Article

Hydrous Pyrolysis of Source Rocks with Different Maturity in Dongying Sag, Bohai Bay Basin, China: Implications for Shale Oil Exploration and Development

1
State Key Laboratory of Shale Oil and Gas Enrichment Mechanisms and Effective Development, Beijing 100101, China
2
School of Ocean and Earth Science, Tongji University, Shanghai 200092, China
3
Wuxi Research Institute of Petroleum Geology, Sinopec Exploration and Production Research Institute, Wuxi 214126, China
*
Author to whom correspondence should be addressed.
Energies 2023, 16(17), 6219; https://doi.org/10.3390/en16176219
Submission received: 20 July 2023 / Revised: 13 August 2023 / Accepted: 25 August 2023 / Published: 27 August 2023
(This article belongs to the Special Issue Shale Lamina and Its Effect on Shale Oil Enrichment)

Abstract

:
Shale oil yield, movability, and reservoir brittleness are three factors that must be focused on for shale oil exploration and development. The yield and composition of hydrocarbons and mineral composition have changed significantly during diagenesis, affecting the yield and movability of shale oil and the brittleness of the rock. In this study, the source rocks at different depths in the Dongying Sag were subjected to hydrous pyrolysis, and the yield and composition of pyrolyzed hydrocarbons and mineral composition were systematically analyzed. The brittleness index (BEI), weighted average specific surface area (SSAWA), and polarity index (PI) have been established to quantitatively characterize the brittleness and adsorption capacity of rock as well as the mobility of shale oil. The results suggest that diagenetic evolution controls rocks’ brittleness and adsorption capacity by changing their mineral composition. In the low-temperature stage, the mineral transformation is not obvious, and the BEI and SSAWA fluctuate in a small range. In the high-temperature stage, the rapid smectite illitization leads to an increase in the brittleness and a decrease in the adsorption capacity. In addition, the nonpolar components such as saturates and aromatics in the pyrolyzed hydrocarbons gradually increased with the increasing temperature, enhancing the mobility of the shale oil. Based on the three evaluation indexes of BEI, PI, and SSAWA, and combined with the changes in hydrocarbon yields during hydrous pyrolysis, we comparatively analyzed the differences in the mobility and yields of original soluble organic matter as well as pyrolyzed hydrocarbons of the source rocks at different depths. Based on the above results, it can be concluded that the shale in the depth range of 3300–3795 m is a favorable area for shale oil exploration and development in the study area. This work suggests that predicting the sweet spot for shale oil exploration and development requires more attention to the impact of diagenetic evolution on the composition of minerals and hydrocarbons.

1. Introduction

In recent years, organic-rich shale has become an attractive exploration target in China due to the huge shale oil and gas resources [1]. Shale oil is a typical unconventional oil and gas resource becoming increasingly important to China’s energy needs, resource base, and economic prospects. Organic-rich shales have low porosity and permeability, with nanoscale pores and inorganic or organic particles [1,2]. Previous studies have shown that shale oil exists mainly in free and adsorbed states [3,4], meaning that hydrocarbons can be free in pores and fractures or adsorbed on organic matter (OM) and mineral particles. Under the current technological conditions, adsorbed oil is still difficult to extract, and free oil is the main contributor to production [5]. Therefore, the movability of shale oil becomes one of the important factors affecting the efficiency of shale oil development [6].
The interactions between minerals and hydrocarbons, such as physical and chemical adsorption, largely control the occurrence form of shale oil [3]. Physical adsorption, including van der Waals forces, hydrogen bonding, and hydrophobic interaction, is reversible and unstable [3], while chemical adsorption, such as ligand exchange, cation bridging, and ion exchange, is highly stable [7]. The adsorption mechanism between minerals and hydrocarbons mainly depends on the surface chemistry of minerals, the structural composition of organic molecules, and the surrounding environmental conditions (e.g., pH and ionic strength) [8]. For example, clay minerals are more likely to be favored by hydrocarbons than minerals such as quartz and plagioclase due to their large specific surface area (SSA) and surface charge [9,10]. Mineral composition, therefore, affects the shale’s adsorption capacity and hence the shale oil’s mobility. Moreover, mineral composition is an important factor affecting the fracability of the reservoir [11,12,13]. The higher the content of brittle minerals such as quartz and plagioclase, the more brittle the rock is, and the easier it is to form natural or induced fractures under external forces [11], thus indirectly increasing the movability of shale oil. Hydrocarbon composition is another important factor affecting shale oil’s movability [14]. Polar components have a stronger affinity for mineral surfaces due to more oxygen-containing functional groups and can be retained by chemical adsorption [15]. Nonpolar components are bound to the mineral surface through physical adsorption and are highly mobile [3]. In summary, the oil movability is closely related to the mineral and hydrocarbon composition.
During diagenetic evolution, the mineral and hydrocarbon composition change with temperature and pressure [16,17], which implies that the movability of shale oil varies depending on the degree of diagenetic evolution. Many studies have been carried out on the movability of shale oil. The main idea is to quantitatively estimate the content of free and adsorbed oil in shale through various experiments, such as solvent extraction, multi-step pyrolysis [18], pore saturation index [19], and nuclear magnetic resonance [20]. The results of such quantitative estimation have become an important basis for predicting favorable layers for shale oil exploration [18]. However, few studies have focused on the dynamic changes in mineral and hydrocarbon composition during diagenesis and the impact of these changes on shale oil movability and rock brittleness.
Hydrocarbon generation and diagenetic evolution are very slow geochemical reactions at low temperatures during stratigraphic burial. Based on the principle of temperature-time compensation [21], high-temperature treatment in the laboratory can quickly reproduce the hydrocarbon generation of organic matter [22,23]. There are four pyrolysis systems: open system, semi-open system, anhydrous closed system, and hydrous closed system. The products of hydrous pyrolysis are more similar to natural oil than other pyrolysis systems [21,22], making it the most suitable pyrolysis technology for artificially simulating petroleum generation [24,25,26,27]. Hydrous pyrolysis has provided many important insights into changes in organic matter during thermal maturation, such as hydrocarbon composition and yield [23,24], the chemical structure of organic matter [28], biomarkers [29,30,31], and isotopes [32,33]. In addition, hydrous pyrolysis is also an important method for modeling mineral transformation as it can provide the necessary ions for mineral transformation [34,35]. The conversion of smectite to illite was reproduced by Eberl and Hower in 1977 using hydrous pyrolysis [36]. Subsequently, a large amount of hydrous pyrolysis provides reliable evidence for studying mineral transformation pathways or mineral pore evolution laws [16,35]. In recent years, more and more scholars have focused on the synergistic evolution of minerals and organic matter during hydrous pyrolysis [17,37,38]. In addition to changes in organic matter, changes in mineral composition and structural and mechanical properties during diagenesis are also gaining attention [17,39]. Du et al. (2021) used hydrous pyrolysis to confirm further the coupling of hydrocarbon generation and smectite illitization in natural systems [17]. Subbotina et al. (2023) revealed the relationship between reservoir properties (such as shale porosity and permeability) and temperature and observed the formation of new minerals as well as the swelling and fracturing of the mineral matrix during hydrous pyrolysis [40]. Liu et al. (2023) compared the changes in mechanical parameters (i.e., Young’s modulus, hardness, and fracture toughness) of shale during hydrous and anhydrous pyrolysis and provided reliable parameters for successful field operations in the development of unconventional reservoirs [39]. All these studies confirm the feasibility of hydrous pyrolysis in studying mineral property changes.
This study selected five shales in the 3050–4501 m depth range in the Dongying Sag for hydrous pyrolysis. Hydrous pyrolysis can not only assess the potential of shale oil generation but also simulate the changes in mineral and hydrocarbon composition during diagenesis [17]. The objectives of this study are (1) to reveal the changes in mineral and hydrocarbon composition during diagenesis; (2) to analyze the changes in rock brittleness and adsorption capacity and their controlling factors during diagenesis; and (3) to select favorable layers for shale oil exploration and development in the study area by comparing the pyrolysis results of shales at different depths with the combination of the brittleness index (BEI), weighted average specific surface area (SSAWA), and polarity index (PI). The results of this work contribute to understanding diagenesis’s effects on rock brittleness and adsorption capacity and provide a theoretical basis for shale oil exploration and development.

2. Samples and Experiments

2.1. Samples

Dongying Sag is an important oil-rich sag in the Jiyang Depression of the Bohai Bay Basin in eastern China (Figure 1). The shale in the upper part of Mbr 4 of the Shahejie Fm (Es4U) and the lower part of Mbr 3 of the Shahejie Fm (Es3L) are the main layers for shale oil exploration and development. Many industrial oil and gas flow wells have been discovered, but at the same time, many failed wells were produced [24]. Therefore, accurately selecting favorable layers for shale oil exploration and development is still an urgent problem to be solved.
This study collected five shales from top to bottom of the Dongying Sag, with a depth range of 3050–4501 m, involving three formations, the middle part of Mbr 3 of Shahejie Fm (Es3M), the lower part of Mbr 3 of Shahejie Fm (Es3L), the upper part of Mbr 4 of Shahejie Fm (Es4U). The basic geochemical information of these source rocks is shown in Table 1. The maturity of these samples varies from mature to high mature depending on the burial depth. In addition, the minerals in these samples consist mainly of clay minerals, quartz, plagioclase, calcite, ankerite, and pyrite (Table 2). Clay minerals are dominated by illite and smectite mixed-layer (I-Sm) and illite, with minor kaolinite and chlorite (Table 2).

2.2. Hydrous Pyrolysis

The sample was ground into <200 mesh powder, followed by mixing to ensure their homogeneity in geochemical properties. The powder (not extracted) and water were loaded into an autoclave at a 3:1 water-to-rock mass ratio. The water used in this experiment was prepared according to the ionic concentration of the formation water in the formation where the samples were located (Table 3), providing the ions required for mineral transformation. The autoclave is sealed in a vacuum environment to form a closed system. Hydrous pyrolysis was carried out at temperatures ranging from 200 to 500 °C for 72 h at 50 °C intervals. Below 350 °C, the pressure is equal to the saturated vapor pressure, while above 350 °C, the pressure is a constant 16.53 MPa. After heating, the gas is collected and quantified using the draining in a vacuum. Liquid hydrocarbons were obtained by repeated ultrasonic extraction of residual solids using a dichloromethane: methanol mixture (9:1 by volume). The original soluble organic matter (SOM) was obtained from the raw samples using the same method. The 25 °C in the figures (Figures 2–4, Figure 6) represents the extracted original sample. After extraction, the residual solids were rinsed using deionized water, dried, and ground for further analysis.

2.3. Measurement Methods

2.3.1. Quantification of Hydrocarbons

The gases were analyzed for components on an Agilent 7820 gas chromatograph (GC) equipped with an HP-pona fused silica capillary column (50 m × 0.20 mm × 0.5 μm). The initial temperature of the GC oven was 60 °C for 2 min, then heated up to 200 °C at 4 °C/min and held for 30 min. The volume fraction of these gases was determined by an external reference method and then transferred to milligrams according to the ideal gas law [41]. The yield of each gas was reported in mg/g TOC.
The collected liquid hydrocarbons were classified as SARA fractions (saturates, aromatics, resins, and asphaltenes) according to the classic scheme [41]. Asphaltenes were first precipitated with n-hexane. The remaining hydrocarbons are put into silica gel (80–100 mesh)-alumina (100–200 mesh) chromatography column and flushed sequentially with n-hexane, dichloromethane, and methanol to separate saturates, aromatics, and resins. The SARA fractions were weighed respectively, and the sum of their mass was the liquid hydrocarbon yield, expressed as mg/g TOC.

2.3.2. X-ray Diffraction (XRD) Analysis

A Rigaku D/max-IIIa diffractometer with nonmonochromatic CuKα radiation was used for XRD analysis at 20 mA and 40 kV. The bulk mineralogy was analyzed using randomly oriented powder samples which were scanned from 3 to 70°(2θ) with a step size of 0.02°(2θ). According to Stokes’ Law, clay-sized (<2 μm) fractions in the bulk rock were separated and made into three oriented slides: air drying (25 °C), ethylene glycol saturation, and heating (550 °C). Oriented slides were scanned from 3 to 30°(2θ) with a step size of 0.02°(2θ). The content of bulk rock and clay minerals was calculated using XRD curves according to the method described in Ref. [42].

3. Results

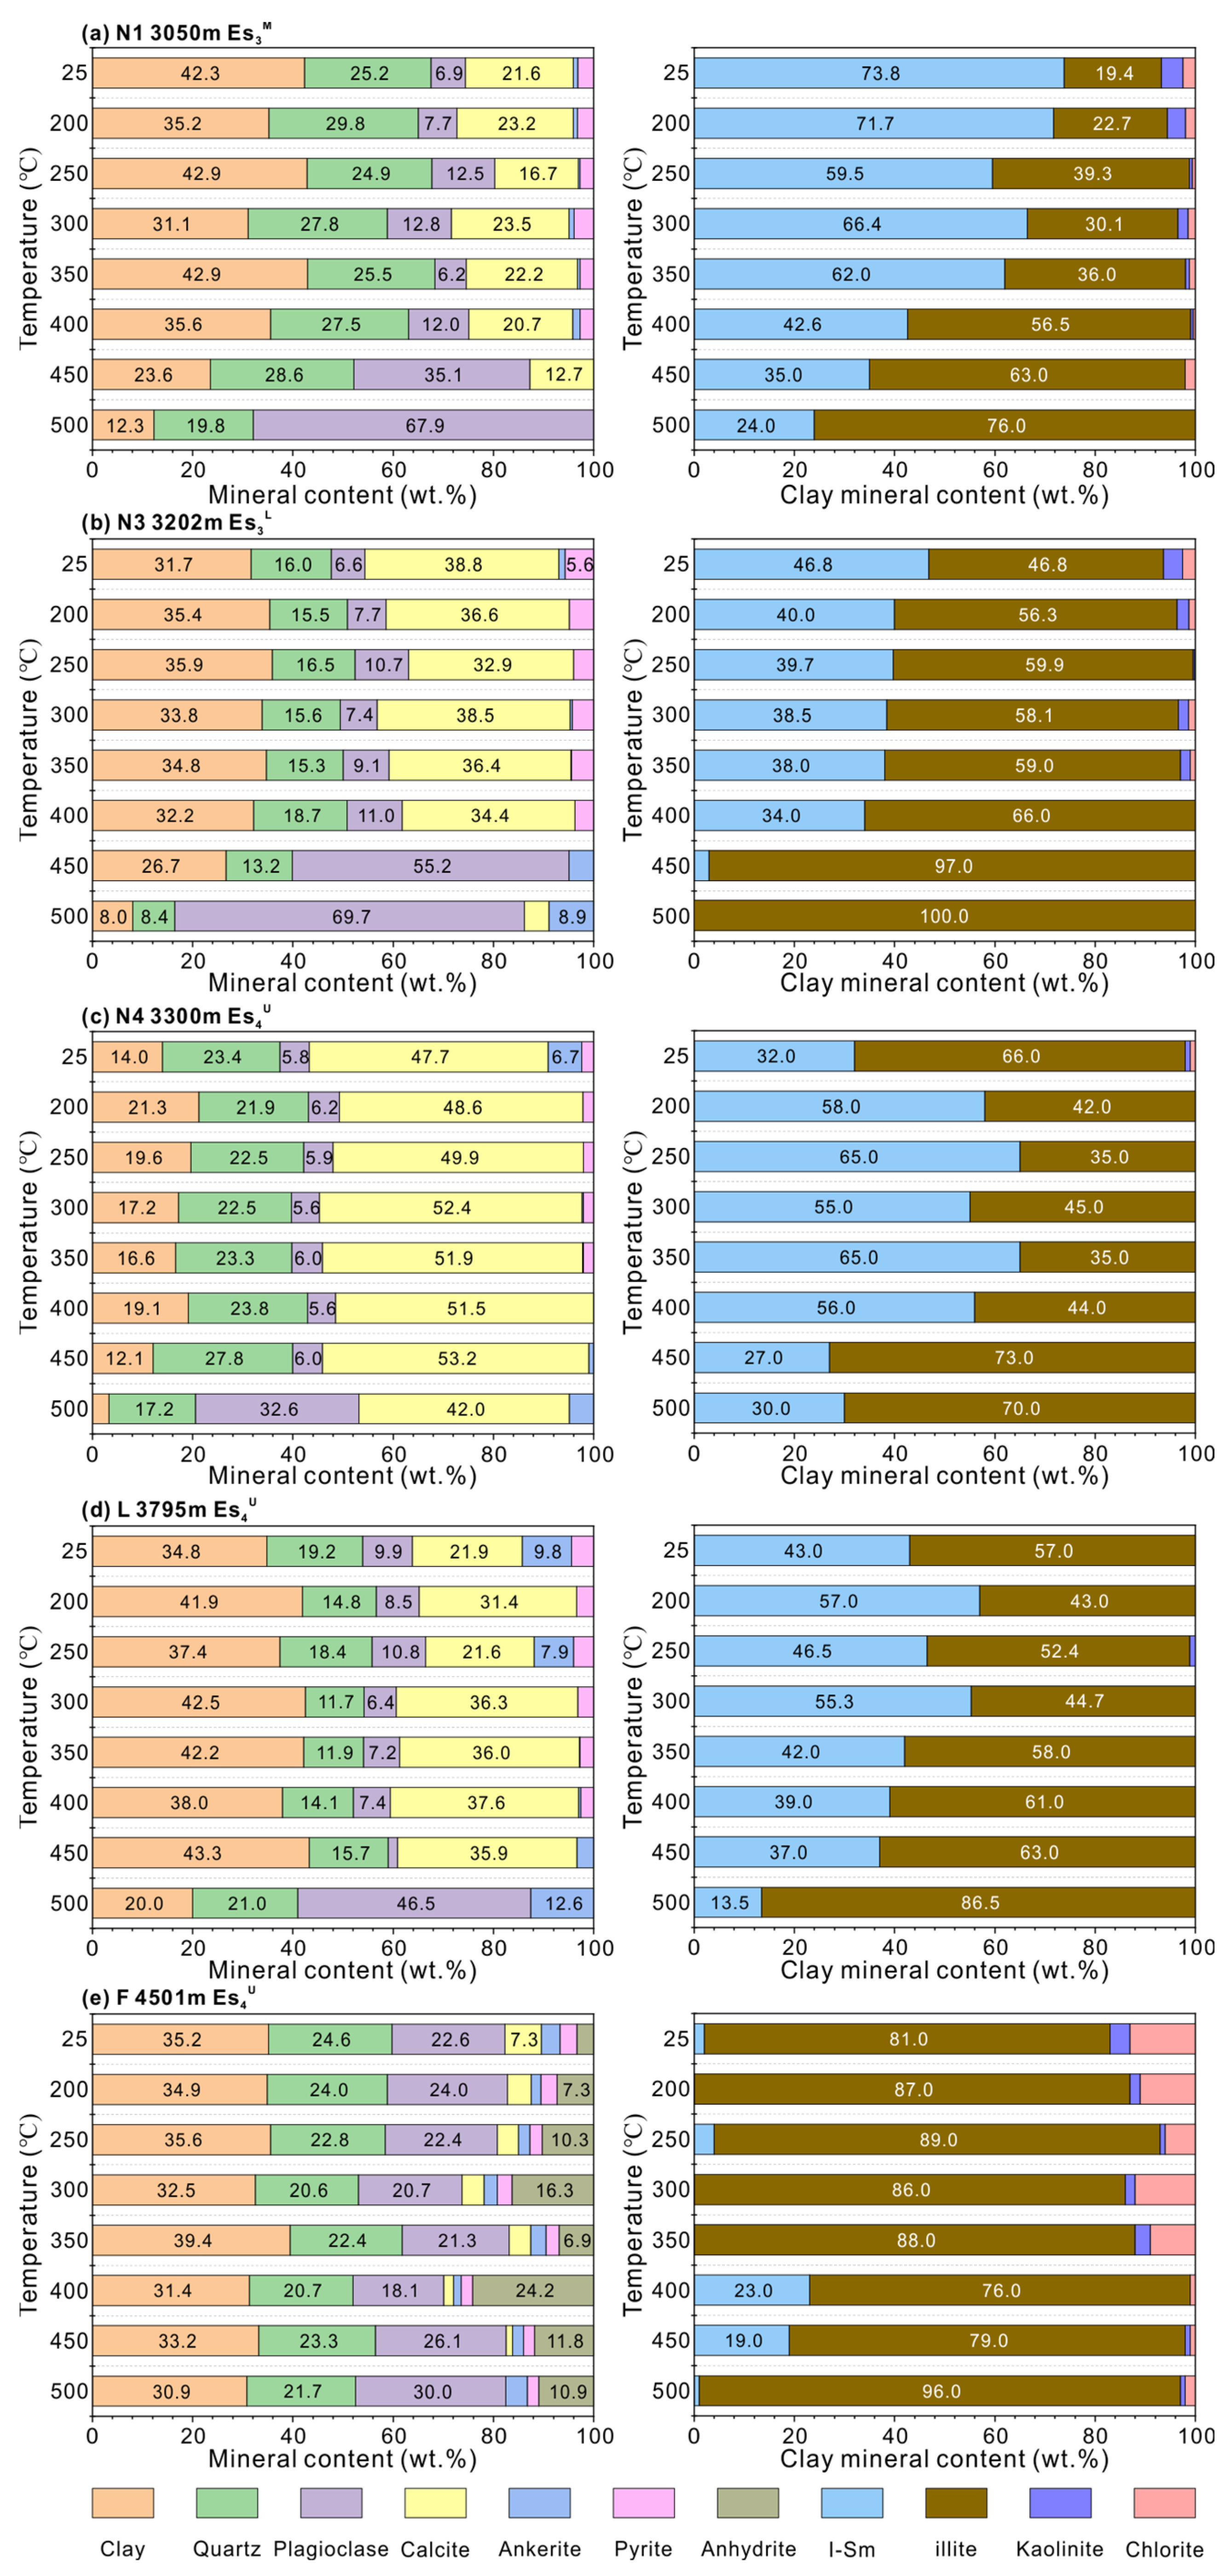
3.1. Changes in Mineral Composition

During the pyrolysis, all samples’ bulk rock and clay minerals except sample F underwent significant changes (Figure 2). The bulk rock minerals of samples N1, N3, N4, and L have similar changes and can be roughly divided into two stages (Figure 2). In the low-temperature stage, the contents of clay minerals, carbonate minerals, quartz, and plagioclase fluctuate only slightly without significant changes. With further increase in temperature, the clay mineral and carbonate minerals gradually decrease, while the quartz and plagioclase gradually increase, especially in the 450–500 °C stage (Figure 2).
Unlike bulk rock minerals, there are some differences in the evolution of clay minerals in these samples (Figure 2). Clay minerals are dominated by I-Sm and illite, with only small amounts of kaolinite and chlorite. With the increase in temperature, kaolinite and chlorite gradually decreased until they completely disappeared, and the I-Sm gradually transformed to illite, but the initial temperature of smectite illitization was different in these samples (Figure 2). Smectite illitization of sample N1 was relatively slow before 350 °C but gradually accelerated after 350 °C (Figure 2a). Compared to sample N1, the I-Sm of sample N3 decreased only slightly before 350 °C, whereas it gradually converted to illite after 350 °C, especially at 400–500 °C (Figure 2b). The I-Sm of samples N4 and L fluctuated within a small range before 400 °C and began to convert to illite at 450–500 °C (Figure 2c). Unlike the other samples, neither the bulk rock minerals nor the clay minerals of sample F changed significantly during pyrolysis, and only kaolinite and chlorite decreased at the high-temperature stage (Figure 2e). The anomalous I-Sm content of sample F at 400–450 °C may be related to the non-homogeneity of the sample (Figure 2e).
Differences in mineral evolution between samples are mainly attributed to their different degrees of diagenetic evolution in natural systems. Sample F has already undergone strong diagenesis in the formation, so further mineral evolution in hydrous pyrolysis may require more severe temperature and pressure conditions [35]. Similarly, different degrees of diagenetic evolution allow for differences in the initial temperature of illitization in the remaining samples. The higher the degree of diagenetic evolution, the higher the initial temperature of illitization.

3.2. Changes in Hydrocarbon Products

Hydrous pyrolysis reveals the differences in residual hydrocarbon yield and hydrocarbon composition between source rocks with different maturity. As shown in Figure 3, the source rocks with different maturity exhibit three different models of hydrocarbon generation. The low-mature sample N1 has two peaks of hydrocarbon yield at 250 °C and 400 °C, respectively (Figure 3a). At 25–350 °C, the hydrocarbon yield increased slightly to 118.41 mg/g TOC, and the hydrocarbons were dominated by resins and asphaltenes. At 350–400 °C, the hydrocarbon yield increased significantly to 215.45 mg/g TOC, and the saturates and aromatics increased significantly, although resins and asphaltenes still dominated. At 400–500 °C, the liquid hydrocarbons gradually decreased, while the gaseous hydrocarbons gradually increased (Figure 3a).
Compared to sample N1, the more mature sample N3 had only one peak of hydrocarbon yield at 450 °C (Figure 3b). At 25–350 °C, the liquid hydrocarbon yield was almost unchanged, averaging 88.43 mg/g TOC, with the hydrocarbons dominated by resins and asphaltenes. At 350–450 °C, the hydrocarbon yield increased rapidly from 85.50 mg/g TOC to 374.34 mg/g TOC, and the saturates and resins also increased significantly. At 450–500 °C, a decrease in liquid hydrocarbons is accompanied by increased gaseous hydrocarbons (Figure 3b).
Sample N4 also had only one peak of hydrocarbon yield at 450 °C, but the original SOM content of this sample was very high and dominated by saturates and aromatics (Figure 3c). At 25–300 °C, the liquid hydrocarbon, dominated by saturates and aromatics, remained unchanged. At 300–450 °C, the hydrocarbon yields gradually increased from 186.09 mg/g TOC to 302.17 mg/g TOC, and the saturates and aromatics also increased. At 450–500 °C, the liquid hydrocarbon yield decreased significantly while the gaseous hydrocarbon yields increased.
Samples L and F also had only one hydrocarbon peak, but unlike samples N3 and N4, this peak was at 250 °C (Figure 3d,e). At 25–250 °C, the hydrocarbon yield of sample L gradually increased to 273.91 mg/g TOC, and the hydrocarbons were dominated by saturates and aromatics. At 250–500 °C, the liquid hydrocarbon yield of sample L gradually decreased, while the gaseous hydrocarbon gradually increased, and the content of saturates and aromatics remained high (Figure 3d). Unlike sample L, sample F produces mainly natural gas, and the maximum yield of liquid hydrocarbon is only 164.58 mg/g TOC. The liquid hydrocarbons are mainly resins and asphaltenes (Figure 3e).

4. Discussion

Shale oil yield, oil mobility, and rock fracability are three important factors for evaluating the sweet spot of shale oil. The hydrocarbon yield of shale mainly depends on OM abundance, type, and maturity [21], while fracability is mainly related to rock brittleness [4], and oil movability is controlled by the interaction between hydrocarbons and mineral surfaces. Diagenesis changes minerals’ composition, affecting shale reservoirs’ brittleness and adsorption capacity. Therefore, understanding these changes is critical to finding the sweet spot for shale oil. Based on the changes in hydrocarbon yield and composition, and mineral compositions of source rocks with different maturity during pyrolysis, the changes in shale oil yield, shale brittleness, and shale oil movability during diagenesis were investigated to provide a theoretical basis for finding the sweet spot for shale oil.

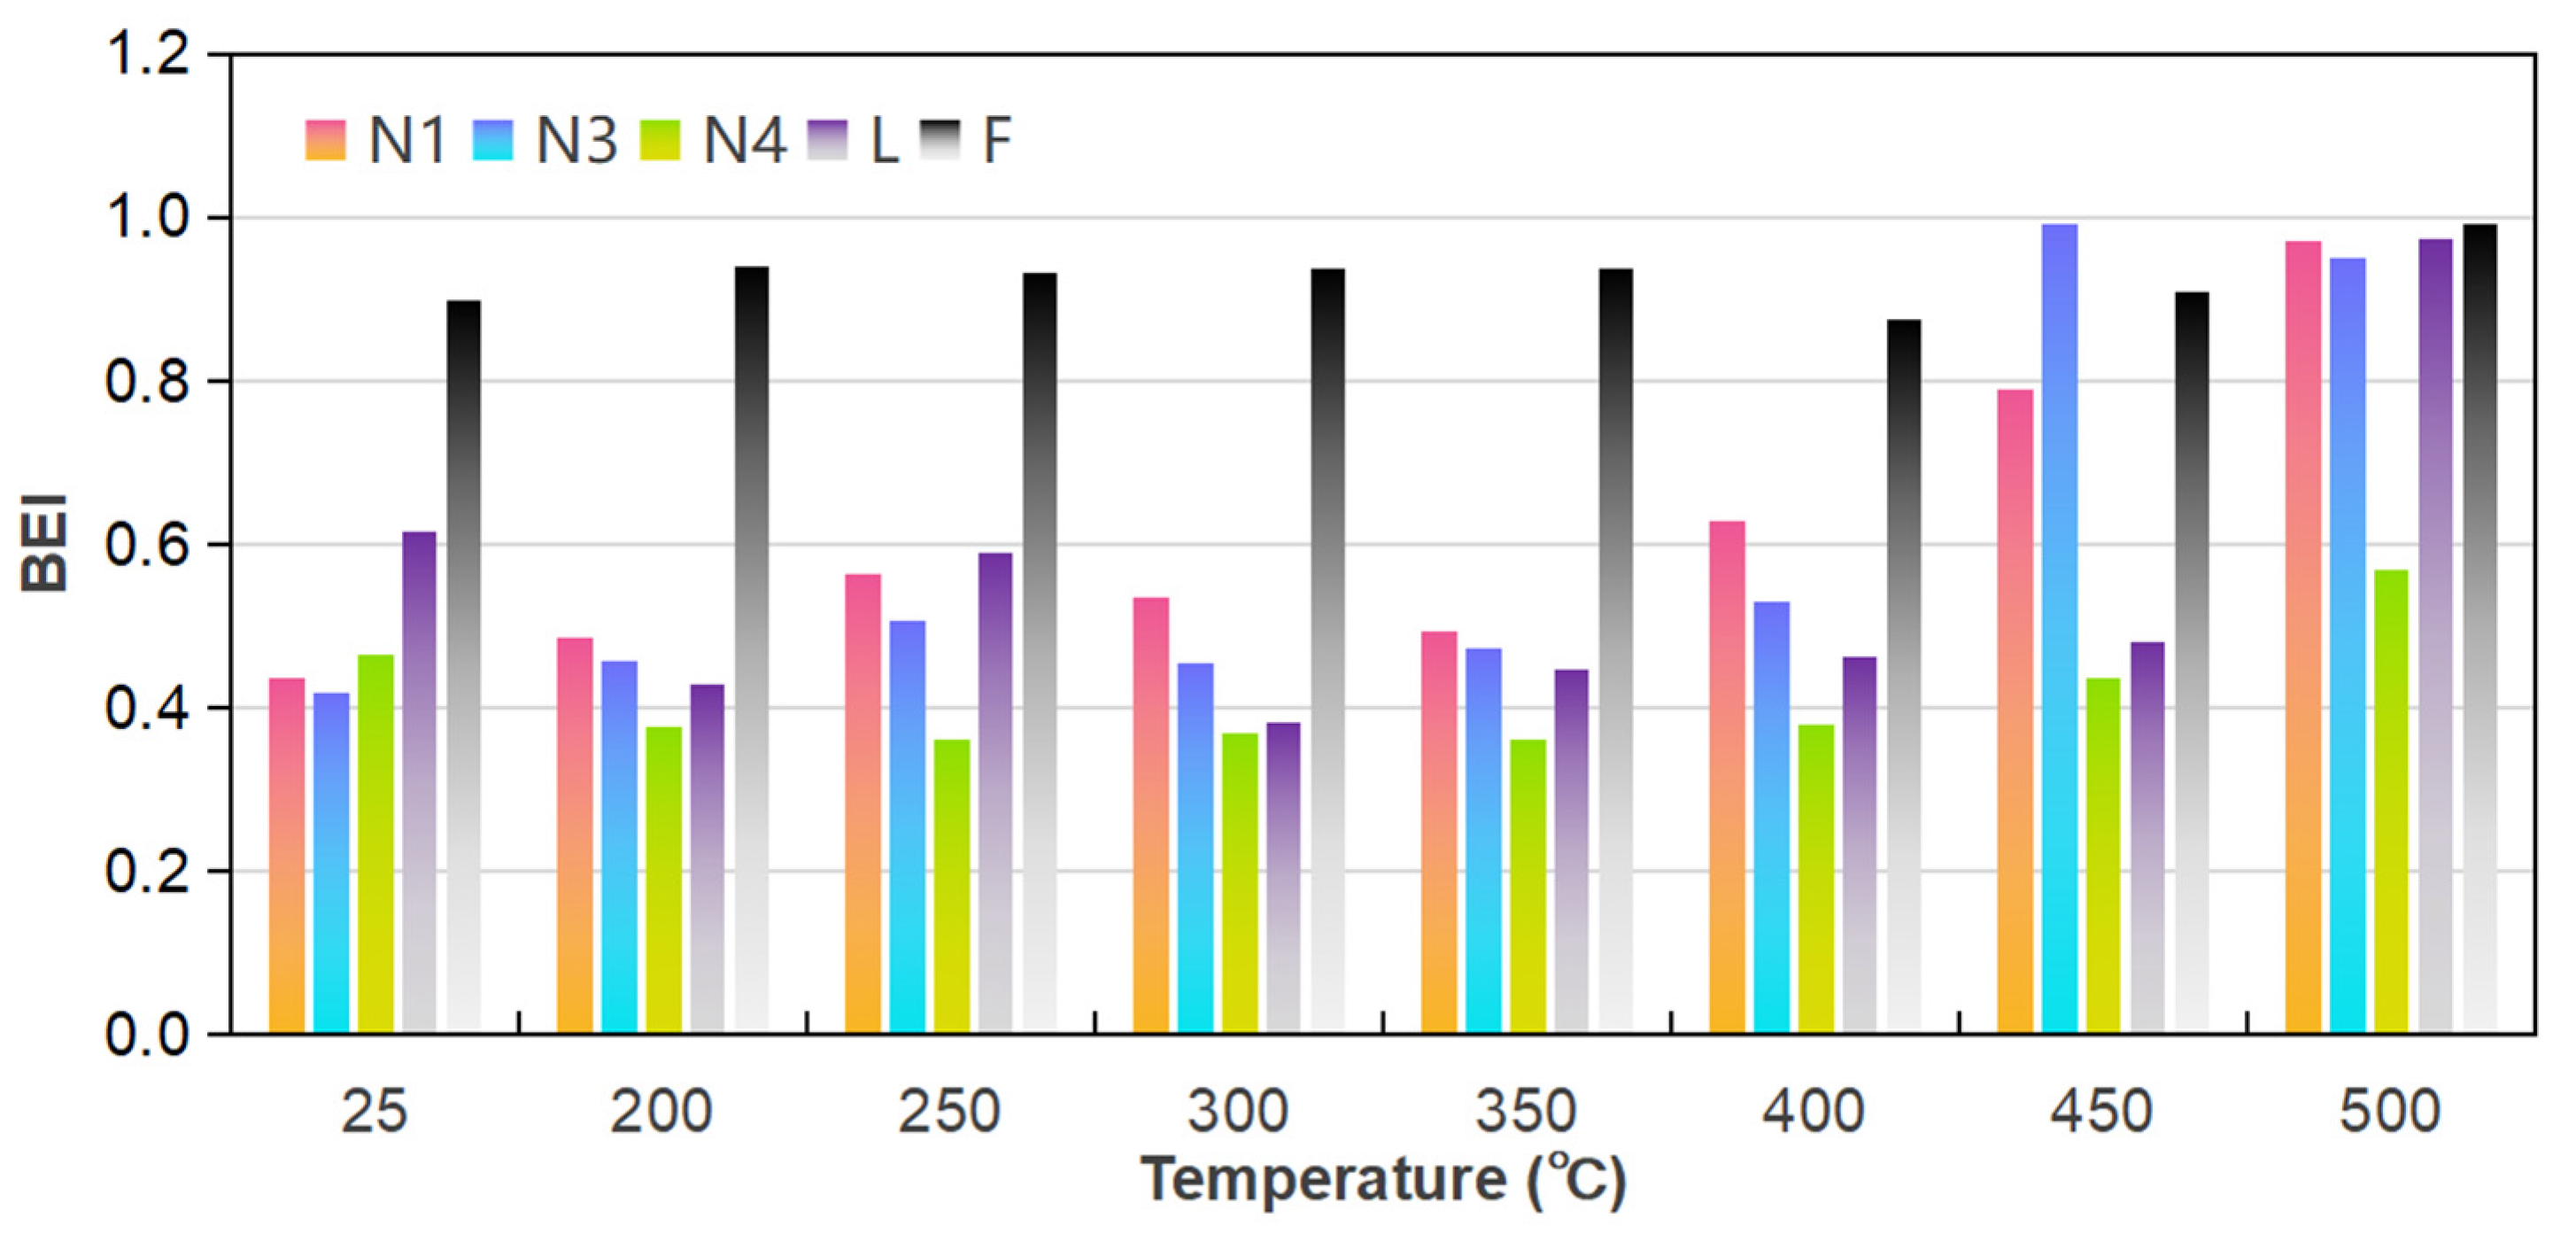
4.1. Changes in the Brittleness Index

Shale brittleness depends mainly on mineral composition [4,11,12]. Clay minerals, carbonate minerals, and detrital minerals such as quartz and plagioclase are the three most dominant groups of minerals in shales. Quartz and plagioclase are usually brittle and easily break under external forces [4,12]. Dolomite is also a brittle mineral [43], while the contribution of calcite to rock brittleness often depends on its degree of crystallization [12,44]. Clay minerals are often considered plastic because they can expand and deform through hydration [45]. However, the hydration capacity of different clay minerals varies greatly [46]. In general, smectite and kaolinite are susceptible to hydration, swelling, and deformation due to their strong cation exchange capacity and water adsorption. Although illite is also a 2:1 layered silicate mineral, it does not swell due to the high affinity of interlayer potassium ions for the structural layers [46]. The same is true for chlorite. Thus, smectite and kaolinite in clay minerals are plastic components, whereas illite and chlorite are brittle components [44].
During the pyrolysis, the bulk rock and clay minerals underwent some changes, similar to the diagenetic evolution in the natural systems [45,47]. In order to quantitatively assess the effect of diagenesis on rock brittleness, we defined the brittleness index (BEI) to characterize rock brittleness based on mineral composition [4,12]. Based on the mineral properties, quartz, plagioclase, ankerite, illite, and chlorite were selected as brittleness components to calculate the BEI with the following equations:
B E I = I + C h + Q + F + A C l a y + Q + F + C
where BEI represents the brittleness index, Clay, Q, F, C, A, I, and Ch represent the mass percentage (wt. %) of clay minerals, quartz, plagioclase, carbonate minerals, ankerite, illite, and chlorite, respectively.
The change in BEI varies from sample to sample (Figure 4). For samples N1, N3, N4, and L, the trend of the BEI with increasing temperature can be divided into two phases. The BEI remains constant before 350 °C and gradually increases after 350 °C (Figure 4). The BEI of sample F remained almost constant during the pyrolysis (Figure 4). These results indicate that the change in BEI corresponds well with the mineral evolution. Rock brittleness varies at different stages of diagenesis. The rock brittleness is significantly enhanced at the high-temperature stage (Figure 4), which agrees with the previous understanding from natural samples [44].
The correlation between the BEI and different mineral contents was further analyzed to compare the contribution of different mineral fractions to rock brittleness. As shown in Figure 5, the BEI of all samples except sample F negatively correlates with the clay mineral content (Figure 5a), which aligns with the previous knowledge [4]. Although the BEI has a good negative correlation with I-Sm content (Figure 5b), it does not have a good positive correlation with illite content (Figure 5c), implying that the enhanced rock brittleness can be attributed to a decrease in I-Sm but not to an increase in illite. In contrast, the BEI has a better positive correlation with quartz and plagioclase content (Figure 5d). The BEI has a good negative correlation with calcite content (Figure 5e) and no significant correlation with ankerite content (Figure 5f), which suggests that carbonate minerals contribute less to rock brittleness.
Combined with the change in mineral content, it can be seen that the decrease in clay minerals and the increase in quartz and plagioclase are the main reasons for the increase in rock brittleness in the high-temperature stage. The decrease in clay minerals can be attributed to the smectite illitization [17,48]. The decrease in smectite during illitization is not equivalent to the increase of illite. In addition to the formation of illite, smectite releases significant amounts of Si, Al, Ca, Na, Fe, and Mg through a dissolution-recrystallization mechanism and forms minerals such as quartz (SiO2), plagioclase (Na-(Al2Si2O8)), and ankerite (Ca(Fe, Mg)CO3) [10,49]. About 17–23% of smectite is converted to other minerals, such as quartz, during the illitization [48]. In the hydrous pyrolysis, most of the smectite was converted to plagioclase and quartz (Figure 2). Thus, the increase in rock brittleness is mainly attributed to the increase in quartz and plagioclase rather than illite, which explains the weak correlation between BEI and illite content (Figure 5c). In summary, diagenesis has an obvious control on rock brittleness, and the formation of quartz and plagioclase, especially plagioclase, by smectite illitization in the high-temperature stage can significantly enhance the rock brittleness (Figure 4).

4.2. Changes in Oil Movability

Oil movability is the key to shale oil development. The adsorption of hydrocarbons by minerals, especially clay minerals, is one of the important factors affecting oil movability. The adsorption capacity of minerals is closely related to the surface chemistry of the mineral and the SSA. Smectite has a SSA of about 740–780 m2/g, illite has a SSA of 20–200 m2/g, and kaolinite has a SSA of 7–80 m2/g [8]. In contrast, the SSA of quartz (SSA < 10 m2/g), plagioclase (SSA < 5 m2/g), and carbonate minerals (SSA < 13 m2/g) are at least 1–2 orders of magnitude lower than those of clay minerals [50]. As a result, clay minerals have the strongest adsorption capacity (8.7–23.3 mg/g), followed by detrital minerals such as quartz and plagioclase (1.46–3.82 mg/g), and carbonate minerals have the worst adsorption capacity (0.6–2.1 mg/g) [9]. The weighted average specific surface area (SSAWA) was calculated based on the SSA of different minerals and the mass percentage of these minerals to characterize the adsorption capacity of rocks. The specific calculation formula is given below:
S S A W A = W i × S S A i W i
where SSAWA represents the weighted average specific surface area of the rock, Wi represents the mass percentage of each mineral, including I-Sm, illite, kaolinite, quartz, plagioclase, carbonate minerals, SSAi represents the SSA of each mineral, in which 780 m2/g is taken for I-Sm, 200 m2/g for illite, 80 m2/g for kaolinite, 10 m2/g for quartz, 5 m2/g for plagioclase, and 13 m2/g for carbonate minerals. It should be noted that this parameter reflects only the relative magnitude of the SSA of the rock and not the absolute one.
Analyzing the movability of shale oil should focus not only on the adsorption capacity of minerals but also on hydrocarbon components. Polar compounds generally have a stronger affinity for mineral surfaces through chemical interactions. In contrast, nonpolar components only have some physical interactions with mineral surfaces, and this adsorption is reversible [15]. Therefore, the polarity index (PI), which is the ratio of saturates plus aromatics to resins plus asphaltenes, was defined to characterize the mobility of hydrocarbons. The larger the PI value, the stronger the mobility.
As shown in Figure 6a, the trend of SSAWA with temperature is also controlled by diagenetic evolution. The SSAWA fluctuates only slightly before 350 °C and gradually decreases after 350 °C, mainly related to the smectite illitization. The adsorption capacity of sample F remained almost unchanged, attributed to its relatively stable mineral composition. In conclusion, the adsorption capacity of rocks gradually decreases with the ongoing diagenetic evolution. The contents of nonpolar components such as saturates and aromatics usually increase with increasing temperature, especially at 350–450 °C (Figure 3), but the significant generation of gas at 450–500 °C leads to a decrease in the saturates sand aromatics (Figure 3). Therefore, the PI first increases and then decreases as the temperature rises from 350 °C to 500 °C (Figure 6b). The PI is also related to the original maturity of the samples. For low mature samples N1 and N3, the PI is always below 1, although the content of saturates and aromatics increased in the high-temperature phase (Figure 6b). For highly mature samples N4 and L, the PI is always greater than 1 (Figure 6b). In a word, the hydrocarbon composition is controlled by thermal evolution.
The oil movability of the different samples was analyzed using SSAWA and PI as evaluation indexes. As shown in Figure 7, the data points were mainly distributed in four regions. Region A, where PI is greater than 1.5 and SSAWA is less than 150 m2/g, represents the weak adsorption capacity and the low polarity, making these hydrocarbons highly mobile. Region B has a PI greater than 1.0 and an SSAWA greater than 150 m2/g, indicating a strong adsorption capacity but low polarity, so these hydrocarbons have some mobility. Region D has a PI of less than 1.0 and a SSAWA of less than 150 m2/g. These hydrocarbons are more polar because many saturate and aromatics have been further cracked into gaseous hydrocarbons (Figure 3). Nevertheless, it can be argued that hydrocarbons in Region D may be slightly less mobile than those in Region B, given the low adsorption capacity and the higher brittleness (Figure 7). Region C has a PI of less than 1.0 and an SSAWA of greater than 150 m2/g, and the BEI is relatively low, making these hydrocarbons the least mobile (Figure 7).
In summary, changes in mineral and hydrocarbon composition during diagenesis jointly affect the movability of shale oil, which can be reflected in parameters such as SSAWA, PI, and BEI. Assessing the moveability of shale oil requires more attention to mineral evolution.

4.3. Implications for Shale Oil Exploration

The original mineral and SOM characteristics of the source rocks at different depths reflect the characteristics of the shale reservoirs and shale oil at current depths, while their pyrolysis results reflect the changes in rock brittleness and shale oil movability as these source rocks evolve further. Therefore, these results can help us predict the shale oil sweet spot in the study area.
The low mature samples N1 and N3 have less original SOM and form a hydrocarbon peak in the high-temperature stage (Figure 3a,b), which suggests that these two samples still have a high potential for hydrocarbon generation, and further thermal evolution is needed to reach the maximum yield of shale oil. Although there is a slight decrease in the adsorption capacity and a small increase in the nonpolar components at 25–400 °C, the movability of these pyrolyzed hydrocarbons is still relatively poor, as shown in Region C in Figure 7. At 400–500 °C, the rapid mineral transformation significantly decreases adsorption capacity and increases rock brittleness, accompanied by an increase in nonpolar components and gaseous hydrocarbons (Figure 4 and Figure 6). These changes lead to an increase in the movability of the shale oil, as shown in Region D of Figure 7. Therefore, regarding shale oil yield, movability, and rock brittleness, samples N1 and N3 may need more diagenetic and thermal evolution to become sweet spots for shale oil. In other words, shales at depths greater than 3200 m may have better prospects for shale oil exploration.
It is noteworthy that sample N1 formed a low-mature oil peak dominated by resins and asphaltenes at 250 °C, related to the relatively slow illitization in this stage [51]. Compared to sample N1, sample N3 may have already experienced this hydrocarbon generation behavior in natural systems, which resulted in sample N3 not having significant illitization and low-mature oil peak at low temperatures in the hydrous pyrolysis (Figure 2b and Figure 3b). Therefore, the relatively low-mature shale between sample N1 and sample N3 may be a favorable area for low-mature oil exploration.
Compared with sample N3, sample N4 has a higher maturity with a higher original SOM (Figure 3c). The liquid hydrocarbon yield of this sample increased by about 70.76% compared with the original SOM under the heating treatment at 450 °C, indicating that this sample also has a high residual potential for hydrocarbon generation. Among the original SOM and the pyrolyzed hydrocarbons, the proportion of saturates and aromatics could reach 67.49% on average (Figure 3c). On the other hand, fewer clay minerals weakened the adsorption capacity of this sample. Therefore, the shale oil formed in sample N4 is highly movable, as shown in Region A in Figure 7. The source rock at this depth can be the preferred target for shale oil exploration and development due to the great advantage in shale oil yield and movability. As the thermal evolution progresses, the movability of the shale oil decreases slightly but remains at a high level, as shown in the pyrolysis results of sample L (Figure 7).
Compared with sample N4, sample L has a higher content of original SOM, but the hydrocarbon peak is advanced to 250 °C (Figure 3d). The hydrocarbon generation at high temperatures relies on the thermal cracking of kerogen, but the contribution of thermal cracking to the low-temperature oil peak is limited because lower temperatures do not allow for a significant amount of OM cracking to occur [51]. In addition, smectite illitization did not occur in this sample in the low- temperature phase; therefore, the low-temperature oil peak of sample L may be attributed to thermal desorption [51,52]. Although the SSAWA is greater than 150 m2/g, the hydrocarbons are mainly dominated by nonpolar components (Figure 6b). Thermal desorption of hydrocarbons under heating treatment at 250 °C further suggests that these hydrocarbons are not highly thermally stable [53]. These results suggest that the original SOM and pyrolyzed hydrocarbons of Sample L are also relatively mobile, as shown in Region B of Figure 7. However, with the further enhancement of thermal evolution, the polar components gradually increased, and the shale oil yield gradually decreased (Figure 3d), although the adsorption capacity of the rock weakened (Figure 4). Therefore, the shale oil development potential of source rocks with a burial depth greater than 3795 m may be reduced, as confirmed by the experimental results of sample F with a greater burial depth.
The original SOM content of sample F is significantly lower than that of samples N4 and L (Figure 3e), reflecting that much of shale oil has been converted to gaseous and light hydrocarbons in the formation. Although the higher diagenetic degree significantly increased the rock brittleness and reduced the rock adsorption capacity (Figure 4 and Figure 6a), the polar components increased due to the cracking of nonpolar components (Figure 6b), which also occurred in the high-temperature stage of the remaining samples (Figure 3 and Figure 6b). In addition, the low hydrocarbon yield of sample F indicates that many hydrocarbons have already been generated in the formation. Considering the brittleness of the shale as well as changes in adsorption capacity, these shales could be a secondary target for exploration. Further heating led to a continuous decrease in liquid hydrocarbon yield and a gradual increase in gaseous hydrocarbons (Figure 3e), so the source rocks at greater burial depths may be dominated by gas production rather than shale oil.
Combining the results of the above analyses, the shale within the depth range (3330–3795 m) between sample N4 and sample L may be the sweet spot with the best shale oil yield and movability in the study area (Figure 7). The source rocks above 3300 m are unfavorable for development due to insufficient diagenesis and poor oil yield, movability, and rock brittleness, while source rocks below 3795 m are overly thermal, and a large amount of shale oil is converted to gaseous hydrocarbons. Although shale oil yield is low, the increased gaseous hydrocarbon and rock brittleness and reduced adsorption capacity make it can potentially be a preferred target for shale gas exploration.

5. Conclusions

Hydrous pyrolysis of shales with different burial depths was used to analyze the control of diagenesis on rock brittleness and shale oil mobility. Moreover, by comparing the experimental results of these shales, the sweet spot for shale oil exploration and development in the study area was predicted. The results show that hydrocarbon generation is accompanied by mineral transformation during hydrous pyrolysis, and the hydrocarbon and mineral compositions change significantly. The brittleness and adsorption capacity of the rocks are controlled by diagenetic evolution. In the low-temperature stage, the mineral transformation is not obvious, so the BEI and SSAWA fluctuate only within a small range. In the high-temperature stage, rapid smectite illitization decreases the clay minerals and increases the quartz and plagioclase significantly. This change in mineral composition leads to a decrease in rock brittleness and adsorption capacity in the high-temperature stage. In addition, the nonpolar components of the liquid hydrocarbons gradually increased with increasing temperature, further enhancing the oil’s movability. Based on shale oil yield, movability, and rock brittleness, it can be concluded that the shale in the 3330–3795 m depth range is a favorable zone for shale oil exploration and development.

Author Contributions

Conceptualization, J.C. and C.C.; methodology, L.L.; software, C.C.; validation, Q.J., X.M. and J.H.; formal analysis, J.C., C.C and X.M.; investigation, L.L., Q.J. and J.H.; resources, J.C. and L.L.; data curation, J.C., X.M. and L.L.; writing—original draft preparation, J.C. and C.C.; writing—review and editing, J.C., C.C. and L.L.; visualization, Q.J. and J.H.; supervision, J.C.; project administration, J.C.; funding acquisition, J.C. All authors have read and agreed to the published version of the manuscript.

Funding

This research was funded by the Open Fund Project of State Key Laboratory of Shale Oil and Gas Enrichment Mechanisms and Effective Development (Grant No. 33550000-22-ZC0613-0271) and National Natural Science Foundation of China (Grant No. 41972126).

Data Availability Statement

The data presented in this study are available upon request from the corresponding author. The data are not publicly available due to the need for further relevant research.

Acknowledgments

We would like to thank Tianzhu Lei from Northwest Institute of Eco-Environment and Resources, Chinese Academy of Sciences, Lanzhou for his help in the experiments.

Conflicts of Interest

The authors declare no conflict of interest.

References

  1. Zou, C.N.; Yang, Z.; Cui, J.W.; Zhu, R.K.; Hou, L.H.; Tao, S.Z.; Yuan, X.J.; Wu, S.T.; Lin, S.H.; Wang, L.; et al. Formation mechanism, geological characteristics and development strategy of nonmarine shale oil in China. Pet. Explor. Dev. 2013, 40, 15–27. [Google Scholar]
  2. Yu, K.; Shao, C.; Ju, Y.; Qu, Z. The genesis and controlling factors of micropore volume in transitional coal-bearing shale reservoirs under different sedimentary environments. Mar. Pet. Geol. 2019, 102, 426–438. [Google Scholar]
  3. Zhu, X.; Cai, J.; Liu, W.; Lu, X. Occurrence of stable and mobile organic matter in the clay-sized fraction of shale: Significance for petroleum geology and carbon cycle. Int. J. Coal Geol. 2016, 160–161, 1–10. [Google Scholar]
  4. Jarvie, D.M. Shale resource systems for oil and gas: Part 2: Shale-oil resource systems. In Shale Reservoirs-Giant Resources for the 21st Century; AAPG Memoir: Tulsa, OK, USA, 2012; pp. 89–119. [Google Scholar]
  5. Zhao, W.; Bian, C.; Li, Y.; Zhang, J.; He, K.; Liu, W.; Zhang, B.; Lei, Z.; Liu, C.; Zhang, J.; et al. Enrichment factors of movable hydrocarbons in lacustrine shale oil and exploration potential of shale oil in Gulong Sag, Songliao Basin, NE China. Pet. Explor. Dev. 2023, 50, 520–533. [Google Scholar]
  6. Pang, X.; Li, M.; Li, B.; Wang, T.; Hui, S.; Liu, Y.; Liu, G.; Hu, T.; Xu, T.; Jiang, F.; et al. Main controlling factors and movability evaluation of continental shale oil. Earth-Sci. Rev. 2023, 243, 104472. [Google Scholar]
  7. Kleber, M.; Eusterhues, K.; Keiluweit, M.; Mikutta, C.; Mikutta, R.; Nico, P.S. Mineral–Organic Associations: Formation, Properties, and Relevance in Soil Environments. Adv. Agron. 2015, 130, 1–140. [Google Scholar]
  8. Kleber, M.; Bourg, I.C.; Coward, E.K.; Hansel, C.M.; Myneni, S.C.B.; Nunan, N. Dynamic interactions at the mineral–organic matter interface. Nat. Rev. Earth Environ. 2021, 2, 402–421. [Google Scholar]
  9. Li, Z.; Zou, Y.-R.; Xu, X.-Y.; Sun, J.-N.; Li, M.; Peng, P.A. Adsorption of mudstone source rock for shale oil—Experiments, model and a case study. Org. Geochem. 2016, 92, 55–62. [Google Scholar]
  10. Bibi, I.; Icenhower, J.; Niazi, N.K.; Naz, T.; Shahid, M.; Bashir, S. Clay Minerals: Structure, Chemistry, and Significance in Contaminated Environments and Geological CO2 Sequestration. In Environmental Materials and Waste; Elsevier: Amsterdam, The Netherlands, 2016; pp. 543–567. [Google Scholar]
  11. Xiong, Z.; Wang, G.; Cao, Y.; Liang, C.; Li, M.; Shi, X.; Zhang, B.; Li, J.; Fu, Y. Controlling effect of texture on fracability in lacustrine fine-grained sedimentary rocks. Mar. Pet. Geol. 2019, 101, 195–210. [Google Scholar]
  12. Ma, C.; Dong, C.; Lin, C.; Elsworth, D.; Luan, G.; Sun, X.; Liu, X. Influencing factors and fracability of lacustrine shale oil reservoirs. Mar. Pet. Geol. 2019, 110, 463–471. [Google Scholar]
  13. Kumar, S.; Das, S.; Bastia, R.; Ojha, K. Mineralogical and morphological characterization of Older Cambay Shale from North Cambay Basin, India: Implication for shale oil/gas development. Mar. Pet. Geol. 2018, 97, 339–354. [Google Scholar] [CrossRef]
  14. Wang, M.; Ma, R.; Li, J.; Lu, S.; Li, C.; Guo, Z.; Li, Z. Occurrence mechanism of lacustrine shale oil in the Paleogene Shahejie Formation of Jiyang Depression, Bohai Bay Basin, China. Pet. Explor. Dev. 2019, 46, 833–846. [Google Scholar]
  15. Li, X.; Bai, Y.; Sui, H.; He, L. Understanding desorption of oil fractions from mineral surfaces. Fuel 2018, 232, 257–266. [Google Scholar] [CrossRef]
  16. Xu, L.; Yang, K.; Wei, H.; Liu, L.; Li, X.; Chen, L.; Xu, T.; Wang, X. Diagenetic evolution sequence and pore evolution model of Mesoproterozoic Xiamaling organic-rich shale in Zhangjiakou, Hebei, based on pyrolysis simulation experiments. Mar. Pet. Geol. 2021, 132, 105233. [Google Scholar]
  17. Du, J.; Cai, J.; Lei, T.; Li, Y. Diversified roles of mineral transformation in controlling hydrocarbon generation process, mechanism, and pattern. Geosci. Front. 2021, 12, 725–736. [Google Scholar] [CrossRef]
  18. Li, Q.; Chen, F.; Wu, S.; Zhang, L.; Wang, Y.; Xu, S. A simple and effective evaluation method for lacustrine shale oil based on mass balance calculation of Rock-Eval data. Appl. Geochem. 2022, 140, 105287. [Google Scholar]
  19. Su, S.; Jiang, Z.; Gao, Z.; Ning, C.; Wang, Z.; Li, Z.; Zhu, R. A new method for continental shale oil enrichment evaluation. Interpretation 2017, 5, T209–T217. [Google Scholar]
  20. Li, J.; Jiang, C.; Wang, M.; Lu, S.; Chen, Z.; Chen, G.; Li, J.; Li, Z.; Lu, S. Adsorbed and free hydrocarbons in unconventional shale reservoir: A new insight from NMR T1-T2 maps. Mar. Pet. Geol. 2020, 116, 104311. [Google Scholar] [CrossRef]
  21. Tissot, B.P.; Welte, D.H. Petroleum Formation and Occurrence; Springer: Berlin/Heidelberg, Germany, 1984. [Google Scholar]
  22. Lewan, M.D.; Winters, J.C.; McDonald, J.H. Generation of Oil-Like Pyrolyzates from Organic-Rich Shales. Science 1979, 203, 897–899. [Google Scholar] [CrossRef] [PubMed]
  23. Lewan, M.D. Experiments on the role of water in petroleum formation. Geochim. Cosmochim. Acta 1997, 61, 3691–3723. [Google Scholar]
  24. Spigolon, A.L.D.; Lewan, M.D.; Penteado, H.L.d.B.; Coutinho, L.F.C.; Filho, J.G.M. Evaluation of the petroleum composition and quality with increasing thermal maturity as simulated by hydrous pyrolysis: A case study using a Brazilian source rock with Type I kerogen. Org. Geochem. 2015, 83–84, 27–53. [Google Scholar] [CrossRef]
  25. Lewan, M.D.; Dolan, M.P.; Curtis, J.B. Effects of smectite on the oil-expulsion efficiency of the Kreyenhagen Shale, San Joaquin Basin, California, based on hydrous-pyrolysis experiments. AAPG Bull. 2014, 98, 1091–1109. [Google Scholar] [CrossRef]
  26. Lewan, M.D.; Roy, S. Role of water in hydrocarbon generation from Type-I kerogen in Mahogany oil shale of the Green River Formation. Org. Geochem. 2011, 42, 31–41. [Google Scholar] [CrossRef]
  27. Lewan, M.D.; Ruble, T.E. Comparison of petroleum generation kinetics by isothermal hydrous and nonisothermal open-system pyrolysis. Org. Geochem. 2002, 33, 1457–1475. [Google Scholar] [CrossRef]
  28. Burdelnaya, N.S.; Bushnev, D.A.; Mokeev, M.V. Changes in the composition of bitumen extracts and chemical structure of kerogen during hydrous pyrolysis. Geochem. Int. 2013, 51, 738–750. [Google Scholar] [CrossRef]
  29. Liang, M.; Wang, Z.; Zheng, J.; Li, X.; Wang, X.; Gao, Z.; Luo, H.; Li, Z.; Qian, Y. Hydrous pyrolysis of different kerogen types of source rock at high temperature-bulk results and biomarkers. J. Pet. Sci. Eng. 2015, 125, 209–217. [Google Scholar] [CrossRef]
  30. Wu, L.; Fang, X.; Ji, S.; Geng, A. Thermal alteration of biomarkers in the presence of elemental sulfur and sulfur-bearing minerals during hydrous and anhydrous pyrolysis. Org. Geochem. 2018, 123, 74–89. [Google Scholar] [CrossRef]
  31. Peters, K.E.; Moldowan, J.M.; Sundararaman, P. Effects of hydrous pyrolysis on biomarker thermal maturity parameters: Monterey Phosphatic and Siliceous members. Org. Geochem. 1990, 15, 249–265. [Google Scholar] [CrossRef]
  32. Chen, X.; Liu, Q.; Meng, Q.; Zhu, D.; Liu, W.; Fu, Q. Assessing effects of sulfate minerals on petroleum generation in sedimentary basins using hydrous pyrolysis: I. Light alkanes. Mar. Pet. Geol. 2019, 110, 737–746. [Google Scholar] [CrossRef]
  33. Kotarba, M.J.; Lewan, M.D. Sources of natural gases in Middle Cambrian reservoirs in Polish and Lithuanian Baltic Basin as determined by stable isotopes and hydrous pyrolysis of Lower Palaeozoic source rocks. Chem. Geol. 2013, 345, 62–76. [Google Scholar] [CrossRef]
  34. Mills, M.M.; Sanchez, A.C.; Boisvert, L.; Payne, C.B.; Ho, T.A.; Wang, Y. Understanding smectite to illite transformation at elevated (>100 °C) temperature: Effects of liquid/solid ratio, interlayer cation, solution chemistry and reaction time. Chem. Geol. 2023, 615, 121214. [Google Scholar] [CrossRef]
  35. Ferrage, E.; Vidal, O.; Mosser-Ruck, R.; Cathelineau, M.; Cuadros, J. A reinvestigation of smectite illitization in experimental hydrothermal conditions: Results from X-ray diffraction and transmission electron microscopy. Am. Mineral. 2011, 96, 207–223. [Google Scholar] [CrossRef]
  36. Eberl, D.; Hower, J. The hydrothermal transformation of sodium and potassium smectite into mixed-layer clay. Clays Clay Miner. 1977, 25, 215–227. [Google Scholar] [CrossRef]
  37. Yuan, G.-H.; Jin, Z.-H.; Cao, Y.-C.; Liu, K.-Y.; Gluyas, J.; Wang, Y.-Z.; Xi, K.-L. Evolution of nC16H34-water–mineral systems in thermal capsules and geological implications for deeply-buried hydrocarbon reservoirs. Geosci. Front. 2022, 13, 101322. [Google Scholar] [CrossRef]
  38. Yuan, G.; Cao, Y.; Zan, N.; Schulz, H.-M.; Gluyas, J.; Hao, F.; Jin, Q.; Liu, K.; Wang, Y.; Chen, Z.; et al. Coupled mineral alteration and oil degradation in thermal oil-water-feldspar systems and implications for organic-inorganic interactions in hydrocarbon reservoirs. Geochim. Cosmochim. Acta 2019, 248, 61–87. [Google Scholar] [CrossRef]
  39. Liu, K.; Safaei-Farouji, M.; Gao, Y.; Gentzis, T.; Liu, B.; Morta, H.B.; Ostadhassan, M. Physico-chemical variations of shale with artificial maturation: In the presence and absence of water. Geoenergy Sci. Eng. 2023, 225, 211675. [Google Scholar] [CrossRef]
  40. Subbotina, M.; Mukhina, E.; Karamov, T.; Popov, E.; Kozlova, E.; Morkovkin, A.; Mukhametdinova, A.; Prochukhan, K.; Cheremisin, A. Evolution of reservoir properties of oil shale rocks under hydro-thermal treatment: Investigations from micro- to macro-scale. Geoenergy Sci. Eng. 2023, 228, 211972. [Google Scholar] [CrossRef]
  41. Ma, W.; Hou, L.; Luo, X.; Tao, S.; Guan, P.; Liu, J.; Lin, S. Role of bitumen and NSOs during the decomposition process of a lacustrine Type-II kerogen in semi-open pyrolysis system. Fuel 2020, 259, 116211. [Google Scholar] [CrossRef]
  42. Cai, J.; Du, J.; Chen, Z.; Lei, T.; Zhu, X. Hydrothermal experiments reveal the influence of organic matter on smectite illitization. Clays Clay Miner. 2018, 66, 28–42. [Google Scholar] [CrossRef]
  43. Ding, W.; Li, C.; Li, C.; Xu, C.; Jiu, K.; Zeng, W. Dominant factor of fracture development in shale and its relationship to gas accumulation. Earth Sci. Front. 2012, 19, 212–220. [Google Scholar]
  44. Du, J.; Cai, J.; Long, S.; Gao, B.; Feng, D.; Peng, Z.; Zeng, X. The Control of Diagenesis and Mineral Assemblages on Brittleness of Mudstones. Front. Earth Sci. 2021, 9, 758046. [Google Scholar] [CrossRef]
  45. Gale, J.F.W.; Laubach, S.E.; Olson, J.E.; Eichhuble, P.; Fall, A. Natural Fractures in shale: A review and new observations. AAPG Bull. 2014, 98, 2165–2216. [Google Scholar] [CrossRef]
  46. Brigatti, M.F.; Galán, E.; Theng, B.K.G. Structure and Mineralogy of Clay Minerals. In Handbook of Clay Science; Elsevier: Amsterdam, The Netherlands, 2013; pp. 21–81. [Google Scholar]
  47. Ola, P.S.; Aidi, A.K.; Bankole, O.M. Clay mineral diagenesis and source rock assessment in the Bornu Basin, Nigeria: Implications for thermal maturity and source rock potential. Mar. Pet. Geol. 2018, 89, 653–664. [Google Scholar] [CrossRef]
  48. Van De Kamp, P.C. Smectite-illite-muscovite transformations, quartz dissolution, and silica release in shales. Clays Clay Miner. 2008, 56, 66–81. [Google Scholar] [CrossRef]
  49. Berthonneau, J.; Grauby, O.; Abuhaikal, M.; Pellenq, R.J.-M.; Ulm, F.J.; Damme, H.V. Evolution of organo-clay composites with respect to thermal maturity in type II organic-rich source rocks. Geochim. Cosmochim. Acta 2016, 195, 68–83. [Google Scholar] [CrossRef]
  50. Kennedy, M.J.; Wagner, T. Clay mineral continental amplifier for marine carbon sequestration in a greenhouse ocean. Proc. Natl. Acad. Sci. USA 2011, 108, 9776–9781. [Google Scholar] [CrossRef]
  51. Cai, C.; Cai, J.; Du, J.; Lei, T.; Wang, X.; Li, Z. Multistage Hydrocarbon Generation of Saline Lacustrine Source Rocks in Hydrous Pyrolysis: Insights from Clay Mineral–Organic Matter Interactions. ACS Omega 2023, 8, 14710–14729. [Google Scholar] [CrossRef]
  52. Galwey, A. Some chemical and mechanistic aspects of petroleum formation. Trans. R. Soc. S. Afr. 2015, 70, 9–24. [Google Scholar] [CrossRef]
  53. Szymański, W.; Drewnik, M.; Stolarczyk, M.; Musielok, Ł.; Gus-Stolarczyk, M.; Skiba, M. Occurrence and stability of organic intercalation in clay minerals from permafrost-affected soils in the High Arctic—A case study from Spitsbergen (Svalbard). Geoderma 2022, 408, 115591. [Google Scholar] [CrossRef]
Figure 1. (a) The location (red dotted frame) of the Jiyang Depression in the Bohai Bay Basin, China. (b) The structural units of the Dongying Sag in the Jiyang Depression. (c) The stratigraphic column of the Dongying Sag in the Jiyang Depression.
Energies 16 06219 g001
Figure 2. Variation of the bulk rock mineral and clay mineral compositions with temperature.
Energies 16 06219 g002
Figure 3. Variation of the liquid hydrocarbon yields, family group fractions, and gaseous hydrocarbon yields with temperature.
Energies 16 06219 g003
Figure 4. Variation of brittleness index (BEI) with temperature for different samples.
Energies 16 06219 g004
Figure 5. Correlation between the brittleness index (BEI) and the content of different minerals, such as clay mineral (a), I-Sm (b), illite (c), quartz and plagioclase (d), calcite (e) and ankerite (f).
Energies 16 06219 g005
Figure 6. Variation of weighted average specific surface area (SSAWA) (a) and hydrocarbon polarity index (PI) (b) with temperature for different samples.
Energies 16 06219 g006
Figure 7. A plot of weighted average specific surface area (SSAWA) and polarity index (PI) for different samples. The size of the circle represents the BEI value. Region A, where PI is greater than 1.5 and SSAWA is less than 150 m2/g, represents the highest movability for hydrocarbons. Region B, where PI is greater than 1.0 and SSAWA is greater than 150 m2/g, and Region D, where PI is less than 1.0, SSAWA is less than 150 m2/g, represent the medium movability for hydrocarbons. The BEI of Region D is higher than that of Region B, indicating that the movability of hydrocarbons of Region D is greater than that of the Region B. Region C has a PI of less than 1.0 and an SSAWA of greater than 150 m2/g, and the BEI is relatively low, represents the worst movability for hydrocarbons.
Energies 16 06219 g007
Table 1. Organic geochemical properties of the studied sample.
SampleDepth(m)FormationLithologyTOC
(%)
Tmax
(°C)
S1
(mg/g)
S2
(mg/g)
HI
(mg/g TOC)
OI
(mg/g TOC)
Ro (%)
N13050Es3MMudstone2.204370.4411.30514170.77
N33202Es3LMudstone10.214434.5576.7175160.81
N43300Es4UMudstone2.304411.8712.42540290.84
L3795Es4UMudstone1.614391.455.39335401.01
F4501Es4UMudstone0.484130.310.34711461.32
Note: TOC is the total organic carbon content. The S1 represents the free hydrocarbons that can be thermally distilled from the rock. The S2 represents the hydrocarbons generated by pyrolytic degradation of the kerogen in rock. The hydrogen index (HI) and oxygen index (OI) were calculated using the following formula: HI = S2 × 100/TOC, OI = S3 × 100/TOC. The S3 represents carbon dioxide generated from the rock. Tmax corresponds to the temperature at the maximum S2. Ro represents the thermal maturation and is calculated using the empirical formula, Ro = 0.2426 × Exp(0.3771 × H); H = Depth (km).
Table 2. Mineral composition of the studied sample.
SampleBulk MineralogyClay Mineralogy
Clay (%)Quartz (%)Plagioclase (%)Calcite (%)Ankerite (%)Pyrite (%)I-Sm 1 (%)Illite (%)Kaolinite (%)Chlorite (%)
N142.3125.226.8921.550.913.1273.8219.424.312.45
N331.6716.026.6338.761.285.6446.8446.793.842.54
N414.0023.445.8147.716.692.3532.0066.001.001.00
L34.8019.159.9321.869.824.4443.0057.000.000.00
F36.3725.3923.357.523.873.502.0081.004.0013.00
1 I-Sm = illite and smectite mixed-layer.
Table 3. Ionic composition of the water used in hydrous pyrolysis.
Main IonsFormationK+Na+Ca2+Mg2+ClSO42−HCO3Salinity
Concentration (g/L)Es34.36 14.54 3.13 0.38 32.04 0.45 1.15 56.05
Es427.00 2.14 5.22 0.61 37.76 0.91 0.80 74.44
Disclaimer/Publisher’s Note: The statements, opinions and data contained in all publications are solely those of the individual author(s) and contributor(s) and not of MDPI and/or the editor(s). MDPI and/or the editor(s) disclaim responsibility for any injury to people or property resulting from any ideas, methods, instructions or products referred to in the content.

