


LCA and C-LCC Indicator as Tools for Sodium-Ion Batteries’ Eco-Design
by
 , , ,
, , ,
Maria Leonor Carvalho
*,
Maria Anna Cusenza
,
Giulio Mela
,
Andrea Temporelli
,
Irene Quinzeni
and
Pierpaolo Girardi
Ricerca Sistema Energetico–RSE S.p.A., Via R. Rubattino 54, 20134 Milan, Italy
*
Author to whom correspondence should be addressed.
Energies 2023, 16(17), 6220; https://doi.org/10.3390/en16176220
Submission received: 26 July 2023
/
Revised: 22 August 2023
/
Accepted: 24 August 2023
/
Published: 27 August 2023
(This article belongs to the Special Issue Energy Storage: From Chemicals to Materials and More Ⅱ)
Abstract
:Sodium-ion batteries are considered promising alternatives to lithium-ion technology; however, the diffusion on a commercial scale is hindered by the struggle to identify materials with high electrochemical performances. Studies available in the literature are mainly focused on electrochemical performance and neglect aspects related to the environmental sustainability. In fact, the current state-of-the-art (presented in this study) shows that life cycle assessment (LCA) studies related to the production processes of electrode materials for Na-ion batteries are still very limited. The LCA methodology applied during the development of a technology phase can constitute a valid support for an eco-oriented design and, therefore, to the choice of solutions characterized by a lower environmental impact with the same electrochemical performance. In this context, a life cycle-based environmental–economic assessment was performed to evaluate the environmental impacts of the production process of cathode and anode materials for sodium-ion batteries. The study is focused on the cathodic active material Na0.66MnO2, considering two synthesis paths, and the anodic material consisting of tin (Sn) and Sn-carbon nanofiber (Sn-Cn) active material, binder, and other additives. Results illustrate the environmental performance of the different materials and constitute a useful input for their selection within an eco-design view.
1. Introduction
Sodium-ion batteries (SIBs) are considered one of the most promising alternatives to the lithium-ion technology [1]. Despite the growing research in this field, the diffusion on a commercial scale is hindered by the struggle to identify cathodic and anodic materials with high electrochemical performances and a useful lifetime, comparable to that of the most widespread technologies on the market [2]. Concerning cathodes, several active materials under study derive from lithium-ion technology since the operating principle of sodium-ion batteries is practically identical. These include, for example, the transition metal oxides, with the general formula NaxMeO2 (Me = transition metal). The up-to-date development in the various structures of the layered oxide materials for SIBs was discussed in [3]. The authors present the synthesis, electrochemical performance, and several challenges associated with SIBs. Instead, for anode materials, graphite, the most-used anode in Li-ion cells, does not significantly interact with the sodium-ion. Therefore, different types of anodic materials potentially suitable for use in sodium-ion cells are being studied. Indeed, they are classified considering the sodium-ion storage mechanisms following the categories: (a) materials that rely on the insertion/intercalation mechanism, such as carbon-based materials (graphite, hard coal, and titanium-based materials (TiO2)), (b) materials based on a conversion reaction, such as oxides, sulfides, and phosphides of some transition metals (such as iron (Fe) and tin (Sn)), and (c) materials forming alloys, such as compounds based on bismuth, phosphorus, silicon, germanium, arsenic, and antimony [4,5]. These anodic materials, after interaction with sodium atoms, undergo large variations in volume that cause mechanical stress, with consequent breakage and pulverization of the active material. These phenomena significantly limit batteries’ lifetime and performance. To solve these problems, research has focused on advanced methods for anode materials’ synthesis, such as using nanostructures, adding carbon-based coatings (e.g., graphene oxide coatings), and doping [5,6,7]. Although batteries are a fundamental asset for the energy transition [8], studies available in the literature are mainly focused on electrochemical performance and neglect aspects related to the environmental sustainability of cathodic and anodic materials and synthesis methods [9]. In this perspective, among different batteries’ components, electrode materials, and in particular cathode ones, are the most critical components for batteries because they determine the electrochemical performance [10]. Moreover, cathode production processes are responsible for a high contribution to the overall environmental impacts associated with the batteries’ production process [11,12,13]. Consequently, during the development of the technology phase, the evaluation of the environmental performance relating to the use of different types of materials and advanced synthesis techniques through the LCA methodology [14,15] can constitute a valid support for an eco-oriented design and, therefore, for the choice of solutions characterized by a lower environmental impact with the same electrochemical performance [12].
In this context, this article reports on an LCA carried out to examine the life cycle environmental impact of potential cathode and anode active materials for sodium-ion batteries. The LCA was carried out well before the industrial and pilot implementation on materials in order to help researchers make choices at the lab scale. In detail, for the cathode, the LCA was focused on the Na0.66MnO2 active materials, considering and comparing the impacts associated with different precursors and synthesis methods. For the anode, the production of the anodic material was investigated considering two active materials (Sn and Sn coupled with carbon nanofibers) and two types of binder. The main innovations of this article are: (1) it presents one of the first studies on sodium-ion batteries focused on the environmental sustainability assessment of potential cathode and anode materials, and (2) it contributes to the eco-design of sodium-ion technologies by proving the environmental impacts associated with different synthesis methods and active materials, with reference to the same energy capacity (1 Wh).
2. Literature Review
In this section, the authors present a literature review on LCA studies applied to sodium-ion batteries. The state-of-the-art analysis was conducted by consulting the main bibliographic databases, such as Scopus, Google Scholar, and Web of Science. The selected studies are briefly described below, with a particular focus on the investigated technologies.
Peters et al. [12] performed one of the first LCA studies on sodium-ion batteries, whereby the authors studied a sodium-ion cell in which the cathodic active material is a layered transition metal oxide (Na1.1Ni0.3Mn0.5Mg0.05Ti0.05O2—NMMT), while the anodic active material is hard carbon, obtained from a carbohydrate (sugar). The cathodic material was prepared with the “solvent casting” method by mixing the active material with a carbon black additive and the polyvinylidene fluoride (PVDF) binder dissolved in N-methyl-2-pyrrolidone (NMP). The anodic material was prepared with the same method by mixing the hard-carbon-based active material with the black-carbon-based additive and the binder, consisting of a mixture of styrene-butadiene copolymer (SBR) and carboxymethylcellulose (CMC) dissolved in water. The current collectors (for both the anode and cathode) were aluminum foils, the electrolyte was sodium hexafluorophosphate salt (NaPF6) dissolved in an organic solvent, and the separator was made of a porous sheet of polyethylene/propylene. Active materials’ manufacturing processes were modeled based on data sheets and patent data, while other cell components and the battery pack were modeled with lithium-ion batteries inventory data, available in the literature. Concerning active materials, production process inputs, in terms of thermal and electrical energy demand, and outputs, in terms pollutants emissions and process waste, were estimated based on stoichiometric considerations or proxy processes. The functional unit was 1 kWh of storage capacity, and the investigated impact categories were the use of fossil resources, climate change, terrestrial acidification, human toxicity, and eutrophication marine and freshwater, assessed through the characterization models implemented by the ReCiPe method [16]. The study showed that cathode and anode preparation processes had significant contributions to all categories examined. In detail, anode production represented 70% of the impact on the eutrophication marine, 30% on climate change and the consumption of fossil resources, and 20% on terrestrial acidification. The cathode was responsible for about 60% of the impact on terrestrial acidification, 20% on climate change, and 16% on terrestrial toxicity.
Considering only climate change, electricity consumption and heat requirements during cell and battery pack manufacturing were responsible for more than 30% of the total GWP impacts. Anode production represented 30% of the impact, followed by cathode production, responsible for 20% of the total GWP. Packaging, BMS, and the electrolyte represented 18% of the total GWP [12].
Later, in 2019, Peters et al. [17] applied LCA to estimate and compare the environmental impacts associated with the production of a hard-carbon-based anode active material from three different precursors: (1) waste tires, (2) apple pomace, and (3) phenolic resin. The three materials’ synthesis processes, at the industrial scale, were obtained by scaling up laboratory data. The environmental performance comparison was carried out assuming 1 kg of hard coal as a reference unit, therefore, without considering active material electrochemical performances. System boundaries were defined following a “from cradle to gate” approach. The foreground processes were modeled from laboratory data, available in the literature, scaled up to production scale, while background processes were modeled by Ecoinvent database data [18]. The environmental impact assessment was conducted with reference to the primary energy consumption categories, assessed with the cumulative energy demand (CED) method [19]. Climate change and resource consumption were estimated on the basis of the characterization models implemented using the ILCD 2011 Midpoint impacts method [20].
Results showed that hard carbon, from apple pomace, had the best environmental performance for the three impact categories investigated.
In 2021, Peters et al. [21] assessed the life cycle environmental impacts associated with five sodium-ion battery cells’ production. Cells under examination were characterized by the same anodic material, hard carbon, and the cathode active material varied, as follows: (1) Na1.1Ni0.3Mn0.5Mg0.05Ti0.05O2 (NaNMMT), (2) Na2/3(Mn0.95Mg0.05)O2 (NaMMO), (3) Na1.05(Ni0.33Mn0.33Co0.33)0.95O2 (NaNMC), (4) Na2[Fe(CN)6] (NaPBA), and (5) Na4[MnV(PO4)3] (NaMVP). The authors assumed a prismatic cell, a polyethylene/propylene membrane as a separator, a CMC-based binder for the anode, a PVDF binder for the cathode, and a NaPF6-based salt as the electrolyte.
The LCA study highlighted that NaMMO technology is the solution with the best environmental performance, since it is characterized by the smallest impact on all the environmental categories examined, except for climate change (for which the NaNMMT technology is preferred). The detailed analysis of the contribution of the individual components on the overall impacts of the cell production process has shown that:
- ○
- For the NaNMC technology, the production of the anode and the cathode are the processes responsible for the greatest contribution to the impacts in all examined categories.
- ○
- For NaMVP technology, anode and cathode production are the processes responsible for the greatest contribution to the impacts on climate change, acidification, and human toxicity, while the depletion of abiotic resources is affected to a greater extent by the electrolyte.
- ○
- For NaMMO, NaNMMT, and NaPBA technologies, cathode and anode production processes are responsible for the major contribution to the impact on acidification and represent a significant contribution to the impact on climate change. For the consumption of abiotic resources, the greatest contribution to the impacts is associated with the production of the electrolyte. With reference to human toxicity, in the case of NaNMMT technology, the process responsible for the greatest contribution to the impact is the anode, while in the case of NaMMO and NaPBA technologies, the production processes of the cell components contribute to the impact with almost equivalent percentages.
Malara et al. [13] evaluated the life cycle environmental impacts associated with an anode material production process by electrospinning of iron (III) oxide-based fibers (Fe2O3), which allows to obtain nanostructures with high porosity, and doping with aliovalent elements (silicon). This synthesis improved the conductive properties of the Fe2O3 fibers. The authors concluded that the thermal treatment, for both anodic materials (Fe2O3 and Fe2O3:Si fibers), is the production phase that shows the greater environmental impacts. The LCA study demonstrated that the Si-doped anode material exhibits a better electrochemical performance with respect to the undoped one and has a lower impact on each category of damage considered.
Liu et al. [22] applied LCA to compare the environmental impact in terms of climate change associated with a hard-carbon-based anode material for sodium-ion batteries obtained from cellulose through two different production process systems: system A, hydrothermal carbonization (HTC), followed by pyrolysis; system B, direct pyrolysis. Further, for both systems, results were obtained at 1000 and 1300 °C for the pyrolysis treatment. Subsequently, anodes were prepared using the synthesized hard carbons as active materials and a pouch cell was assembled using metallic sodium as a cathode. The life cycle assessment results showed that the preparation processes involving hydrothermal carbonization and pyrolysis (system A) are responsible for a lower environmental impact on climate change than the corresponding preparation systems, which only involve pyrolysis. The combined preparation process allows obtaining anodes characterized by better electrochemical performances.
A comparative LCA with a cradle-to-gate approach was performed by Mozaffarpour et al. [9] in order to evaluate the environmental impacts of the nanostructured cathode material Na3MnCO3PO4 (NMCP), obtained through three different production processes: ball milling, hydrothermal, and stirring-assisted hydrothermal. The authors concluded that in hydrothermal-based methods, sodium carbonate showed a much higher impact on almost all categories due to its greater use in these processes. Electricity demand is one of the main environmental weaknesses in ball milling and stirring-assisted hydrothermal methods. When 1 kWh of energy storage capacity is considered as the functional unit, ball milling showed the least environmental impact in all categories except acidification, eutrophication, and carcinogenics.
In 2022, Carvalho et al. [23] applied a life cycle environmental–economic assessment, comparing Na-ion coin cells with Ti1Al1TiC1.85 MXene as the anode material and Na0.44MnO2 as the cathode, with LIBs. LCA results show that the assessed SIBs are less environmentally friendly than LIBs, an outcome determined by the SIBs’ lower energy density. Nevertheless, if results are shown by mass, SIBs can be possible alternatives to LIBs. The authors show that Na-ion technology uses less-critical resources, both in absolute and in relative values, when compared to LIBs, highlighting the need to find valid alternatives to LIBs.
The current state-of-the-art shows that LCA studies related to the production processes of anodic and/or cathodic materials are still very limited. The few studies available are related to laboratory-scale production processes and are developed with the aim of comparing the environmental impacts associated with different active materials’ synthesis methods [9,13,22] and with the use of different precursors [17]. Further, some of them carry out analysis to identify the main processes in charge of the highest contribution to the impact [9,12,21]. Table 1 summarizes the cathodic and anodic materials of the current state-of-the-art, functional units, and global warming potential (GWP) results.
Table 1 shows that LCA studies on anodic active materials are limited to the analysis of hard carbon, MXenes, and iron (III) oxide, while with reference to the cathodic active materials, the analysis shows the greatest selection of potential active materials. The examined studies show that anode and cathode production processes are responsible for a significant share of the overall impacts associated with the production of a sodium-ion cell [21] and that the synthesis methods significantly affect the electrochemical performance of active materials, and consequently, the environmental performance [9,13,21].
Greenhouse gas emission results from the analyzed studies show a great variability, with the outcomes driven by several different functional units.
In the outlined framework, the present study contributes to the literature by developing the LCA of further active cathodic materials and anodes for sodium-ion batteries. Precisely, with reference to the active cathode material, Na0.66MnO2 was analyzed, and with reference to the anode, the analysis concerned an active anodic material made with metallic Sn powder and carbon nanofibers, and another in which only metallic Sn was used (Sn anode). Sn was chosen, with respect to other materials (such as germanium or antimony), due to its good electrochemical performance, low toxicity, and relatively low cost, and even if it is not particularly abundant, it is not among the critical materials in Europe.
3. Materials and Methods
The present and the following section are organized according to an ISO 10404-compliant LCA. The present section describes the goal and scope and the life cycle inventory, Section 4 presents the life cycle impact assessment, while Section 5, the conclusion, details the interpretation phase.
3.1. Life Cycle Assessment
3.1.1. Goal and Scope
The goal of this study was to assess the life cycle environmental impact associated with the production process of cathode and anode materials for sodium-ion batteries. The study is focused on the cathodic active material Na0.66MnO2, considering two synthesis paths, and the anodic material considering two active materials (Sn and Sn coupled with carbon nanofibers), two types of binder, and other additives. The functional unit is 1 Wh of cathodic active material capacity and 1 Wh of anodic material capacity.
System boundaries have been defined for both the cathode and the anodic materials according to a cradle-to-gate approach and include raw materials’ extraction, processing, and production at the laboratory scale of the active cathode material and the anode material.
SimaPro 9.3 software was used, using Ecoinvent 3.8 (“cut-off” allocation) as a background database and the Environmental Footprint (EF 3.0) methodology for impact assessment [24]. EF methods cover 16 environmental impact categories but, in this study, only impact categories with reliability levels I and II are reported. An exception is the resource use, minerals and metals, impact category that is also stated, although at level III, for its paramount importance in the field of energy storage. However, as discussed later, resource consumption has also been addressed with a further indicator, life cycle commodities costing [25], described in Section 3.2.
3.1.2. Life Cycle Inventory (LCI)
The following section describes how the active materials, both cathodic and anodic, were produced.
Na0.66MnO2 Cathodic Active Material
The Na0.66MnO2 cathodic active material was formulated from two types of synthesis methods: sol-gel (SG) and solid state (SS). For sol-gel synthesis, two scenarios were considered, as follows.
- (a)
- From nitrates (SG_N)
Sodium nitrate (NaNO3), manganese nitrate (Mn(NO3)2·4H2O), and citric acid (C6H8O7) (in a 2:1 ratio with respect to the sum of the cations moles), in stoichiometric quantities, were dissolved in 100 mL of water (plus 10% excess NaNO3, to compensate losses during heat treatments). The solution was kept overnight under stirring until complete solvent evaporation. The obtained powder was kept at 300 °C for 3 h to remove the organic component, and finally, at 750 °C for 12 h.
- (b)
- From acetates (SG_A)
Sodium acetate (C2H3NaO2) (with 10% moles excess to compensate losses during heat treatments), manganese acetate tetrahydrate (Mn (CH3CO2)2·4H2O), and citric acid (quantities equal to the sum of reactant moles) were dissolved in 100 mL of water. Under stirring, the solution was left to dry overnight. The obtained gel was kept at 350 °C for 5 h and successively at 800 °C for 12 h.
For solid-state synthesis (SS), manganese carbonate (MnCO3) was mixed with sodium carbonate (Na2CO3) and 5 mL of milli-Q water and milled for 10 min. Water was evaporated at room temperature, and the resulting powder was treated at 900 °C for 12 h.
Data regarding materials and energy consumption derive directly from the lab where they were produced and tested. The full inventory to produce the Na0.66MnO2 active material, background process modeling data sources, and electrochemical data can be found in the Supplementary Materials (Supplementary Materials, Section Cathode Inventory).
Anodic Material
Two different compositions were analyzed for the anodic material. Specifically, the analysis concerned an anodic material in which the active material is made with metallic tin (Sn) powder and carbon nanofibers (Sn_NC anode), and another in which only metallic Sn was used (Sn anode).
The anodic materials’ production process was divided into two phases:
- (a)
- The first phase consists of the milling and homogenization of the selected raw materials to produce the active negative material. Tin metal powder, for the Sn anode, and tin metal powder and carbon nanofibers, for the Sn_NC anodes, were introduced into the tungsten carbide grinding jars of a ball mill. The raw materials were mixed and homogenized in two steps: a first grinding at a frequency of 12 Hz for 16 min, and then for 8 min at 15 Hz.
- (b)
- In the second phase, the active negative material was mixed with a binder dissolved in a solvent and an additive. The Sn-NC anodes were prepared considering two scenarios: Sn-NC_PVDF, which uses polyvinylidene fluoride (PVDF) dissolved in acetone, and Sn-NC_CMC, which uses carboxymethylcellulose (CMC) dissolved in water. In both cases, carbon black (C65) was used as an additive. For the anodic material Sn, PVDF dissolved in the N-methyl-2-pyrrolidone (NMP) solvent was used as a binder.
Data regarding materials and energy consumption derive directly from the lab where they were produced, and the tested anodic material full inventory, background process modeling data sources, and electrochemical data can be found in the Supplementary Materials (Supplementary Materials, Section Anode Inventory).
3.2. Commodity Life Cycle Cost Indicator (C-LCC)
As anticipated, in order to overcome the criticalities related to the EF resource use, mineral and metals, the environmental performances in terms of resource use have been measured through the commodity life cycle cost indicator (C-LCC) [25]. Such indicator is based on market prices and quantifies, in monetary units, the level to which a product utilizes natural resources during its life cycle. Within the C-LCC, costs are handled as characterization factors, while the classification and characterization phases are carried out as in a conventional life cycle impact assessment [25].
The starting point for the calculation of the indicator is the list of all raw materials and energy flows that can be found in the database of the LCA SimaPro 9.3 software [26], while the second step is the identification, for every material and energy flow, of the corresponding market price. The inclusion of all raw materials and energy flows is an improvement from the previous version of the indicator (see Mela et al. [25]), which considered only the LCA indicator of minerals and fossils, and renewable resource depletion from the international reference life cycle data system (ILCD).
Market prices, or their proxies, are used as a measure of resource scarcity and, for this reason, rely on fewer, more reliable, and up-to-date assumptions with respect to other economic resource scarcity indicators, such as the mineral and fossil depletion indicators developed by ReCiPe [27].
For further information about the C-LCC indicator, please refer to Mela et al. [25].
4. Results and Discussion
4.1. Na0.66MnO2 Cathodic Active Material
Table 2 shows the environmental impacts associated with the production process of the cathodic active material Na0.66MnO2 through sol-gel synthesis, nitrate precursors (SG_N); sol-gel synthesis, acetate precursors (SG_A), and solid-state synthesis (SS). The contributions to the total impacts and broken down into different components/phases of the process are reported in Figure 1.
The energy requirement to produce the cathodic active material, at the laboratory scale, is the main contribution to all the examined indicators, independently of the synthesis type.
Considering climate change (GWP), the SG_N presents a lower impact (≈36%) compared to the SG_A. Since both have an identical electrochemical performance, this result is mostly due to the direct impacts during the production process, i.e., air emissions linked to drying and heat treatments (Table 3). The main difference is the precursors: nitrates or acetates. During drying and heat treatment, in the case of nitrates, water, NO2, and citric acid are emitted into the atmosphere, while for SG_A synthesis, water, CO2, and citric acid are the main emissions. The sodium and manganese “acetate” precursors involve higher values of CO2eq per Wh of cathodic active material due to their extraction and processing (Table 3, and for greater detail, see Figure 2). Citric acid has a greater impact on the SG_N due to the use of greater mass, compared to SG_A.
In the SG_N synthesis, the environmental impacts associated only with the production phase of the cathodic active material contribute 28% to the formation of photochemical ozone, 27% to the marine eutrophication, 14% to terrestrial eutrophication, 8% to particulates, and 2% to acidification.
The detailed analysis of the impact category of the use of mineral and metallic resources shows that SS synthesis has a lower impact of about 6% compared to the SG_A synthesis and 19% compared to the SG_N. The energy requirement necessary to produce the active material at the laboratory scale is the main contribution to the indicator, regardless of the synthesis type.
Excluding energy consumption (more details can be found in the Supplementary Materials, Cathode Results Section) and considering GWP, for the SG_N, citric acid is the main contributor to the indicator (92%). Instead, for SG_A and SS, air emissions linked to drying and heat treatments contribute 98% and 99%, respectively, to the indicator.
In the SG_N, the environmental impacts associated only with the cathode active material production phase contribute 91% to the formation of photochemical ozone, 87% to the marine eutrophication, 71% to terrestrial eutrophication, 35% for particulate matter, and 19% for acidification. Citric acid has an impact greater than 90% for the categories climate change, depletion of the ozone layer, eutrophication of freshwater, and use of resources—minerals and metals.
For SG_A, impacts associated with citric acid contribute between 67% and 83% to the categories photochemical ozone formation, particulate matter, freshwater eutrophication, marine eutrophication, terrestrial eutrophication, and resource use—minerals and metals. For this synthesis, the manganese precursor has an effect of between 15% and 47% in all categories, except the climate change category.
For SS, impacts associated with the manganese precursor (manganese carbonate) contribute between 79% and 97% to all impact categories considered, except the climate change category. For the latter, the environmental impacts associated with the cathode active material production phase contribute 99%.
4.2. Anodic Material
Table 4 shows the environmental impacts associated with the production process of the anode material considering different scenarios: Sn-NC_PVDF, Sn-NC_CMC, and Sn. The functional unit is 1 Wh of anode material energy capacity. The contributions to the total impacts broken down into different components/phases of the process are reported in Figure 3.
At the same energy capacity, the anodic material Sn presents the lowest impact in all considered impact categories when compared to anodic materials based on tin and carbon nanofibers (Sn-NC anodes). The better environmental performance of Sn is associated with its better electrochemical performance.
The comparison between the Sn-NC-based anode materials (Sn-NC_PVDF and Sn-NC_CMC) shows that Sn-NC_PVDF accounts for the lowest contribution to all the examined environmental impact categories, with the exception of the formation of photochemical ozone, on which the Sn-NC_CMC anode is responsible for the lowest impact (−17% compared to Sn-NC_PVDF), and the use of mineral and metallic resources, on which the difference between the impacts caused by the compared technologies is negligible (2.2%). With reference to GWP, although the CMC and aqueous solvent have lower impacts on these environmental categories than PVDF and acetone, the impact caused by the Sn-NC_PVDF anode material is about 8% lower than that associated with the anode material due to the better electrochemical performance.
Considering the use of mineral and metallic resources impact category, the Sn-NC_PVDF anode is responsible for a slightly higher impact (2.3%), compared to the Sn-NC_CMC. This result is mainly associated with the use of CMC, whose production is responsible for an impact on this category that is 78% less than that of PVDF, and secondly, to the lower quantity of tin contained in the Sn-NC_CMC anode (0.58 g), compared to the amount present in the Sn-NC_PVDF anode (0.67 g). Regarding the formation of the photochemical ozone impact category, the Sn-NC_PVDF anode shows a greater impact due to the use of an acetone-based solvent. Thus, the environmental benefits associated with the better electrochemical performance of the Sn-NC_PVDF anode are partially compensated using PVDF dissolved in acetone. In fact, although the amount of CMC and aqueous solvent used in the Sn-NC_CMC is greater than the amount of PVDF and acetone present in the Sn-NC_PVDF, the impact associated with the CMC–water combination is significantly smaller than the impact caused by PVDF dissolved in acetone in all considered categories.
The Sn anode has an active material made only by tin and uses NMP as a solvent and PVDF as a binder. The impacts associated with this anode are 57% lower for the resource use category—minerals and metals, and 72% lower for the photochemical ozone formation category, compared to Sn-NC_PVDF. The climate change impact of the Sn anode is less than 66% of the impact caused by the Sn-NC_PVDF anode.
The detailed analysis of the contribution of the single compounds showed that the environmental benefits associated with the better electrochemical performance of the Sn anode are partially compensated using the NMP solvent. In fact, although the amount of acetone required in the Sn-NC_PVDF anode is higher than the amount of NMP required in the Sn anode, the impacts associated with the latter are significantly higher. With reference to climate change, there is an impact greater than 34%, while the impact on the use of mineral and metallic resources is greater by an order of magnitude. Therefore, from the point of view of environmental impact, acetone performs better than NMP.
For the three anodes under examination, the grinding, drying, and calendering processes contribute with percentages higher than 70% in all the categories under examination, with the only exception being the consumption of resources, minerals and metals, on which the tin production process is responsible for the highest contribution to the impact (≈85%). The electricity consumption during the anodic materials’ production process is an aspect that requires attention.
It is important to underline that the scale-up from laboratory to industrial production is associated with a reduction in unit consumption due to scale economy, with a consequent reduction of energy consumption’s contribution to the impacts. With reference to the impact on climate change, the consumption of electricity accounts for more than 99% of all examined case studies, while for the consumption of the mineral and metal resources impact category, it represents the process responsible for the greatest contribution to the impact (approximately 13%) after that of tin production.
Considering the uncertainty on real consumption in the industrialization of the production process, an analysis was carried out excluding energy consumption (more details can be found in the Supplementary Materials, Anode Results Section).
The detailed analysis of the impact on climate change has shown that the processes responsible for the greatest contribution to the impact are the production of acetone, with an incidence of about 60%, followed by the production of Sn and PVDF, which have an impact of 30% and 10%, respectively. With reference to the consumption of mineral and metallic resources, 99.7% of the impact is due to the Sn production process.
4.3. Commodity Life Cycle Cost Indicator (C-LCC)
The C-LCC indicator is used to complement the life cycle assessment, providing information on the scarcity of the natural resources used in the processes under study. Scarcity, as detailed in Section 3.2, is quantified through market prices, which, in turn, reflect the expectations of economic operators on the supply and demand of each material in the medium term. Figure 4 illustrates the C-LCC indicator values calculated for (a) the three types of anodes and (b) the different cathodic materials considered.
The anode characterized by the highest value of the C-LCC indicator is the Sn-NC_CMC, with a value of about 6.06 euro/Wh, slightly higher than that of the Sn-NC_PVDF (5.66 euro/Wh). The Sn presents a much lower value of 2.12 euro/Wh.
In the case of cathodic materials, the baseline indicator values are very similar and range between 0.69 and 0.65 euro/Wh.
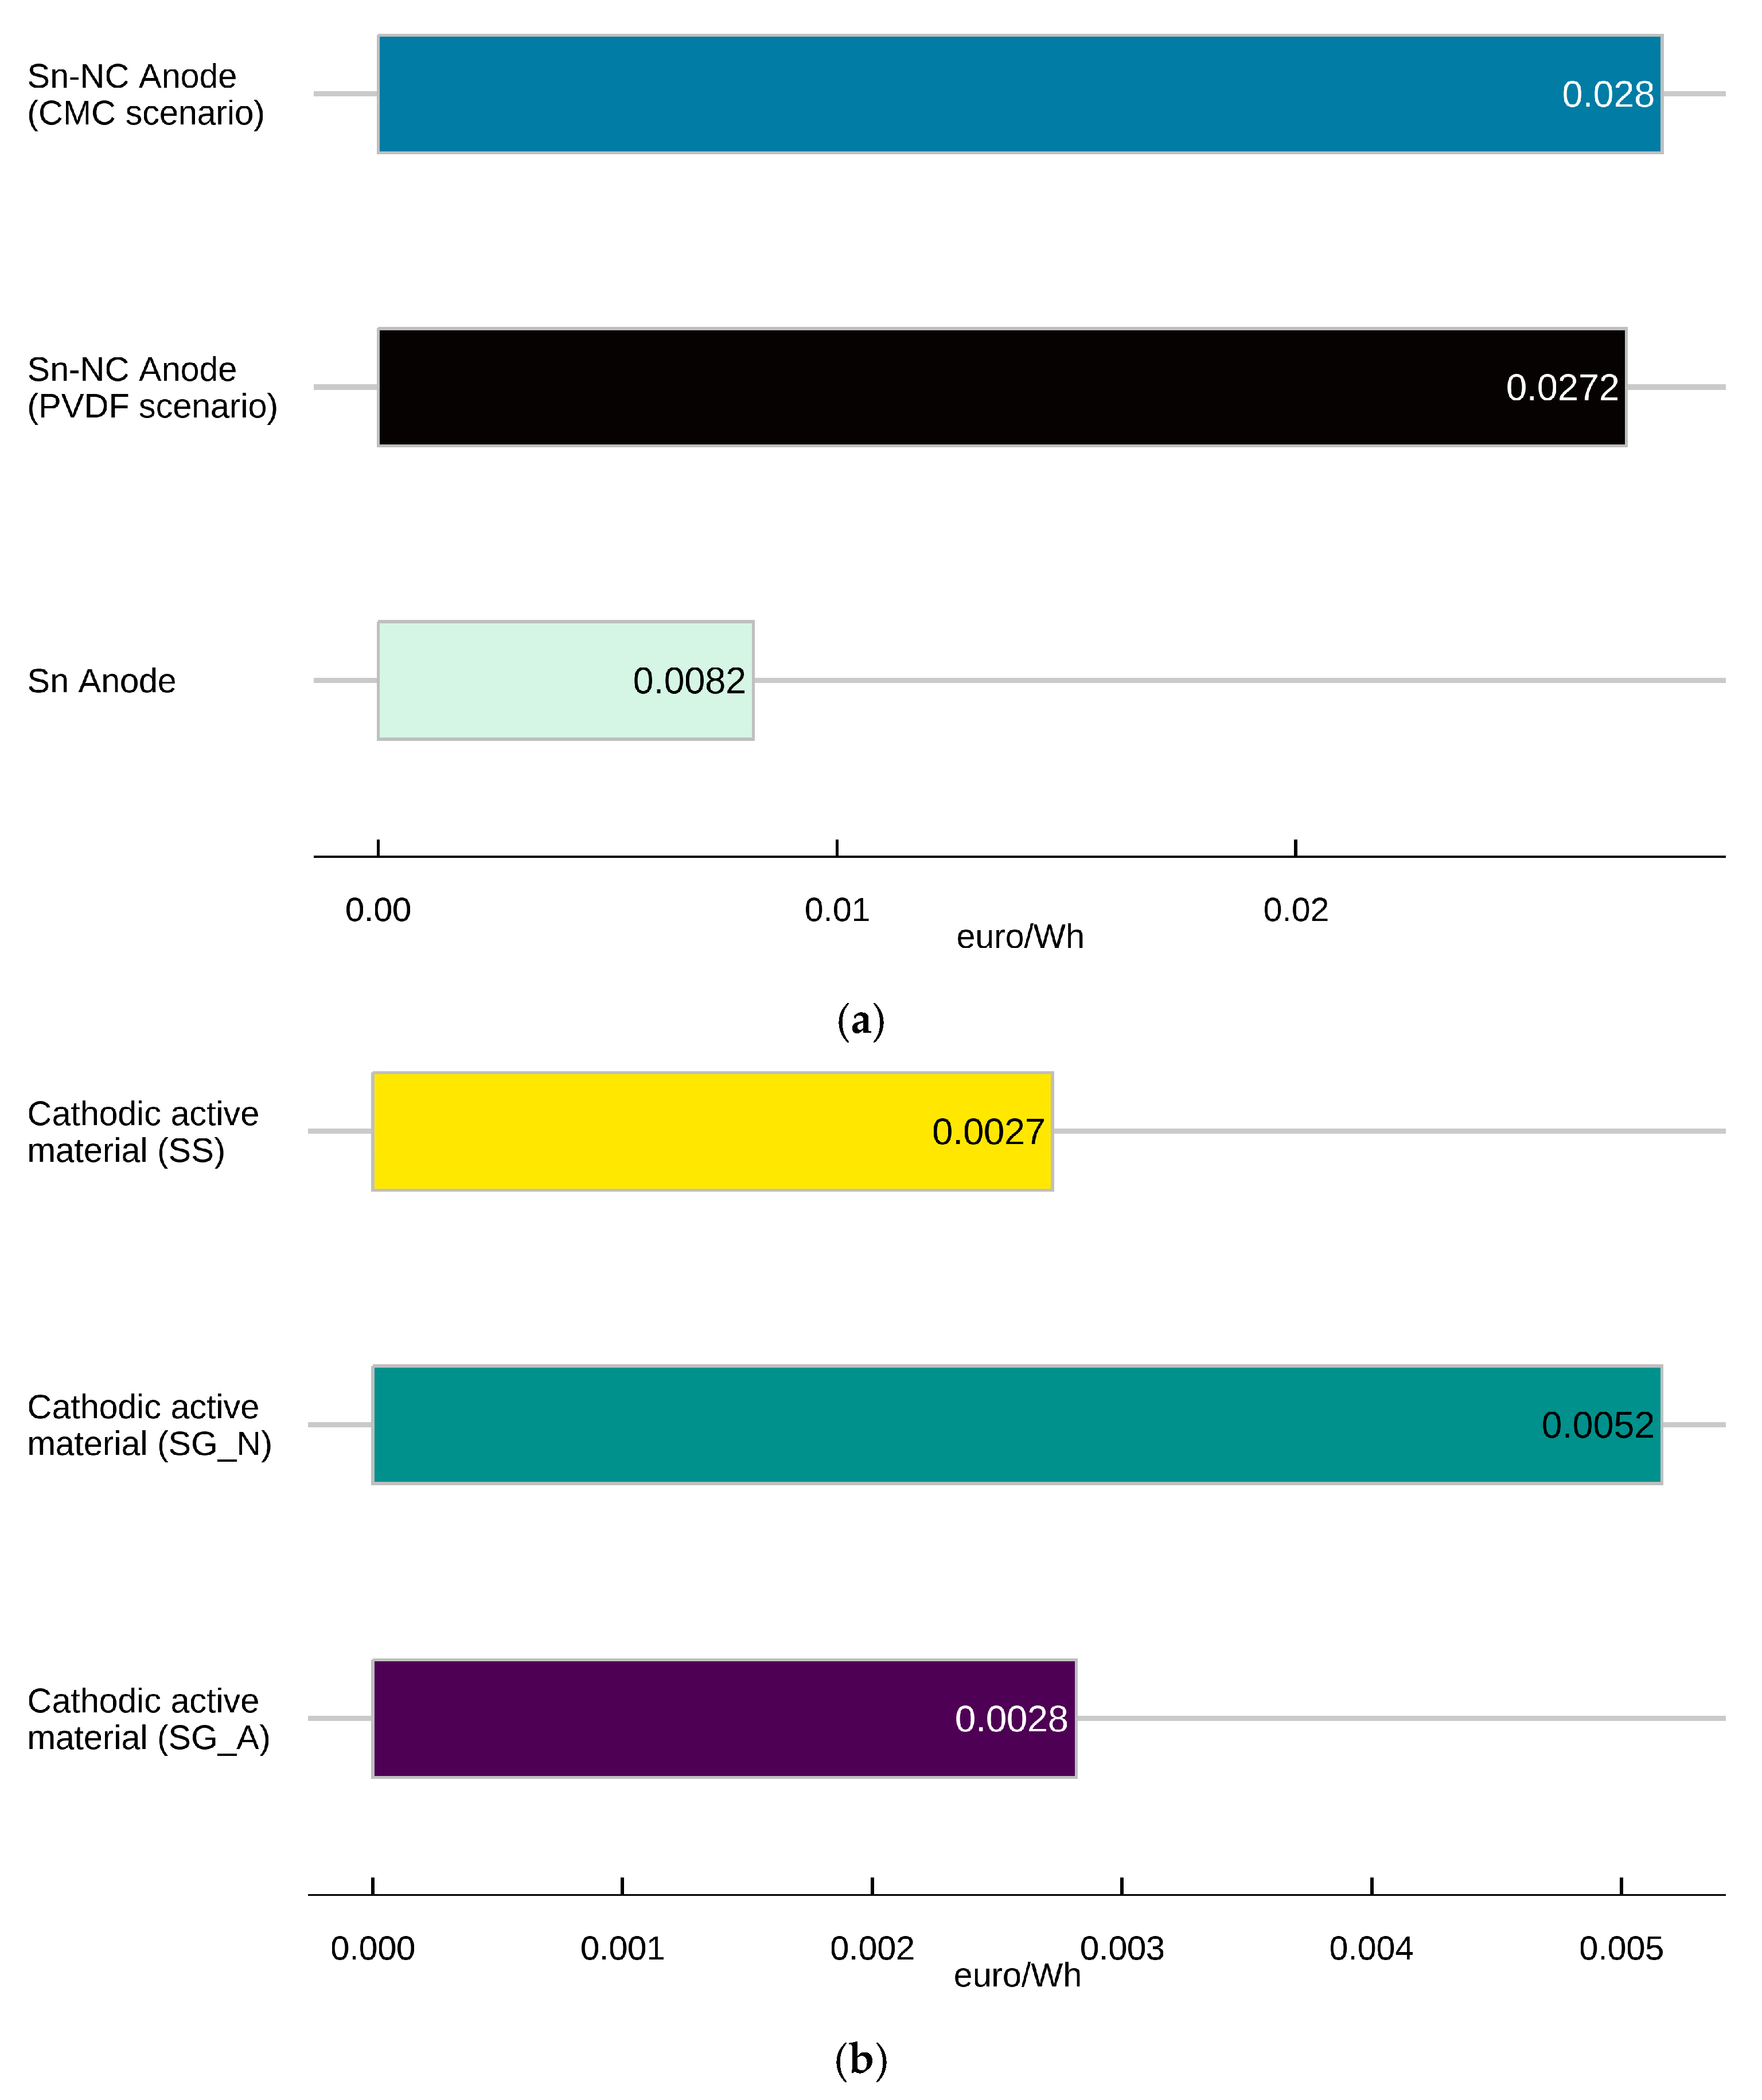
The breakdown of the C-LCC index for the different components of the three anodes and the three different cathodic active materials analyzed is illustrated in Figure 5 (the presented results do not consider electricity consumption, by far the process with the greatest weight on the C-LCC indicator).
For all considered anode scenarios, the most important process, in terms of resource use, is represented by the active material (in this case, tin); although, in the case of the Sn anode, the solvent also has a not negligible relative weight (approximately 27%). The anodes differ from each other by the binder and solvent used in the production process of the active material.
The critical C-LCC indicator can be calculated considering critical materials only (that is, materials crucial for the European economy and the energy transition, supply of which is concentrated in a few possibly geo-politically unstable extra-EU countries). The critical materials considered are those included in the 2020 EU list of critical materials, as follows: antimony, baryte, beryllium, bismuth, borate, cobalt, coking coal, fluorspar, gallium, germanium, hafnium, heavy rare-earth elements, light rare-earth elements, indium, magnesium, natural graphite, natural rubber, niobium, platinum group metals, phosphate rock, phosphorous, scandium, silicon metal, tantalum, tungsten, vanadium, bauxite, lithium, titanium, and strontium [28]. Figure 6 shows the value of the critical C-LCC indicator calculated based only on the previous processes, to highlight which binder–solvent combination is optimal from the use of resources point of view.
In this case, the Sn-NC_PVDF and the Sn are the elements characterized by the highest indicator values, while the Sn-NC_CMC is the one with the binder and solvent characterized by less resources. The C-LCC indicator calculated for the processes involving the binder and solvent of the latter, in fact, is much lower than that of the other two alternatives.
Figure 7a shows the critical C-LCC indicator computed for the anode types. In absolute value, similar to the baseline C-LCC indicator, the Sn-NC_CMC and the Sn-NC_PVDF are the elements with the highest critical C-LCC index, while the Sn is significantly lower. In percentage terms, the incidence of critical materials on the total baseline C-LCC indicator is very low and similar across all anodes (about 0.4%).
In the case of cathodic active materials, even though the baseline C-LCC indicator assumes comparable values between the three alternatives (Figure 5b), the relative share of each component is very different. In the case of the SS cathode, the main material requirements come from manganese carbonate; in the case of the SG_N, citric acid, manganese nitrate, and sodium nitrate; while in the case of the SG_A, in addition to citric acid, manganese acetate has the greatest relevance. The situation is slightly different in the case of the critical C-LCC indicator; in this case, the cathodic active material SG_N is characterized by a significantly higher value than that of the other two elements. However, even in that case, the relative importance of the critical C-LCC indicator on the total baseline indicator is less than 1%.
Uncertainty analysis of the C-LCC indicator with the Monte Carlo method can be found in the Supplementary Materials (Supplementary Materials, Uncertainty Analysis Section: Monte Carlo). The results show a strong stability of the ordering of the alternatives.
5. Conclusions
This study presented the life cycle environmental impact assessment associated with the production processes of cathodic and anodic materials for electrochemical sodium-ion storage systems. For the cathode, only the active material was studied, comparing the environmental impacts associated with the use of two types of synthesis methods, i.e., sol-gel synthesis and solid-state synthesis, and the use of different precursors for the sol-gel synthesis, i.e., nitrate and acetate. For the anode, the anodic material consisting of two different negative active materials (metallic tin powder plus carbon nanofibers, and only metallic tin), three types of binders (PVDF dissolved in acetone, CMC dissolved in water, and PVDF dissolved in an NMP), and other additives was considered to obtain better electrochemical performances.
For the Na0.66MnO2 cathodic material, results indicated that the sol-gel synthesis from nitrate should be favorable in an eco-design view of sustainability.
In the sol-gel synthesis, citric acid had a strong influence in various impact categories. From an eco-design perspective, citric acid quantity optimization and/or an alternative gelling agent could be a good strategy.
With reference to the anode, with a view to decarbonize the energy system, the anode consisting of metallic tin combined with carbon nanofiber and PVDF could be the most promising technology. The CMC–water combination was responsible for a significantly lower impact than the PVDF–acetone combination for all the investigated categories. Thus, if the anodic electrochemical performances are similar, the eco-oriented design should favor the use of CMC and water.
The Sn anode ranked as the best solution, both in terms of decarbonization and in terms of decoupling the energy system from the use of minerals and metals. However, it is important to underline that the environmental benefits associated with the better electrochemical performance of the Sn anode were partially compensated using the NMP solvent. From an eco-oriented design point of view, it is suggested to evaluate the use of a more sustainable solvent. Finally, electricity consumption associated with cathodic material and anodic production processes presented a high contribution to most of the considered impact categories. Energy consumption is an aspect that requires attention from an eco-design perspective on an industrial scale.
The baseline C-LCC indicator showed a greater use of resources by the Sn anode. The use of critical materials was very low for all three anodic alternatives considered, as evidenced by the critical C-LCC indicator which, in all cases, accounted for less than 1% of the total baseline indicator.
In the case of the cathode, the baseline C-LCC indicator values were very similar for all the alternatives considered. As for the anode, as well as the cathodic active material, the weight of the critical materials was very low, a symptom that does not constitute a limiting factor for any large-scale production.
Supplementary Materials
The following supporting information can be downloaded at: https://www.mdpi.com/article/10.3390/en16176220/s1. Refs. [29,30,31,32,33] cited in Supplementary Materials. Table S1. Inventory data for the cathodic active material production process, at the laboratory scale, considering two different synthesis processes: Sol-Gel (SG) and Solid-State (SS). For sol-gel synthesis, two scenarios were considered: From nitrates (SG_N) and from acetates (SG_A); Table S2. Background processes modelling for the cathodic active material Na0.66MnO2 production; Table S3. Average work potentials and capacities (SG_N: Sol-gel synthesis from nitrates; SG_A: Sol-gel synthesis from acetates; SS: Solid state synthesis). Figure S1. Impact assessment results for 1 Wh of cathodic active material capacity, broken down different components/phases of the production proces, excluding energy consumption; Table S4: Inventory data for anode materials production process, at laboratory scale. Table S5: Average work potentials and capacities. Table S6: Background processes modelling for the anodic materials. Figure S2. Impact assessment results for 1 Wh of anode material capacity, broken down different components/phases of the production proces, excluding energy consumption; Figure S3. Anode: Monte Carlo simulations and comparison with baseline values. Figure S4. Cathodic material: Monte Carlo simulations and comparison with baseline values. Figure S5. Anode: probabilities that the C-LCC indicator falls below the baseline value, given price fluctuations. Figure S6. Cathod material: probabilities that the C-LCC indicator falls below the baseline value, given price fluctuations.
Author Contributions
Conceptualization and methodology, M.L.C., M.A.C., G.M. and P.G.; investigation, M.L.C., M.A.C., G.M. and I.Q.; data curation, all authors; writing—original draft preparation, M.L.C., M.A.C. and G.M.; writing—review and editing, all authors; supervision, P.G. All authors have read and agreed to the published version of the manuscript.
Funding
This research received no external funding.
Data Availability Statement
The data that support the findings of this study are available from the corresponding author on request.
Acknowledgments
This work has been financed by the Research Fund for the Italian Electrical System under the Contract Agreement between RSE S.p.A. and the Ministry of Economic Development—General Directorate for the Electricity Market, Renewable Energy and Energy Efficiency, Nuclear Energy, in compliance with the Decree of 16 April 2018.
Conflicts of Interest
The authors declare no conflict of interest.
References
- Vaalma, C.; Buchholz, D.; Weil, M. A cost and resource analysis of sodium-ion batteries. Nat. Rev. Mater. 2018, 3, 18013. [Google Scholar] [CrossRef]
- Sayahpour, B.; Hirsh, H.; Parab, S.; Nguyen, L.; Zhang, M.; Meng, Y. Perspective: Design of cathode materials for sustainable sodium-ion batteries. MRS Energy Sustain. 2022, 9, 183–197. [Google Scholar] [CrossRef]
- Kanwade, A.; Gupta, S.; Kankane, A.; Kumar Tiwari, M.; Srivastava, A.; Akash Kumar Satrughna, J.; Yadav, S.C.; Shirage, P.M. Transition metal oxides as a cathode for indispensable Na-ion batteries. RSC Adv. 2022, 12, 23284–23310. [Google Scholar] [PubMed]
- Gerbaldi, C.; Bella, F.; Colò, F.; Piana, G.; Meligrana, G. Elettrodi Inorganici Nanostrutturati Innovativi per Batterie Sodio-Ione; Report RdS/PAR2017/162; ENEA: Roma, Italy, 2018. [Google Scholar]
- Perveen, T.; Siddiq, M.; Shahzad, N.; Ihsan, R.; Ahmad, A.; Shahzad, M. Prospects in anode materials for sodium ion batteries—A review. Renew. Sustain. Energy Rev. 2020, 119, 109549. [Google Scholar]
- Liu, Y.; Liu, X.; Wang, T.; Fan, L.; Jiao, L. Research and application progress on key materials for sodium-ion batteries. Sustain. Energy Fuels 2017, 1, 986–1006. [Google Scholar]
- Reddy, I.; Akkinepally, B.; Manjunath, V.; Neelima, G.; Reddy, M.; Shim, J. SnO2 Quantum Dots Distributed along V2O5 Nanobelts for Utilization as a High-Capacity Storage Hybrid Material in Li-Ion Batteries. Molecules 2021, 26, 7262. [Google Scholar] [CrossRef] [PubMed]
- Gallo, A.B.; Simões-Moreira, J.R.; Costa, H.K.M.; Santos, M.M.; Moutinho dos Santos, E. Energy storage in the energy transition context: A technology review. Renew. Sustain. Energy Rev. 2016, 65, 800–822. [Google Scholar] [CrossRef]
- Mozaffarpour, F.; Hassanzadeh, N.; Vahidi, E. Comparative life cycle assessment of synthesis routes for cathode materials in sodium-ion batteries. Clean Technol. Environ. Policy 2022, 24, 3319–3330. [Google Scholar] [CrossRef]
- Liu, C.; Neale, Z.; Cao, G. Understanding electrochemical potentials of cathode materials in rechargeable batteries. Mater. Today 2016, 19, 109–123. [Google Scholar] [CrossRef]
- Ponzio, J.; Scown, C. Life-Cycle Assessment Considerations for Batteries and Battery Materials. Adv. Energy Mater. 2022, 11, 2100771. [Google Scholar]
- Peters, J.; Buchholz, D.; Passerini, S.; Weil, M. Life cycle assessment of sodium-ion batteries. Energy Environ. Sci. 2016, 9, 1744–1751. [Google Scholar] [CrossRef]
- Malara, A.; Pantò, F.; Santangelo, S.; Antonucci, P.; Fiore, M.; Longoni, G.; Ruffo, R.; Frontera, P. Comparative life cycle assessment of Fe2O3-based fibers as anode materials for sodium-ion batteries. Environ. Dev. Sustain. 2021, 23, 6786–6799. [Google Scholar] [CrossRef]
- ISO 14040:2006/A1:2020; Environmental Management—Life Cycle Assessment—Principles and Framework. ISO—The International Organization for Standardization: Geneva, Switzerland, 2020.
- ISO 14044:2006/Amd 2:2020; Environmental Management—Life Cycle Assessment—Requirements and Guidelines. ISO—The International Organization for Standardization: Geneva, Switzerland, 2020.
- Goedkop, M.; Heijungs, R.; Huijbregts, M.; De Schryver, A.; Struijs, J.; van Zelm, R. ReCiPe 2008: A Life Cycle Impact Assessment Method Which Comprises Harmonised Category Indicators at the Midpoint and the Endpoint Level; First Edition Report I; Ministry of Housing, Spatial Planning and Environment (VROM): Barendrecht, The Netherlands, 2009.
- Peters, J.; Abdelbaky, M.; Baumann, M.; Weil, M. A review of hard carbon anode materials for sodium-ion batteries and their environmental assessment. Matériaux Tech. 2019, 107, 503. [Google Scholar] [CrossRef]
- Wernet, G.; Bauer, C.; Steubing, B.; Reinhard, J.; Moreno-Ruiz, E.; Weidema, B. The ecoinvent database version 3 (part I): Overview and methodology. Int. J. Life Cycle Assess. 2016, 21, 1218–1230. [Google Scholar] [CrossRef]
- Frischknecht, R.; Jungbluth, N. Implementation of Life Cycle Impact Assessment Methods; Final Report Ecoinvent 2000; Swiss Centre for LCI: Duebendorf, Switzerland, 2000. [Google Scholar]
- European Commission-Joint Research Centre—Institute for Environment and Sustainability. International Reference Life Cycle Data System (ILCD) Handbook—Recommendations for Life Cycle Impact Assessment in the European Context; EUR 24571 EN; Publications Office of the European Union: Luxemburg, 2011. [Google Scholar]
- Peters, J.B.M.; Binder, J.W.M. On the environmental competitiveness of sodium-ion batteries under a full life cycle perspective a cell-chemistry specific modelling approach. Sustain. Energy Fuels 2022, 6, 512–513. [Google Scholar] [CrossRef]
- Liu, H.; Xu, Z.; Guo, Z.; Feng, J.; Li, H.; Qiu, T.; Titirici, M. A life cycle assessment of hard carbon anodes for sodium-ion batteries. Philos. Trans. R. Soc. 2021, 379, 20200340. [Google Scholar] [CrossRef] [PubMed]
- Carvalho, M.L.; Mela, G.; Temporelli, A.; Brivio, E.G.P. Sodium-Ion Batteries with Ti1Al1TiC1.85 MXene as Negative Electrode: Life Cycle Assessment and Life Critical Resource Use Analysis. Sustainability 2022, 14, 5976. [Google Scholar] [CrossRef]
- Fazio, S.; Biganzioli, F.; De Laurentiis, V.; Zampori, L.; Sala, S.; Diaconu, E. Supporting Information to the Characterisation Factors of Recommended EF Life Cycle Impact Assessment Methods, Version 2, from ILCD to EF 3.0, EUR 29600 EN, European Commission; Publications Office of the European Union: Luxembourg, 2018; ISBN 978-92-79-98584-3. PUBSY No. JRC114822. [Google Scholar]
- Mela, G.; Carvalho, M.L.; Temporelli, A.; Girardi, P. The Commodity Life Cycle Costing Indicator. An Economic Measure of Natural Resource Use in the Life Cycle. Sustainability 2021, 13, 4870. [Google Scholar] [CrossRef]
- Pré Sustainability. SimaPro|LCA Software for Informed Change-Makers. Pré Sustainability. 2022. Available online: https://simapro.com/ (accessed on 12 December 2022).
- Pré Sustainability. The ReCiPe Method. 2021. Available online: https://pre-sustainability.com/articles/recipe/ (accessed on 2 January 2021).
- European Commission. Communication from the Commission to the European Parliament, the Council, the European Economic and Social Committee and the Committee of the Regions Critical Raw Materials Resilience: Charting a Path towards Greater Security and Sustainability; European Commission: Brussels, Belgium, 2020. [Google Scholar]
- Dai, Q. Life Cycle Assessment of Natural Gas Utilization in Light-Duty Passenger Vehicles; Civil and Environmental Engineering Ann Arbor, University of Michigan: Ann Arbor, MI, USA, 2014. [Google Scholar]
- Jungbluth, N. Life Cycle Inventory of Sodium Acetate and Expanded Graphite; ESU-servives Ltd.: London, UK, 2008. [Google Scholar]
- Carvalho, M.L.; Marmiroli, B.; Mela, G.; Molocchi, A. LCA ed Esternalità del kWh Italiano: 2020 e Scenari Futuri; RSE SpA: Milano, Italy, 2022. [Google Scholar]
- Johansson, E.; Norrman, F. Life Cycle Analysis on Phase Change Materials for Thermal Energy Storage; Royal Institute of Technology (KTH): Stockholm, Sweden, 2019. [Google Scholar]
- Khanna, V.; Bakshi, B.; Lee, L. Carbon Nanofiber Production. Life Cycle Energy Consumption and Environmental Impact. J. Ind. Ecol. 2008, 12, 394–410. [Google Scholar] [CrossRef]
Figure 1.
Impact assessment results for 1 Wh of cathodic active material capacity broken down into different components/phases of the production process: (a) SG_N: sol-gel synthesis, nitrate precursors; (b) SG_A: sol-gel synthesis, acetate precursors; (c) SS: solid-state synthesis (GWP: global warming potential, ODP: ozone depletion potential, IR: ionizing radiation, POCP: photochemical ozone formation, PM: particulate matter, AP: acidification, EPFW: eutrophication, freshwater, EPM: eutrophication, marine, EPT: eutrophication, terrestrial, ADPm&m: resource use, minerals and metals).


Figure 2.
Impact assessment results for the climate change impact category per Wh of cathodic active material, broken down into the different precursors (SG_N: sol-gel synthesis, nitrate precursors; SG_A: sol-gel synthesis, acetate precursors; SS: solid-state synthesis).
Figure 2.
Impact assessment results for the climate change impact category per Wh of cathodic active material, broken down into the different precursors (SG_N: sol-gel synthesis, nitrate precursors; SG_A: sol-gel synthesis, acetate precursors; SS: solid-state synthesis).

Figure 3.
Impact assessment results for 1 Wh of anodic material capacity, broken down into different components/phases of the production process: (a) Sn-NC_PVDF, (b) Sn-NC_CMC, and (c) Sn scenario (GWP: global warming potential, ODP: ozone depletion potential, IR: ionizing radiation, POCP: photochemical ozone formation, PM: particulate matter, AP: acidification, EPFW: eutrophication, freshwater, EPM: eutrophication, marine, EPT: eutrophication, terrestrial, ADPm&m: resource use, minerals and metals).


Figure 4.
C-LCC indicator values calculated for: (a) the different types of anodes and (b) the different cathodic active materials.
Figure 4.
C-LCC indicator values calculated for: (a) the different types of anodes and (b) the different cathodic active materials.

Figure 5.
Commodity life cycle cost indicator (C-LCC) component breakdown: (a) anodes and (b) cathodic active materials (percentage on total C-LCC).
Figure 5.
Commodity life cycle cost indicator (C-LCC) component breakdown: (a) anodes and (b) cathodic active materials (percentage on total C-LCC).

Figure 6.
Critical commodity life cycle cost indicator calculated for the binder and solvent production processes.
Figure 6.
Critical commodity life cycle cost indicator calculated for the binder and solvent production processes.

Figure 7.
Critical commodity life cycle cost indicator—absolute values for: (a) anode and (b) cathode.
Figure 7.
Critical commodity life cycle cost indicator—absolute values for: (a) anode and (b) cathode.


Table 1.
LCA studies applied to sodium-ion batteries: active materials for cathodes and anodes analyzed in the literature, functional units, and global warming results.
Table 1.
LCA studies applied to sodium-ion batteries: active materials for cathodes and anodes analyzed in the literature, functional units, and global warming results.
| References | Active Material | Functional Units | Global Warming |
|---|---|---|---|
| Peters et al. [12], 2016 | Cathode: Na1.1Ni0.3Mn0.5Mg0.05Ti0.05O2 Anode: Hard carbon | kW storage capacity | 140.33 kg CO2eq/kW storage capacity |
| Peters et al. [17], 2019 | Anode 1: Hard carbon from waste tires Anodo 2: Hard carbon from apple pomace Anodo 3: Hard carbon from phenolic resins | kg hard carbon kg SIBB cell from different hard carbons | 6.27 CO2eq/kg hard carbon from waste tires 10.41 CO2eq/kg SIB cell from waste tires 2.69 CO2eq/kg hard carbon from apple pomace 9.42 CO2eq/kg SIB cell from apple pomace 14.85 CO2eq/kg hard carbon from phenolic resins 12.78 CO2eq/kg SIB cell from phenolic resins |
| Peters et al. [21], 2021 | Cathode 1: Na1.1Ni0.3Mn0.5Mg0.05Ti0.05O2 (NaNMMT); Cathode 2: Na2/3(Mn0.95Mg0.05)O2 (NaMMO); Cathode 3: Na1.05(Ni0.33Mn0.33Co0.33)0.95O2 (NaNMC); Cathode 4: Na2[Fe(CN)6] (NaPBA); Cathode 5: Na4[MnV(PO4)3] (NaMVP); Anode: Hard carbon | kWh of battery cell capacity | 50.6 kg CO2eq/kWh of battery cell capacity NaNMMT 52.3 kg CO2eq/kWh of battery cell capacity NaMMO 86.7 kg CO2eq/kWh of battery cell capacity NaNMC 87.0 kg CO2eq/kWh of battery cell capacity NaPBA 89.7 kg CO2eq/kWh of battery cell capacity NaMVP |
| Malara et al. [13], 2021 | Anode 1: Electro-spun Fe2O3:Si-based fibers Anode 2: Electro-spun Fe2O3-based fibers | storage capacity delivered by the anode | - |
| Liu et al. [22], 2021 | Anode 1: Hydrothermal carbonization (HTC) followed by pyrolysis Anode 2: Direct pyrolysis with different carbon yields | kg hard carbon | 4.07 kg CO2 eq/kg hard carbon 1 4.61 kg CO2 eq/kg hard carbon 2 |
| Mozaffarpour et al. [9], 2022 | Cathode 1: Na3MnCO3PO4—ball milling synthesis Cathode 2: Na3MnCO3PO4—hydrothermal synthesis Cathode 3: Na3MnCO3PO4—stirring-assisted hydrothermal synthesis | kg hard cathode | 15.3 kg CO2eq/kg cathode 1 14.2 kg CO2eq/kg cathode 2 20.0 kg CO2eq/kg cathode 3 |
| Carvalho et al. [23], 2022 | Na_Lab and Na_Ind—Cathode: Na0.44MnO2/Anode: Mxene_Ti1Al1TiC1.85 | kWh coin cell capacity | 5.56 × 10⁴ kg CO2eq/kWh coin Na_Lab cell capacity 6.98 kg CO2eq/kg coin Na_Lab cell 5.15 × 10³ kg CO2eq/kWh coin Na_Ind cell capacity 2.21 kg CO2eq/kg coin Na_Ind cell |
Table 2.
Impact assessment results for 1 Wh of cathodic active material capacity (SG_N: sol-gel synthesis, nitrate precursors; SG_A: sol-gel synthesis, acetate precursors; SS: solid-state synthesis).
Table 2.
Impact assessment results for 1 Wh of cathodic active material capacity (SG_N: sol-gel synthesis, nitrate precursors; SG_A: sol-gel synthesis, acetate precursors; SS: solid-state synthesis).
| Impact Category | SG_N | SG_A | SS |
|---|---|---|---|
| Climate change (GWP) (kg CO2eq) | 4.58 | 7.15 | 6.00 |
| Ozone depletion (ODP) (kg CFC-11eq) | 6.32 × 10⁻⁷ | 6.30 × 10⁻⁷ | 6.72 × 10⁻⁷ |
| Ionizing radiation (IR) (kBq U235eq) | 1.34 × 10⁻¹ | 1.34 × 10⁻¹ | 1.42 × 10⁻¹ |
| Photochemical ozone formation (POCP) (kg NMVOCeq) | 9.95 × 10⁻³ | 7.12 × 10⁻³ | 7.51 × 10⁻³ |
| Particulate matter (PM) (disease incidence) | 5.80 × 10⁻⁸ | 5.07 × 10⁻⁸ | 5.00 × 10⁻⁸ |
| Acidification (AP) (mol H+eq) | 1.08 × 10⁻² | 1.04 × 10⁻² | 1.08 × 10⁻² |
| Eutrophication, freshwater (EPFW) (kg PO4eq) | 9.12 × 10⁻⁵ | 8.88 × 10⁻⁵ | 9.23 × 10⁻⁵ |
| Eutrophication, marine (EPM) (kg Neq) | 3.95 × 10⁻³ | 2.83 × 10⁻³ | 2.95 × 10⁻³ |
| Eutrophication, terrestrial (EPT) (mol Neq) | 2.96 × 10⁻² | 2.48 × 10⁻² | 2.59 × 10⁻² |
| Resource use, minerals and metals (ADPm&m) (kg Sbeq) | 8.23 × 10⁻⁶ | 7.42 × 10⁻⁶ | 6.96 × 10⁻⁶ |
Table 3.
Impact assessment results for the climate change impact category per Wh of cathodic active material, and broken down into the different components.
Table 3.
Impact assessment results for the climate change impact category per Wh of cathodic active material, and broken down into the different components.
| Direct Impacts | Sodium Precursors | Manganese Precursors | Citric Acid | Water | EC—Drying | EC—Heat Treatment | Total | |
|---|---|---|---|---|---|---|---|---|
| SG_N | 0.00 | 1.08 × 10⁻³ | 5.68 × 10⁻³ | 8.11 × 10⁻² | 4.55 × 10⁻⁵ | 4.81 × 10⁻² | 4.44 | 4.58 |
| SG_A | 2.61 | 2.44 × 10⁻³ | 1.31 × 10⁻² | 3.90 × 10⁻² | 4.55 × 10⁻⁵ | 4.81 × 10⁻² | 4.44 | 7.15 |
| SS | 1.15 | 1.07 × 10⁻³ | 5.84 × 10⁻³ | - | 2.76 × 10⁻⁶ | 1.12 × 10⁻¹ | 4.73 | 6.00 |
SG_N: sol-gel synthesis, nitrate precursors; SG_A: sol-gel synthesis, acetate precursors; SS: solid-state synthesis; EC: electricity consumption.
Table 4.
Impact assessment results for 1 Wh of anode material capacity (Sn_NC_PVDF, Sn_NC_CMC, and Sn).
Table 4.
Impact assessment results for 1 Wh of anode material capacity (Sn_NC_PVDF, Sn_NC_CMC, and Sn).
| Impact Category | Sn_NC_PVDF | Sn_NC_CMC | Sn |
|---|---|---|---|
| Climate change (GWP) (kg CO2eq) | 3.7 × 101 | 4.01 × 101 | 1.36 × 101 |
| Ozone depletion (ODP) (kg CFC-11eq) | 5.09 × 10⁻⁶ | 5.56 × 10⁻⁶ | 1.86 × 10⁻⁶ |
| Ionizing radiation (IR) (kBq U235eq) | 1.08 | 1.18 | 4.02 × 10⁻¹ |
| Photochemical ozone formation (POCP) (kg NMVOCeq) | 7.62 × 10⁻² | 6.30 × 10⁻² | 2.19 × 10⁻² |
| Particulate matter (PM) (disease incidence) | 4.02 × 10⁻⁷ | 4.25 × 10⁻⁷ | 1.59 × 10⁻⁷ |
| Acidification (AP) (mol H+eq) | 8.41 × 10⁻² | 9.03 × 10⁻² | 3.15 × 10⁻² |
| Eutrophication, freshwater (EPFW) (kg PO4eq) | 7.24 × 10⁻⁴ | 7.76 × 10⁻⁴ | 2.70 × 10⁻⁴ |
| Eutrophication, marine (EPM) (kg Neq) | 2.28 × 10⁻² | 2.47 × 10⁻² | 8.47 × 10⁻³ |
| Eutrophication, terrestrial (EPT) (mol Neq) | 2.03 × 10⁻¹ | 2.18 × 10⁻¹ | 7.57 × 10⁻² |
| Resource use, minerals and metals (ADPm&m) (kg Sbeq) | 3.81 × 10⁻⁴ | 3.73 × 10⁻⁴ | 1.66 × 10⁻⁴ |
Disclaimer/Publisher’s Note: The statements, opinions and data contained in all publications are solely those of the individual author(s) and contributor(s) and not of MDPI and/or the editor(s). MDPI and/or the editor(s) disclaim responsibility for any injury to people or property resulting from any ideas, methods, instructions or products referred to in the content. |
© 2023 by the authors. Licensee MDPI, Basel, Switzerland. This article is an open access article distributed under the terms and conditions of the Creative Commons Attribution (CC BY) license (https://creativecommons.org/licenses/by/4.0/).
Share and Cite
MDPI and ACS Style
Carvalho, M.L.; Cusenza, M.A.; Mela, G.; Temporelli, A.; Quinzeni, I.; Girardi, P. LCA and C-LCC Indicator as Tools for Sodium-Ion Batteries’ Eco-Design. Energies 2023, 16, 6220. https://doi.org/10.3390/en16176220
AMA Style
Carvalho ML, Cusenza MA, Mela G, Temporelli A, Quinzeni I, Girardi P. LCA and C-LCC Indicator as Tools for Sodium-Ion Batteries’ Eco-Design. Energies. 2023; 16(17):6220. https://doi.org/10.3390/en16176220
Chicago/Turabian StyleCarvalho, Maria Leonor, Maria Anna Cusenza, Giulio Mela, Andrea Temporelli, Irene Quinzeni, and Pierpaolo Girardi. 2023. "LCA and C-LCC Indicator as Tools for Sodium-Ion Batteries’ Eco-Design" Energies 16, no. 17: 6220. https://doi.org/10.3390/en16176220
Note that from the first issue of 2016, this journal uses article numbers instead of page numbers. See further details here.