

Developing a Comprehensive Mathematical Model for Aluminium Production in a Soderberg Electrolyser


1
Dean of the Economics Department, Saint Petersburg Mining University, 199106 Saint Petersburg, Russia
2
System Analysis and Control, Saint Petersburg Mining University, 199106 Saint Petersburg, Russia
*
Author to whom correspondence should be addressed.
Energies 2023, 16(17), 6313; https://doi.org/10.3390/en16176313
Submission received: 1 August 2023
/
Revised: 17 August 2023
/
Accepted: 25 August 2023
/
Published: 30 August 2023
(This article belongs to the Special Issue Data Driven Approaches for Environmental Sustainability 2023)
Abstract
:The technological process of aluminium electrolysis is a complex scientific and technical task. This is due to a large number of internal, external and resultant factors. The aim of this work is to analyse these factors, assess them and their influence on the technological process of electrolysis and develop a comprehensive and mathematical model of aluminium production in the Soderberg electrolyser. The work analyses the technological process of primary aluminium production on the basis of the Bayer method and then on the basis of the Hall–Eru method. The existing methods and technologies for computer modelling of the technological process are analysed. The modern methods of analysis for thermal and electromagnetic fields in electrolysers are considered. On the basis of an in-depth analysis, a number of factors influencing the process of primary aluminium production are identified. Using the methods of system analysis to analyse the identified factors, a ranked list of factors according to the degree of influence is obtained. Using the Pareto diagram, we obtain a list of factors with maximum impact. A conceptual model of the technological process is derived. Based on the obtained conceptual model, the mathematical model of the technological process is derived. The conducted research may be useful to specialists in the field of metallurgy for the analysis of the technological processes of primary aluminium production.
1. Introduction
Today, aluminium production ranks second in the world after steel. Every year, the demand for the metal is increasing as it is in demand in various industrial and engineering applications [1]. Production growth is primarily driven by Asia and the Middle East [2]. Since the beginning of 2002, China has been the world’s leading smelter of aluminium, and today, its production exceeds half of the world’s total. India and Russia share the second place and produce approximately the same amount of metal.
The importance of aluminium and its alloys in the life of a modern person cannot be underestimated. First of all, it is used in the aviation and automotive industries, but it is also widely used in mechanical engineering, instrumentation, electrical and chemical industries, etc. Aluminium is not found in its pure form in nature. The development of science and the appearance of electricity made it possible for man to discover aluminium only in the 19th century. For approximately 150 years, mankind has been producing aluminium using the electrolytic method and has been improving the technology of its production for the entire period of time.
The industrial production process of primary aluminium is carried out in electrolysers by the electrolysis of metallurgical alumina in a molten cryolite. Over the years of production, the design of the anodes has changed; they can be either pre-fired carbon-graphite blocks or self-fired [3].
The version with self-firing anodes was proposed by engineer C. Soderberg in the early 1920s. Since then, all aluminium smelters around the world have been using this technology for almost a hundred years, as its use significantly reduces the cost of aluminium [4].
The process technology depends on many parameters, the importance of which is determined during the development of a comprehensive mathematical model of aluminium production. Understanding the physico-chemical processes in the apparatus and measuring most of the parameters will allow the process to be automated to a greater extent. The world task of mathematical modelling of aluminium production is the visualisation of all processes and, as the simplest way of information perception for human is visual perception, the mathematical model of Soderberg cell may partly simplify the work for human’s in operating the unit [5,6]. An inherent property of a mathematical model is its adaptability and ability to evolve. It is this parameter that is the qualitative result of modelling on a large scale. Complex mathematical modelling reflects the change in parameters not only depending on the location in space but also reflecting its change over time.
Thus, the basis of any technological process is a complex symbiosis between many input, internal and output factors, which are closely related to the location of production. Based on this, it is necessary to conduct a deep analysis of the existing factors, identifying factors that have the maximum impact on the technological process or cutting off factors that are insignificant or have minimal impact. The system of equations formed in this way will make it possible to describe the physical processes occurring in the electrolyser as accurately as possible. It is important to note that a feature of this approach is the application of system analysis methods to metallurgical production [7].
2. Methodological Analysis of the Primary Aluminium Production Process
As a result of the study of a considerable number of literature sources and, accordingly, ideas that were proposed to simplify the development of a mathematical model, it can be concluded that not many of the previously considered options present the apparatus under study in the form of such a mathematical model that would clearly display what happens in the electrolyser during the process of aluminium production. The existing models describe the change in various parameters of the electrolyser in time: a partial differential equation, for example, such as the supply voltage of the electrolysis bath or the amount of metal poured out of the electrolyser [8,9]. However, to understand this model, it is still necessary to understand the basis, e.g., what each variable means, how the constant coefficients are determined, etc. That is why it is necessary to pay special attention to the development of complex mathematical models of aluminium production, reflecting the calculation of basic parameters and their variation in the relationship. On this basis, virtual electrolysers can be created, as the visibility of such models is much higher. This will make designing and refurbishment of existing cells easier as all changes will be transparent and will not require any complicated calculations, which will save time for other complicated issues. In addition, a comprehensive mathematical model was constructed.
Taking into account the trends in the development of the electrolytic technology of primary aluminium production, it can be concluded that the importance of solving the problem of improving the operating parameters of the anode and cathode blocks will only increase [10]. The complex approach, including the optimisation of both initial raw materials and the introduction of additional stages in the technological process, was acknowledged to be the best method for its solution. After testing the methods proposed earlier under industrial conditions, it is possible to distinguish those variants that dealt with impregnation with pitch and creation of variable resistance along the block length, as their application improved the operational parameters of the object [11,12]. Due to errors or human error, the data collected directly during the production process inevitably lead to errors and noise. To ensure system stability, the control input data in real production are limited to a certain range to keep the electrolyser temperature and average voltage within the required range.
Some scientific articles mention energy efficiency issues but focus on other things, such as technology development or a computational model [13,14]. Energy intensity can be reduced by implementing both current and new energy efficiency measures. In the future, there may also be the prospect of achieving carbon-neutral and coal-independent electrolysis. However, this will require further research and the development of measures identified as new or emerging. Electrolysis shows more new methods compared to other processes, which can also be explained by the high energy intensity. In many cases, the measures presented can be combined, which implies that the best solution should be to combine measures to achieve the highest energy efficiency improvement. The production of secondary aluminium becomes increasingly important to meet the growing demand for aluminium. The production of secondary aluminium requires only 5% energy compared to primary aluminium [15]. This is important in terms of environmental and economic concerns and increased competitiveness.
2.1. Description of the Technological Process
Aluminium is a metal that does not exist in nature in a free state; therefore, it is produced by the electrolysis of cryolite–alumina melts in flat baths that are lined with carbonaceous materials. Cryolite is a complex salt and makes up 80–90% of the total mass of the electrolyte; it is a molten cryolite. Aluminium oxide—alumina, which occupies no more than 5–8% of the mass of the melt, is used as a raw material for the electrolysis process; it is produced by recycling aluminium-containing metals using hydrochemical methods. This amount of alumina dissolves well in the electrolyte. In addition, the electrolyte contains up to 6–10% various additives: as well as with the initial products, there are a number of oxides, allowing us to improve the characteristics of the electrolyte [16].
The cryolite–alumina melt is very aggressive. The chemical interaction of the electrolyte occurs with practically all materials, except some carbonaceous materials. The molecular ratio of sodium fluoride to aluminium fluoride, the so-called cryolite ratio (CR), an important characteristic of the electrolyte composition, is usually expressed as
As it changes, the current yield of aluminium decreases; therefore, it is important to maintain a stable electrolyte composition during electrolysis.
During electrolysis, the dissociation of molten cryolite produces positively charged sodium cations and negatively charged complex anions. At a temperature equal to the melting temperature of aluminium, the bonds between aluminium and fluorine in the complex ions can be broken, after which the partial decomposition of the complex ion into simpler ions occurs [17,18]. When alumina is introduced into the melt, the structure of the electrolyte becomes much more complex. The dissolution of alumina is accompanied by the formation of acceptor complexes in the electrolyte. Aluminium and oxygen ions are strong complexing agents, so their existence in the melt in a free form is unlikely.
In its simplified form, the electrolyte consists of sodium cations and complex ions. The most mobile of all sodium ions carry the current during the electrolysis process [19]. Compared to the other cations, the aluminium ions have the most positive release potential; therefore, their discharge to the cathode is faster, leading to the reduction of aluminium from the complex ion containing aluminium.
Aluminium, being heavier than the electrolyte (the specific weight of aluminium is 2.3 g/cm3; the electrolyte is 2.1 g/cm3), accumulates at the bottom of the electrolyser. The phenomenon occurring at the anode can be described as follows: the discharge of the oxygen ion from the complex anion occurs; meanwhile, during the adsorption of atomic oxygen by carbon, intermediate oxides are formed, and then, the negatively charged anions migrate to the anode [20]. Their decomposition and desorption of gaseous carbon dioxide from the anode surface is the slowest stage. It determines a significant overvoltage at the anode.
The electrolysis process normally takes place at the 950–965 °C temperature required to decompose the alumina, but maintaining this temperature requires a constant feedstock consumption of alumina, carbonaceous anode, fluoride salts and electrical power. Approximately 14,500 kWh of electricity is used to manufacture one tonne of raw aluminium. The sodium fluoride and aluminium fluoride forming part of the electrolyte affect the aluminium in the electrolyser tank to a certain extent, namely, the sodium under the aluminium layer attacks the carbonaceous materials at the bottom of the electrolysis tank, and the aluminium sub-fluoride is oxidised by the carbon dioxide in the anode space, resulting in a reduction in the metal current yield to 85–87%. In addition, the carbon monoxide content in the anode gases increases with the increasing temperature as a result of the reaction of aluminium with the electrolyte components. The aluminium current yield is also influenced by the electrolyte temperature [21,22]. This temperature is maintained by the side plating and skulls that act as liners and thermal regulators for the electrolysers. The temperature regime largely depends on the inter-pole distance (IPD), which usually varies between 4–6 cm. If it is reduced, the current consumption per tonne of aluminium immediately decreases, but the risk of the reverse oxidation of metal by anode gases increases. Increasing the distance leads to the overheating of the electrolyte and the disturbance of the electrolysis process. During electrolysis, the composition of the electrolyte is corrected with fluorosols. For this purpose, workers periodically take samples, which are then taken to the laboratory for crystallo-optical analysis. The alumina content in the electrolyte is important; if it is sufficient, it will wet the anode well. The bath voltage is 4–4.5 V, and the gaseous products are not trapped on the surface of the anode and escape from the electrolyte in the form of small bubbles. If the electrolyte is significantly depleted in the alumina, the anode surface passivates and its potential increases, which leads to a discharge of fluoride-containing ions. As a result, the wetting of the anode is reduced and the bubbles form a continuous gas film on its surface. The electrical resistance at the anode–electrolyte interface increases, and the voltage surges by a factor of 10 or more. At the bottom of the anode, there are strong spark discharges, so the anodic effect occurs in the bath [23]. To eliminate it, alumina is introduced into the bath, and the electrolyte is thoroughly mixed with gases from dry wood distillation. After this, the normal regime is restored.
Let us take a look at the Soderberg S8BM aluminium smelter (Figure 1).
The cathode device of the electrolyser is a rigid metal casing, lined on the inside with chamotte bricks. The inside of the tank shell is protected by carbon plates and blocks, which are thermal insulation. The cathode blocks, bonded in cast iron with steel rods, form the bottom sections, which are stacked on top of the coal bedding, resulting in a fully assembled aluminium bath substrate. Above the carbon bed is the molten aluminium layer, the surface of which is the cathode.
Above the molten aluminium layer is the electrolyte. The electrolysis process takes place at very high temperatures, so the cathode device must be resistant to such aggressive conditions, as well as have properties such as heat and current isolation, electrical conductivity, long-term operation and mobility.
The anode device of the electrolyser consists of 20 or more anodes, each assembled from pre-fired carbon blocks, which are cast iron cast steel nipple anode holders. The anode device conducts the current to the place where the electrolysis process takes place. The anode rails are connected to the anode rails by means of special screw clamps that also act as a supporting frame. The frame is insulated from the cathode housing. The frame can be moved vertically by means of an electric motor, a gearbox and a jack. During electrolysis, the frame is lowered downwards as the anodes are burned off.
The anode unit is fitted with pins that supply current and also stabilise the electromagnetic fields of the electrolyser, as they are made from steel with an admixture of aluminium, which has no magnetic properties. The pins themselves are attached to the anode frame, which allows them to maintain the horizontal position of the anode.
An aluminium-3 system is used to automatically adjust the position of the anodes. During the electrolysis process, the electrodes are burned off. When a 12–13 cm thick layer of carbon remains below the steel nipple, the anode is removed, and a new anode is installed in its place. The depth of the anode is set very precisely, as this has a major influence on the efficiency of the bath. The anodes are placed in a staggered arrangement. Near each new anode, there must be a burner in the first, as well as in the second anode. This is necessary for an even distribution of the current load [24].
The choice of shim is very important. With a unilateral current supply, the magnetic fields create misalignment of the metal in the bath, which leads to a violation of the inter-pole distance and uneven combustion of the anodes. This reduces the current yield of the aluminium. On the contrary, a bilateral current supply to the anode weakens the magnitude of the magnetic fields; the metal takes horizontal position; the MPR does not change; and the electrolysis process proceeds normally. The electrolyser arrangement is as follows: first, the electric current flows through the anode risers to the anode busbar, and through the anode-holders, it enters the anode blocks. From there, the current flows through the electrolyte, heats it up with joule heat and carries out electrolysis. The current then flows through the cathode rail to the next electrolyser.
The cathode metalwork is responsible for the lifetime of the electrolyser, and if it breaks, the electrolyser is subject to overhaul; therefore, the metalwork must compensate for the conditions in the cathode device.
In order to extend the life of the electrolyser, the interaction between the individual parts of the electrolyser must also be taken into account. The occurrence of high stresses leads to the formation of cracks in the substrate, so it is important to leave a small space for its movement with the compensator. The compensator—the peripheral parts of the lining and the joints—muffles the forces from the cathodic effect.
During the electrolysis process, heat is released into the environment, thus, consuming electrical energy. The cathode liner, with its structural mechanical strength, helps to control the temperature of the melt and to resist the effects of melt components. The fireclay used as a refractory material prevents the electrolyte from entering the insulation space.
The bottom blocks, which are made from carbon materials and serve as cathodes, are mounted in the electrolyser shaft. They conduct current and are resistant to molten aluminium and electrolyte.
The end sides of the electrolyser are permanently sealed. The sidewalls are usually made of the same materials as the pod units, so their properties are very similar. The efficiency of such a shelter is 95%.
In order to protect personnel from harmful gases, the electrolyser is equipped with a hinged, flush-type shelter. When the electrolyser is being processed the shelter flaps are electrically lifted to give workers access to the bath. The maintenance of electrolysers involves a number of basic operations. They are carried out in a strictly regulated manner using special machines and mechanisms.
2.2. Structural Identification of the Aluminium Production Process
The object of the study is the Soderberg electrolyser. The electrolyser is a complex, multi-connected system; therefore, all the processes inside and outside the electrolyser cannot be considered in isolation.
The conditions of the electrolyser cannot be neglected, as they have a significant influence on the final product.
The main hall parameters that affect the electrolyser are
- -
- Humidity in the workshop;
- -
- Dust in the workshop;
- -
- Temperature of the air in the workshop;
- -
- Outdoor temperature that has an effect on the temperature in the shop;
- -
- Noise levels in the workshop;
- -
- The level of electromagnetic field outside the electrolyser at individual points;
- -
- Number and location of electrolysers in the workshop.
Let us consider each of them in more detail:
In aluminium smelting shops, sulphur dioxide and fine ash particles are emitted. The by-products from aluminium production have a negative impact on the human body and the environment. The main components with which humans interact are alumina, cryolite, fluorine salts, by-products and microclimates [25]. Due to the exposure to alumina dust, humans develop chronic respiratory tract lesions. The exposure to high temperatures and humidity is exacerbated by the dust content in the air. The air in the electrolysis workshops is often saturated with sulphuric acid and zinc sulphate fog.
The thermal state of the electrolyser depends on the heat loss from the electrolyser surfaces to the environment, the total heat accumulated by the anode and the bottom separately, and the heat input from fuel combustion [26]. This condition is described by means of an energy balance. Thermal losses at the anode and cathode increase rapidly at ambient temperatures of −40 °C, as proven by numerous experiments in the static analysis of the thermal field of the aluminium electrolyser. At an ambient temperature of +20 °C, the heat loss decreases considerably. Due to this, the additional fuel consumption at each electrolyser increases during the winter period [27]. Maintaining the thermal and energy balance contributes to the stable operation and long-term operation of the electrolyser.
The temperature figures mainly have little influence on the quality of the finished product, but they cannot be neglected, as the temperature inside the electrolysis bath is considerably higher than the temperature outside and it is regulated by the melt and cryolite. Since the aluminium production process is not yet fully automated, the control and regulation of the process is carried out by the operating staff by measuring the parameters of the electrolyser.
When using the Soderberg self-blasting anodes, the noise, vibration and thermal radiation levels are higher than hygienic standards. Such working conditions correspond to hazard classes 3.3–3.4. The prolonged exposure to these factors can lead to unintentional errors and risks.
In aluminium electrolysis, the current flows vertically up and down through the anodes and risers and horizontally along and across the bath, so the magnetic field has a complex pattern at every point in the bath. Aluminium electrolysis requires high amperage; hence, the current feeder elements are designed for high amperage currents and strong magnetic fields are generated around them. The direction of the electromagnetic forces depends on the direction of the currents in their interaction, which affects the surface of the molten metal and its directional movement [28]. This parameter significantly affects the final product, since at high values of the electromagnetic field and its sources, the rotating moment inside the electrolysis bath causes agitation of the metal. The design data of the self-firing anode electrolyser refer to the input parameters and are constants in the technological process.
Depending on the size of the plant, the average electrolysis facility contains up to 200 electrolysers, arranged in two rows. The length and width of a single enclosure is up to 700 m and 27 m, respectively.
In the middle section, there is a transport corridor, through which all transport and process communications, including transportation of metal, equipment, raw material and other materials, can be carried out. At the end of each shop, there is an area up to 35 m long called the repair technological zones where the main and auxiliary technological equipment is repaired. Below, at the “0” mark, there are parts of the main equipment that were dismantled, taken out for repair or were meant to be transported. At the +13.500 m mark there are repair areas for the process equipment serving the electrolysers—process hoisting cranes and installation cranes.
The specific layout of the electrolysis shops also affects the quality of the technological process and the amount of aluminium produced, as the number and location of the adjacent rows of electrolysers in the series affects the magnitude and pronounced influence of the external electromagnetic field on the magnetic–dynamic stability of the melt in the operating adjacent electrolysers in the series.
The electrolysis process inside the electrolyser itself is influenced by many input parameters, the values of which can be measured, but it is not always possible to influence them [29]. During the process, the operating staff performs technological routine operations, determining the regulations of the overall technological process in the enclosure and the series as a whole. All the technological manipulations performed by the machines and the operating staff are the control actions determining the obligatory routine operations in the process cycles within the overall electrolysis process.
All of the measured quantities and parameters derived from the mathematical model: current output, energy consumption, quantity of poured metal, operating voltage, alumina concentration, etc.—are the output (controllable) values. Furthermore, during the maintenance and operation of the electrolyser, random influences occur, which include raw material loading, metal pouring, changing of anode pins, correction of the electrolysis process, short circuits and variations: current and melt temperature, ambient air temperature and the chemical composition of raw materials.
The main indicators responsible for TP efficiency are current and energy yield. These indicators are determined by the following factors: electric power and non-electric power parameters [30].
The non-electricity parameters of the TP are: alumina, anode mass, level and composition of cryolite, properties and temperature of the electrolyte and layer height of the process aluminium.
In the electrolytic production of aluminium, alumina is used as the main raw material. Its quality requirements are quite high, as it must be soluble in molten cryolite and contain as few as possible electropositive elements that degrade the quality of the final product. Alumina is divided into several grades, but the purest composition, corresponding to grade 1, is used in the aluminium industry. It is also worth noting that the alumina particles should not be too fine or too coarse, as fine alumina is atomised during loading, while coarse alumina is very insoluble.
Cryolite Na3AlF6 is very rare in nature and, therefore, artificial industrial cryolite is used at aluminium smelters. It consists of sodium fluoride and excess aluminium fluoride. The cryolite ratio of this salt is the main characteristic of the composition of the electrolyte. In the molten state at a K.O. value of 2.6–2.8, the smallest aluminium losses in the electrolyte and the highest current yield values are observed (Figure 2). The addition of calcium fluoride and magnesium leads to a decrease in the electrolyte melting temperature that, in turn, reduces the voltage; therefore, their content in the electrolyte can be as low as 10%. The content of fluoride salts in the molten electrolyte must not exceed the permissible values as this can lead to insolubility of the alumina [31].
Fluoride salts also increase the density of the electrolyte and molten aluminium, which allows aluminium to collect at the bottom of the bath under the electrolyte layer during the electrolysis process, as the density of aluminium in the molten state is higher. The alumina in the electrolyte, as well as calcium fluoride and magnesium, increase the viscosity of the cryolite melts but also reduce their electrical conductivity. The bath temperature is maintained thanks to the joule heat generated by the voltage drop in the electrolyte layer. The composition of the electrolyte is adjusted by the content of the fluoride salts.
An insufficient concentration of alumina in the electrolyte and a critical current density lead to anodic effects (spark discharges) at the boundary between the electrolyte and the surface of the immersed anode. However, an excessive alumina content in the electrolyte (7–8%) leads to the formation of precipitation. If the anodic effect occurs frequently, energy and material consumption increase, and therefore, the frequency must be controlled [32].
The current density is influenced by the temperature and the natural character of the salts, as well as the material from which the anode is made. The melting temperature of alumina is 2050 °C, but the use of additives to the electrolyte has reduced the temperature to 960 °C. Increasing the temperature of the electrolyte reduces the current yield but dissolves the metal in the molten electrolyte (Figure 3). Maintaining the correct temperature is necessary so that the metal and electrolyte densities are not disturbed and a stable electrolysis pattern is observed.
It is important to note that temperature and mechanical disturbances lead to the destruction of the substrate and premature failure of the electrolyser. The temperature fluctuations are caused by poor series current and voltage control, and the mechanical fluctuations are caused by incorrect electrolyser design.
The composition of the anode mass in Soderberg electrolysers is determined by the requirements for high technical and economic performance, as the voltage at which alumina decomposes depends on the anode material.
The current yield is one of the important indicators that determines the cost of the final product. The height of the technical aluminium layer is one of the factors influencing this parameter, as the height of the metal must increase with the increasing current density. As the metal level decreases, the anode sinks deeper and is subjected to a greater thermal load, which contributes to the faster consumption of the anode mass. With its high thermal conductivity, aluminium dissipates heat through the sides of the cathode shroud, thereby restoring the thermal field under the anode of the electrolyser [33].
The energy input parameters of the TP are the pole distance (distance between the electrodes), the electrolyser bath voltages, the electromagnetic field, the rotating force and the current strength. The magnetic field can affect the measurement results, and therefore, errors can occur. The measurement of these parameters is carried out using special instruments.
The anode is periodically lowered to provide the necessary inter-pole distance, as during the course of a day, a part of the anode is burned off by approximately 2 cm, and oxidation occurs due to the oxygen released on the surface of the anode. The MPR and the composition of the electrolyte are used to regulate the drop in operating voltage of the electrolyser, the quality of the heat released, the rate of electrochemical processes, etc. Increasing the MPR leads to an increase in current output and power consumption, which results in a voltage drop (Figure 4).
In the workshop, all electrolysers are arranged in series and the current on one electrolyser is regulated using make-up units. During the TP, there are anodic effects, voltage fluctuations, treatment of the electrolysers, etc.—all of which prevent the current strength from remaining constant. The current output is directly dependent on the current density (Figure 5). At current densities above the allowable values, there is an excess of sodium content in the aluminium, and at lower current densities, there can be complete or partial discharge of the cations due to a reduction in voltage and depletion of electrons at the cathode [34].
3. Expert Analysis and Processing of Results by Means of Correlation Analysis
The relationship between the parameters of the object requires a new approach in modelling, since this process is complex and multi-connected, and many previous developments broke the system into sub-processes, for which mathematical models were developed and then linked; therefore, the synthesised mathematical model should generally reflect all the relationships occurring in the electrolyser. In order to obtain a mathematical model of the system and its further implementation based on technical means, a conceptual model of the process of aluminium production in the Soderberg electrolyser is developed.
Based on all the above parameters, a resulting table (Table 1) showing all the parameters affecting the TP of aluminium electrolysis can be made, which will subsequently be sent for expert evaluation.
Correlation analysis is used to build a conceptual model and to determine the relationship between the variables and their significance. The assessments are individual and based on the opinion of individual experts.
The principle for selecting the expert panel is as follows: The experts involved in the assessment of the technological parameters of the electrolyser must have practical and research experience in the aluminium industry. When selecting experts, it is important to consider their professional competence, personal interest in the results of the expert work and conformity [35].
The experts are expected to respond with a completed worksheet and/or comments on the work completed. When assessing the degree of importance of the dimensions, the assessor assigns them a ranking number on a scale from 1 to 10, where the scores have the following meaning:
- ❖
- Minor importance 1–3;
- ❖
- Minor importance 4–5;
- ❖
- Significant 6–7;
- ❖
- Important 8–10.
A summary matrix (Table 2) is, thus, generated from the data obtained.
A total of 67 parameters are declared, i.e., their ideal sum is 2.278 ( ).
The ranks are reformulated as follows: the ranks are ranked from bottom to top according to the scores obtained; then, an investigation is carried out to find the same scores for different parameters. Next, the ordinal values of the parameters are added up (because they are arranged in ascending order rather than simply numbered) and divided by the number of parameters with the same value in that category (Table 3).
where, is sequential numbers in ascending order; is the number of parameters with the same value in this category.
This value is considered a rank and is assigned to all parameters in the same scoring area. Table 3 shows the reformulation for one expert; similar calculations are performed for the remaining experts.
Similarly, the scores are converted into ranks for all experts, and then, a summary table of the ranks is generated (Table 4).
Next, for each parameter, the sum of the ranks is calculated, and the coefficient d is calculated (Table 5).
where d is the deviation of the sum of the ranks from the arithmetic mean of the ranks;
n is the number of parameters to be investigated, n = 67.
The importance of the factors is ranked according to the total rank of each parameter. The result is shown in (Table 6).
Coefficient of concordance:
where - is summing the squares of the deviation of the sum of ranks from the arithmetic mean of the ranks;
= 5 number of experts.
where —number of bundles (types of repeating elements) in the i-th expert’s assessments, —number of elements in the l-th bundle for the i-th expert (number of repeated elements).
.
If , there is a consistency in the experts’ opinions.
Then, we assess the significance of the concordance coefficient; for this purpose, we calculate Pearson’s consistency criterion:
.
The specified significance level for the number of samples up to 100 units is 0.05.
The calculated value is for table (85.965), so the obtained coefficient of concordance W = 0.61 is not random; therefore, the calculated results make sense and can be used in further studies.
According to Table 6 “Location of factors by importance”, the weight (λ) of each parameter is calculated based on the sum of ranks (R) of all experts. For this purpose, we take the sum of rank sums as one and, according to the formula:
Furthermore, the weight for the first parameter was calculated, and similar calculations were carried out for the rest (Table 7):
According to Table 7 “Calculation of parameter weights” presented above, we decided to take into consideration and consider significant only those parameters that, based on the Pareto diagram (Figure 6), have a weight λ ≥ 0.0171. The selected parameters are presented in Table 8.
On the Pareto diagram, on the axis of ordinates, the weights of the parameters, both in numerical and accumulated percentage terms, and on the axis of abscissas—the parameters of the technological process, are arranged in descending order. The first columns of the diagram show the most important process parameters, and all other parameters beyond the separating cumulative curve remain unchanged because their ability to affect the outcome is small. By taking into account the important factors, it is possible to focus on eliminating the most significant problems [36].
Construction of Conceptual and Mathematical Model
Any system design or programme writing starts with the stage of building a conceptual model of the object. A conceptual model is a set of concepts describing the area under study. An important factor in its construction is the analysis of the scientific literature, which gives a fairly clear idea of the structure of the object and the elements that are in the relationship.
The use of a graphical representation of the conceptual model is more preferable than in the form of text, because the information expressed by a diagram or scheme clearly demonstrates the direction of the main relationships [37].
All the concepts included in the conceptual model are concretised and interpreted so that the conceptual model constructed can serve as a basis for the further development of data collection techniques, etc. Some terms are used in mathematical concepts, making it possible to describe them using equations and formulae.
The construction of the conceptual model is based on the data obtained at the stages of expert assessment and the formation of significant parameters. Table 8 is the result, and it is from its conclusions that the conceptual model will be built. The “central” object of the model is the process under consideration: aluminium electrolysis taking place in the Soderberg electrolyser.
The most important parameters are the parameters with the highest weight, shown in Table 8, and belonging to the group of input and output parameters. The constructed conceptual model showing the significant technological parameters is presented in Figure 7.
Based on the above study on identifying the most significant parameters of the technological process, it is possible to establish functional relationships between them.
It should be noted that most of the parameters have a non-linear relationship, so improvement of one of them may lead to the deterioration of another. There is no formula that includes all TP variables simultaneously, but a system of equations describing individual parameters can reflect the relationship between the parameters. Many parameters can be described using the existing laws and mathematical formulae, but there is a category of parameters that require qualitative descriptions.
The state of technology largely depends on the quality of the metal produced and compliance with technological regulations. Primary aluminium containing 99.7–99.8% of the main component has the maximum quotation on the London Metal Exchange. In order to maintain the grade level of metal not lower than A7 at the production facility after the overhaul of the electrolysers, its low grade primary metal (A0–A6) is diluted in the foundry department with A8 grade to A7 grade during the first two weeks.
The bauxite raw material base in Russia is mainly low- and medium-grade, which reduces the quality of the extracted alumina; therefore, nepheline ores also have to be used as aluminium raw material. In order to meet the aluminium smelters’ demand for alumina, raw materials are imported from abroad.
The calculation of raw material import costs is based on production and economic indicators. In general terms, in order to calculate the cost of raw materials purchased from abroad, it is necessary to summarise a number of indicators, which vary depending on the circumstances.
A formula that can be used to calculate the cost of raw materials is
where Hp—material consumption rate for products, kg.;
Цм—material price, RUB/tonne;
Ктз—coefficient that takes into account transport and procurement costs.
The material balance is the ratio between the materials produced in the electrolysis process and those loaded into the electrolyser. According to the data obtained from the material balance, the change in the composition of the electrolyte and the required expenditure of raw materials, materials and electricity are determined [10].
The concentration of alumina in the electrolyte is expressed from the material balance by the dissolved alumina and is strictly regulated by stabilisation within the permissible range of variation, because insufficient concentration is the cause of the anodic effect, and excessive concentration reduces the solubility of alumina in the electrolyte melt:
where is the mass of the electrolyte melt, kg;
is the concentration of alumina in the electrolyte, wt. fraction;
is the flow rate of loaded alumina, kg/s;
is the stoichiometric coefficient of the alumina decomposition reaction, which allows us to determine the quantitative and qualitative relations between the used components of raw materials.
The amount of aluminium in the electrolyser is the aluminium formed during the electrolysis process and is represented as the following equation:
The capacity of the electrolyser (kg/h) is the amount of aluminium released per unit time:
where is the current on the electrolyser, A;
is the electrochemical equivalent of aluminium, kg/А·с;
is the current yield, mass fraction.
The material input to the electrolysis bath is calculated from the capacity of the electrolyser:
where is the specific consumption of alumina, anode mass and fluoride salts, respectively, kg/kgAl;
is the consumption of alumina, anode mass and fluoride salts, respectively, kg.
The aluminium fluoride content in the cryolite is necessary to maintain the chemical composition of the electrolyte; the quality of aluminium fluoride has the following requirements:
- -
- Contains at least 30% aluminium and 61% fluorine;
- -
- Contains impurities: Na ≤ 0.5%, SiO2 + Fe2O3 ≤ 0.38%, SO4 ≤ 0.5%, P2O5 ≤ 0.04%.
In order to control the cryolite ratio, the concentration of the aluminium fluoride content in the electrolyte must be maintained. The aluminium fluoride bath is fed with aluminium fluoride by means of an automatic control system that monitors the electrolyte level. The control is based on daily discrete measurements and qualitative analyses updated at least three times a week. The automatic control systems of cryolite ratio “TROLL” and “Stella” calculate the optimal additives by the sum of three independent variable components dynamically reacting to the perturbation each on its own channel for deviation from the nominal value [14]:
where is the total (calculated) addition of fluorosols for the correction of KO and the technological state of the electrolyser, kg;
is the current KO additive (laboratory data), kg;
is the temperature additive (measured value), kg;
is the additive taking into account the normative consumption of fluorosols—the amount of fluorides required for obtaining a certain mass of metal and maintaining KO in the absence of other factors.
The additive for the current KO is equal to:
where is the mass of electrolyte in the electrolyser, kg;
is the basic KO (set KO for the given bath);
is the current DO (data from the laboratory);
is the constant characterising the raw material used.
Correction by KO occurs only when both are not equal to each other.
The temperature additive allows correction and is calculated by the following formula:
where is the temperature of the electrolyser, K;
is the temperature coefficient;
is the electrolysis temperature, K.
The system also contains a formula for calculating the variable component Mnorm:
where is the electrolyte level in the electrolyser;
is the basic electrolyte level in the electrolyser;
is the standard consumption of fluorosols.
The height of the molten aluminium layer at the bottom of the electrolyser is measured by various methods, such as using a steel rod by hand, but the efficiency of such methods is low, so currently, a method based on the interface trace on steel rods is used. When a steel rod is vertically immersed in an electrolyte solution and molten aluminium, a trace called the interface trace is formed. This method measures the distance between the reference point on the steel rod and the trace formed. The height of the molten aluminium layer is calculated according to the expression [38]:
where is the distance from the fixation point to the electrolyser bed, cm, which is determined once during rod calibration and is further corrected as the electrolyser bed wears out at least twice a year; is the distance from the fixation point to the reference point, cm, determined once during rod calibration;
is the distance from the reference point to the trace of the interfacial boundary between the electrolyte and the molten aluminium, cm, determined at each measurement of the height of the molten aluminium layer.
The amount of heat in the electrolyser is described by the energy balance equation:
where is the amount of heat in the electrolyser, including the heat of the electrolyte melting, J;
is the electric power consumption (electric power), W;
, is the heat of the input and output material flows (alumina, anode, carbon, aluminium, exhaust gases), W;
is the flow of the heat losses into the environment, W;
is the energy effect of all chemical reactions in the electrolyser (at reaction temperature), W.
Electricity consumption:
where is the voltage on the electrolyser, V;
is the electrolyte resistance, Ohm;
is the reversible part of the energy effect of the chemical reaction (change in internal energy of the reacting substances), W.
Heat loss flux to the environment:
where is the heat loss flux through the electrolyte melting boundary, W;
is the heat loss fluxes through the boundary of the electrolyser bottom and anodes, W.
Heat loss flux through the electrolyte melting boundary:
where is the heat transfer coefficient in the melting zone, W/(m2·°C);
is the area of contact between the electrolyte and anodes, m2;
is the temperature in the melting zone, °C;
is the ambient temperature, °C.
Heat loss flux through the electrolyte melting boundary under the electrolyser and anodes:
where is the heat transfer coefficient from the electrolyte through the electrolyser bottom and anodes to the atmosphere, W/(m2·°C);
is the total area of the electrolyser base and anodes, m2.
is the electrolyte temperature, °C.
Energy effect of all chemical reactions occurring in the electrolyser:
is the irreversible part of the energy effect of the chemical reaction (Peltier heat), W;
In the process of electrolysis, the mass of the liquid electrolyte is not constant, as there is an inflow and outflow of substances, so the interfacial heat balance equation determines the change in mass over time:
where is the specific heat of melting for the electrolyte, J/kg;
is the mass of the alumina melt, kg;
is the heat transfer coefficient from the electrolyte to the alumina melting zone. W/(m2·°C).
Substituting Equations (8)–(13) into (7), we obtain the energy balance equation for determining the temperature of the electrolyte in the electrolyser:
where is the heat capacity of the electrolyte, W/(kg·°C), calculated from the heat capacity of the substances that make up the electrolyte.
The magnetic field in the electrolyser appears near the current carrying elements of the electrolyser. The electromagnetic force acting on the melt results from the interaction of the magnetic field with the current flowing through the electrolyser.
where , , are the components of current density, А/cm2;
, , are the components of magnetic field strength, A/m.
The operating voltage on the electrolyser is taken from the anode and cathode ties and characterises the stationary state of the operating mode:
where R is the resistance of the electrolyser, Ohm;
is the reverse ЭДС on the electrolyser, V.
To control and calculate the pole-to-pole distance, the following equation is used:
where is the anode burn rate, m/s;
is the rate of change in the aluminium level, m/s.
Since the resistance of the electrolyte is proportional to the resistance of the interpole distance, the value of the interpole distance can be expressed using the indirect method:
where is the cross-sectional area of the electrolyte, m2;
is the resistance of the electrolyte in the interpole distance, Ohm;
is the specific resistance of the electrolyte, Оhm·m.
The electric balance is based on the calculation of the current values and voltage drop in the structural elements of the electrolyser. The voltage drop in various nodes and areas depends on the resistance of these elements and the variation of the series current:
where is the polarisation voltage, V.
The empirical equation of M.A. Korobov reflects the dependence of the voltage drop on the design parameters of the anode and conducting pins, as well as the specific resistance of the anode and current density [6]. For electrolysers with top current supply, the voltage drop in the self-firing anodes is calculated from the following expression:
where is the number of current-carrying pins;
is the average distance from all current-carrying pins to the anode bottom, m;
is the average specific resistance of anode Ohm·m;
is the anode current density, A/m2;
is the anode area, m2.
The voltage drop in the cathode device is also determined by M.A. Korobov’s equation:
where is the length of the current path along the block, m;
is the specific electrical resistance of the cathode block, Ohm·m;
is half of the width of the bath shaft, m.
is the cross-sectional area of the cathode rod, taking into account the cast iron casting, m2.
G.V. Forsblom and V.P. Mashovets proposed a formula for calculating the voltage drop in the electrolyte:
where is the anode perimeter, m.
The voltage drop in the electrolyte accounts for a large share of the bath voltage; therefore, it is important to control this indicator. Reducing the MPR to permissible values helps to reduce the amount of heat generated in the electrolyte during the flow of the electric current, as well as to stabilise the electric balance.
The voltage drop in the harness is determined by the sum of the voltage drop at the anode and cathode, as well as in the electrolyser contacts:
where is the voltage drop on the anode harness, V;
is the voltage drop on the cathode harness.
The anodic current density, current density in the pins and in the electrolyte are equal to:
where —total area of pins, mm2;
—area of the metal mirror, cm2.
The critical current density can be estimated by the Pionte equation:
The limiting current density is equal to
The greatest influence on the current yield is the shape of the metal–electrolyte interface and the circulation of the electrolyte and aluminium; therefore, the current yield is determined by Korobov’s empirical formula, which reflects the relationship with various characteristics of the electrolysis bath:
The current redistribution on the electrolyser elements occurs continuously as the anode pins are repositioned, anode blocks are replaced, the electrolyser is treated, and other technological operations are performed. To ensure a uniform energy input into electrolysis and its corresponding consumption, it is necessary to maintain the energy balance of the electrolyser, depending on the state of the production technology, which determines the optimal technical and economic indicators of the process [7]. It is accepted to estimate the change in the current distribution over the electrolyser nodes by the value of the current distribution non-uniformity coefficient :
where is the average current value;
is the current value of current on the i-th current conduit;
is the number of branches.
It is worth noting that the measurement of the current value by individual elements of the electrolyser is hindered by powerful magnetic fields and high current values, since the current reaches several thousand Amer.
The electricity costs are determined by the specific energy consumption W (kW·h/kg) for aluminium production, which is equal to the ratio of energy input to the amount of metal produced:
where is the total electrical work, J;
is the average voltage, V.
Reducing the cost of electricity is a consequence of reducing the power consumption, which is one of the main tasks for energy systems. Electricity consumption is not simultaneous, as some electricity consumers work only at certain time intervals; most often the peak of consumption is observed during morning and evening working hours, as most of the maintenance machinery, lighting equipment, etc., do not use electricity during night hours. The uniform distribution of electricity is a production problem. In order to solve this problem, single-rate and two-rate tariffs have been introduced in Russia [39,40,41].
The single-rate tariff is designed for small capacity, which does not exceed 100 kW. In this tariff, payment is based on the results of electricity meter readings.
The two-rate tariff implies two rates—basic and additional. This payment system was in effect for a long time in the USSR [42,43,44,45]., but it was not profitable for aluminium producers, because the basic rate was paid for the maximum load controlled by special meters during the month during peak hours and amounted to 1 MW, and the additional rate was paid for the electricity consumption recorded by the meters. Generating companies do not take into account the fact that the power consumption of the aluminium electrolyser series is stable. Rates for declared capacity are determined by the company on a monthly basis (RUB/MW∙h), and for consumed electricity—on an hourly basis (RUB/MW∙h) [46].
where is the number of days in the month (Nday = 28, 29, 30, 31);
is the price for electricity fixed by meters, rub./MW∙h;
is the price for the declared capacity, rub./MW∙h.
It should be noted that the cost of electricity produced by hydroelectric power plants is lower than that of thermal power plants. The transport of purchased electricity is also paid according to tariffs, depending on the network—federal or interregional, through which it is delivered to the consumer. Thus, in case of interregional transport, the share of electricity transport can be up to 70% and federal transport up to 20%.
The mathematical model is a system of equations that allows us to estimate and determine the parameters of the technological process that influence the main performance indicators of the electrolyser, as well as to establish internal and external relations for the object.
The title of the formulae included in the mathematical model (26) are given in Table 9. The results obtained in the chapter can be used as a basis for the development of algorithms for optimal electrolyser control.
4. Discussion
The level of the technological production of aluminium is determined by the area of improvement in the functioning of the technological process of electrolysis. Most of the techniques for optimisation of the technological process are of a point local nature. This study attempts to describe the technological process as a dynamic non-stationary process with a large number of perturbing influences. The authors, relying on the works in the field of spatially distributed systems and the theory of system analysis, analysed the technological process of aluminium production. The input, output and resultant parameters of the electrolyser with self-firing Soderberg anodes were covered in sufficient detail. We obtained a complex and mathematical model of the electrolysis process.
The scientific interest of this work consists in the mathematical model, which differs from the existing ones in spatial distribution. It allows us to determine the technical parameters of the electrolyser at any stage of the technological process.
The industrial interest of this work consists of the possibility of the technical control and forecasting of the technological process development. The modern electrolyser is a very dynamic object. Determination of the cryolite ratio in laboratory conditions takes up to 8 h, and the run-up process is 10–12 h. Thus, the result of the determination loses its relevance almost at the measurement stage. Indirectly, the cryolite ratio can be judged by the state of the temperature field, but this type of measurement has a large error. The presented mathematical model reduces the error of indirect calculation by 7–10%.
However, this work is not without its shortcomings. The following number of aspects can be attributed to them. The development of a conceptual model of technological process should take into account a number of economic factors [47,48]; this is not considered in this paper because of the emphasis on the technical part of the issue. Moreover, this paper does not consider the environmental side of the issue [49,50]. It should be noted that the use of pure aluminium is effective in various industries: mechanical engineering [51,52], in the processes of natural resources extraction [53,54] and in the process of automation and control systems [55,56]. A special place in the structure of these studies is occupied by the works of Pershin I.M., who clearly showed the possibility of improving the control systems of mining and mining systems [57,58]. Furthermore, this work does not consider alternative technologies, where the results obtained can be applied. For example, technologies for obtaining environmentally friendly fuels [59,60], which would significantly increase the economic efficiency of the process.
The undeniable positive side of the work is the high technical accuracy of the developed model. This is confirmed by many experiments carried out on the basis of this model.
5. Conclusions
The demand for aluminium in today’s market is leading to a significant increase in production. Experts estimate that the annual growth in aluminium production will increase by an average of 3–5 percent annually [61]. This will lead to the need to modernise the existing production facilities. This task cannot be accomplished without a comprehensive understanding of the technological process. In this study, an in-depth analysis of the technological process was carried out, the factors affecting the state of the technological process were identified, and a model was developed to describe each element of the technological process in relation to the others.
The main results of the work should include the following:
- A formalised description of the input and output parameters, as well as control and disturbance influences, was given, on the basis of which the resulting table was generated and sent for expert evaluation. Based on the obtained data and the results of the correlation analysis, a conceptual model of the process of aluminium production in an electrolyser was built.
- A mathematical model was built that makes it possible to determine the degree of influence of the changing individual parameters of the process on its final results and on the quality of the products obtained.
The mathematical model obtained in this study can be used by scientific and industrial organisations for a mathematical description of the process of obtaining primary aluminium. However, the results obtained are not limited to this. The demonstrated technique for obtaining a mathematical model by the methods of system analysis makes it possible to apply the results of this study in related fields [62,63,64,65,66,67,68,69,70,71,72,73,74,75,76,77,78,79,80,81]. In these works, this technique was adapted to economic and physical processes of various natures. Authors would especially like to note the importance of the obtained results for metallurgical production. The models obtained earlier gave an error in the calculations from 10–20 percent. The error obtained in this study gives an error of no more than 7%, which is undoubtedly a contribution to the scientific and technological development of the industry.
Author Contributions
Conceptualisation, Y.V.I. Ilyushin; methodology, Y.V.I. Ilyushin; software, Y.V.I. Ilyushin; validation, Y.V.I. Ilyushin; formal analysis, E.I.K. Kapostey; investigation, Y.V.I. Ilyushin; resources, Y.V.I. Ilyushin; data curation, Y.V.I. Ilyushin; writing—original draft preparation, E.I.K. Kapostey; writing—review and editing, Y.V.I. Ilyushin; supervision, Y.V.I. Ilyushin; project administration, Y.V.I. Ilyushin. All authors have read and agreed to the published version of the manuscript.
Funding
This research received no external funding.
Data Availability Statement
Conflicts of Interest
The authors declare no conflict of interest.
References
- Marinina, O.; Kirsanova, N.; Nevskaya, M. Circular Economy Models in Industry: Developing a Conceptual Framework. Energies 2022, 15, 9376. [Google Scholar] [CrossRef]
- Ponomarenko, T.; Reshneva, E.; Mosquera Urbano, A.P. Assessment of Energy Sustainability Issues in the Andean Community: Additional Indicators and Their Interpretation. Energies 2022, 15, 1077. [Google Scholar] [CrossRef]
- Cai, X.; Zang, K. Design and implementation of electrolyzer simulation system. Lect. Notes Electr. Eng. 2013, 210, 247–254. [Google Scholar]
- Popov, P.A.; Vabishchevich, P.N. Numerical Simulation of the Aluminum Production. In AIP Conference Proceedings; American Institute of Physics Inc.: College Park, MD, USA, 2014; Volume 1629, pp. 56–68. [Google Scholar]
- Piskazhova, T.V.; Savenkova, N.P.; Anpilov, S.V.; Kalmykov, A.V.; Zaitsev, F.S.; Anikeev, F.A. Three-Dimensional Mathematical Modeling of Dynamics Interfaces between Aluminum, Electrolytes and Reverse Zone of Oxidized Metal Depending on the Potencial Distribution. J. Sib. Fed. Univ. Eng. Technol. 2017, 10, 59–73. [Google Scholar] [CrossRef]
- Savenkova, N.P.; Mokin, A.Y.; Udovichenko, N.S. The MHD stability investigation of an aluminum electrolyzer under various process conditions. J. Phys. Conf. Ser. 2020, 1560, 012068. [Google Scholar] [CrossRef]
- Petrov, P.A.; Sharikov, Y.V.; Vlasov, A.A.; Bazhin, V.Y.; Feoktistov, A.Y. Developing Software for the Feed-Control Systems of High-Power Aluminum Reduction Cells. Metallurgist 2015, 58, 1060–1063. [Google Scholar] [CrossRef]
- Makeev, A.V.; Piskazhova, T.V.; Gofman, P.M. Optimization control actions for the electrolytic method of aluminium production. Sib. J. Sci. Technol. 2020, 21, 314–322. [Google Scholar] [CrossRef]
- Feshchenko, R.Y.; Erokhina, O.O.; Kvanin, A.L.; Lutskiy, D.S.; Vasilyev, V.V. Analytical review of the foreign publications about the methods of rise of operating parameters of cathode blocks during 1995–2014. CIS Iron Steel Rev. 2017, 13, 48–52. [Google Scholar] [CrossRef]
- Litvinenko, V.S. Digital Economy as a Factor in the Technological Development of the Mineral Sector. Nat. Resour. Res. 2020, 29, 1521–1541. [Google Scholar] [CrossRef]
- Li, X.; Liu, B.; Qian, W.; Rao, G.; Chen, L.; Cui, J. Design of Soft-Sensing Model for Alumina Concentration Based on Improved Deep Belief Network. Processes 2022, 10, 2537. [Google Scholar] [CrossRef]
- Zhang, S.; Zhang, T.; Yin, Y.; Xiao, W. Alumina Concentration Detection Based on the Kernel Extreme Learning Machine. Sensors 2017, 17, 2002. [Google Scholar] [CrossRef] [PubMed]
- Zhu, J.; Li, J. Diagnosis Method for the Heat Balance State of an Aluminum Reduction Cell Based on Bayesian Network. Metals 2020, 10, 604. [Google Scholar] [CrossRef]
- Dzurňák, R.; Varga, A.; Jablonský, G.; Variny, M.; Pástor, M.; Lukáč, L. Analyzing the Formation of Gaseous Emissions during Aluminum Melting Process with Utilization of Oxygen-Enhanced Combustion. Metals 2021, 11, 242. [Google Scholar] [CrossRef]
- Marchi, B.; Zanoni, S.; Ferretti, I. Energy Efficiency Investments in Industry with Uncertain Demand Rate: Effects on the Specific Energy Consumption. Energies 2020, 13, 161. [Google Scholar] [CrossRef]
- Sarnovsky, M.; Bednar, P.; Smatana, M. Cross-Sectorial Semantic Model for Support of Data Analytics in Process Industries. Processes 2019, 7, 281. [Google Scholar] [CrossRef]
- Akundi, A.; Euresti, D.; Luna, S.; Ankobiah, W.; Lopes, A.; Edinbarough, I. State of Industry 5.0—Analysis and Identification of Current Research Trends. Appl. Syst. Innov. 2022, 5, 27. [Google Scholar] [CrossRef]
- Xu, C.; Tu, Z.; Zhang, W.; Cen, J.; Xiong, J.; Wang, N. A Method of Optimizing Cell Voltage Based on STA-LSSVM Model. Mathematics 2022, 10, 4710. [Google Scholar] [CrossRef]
- Cui, J.; Li, Z.; Li, X.; Liu, B.; Li, Q.; Yan, Q.; Huang, R.; Lu, H.; Cao, B. A Novel Method of Local Anode Effect Prediction for Large Aluminum Reduction Cell. Appl. Sci. 2022, 12, 12403. [Google Scholar] [CrossRef]
- Wang, J.; Chen, X.; Deng, Z.; Zhang, H.; Zeng, J. Distributed Robust Dictionary Pair Learning and Its Application to Aluminum Electrolysis Industrial Process. Processes 2022, 10, 1850. [Google Scholar] [CrossRef]
- Curtolo, D.C.; Xiong, N.; Friedrich, S.; Friedrich, B. High- and Ultra-High-Purity Aluminum, a Review on Technical Production Methodologies. Metals 2021, 11, 1407. [Google Scholar] [CrossRef]
- Yang, Y.; Zhang, Y.; Yu, J.; Wang, Z.; Shi, Z. Study on the Inter-Electrode Process of Aluminum Electrolysis (Ⅱ)—Digital Analysis of the Anode Gas Distribution Patterns on the Anode Surface Using A See-Through Cell. Appl. Sci. 2021, 11, 7702. [Google Scholar] [CrossRef]
- Sun, K.; Li, J.; Zhang, H.; Li, T.; Li, J. First-Principles Study on the Mechanism of Greenhouse Gas Generation in Aluminum Electrolysis. Metals 2021, 11, 1118. [Google Scholar] [CrossRef]
- Stanic, N.; Bø, E.T.; Sandnes, E. CO and CO2 Anode Gas Concentration at Lower Current Densities in Cryolite Melt. Metals 2020, 10, 1694. [Google Scholar] [CrossRef]
- Wang, W.; Sun, K. Influence of Current Density on the Microstructure of Carbon-Based Cathode Materials during Aluminum Electrolysis. Appl. Sci. 2020, 10, 2228. [Google Scholar] [CrossRef]
- Yang, Y.; Tao, W.; Liu, W.; Hu, X.; Wang, Z.; Shi, Z.; Shu, X. The Adsorption Behavior of Moisture on Smelter Grade Alumina during Transportation and Storage—For Primary Aluminum Production. Metals 2020, 10, 325. [Google Scholar] [CrossRef]
- Luneng, R.; Bertel, S.N.; Mikkelsen, J.; Ratvik, A.P.; Grande, T. Chemical Durability of Thermal Insulating Materials in Hall-Héroult Electrolysis Cells. Ceramics 2019, 2, 441–459. [Google Scholar] [CrossRef]
- Boikov, A.; Payor, V. The Present Issues of Control Automation for Levitation Metal Melting. Symmetry 2022, 14, 1968. [Google Scholar] [CrossRef]
- Boikov, A.V.; Savelev, R.V.; Payor, V.A. Evaluation of bulk material behavior control method in technological units using dem. Part 2. CIS Iron Steel Rev. 2020, 20, 3–6. [Google Scholar] [CrossRef]
- Guan, P.; Liu, A.; Shi, Z.; Hu, X.; Wang, Z. Corrosion Behavior of Fe-Ni-Al Alloy Inert Anode in Cryolite Melts. Metals 2019, 9, 399. [Google Scholar] [CrossRef]
- Yakimov, I.; Zaloga, A.; Dubinin, P.; Bezrukovа, O.; Samoilo, A.; Burakov, S.; Semenkin, E.; Semenkina, M.; Andruschenko, E. Application of Evolutionary Rietveld Method Based XRD Phase Analysis and a Self-Configuring Genetic Algorithm to the Inspection of Electrolyte Composition in Aluminum Electrolysis Baths. Crystals 2018, 8, 402. [Google Scholar] [CrossRef]
- Huang, Y.; Wang, Z.; Yang, Y.; Gao, B.; Shi, Z.; Hu, X. Anodic Bubble Behavior in a Laboratory Scale Transparent Electrolytic Cell for Aluminum Electrolysis. Metals 2018, 8, 806. [Google Scholar] [CrossRef]
- Zhang, Y.; Yang, X.; Shardt, Y.A.W.; Cui, J.; Tong, C. A KPI-Based Probabilistic Soft Sensor Development Approach that Maximizes the Coefficient of Determination. Sensors 2018, 18, 3058. [Google Scholar] [CrossRef] [PubMed]
- Benzaoui, A.; Kocaefe, D.; Bhattacharyay, D.; Kocaefe, Y. A Non-Destructive Technique for the On-Line Quality Control of Green and Baked Anodes. Metals 2017, 7, 128. [Google Scholar] [CrossRef]
- Poncsák, S.; Kiss, L.I.; Guérard, S.; Bilodeau, J.-F. Impact of the Solidification Rate on the Chemical Composition of Frozen Cryolite Bath. Metals 2017, 7, 97. [Google Scholar] [CrossRef]
- Khaji, K.; Al Qassemi, M. The Role of Anode Manufacturing Processes in Net Carbon Consumption. Metals 2016, 6, 128. [Google Scholar] [CrossRef]
- Sun, Y.-Z.; Lin, J.; Song, Y.-H.; Xu, J.; Li, X.-M.; Dong, J.-X. An Industrial System Powered by Wind and Coal for Aluminum Production: A Case Study of Technical Demonstration and Economic Feasibility. Energies 2012, 5, 4844–4869. [Google Scholar] [CrossRef]
- Makhova, L.; Haykin, M.; Glazkova, I.; Domnina, O. Development of Mathematical Models for Trucks and Cargo. Infrastructures 2023, 8, 17. [Google Scholar] [CrossRef]
- Pershin, I.M.; Papush, E.G.; Kukharova, T.V.; Utkin, V.A. Modeling of Distributed Control System for Network of Mineral Water Wells. Water 2023, 15, 2289. [Google Scholar] [CrossRef]
- Marinina, O.; Nechitailo, A.; Stroykov, G.; Tsvetkova, A.; Reshneva, E.; Turovskaya, L. Technical and Economic Assessment of Energy Efficiency of Electrification of Hydrocarbon Production Facilities in Underdeveloped Areas. Sustainability 2023, 15, 9614. [Google Scholar] [CrossRef]
- Kondrasheva, N.K.; Anzhelika, M.; Eremeeva, A.M. Production of biodiesel fuel from vegetable raw materials. J. Min. Inst. 2023, 260, 248–256. [Google Scholar] [CrossRef]
- Sidorenko, A.A.; Dmitriev, P.N.; Alekseev, V.Y.; Sidorenko, S.A. Improvement of techno-logical schemes ofmining of coal seams prone to spontaneous combustion and rockbumps. J. Min. Inst. 2023, 1–13. [Google Scholar] [CrossRef]
- Shapiro, S.L.; Kopkov, M.P.; Potseshkovskaya, I.V. Problems of the organization of surface and underground space (e.g., historical embankments of Saint Petersburg). E3S Web Conf. 2021, 266, 03016. [Google Scholar] [CrossRef]
- Potseshkovskaya, I.V. and A.N. Soroka, A.N. Revitalization of urban industrial areas based on sustainable development principles. E3S Web Conf. 2021, 266, 08012. [Google Scholar] [CrossRef]
- Kazanin, O.I.; Sidorenko, A.A.; Sidorenko, S.A.; Ivanov, V.V.; Mischo, H. High productive longwall mining of multiple gassy seams: Best practice and recommendations. Acta Montan. Slovaca 2022, 27, 152–162. [Google Scholar] [CrossRef]
- Sidorenko, A.A.; Sidorenko, S.A.; Ivanov, V.V. Numerical modelling of multiple-seam coal mining at the Taldinskaya-Zapadnaya-2 mine. ARPN J. Eng. Appl. Sci. 2021, 16, 568–574. [Google Scholar]
- Bykowa, E.N.; Khaykin, М.М.; Shabaeva, Y.I.; Beloborodova, М.D. Development of methodology for economic evaluation of land plots for the extraction and processing of solid minerals. J. Min. Inst. 2023, 259, 52–67. [Google Scholar] [CrossRef]
- Semyachkov, A.I.; Pochechun, V.A.; Semyachkov, K.A. Hydrogeoecological conditions of technogenic groundwater in waste disposal sites. J. Min. Inst. 2023, 260, 168–179. [Google Scholar] [CrossRef]
- Romasheva, N.V.; Babenko, M.A.; Nikolaichuk, L.A. Sustainable development of the Russian Arctic region: Environmental problems and ways to solve them. MIAB Mining Inf. Anal. Bull. 2022, 2022, 78–87. (In Russian) [Google Scholar] [CrossRef]
- Makarova, A.A.; Kaliberda, I.V.; Kovalev, D.A.; Pershin, I.M. Modeling a Production Well Flow Control System Using the Example of the Verkhneberezovskaya Area. In Proceedings of the 2022 Conference of Russian Young Researchers in Electrical and Electronic Engineering (ElConRus), Saint Petersburg, Russia, 25–28 January 2022; pp. 760–764. [Google Scholar] [CrossRef]
- Makarova, A.A.; Mantorova, I.V.; Kovalev, D.A.; Kutovoy, I.N. The Modeling of Mineral Water Fields Data Structure. In Proceedings of the 2021 IEEE Conference of Russian Young Researchers in Electrical and Electronic Engineering (ElConRus), St. Petersburg, Moscow, Russia, 26–29 January 2021; pp. 517–521. [Google Scholar] [CrossRef]
- Asadulagi, M.M.; Vasilkov, O.S. The Use of Distributed and Lumped Type Controllers for the Hydro-lithospheric Process Control System of the Kislovodskoye Field. In Proceedings of the 2019 3rd International Conference on Control in Technical Systems, CTS 2019, St. Petersburg, Russia, 30 October–1 November 2019; Institute of Electrical and Electronics Engineers Inc.: St. Petersburg, Russia, 2019; pp. 7–10. [Google Scholar] [CrossRef]
- Martirosyan, A.V.; Martirosyan, K.V.; Mir-Amal, A.M.; Chernyshev, A.B. Assessment of a Hydrogeological Object’s Distributed Control System Stability. In Proceedings of the 2022 Conference of Russian Young Researchers in Electrical and Electronic Engineering, ElConRus 2022, Saint Petersburg, Russia, 25–28 January 2022; pp. 768–771. [Google Scholar] [CrossRef]
- Kukharova, T.V.; Ilyukhina, Y.A.; Shestopalov, M.Y. Development of a Methodology for Controlling the Process of Heating Metal Blanks in a Methodical Furnace. In Proceedings of the 2022 Conference of Russian Young Researchers in Electrical and Electronic Engineering, ElConRus 2022, Saint Petersburg, Russia, 25–28 January 2022; pp. 718–721. [Google Scholar] [CrossRef]
- Pershin, I.M.; Kukharova, T.V.; Tsapleva, V.V. Designing of distributed systems of hydrolithosphere processes parameters control for the efficient extraction of hydromineral raw materials. J. Phys. Conf. Ser. 2021, 1728, 012017. [Google Scholar] [CrossRef]
- Pershin, I.M.; Papush, E.G.; Malkov, A.V.; Kukharova, T.V.; Spivak, A.O. Operational Control of Underground Water Exploitation Regimes. In Proceedings of the 2019 3rd International Conference on Control in Technical Systems, CTS 2019, St. Petersburg, Russia, 30 October–1 November 2019; pp. 77–80. [Google Scholar] [CrossRef]
- Nosova, V.A.; Pershin, I.M. Determining the optimal number of wells during field development. In Proceedings of the 2021 4th International Conference on Control in Technical Systems, CTS 2021, Saint Petersburg, Russia, 21–23 September 2021; pp. 42–44. [Google Scholar]
- Eremeeva Anzhelika, M.; Kondrasheva, N.K.; Khasanov, A.F.; Oleynik, I.L. Environmentally Friendly Diesel Fuel Obtained from Vegetable Raw Materials and Hydrocarbon Crude. Energies 2023, 16, 2121. [Google Scholar] [CrossRef]
- Korshunov, G.I.; Eremeeva, A.M.; Seregin, A.S. Justification of reduction in air requirement in ventilation of coal roadways with running diesel engines. Min. Informational Anal. Bull. 2022, 3, 47–59. [Google Scholar] [CrossRef]
- Litvinenko, V.S.; Petrov, E.I.; Vasilevskaya, D.V.; Yakovenko, A.V.; Naumov, I.A.; Ratnikov, M.A. Assessment of the role of the state in the management of mineral resources. J. Min. Inst. 2023, 259, 95–111. [Google Scholar] [CrossRef]
- Afanaseva, O.; Bezyukov, O.; Pervukhin, D.; Tukeev, D. Experimental Study Results Processing Method for the Marine Diesel Engines Vibration Activity Caused by the Cylinder-Piston Group Operations. Inventions 2023, 8, 71. [Google Scholar] [CrossRef]
- Umar, N.; Sohail, M.; Mukdasai, K.; Singh, A.; Alahmadi, R.A.; Galal, A.M.; Eldin, S.M. Applications of variable thermal properties in Carreau material with ion slip and Hall forces towards cone using a non-Fourier approach via FE-method and mesh-free study. Front. Mater. 2022, 9, 1054138. [Google Scholar]
- Martirosyan, K.V.; Chenyshev, A.B.; Martirosyan, A.V. Application of Bayes Networks in the Design of the Information System “Mineral Water Deposit”. In Proceedings of the 2023 XXVI International Conference on Soft Computing and Measurements (SCM), Saint Petersburg, Russia, 24–26 May 2023; pp. 236–239. [Google Scholar] [CrossRef]
- Umar, N.; Sohail, M.; Naz, S.; Mukdasai, K.; Singh, M.; Singh, A.; Mohan, C.R.; Eldin, S.M.; Galal, A.M. Effective role of mineral oil and biological nanomaterial on thermal energy influenced by magnetic dipole and nanoparticle shape. Front. Mater. 2023, 10, 1,107,661. [Google Scholar]
- Tarabarinova, T.A.; Golovina, E.I. Capitalization of mineral resources as an innovation ecological strategy. Geol. Miner. Resour. Sib. 2021, 4, 86–96. [Google Scholar] [CrossRef]
- Iliushina, A.N.; Novozhilov, I.M. Search of the Optimal Mining Transport Route Applying Parallel Computing Technologies. In Proceedings of the 2023 XXVI International Conference on Soft Computing and Measurements (SCM), Saint Petersburg, Russia, 24–26 May 2023; pp. 61–63. [Google Scholar] [CrossRef]
- Gerasimova, I.G.; Oblova, I.S.; Golovina, E.I. The demographic factor impact on the economics of the Arctic region. Resources 2021, 10, 117. [Google Scholar] [CrossRef]
- Martirosyan, A.V.; Martirosyan, K.V.; Chernyshev, A.B. Investigation of Popov’s Lines’ Limiting Position to Ensure the Process Control Systems’ Absolute Stability. In Proceedings of the 2023 XXVI International Conference on Soft Computing and Measurements (SCM), Saint Petersburg, Russia, 24–26 May 2023; pp. 69–72. [Google Scholar] [CrossRef]
- Afanasev, P.M.; Bezyukov, O.K.; Ilyushina, A.N.; Pastukhova, E.V. Development of a system for controlling the temperature field of the columns and pipelines of raw gas transportation. ARPN J. Eng. Appl. Sci. 2023, 18, 421–437. [Google Scholar]
- Marinina, O.; Tsvetkova, A.; Vasilev, Y.; Komendantova, N.; Parfenova, A. Evaluating the Downstream Development Strategy of Oil Companies: The Case of Rosneft. Resources 2022, 11, 4. [Google Scholar] [CrossRef]
- Moroz, E.A.; Grizkevich, V.O.; Novozhilov, I.M. The Potential of Artificial Intelligence as a Method of Software Developer’s Productivity Improvement. In Proceedings of the 2022 Conference of Russian Young Researchers in Electrical and Electronic Engineering (ElConRus), Saint Petersburg, Russia, 24–26 May 2022; pp. 386–390. [Google Scholar] [CrossRef]
- Katysheva, E. Analysis of the Interconnected Development Potential of the Oil, Gas and Transport Industries in the Russian Arctic. Energies 2023, 16, 3124. [Google Scholar] [CrossRef]
- Golovina, E.I.; Pasternak, S.N.; Tsiglianu, P.P.; Tselischev, N.A. Sustainable management of transboundary groundwater resources: Past and future. Sustainability 2021, 13, 12102. [Google Scholar] [CrossRef]
- Zolotov, O.I.; Ilyushina, A.N.; Novozhilov, I.M. Spatially Distributed System for Monitoring of Fields Technical Condition in Mineral Resources Sector. In Proceedings of the 2021 XXIV International Conference on Soft Computing and Measurements (SCM), St. Petersburg, Russia, 26–28 May 2021; pp. 93–95. [Google Scholar] [CrossRef]
- Golovina, E.; Shchelkonogova, O. Possibilities of Using the Unitization Model in the Development of Transboundary Groundwater Deposits. Water 2023, 15, 298. [Google Scholar] [CrossRef]
- Marinin, M.; Marinina, O.; Wolniak, R. Assessing of Losses and Dilution Impact on the Cost Chain: Case Study of Gold Ore Deposits. Sustainability 2021, 13, 3830. [Google Scholar] [CrossRef]
- Eremeeva, A.M.; Ilyashenko, I.S.; Korshunov, G.I. The possibility of application of bioadditives to diesel fuel at mining enterprises. MIAB Mining Inf. Anal. Bull. 2022, 39–49. [Google Scholar] [CrossRef]
- Kivaev, I.N.; Iliushina, A.N.; Novozhilov, I.M. Mathematical Approach to the Formalization of Errors of Operator’s Activities. In Proceedings of the 2018 XVII Russian Scientific and Practical Conference on Planning and Teaching Engineering Staff for the Industrial and Economic Complex of the Region (PTES), St. Petersburg, Russia, 14–15 November 2018; pp. 106–107. [Google Scholar] [CrossRef]
- Katysheva, E.G. Application of BigData technology to improve the efficiency of Arctic shelf fields development. IOP Conf. Ser. Earth Environ. Sci. 2021, 937, 042080. [Google Scholar] [CrossRef]
- Novozhilov, I.M.; Ilyushin, Y.V.; Kivayev, I.N. Improving the quality of training specialists in subsoil use at the expense of introduction of automated training systems. In Proceedings of the 2017 IEEE VI Forum Strategic Partnership of Universities and Enterprises of Hi-Tech Branches (Science. Education. Innovations) (SPUE), St. Petersburg, Russia, 15–17 November 2017; pp. 125–127. [Google Scholar] [CrossRef]
- Kazanin, O.I.; Sidorenko, A.A.; Meshkov, A.A.; Sidorenko, S.A. Reproduction of the longwall panels: Modern requirements for the technology and organization of the development operations at coal mines. Eurasian Min. 2020, 2, 19–23. [Google Scholar] [CrossRef]
Figure 1.
Soderbergh S-8BM aluminium electrolyser with a self-igniting anode.
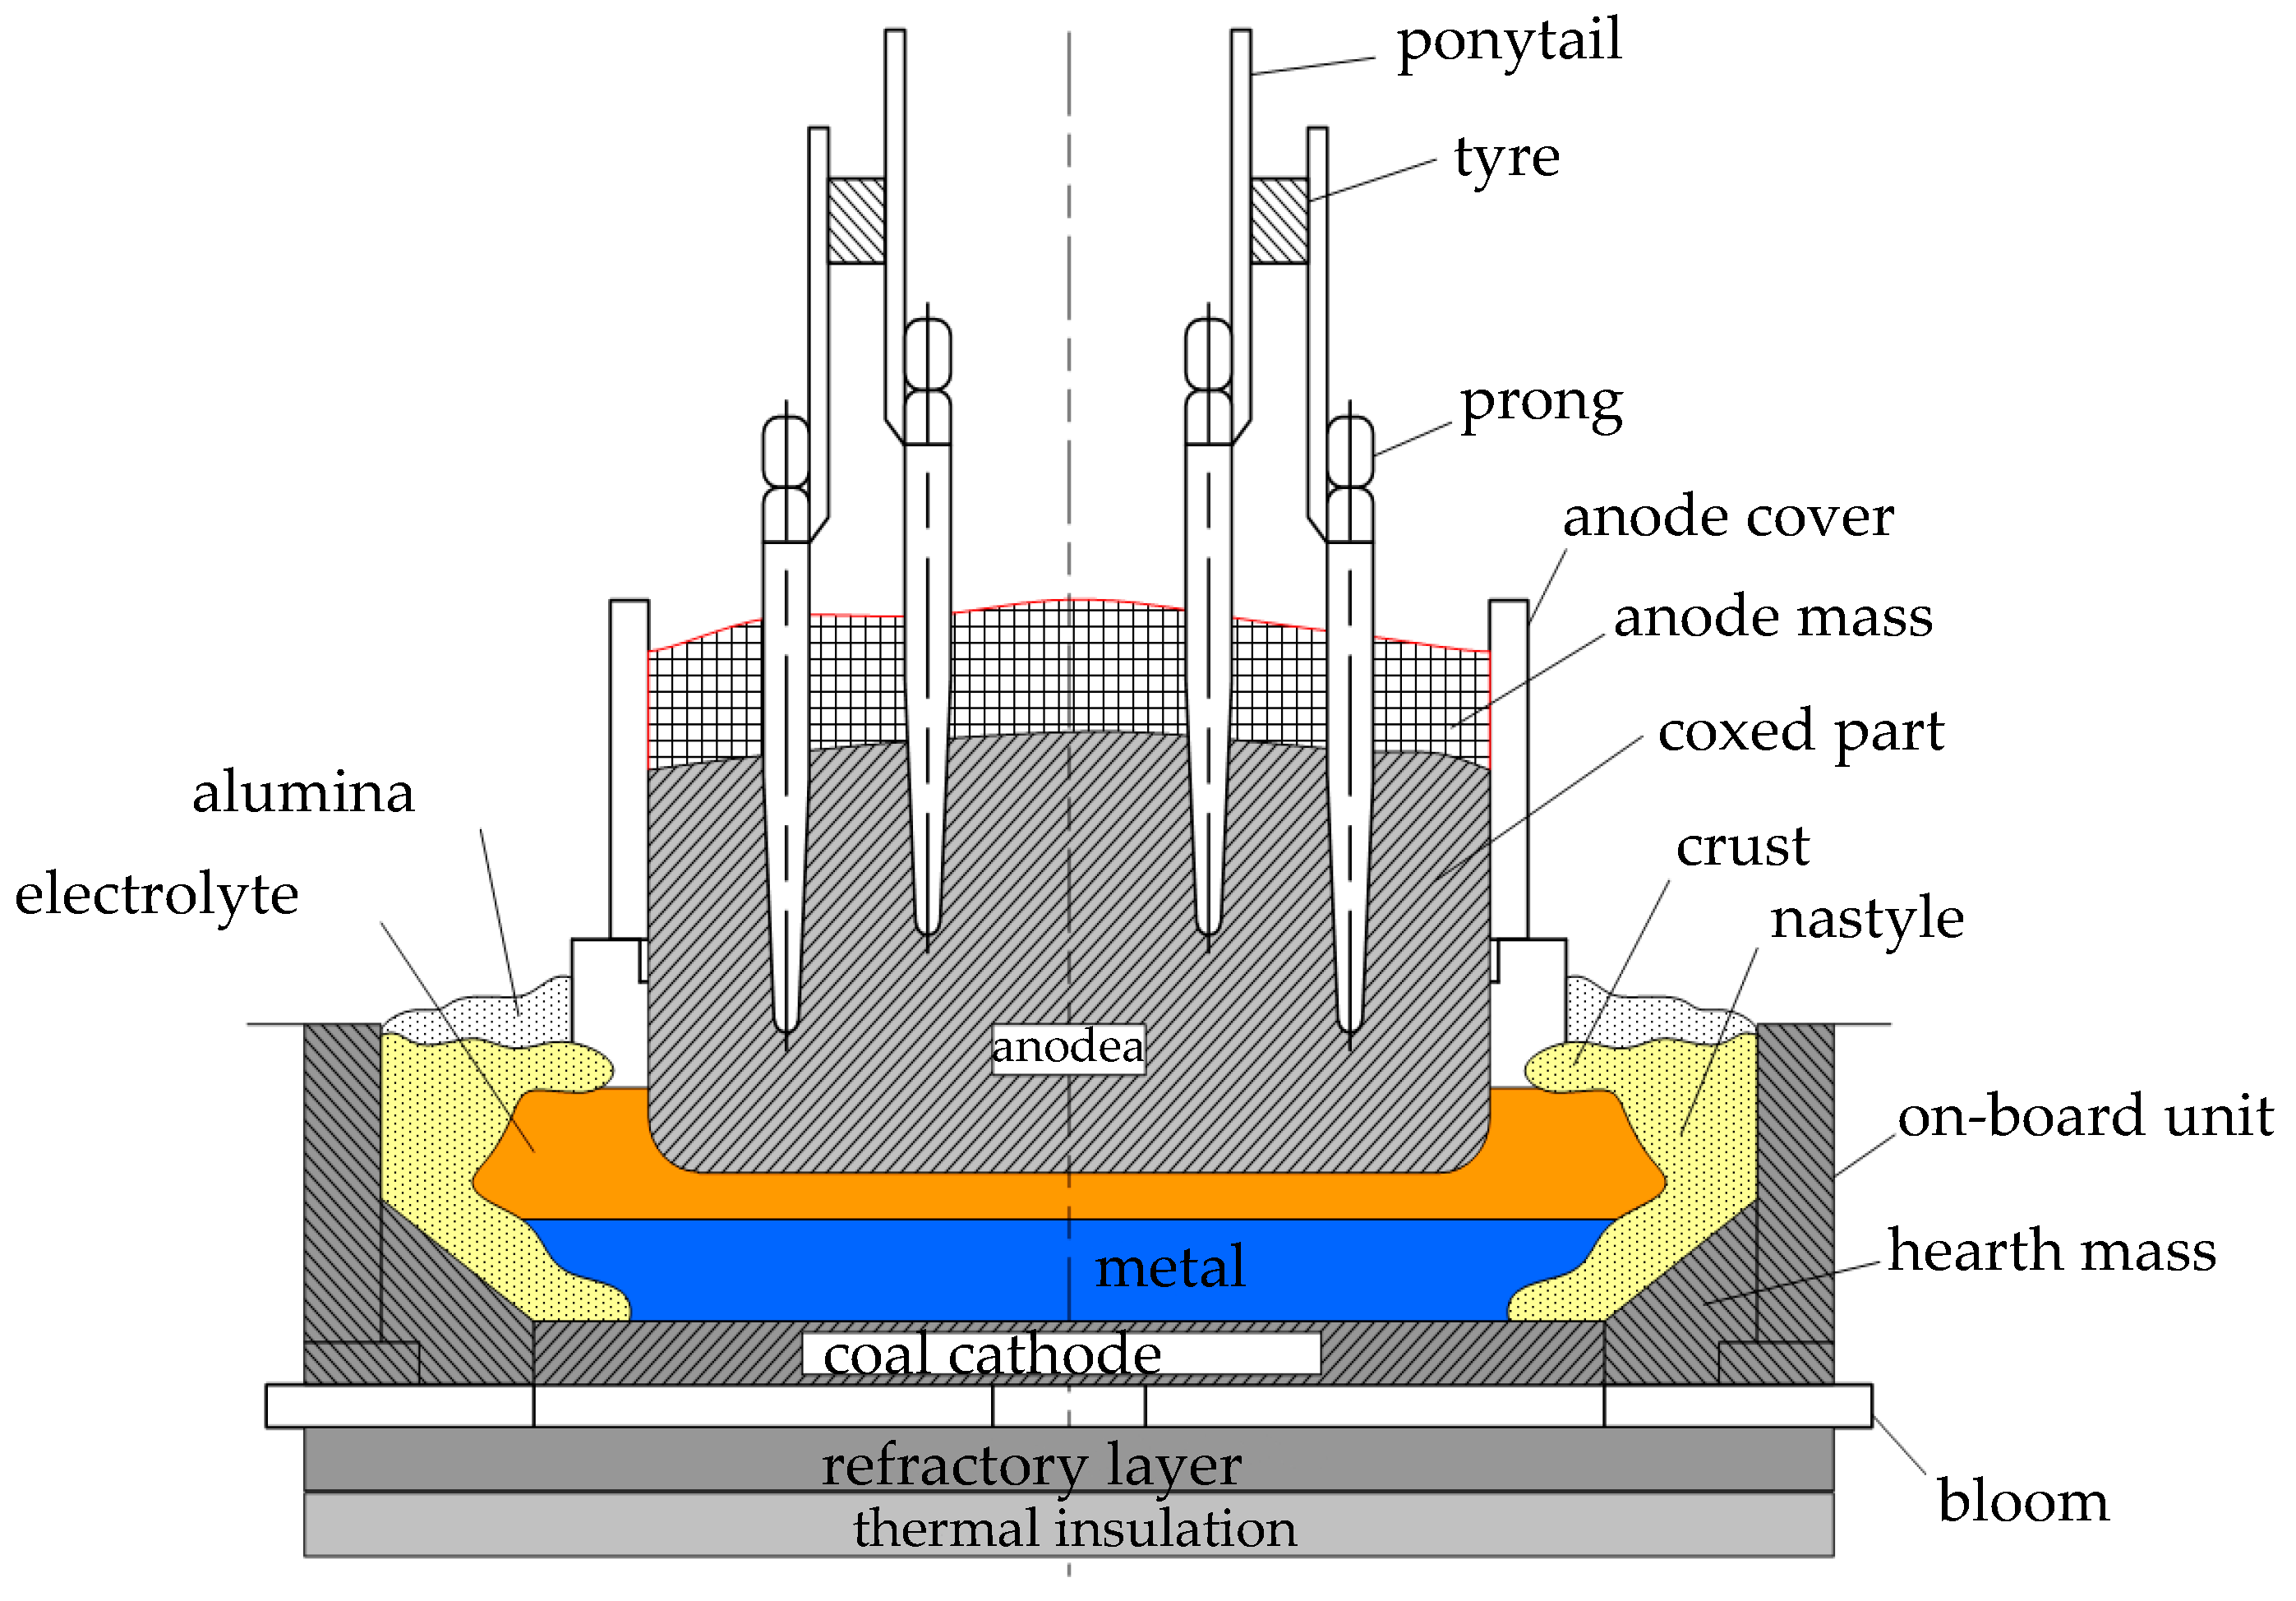
Figure 2.
Dependence of the current output on the composition of the electrolyte.

Figure 3.
Dependence of the current output on the temperature of the electrolyte.

Figure 4.
Dependence of the current output on the inter-pole distance.

Figure 5.
Dependence of the current output on the current density.

Figure 6.
The most important factors affecting the efficiency of the technological process.

Figure 7.
Conceptual model of aluminium production.


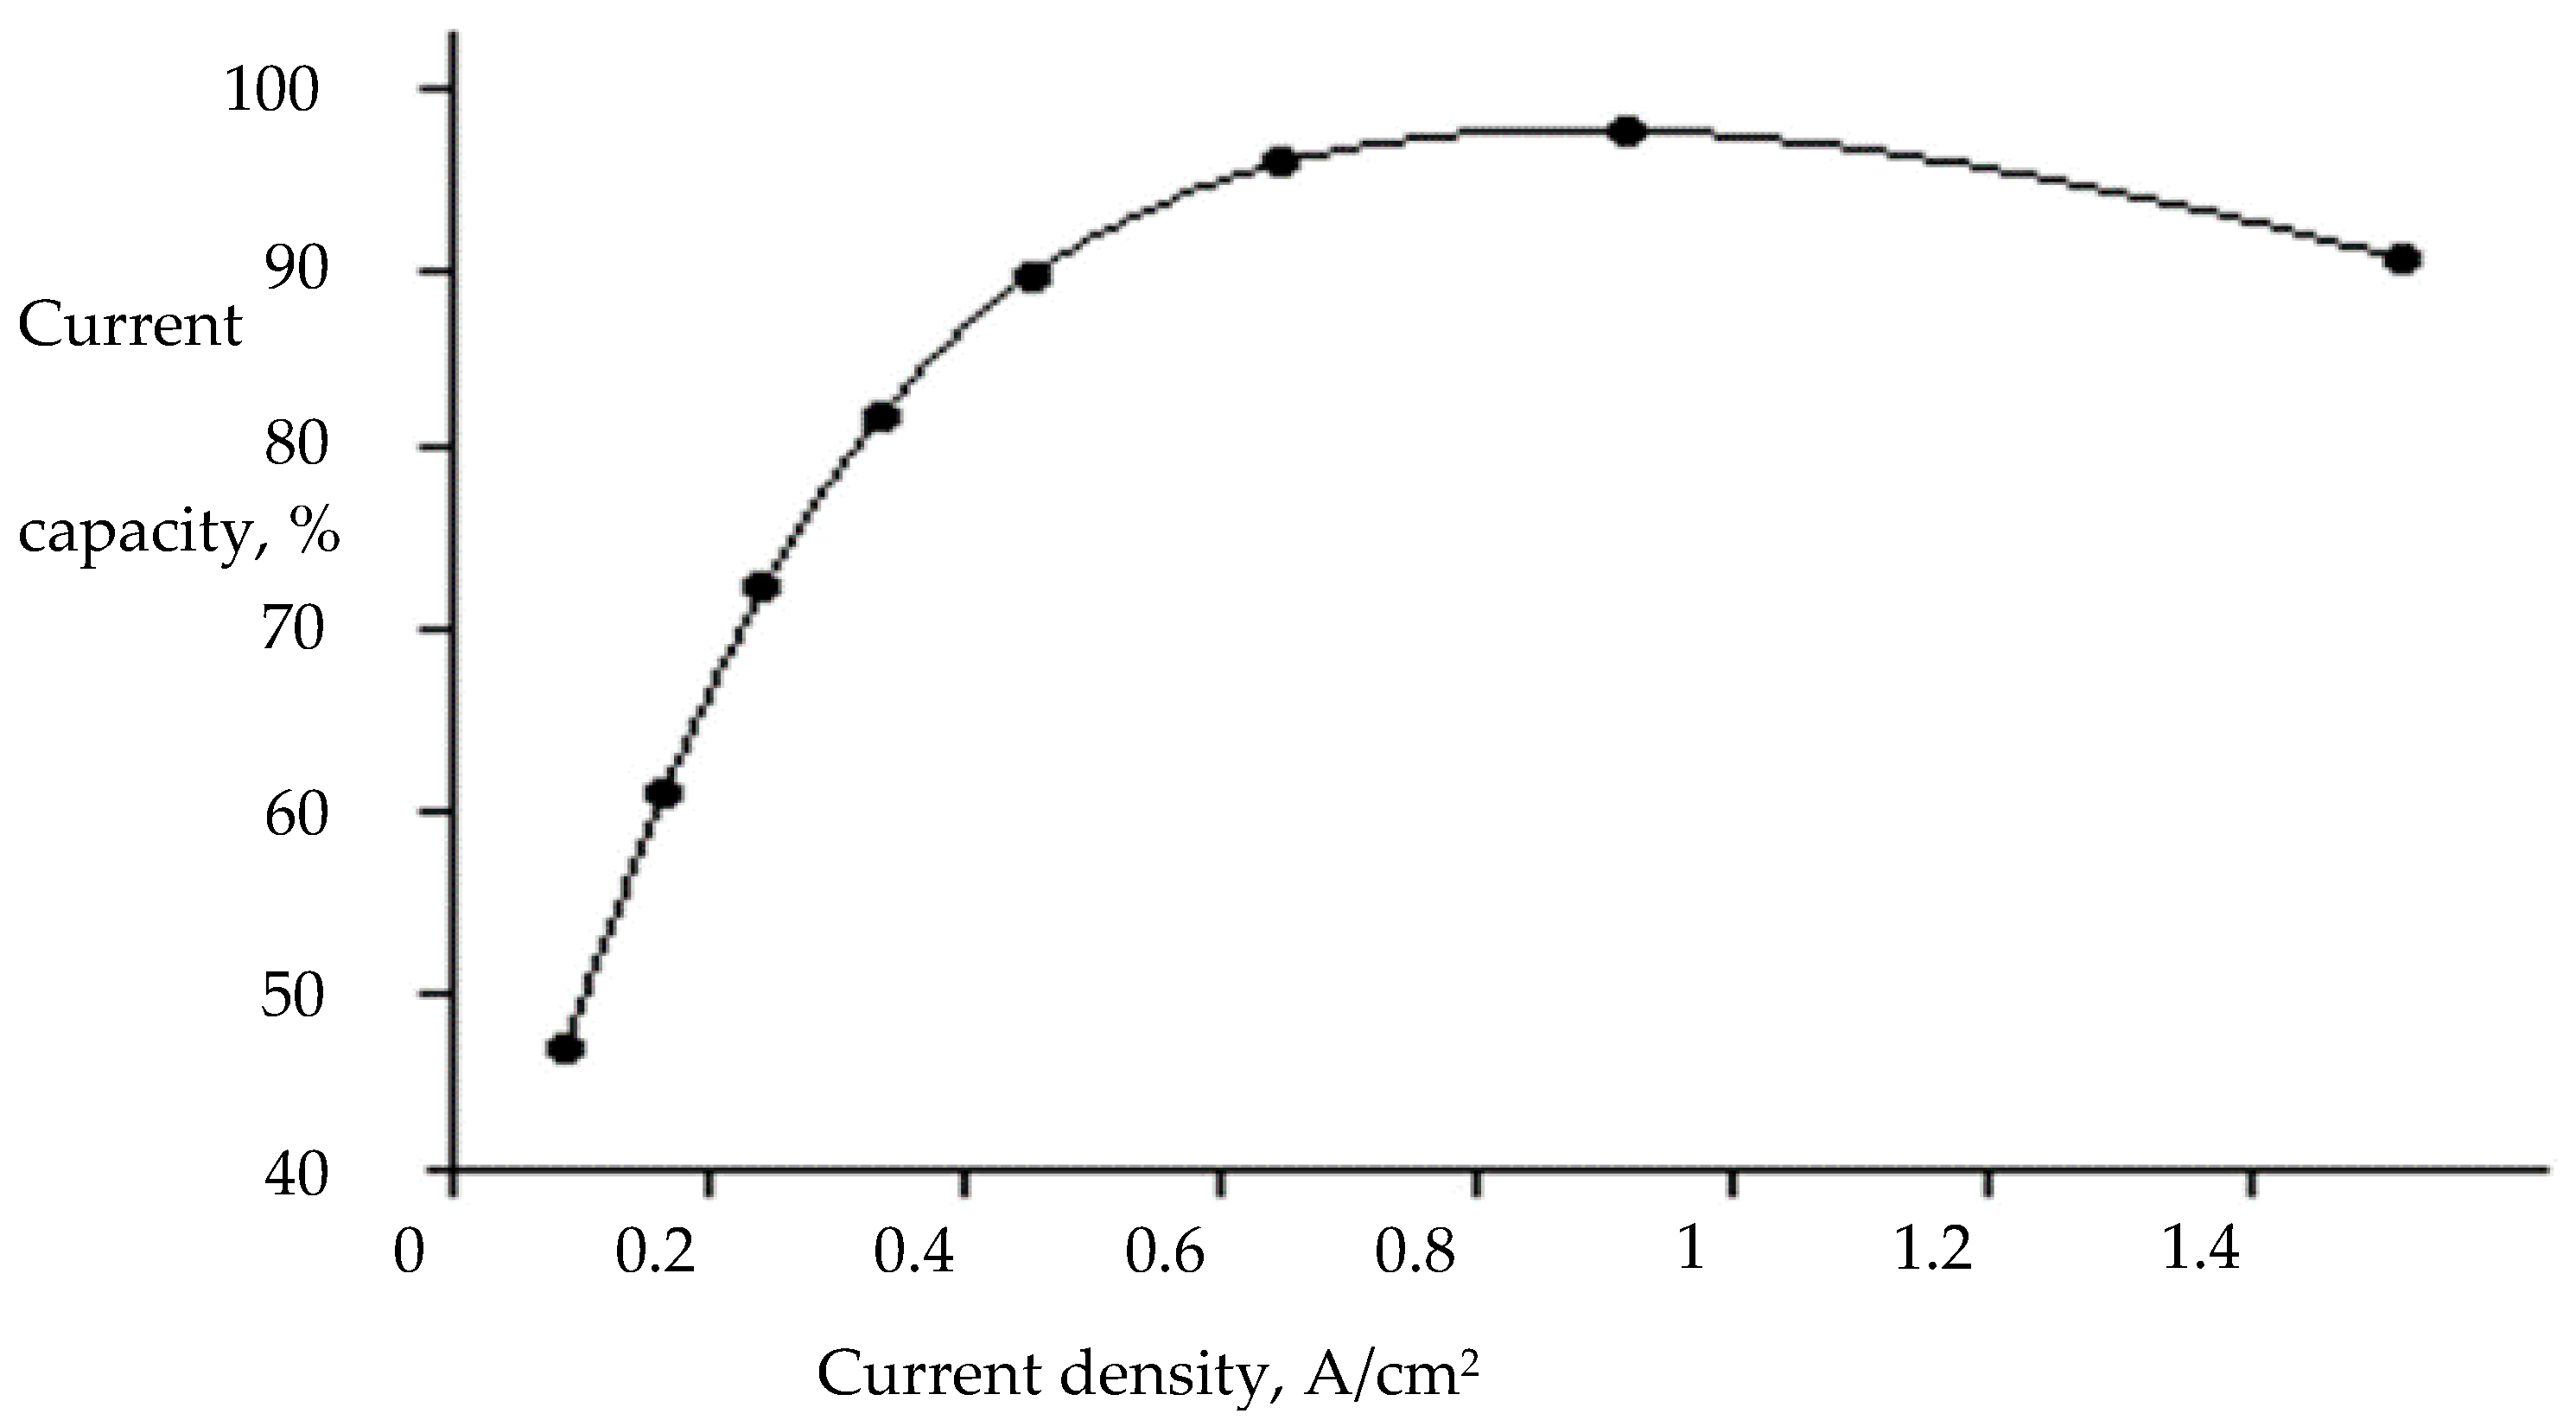
Table 1.
Technological parameters of the electrolyser and the aluminium production process.
| Process Parameters of the Electrolyser | № | ||||
|---|---|---|---|---|---|
| output parameters | Disturbances and external parameters of the electrolyser | Humidity in the workshop | 1 | ||
| Air temperature in the workshop | 2 | ||||
| Air temperature outside | 3 | ||||
| Noise level in the workshop | 4 | ||||
| Fluctuations of series current | 5 | ||||
| Level of electromagnetic field outside the electrolyser at specific points | 6 | ||||
| Electromagnetic field strength of neighbouring electrolysers in the workshop | 7 | ||||
| Electrolyser team composition | 8 | ||||
| Electrolyser model | 9 | ||||
| Lifetime of electrolyser | 10 | ||||
| Number of electrolysers in the workshop | 11 | ||||
| Location of electrolysers in the workshop | 12 | ||||
| Design parameters of the electrolyser | Depth | 13 | |||
| Length | 14 | ||||
| Width | 15 | ||||
| Internal parameters of the electrolyser and electrolysis process | Electricity parameters of the electrolyser | Electrolysis series currents | 16 | ||
| Current distribution on an individual electrolyser | 17 | ||||
| Current density | 18 | ||||
| Voltage drop on individual components | at the anode | 19 | |||
| at the cathode | 20 | ||||
| in the armature | 21 | ||||
| in the electrolyte | 22 | ||||
| due to anodic effects | 23 | ||||
| Decomposition voltage | 24 | ||||
| Electrolysis power series | 25 | ||||
| Electromagnetic field of the electrolyser | 26 | ||||
| Electromagnetic force acting on the melt | 27 | ||||
| Rotational torque due to melt differential | 28 | ||||
| Alumina characteristic | 29 | ||||
| Anode mass characteristic | 30 | ||||
| Level of cryolite | 31 | ||||
| Cryolite ratio | 32 | ||||
| Composition of cryolite (electrolyte) | 33 | ||||
| Aluminium fluoride content in cryolite | 34 | ||||
| Content of calcium fluoride in cryolite | 35 | ||||
| Physico-chemical properties of the electrolyte | 36 | ||||
| Electrolyte temperature | 37 | ||||
| Homogeneity of the podium temperature field | 38 | ||||
| Layer height of process aluminium | 39 | ||||
| Specific raw material costs | Specific consumption of alumina | 40 | |||
| Specific anode/anode mass consumption | 41 | ||||
| Specific consumption of fluoride salts | 42 | ||||
| Environment and external factors | Techno-economic factors | Level of industrial production | 43 | ||
| State of production technology | 44 | ||||
| Electricity sources | 45 | ||||
| Electricity costs | 46 | ||||
| Electricity tariffs | 47 | ||||
| Costs of imported raw materials | 48 | ||||
| Costs of final product exports | 49 | ||||
| Labour resources | 50 | ||||
| Availability of markets | 51 | ||||
| Transport system development | 52 | ||||
| Natural resources | Bauxite deposits | 53 | |||
| Water reserves | 54 | ||||
| Environmental safety | 55 | ||||
| Control actions | Alumina feed rate | 56 | |||
| Change in anode position | 57 | ||||
| Electrolyser output parameters | Electrolyser output | 58 | |||
| Quantity of aluminium in electrolysis tank | 59 | ||||
| Electrolyte volume in electrolyser | 60 | ||||
| Alumina concentration in electrolyte | 61 | ||||
| Distance between poles | 62 | ||||
| Number of anode effects on the electrolyser | 63 | ||||
| Current yield | 64 | ||||
| Operating voltage | 65 | ||||
| Heat content of electrolyser | 66 | ||||
| Electrolyte temperature | 67 | ||||
Table 2.
Summary table of expert assessments.
| Parameter Sequence Number (xi) | Experts | ||||
|---|---|---|---|---|---|
| 1 Exp. | 2 Exp. | 3 Exp. | 4 Exp. | 5 Exp. | |
| х1 | 3 | 2 | 4 | 3 | 3 |
| х2 | 5 | 2 | 4 | 4 | 4 |
| х3 | 5 | 1 | 4 | 3 | 4 |
| … | … | … | … | … | … |
| х67 | 9 | 7 | 10 | 10 | 10 |
Table 3.
Determination of ranks based on estimates.
| Parameter | Parameter Sequence Number (xi) | Number in Ascending Order | Expert Assessment | Rank |
|---|---|---|---|---|
| Noise level in the hall | х1 | 1 | 1 | 1.00 |
| Number of electrolysers in the workshop | х2 | 2 | 2 | 2.00 |
| Room humidity | х3 | 3 | 3 | 5.50 |
| … | … | … | … | … |
| Electrolyte temperature | х67 | 67 | 9 | 64.00 |
Table 4.
Summary table of expert ranks.
| Parameter Sequence Number (xi) | Experts | ||||
|---|---|---|---|---|---|
| 1 Exp. | 2 Exp. | 3 Exp. | 4 Exp. | 5 Exp. | |
| х1 | 5.5 | 4.5 | 8.5 | 6 | 4 |
| х2 | 14 | 4.5 | 8.5 | 11.5 | 8 |
| х3 | 14 | 1.5 | 8.5 | 6 | 8 |
| … | … | … | … | … | … |
| х67 | 64 | 56 | 52 | 58 | 64.5 |
Table 5.
Calculation of the d coefficient.
| Parameter Sequence Number (xi) | Experts | d | d2 | |||||
|---|---|---|---|---|---|---|---|---|
| 1 Exp. | 2 Exp. | 3 Exp. | 4 Exp. | 5 Exp. | ||||
| х1 | 5.5 | 4.5 | 8.5 | 6 | 4 | 28.5 | −141.50 | 20,022.25 |
| х2 | 14 | 4.5 | 8.5 | 11.5 | 8 | 46.5 | −123.50 | 15,252.25 |
| х3 | 14 | 1.5 | 8.5 | 6 | 8 | 38 | −132.00 | 17,424.00 |
| … | … | … | … | … | … | … | … | … |
| х67 | 64 | 56 | 52 | 58 | 64.5 | 294.5 | 124.50 | 15,500.25 |
| Σ | 2278 | 2278 | 2278 | 2278 | 2278 | 11,390 | 0 | 357,322.50 |
Table 6.
Location of factors by importance.
| Number in Ascending Order of the Sum of the Ranks | Parameter | Parameter Sequence Number (xi) | |
|---|---|---|---|
| 1 | Humidity in the workshop | х1 | 28.5 |
| 2 | Air temperature outside | х3 | 38 |
| 3 | Number of electrolysers in the workshop | х11 | 39 |
| … | ... | … | … |
| 67 | Current output | х64 | 305.5 |
Table 7.
Calculation of parameter weights.
| Order Number in Ascending Order of the sum of Ranks | Parameter Title | Parameter Sequence Number (xi) | Weight (λi) | |
|---|---|---|---|---|
| 1 | Humidity in the shop | х1 | 28.5 | 0.0025 |
| 2 | Air temperature outside | х3 | 38 | 0.0033 |
| 3 | Number of electrolysers in the shop | х11 | 39 | 0.0034 |
| … | ... | … | … | … |
| 67 | Current output | х64 | 305.5 | 0.0268 |
| Σ | 11,390 | 1 |
Table 8.
The parameters selected as the most significant for the electrolysis process.
| Parameter Title | Parameter Sequence Number (xi) | Weight (λi) | Letter Designation | Unit | |
|---|---|---|---|---|---|
| Bauxite deposits | х53 | 192.5 | 0.0171 | - | - |
| Electricity costs | х46 | 194.5 | 0.0173 | rub./MW∙ч | |
| Electrolyte temperature | х37 | 200.5 | 0.0179 | °C | |
| Amount of aluminium in the electrolyser | х59 | 204.5 | 0.0182 | kg/w | |
| Uniformity of the temperature field of the bottom plate | х38 | 207 | 0.0184 | - | - |
| Specific alumina consumption | х40 | 210 | 0.0187 | kg/kgAl | |
| Alumina concentration in the electrolyte | х61 | 215 | 0.0192 | Al2O3 | % |
| Cryolite (electrolyte) composition | х33 | 215.5 | 0.0192 | kg | |
| Electromagnetic force acting on the melt | х27 | 218.5 | 0.0195 | H/cm3 | |
| Aluminium fluoride content in the cryolite | х34 | 220 | 0.0196 | AlF3 | % |
| Cryolite ratio | х32 | 221.5 | 0.0197 | КО | - |
| Process aluminium layer height | х39 | 227.5 | 0.0203 | cm | |
| Physico-chemical properties of the electrolyte | х36 | 235 | 0.0209 | - | - |
| Current density | х18 | 235 | 0.0209 | i | А/сm2 |
| Electricity tariffs | х47 | 236 | 0.0210 | Цээ. Цм | rub./МW∙h |
| State of production technology | х44 | 237.5 | 0.0212 | - | - |
| Current distribution on an individual electrolyser | х17 | 248 | 0.0221 | - | |
| Voltage drop in anode | х19 | 251 | 0.0224 | W | |
| Voltage drop in electrolyte | х22 | 254 | 0.0226 | W | |
| Raw material import costs | х48 | 255 | 0.0227 | М | rub/unit |
| Voltage drop in cathode | х20 | 260.5 | 0.0232 | W | |
| Voltage drop in the busbar | х21 | 265 | 0.0236 | W | |
| Amount of heat in the electrolyser | х66 | 273 | 0.0243 | J | |
| Pole-to-pole distance | х62 | 292 | 0.0260 | L | cm |
| Operating voltage | х65 | 292 | 0.0260 | W | |
| Electrolyte temperature (output) | х67 | 294.5 | 0.0262 | °C | |
| Current output | х64 | 305.5 | 0.0272 | η | unit |
Table 9.
Name of mathematical model formulas.
| № | Formula Title | № | Formula Title |
|---|---|---|---|
| 1. | Raw material costs | 11. | Electrical balance |
| 2. | Alumina concentration in electrolyte | 12. | Voltage drop in anodes |
| 3. | Amount of aluminium in the electrolyser | 13. | Voltage drop in cathode |
| 4. | Input of materials to the electrolysis bath | 14. | Voltage drop in electrolyte |
| 5. | KO control | 15. | Voltage drop in the busbar |
| 6. | Al melt layer height | 16. | Current density |
| 7. | Amount of heat in the electrolyser | 17. | Current output |
| 8. | Energy balance | 18. | Current distribution non-uniformity coefficient |
| 9. | Electromagnetic forces | 19. | Electricity costs |
| 10. | Pole-to-pole distance |
Disclaimer/Publisher’s Note: The statements, opinions and data contained in all publications are solely those of the individual author(s) and contributor(s) and not of MDPI and/or the editor(s). MDPI and/or the editor(s) disclaim responsibility for any injury to people or property resulting from any ideas, methods, instructions or products referred to in the content. |
© 2023 by the authors. Licensee MDPI, Basel, Switzerland. This article is an open access article distributed under the terms and conditions of the Creative Commons Attribution (CC BY) license (https://creativecommons.org/licenses/by/4.0/).
Share and Cite
MDPI and ACS Style
Ilyushin, Y.V.; Kapostey, E.I. Developing a Comprehensive Mathematical Model for Aluminium Production in a Soderberg Electrolyser. Energies 2023, 16, 6313. https://doi.org/10.3390/en16176313
AMA Style
Ilyushin YV, Kapostey EI. Developing a Comprehensive Mathematical Model for Aluminium Production in a Soderberg Electrolyser. Energies. 2023; 16(17):6313. https://doi.org/10.3390/en16176313
Chicago/Turabian StyleIlyushin, Yury Valeryevich, and Ekaterina Ivanovna Kapostey. 2023. "Developing a Comprehensive Mathematical Model for Aluminium Production in a Soderberg Electrolyser" Energies 16, no. 17: 6313. https://doi.org/10.3390/en16176313
Note that from the first issue of 2016, this journal uses article numbers instead of page numbers. See further details here.