
Experimental Study on Flame Response Characteristics of a Non-Premixed Swirl Model Combustor

1
Aero-Engine Thermal Environment and Structure Key Laboratory of Ministry of Industry and Information Technology, Nanjing University of Aeronautics and Astronautics, Nanjing 210016, China
2
Sichuan Gas Turbine Establishment, Aero Engine Corporation of China, Mianyang 621000, China
*
Author to whom correspondence should be addressed.
Energies 2023, 16(19), 6834; https://doi.org/10.3390/en16196834
Submission received: 22 August 2023
/
Revised: 18 September 2023
/
Accepted: 21 September 2023
/
Published: 27 September 2023
(This article belongs to the Section I2: Energy and Combustion Science)
Abstract
:Non-premixed swirl combustion has been widely used in pieces of industrial combustion equipment such as industrial boilers, furnaces, and certain specific gas turbine combustors. In recent years, the combustion instability of non-premixed swirl flames has begun receiving attention, yet there is still a lack of related research in academia. Therefore, in this study, we conducted experimental research on a swirl stabilized gas flame model combustor and studied the heat release response characteristics of the swirl combustor through the flame transfer function. Firstly, the flame transfer function (FTF) was measured under different inlet velocities and equivalence ratios, and the experimental results showed that the FTF gain curve of the non-premixed swirl flame exhibited a significant “bimodal” shape, with the gain peaks located around 230 Hz and 330 Hz, respectively. Secondly, two oscillation modes of the flame near the two gain peaks were identified (the acoustic induced vortex mode Mv and the thermoacoustic oscillation mode Ma), which have not been reported in previous studies on swirl non-premixed flames. In addition, we comprehensively analyzed the flame pulsation characteristics under the two oscillation modes. Finally, the coupling degrees between velocity fluctuations, fuel pressure fluctuations, and heat release fluctuations were analyzed using the Rayleigh Index (RI), and it was found that in the acoustic-induced vortex mode, a complete feedback loop was not formed between the combustor and the fuel pipeline, which was the main reason for the significant difference in the pressure fluctuation amplitude near 230 Hz and 330 Hz.
1. Introduction
Combustion instability poses a significant and challenging issue in the design of low-emission engine combustors and advanced military engine afterburner and ramjet combustors [1]. During their operation, these combustors often experience oscillating combustion under specific operating conditions. Pronounced pressure fluctuations can result in an exceedingly unstable combustion state, giving rise to severe mechanical vibrations and noise. Combustion instability can lead to a flameout within the combustor, potentially causing damage to engine components, reducing their operational lifespan, and exacerbating pollutant emissions, among other unfavorable consequences.
At present, the specific mechanisms underlying combustion instability are not fully understood, but there is a widely accepted consensus in the academic community that the coupling between the acoustic modes of the combustor and oscillations in the heat release rate is the primary cause of combustion instability [2]. This coupling is particularly prominent under lean fuel conditions, where the flame is close to its extinction limit, making it more susceptible to inlet disturbances. From the perspective of interaction processes, the interaction between the flame and the vortex behind the flame stabilizer [3,4], inter-flame collisions [5], and the interaction between the flame and sound waves [6,7] all have a significant impact on the stability of a combustion system. Extensive experimental and numerical simulation studies [8,9,10,11] have been conducted by researchers both domestically and internationally, aiming to deepen the understanding of sound wave and heat release behavior from the perspective of physical coupling mechanisms.
In addition, unique research methods have been developed in the field of combustion instability, such as the classical flame transfer function (FTF) analysis method. FTFs are widely used for characterizing the dynamic characteristics of flames. An FTF allows for the analysis of combustion stability in the design process and facilitates the optimization of a combustion system’s structure to enhance stability margins. Extensive experimental studies have been carried out by Palies [12] et al. to investigate the influence of swirler structure and swirl number on flame response. Furthermore, FTFs can be further incorporated into acoustic calculations, such as low-order network models (LONM) [13,14,15] or Helmholtz solvers [16,17], to obtain detailed thermoacoustic stability data by including them as a source term representing non-steady heat release.
Extensive experimental and numerical research has been conducted by scholars both domestically and internationally on the use of FTFs to analyze combustion Instability. In terms of experimental studies, Eirik et al. [18]. investigated the flame response characteristics under different upstream bluff body configurations. They discovered that by arranging a series of small-diameter cylinders upstream of the bluff body, the gain and phase of the FTF at the target frequency can be adjusted, providing a method for suppressing thermoacoustic instability. In a study conducted by Liu et al. [19], the nonlinear response characteristics of low-swirl CH4/air premixed flames toward acoustic excitation were investigated. The research findings indicate that the extreme values of the flame transfer function (FTF) gain for low-swirl flames are influenced by the coexistence or difference of axial and tangential velocities. Guoqong et al. [20] measured the FTF of swirling flames under various conditions, including different flow rates, fuel types, equivalence ratios, and combustor structures. It was observed that the gain and phase of the FTF are not independent of each other. The phase derivatives and gain for different flame types remain consistent over a wide range of acoustic frequencies, and there exists a linear relationship between the peak frequency of the gain and the phase derivative. Yoon et al. [21] examined the impact of fuel composition on the FTF of partially premixed combustors. The results suggest that an increase in H2 content leads to changes in a fuel’s chemical properties, resulting in accelerated chemical reaction rates and flame propagation speeds. Consequently, a flame exhibits greater stability, leading to a decrease in FTF gain. Compared to experimental measurements, numerical simulations can provide more comprehensive flow field data, enabling the study of flame response characteristics at smaller scales. Hermeth et al. [22] conducted research on lean swirling combustors using a large eddy simulation (LES) methodology. The study revealed that, under attachment conditions, a flame stabilizes on the bluff body upstream of the recirculation zone, while under detachment conditions, the flame pulsation behavior is mainly controlled by the precessing vortex core (PVC), leading to significant changes in the flame transfer function (FTF) gain and phase. Mejia et al. [23] investigated the influence of flame-holder temperature on the FTF of laminar flames. It was found that the flame-holder temperature can alter flame’s base position and flow characteristics, thereby causing significant changes in the FTF by Kaiser et al. [24] created direct numerical simulations (DNS) to study the FTF of laminar flames at different cylinder bluff body rotation speeds. The study revealed that the rotation of the bluff body results in differences in the phase lag between the upper and lower branches of the flame, which disturbs the flame heat release and leads to significant differences in the FTF. Therefore, adjusting the bluff body rotation speed can regulate the phase lag difference between the flame branches. Furthermore, some researchers [25,26,27] have employed a combination of large eddy simulation (LES) and system identification (SI) methods to predict the system FTF. This approach allows for obtaining flame response characteristics through a single computational fluid dynamics (CFD) calculation, thus saving computational resources. In recent years, some scholars have also attempted to derive analytical solutions for FTFs based on physical equations, such as the Distributed Time Lag (DTL) model [28,29] and the G-equation model [30,31,32].
In recent years, most studies on thermoacoustic instability have focused on premixed flames of gaseous fuels such as methane and ammonia, while there has been less research on non-premixed flames [14,33,34,35,36,37], such as those found in gas turbine combustors. However, in recent years, there has been a growing interest in investigating the oscillation characteristics of non-premixed flames.
Some scholars have conducted relevant research, but only a few studies have investigated the dynamic behavior of non-premixed swirl flames, and there are few reports on experimental measurements of their flame response characteristics. Therefore, the aim of this study was to experimentally investigate the unsteady heat release response characteristics of non-premixed swirl flames. The flame transfer function (FTF) of non-premixed swirling flames was measured under different operating conditions, resulting in a bimodal shape of the gain curve. By combining dynamic pressure data and analysis of instantaneous flame images, we have identified two physical mechanisms that contribute to the formation of extremum points in the gain curve. This novel finding has not been reported in previous studies. This research will contribute to a deeper understanding of the dynamic characteristics of swirling flames and provide guidance for the stable operation of combustion systems.
2. Experimental Setup and Measurement Layout
2.1. Experimental Setup
The overall layout of the experimental section is depicted in Figure 1. The experimental setup comprised an intake pipeline, a fuel supply system, a combustor, and a synchronous measurement system. Propane gas was employed as the fuel, and the experiment was conducted under ambient temperature and pressure conditions. The air, after passing through an upstream honeycomb flow straightener, entered the combustor through an axially swirled flow injector. The fuel, on the other hand, was supplied through the central tube of the swirler and injected into the combustor through jet orifices to allow it to co-mingle and react with the air. The diameter of the fuel center tube was 12 mm, while the inner diameter of the air pipe outer wall was 50 mm. The cross-section of the combustor was square-shaped, with a side length of l = 100 mm and a length of a = 300 mm. Following treatment, the high-temperature combustion gas was discharged, with the outlet pressure equal to the ambient pressure. A pair of loudspeakers was arranged upstream of the intake pipeline to apply acoustic excitation of a specific amplitude and frequency to the incoming flow.
Figure 2 presents a structural sketch of the swirler utilized in this experiment, in which a Venturi tube is positioned at the head of the combustor to prevent carbon accumulation. The swirler, referred to as a single-stage axial swirler, possesses an inner diameter of 20 mm and an outer diameter of 22.5 mm. The blades were installed at an angle of 43°. The swirl number, calculated using the following formula [38], yields a value of 0.693:
In this equation, Rh represents the outer diameter of the swirler blade, Rn represents the inner diameter of the swirler blade, and θ represents the blade angle.
2.2. Measurement System
To measure the flame transfer function of the model combustor, it was necessary to synchronously collect velocity fluctuation and heat release rate fluctuation information through experiments. Velocity fluctuation is measured using the two-microphone [39] method, with two sound pressure sensors (Beijing Shengwang Company, Beijing, China, MBA416, sensitivity: 45 mV/Pa) arranged 50 mm upstream from the swirler installation plane, with a separation distance of 30 mm between the two sensors. To ensure measurement accuracy, the semi-infinite length method was employed to measure sound pressure fluctuations and eliminate the influence of sound wave reflection within the pipeline. The average intake velocity was measured using a thermal anemometer. The propane flow rate was controlled using a mass flow controller (Asert Instrumrnts, Beijing, China, AST10-HB, range: 50 SLM/min, uncertainty: ≤0.35% F.S.). Pressure fluctuation inside the combustor and flue pressure fluctuation upstream of the fuel pipeline were determined using dynamic pressure sensors (PCB Piezotronics, New York, NY, USA, PCB 113B28, sensitivity: 15 mV/kPa, uncertainty: ≤0.3% F.S.). Heat release rate fluctuation, which can be used to determine the combustion state, was indirectly measured by capturing the fluorescence intensity of CH* chemical species of the flame [40]. In this study, a bandpass filter with a wavelength of 435 nm ± 5 nm, combined with a photodetector (Hamamatsu photon, Shizuoka, Japan, CH348), was used to capture the CH* chemical light intensity signal, with a detector uncertainty of ≤0.5% F.S. Flame images were captured using the high-speed camera (Phantom, CA, USA, VEO 1010) with an exposure time of 19 ms and an exposure rate of 5000 frames/s. All the dynamic signals mentioned above were transmitted to the NI PXle-1092 data acquisition PXI chassis developed by National Instruments Corporation (Austin, TX, USA) to achieve synchronous acquisition, with a sampling rate of 10 kHz. In addition, to minimize random errors, when measuring the flame transfer function in the combustor, at least three experiments were repeated for each operating condition, and some outliers were manually removed. The results presented in the paper are the average values of repeated experimental results.
To ensure the accuracy of the two microphone measurements, a comparative validation of the velocity fluctuation measurements was conducted under cold conditions using a hot wire anemometer. The hot wire anemometer used in this study was the CTA-04 (Hanghua Technology, Dalian, China) which has a frequency response range of 50 kHz–450 kHz. During the measurements, different frequency acoustic excitations were applied through a speaker. On the one hand, the hot wire anemometer probe was fixed at the outlet of the blade channel using a fixture to measure the velocity fluctuation at the swirler outlet (the hot wire measurement results and their spectra are shown in Figure 3a,b). On the other hand, the sound pressure fluctuation signals were obtained using the two pressure sensors located upstream of the combustor, and the velocity fluctuation amplitude was calculated using the two-microphone method (as shown in Figure 3c). The measured results from both methods were compared to validate the accuracy of the two-microphone velocity fluctuation measurements. In Figure 3, it can be observed that the hot wire spectrum and the spectrum calculated using the two-microphone method are almost identical, although the hot wire spectrum has a certain degree of background noise due to the influence of turbulent fluctuations.
Figure 4 presents a comparison between the hot wire and two-microphone measurements (normalized) under different excitation frequencies (corresponding to an excitation frequency range of 15–450 Hz, with a 15 Hz interval) at an intake velocity of 4 m/s and a speaker excitation power of 25 W. It can be observed that at different excitation frequencies, the two microphone measurements closely resemble the hot wire measurements in both trend and amplitude. This validates the accuracy of the dual-microphone method in measuring velocity fluctuation and demonstrates its ability to accurately capture the velocity fluctuation response at the swirler outlet under acoustic excitation.
The flame transfer function of non-premixed swirling flames was measured in this study under different inlet velocities (3.8 m/s, 4 m/s, and 4.2 m/s) and different equivalence ratios (0.248, 0.273, 0.298, and 0.323). Under the aforementioned operating conditions, the combustor maintained a stable burning state. To measure the flame transfer function, the velocity fluctuation characteristics of the combustor were first measured under cold conditions at different excitation powers and frequencies (as shown in Figure 5). In Figure 5, different colors represent different excitation power levels. Specific power values can be obtained from the Figure. Subsequently, this study focused on investigating the inlet disturbance level of u’/u = 0.1 (±0.01) and the disturbance generated at different excitation frequencies upstream of the combustor, while also measuring the heat release response inside the combustor.
3. Results
3.1. FTF Results
Acoustic excitation in the frequency range of 50–370 Hz was applied to the combustor through speakers arranged upstream in the intake duct, with a specific velocity fluctuation amplitude of u′/u = 0.1 (±0.01), for further analysis. Figure 6 presents the flame transfer function (FTF) measurements for different equivalence ratios (Φ = 0.248, 0.273, 0.298, and 0.323) at an inlet velocity of 3.8 m/s. From the gain curve, it is evident that all the equivalence ratios exhibit distinct bimodal characteristics, with two peak gain values around 230 Hz and 330 Hz, respectively. The gain peak near 230 Hz gradually shifts upward with increasing equivalence ratios, while the gain peak around 330 Hz remains relatively stable, indicating the possibility of two distinct oscillation modes associated with these gain peaks. An examination of the phase curve reveals minimal variation in the FTF phase for different equivalence ratios. This phenomenon can be attributed to the dominant convective time delay in non-premixed combustion systems, where changes in equivalence ratios have negligible effects on the convective time delay when the intake velocity remains constant. Furthermore, sharp spikes in the phase curve can be observed near 230 Hz, 290 Hz, and 330 Hz, indicating abrupt phase shifts at these frequencies. These transitions lead to variations in the coupling between velocity fluctuation and heat release rate fluctuation and consequently contribute to local extremum values in the gain curve. By performing first-order fitting using the equation ΔΦ = 2πfτ, the estimated time delay of the system for different equivalence ratios was determined to be approximately 30.62 ms.
Figure 7 presents the flame transfer function (FTF) measurements of the combustor for an equivalence ratio of 0.248 at different inlet velocities. From the gain perspective, the gain curves still exhibit prominent bimodal characteristics, and there is little difference in the measurement results among different inlet velocities. This is because the thermal release level of the combustor primarily depends on the fuel equivalence ratio, with the inlet velocity having a minor influence. Furthermore, increasing the inlet velocity causes the peak gain values to shift towards higher frequencies. When the inlet velocity is increased to 4.2 m/s, the peak gain values move from around 230 Hz/330 Hz to approximately 240 Hz/340 Hz. From the phase curves, it can be observed that the inlet velocity significantly affects the convective time delay, resulting in noticeable differences between the phase curves for different inlet velocities. With an increasing inlet velocity, the time delay (τ) decreases successively: 30.62 ms, 27.48 ms, and 22.56 ms.
3.2. Flame Response Analysis
Compared to typical FTFs of other non-premixed flames [14,41], the FTF gain curves under different operating conditions in this study also exhibit a distinct bimodal shape. Moreover, the behavior of the two peak values varies with changes in the equivalence ratio. Specifically, under excitation at 230 Hz, the gain significantly increases with an increasing equivalence ratio. Conversely, under excitation at 330 Hz, the gain shows less variation with changes in the equivalence ratio, indicating the possibility of two distinct flame oscillation modes corresponding to these two peak values. In the following sections, the flame oscillation characteristics corresponding to these two peak values will be further analyzed.
Firstly, an analysis of the instantaneous flame images was conducted using the Proper Orthogonal Decomposition (POD) method [42]. The POD method can be used to extract coherent structures in a flow field and capture the dominant fluctuation characteristics. In this study, the 1000 acquired instantaneous flame images for each excitation frequency were subjected to POD decomposition. The decomposition results were then sorted based on the magnitude of the singular values, yielding the Proper Orthogonal Modes (POMs) at different orders. Figure 8 presents the statistical results of the first-order POMs for the flame heat release fluctuations at various excitation frequencies. The first-order POM, which represents the dominant fluctuation mode of the flame, exhibits the highest energy contribution. In the figure, it can be observed that both high frequencies (>350 Hz) and low frequencies (<150 Hz) of acoustic excitation do not induce strong oscillations in the spatial distribution of the flame. However, in the intermediate frequency range of 220 Hz–330 Hz, corresponding to the FTF’s high gain, the flame exhibits significant and organized oscillation patterns in the axial direction. This pronounced axial oscillation contributes to the high gain level of the FTF within the intermediate frequency range.
The POD results can explain the main reason for the higher amplitude of the FTF gain under intermediate frequency excitation. However, based on the results, the spatial fluctuation structures corresponding to the two gain peaks are very similar, making it difficult to extract deeper flame oscillation characteristics from them. Therefore, in this study, the phase-averaged flame structures over 20 oscillation cycles were statistically analyzed for the two oscillation modes. In order to obtain clear flame structures, an inverse Abel transform [43] was performed on the phase-averaged flame structures.
Figure 9 and Figure 10 show the phase-averaged flame structures and their inverse Abel transform results for the flame under excitation at 230 Hz and 330 Hz, respectively. Under excitation at 230 Hz, the flame’s oscillation behavior over one cycle can be summarized as follows: within one oscillation period, the flame adheres to the exit of the Venturi tube and is distributed within the shear layer between the central recirculation zone (ORZ) and the main stream. Due to the velocity fluctuations induced by the acoustic excitation, the flame is stretched, resulting in an increase in the flame’s length. After reaching a certain length, the flame undergoes fragmentation, causing it to lose its continuous topological structure. As the flow progresses downstream, the separated high-temperature reaction region gradually dissipates, and the flame at the exit of the Venturi tube is stretched again, repeating the above process.
Furthermore, within the phase angle range of 135°–180°, a significant curling effect can be observed at the flame tip, leading to a substantial increase in the area of the flame tip and an enhancement of the heat release rate. The flame’s oscillation characteristics under excitation at 230 Hz correspond to the “ Acoustic Induced Vortex” mode (referred to as the Mv mode) proposed by Liu et al. [44]. This mode is primarily associated with the fluctuation of the flow field. Under the influence of velocity disturbances in the incoming airflow, periodic acoustically induced vortex structures appear in the inner and outer shear layers. The periodic generation, development, and dissipation of these acoustically induced vortices are the main factors causing significant variations in flame length. Moreover, when the acoustically induced vortices reach the trailing edge of the flame, they exhibit higher intensity and are closer to the flame, resulting in a curling effect at the flame tip.
Under excitation at 330 Hz, there is no significant change in flame length over one cycle. However, the flame front continuously trembles, and within the phase angle range of 90°–225°, the flame front can be observed curling from the root and gradually progressing downstream. The intense fluctuation of the flame front leads to a significant variation in the heat release rate. The axial fluctuation frequency f of the combustor can be estimated using f = c/(2*L), where L is the total length of the combustion system. For an equivalence ratio of 0.248, with an exit temperature of approximately 750 K and an average speed of sound of about 550 m/s, the first-order axial oscillation frequency of the combustor is estimated to be around 324 Hz, which is close to 330 Hz. Therefore, it can be inferred that the 330 Hz mode is related to the acoustic mode of the combustor. In fact, according to the experimental measurements, the self-excitation frequency of the combustor is also around 320 Hz. Analysis based on the following text, it can be concluded that in this oscillation mode, a complete feedback loop is formed between the combustor and the fuel supply system. Therefore, this mode is referred to as the Ma mode.
The experimental results demonstrate that not only does the flame transfer function (FTF) exhibit a significant bimodal distribution, but the pressure fluctuation amplitude also displays bimodal characteristics in the frequency domain. Figure 11 presents the statistical results regarding the pressure fluctuation amplitude within the combustor at different equivalence ratios. It can be observed that the pressure fluctuation amplitude exhibits peaks at frequencies corresponding to both the Mv mode and the Ma mode. As the equivalence ratio decreases gradually, the pressure fluctuation amplitude of the Ma mode gradually increases. At lower equivalence ratios, the pressure fluctuation amplitude in the Ma mode is significantly higher than that in the Mv mode, while this trend reverses for the Mv mode with changing equivalence ratios.
To further investigate the dynamic characteristics of the two flame oscillation modes, a phase space reconstruction analysis [45] was conducted on the pressure fluctuation signal (p′). The time delay τ was obtained using the mutual information method [46], and the value at which the mutual information first reaches its minimum was chosen as the time delay for phase space reconstruction. The embedding dimension d was calculated using the pseudo-near-point method [47]. Figure 12 illustrates the time series signals, phase space reconstruction results, and probability density function (PDF) distributions of the pressure fluctuation within the combustor for an inlet velocity of 3.8 m/s, an equivalence ratio of 0.248, and both the Mv and Ma modes.
It can be observed that although the heat release rate fluctuation levels are similar in the two flame oscillation modes, the characteristics of pressure fluctuation are markedly different. In the Mv mode, the pressure fluctuation amplitude within the combustor is relatively small, and the pressure fluctuation signal exhibits chaotic behavior. As evident from the PDF distribution characteristics, the pressure fluctuation in this mode possesses characteristics of random noise, with the primary sources being turbulent and combustion noise. In contrast, in the Ma mode, the amplitude of the pressure fluctuation time series signal increases compared to the Mv mode, and the phase space reconstruction of p′ forms a closed circular ring, indicative of a typical “limit cycle” feature. This suggests the presence of thermoacoustic coupling phenomena caused by acoustic excitation within the combustor.
The analysis above indicates that the pressure fluctuation within the combustor remains chaotic in the Mv mode. However, in the Ma mode, the combustion system exhibits greater sensitivity to acoustic excitation, as even acoustic disturbances with an amplitude level of u′/u = 0.1 can drive the stable combustion system into a limit cycle oscillation state.
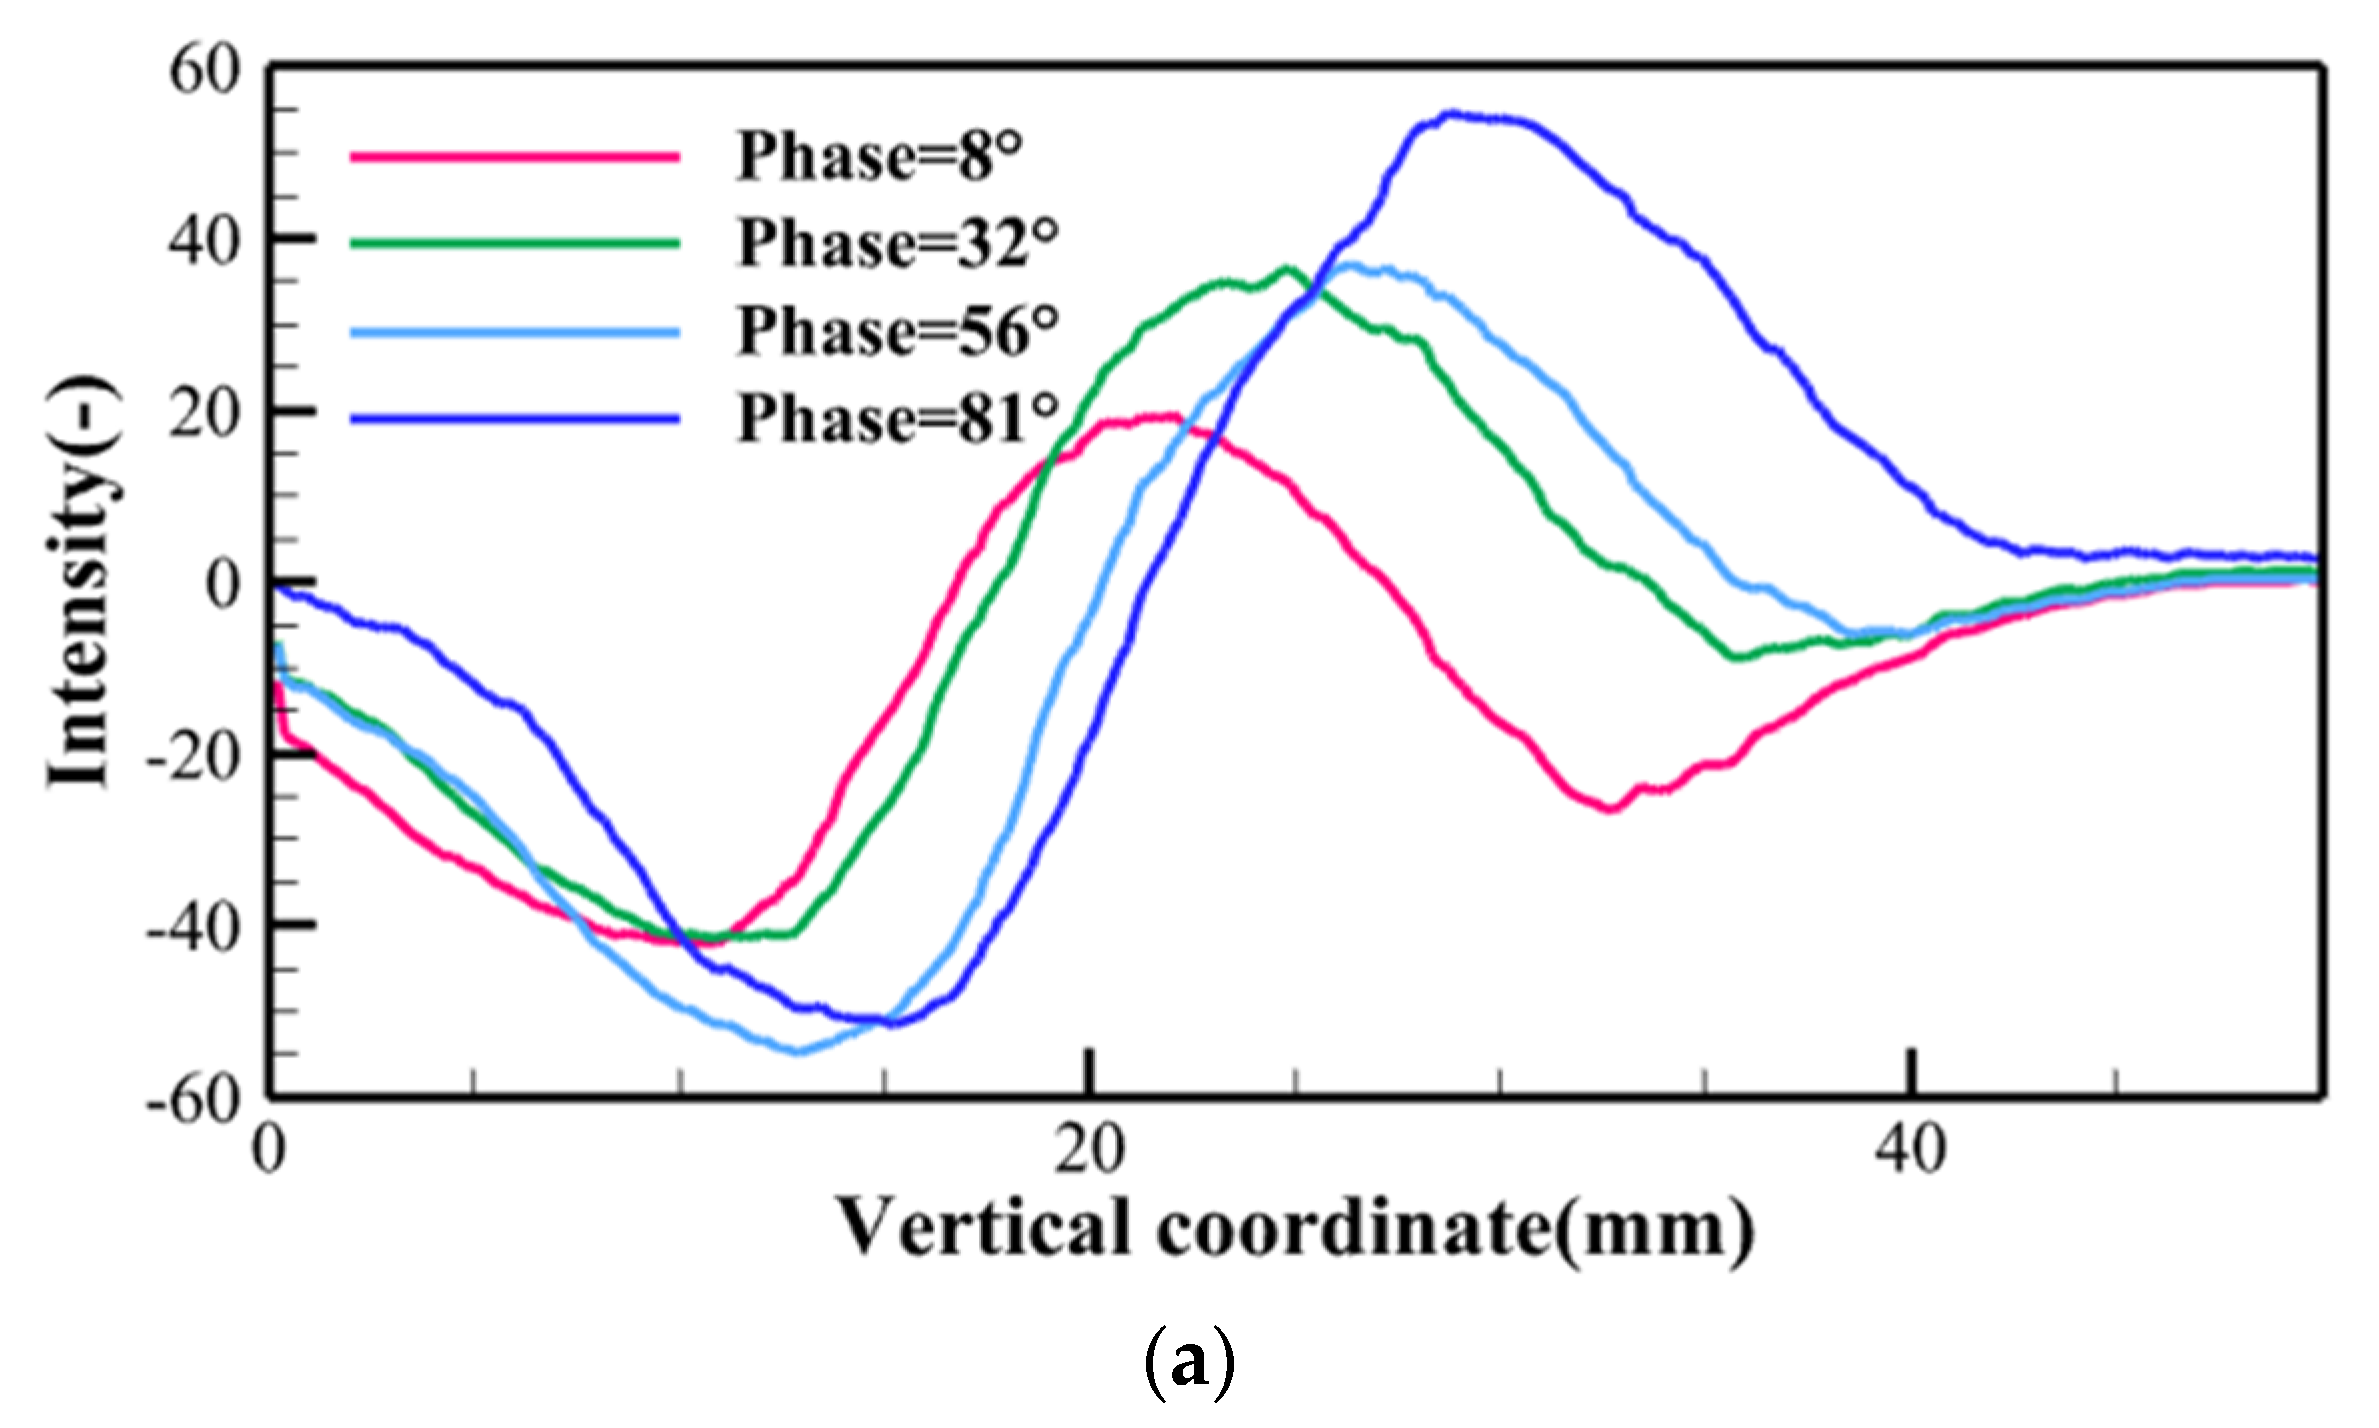
The flame phase-space diagram [48] can better reflect the dynamic characteristics of flame in the two modes. In the phase space diagram, the x-axis represents the axial coordinate of the flame, the y-axis represents the phase of flame pulsation, and the contour lines reflect the variations of flame heat release relative to the mean results. Firstly, an averaged flame in one oscillation cycle was obtained, and the grayscale values in each column were summed to obtain the axial intensity distribution I(j, φ) of the averaged flame at different phases, where j ranges from 0 to 110 mm (with the flame’s root at j = 0) and φ ranges from 0 to 360°. Then, the axial intensity distribution of the averaged flame is subtracted from the result, resulting in I(j,) − (j). This result quantitatively describes the spatiotemporal distribution of axial heat release fluctuations. In the figure, it can be observed that the maximum distance of axial flame pulsation is around 50 mm for both flame pulsation modes. The slope of the peak–valley structure in the phase space satisfies the following equation:
The slope of the peak–valley structure in the phase space is greater in the Ma mode (330 Hz) than in the Mv mode (230 Hz) when the operating conditions remain unchanged, where u represents the convective velocity. Figure 13a also reflects the periodic shedding phenomenon of the vortex ring structure in the Mv mode, where the downstream CH* intensity decreases as the downstream vortex ring structure starts to shed at a phase angle of around 225°.
To further analyze the spatial development patterns of heat release rate fluctuations, the spatial distribution information on the heat release rate fluctuations at different phases was extracted from the flame phase space diagram, as shown in Figure 14. It can be observed that in the Mv mode, during the development of the acoustically induced vortex, the amplitude of heat release rate fluctuations gradually increases with the phase angle. This is mainly due to the fact that as the acoustically induced vortex moves downstream, its intensity and size gradually increase [44], leading to a significant enhancement of chemical reaction rates downstream under the influence of the acoustically induced vortex. On the other hand, in the Ma mode, the heat release rate fluctuations stably propagate downstream with an increasing phase angle, and their amplitudes do not vary with the phase angle. From an energy perspective, the increase in, maintenance of, or decrease in heat release rate fluctuation amplitudes primarily depend on the balance between a system’s acoustic energy gain and dissipation. In the Ma mode, the system satisfies the energy balance relationship between driving energy and dissipative energy, thereby allowing for the stable downstream propagation of heat release rate fluctuations.
In summary, although local maxima of flame transfer function (FTF) gain exist under 230 Hz and 330 Hz acoustic excitations, the underlying physical driving mechanisms are different. The 230 Hz excitation is primarily associated with the formation and development of acoustically induced vortices, resulting in significant variations in flame length. Within one period, the flame continuously stretches and breaks, leading to intense oscillations in the heat release rate. On the other hand, the 330 Hz excitation mainly induces the vigorous fluctuation of the flame surface, strengthening the intensity of the heat release rate fluctuations. From the flame phase space diagram, it can be observed that the heat release rate fluctuations can propagate stably along the axial direction, indicating a balance between driving and dissipative energies in the combustion system.
3.3. Coupling Mechanism
The results of the analysis from the previous section indicate that both flame pulsation modes result in local maxima of flame transfer function gain, with similar levels of gain. However, the pressure pulsation level in the Ma mode is significantly higher than that in the Mv mode. This suggests that although there is a significant interaction between the heat release rate and pressure in the oscillation mode dominated by acoustically induced vortices, a positive feedback relationship that further enhances the intensity of pressure pulsations in the combustor does not seem to have formed. To further analyze the main reasons for this phenomenon, we conducted an analysis from the perspective of coupling in the combustion system.
The Rayleigh Index (RI) [49] can be used to reflect the correlation between heat release rate fluctuations and pressure fluctuations. The calculation expression for the Rayleigh Index is as follows:
In the above expression, T represents the oscillation period, q′ represents heat release rate fluctuations, and p′ represents pressure fluctuations. An RI > 0 indicates that q′ and p′ are in phase within one oscillation period, suggesting the transfer of energy from the flame to the acoustic field. This is a necessary condition (rather than a sufficient condition) [50] for unstable combustion. A larger RI value indicates stronger coupling between heat release rate fluctuations and pressure fluctuations. Conversely, an RI < 0 indicates that they are out of phase. To reduce the impact of random errors on the calculation results, the RI was not directly calculated for a single oscillation period. Instead, the RI was calculated over the duration of the oscillation period (T) and within a data acquisition time window (2 s). The temporal variation in the RI within the 2 s acquisition time was computed, and the average value of the temporal RI results was obtained, which will be referred to as RI1.
Figure 15 illustrates the calculated results regarding RI1 in the combustor under different equivalence ratios and excitation frequencies when u′/u = 0.1. In the figure, it can be observed that, firstly, for most frequencies except for certain low-frequency positions, the RI1 in the combustor is greater than 0 under the excitation amplitude of u′/u = 0.1. Secondly, the frequency–domain distribution of RI1 also exhibits a clear bimodal pattern, with peak values located near 230 Hz and 330 Hz. Lastly, for both flame pulsation modes, the variations in RI1 with the equivalence ratio are starkly different. For the Ma mode, an increase in the equivalence ratio improves combustion stability, resulting in a significant increase in RI1. Conversely, for the Mv mode, where the generation and development of acoustically induced vortices are primarily related to flow field fluctuations, the influence of the equivalence ratio is relatively small, making RI1 less sensitive to changes in the equivalence ratio.
In practical combustion systems, the coupling process between “heat” and “sound” is often closely related to processes such as flow, mixing, and combustion, as shown in Figure 16 [51]. The entire combustion process involves numerous physical sub-processes and interactions between the flame, the combustor, and fuel pipelines. From the perspective of system feedback, fluctuations in the heat release rate, pressure, and fuel flow constitute important components of the thermoacoustic oscillation feedback loop under the influence of acoustic waves, entropy waves, and other factors.
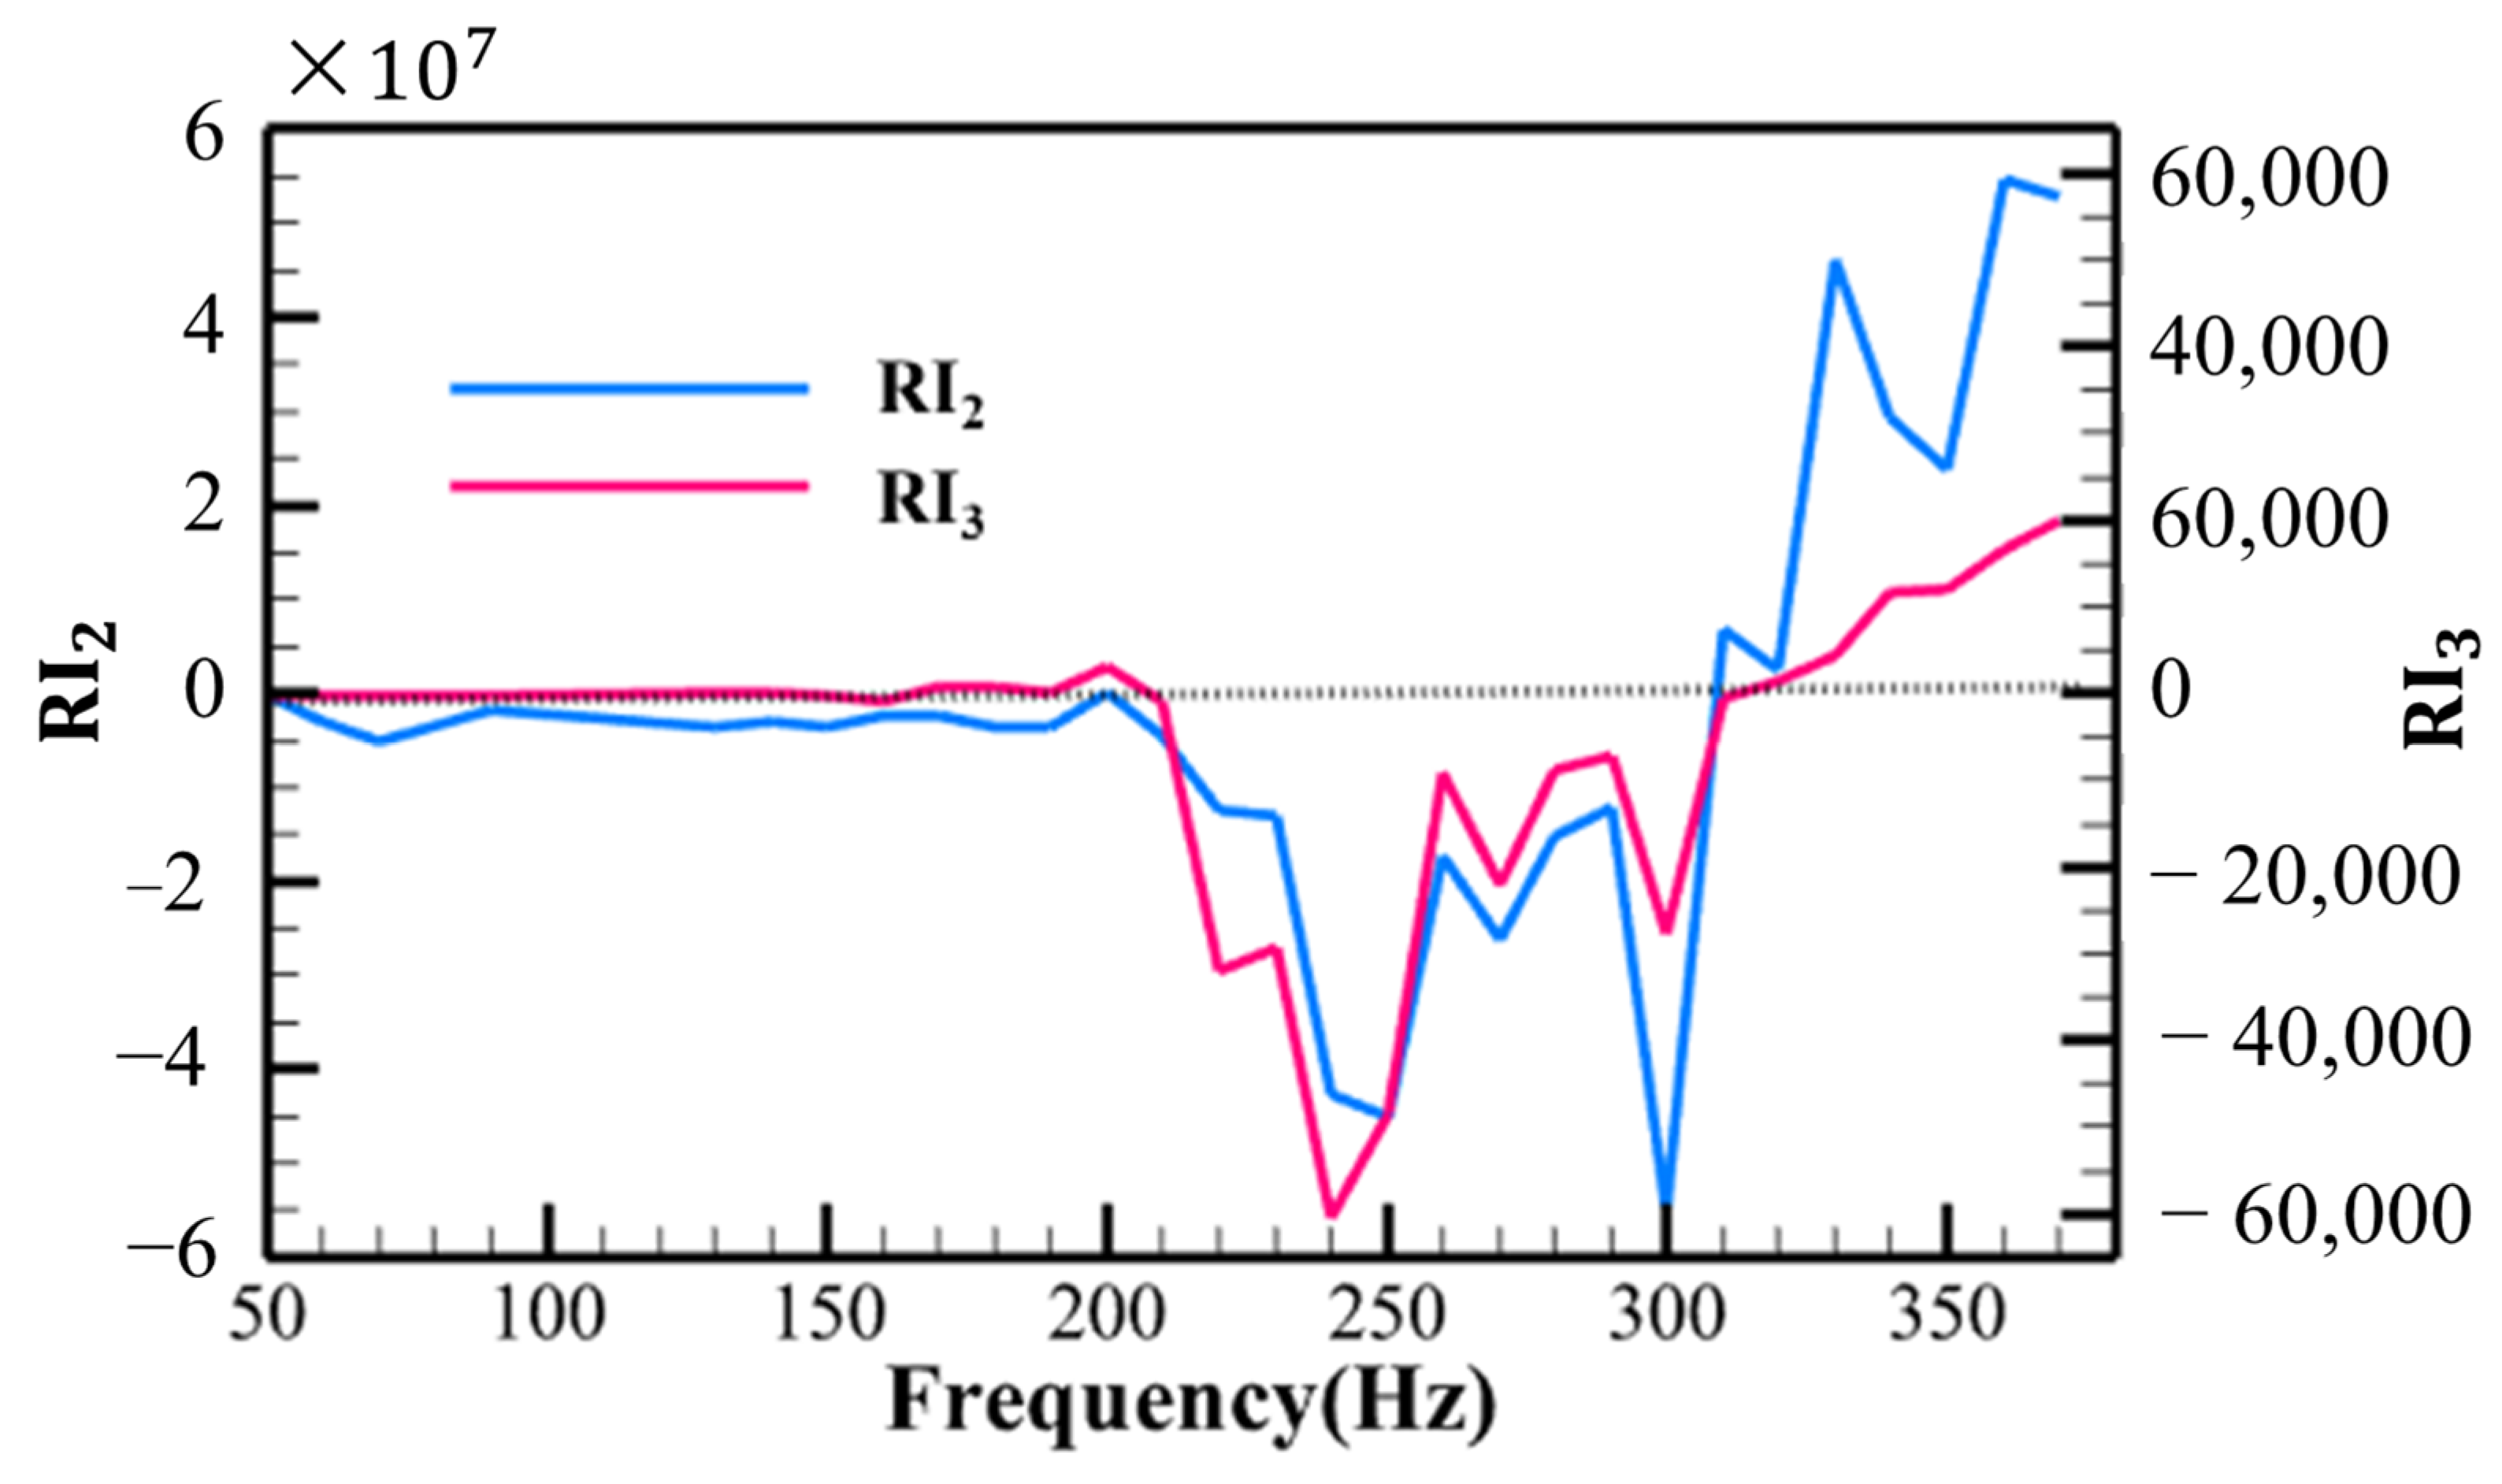
In order to quantitatively determine the coupling relationship between heat release rate fluctuations (), pressure fluctuations (), and fuel flow fluctuations () and analyze the potential feedback loops in the system, the Rayleigh integrals were calculated in this study. At Re = 12,058 and Φ = 0.248, the Rayleigh indices (RI2 and RI3) between and , as well as those between and , were computed for both oscillation modes, as shown in Figure 17. Based on Figure 17, it can be observed that in the Ma mode, RI2 > 0 and RI3 > 0, indicating the formation of a complete feedback loop between the flame, the combustor, and fuel pipelines under the modulation of 330 Hz acoustic disturbances, leading to limit cycle oscillations in the combustor. On the other hand, in the Mv mode, although there is an in-phase relationship between heat release rate fluctuations and pressure fluctuations (RI1 > 0), RI2 < 0 and RI3 < 0, indicating the incomplete feedback loop between the combustor and fuel pipelines. Consequently, the amplitude of pressure fluctuations is relatively lower compared to that in the Ma mode.
4. Conclusions
The flame response characteristics of lean, non-premixed swirl flames were investigated in this study, focusing on a model combustor. Experimental research was conducted by analyzing pressure fluctuations, heat release fluctuations, and instantaneous flame images. Two distinct physical mechanisms that cause significant fluctuations in the heat release of the combustor were identified. This discovery offers a novel perspective for a comprehensive understanding of flame response characteristics. The main research conclusions of this paper are summarized as follows: The flame transfer function (FTF) of a swirl non-premixed flame exhibits a significant bimodal shape in the gain curve when the velocity disturbance level u′/u = 0.1. Gain peaks are observed at around 230 Hz and 330 Hz. The sensitivities of these peaks to changes in the equivalence ratio are different. When the inlet velocity is kept constant, increasing the equivalence ratio causes the peak gain near 230 Hz to shift upward, while the peak near 330 Hz shows no significant change. Moreover, variations in the equivalence ratio do not significantly affect the shape of the FTF phase curve. For an inlet velocity of 3.8 m/s, the system has a time delay of approximately 30.62 ms. When the equivalence ratio is held constant and the inlet velocity is increased, the bimodal gain peaks shift to the right, and the slope of the phase curve decreases.
The bimodal peaks in the gain curve correspond to two distinct flame oscillation modes, indicating that there are at least two physical mechanisms causing significant fluctuations in heat release in the combustor. The peak gain near 230 Hz is associated with the acoustically induced vortices formed at the exit of the swirlers, where the flame length undergoes significant variations within one period. A pronounced curling effect at the flame tip can be observed in the phase angle range of 135°–180°, leading to a significant increase in the surface area of the flame tip and thus enhancing the heat release rate. The flame surface exhibits intermittency, resulting in local maxima of the heat release rate fluctuation amplitude.
The peak gain near 330 Hz is associated with the acoustic modes of the system, and it is close to the first-order axial oscillation frequency (324 Hz) in the combustor. In this Ma mode, the flame front undergoes continuous oscillations. Through flame phase space analysis, it was observed that the system satisfies the energy balance relationship between driving and dissipation, allowing for the stable downstream propagation of heat release rate perturbations.
The experimental measurements also indicate that although both oscillation modes result in local maxima of FTF gain and have similar levels of gain, the pressure pulsation level in the Ma mode is significantly higher than that in the Mv mode. By calculating the Rayleigh indices between pressure fluctuation, fuel pressure fluctuation, and heat release rate fluctuation, it was found that for the Ma mode, RI1, RI2, and RI3 are all positive, indicating the formation of a complete feedback loop between the flame, the combustor, and the fuel pipeline under the modulation of the 330 Hz acoustic disturbance, leading to limit cycle oscillations in the combustor. On the other hand, for the Mv mode excited at 230 Hz, both RI2 and RI3 were negative, indicating that a complete feedback loop had not been formed between the combustor and the fuel pipeline. Therefore, although the strong fluctuation of flame length in this oscillation mode results in a local maximum of FTF gain, it does not further drive pressure fluctuation to form limit cycle oscillations.
Author Contributions
Conceptualization, C.Y. and Y.L.; methodology, X.Z. and C.L.; writing—original draft, C.Y.; resources, Y.L.; formal analysis, C.Y. and H.L.; investigation, X.G. and F.J.; project administration, Y.L.; software, H.L.; supervision, Y.L. and F.J.; validation, X.Z. and C.L.; writing—review and editing, Y.L. and F.J. All authors have read and agreed to the published version of the manuscript.
Funding
This research received no external funding.
Data Availability Statement
The data that support the findings of this study are available from the corresponding author upon reasonable request.
Conflicts of Interest
The authors declare no conflict of interest.
References
- Sun, X.; Zhang, G.; Wang, X.; Li, L.; Deng, X.; Cheng, R. Research Progress on Prediction and Control of Combustion Instability in Aeroengines. Acta Aeronaut. Astronaut. Sin. 2023, 44, 1–20. (In Chinese) [Google Scholar]
- O’Connor, J. Understanding the Role of Flow Dynamics in Thermoacoustic Combustion Instability. Proc. Combust. Inst. 2023, 39, 4583–4610. [Google Scholar] [CrossRef]
- Liu, Y.; Yan, Y.; Li, J. Sinusoidal Approximation Active Control for Combustion Oscillation. In Proceedings of the 25th AIAA/CEAS Aeroacoustics Conference, Nanjing, China, 20–23 May 2019. [Google Scholar]
- Litvinov, I.; Yoon, J.; Noren, C.; Stöhr, M.; Boxx, I.; Geigle, K.P. Time-resolved study of mixing and reaction in an aero-engine model combustor at increased pressure. Combust. Flame 2021, 231, 111474. [Google Scholar] [CrossRef]
- Tyagi, A.; Boxx, I.; Peluso, S.; O’Connor, J. The Role of Flow Interaction in Flame-Flame Interaction Events in a Dual Burner Experiment. Proc. Combust. Inst. 2019, 37, 2485–2491. [Google Scholar] [CrossRef]
- Ghani, A.; Steinbacher, T.; Albayrak, A.; Polifke, W. Intrinsic Thermo-Acoustic Feedback Loop in Turbulent Spray Flames. Combust. Flame 2019, 205, 22–32. [Google Scholar] [CrossRef]
- Sakaki, K.; Funahashi, T.; Nakaya, S.; Tsue, M.; Kanai, R.; Suzuki, K.; Inagawa, T.; Hiraiwa, T. Longitudinal Combustion Instability of a Pintle Injector for a Liquid Rocket Engine Combustor. Combust. Flame 2018, 194, 115–127. [Google Scholar] [CrossRef]
- Tan, W. Study on Thermoacoustic Coupling Characteristics of Model Afterburner. Master’s Thesis, Nanjing University of Aeronautics and Astronautics, Nanjing, China, 2015. (In Chinese). [Google Scholar]
- Tachibana, S.; Saito, K.; Yamamoto, T.; Makida, M.; Kitano, T.; Kurose, R. Experimental and Numerical Investigation of Thermo-Acoustic Instability in a Liquid-Fuel Aero-Engine Combustor at Elevated Pressure: Validity of Large-Eddy Simulation of Spray Combustion. Combust. Flame 2015, 162, 2621–2637. [Google Scholar] [CrossRef]
- Erickson, R.R.; Soteriou, M.C. The Influence of Reactant Temperature on the Dynamics of Bluff Body Stabilized Premixed Flames. Combust. Flame 2011, 158, 2441–2457. [Google Scholar] [CrossRef]
- Wang, H.; Wang, Z.; Sun, M.; Qin, N. Large-Eddy/Reynolds-Averaged Navier–Stokes Simulation of Combustion Oscillations in a Cavity-Based Supersonic Combustor. Int. J. Hydrogen Energy 2013, 38, 5918–5927. [Google Scholar] [CrossRef]
- Palies, P.; Durox, D.; Schuller, T.; Candel, S. Experimental Study on the Effect of Swirler Geometry and Swirl Number on Flame Describing Functions. Int. J. Hydrogen Energy 2011, 183, 704–717. [Google Scholar] [CrossRef]
- Han, X.; Morgans, A.S. Simulation of the Flame Describing Function of a Turbulent Premixed Flame Using an Open-Source LES Solver. Combust. Flame 2015, 162, 1778–1792. [Google Scholar] [CrossRef]
- Kim, T.; Ahn, M.; Lim, D.; Yoon, Y. Flame Describing Function and Combustion Instability Analysis of Non-Premixed Coaxial Jet Flames. Exp. Therm. Fluid Sci. 2022, 136, 110642. [Google Scholar] [CrossRef]
- Haeringer, M.; Merk, M.; Polifke, W. Inclusion of Higher Harmonics in the Flame Describing Function for Predicting Limit Cycles of Self-Excited Combustion Instabilities. Proc. Combust. Inst. 2019, 37, 5255–5262. [Google Scholar] [CrossRef]
- Silva, C.F.; Nicoud, F.; Schuller, T.; Durox, D.; Candel, S. Combining a Helmholtz Solver with the Flame Describing Function to Assess Combustion Instability in a Premixed Swirled Combustor. Combust. Flame 2013, 160, 1743–1754. [Google Scholar] [CrossRef]
- Ni, F.; Nicoud, F.; Méry, Y.; Staffelbach, G. Including Flow–Acoustic Interactions in the Helmholtz Computations of Industrial Combustors. AIAA J 2018, 56, 4815–4829. [Google Scholar] [CrossRef]
- Æsøy, E.; Nygård, H.T.; Worth, N.A.; Dawson, J.R. Tailoring the Gain and Phase of the Flame Transfer Function through Targeted Convective-Acoustic Interference. Combust. Flame 2022, 236, 111813. [Google Scholar] [CrossRef]
- Liu, W.; Zhang, L.; Xue, R.; Yang, Q.; Wang, H. Experimental Investigation on Nonlinear Response of a Low-Swirl Flame to Acoustic Excitation with Large Amplitude. J. Eng. Gas Turbines Power 2021, 143, 121201. [Google Scholar] [CrossRef]
- Wang, G.; Zheng, J.; Li, L.; Liu, X.; Qi, F. Relationship of Gain and Phase in the Transfer Function of Swirling Flames. Proc. Combust. Inst. 2021, 38, 6173–6182. [Google Scholar] [CrossRef]
- Yoon, J.; Joo, S.; Kim, J.; Lee, M.C.; Lee, J.G.; Yoon, Y. Effects of Convection Time on the High Harmonic Combustion Instability in a Partially Premixed Combustor. Proc. Combust. Inst. 2017, 36, 3753–3761. [Google Scholar] [CrossRef]
- Hermeth, S.; Staffelbach, G.; Gicquel, L.Y.M.; Anisimov, V.; Cirigliano, C.; Poinsot, T. Bistable Swirled Flames and Influence on Flame Transfer Functions. Combust. Flame 2014, 161, 184–196. [Google Scholar] [CrossRef]
- Mejia, D.; Miguel-Brebion, M.; Ghani, A.; Kaiser, T.; Duchaine, F.; Selle, L.; Poinsot, T. Influence of Flame-Holder Temperature on the Acoustic Flame Transfer Functions of a Laminar Flame. Combust. Flame 2018, 188, 5–12. [Google Scholar] [CrossRef]
- Kaiser, T.L.; Öztarlik, G.; Selle, L.; Poinsot, T. Impact of Symmetry Breaking on the Flame Transfer Function of a Laminar Premixed. Proc. Combust. Inst. 2019, 37, 1953–1960. [Google Scholar] [CrossRef]
- Huber, A.; Polifke, W. Dynamics of Practical Premixed Flames, Part II: Identification and Interpretation of CFD Data. Int. J. Spray Combust. Dyn. 2009, 1, 229–249. [Google Scholar] [CrossRef]
- Lee, M.; Kim, K.T.; Gupta, V.; Li, L.K. System Identification and Early Warning Detection of Thermoacoustic Oscillations in a Turbulent Combustor Using Its Noise-Induced Dynamics. Proc. Combust. Inst. 2021, 38, 6025–6033. [Google Scholar] [CrossRef]
- Zhu, R.; Pan, D.; Ji, C.; Zhu, T.; Lu, P.; Gao, H. Combustion Instability Analysis on a Partially Premixed Swirl Combustor by Thermoacoustic Experiments and Modeling. Energy 2020, 211, 118884. [Google Scholar] [CrossRef]
- Æsøy, E.; Aguilar, J.G.; Wiseman, S.; Bothien, M.R.; Worth, N.A.; Dawson, J.R. Scaling and Prediction of Transfer Functions in Lean Premixed H2/CH4-Flames. Combust. Flame 2020, 215, 269–282. [Google Scholar] [CrossRef]
- Polifke, W.; Kopitz, J.; Serbanoviv, A. Impact of the Fuel Time Lag Distribution in Elliptical Premix Nozzles on Combustion Stability. In Proceedings of the 7th AIAA/CEAS Aeroacoustics Conference and Exhibit, Garching, Germany, 28–30 May 2001. [Google Scholar]
- Dupuy, F.; Gatti, M.; Mirat, C.; Gicquel, L.; Nicoud, F.; Schuller, T. Combining Analytical Models and LES Data to Determine the Transfer Function from Swirled Premixed Flames. Combust. Flame 2020, 217, 222–236. [Google Scholar] [CrossRef]
- You, D.; Huang, Y.; Yang, V. A Generalized Model of Acoustic Response of Turbulent Premixed Flame and Its Application to Gas-Turbine Combustion Instability Analysis. Combust. Sci. Technol. 2005, 177, 1109–1150. [Google Scholar] [CrossRef]
- Orchini, A.; Juniper, M.P. Linear Stability and Adjoint Sensitivity Analysis of Thermoacoustic Networks with Premixed Flames. Combust. Flame 2016, 165, 97–108. [Google Scholar] [CrossRef]
- Xu, Z. Basic Research on the Effects of Active Disturbance on Non-Premixed Combustion. Ph.D. Thesis, Zhejiang University, Hangzhou, China, 2022. (In Chinese). [Google Scholar]
- Huang, Y. Mechanism and Control of Thermoacoustic Instability in Non-Premixed Swirling Combustion. Ph.D. Thesis, Zhejiang University, Hangzhou, China, 2016. (In Chinese). [Google Scholar]
- Wiseman, S.; Gruber, A.; Dawson, J.R. Flame Transfer Functions for Turbulent, Premixed, Ammonia-Hydrogen-Nitrogen-Air Flames. J. Eng. Gas Turbines Power 2023, 145, 031015. [Google Scholar] [CrossRef]
- Vance, F.H.; Alanyalıoğlu, Ç.; Hasse, C. Analysis of Lewis number effects on dynamic response of laminar premixed flames. Combust. Flame 2023, 248, 112508. [Google Scholar] [CrossRef]
- Flores, E.; Muntean, V.; Pozo-Estivariz, D.; Martínez-Ruiz, D. Thermoacoustic coupling regions of premixed-flames in non-adiabatic tubes. Combust. Flame 2023, 247, 112478. [Google Scholar] [CrossRef]
- Huang, Y.; Yang, V. Dynamics and Stability of Lean-Premixed Swirl-Stabilized Combustion. Prog. Energy Combust. Sci. 2009, 35, 293–364. [Google Scholar] [CrossRef]
- Åbom, M.; Bodén, H. Error Analysis of Two-Microphone Measurements in Ducts with Flow. J. Acoust. Soc. Am. 1988, 83, 2429–2438. [Google Scholar] [CrossRef]
- Nori, V.N.; Seitzman, J.M. CH* Chemiluminescence Modeling for Combustion Diagnostics. Proc. Combust. Inst. 2009, 32, 895–903. [Google Scholar] [CrossRef]
- Ahn, M.; Kim, T.; Yoon, Y. Comparison of Flame Response Characteristics between Non-Premixed and Premixed Flames under Acoustic Excitation. Exp. Therm. Fluid Sci. 2022, 139, 110707. [Google Scholar] [CrossRef]
- Liu, Y.; Li, J.; Han, Q.; Yan, Y. Study of Combustion Oscillation Mechanism and Flame Image Processing. AIAA J. 2019, 57, 824–835. [Google Scholar] [CrossRef]
- Keefer, D.R.; Smith, L.M.; Sudharsanan, S.I. Abel Inversion Using Transform Techniques. J. Quant. Spectrosc. Radiat. Transf. 1988, 39, 367–373. [Google Scholar]
- Liu, X.; Wang, G. Experimental Study of Periodic Flow Structure of Swirling Flames under Strong Acoustic Excitation. Exp. Fluid Mech. 2020, 34, 53–60. (In Chinese) [Google Scholar]
- Ge, Y.; Li, S.; Wei, X. Analysis of Laminar Diffusion Flame Combustion Instability Phenomena Using Phase Space Reconstruction Method. J. Eng. Thermophys. 2020, 41, 1550–1555. (In Chinese) [Google Scholar]
- Jiang, A.; Zhou, P.; Zhang, Y.; Hua, H. Improvement of Delay Time Mutual Information Algorithm for Phase Space Reconstruction. J. Vib. Shock 2015, 34, 79–84. (In Chinese) [Google Scholar]
- Han, M. Chaos Time Series Prediction Theory and Methods; China Water & Power Press: BeiJing, China, 2007. (In Chinese) [Google Scholar]
- Palies, P.; Durox, D.; Schuller, T.; Candel, S. The Combined Dynamics of Swirler and Turbulent Premixed Swirling Flames. Combust. Flame 2010, 157, 1698–1717. [Google Scholar] [CrossRef]
- Culick, F.E.C. Nonlinear Behavior of Acoustic Waves in Combustors—II. Acta Astronaut. 1976, 3, 735–757. [Google Scholar] [CrossRef]
- Gao, L. Study on Self-Excited Oscillations of Methane Premixed Flames under Open Space Conditions. Ph.D. Thesis, Chongqing University, Chongqing, China, 2021. (In Chinese). [Google Scholar]
- Wang, Y.; Zhu, M. Flame Dynamics and Its Influence on Thermoacoustic Stability. J. Tsinghua Univ. (Sci. Technol.) 2022, 62, 785–793. (In Chinese) [Google Scholar]
Figure 1.
Experimental setup.

Figure 2.
Structural sketch of swirler: (a) swirler’s structure; (b) geometry of the injection unit.
Figure 2.
Structural sketch of swirler: (a) swirler’s structure; (b) geometry of the injection unit.
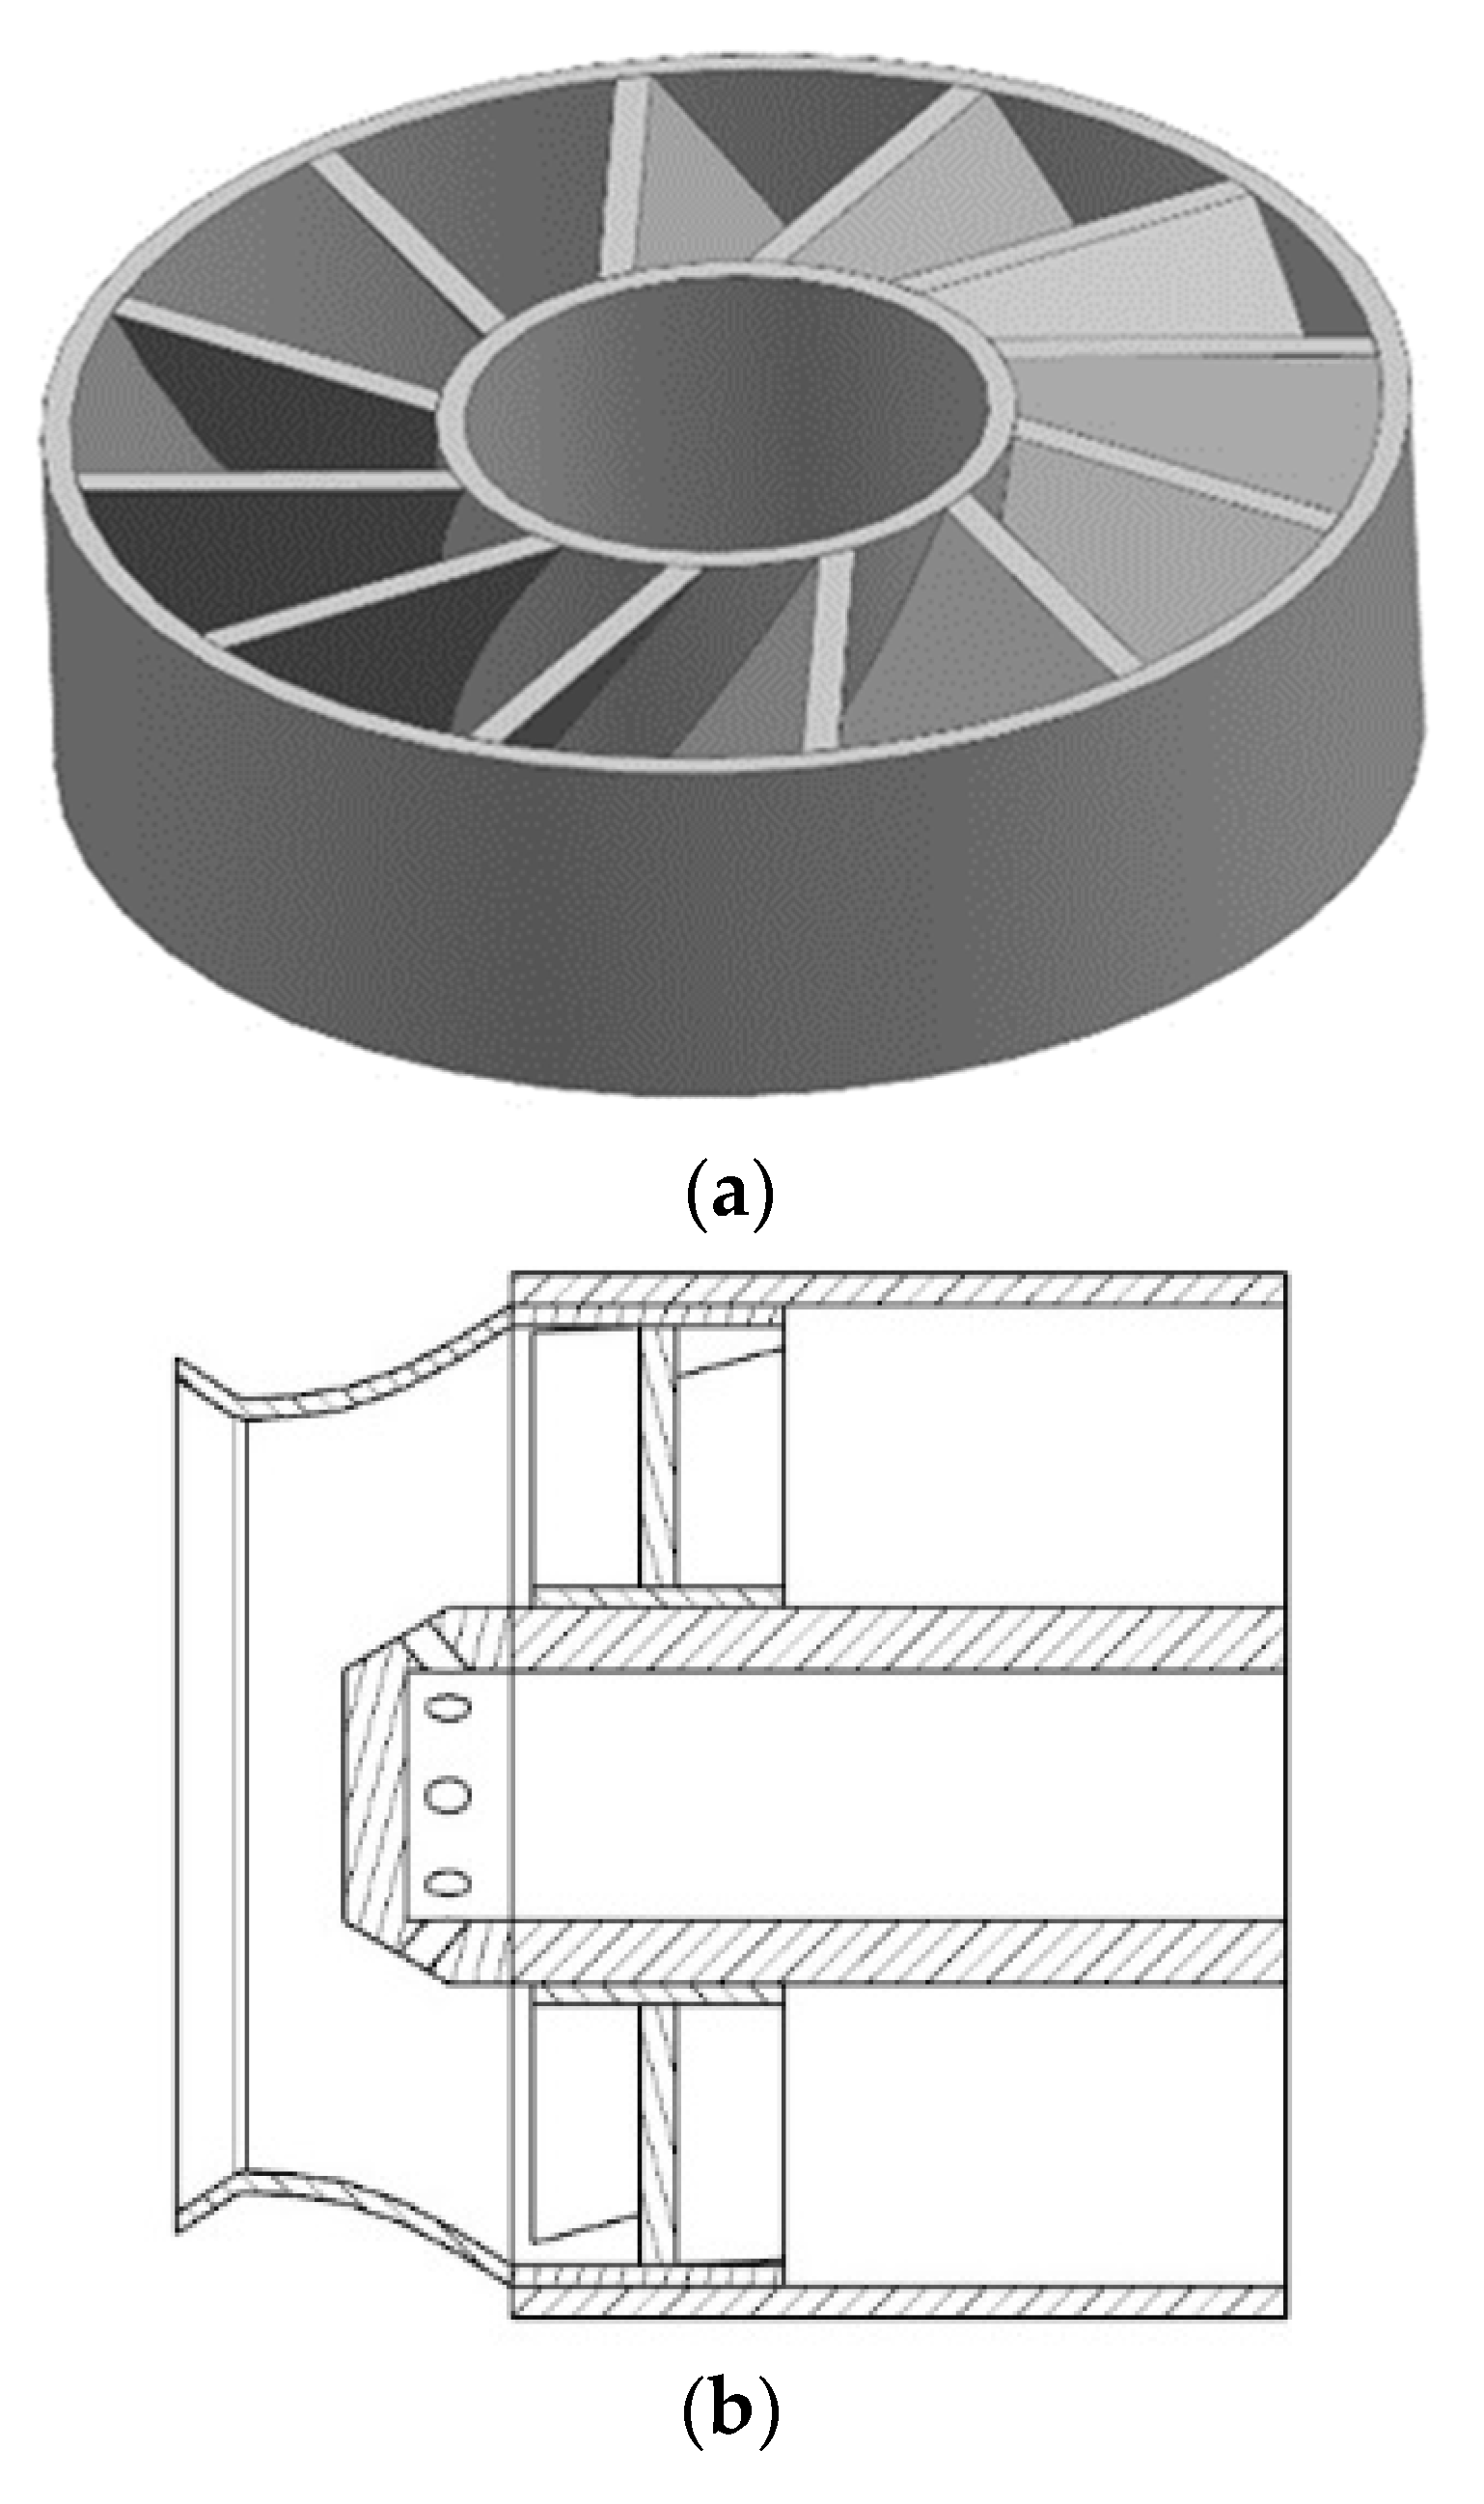
Figure 3.
Verification of two-microphone method: (a) measurement results for hot wire anemometer; (b) velocity pulsation spectrum (hot wire); (c) velocity pulsation spectrum (two-microphone method).
Figure 3.
Verification of two-microphone method: (a) measurement results for hot wire anemometer; (b) velocity pulsation spectrum (hot wire); (c) velocity pulsation spectrum (two-microphone method).
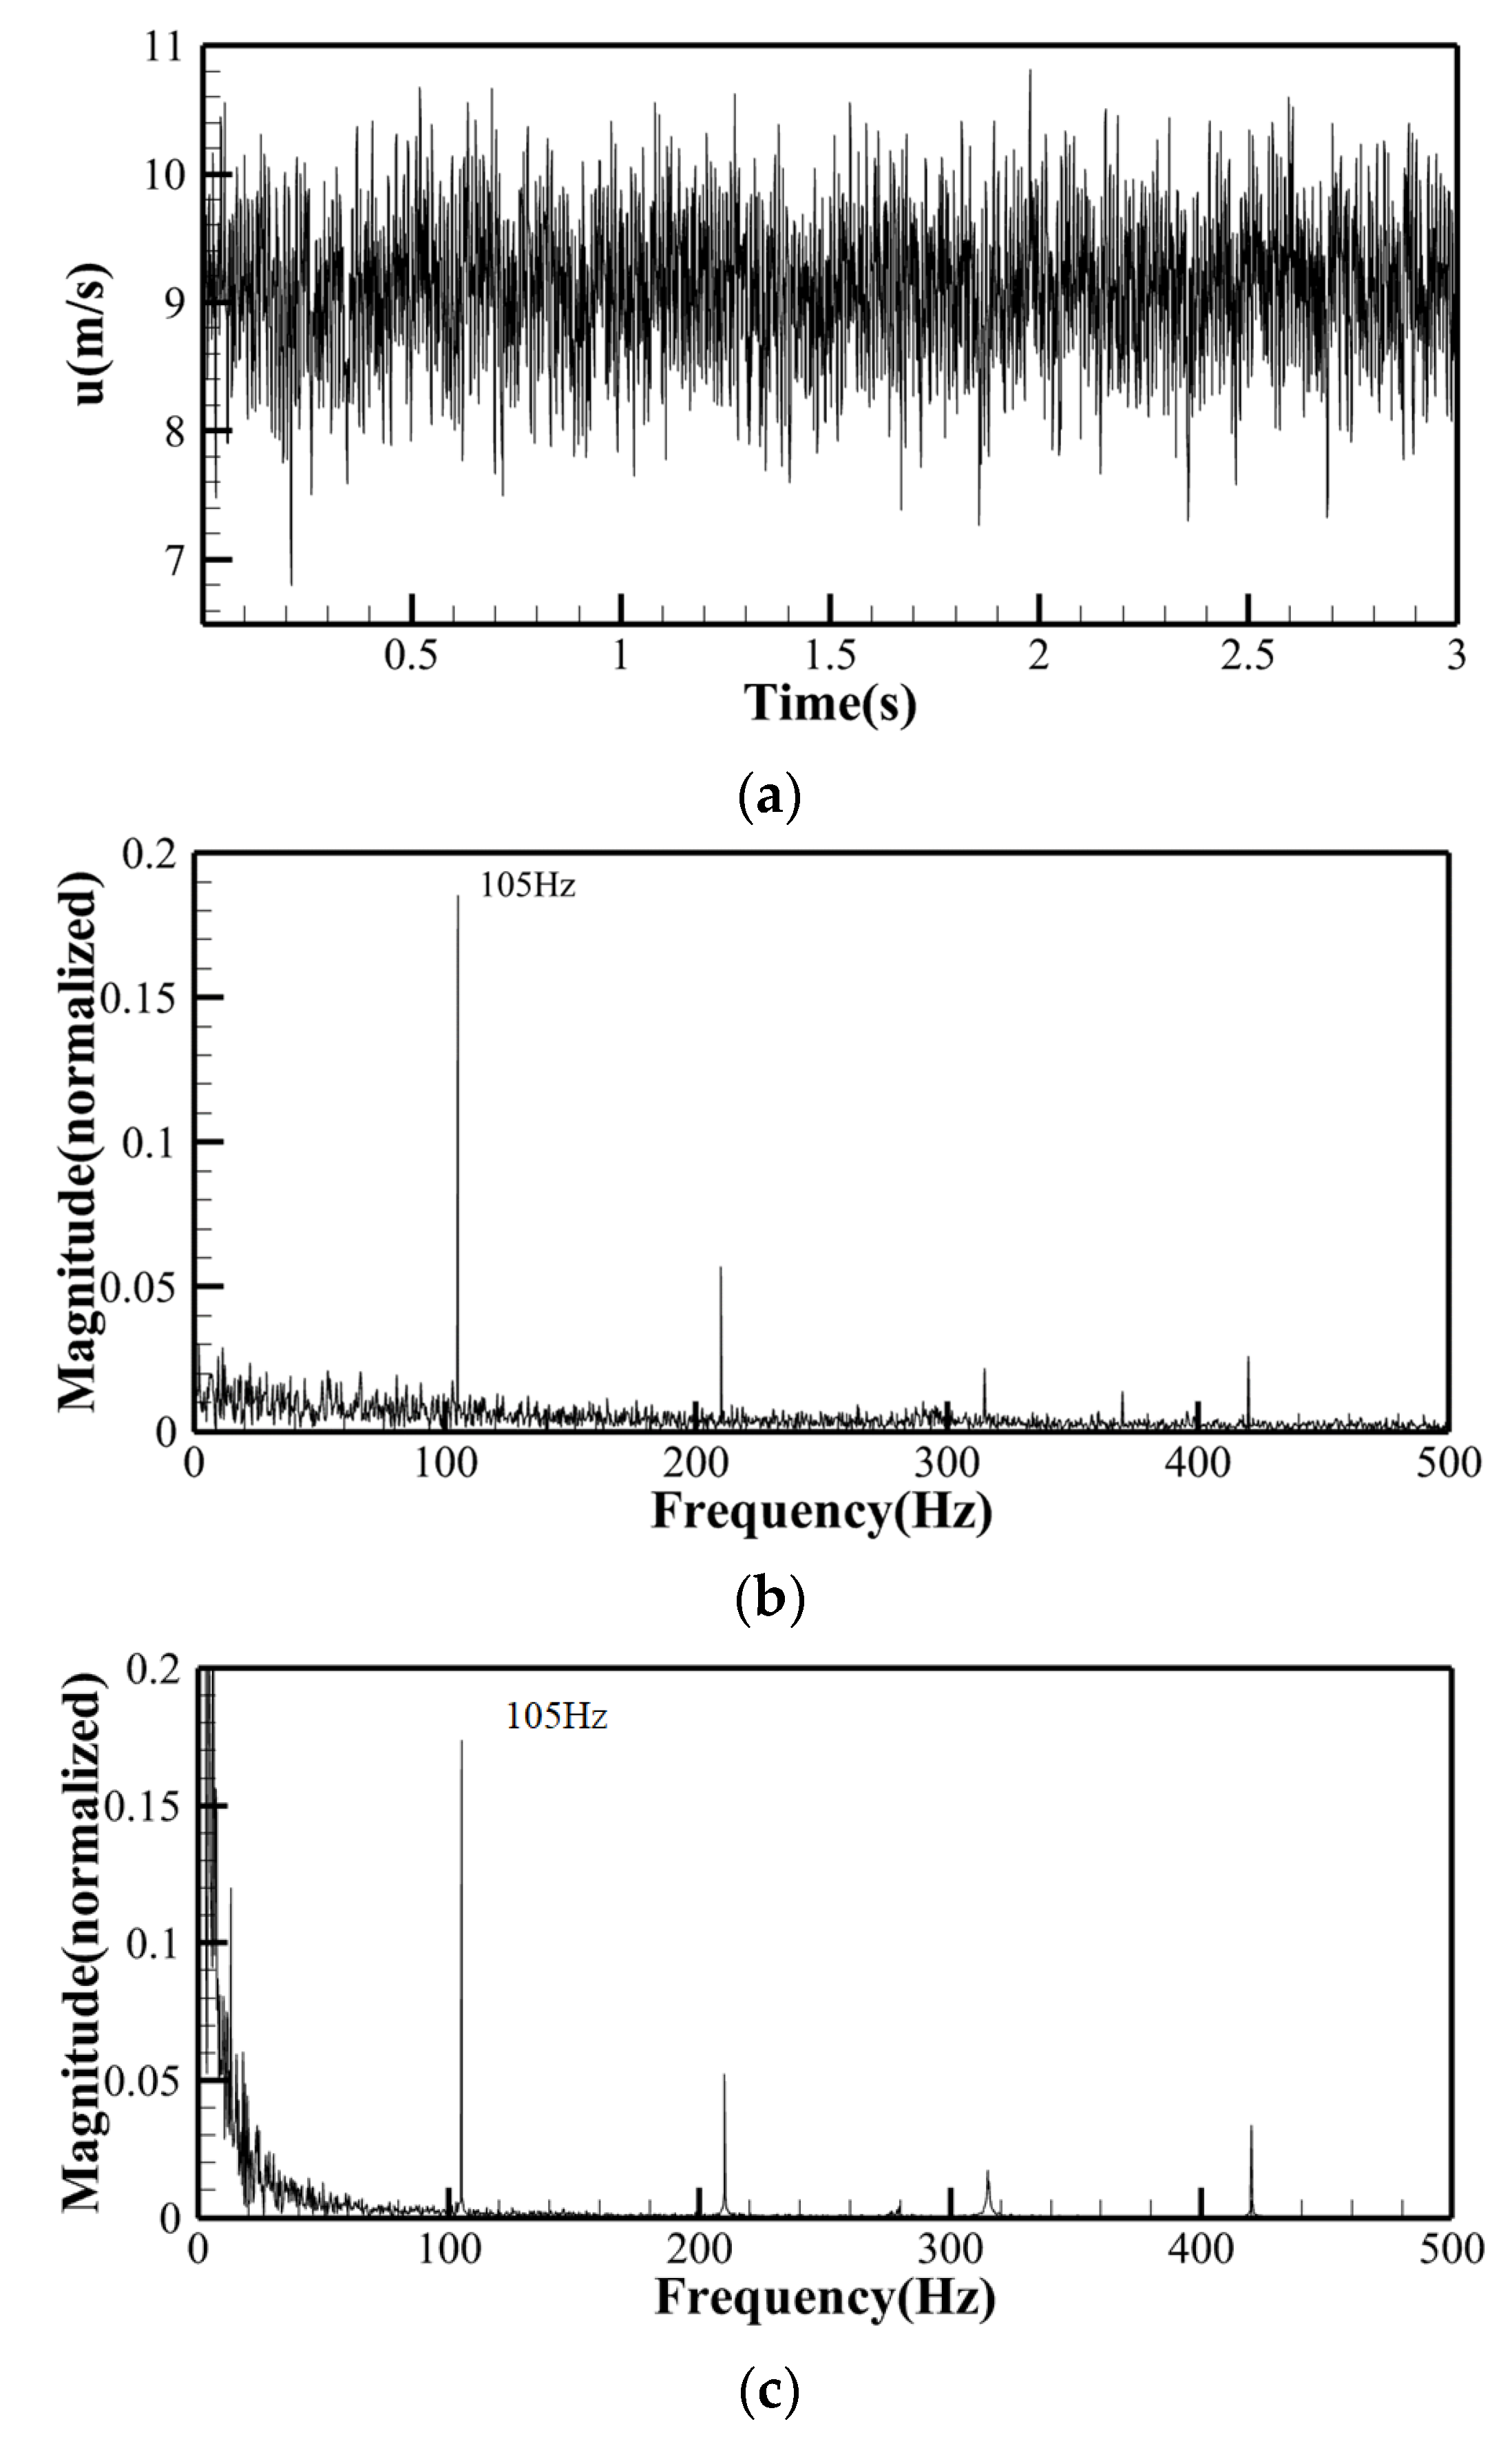
Figure 4.
Comparison of measurement results between hot wire anemometer and two-microphone method.
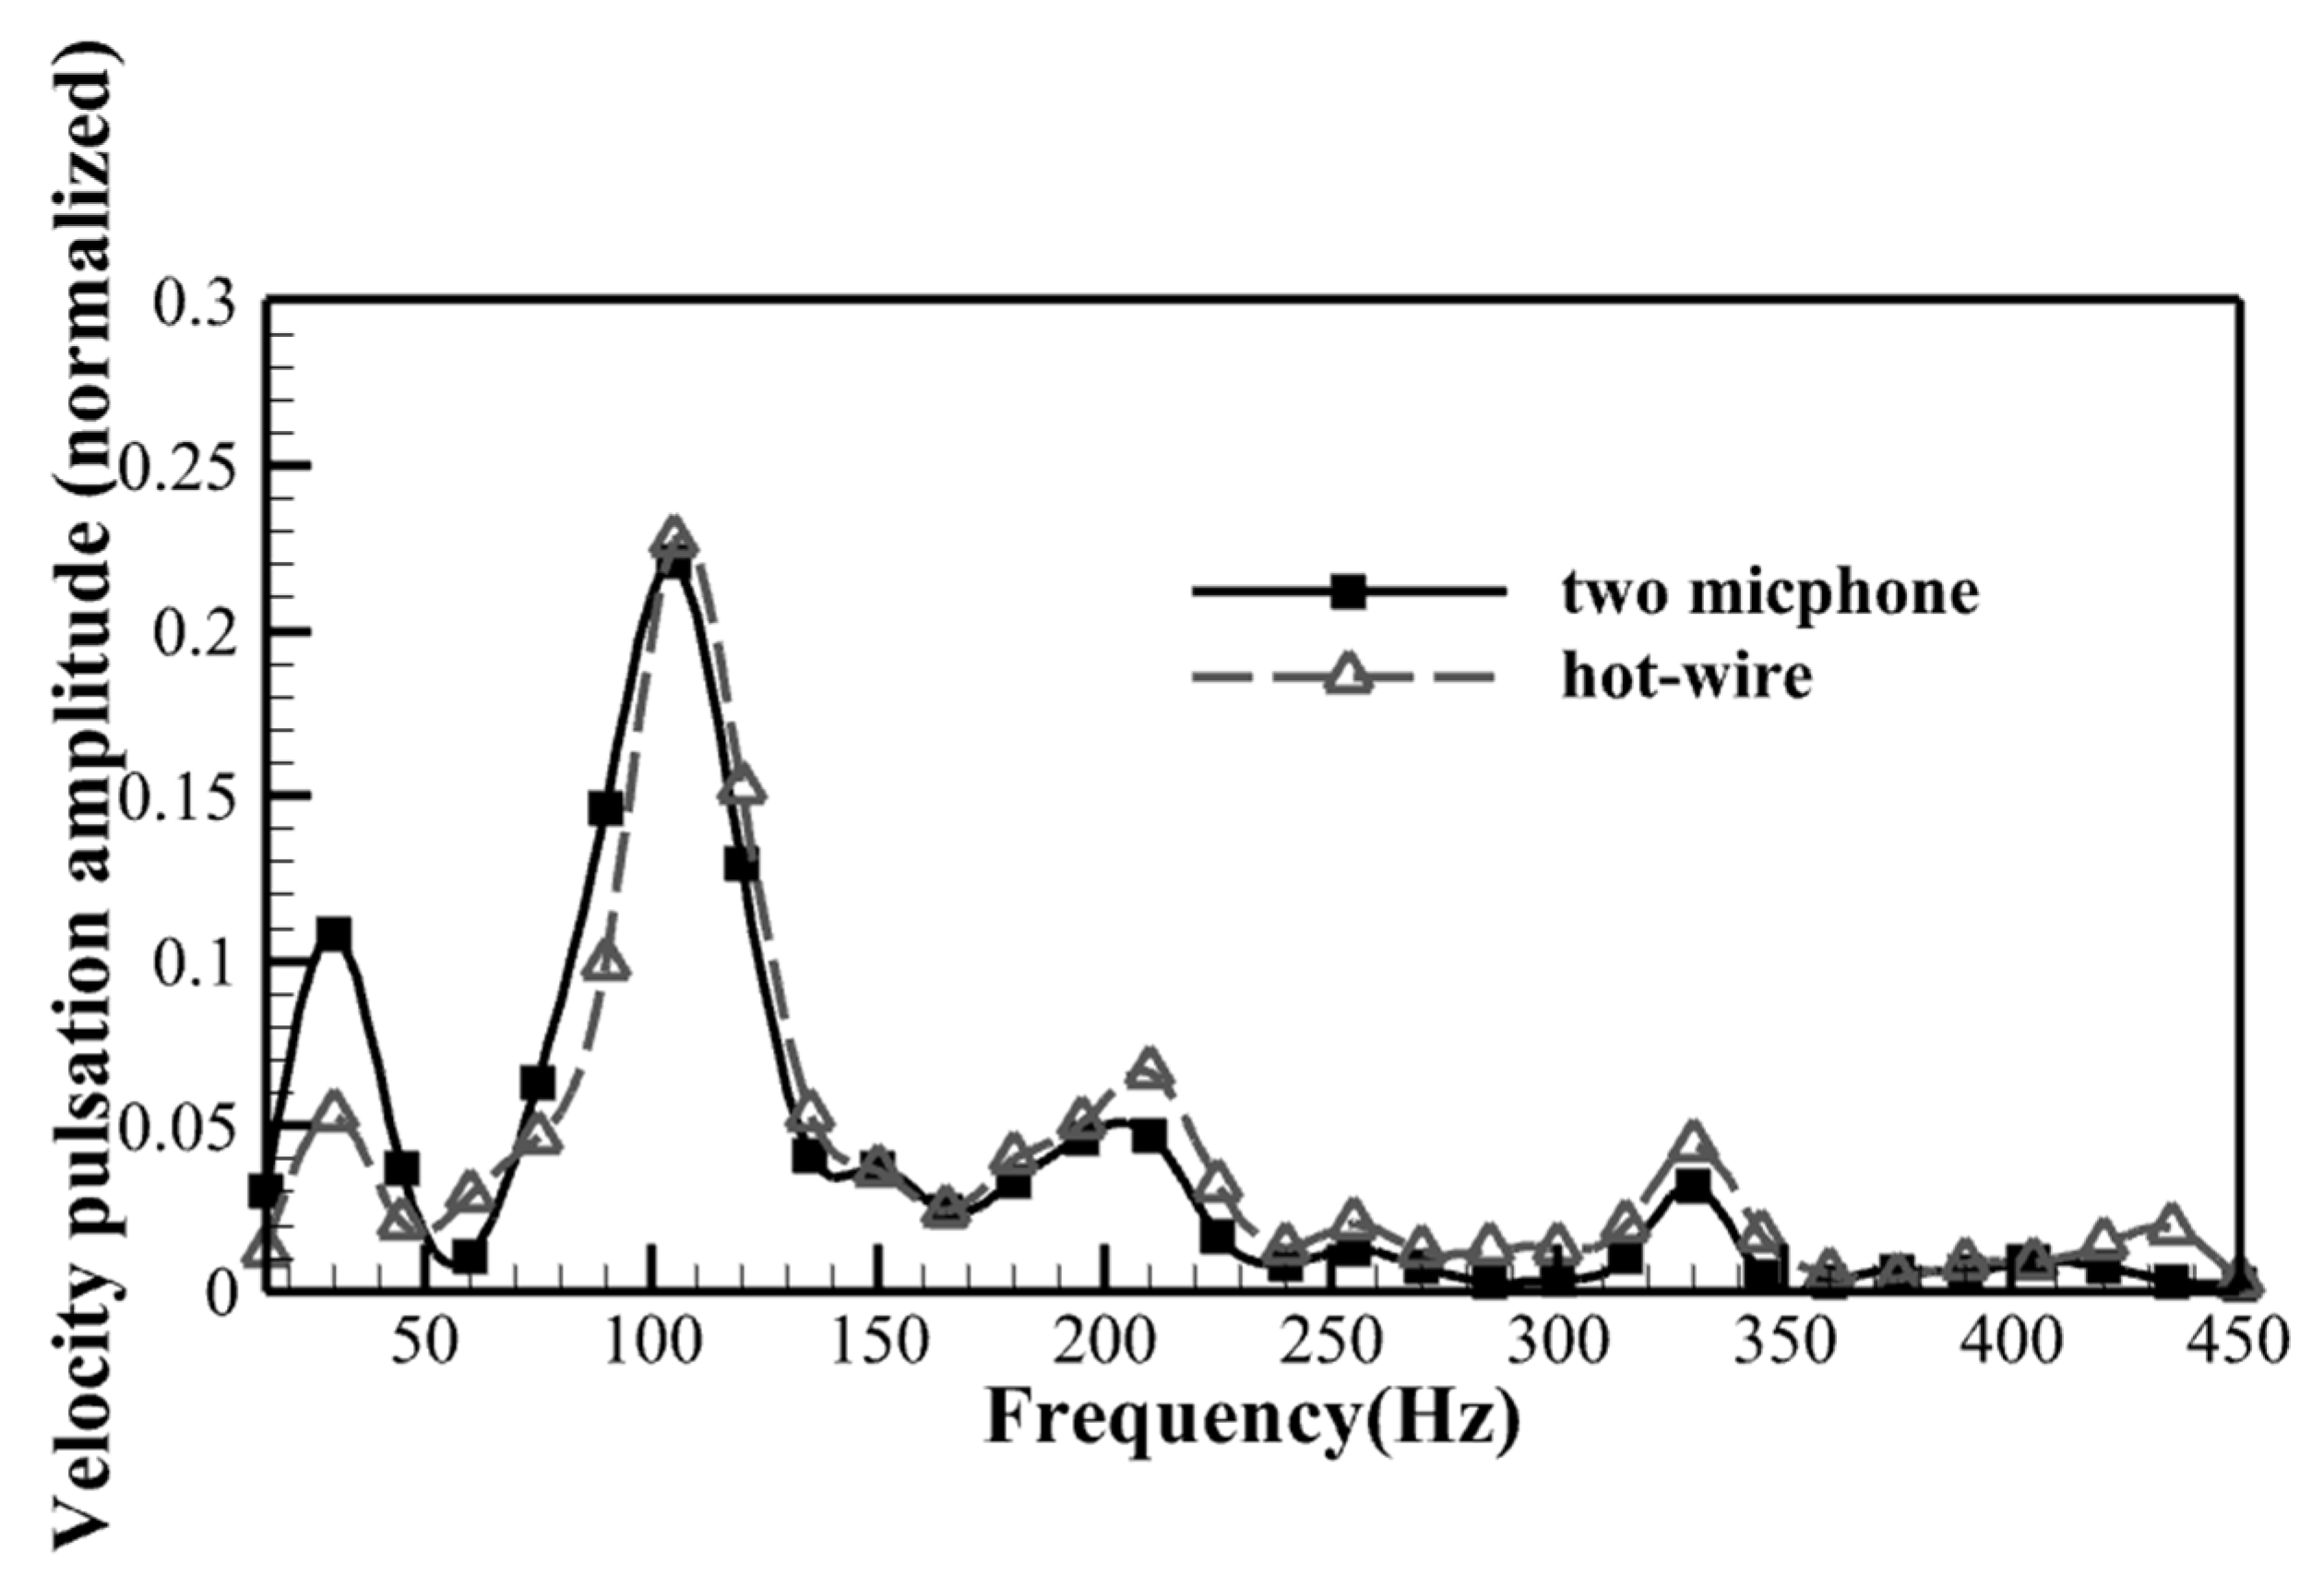
Figure 5.
Velocity fluctuation characteristics of combustor under cold condition (u = 3.8 m/s). Different colors represent different excitation power levels.
Figure 5.
Velocity fluctuation characteristics of combustor under cold condition (u = 3.8 m/s). Different colors represent different excitation power levels.
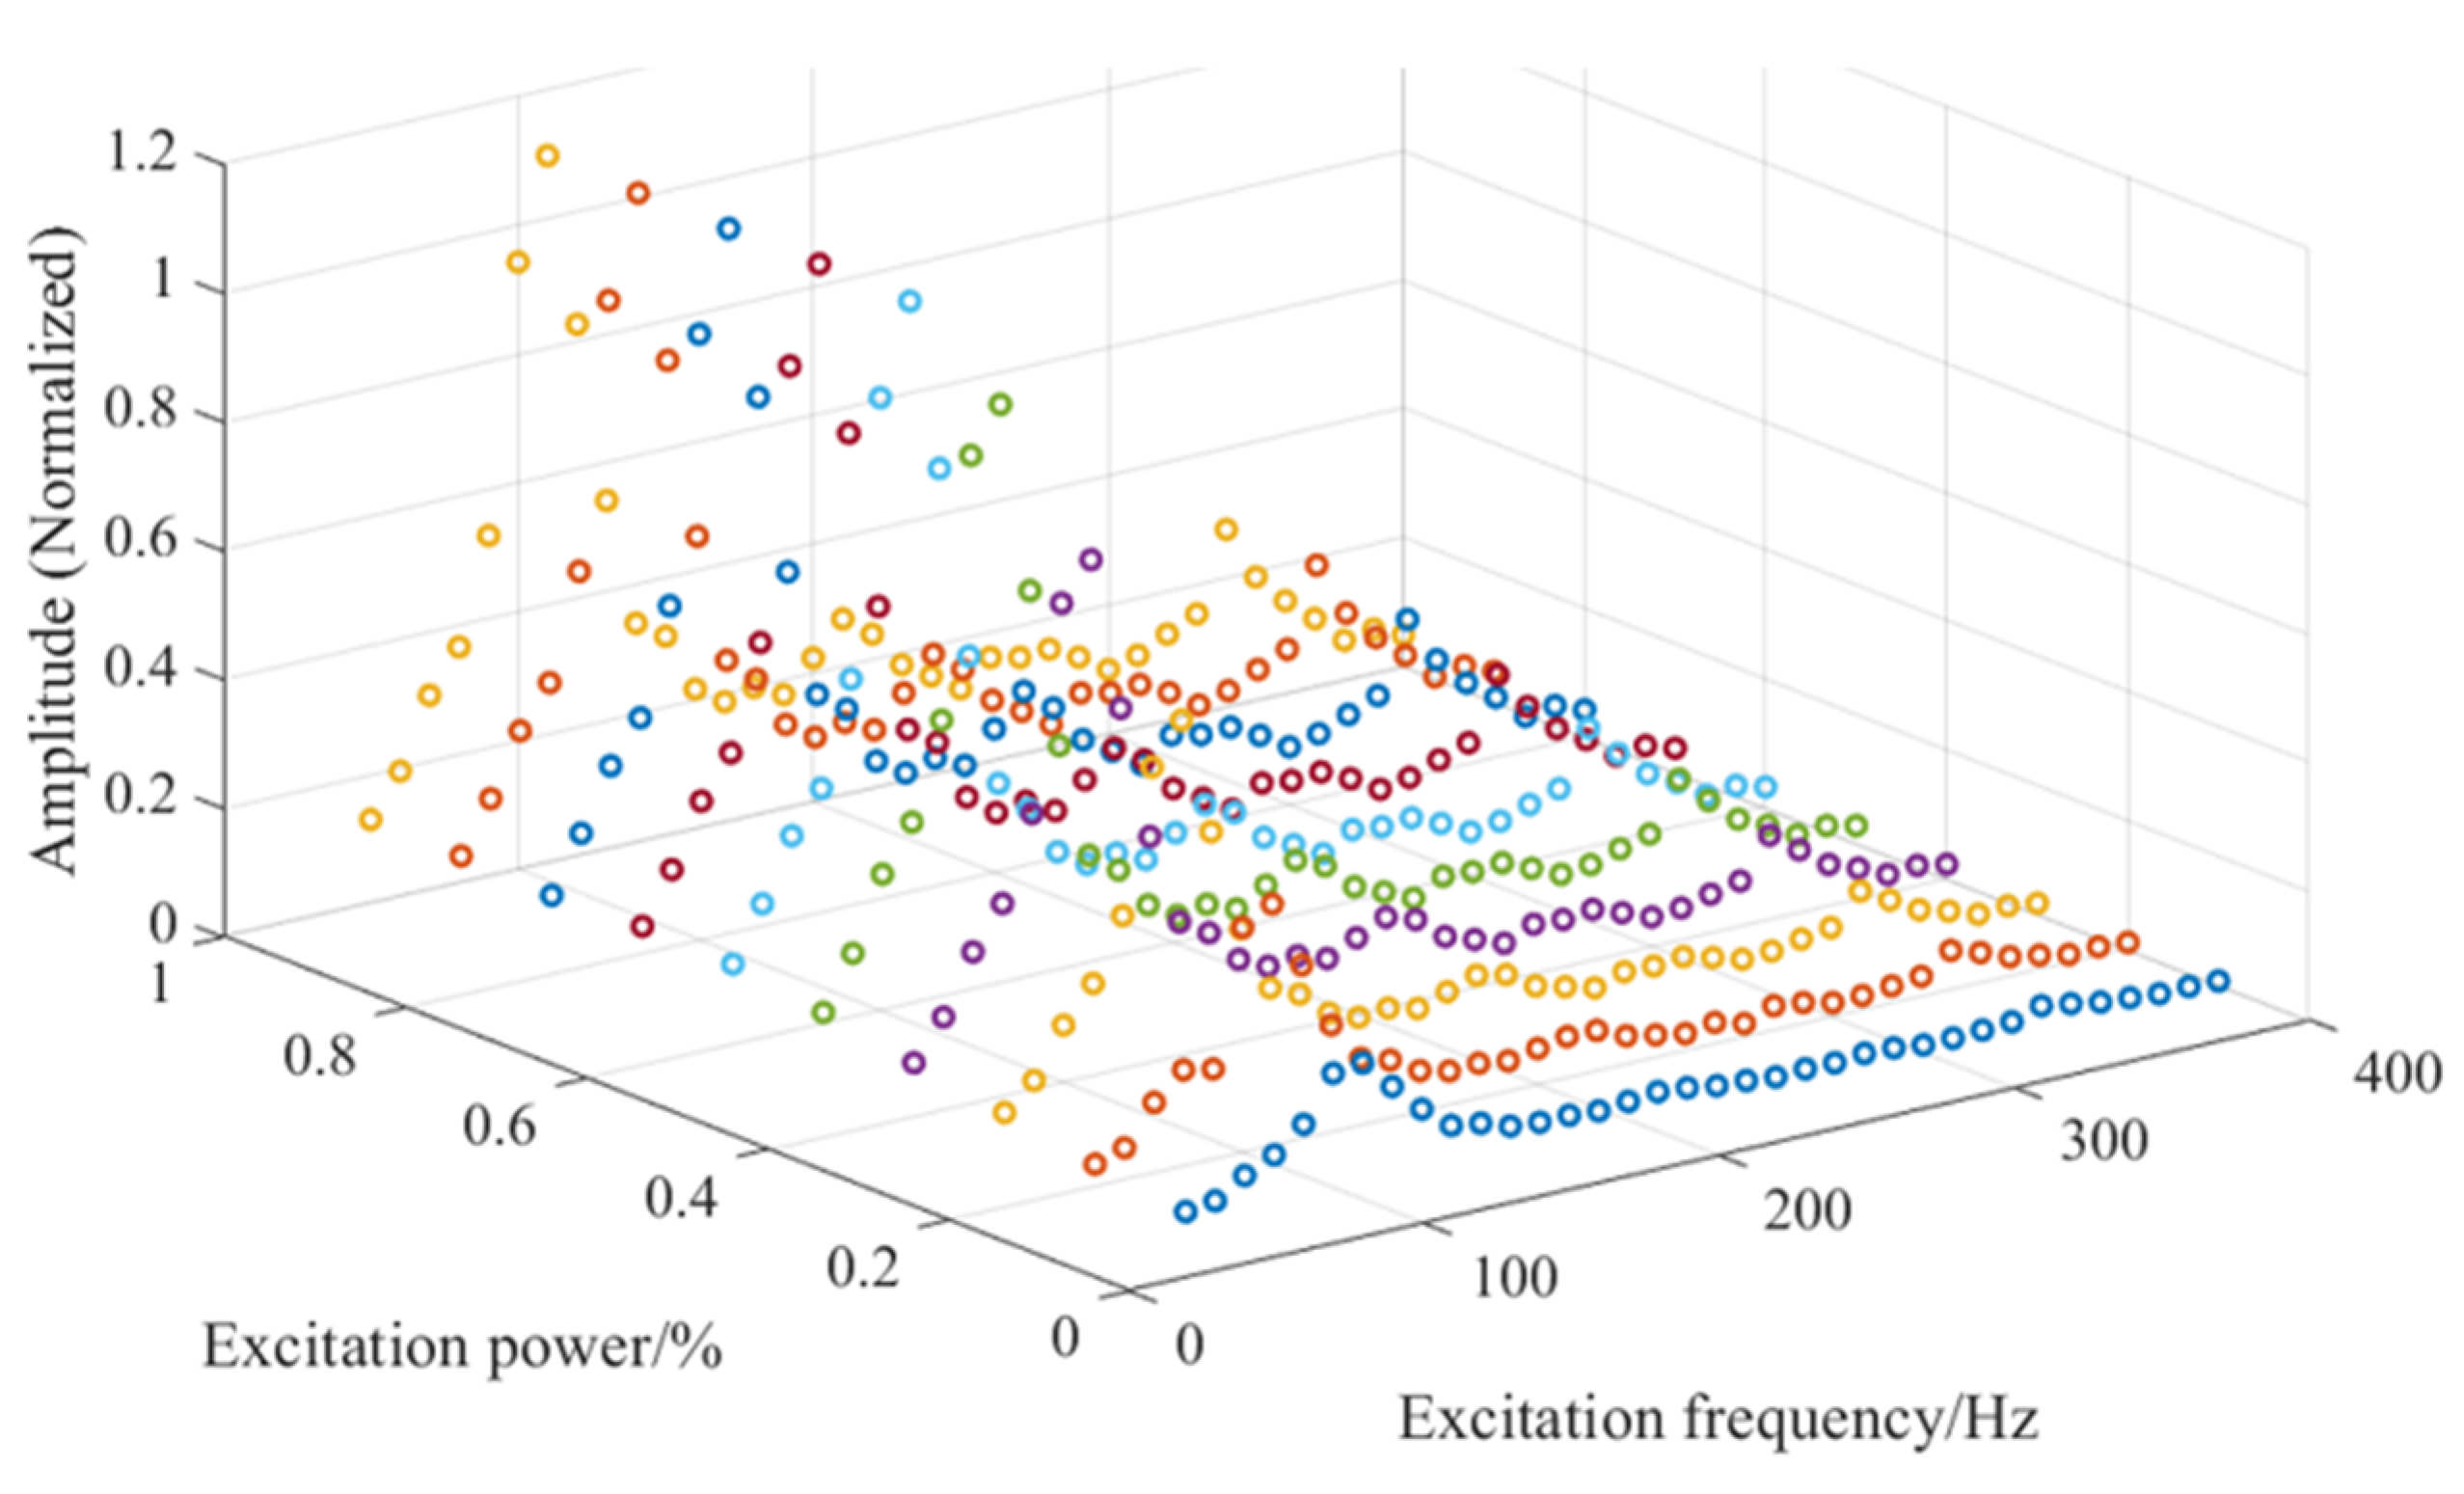
Figure 6.
FTF under different equivalence ratios: (a) gain; (b) phase.

Figure 7.
FTF under different inlet velocities: (a) gain; (b) phase.

Figure 8.
First order POMs of flame instantaneous images under different excitation frequencies.
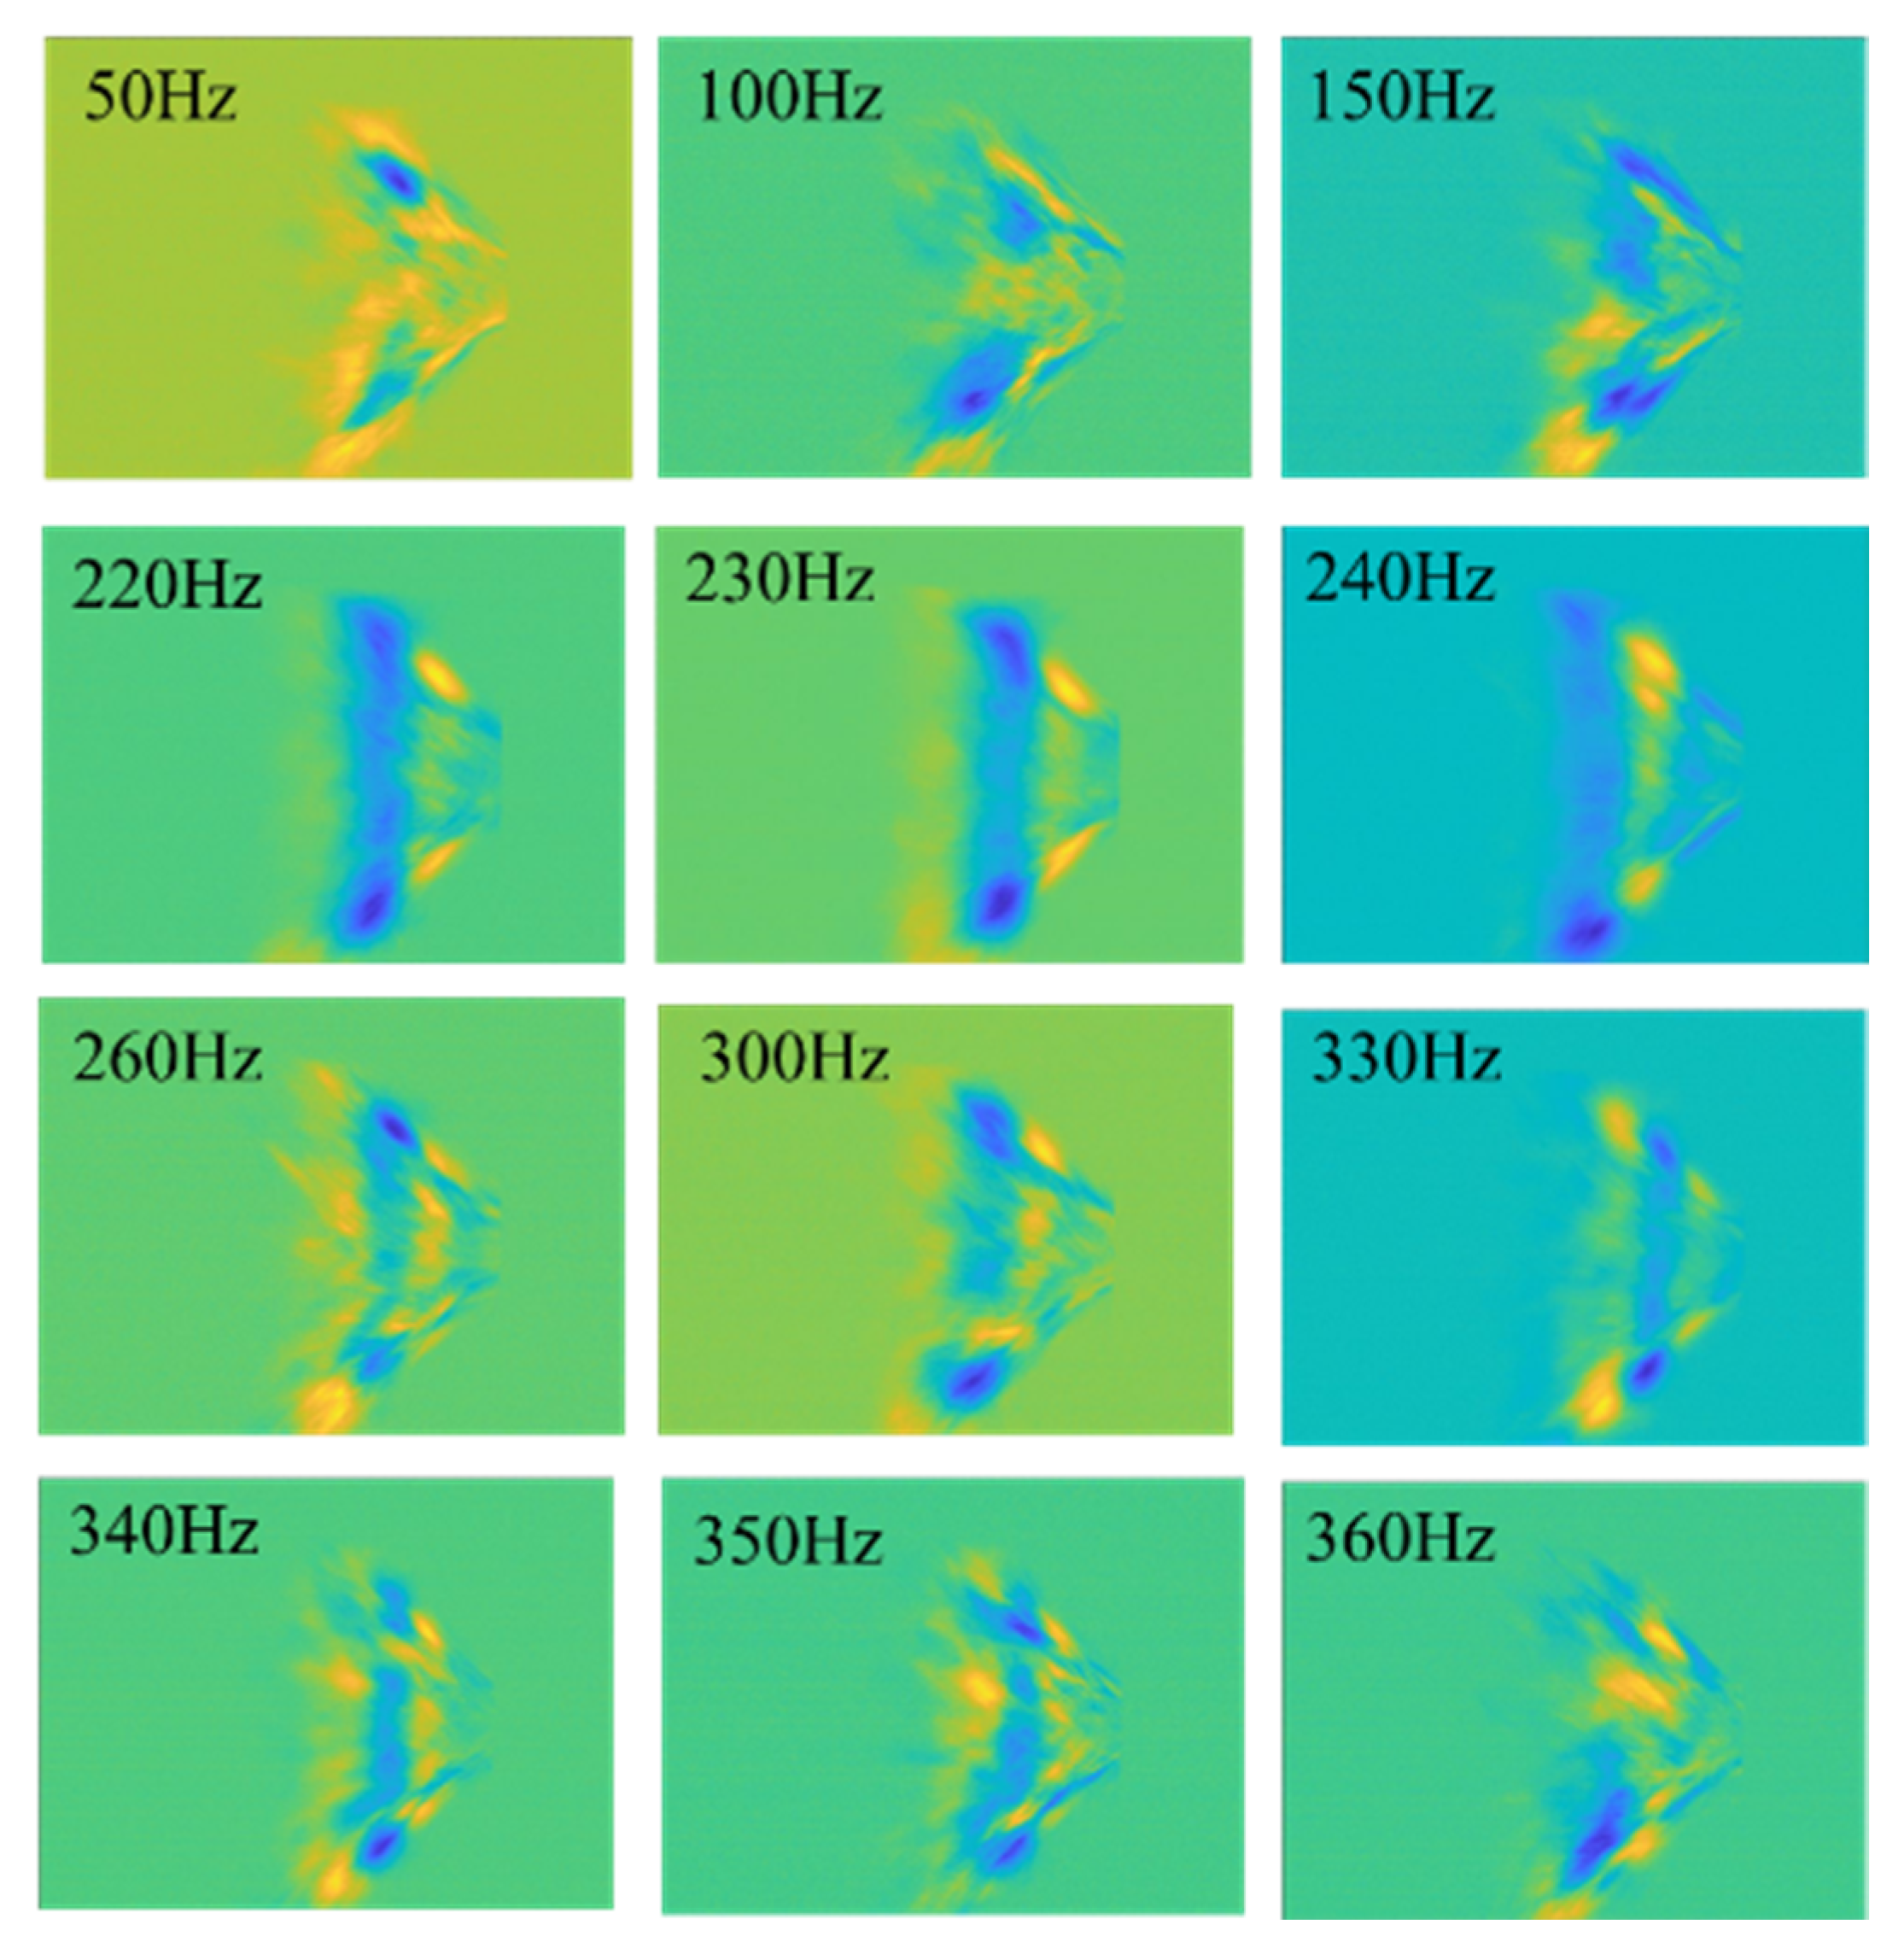
Figure 9.
Phase average flame structure of flame under 230 Hz excitation (left: phase average image; right: inverse Abel transformation result).
Figure 9.
Phase average flame structure of flame under 230 Hz excitation (left: phase average image; right: inverse Abel transformation result).
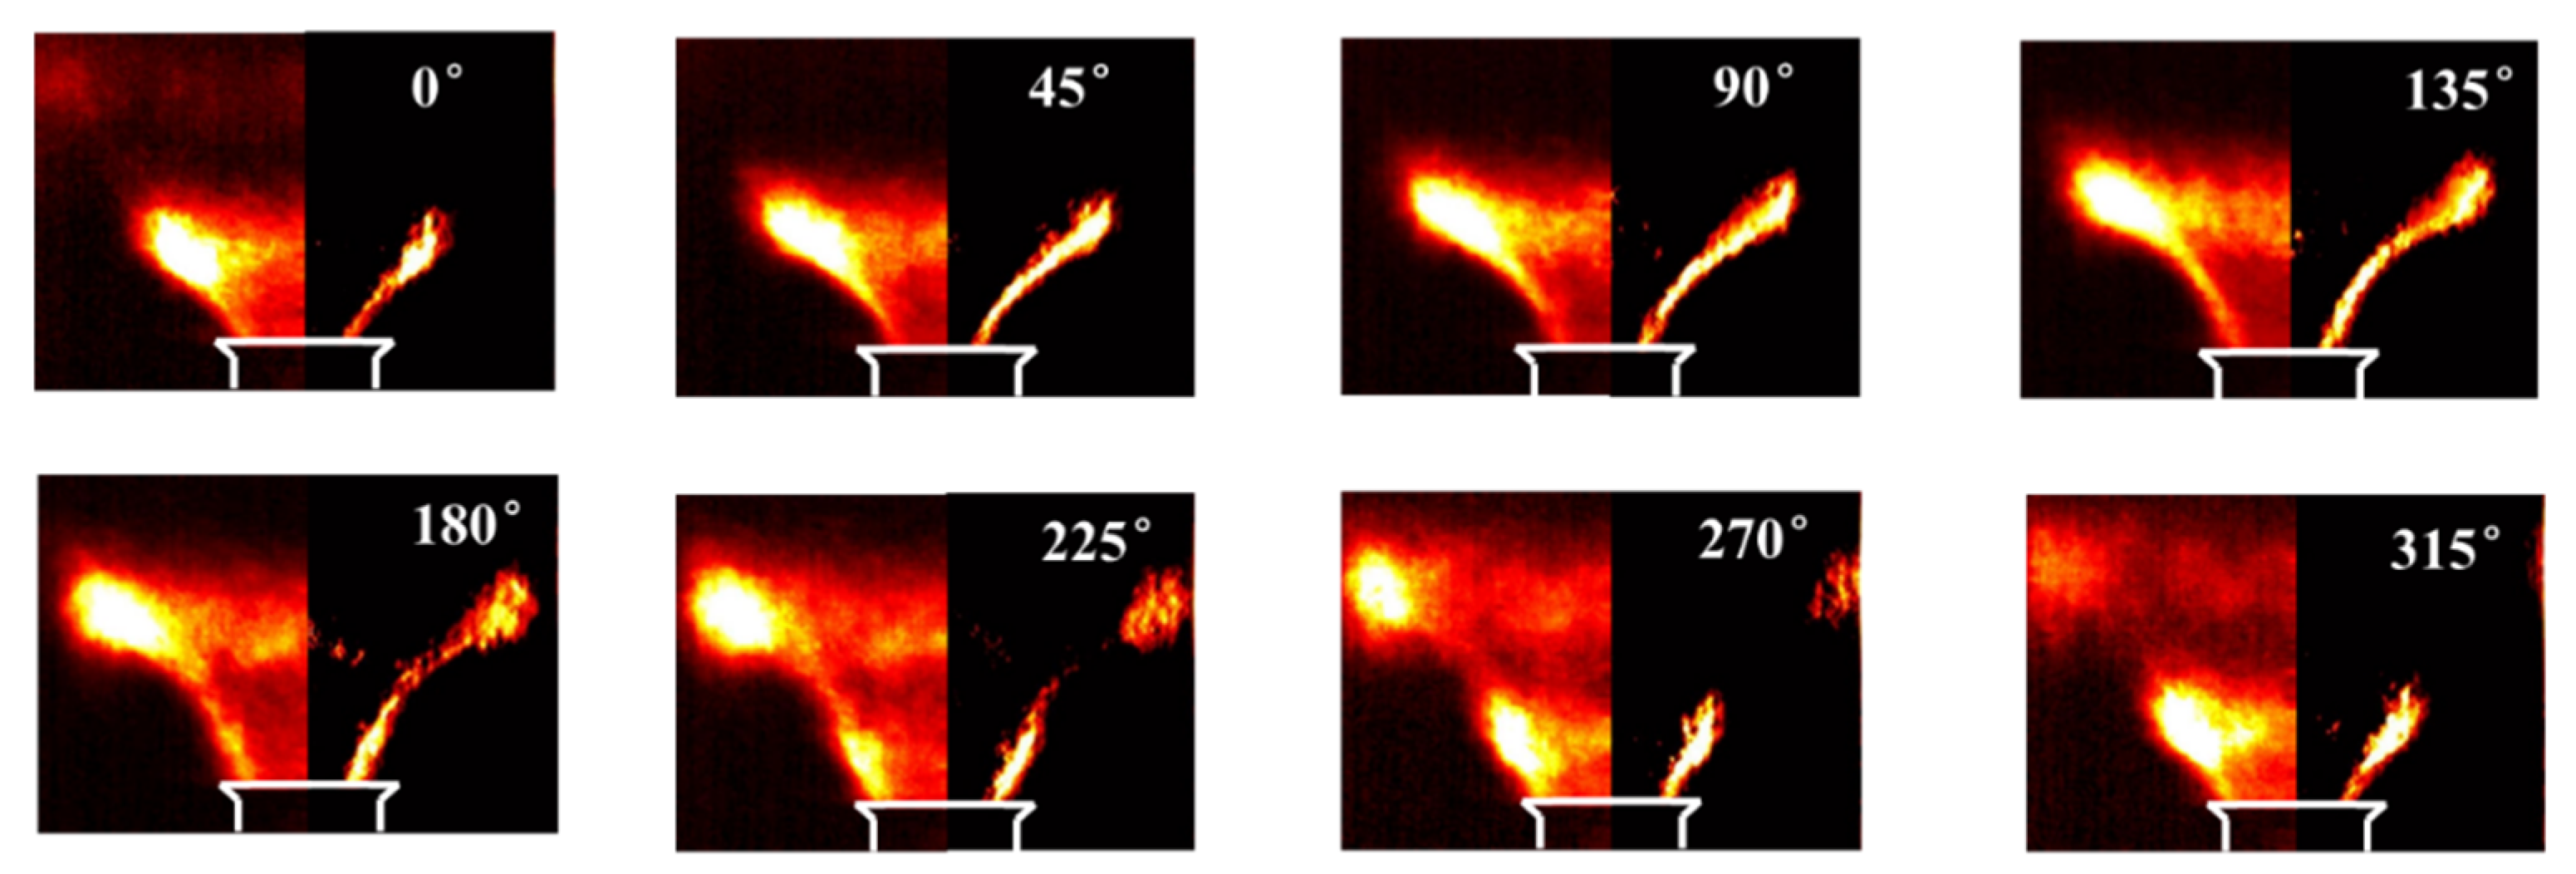
Figure 10.
Phase average flame structure of flame under 330 Hz excitation (left: phase average image; right: inverse Abel transformation result).
Figure 10.
Phase average flame structure of flame under 330 Hz excitation (left: phase average image; right: inverse Abel transformation result).

Figure 11.
Results of pressure pulsation amplitude in combustor under different equivalence ratios.
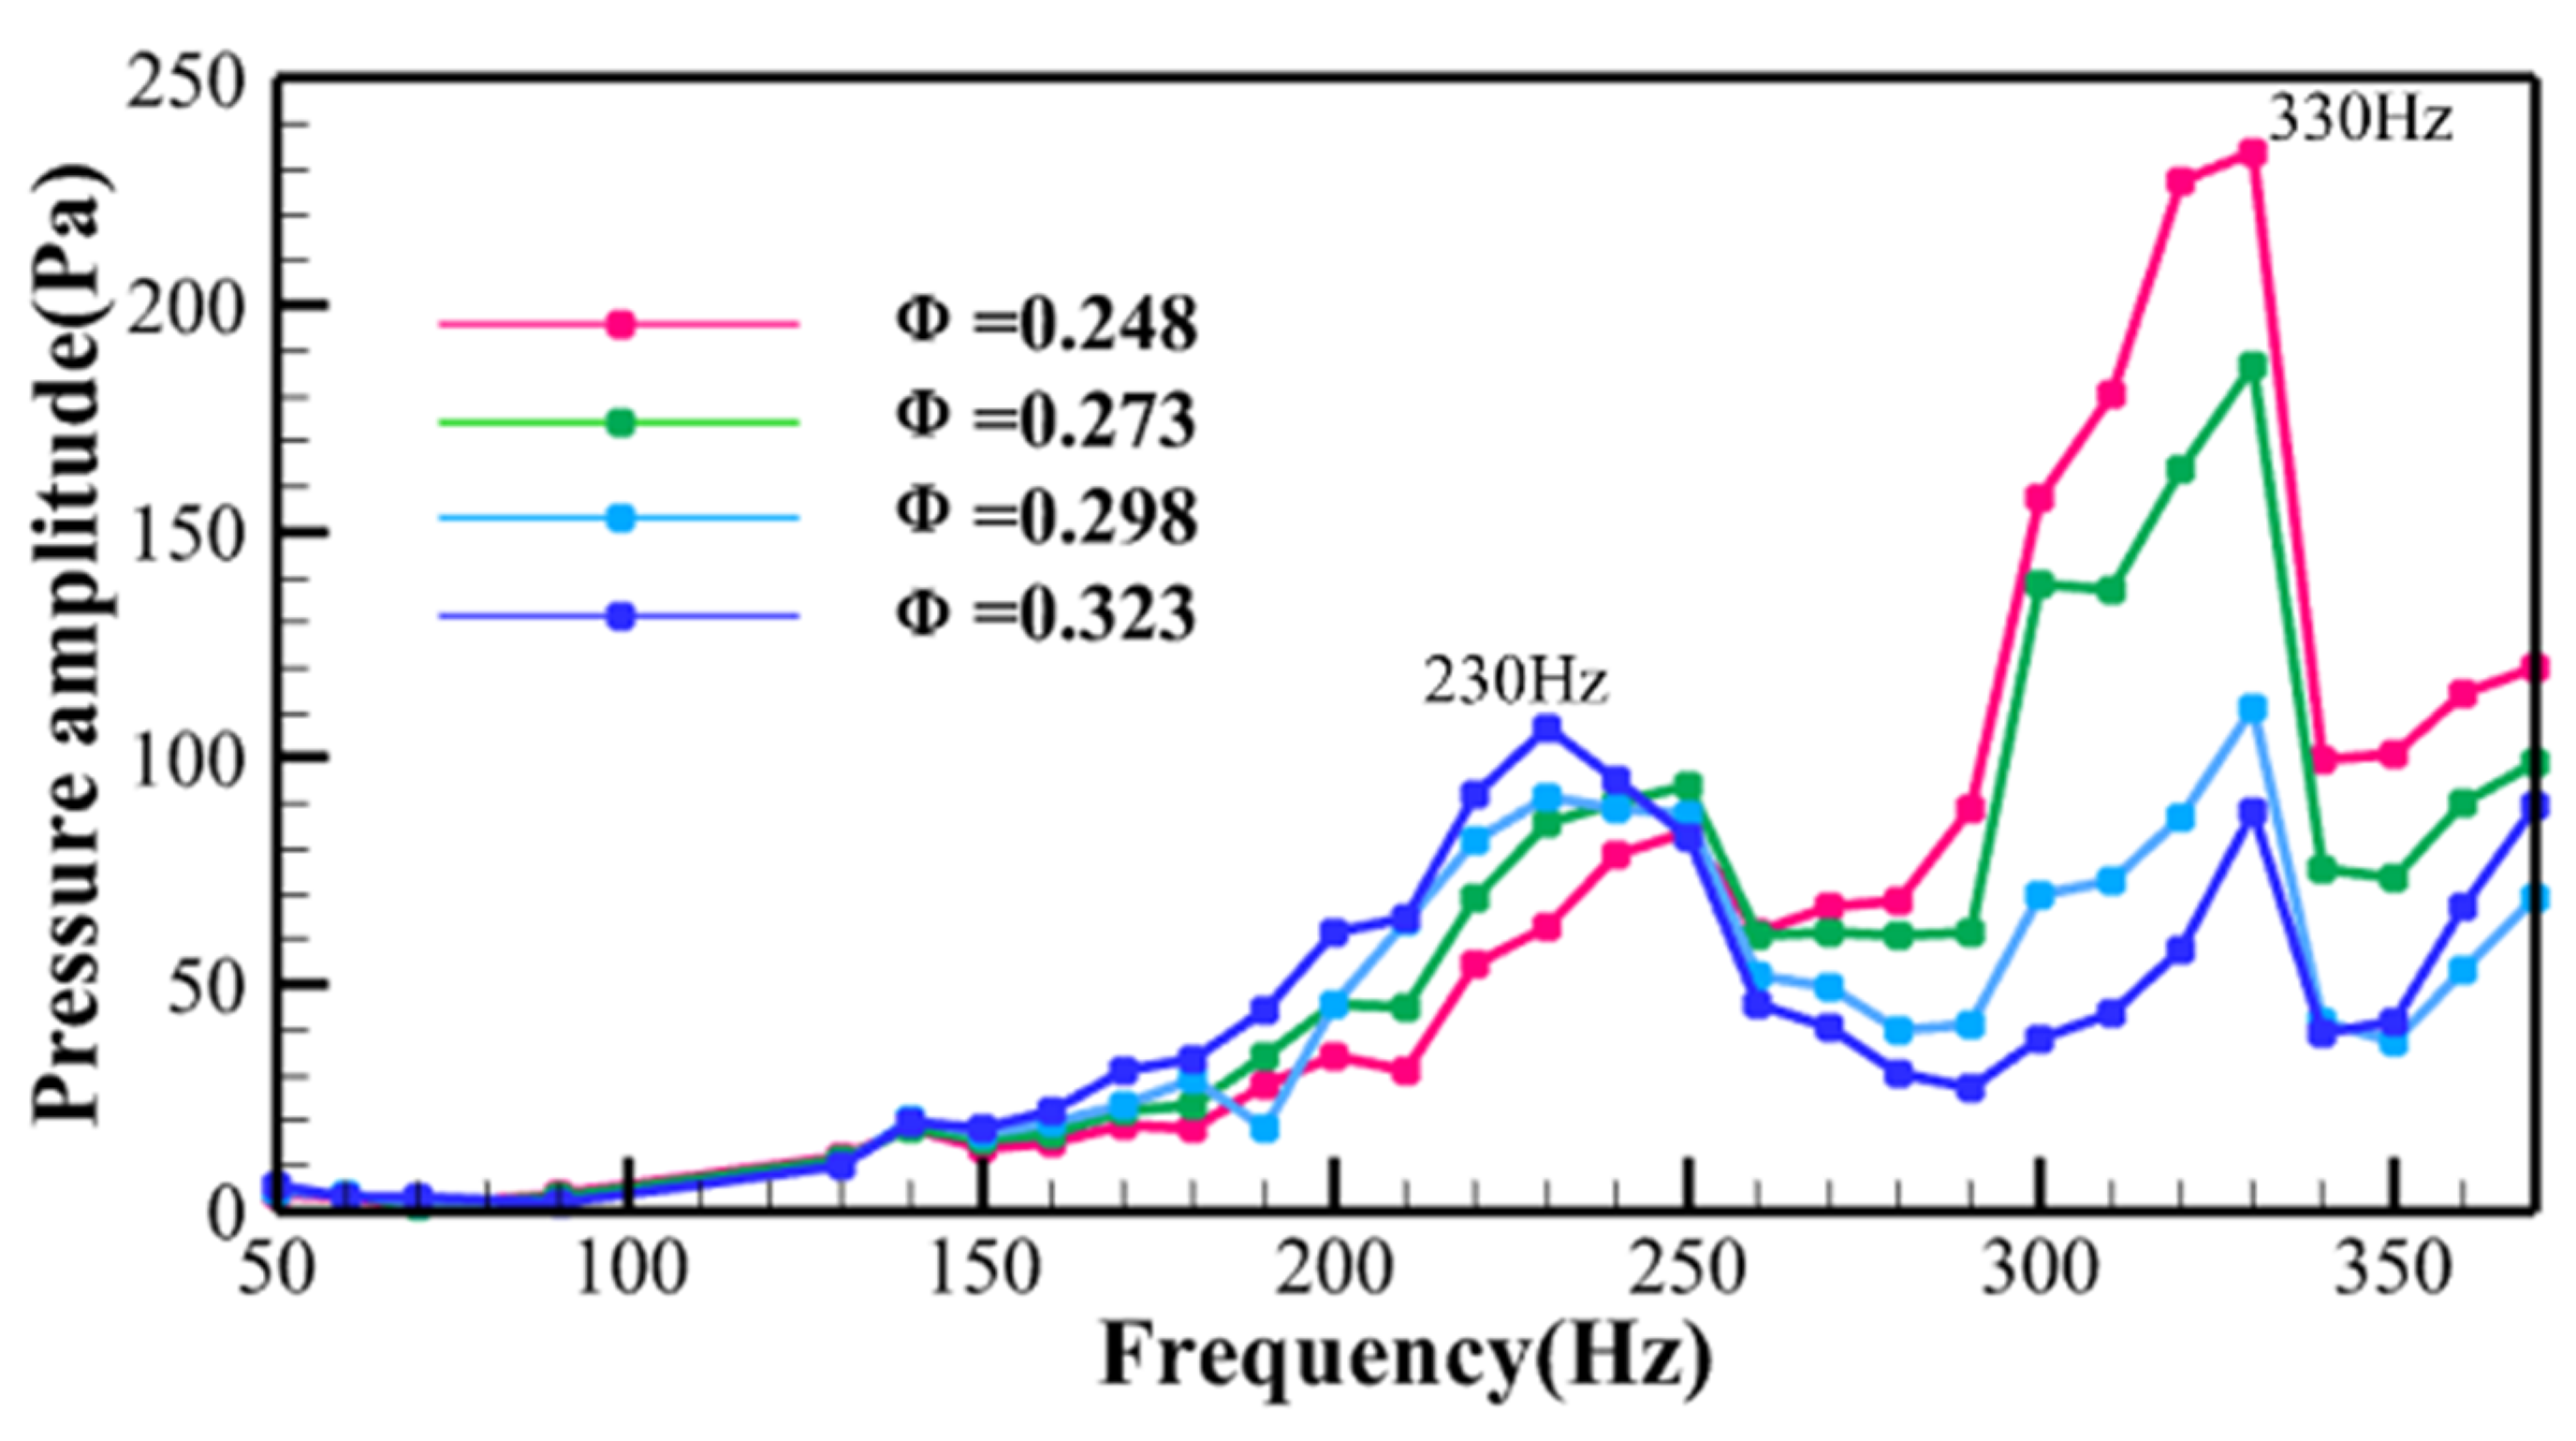
Figure 12.
Time series signal of pressure pulsation in the combustor (left), phase space reconstruction (middle), and PDF distribution (right) under two oscillation modes. (a) Mv mode; (b) Ma mode.
Figure 12.
Time series signal of pressure pulsation in the combustor (left), phase space reconstruction (middle), and PDF distribution (right) under two oscillation modes. (a) Mv mode; (b) Ma mode.

Figure 13.
Phase space diagram of light emission: (a) Mv mode; (b) Ma mode.

Figure 14.
Axial distribution of heat release rate fluctuations in different phases: (a) Mv mode; (b) Ma mode.
Figure 14.
Axial distribution of heat release rate fluctuations in different phases: (a) Mv mode; (b) Ma mode.


Figure 15.
RI1 Results.

Figure 16.
Schematic diagram of thermoacoustic coupled oscillation.
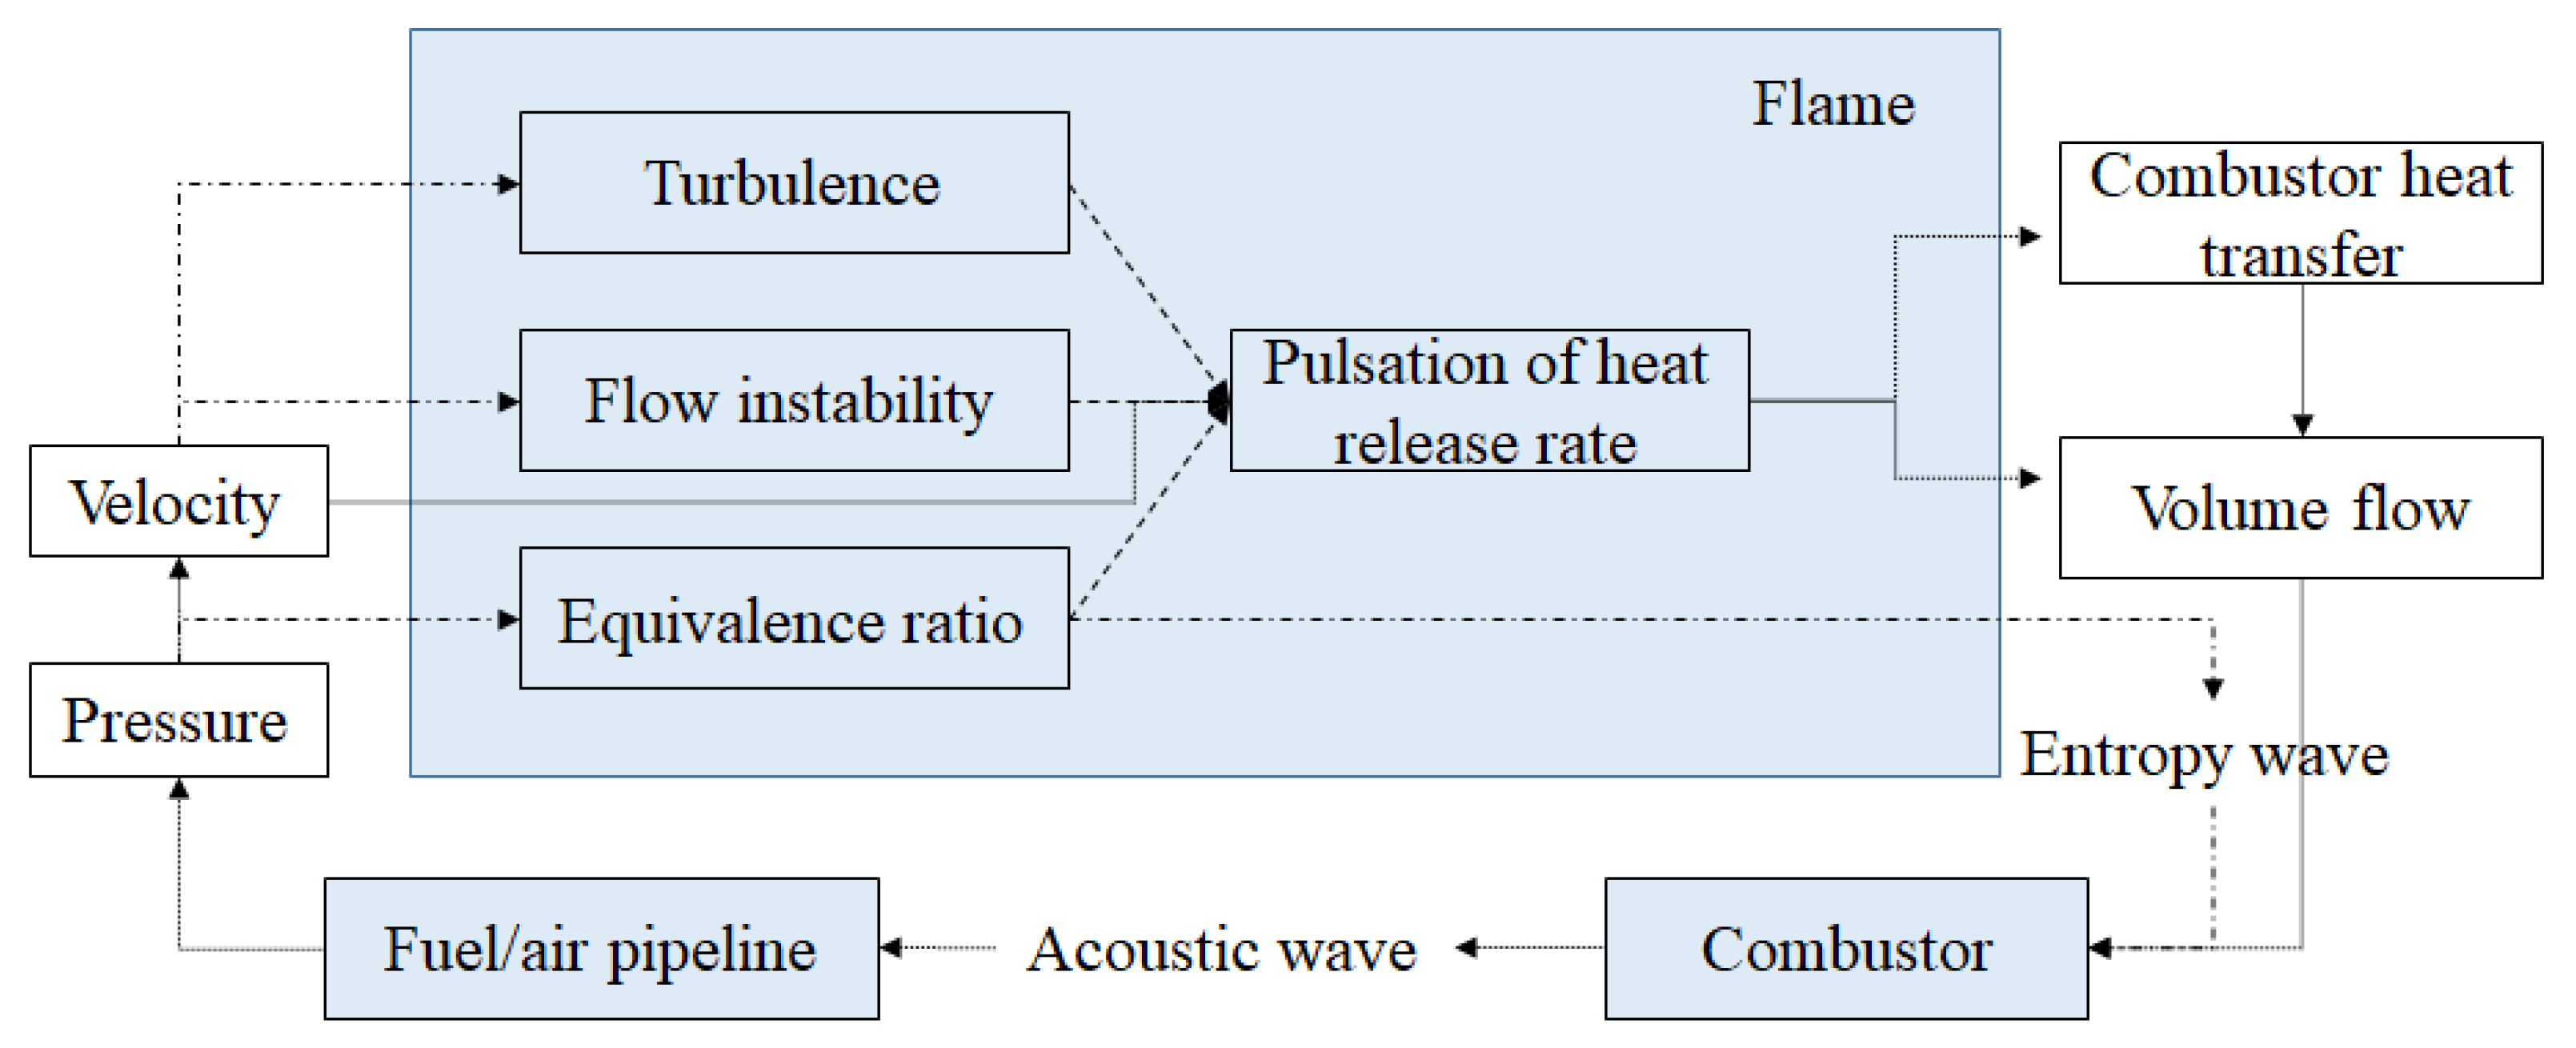
Figure 17.
The Rayleigh index between and as well as and .

Disclaimer/Publisher’s Note: The statements, opinions and data contained in all publications are solely those of the individual author(s) and contributor(s) and not of MDPI and/or the editor(s). MDPI and/or the editor(s) disclaim responsibility for any injury to people or property resulting from any ideas, methods, instructions or products referred to in the content. |
© 2023 by the authors. Licensee MDPI, Basel, Switzerland. This article is an open access article distributed under the terms and conditions of the Creative Commons Attribution (CC BY) license (https://creativecommons.org/licenses/by/4.0/).
Share and Cite
MDPI and ACS Style
Yang, C.; Liu, Y.; Zhang, X.; Li, H.; Ge, X.; Jin, F.; Liu, C. Experimental Study on Flame Response Characteristics of a Non-Premixed Swirl Model Combustor. Energies 2023, 16, 6834. https://doi.org/10.3390/en16196834
AMA Style
Yang C, Liu Y, Zhang X, Li H, Ge X, Jin F, Liu C. Experimental Study on Flame Response Characteristics of a Non-Premixed Swirl Model Combustor. Energies. 2023; 16(19):6834. https://doi.org/10.3390/en16196834
Chicago/Turabian StyleYang, Chen, Yong Liu, Xiang Zhang, Hao Li, Xinkun Ge, Feng Jin, and Chongyang Liu. 2023. "Experimental Study on Flame Response Characteristics of a Non-Premixed Swirl Model Combustor" Energies 16, no. 19: 6834. https://doi.org/10.3390/en16196834
Note that from the first issue of 2016, this journal uses article numbers instead of page numbers. See further details here.