
Study on the Life Cycle Assessment of Automotive Power Batteries Considering Multi-Cycle Utilization
by
 ,
,
Yongtao Liu
1 ,
,
Chunmei Zhang
1,
Zhuo Hao
2,
Xu Cai
1,
Chuanpan Liu
1,
Jianzhang Zhang
1,
Shu Wang
1 and
Yisong Chen
1,* 1
School of Automobile, Chang’an University, Xi’an 710064, China
2
CATARC New Energy Vehicle Test Center (Tianjin) Co., Ltd., Tianjin 300000, China
*
Author to whom correspondence should be addressed.
Energies 2023, 16(19), 6859; https://doi.org/10.3390/en16196859
Submission received: 25 August 2023
/
Revised: 22 September 2023
/
Accepted: 26 September 2023
/
Published: 28 September 2023
(This article belongs to the Section D2: Electrochem: Batteries, Fuel Cells, Capacitors)
Abstract
:This article utilizes the research method of the Life Cycle Assessment (LCA) to scrutinize Lithium Iron Phosphate (LFP) batteries and Ternary Lithium (NCM) batteries. It develops life cycle models representing the material, energy, and emission flows for power batteries, exploring the environmental impact and energy efficiency throughout the life cycles of these batteries. The life cycle assessment results of different power battery recycling process scenarios are compared and analyzed. This study focuses on retired LFP batteries to assess the environmental and energy efficiency during the cascade utilization stage, based on a 50% Single-Cell Conversion Rate (CCR). The findings of the research reveal that, in terms of resource depletion and environmental emission potential, LFP batteries exhibit lower impacts compared to NCM batteries. The use of hydrometallurgy in recovering LFP power batteries leads to minimal life cycle resource consumption and environmental emission potential. During the cascade utilization stage of LFP batteries, significant benefits are noted, including a 76% reduction in mineral resource depletion (ADP e) and an 83% reduction in fossil energy depletion (ADP f), alongside notable reductions in various environmental impact factors. Simultaneously, considering the sensitivity of life cycle assessment indicators and their benefit percentages to different CCRs, it is observed that ODP exhibits the highest sensitivity to CCR changes, while evaluation indicators such as HTP, AP, and GWP show relatively lower sensitivity. This study can provide an effective reference for the establishment of an energy saving and emission reduction evaluation system of power batteries.
1. Introduction
In 2022, China achieved a production and sales volume of 7.058 million and 6.887 million units of new energy vehicles, representing year-on-year increases of 96.9% and 93.4%, respectively [1]. As the market share of new energy vehicles continues to rise, the installation of power batteries has also increased significantly. In 2022, the installed capacity of electric vehicle power batteries reached a substantial 294.6 GWh. As a crucial component of new energy vehicles [2], it is essential to understand the resource and environmental impacts throughout the life cycle of power batteries. This understanding can provide valuable insights for establishing an efficient evaluation system focused on energy conservation and emissions reduction throughout the life cycle of power batteries. At the same time, China has entered the large-scale scrapping period for the first batch of automotive power batteries. According to data from the China Automotive Technology Center, in 2020, the scrap quantity of new energy vehicle power batteries reached 141,200 tons per year, with a cumulative total of 293,100 tons from 2011 to 2020 [2]. The improper handling of such a large quantity of scrapped power batteries could pose significant environmental and societal risks. Consequently, the recycling and treatment of power batteries have become crucial aspects of battery life cycle management. Assessing the resource and environmental benefits of the secondary utilization of retired power batteries can provide a scientific basis for improving the management system and related standards for their reuse. Therefore, this paper conducts a comprehensive life cycle assessment and multi-cycle utilization study of automotive power batteries based on the life cycle assessment method and power battery evaluation model.
Significant research has been conducted both domestically and internationally regarding the life cycle assessment of power batteries, focusing on their resource and environmental impacts. There have been many studies on the life cycle assessment of power batteries for pure electric vehicles [3,4], plug-in hybrid vehicles [5,6], and fuel cell vehicles [7,8], in order to obtain the energy consumption and emissions of power batteries during the production, manufacturing, assembly, and use stages. Majeau [9], Oliveira [10], and Marques [11] conducted a life cycle assessment on nickel hydrogen batteries, nickel cobalt manganese lithium ion batteries (Lithium ion NCM), and iron phosphate lithium ion batteries (LiFePO4 LFP) for plug-in hybrid vehicles, and compiled a transparent life cycle inventory in a component manner. The results showed that NCM and LFP have lower environmental impacts than nickel hydrogen batteries, and LFP has more environmental advantages compared to NCM. Ambrose [12], Ellingsen [13], Dai [14], and Petersac [15] employed the life cycle assessment (LCA) model to analyze resource consumption and environmental impacts of lithium-ion batteries used in pure electric vehicles. Sun [16] and Accardo [17] utilized LCA methods, based on data from Chinese domestic lithium battery suppliers, to evaluate and quantify the life cycle environmental impacts of Nickel Cobalt Manganese (NCM) batteries in pure electric passenger and commercial vehicles. Ahmadi [18] and Chen [19] analyzed the environmental impacts of LFP batteries throughout their entire life cycle, including manufacturing, usage, recycling, and reutilization, using data lists obtained for recycling and reutilization estimates. Several studies, including those conducted by Jia [20], Loakimidis [21], Zhu [22], and Liu [23], have investigated green recycling technologies and secondary application scenarios for discarded LFP batteries. The aim is to minimize their potential environmental impact. In the field of power battery recycling and multi-cycle utilization, research by Sanfelix [24] has suggested that recycling lithium-ion batteries could reduce their life cycle environmental impact by approximately 25%. Some researchers have proposed utilizing the Waste Management Hierarchy to optimize material usage and reduce life cycle impact values, achieving a dual objective of cost reduction and environmental impact reduction [25]. This hierarchy categorizes waste power batteries into successive stages of reuse, recycling, recovery, and disposal. Mahmud [26] studied the environmental impacts of lithium-ion and nickel-metal hydride batteries throughout their entire life cycle, comparing their environmental benefits during the recycling stage. In a comprehensive analysis of lithium-ion power battery material and energy flows, Blomeke [27] assessed the environmental and economic impacts of three commonly used recycling routes: pyrometallurgical, mechanical and thermal-mechanical pretreatment, and hydrometallurgical. At the end of the life cycle of new energy vehicles, their power battery packs retain around 80% of their performance, enabling secondary utilization in other contexts such as stationary energy storage systems for buildings and photovoltaic power generation [28,29]. The secondary utilization of discarded power batteries offers multiple benefits in terms of energy, the environment, and the economy. It not only stores electricity generated from intermittent and low-emission renewable energy sources such as wind, solar, and tidal energy, but also provides a “peak shaving and valley filling” distributed energy utilization approach to alleviate grid burdens [30]. To assess the energy consumption and environmental impact of the secondary utilization of discarded power batteries from new energy vehicles, several researchers have conducted relevant life cycle assessments, although such studies remain limited. Faria [31] investigated the life cycle assessment of second-use scenarios for electric vehicle power batteries and demonstrated that the environmental impact of secondary utilization depends significantly on local power structures and battery efficiency losses. Ahmadi [18] applied retired lithium-ion batteries from electric vehicles to stationary energy storage scenarios and conducted a life cycle assessment to evaluate their environmental and energy consumption impacts over ten years. The study also included a sensitivity analysis regarding the electricity structure and battery efficiency losses in the province of Ontario, Canada.
In summary, it is evident that both domestic and international research have made some strides in assessing the life cycle impact of power batteries. However, there is a relative scarcity of research focusing on energy consumption analysis throughout the power battery life cycle, as well as the evaluation of environmental and energy-related benefits during the phased utilization of retired power batteries. The sensitivity of individual power battery conversion rates to the life cycle environment and energy efficiency during the cascade utilization stage of power batteries remains unclear. To delve deeper into the environmental impact outcomes of power battery life cycles, this article selects lithium iron phosphate batteries and ternary lithium batteries as the research objects based on the technical characteristics and basic data of power batteries in China. A mathematical evaluation model and a GaBi evaluation model are constructed for two power batteries to evaluate their life cycle environmental and resource benefits. Four different power battery recycling processes, LFP wet recycling and physical recycling, NCM wet recycling and fire recycling, are selected for a comparative analysis of life cycle environmental and resource benefits. On this basis, a quantitative analysis is conducted on the energy and environmental benefits generated during the cascade utilization stage of lithium iron phosphate batteries.
2. Life Cycle Assessment Model for Power Batteries
Based on the research basis of the author’s team [1,32,33,34,35,36], the LCA method in this paper is used to construct a mathematical evaluation model of resource depletion and environmental emissions, and the life cycle resources and environmental benefits of lithium iron phosphate batteries and ternary lithium batteries are evaluated through this model.
2.1. Evaluation Object and System Boundary
Currently, the commonly used power batteries in new energy vehicles consist of lithium iron phosphate (LFP) batteries and ternary lithium batteries (NCM). According to statistics from the National Energy Administration, the cumulative installed capacity of NCM batteries reached 110.4 GWh in 2022, accounting for 37.5% of the total installed capacity. Meanwhile, the cumulative installed capacity of LFP batteries was 183.8 GWh, making up 62.4% of the total installed capacity. Therefore, this paper focuses on NCM and LFP batteries as the subjects of the research. The primary research objectives of this paper encompass the development of two life cycle assessment models for power batteries, the simulation of various recycling scenarios for the two types of batteries, and an evaluation of the life cycle benefits during the secondary utilization phase of retired power batteries. In order to ensure the feasibility of the modeling process, we will optimize or omit insignificant components with minimal environmental impact. The system boundary of this study is depicted in Figure 1.
Considering that the battery capacity used in pure electric vehicles is 57 kWh, the functional unit of the 57 kWh battery capacity is selected for vertical comparison between the two batteries. The power battery parameters and their respective performance parameters are shown in Table 1.
2.2. Mathematical Evaluation Model
2.2.1. Mathematical Evaluation Model for Resource Depletion
Life cycle resource depletion primarily encompasses the utilization of mineral resources linked to input materials, the consumption of primary energy sources such as crude oil and natural gas during mechanical processing and material smelting, and the consumption of electricity during production processes. In this study, the evaluation of resource depletion employs two distinct life cycle impact categories from the CML2001 assessment system: the Abiotic Depletion Potential element (ADP(e), measured in Sb-eq, unit: kg) and Abiotic Depletion Potential fossil (ADP(f), unit: MJ).
The matrix for mineral resource consumption and energy consumption during the raw material acquisition stage is represented by Equation (1).
In the equation, represents the material utilization rate when producing the j-th type of battery material using the i-th type of raw material, where c denotes the number of original material types and l represents the total number of battery material types. is a diagonal matrix representing the fundamental material utilization rate during the raw material acquisition stage. Meanwhile, denotes the mass of the i-th material in the j-th component of the t-th battery, and n represents the number of battery component types. Furthermore, signifies the consumption of the j-th primary energy type for producing one unit of the i-th secondary energy type, where s is the number of secondary energy types and v is the number of primary energy types. Lastly, represents the quantity of the j-th secondary energy type consumed per unit mass of the i-th material during production and processing.
During the component production stage, the primary focus is on the impact of energy consumption, which includes electricity and heat consumption during the battery assembly process. Material consumption is not considered in this stage. The energy consumption intensity matrix for the component production stage is represented by Equation (2).
In the equation, represents the quantity of the j-th secondary energy type consumed during the production of the i-th component.
During the battery manufacturing and assembly stage, the primary focus is on the consumption of secondary energy sources, such as electricity and heat, during the battery assembly process. Material consumption is disregarded. The energy consumption intensity matrix for the component manufacturing and assembly stage is represented by Equation (3).
In the equation, represents the quantity of the j-th secondary energy type consumed during the assembly of the i-th component.
The power battery recycling stage involves the recovery of metals such as copper, aluminum, and iron. It also requires the consumption of secondary energy sources, such as electricity, for battery disassembly and active material separation. Additionally, a significant amount of chemical agents, such as acidic, alkaline, and oxidizing substances, is used for the replacement and recovery of active materials. The resource depletion matrix for the power battery recycling stage is represented by Equation (4).
In the equation, represents the consumption of the j-th chemical agent during the recycling of the i-th battery material, where a denotes the number of battery recycling material types, and b represents the types of fossil agents consumed during battery material recycling. Meanwhile, signifies the quantity of the j-th raw material required for the production of the i-th battery material in the recycling process. Furthermore, stands for the quantity of the j-th secondary energy type consumed during the disassembly and recycling of the i-th component, while denotes the quantity of the j-th secondary energy type generated during the production of the i-th component.
2.2.2. Mathematical Evaluation Model for Environmental Emissions
Life cycle environmental emissions encompass the gas emissions generated throughout various stages of the power battery life cycle, including energy extraction, material smelting, and energy consumption processes. These stages include raw material acquisition, component manufacturing, battery assembly, and end-of-life recycling. The emissions consist of diverse environmental pollutants, toxic gases, as well as specific particles and organic compounds. In this study, six distinct life cycle impact categories from the CML2001 assessment system are utilized for evaluating environmental impacts. These categories comprise the Global Warming Potential (GWP, measured in CO2 eq, unit: kg), Acidification Potential (AP, measured in SO2 eq, unit: kg), Eutrophication Potential (EP, measured in Phosphate eq, unit: kg), Photochemical Ozone Creation Potential (POCP, measured in Ethene eq, unit: kg), Ozone Depletion Potential (ODP, measured in Monochloroethane eq, unit: kg), and Human Toxicity Potential (HTP, measured in DCB-Eq, unit: kg).
The environmental impact gas emission matrix for the raw material acquisition stage is represented by Equation (5).
In the equation, represents the quantity of the j-th environmental emission generated during the production of the i-th primary energy type, r represents the type of environmental emissions in the power battery life cycle.
The environmental impact gas emission matrix for the component production stage is represented by Equation (6).
The environmental impact gas emission matrix for the power battery manufacturing and assembly stage is represented by Equation (7).
The environmental emissions during the power battery recycling stage primarily come from the emissions generated during the disassembly process due to the consumption of electricity and heat, the environmental emissions during the production of chemical agents used in battery material recycling, and the environmental impact and benefits resulting from battery material recycling. The environmental emission matrix for this stage is represented by Equation (8).
2.2.3. The Mathematical Evaluation Model for the Secondary Utilization of Power Batteries
In the equation, represents the material mass matrix during the power battery secondary utilization stage, represents the energy consumption intensity matrix during the production of new materials for battery components, represents the energy consumption intensity matrix during the production of new battery components, and represents the energy consumption intensity matrix during the disassembly and testing process of retired power batteries. The variable denotes the number of raw material types for new battery components, and represents the number of new battery component types.
The resource consumption matrix for the power battery secondary utilization stage is represented by Equation (10):
In the equation, represents the matrix of raw material utilization rates during the first stage of material preparation for the component manufacturing process. represents the diagonal matrix of the basic material utilization rates during the second stage of material production and processing.
The environmental emission intensity matrix for the power battery’s secondary utilization stage is represented by Equation (11):
To facilitate a more intuitive and comparable evaluation of the life cycle environmental impacts among different power batteries, and to obtain an overall environmental impact evaluation result for power batteries by aggregating various environmental impact indicators, this study normalized the characterization results of various environmental impacts. The normalized baseline values and weight coefficients of different environmental assessment indicators are shown in Table 2, where, is the environmental impact potential value of class w, is the resources/emissions of class i that caused environmental impacts with class w, and is the characteristic factor of resources/emissions with class i.
2.3. The GaBi Evaluation Model
Based on the constructed mathematical evaluation model described above, this paper divides the entire power battery into seven major components, including the cathode, anode, electrolyte, separator, casing, cooling liquid, and BMS. For both LFP and NCM batteries, the life cycle assessment models are established for four stages: raw material acquisition, component manufacturing, battery assembly, and end-of-life recycling, using the GaBi platform as a foundation.
2.3.1. The Lithium Iron Phosphate (LFP) Battery Evaluation Model
This study selects lithium iron phosphate (LFP) batteries with an energy density of 170 Wh/kg as the research object. Based on the previously selected 57 kWh battery capacity, the calculated battery mass for the LFP battery under investigation is 335 kg. The inventory of raw materials acquisition in the LFP battery life cycle is obtained through data research, literature compilation, and company surveys, as shown in Table 3.
The production process of the power battery can be divided into three stages: electrode manufacturing (front-end), cell assembly (middle-stage), and cell activation testing and battery packaging (back-end). The structure of the lithium iron phosphate (LFP) battery is complex, with numerous specific components, making it challenging to trace the energy consumption for each component’s manufacturing and assembly. Therefore, this study selects the energy consumption data for a unit power battery manufacturing process and calculates the energy consumption required for the LFP battery manufacturing stage. According to the literature, the production of 1 kg of lithium iron phosphate battery consumes approximately 11.7 kWh of electrical energy and 8.8 MJ of natural gas thermal energy [14]. Hence, in this modeling process, the LFP battery production stage requires a total of 3919.5 kWh of electrical energy and 2948 MJ of thermal energy. Research conducted by the Argonne National Laboratory (ANL) in the United States indicates that the energy consumption during the assembly process of electric vehicle lithium-ion power batteries is directly proportional to their mass, with an average of 2.67 MJ/kg. Furthermore, this study assumes that the energy consumption during the assembly stage is entirely from electrical energy, requiring a total of 894.45 MJ of electrical energy [37,38].
At present, power battery recycling technology in China is not yet mature. The current power battery scrapping and dismantling mainly adopt two mainstream methods: dry recycling and wet recycling. The main materials recovered are the metal materials from the power battery, especially the cathode materials of the battery pack. Due to the difficulty in recycling electrolyte and other component materials, the low recycling rate, and the high economic cost, this study only considers the recycling of metal materials. The recycling method adopted in this study is wet recycling. The material energy consumption and recycling efficiency required for the recycling of 1 kWh of an LFP battery are shown in Table 4.
2.3.2. The Evaluation Model for Ternary Lithium-Ion Batteries
The NCM battery and LFP battery have similar basic components, with the main difference being the proportions of battery materials and the positive electrode active materials. For the LFP battery, the positive electrode material is lithium iron phosphate, while the ternary lithium-ion battery (NCM battery) consists of nickel–cobalt–manganese ternary materials. In this study, a ternary lithium-ion battery with an energy density of 175 Wh/kg was selected as the research object. Based on the previously chosen functional unit of a 57 kWh battery capacity, the total mass of the ternary lithium-ion battery under study was calculated to be 326 kg. The material inventory for the NCM battery’s raw material acquisition phase is presented in Table 5.
The method for calculating the energy consumption data during the manufacturing and assembly stage of NCM batteries is the same as that used for LFP batteries in the previous section. The energy consumption data for the NCM battery manufacturing stage is obtained based on the energy consumption data for the unit power battery manufacturing process [40]. According to the literature, the NCM battery manufacturing stage requires a total of 3814.2 kWh of electrical energy and 2868.8 MJ of thermal energy. The research conducted by the US ANL laboratory indicates that the energy consumption during the assembly process of lithium-ion batteries for electric vehicles is proportional to the mass, approximately 2.67 MJ/kg [38,40]. With the total weight of the NCM battery being 326 kg, and assuming that all energy consumption during the assembly stage comes from electricity, the NCM battery assembly stage requires a total of 870.42 MJ of electrical energy. The recycling process for the scrapped NCM batteries involves steps such as disassembly, pre-treatment, physical separation, post-treatment, etc., to finally extract materials such as cobalt sulfate, nickel sulfate, manganese sulfate, and lithium fluoride, and achieve the effective recycling of the batteries. The material inventory and quantities required for recycling 1 kWh of NCM batteries are presented in Table 6.
3. Evaluation Results Analysis
3.1. Resource Depletion Results Analysis
Based on the constructed mathematical evaluation models, the GaBi model, and utilizing the CML2001 evaluation method, the resource depletion life cycle characterization results for the two batteries, LFP and NCM, are obtained and presented in Table 7.
(1) Depletion of Mineral Resources
The proportion of mineral resource depletion during the life cycle of the two power batteries is shown in Figure 2. According to Figure 2, the mineral resource consumption during the raw material acquisition stage accounts for over 50% for both types of batteries, followed by the end-of-life recycling stage. The mineral resource consumption during the battery production and manufacturing stages can be considered negligible. The specific mineral resource consumption during the raw material acquisition stage and end-of-life recycling stage for both batteries is depicted in Figure 3. It can be observed from Figure 3 that the mineral resource consumption for the NCM battery is 1.10 × 10⁻¹, and for the LFP battery is 1.07 × 10⁻¹. Both batteries exhibit significant mineral resource depletion during the raw material acquisition stage, mainly due to the substantial proportion of positive and negative electrode active materials in addition to metals such as copper, aluminum, and steel in the batteries. During the end-of-life recycling stage, the recycling of metal materials leads to a positive resource depletion benefit for both NCM and LFP batteries. However, the recycling process for NCM batteries is more complex and challenging, resulting in slightly lower positive benefits compared to LFP batteries in the end-of-life recycling stage. As a result, the overall mineral resource consumption for NCM batteries is higher than that of LFP batteries.
(2) Fossil energy consumption
The proportion of fossil energy depletion during the life cycle of the two power batteries is shown in Figure 4. It is evident from Figure 4 that the fossil energy consumption of power batteries is mainly concentrated in the raw material acquisition and battery production and manufacturing stages. All components of the power batteries contribute to fossil energy depletion during the raw material extraction and processing processes. In the battery production and manufacturing stage, the fossil energy depletion is mainly reflected in the battery preparation process. The total fossil energy depletion values for the life cycle of the two batteries are depicted in Figure 5. According to Figure 5, the total fossil energy consumption for NCM batteries is 6.5 × 10⁴, and for LFP batteries is 4.7 × 10⁴.
During the production and manufacturing stage, fossil energy consumption mainly originates from the electricity usage in material processing and battery formation processes. In China, the current power structure is still heavily reliant on fossil fuel-based power generation [36], with a relatively low proportion of clean energy generation. Consequently, the substantial electricity consumption during battery manufacturing leads to significant fossil energy depletion. In the battery scrap and recycling stage, fossil energy consumption arises from both the electricity consumption in the recycling process and the consumption of relevant materials. Additionally, due to the recycling of positive and negative electrode active materials, power batteries generate some positive benefits during the scrap and recycling stage. However, NCM batteries, with their positive electrode active material being nickel–cobalt–manganese, have more complex recycling processes and involve more chemical materials, resulting in lower positive fossil energy depletion benefits.
In summary, LFP batteries have certain advantages in terms of mineral resource consumption and fossil energy consumption. Considering China’s high dependence on imported resources and energy, the development of LFP batteries could become an important technological pathway to alleviate resource scarcity. Meanwhile, when the recycling processes for NCM batteries are simplified and the energy density of lithium-titanate batteries is improved, they are also expected to yield favorable positive benefits in terms of fossil energy depletion values.
3.2. Analysis of Environmental Impact Results
Based on the constructed mathematical evaluation model, the GaBi model, and the CML2001 evaluation method, the environmental impact life cycle characterization results for both batteries have been obtained. Subsequently, the life cycle characterization results have been normalized for comparison. The normalized results for the life cycle of both batteries are presented in Table 8.
The total environmental impact of gas emissions for both batteries throughout their life cycle is illustrated in Figure 6. Additionally, the percentage contribution of each life cycle stage to the overall environmental impact is shown in Figure 7. According to Figure 6, the total gas emissions for the life cycle of the NCM battery are 1.51 × 10⁻¹⁰, while for the LFP battery, the total gas emissions are 7.19 × 10⁻¹¹.
From Figure 6, it can be observed that for the NCM battery, the GWP, AP, and HTP account for 24%, 36%, and 29%, respectively. On the other hand, for the LFP battery, the main environmental impact is associated with the HTP, which accounts for 57%, followed by the GWP at 27%. The high contributions of GWP and HTP in both battery types are mainly attributed to the extraction and preparation of copper in the positive and negative electrode materials of the batteries. Additionally, the GWP is influenced by the extraction and preparation of aluminum metal materials, positive electrode active materials, and the energy consumption throughout the life cycle. To effectively mitigate the environmental impact of the entire life cycle of the batteries, various measures such as seeking green alternative materials in the battery components, lightweighting of batteries, and improving the power structure in China are all essential strategies. Implementing these measures can significantly improve the overall environmental performance of the entire battery industry and lay a solid foundation for sustainable and green development in the battery industry.
From Figure 7, it is evident that for the GWP, all four types of batteries predominantly exhibit the highest impact in the raw material acquisition stage. Among them, the GWP contribution in the raw material acquisition stage of the LFP battery is the highest, accounting for approximately 72%. As for the AP, the highest emissions are also attributed to the raw material acquisition stage, with the NCM battery showing the highest contribution at around 87%. For EP in water bodies, it is mainly observed in both the raw material acquisition stage and the battery production and manufacturing stage for all battery types. Regarding the ODP, in the LFP battery, it is primarily observed in the production and manufacturing stage as well as the end-of-life (recycling) stage. On the other hand, in the NCM battery, ODP mainly occurs in the raw material acquisition stage and the end-of-life stage.
Therefore, from the perspective of dual carbon, to expedite China’s process of carbon peaking and carbon neutrality, it is essential to fully consider the utilization of lightweight and environmentally friendly alternative materials, such as copper and aluminum, at the stage of obtaining raw materials for power batteries. At the level of positive and negative electrode active material preparation, this can be achieved by simplifying the process flow and reducing the use of chemical materials. On the production and manufacturing level, it is imperative to accelerate the establishment of a clean energy system and increase the proportion of clean energy in China’s power grid. Moreover, from the perspective of scrap and recycling, it is necessary to enhance the research and development of power battery recycling technologies and expedite the construction of a comprehensive and standardized power battery recycling and utilization system.
4. Scenario Analysis and Discussion
4.1. Scenario Analysis of Different Power Battery Recycling Processes
4.1.1. Recycling Process Scenarios
When the capacity of a power battery decreases to below 60% of its nominal capacity, it enters the End-of-Life (EoL) stage, where it can no longer meet energy storage demands. Lithium-ion batteries, containing abundant metals such as lithium, nickel, cobalt, aluminum, and copper, possess significant economic recycling value [41]. On the other hand, if discarded power batteries are not subjected to recycling processes, the metals and organic substances they contain can lead to environmental pollution and pose health risks to humans [42,43]. Therefore, the recycling of metal materials from power batteries becomes a crucial task during the end-of-life phase. In this context, hydrometallurgical processes, pyrometallurgical processes, and direct physical recycling are the primary technological pathways for battery recycling. Considering the current state of battery recycling and the power battery recycling market in China, four scenarios are selected for comparative analysis: NCM hydrometallurgical recycling, pyrometallurgical recycling, LFP hydrometallurgical recycling, and physical recycling. The process flowcharts for these four recycling methods are illustrated in Figure 8.
4.1.2. Analysis of Evaluation Results
Based on the material and energy consumption data for NCM and LFP recycling stages from the four scenarios mentioned above [44,45], and utilizing the GaBi model, we constructed life cycle assessment models for LFP hydrometallurgical and physical recycling, as well as NCM hydrometallurgical and pyrometallurgical recycling. These models were employed to conduct a life cycle impact assessment and analysis of the four recycling processes. The values of ADP(f) and GWP during the LFP and NCM recycling stages under different scenarios are presented in Figure 9. Additionally, Figure 10 illustrates the impact of the end-of-life recycling stages on the overall battery life cycle under different recycling processes. From Figure 9, it is evident that LFP wet recycling yields the highest resource and environmental benefits, while LFP physical recycling results in the lowest resource benefits and is accompanied by a minor global warming gas emission.
Based on Figure 9, it can be observed that, in terms of fossil energy consumption, LFP wet recycling exhibits the highest positive effect, followed by NCM wet recycling, NCM pyrometallurgical recycling, and LFP physical recycling, which shows the lowest energy benefits. Concerning the global warming potential, the benefits generated by different recycling processes rank as follows: LFP wet recycling > NCM wet recycling > NCM dry recycling > LFP physical recycling. The relatively high fossil energy consumption and global warming gas emissions in LFP physical recycling are attributed to the need for secondary processing due to the inability to directly recycle and utilize the materials recovered. In the case of NCM pyrometallurgical recycling, the electric energy consumption during material smelting contributes to a certain level of fossil energy consumption and global warming gas emissions. Considering that NCM batteries require the recycling of a greater variety of materials and involve a larger amount of chemical materials consumption compared to LFP batteries, the recycling benefits of NCM batteries are lower than those of LFP batteries.
Referring to Figure 10, it can be deduced that the recycling of waste power batteries can result in a certain degree of positive energy and environmental effects throughout the battery’s life cycle, with the wet recycling process generating the most significant life cycle energy consumption and environmental emissions. Among the four recycling processes, the order of fossil energy consumption and global warming potential during the battery’s life cycle, from highest to lowest, is as follows: NCM (pyrometallurgical recycling) > NCM (wet recycling) > LFP (physical recycling) > LFP (wet recycling). Therefore, lithium-ion batteries (specifically NCM batteries) show slightly higher fossil energy consumption and global warming emissions compared to lithium iron phosphate batteries (LFP batteries). Consequently, LFP batteries are more resource-efficient and environmentally friendly than NCM batteries.
4.2. Benefit Analysis of Decommissioned Power Battery Trapezoidal Utilization
4.2.1. Laddering of Utilization Scenarios
To further assess the energy and environmental benefits of the cascaded utilization stage in power batteries, this study employs the LCA approach. Various factors are taken into consideration, including the prevalence of retired LFP batteries, the higher proportion of LFP batteries among potential retired battery structures, and the lower cycle numbers and disassembly complexity of LFP batteries compared to ternary lithium batteries. Consequently, this research focuses on retired LFP batteries for the cascaded utilization study. The study involves analyzing the material and energy flows during the cascaded utilization stage of LFP batteries. A comprehensive life cycle assessment model is developed to quantitatively evaluate the energy and environmental benefits generated during this stage. The research primarily adopts a recycling approach at the module level of retired batteries. The system boundary for the cascaded utilization of retired batteries is illustrated in Figure 11.
The study focuses on a domestic power battery cascaded utilization project, which involves the refurbishment of retired LFP battery modules. These modules undergo a process of disassembly, screening, and performance testing. Any non-compliant individual cells and circuit boards are replaced and adjusted as needed. Subsequent to welding and thorough testing, the cells are reassembled into series and parallel configurations for reintegration into service. Building upon the previously proposed 50% individual cell conversion rate, this study assumes a battery pack reuse rate of 50%. Additionally, both the power battery cooling system and the battery management system (BMS) are entirely replaced with a 100% renewal rate. Consequently, the battery remanufacturing stage involves the construction of new BMS, cooling systems, and fresh housing components. The materials required for remanufacturing the retired lithium iron phosphate batteries at this stage are outlined in Table 9, which includes the BMS, cooling liquid, and housing components detailed in earlier sections. During the modeling process, polyvinyl chloride (PVC) is used as a substitute for the plastic shell, and pure nickel connectors are employed. The primary materials for the wiring harness consist of copper wire and plastic. To underscore the energy and emissions benefits associated with the cascaded utilization of power batteries, particular attention is given to the stages of raw materials acquisition for lithium iron phosphate batteries, component manufacturing, and battery assembly in the construction of alternative batteries. This approach specifically focuses on assessing energy consumption and emissions during the battery assembly process, thereby facilitating a comparative analysis during the battery remanufacturing stage of retired power batteries. Taking into account the chosen functional units in this chapter, along with their individual cell energy density, the mass of the newly constructed lithium iron phosphate replacement battery is estimated to be approximately 134 kg.
4.2.2. Analysis of Evaluation Results
This study is grounded in localized national data and employs the widely recognized CML2001 characterization method integrated within the GaBi platform, a commonly utilized tool for scholars conducting life cycle assessments. Similar to the preceding sections, the environmental impact indicators for the life cycle assessment are organized into eight categories: ADP(e), ADP(f), GWP, AP, EP, POCP, HTP, and ODP. These impact indicators serve to characterize and assess the environmental effects, with the corresponding results being interpreted and analyzed accordingly. The characterization results and benefit values for the cascaded utilization of power batteries are presented in Table 10.
The resource depletion assessment indicators considered in this study mainly encompass ADP(e) and ADP(f). Based on the earlier mentioned characterization results, it is evident that the cascaded utilization stage of power batteries yields a positive effect of 3.38 × 10⁻² kg Sb-eq in element resource consumption and a positive effect of 8.18 × 10³ MJ in fossil energy consumption. According to the characterization assessment findings, the distribution of positive effects in resource depletion resulting from cascaded utilization is depicted in Figure 12. From Figure 12, it is observable that through the cascaded utilization of power batteries, in terms of battery production and manufacturing, approximately 76% of the positive effect in ADP(e) and 83% of the positive effect in ADP(f) are generated.
After conducting impact assessment calculations for the cascaded utilization stage of retired lithium iron phosphate batteries, this study selects GWP, AP, EP, POCP, HTP, and ODP for interpretation and analysis, in accordance with the CML2001 characterization method discussed in the preceding sections.
The results of positive effects on environmental impact categories during the cascaded utilization stage of power batteries are presented in Figure 13. From Figure 13, it is evident that the cascaded utilization stage of power batteries generates the following positive effects: 1.59 × 10³ kg CO2-eq of global warming potential, 6.31 × 100 kg SO2-eq of acidification potential, 2.36 × 10⁻¹ kg phosphate-eq of eutrophication potential, 3.94 × 10⁻¹ kg Ethene-eq of photochemical ozone creation potential, 1.17 × 10³ kg DCB-eq of human toxicity potential, and 8.20 × 10⁻¹⁰ kg R11-eq of ozone depletion potential. Furthermore, Figure 14 illustrates the contribution of each environmental impact category to the overall positive effects during the cascaded utilization of power batteries. It can be observed that GWP, AP, EP, POCP, HTP, and ODP contribute 94%, 93%, 84%, 92%, 98%, and 33% of the total positive effects on environmental impacts during the cascaded utilization process of power batteries, respectively.
Based on Figure 13, it is evident that the cascaded utilization stage of power batteries exhibits favorable positive environmental impacts on emissions. Specifically, the reduction rates of HTP, GWP, and AP are as high as 97%, 94%, and 93%, respectively. The main contributing factors are as follows: HTP is primarily associated with the extraction and preparation of copper, which is present in both the positive and negative electrode materials of power batteries; GWP and AP are mainly linked to the extraction and preparation of aluminum, as well as the extraction and preparation of positive electrode active materials, along with the electric energy consumption during the battery production and manufacturing process. The cascaded utilization of power batteries involves the retesting and remanufacturing of retired power batteries as a substitute for new power batteries, thereby avoiding the need for new battery material acquisition and battery production and manufacturing processes. As a result, cascaded utilization demonstrates notable reductions in environmental impacts such as HTP, GWP, and AP. In contrast, the ODP exhibits a lower benefit percentage of only 30%. This is primarily because ODP is mainly generated during the battery’s end-of-life recycling stage, with the production and manufacturing stage contributing only around one-third of the total impact. Hence, the ODP reduction effect is relatively limited.
In conclusion, the cascaded utilization stage of power batteries demonstrates significant positive environmental emission benefits. In terms of HTP, its positive effect on cascaded utilization provides a foundation for the sustainable development of human society. From the perspective of GWP, the positive benefits of cascaded utilization offer strong support for the advancement of China’s “dual-carbon” strategy. Concerning AP, the positive benefits of cascaded utilization will effectively optimize China’s air quality index and contribute to the country’s efforts in combating atmospheric pollution.
4.3. Sensitivity Analysis Considering the Individual Cell Conversion Rate
Based on the preceding statements, it is evident that the individual cell conversion rate during the cascaded utilization stage of power batteries will determine the battery performance, capacity, and relevant quality parameters of the retired power batteries that are remanufactured and reused. This parameter will have a significant impact on the energy consumption and emissions during the cascaded utilization stage of power batteries. Therefore, this study selects the individual cell conversion rate as the key sensitive parameter and conducts a one-factor sensitivity analysis. The baseline value for the individual cell conversion rate is set at 50%, as mentioned earlier, and it is varied above and below this baseline value. Considering the specific conditions of the cascaded utilization of power batteries, five sets of data are chosen for sensitivity analysis, corresponding to individual cell conversion rates of 30%, 40%, 50%, 60%, and 70%. In the context of retired power batteries having an 80% residual capacity after being removed from new energy vehicles, the battery capacity and related quality parameters for different individual cell conversion rates of retired power batteries are presented in Table 11.
With reference to the relevant parameters in Table 10 and applying them to the cascaded utilization LCA model developed earlier, the fluctuation in energy depletion and environmental emissions resulting from variations in the individual cell conversion rate is depicted in Table 12 and Figure 15. Additionally, the sensitivity of the evaluation indicators’ benefits percentage to changes in the individual cell conversion rate is shown in Table 13 and Figure 16. As observed in Figure 15, the various evaluation indicators demonstrate an increasing trend with the rise in the individual cell conversion rate during the cascaded utilization stage of power batteries. This suggests that as the individual cell conversion rate increases, the benefits in terms of resource depletion and environmental impact during the life cycle also increase.
As evident from the sensitivity variation curves of various evaluation indicators in Figure 15, fluctuations in the sensitive factor of the individual cell conversion rate lead to noticeable impacts. Notably, the ODP exhibits particularly prominent sensitivity, with a substantial change rate of 125% when the individual cell conversion rate reaches 70%. Following this, the EP demonstrates a change rate of 88% at the peak point, which occurs when the individual cell conversion rate reaches 60%. As the individual cell conversion rate continues to increase, the change rate only rises slightly to 89%. In contrast, evaluation indicators such as HTP, AP, and GWP show relatively lower sensitivity to changes in the individual cell conversion rate.
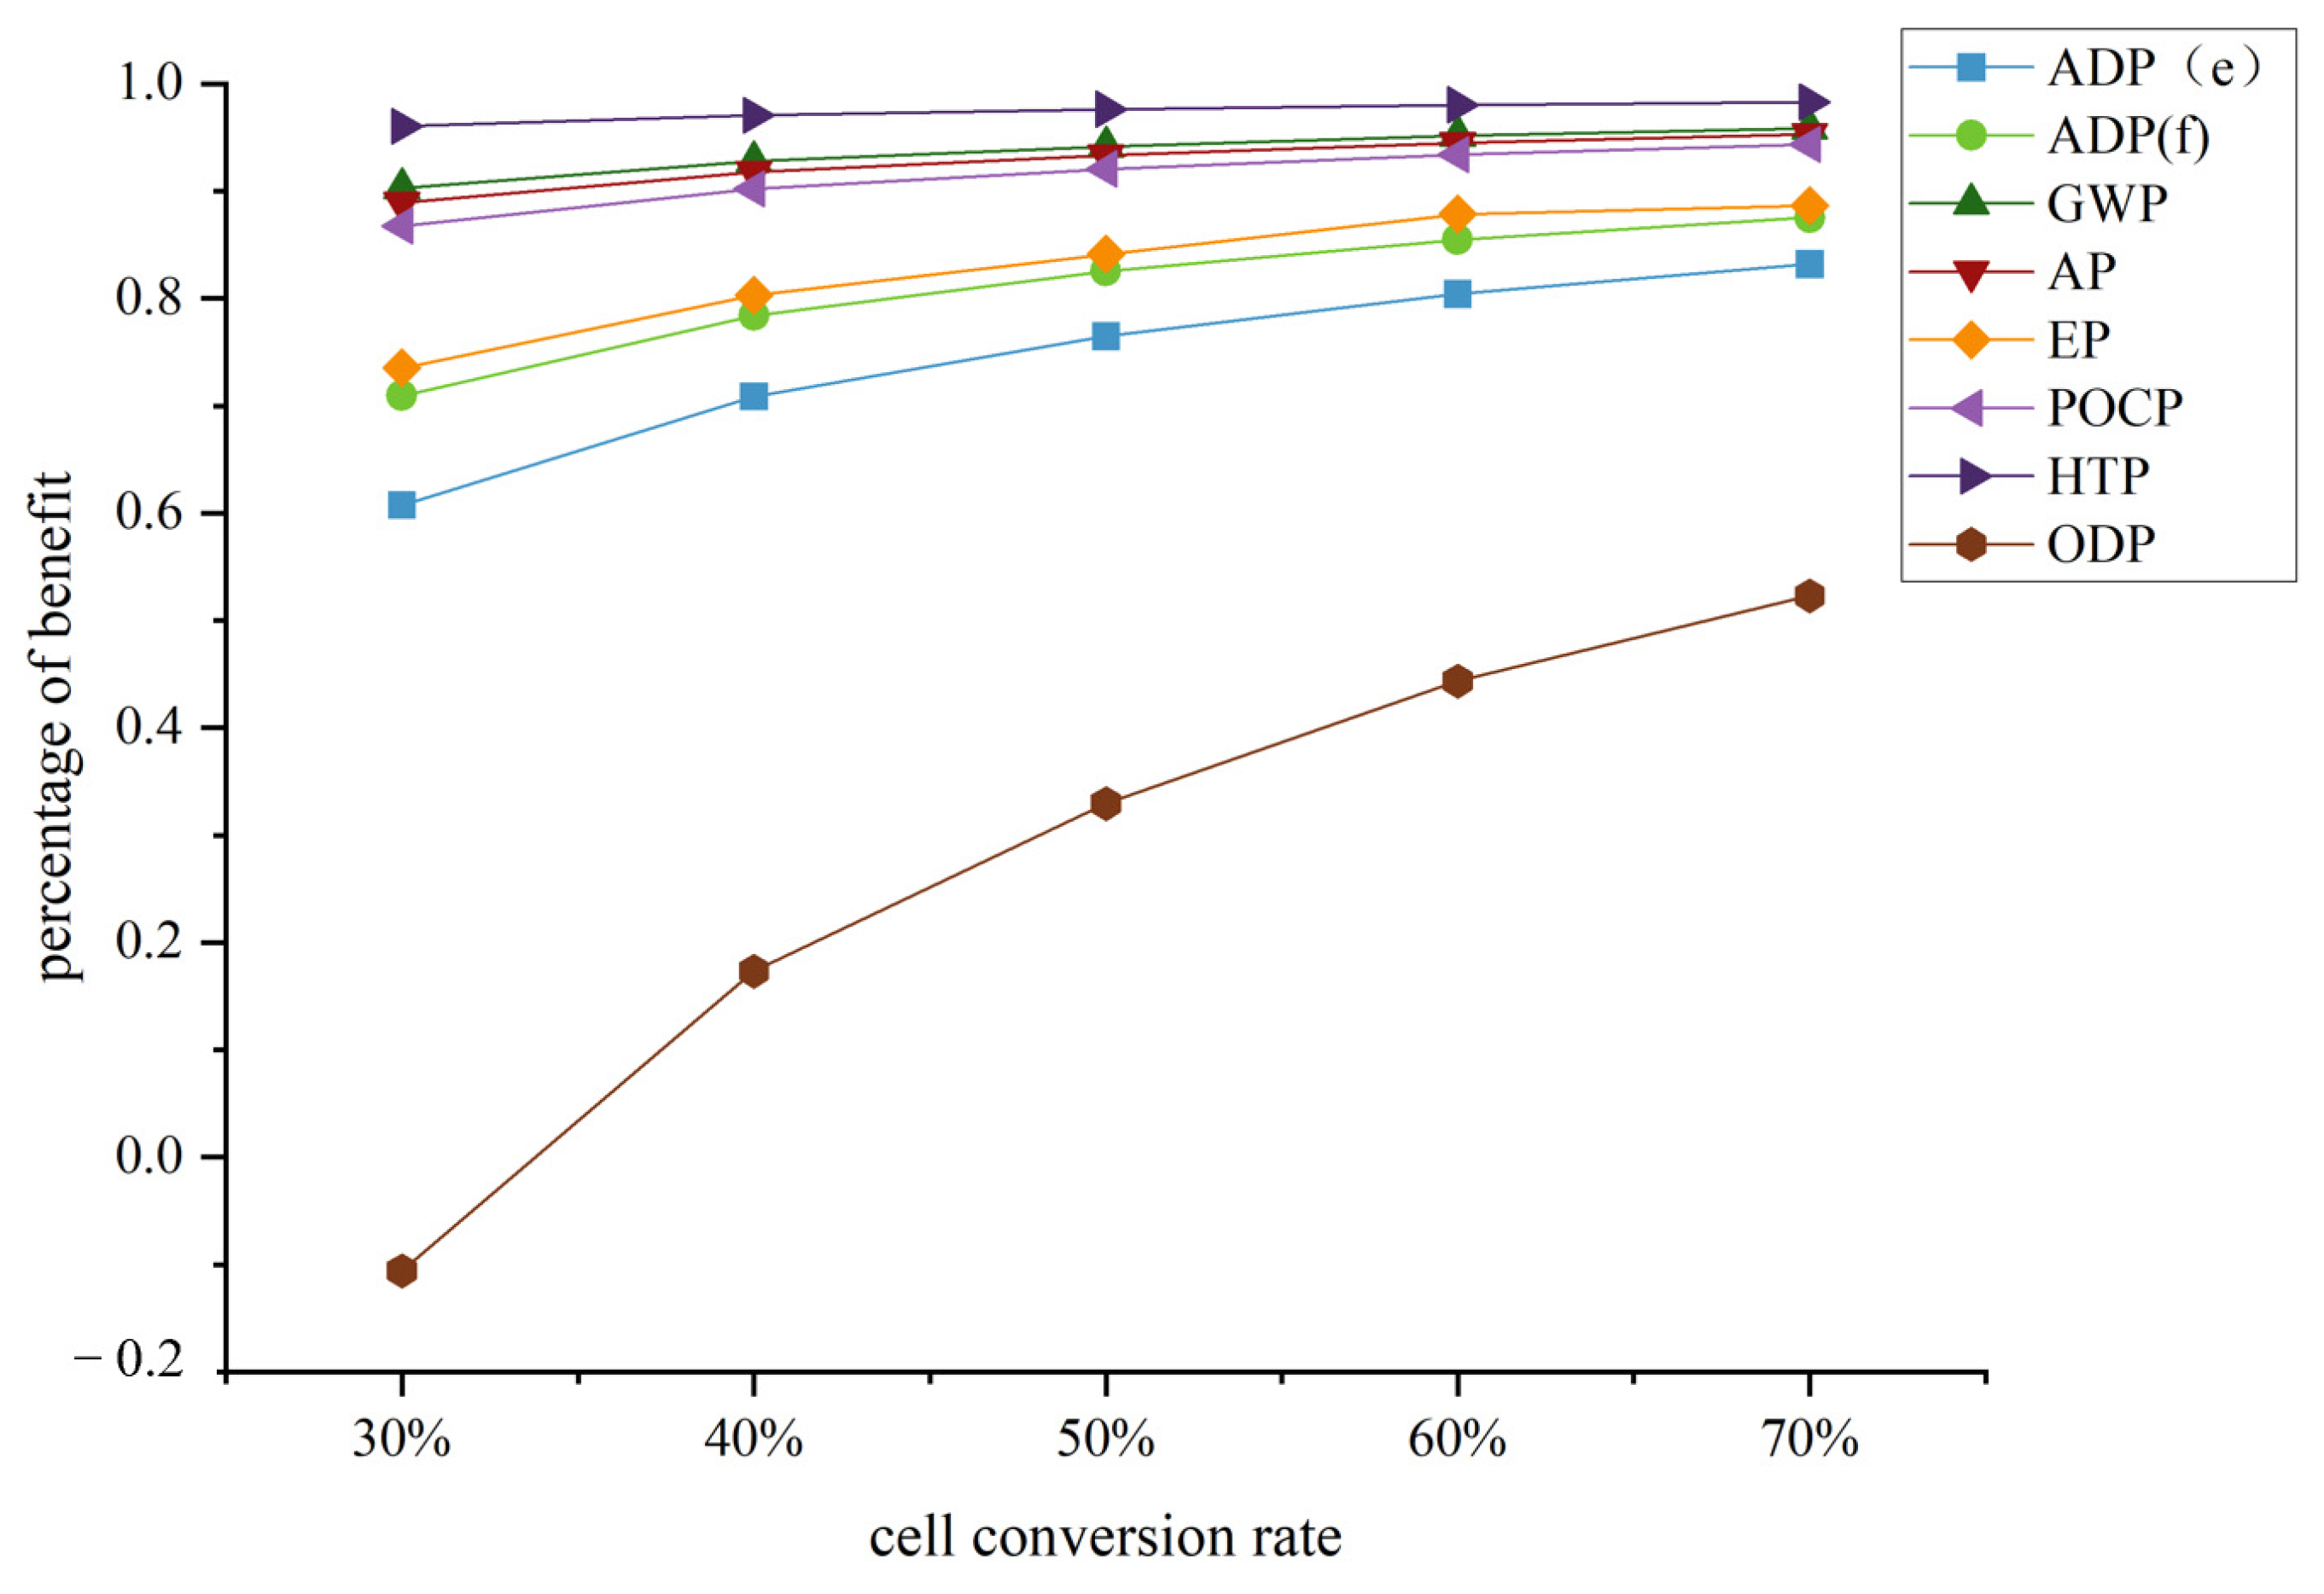
As the individual cell conversion rate varies, the benefits percentage of various evaluation indicators also fluctuates. From Figure 16, it can be observed that changes in the individual cell conversion rate lead to fluctuations in the benefits percentages of different indicators. Specifically, the benefits percentages of HTP and GWP fluctuate between 90% and 100%, indicating a relatively stable range. Similarly, the benefits percentages of AP and POCP fluctuate within the range of 80% to 90%. These indicators maintain relatively high benefits percentages with minor variations. On the other hand, the benefits percentage of ADP(f) and EP increases from 74% to 89%, showing a notable improvement. Meanwhile, the benefits percentage of ADP(e) increases from 61% to 83%. The most significant enhancement is observed in the benefits percentage of ODP, which increases from −11% to 52% within the range of individual cell conversion rates from 30% to 70%. These data imply that when the individual cell conversion rate of retired power batteries falls below 30%, positive ODP benefits at the environmental impact level are not achieved.
In summary, during the cascaded utilization stage of power batteries, an increase in the individual cell conversion rate from 30% to 70% leads to a 22% rise in the benefits percentage of ADP(e), reaching 83%, and a 17% increase in the benefits percentage of ADP(f), reaching 88%. In terms of environmental emissions, the growth rate of benefits for HTP, GWP, AP, and POCP is relatively modest, ranging from 2% to 7%. Meanwhile, the benefits percentage of EP experiences a more substantial increase of 15%, reaching 89%. Therefore, from a theoretical perspective, anticipated advancements and enhancements in key technologies for cascaded utilization are likely to effectively raise the individual cell conversion rate, resulting in increased environmental benefits while conserving resources.
5. Conclusions
This article, employing life cycle assessment methods, evaluated and analyzed the life cycle resource benefits and environmental advantages of lithium iron phosphate batteries and ternary lithium batteries. Considering the distinct recovery processes of both battery types, the life cycle resources and environmental advantages of decommissioned lithium iron phosphate batteries were appraised. The findings revealed as follows.
(1) Comparison and Environmental Impact
The comparison of life cycle normalization evaluations for both battery types revealed that lithium iron phosphate batteries possess a lower potential for resource depletion and environmental emissions throughout their life cycle, compared to ternary lithium batteries. The predominant depletion of mineral resources and consumption of fossil energy originate primarily at the raw material acquisition stage. Both battery types exhibit substantial global warming potential and human toxicity potential, with the majority of environmental emissions concentrated at the raw material procurement stage. The lithium iron phosphate batteries exhibit superior environmental benefits during the scrap and recycling phase, surpassing those of ternary lithium batteries. Given China’s significant reliance on imported resources and energy, the advancement of lithium iron phosphate batteries is critical for addressing resource shortages, while further enhancements in the recycling process of NCM batteries and energy density improvements in LFP batteries will lead to additional environmental benefits.
(2) Recycling Process Analysis
The analysis of various life cycle scenarios for power battery recycling processes concluded that wet battery recycling is more beneficial in terms of life cycle energy consumption and environmental emissions compared to pyrometallurgical and physical recycling methods. The wet recycling of lithium iron phosphate batteries yielded the most substantial resource and environmental benefits, with physical recycling demonstrating the least resource benefits and minimal global warming gas emissions. Regarding fossil energy consumption, LFP wet recycling showcased the highest positive fossil energy efficiency. In terms of global warming potential, the benefits generated by different recycling processes are ranked as follows: LFP wet recycling > NCM wet recycling > NCM dry recycling > LFP physical recycling.
(3) Cascading Utilization Benefits Evaluation
The cascaded utilization stage of power batteries produces positive benefits, yielding a positive impact of 3.38 × 10⁻² kg Sb-eq in fossil energy and 8.18 × 10³ MJ in fossil energy consumption. During this process, substantial positive environmental impact benefits are realized, contributing to 94% for GWP, 93% for AP, 84% for EP, 92% for POCP, 98% for HTP, and 33% for ODP. A sensitivity analysis revealed that an increase in the conversion rate of retired power batteries from 30% to 70% in the cascaded utilization stage led to a 22% increase in the efficiency of ADP(e) in resource depletion, reaching 83%. The efficiency of ADP(f) also witnessed a 17% increase, achieving 88%. While the positive growth rate of HTP, GWP, AP, and POCP was relatively modest, ranging from 2% to 7%, the EP benefit saw a notable 15% increase, attaining 89%.
Author Contributions
Conceptualization, Y.L.; Methodology, C.Z.; Software, Z.H.; Validation, X.C.; Formal analysis, C.L.; Investigation, Y.C.; Resources, J.Z.; Supervision, S.W. All authors have read and agreed to the published version of the manuscript.
Funding
This research was funded by the Humanities and Social Sciences Youth Fund of the Ministry of Education (18YJCZH110), the Natural Science Foundation of the Shaanxi Province (Grant No. 2023-JC-QN-0664), the Key Research and Development Program of the Shaanxi Province (Grant No. 2023JBGS-13), the Third Batch of the Youth Joint Scientific Research Team Construction Project of the Zhejiang Institute of Communications (2022QNLH05), and the Fundamental Research Funds for the Central Universities (Grant No. 300102222113 and 300102223204).
Data Availability Statement
Data sharing not applicable.
Conflicts of Interest
The authors declare no conflict of interest.
References
- Hao, Z.; Ma, Y.; Wang, P.; Luo, G.; Chen, Y. A Review of Axial-Flux Permanent-Magnet Motors: Topological Structures, Design, Optimization and Control Techniques. Machines 2022, 10, 1178. [Google Scholar] [CrossRef]
- Xiuqi, L. China Association of Automobile Manufacturers: China’s new energy vehicle production and sales have ranked first globally for 8 consecutive years. China Energy News, 16 January 2023. [Google Scholar]
- Temporelli, A.; Carvalho, M.L.; Girardi, P. Life cycle assessment of electric vehicle batteries: An overview of recent literature. Energies 2020, 13, 2864. [Google Scholar] [CrossRef]
- Sousa, N.; Coutinho-Rodrigues, J. Quest for sustainability: Life-cycle emissions assessment of electric vehicles considering newer Li-Ion batteries. Sustainability 2019, 11, 2366. [Google Scholar]
- Zackrisson, M.; Avellan, L.; Orlenius, J. Life cycle assessment of lithium-ion batteries for plug-in hybrid electric vehicles—Critical issues. J. Clean. Prod. 2010, 18, 1519–1529. [Google Scholar] [CrossRef]
- Cusenza, M.A.; Bobba, S.; Ardente, F.; Cellura, M.; Di Persio, F. Energy and environmental assessment of a traction lithium-ion battery pack for plug-in hybrid electric vehicles. J. Clean. Prod. 2019, 215, 634–649. [Google Scholar] [CrossRef] [PubMed]
- Kantor, I.; Fowler, M.W.; Hajimiragha, A.; Elkamel, A. Air quality and environmental impacts of alternative vehicle technologies in Ontario, Canada. Int. J. Hydrogen Energy 2010, 35, 5145–5153. [Google Scholar] [CrossRef]
- Ahmadi, P.; Raeesi, M.; Changizian, S.; Teimouri, A.; Khoshnevisan, A. Life cycle assessment of diesel, diesel-electric and hydrogen fuel cell transit buses with fuel cell degradation and battery aging using machine learning techniques. Energy 2022, 259, 125003. [Google Scholar] [CrossRef]
- Majeau-Bettez, G.; Hawkins, T.R.; Stromman, A.H. Life cycle environmental assessment of lithium-ion and nickel metal hydride batteries for plug-in hybrid and battery electric vehicles. Environ. Sci. Technol. 2011, 45, 4548–4554. [Google Scholar] [CrossRef] [PubMed]
- Oliveira, L.; Messagie, M.; Rangaraju, S.; Sanfelix, J.; Rivas, M.H.; Van Mierlo, J. Key issues of lithium-ion batteries—From resource depletion to environmental performance indicators. J. Clean. Prod. 2016, 108, 354–362. [Google Scholar] [CrossRef]
- Marques, P.; Garcia, R.; Kulay, L.; Freire, F. Comparative life cycle assessment of lithium-ion batteries for electric vehicles addressing capacity fade. J. Clean. Prod. 2019, 229, 787–794. [Google Scholar] [CrossRef]
- Ambrose, H.; Kendall, A. Understanding the Future of Lithium: Part 2, Temporally and Spatially ResolvedLife-Cycle Assessment Modeling. J. Ind. Ecol. 2020, 24, 90–100. [Google Scholar] [CrossRef]
- Ellingsen, L.A.-W.; Majeau-Bettez, G.; Singh, B.; Srivastava, A.K.; Valøen, L.O.; Strømman, A.H. Life Cycle Assessment of a Lithium-Ion Battery Vehicle Pack. J. Ind. Ecol. 2014, 18, 113–124. [Google Scholar] [CrossRef]
- Dai, Q.; Kelly, J.C.; Gaines, L.; Wang, M. Life Cycle Analysis of Lithium-Ion Batteries for Automotive Applications. Batteries 2019, 5, 48. [Google Scholar] [CrossRef]
- Petersac, J.F.; Weil, M. Providing a Common Base for Life Cycle Assessments of Li-Ion Batteries. J. Clean. Prod. 2018, 171, 704–713. [Google Scholar] [CrossRef]
- Sun, X.; Luo, X.; Zhang, Z.; Meng, F.; Yang, J. Life CycleAssessment of Lithium Nickel Cobalt Manganese Oxide (NCM) Batteries for Electric Passenger Vehicles. J. Clean. Prod. 2020, 273, 123006. [Google Scholar] [CrossRef]
- Accardo, A.; Dotelli, G.; Musa, M.L.; Spessa, E. Life Cycle Assessment of an NMC Battery for Application toElectric Light-Duty Commercial Vehicles and Comparison with a Sodium-Nickel-Chloride Battery. Appl. Sci. 2021, 11, 1160. [Google Scholar] [CrossRef]
- Ahmadi, L.; Young, S.B.; Fowler, M.; Fraser, R.A.; Achachlouei, M.A. A Cascaded Life Cycle: Reuse of Electric Vehicle Lithium-Ion Battery Packs in Energy Storage Systems. Int. J. Life Cycle Assess. 2017, 22, 111–124. [Google Scholar] [CrossRef]
- Chen, M.; Ma, X.; Chen, B.; Arsenault, R.; Karlson, P.; Simon, N.; Wang, Y. Recycling End-of-Life Electric Vehicle Lithium-Ion Batteries. Joule 2019, 3, 2622–2646. [Google Scholar] [CrossRef]
- Jia, Z.; Gao, F.; Du, S.; Sun, B. Life Cycle of Different Application Scenarios of Assessment Lithium-Iron Phosphate Batteries. China Env.-Ment. Sci. 2022, 42, 1975–1984. (In Chinese) [Google Scholar]
- Ioakimidis, C.S.; Murillo-Marrodán, A.; Bagheri, A.; Thomas, D.; Genikomsakis, K.N. Life Cycle Assessment of a Lithium Iron Phosphate (LFP) Electric Vehicle Battery in Second Life Application Scenarios. Sustainability 2019, 11, 2527. [Google Scholar] [CrossRef]
- Lingyun, Z.; Ming, C. Development of a Two-Stage Pyrolysis Process for the End-of-Life Nickel Cobalt Manganese Lithium Battery Recycling from Electric Vehicles. Sustainability 2020, 12, 9164. [Google Scholar]
- Liu, S. Comparative Study on Life Cycle Assessment of Li-Ion Power Battery and Pure Electric Vehicle. Master’s Thesis, Chang’an University, Xi’an, China, 2021. [Google Scholar]
- Sanfélix, J.; Messagie, M.; Omar, N.; Van Mierlo, J.; Hennige, V. Environmental performance of advanced hybrid energy storage systems for electric vehicle applications. Appl. Energy 2015, 137, 925–930. [Google Scholar] [CrossRef]
- Richa, K.; Babbitt, C.W.; Gaustad, G.; Wang, X. A future perspective on lithium-ion battery waste flows from electric vehicles. Resour. Conserv. Recycl. 2014, 83, 63–76. [Google Scholar] [CrossRef]
- Mahmud, M.A.P.; Huda, N.; Farjana, S.H.; Lang, C. Comparative life cycle environmental impact analysis of lithium-ion (LiIo) and nickel-metal hydride (NiMH) batteries. Batteries 2019, 5, 22. [Google Scholar] [CrossRef]
- Blömeke, S.; Scheller, C.; Cerdas, F.; Thies, C.; Hachenberger, R.; Gonter, M.; Herrmann, C.; Spengler, T.S. Material and energy flow analysis for environmental and economic impact assessment of industrial recycling routes for lithium-ion traction batteries. J. Clean. Prod. 2022, 377, 134344. [Google Scholar] [CrossRef]
- Casals, L.C.; García, B.A.; Aguesse, F.; Iturrondobeitia, A. Second life of electric vehicle batteries: Relation between materials degradation and environmental impact. Int. J. Life Cycle Assess. 2018, 22, 82–93. [Google Scholar] [CrossRef]
- Heymans, C.; Walker, S.B.; Young, S.B.; Fowler, M. Economic analysis of second use electric vehicle batteries for residential energy storage and load-levelling. Energy Policy 2014, 71, 22–30. [Google Scholar] [CrossRef]
- Ahmadi, L.; Fowler, M.; Young, S.B.; Fraser, R.A.; Gaffney, B.; Walker, S.B. Energy efficiency of Li-ion battery packs re-used in stationary power applications. Sustain. Energy Technol. Assess. 2014, 8, 9–17. [Google Scholar] [CrossRef]
- Faria, R.; Marques, P.; Garcia, R.; Moura, P.; Freire, F.; Delgado, J.; de Almeida, A.T. Primary and secondary use of electric mobility batteries from a life cycle perspective. J. Power Sources 2014, 262, 169–177. [Google Scholar] [CrossRef]
- Chen, Y.; Lan, L.; Hao, Z.; Fu, P. Cradle-grave energy consumption, greenhouse gas and acidification emissions in current and future fuel cell vehicles: Study based on five hydrogen production methods in China. Energy Rep. 2022, 8, 7931–7944. [Google Scholar] [CrossRef]
- Chen, Y.; Lan, L.; Du, Y.; Wang, T.; Xu, H. Evaluation of environmental benefits and carbon reduction economy of EREV/BEV/ICEV based on life cycle assessment theory. Acta Sci. Circumstantiae 2023, 43, 516–527. [Google Scholar]
- Chen, Y.; Lan, L.; Hao, Z.; Fu, P. Life cycle assessment and key parameters comparison of hydrogen fuel cell vehicle power system. Environ. Sci. 2022, 43, 4402–4412. [Google Scholar]
- Fu, P.; Lan, L.B.; Chen, Y.; Hao, Z.; Xing, Y.X.; Cai, X.; Zhang, C.M.; Chen, Y.S. Life cycle prediction assessment of energy saving and new energy vehicles for 2035. Environ. Sci. 2023, 44, 2365–2374. [Google Scholar]
- Zhang, S.; Zhang, C.; Cai, X.; Lan, L.; Zhang, J. Life cycle prediction assessment of hydrogen fuel cells and diesel heavy-duty commercial vehicles for 2035. Res. Environ. Sci. 2023, 1–17. [Google Scholar] [CrossRef]
- Hao, H.; Mu, Z.; Jiang, S.; Liu, Z.; Zhao, F. GHG emissions from the production of lithium-ion batteries for electric vehicles in China. Sustainability 2017, 9, 504. [Google Scholar] [CrossRef]
- Ma, J. Life Cycle Assessment on a specific BEV with Different Power-Batteries. Master’s Thesis, Chang’an University, Xi’an, China, 2021. [Google Scholar]
- Liu, J. Life Cycle Assessment of Hydrogen Fuel Cell Vehicle. Master’s Thesis, Chang’an University, Xi’an, China, 2021. [Google Scholar]
- Chen, H.; Zhang, T.; Gao, Q.; Han, Z.; Jin, Y.; Li, L.; Yang, K.; Xu, Y.; Liu, X.; Xu, X.; et al. Assessment and management of health status in full life cycle of echelon utilization for retired power lithium batteries. J. Clean. Prod. 2022, 379, 134583. [Google Scholar] [CrossRef]
- Sommerville, R.; Zhu, P.; Rajaeifar, M.A.; Heidrich, O.; Goodship, V.; Kendrick, E. A qualitative assessment of lithium-ion battery recycling processes. Resour. Conserv. Recycl. 2021, 165, 105219. [Google Scholar] [CrossRef]
- Hua, Y.; Liu, X.; Zhou, S.; Huang, Y.; Ling, H.; Yang, S. Toward sustainable reuse of retired lithium-ion batteries from electric vehicles. Resour. Conserv. Recycl. 2021, 168, 105249. [Google Scholar] [CrossRef]
- Richa, K.; Babbitt, C.W.; Nenadic, N.G.; Gaustad, G. Environmental trade-offs across cascading lithium-ion battery life cycles. Int. J. Life Cycle Assess. 2017, 22, 66–81. [Google Scholar] [CrossRef]
- Feng, T.; Guo, W.; Li, Q.; Meng, Z.; Liang, W. Life cycle assessment of lithium nickel cobalt manganese oxide batteries and lithium iron phosphate batteries for electric vehicles in China. J. Energy Storage 2022, 52, 104767. [Google Scholar] [CrossRef]
- Quan, J.; Zhao, S.; Song, D.; Wang, T.; He, W.; Li, G. Comparative life cycle assessment of LFP and NCM batteries including the secondary use and different recycling technologies. Sci. Total Environ. 2022, 819, 153105. [Google Scholar] [CrossRef] [PubMed]
- Wang, Y.; Tang, B.; Shen, M.; Wu, Y.; Qu, S.; Hu, Y.; Feng, Y. Environmental impact assessment of second life and recycling for LiFePO4 power batteries in China. J. Environ. Manag. 2022, 314, 115083. [Google Scholar] [CrossRef] [PubMed]
- Koroma, M.S.; Costa, D.; Philippot, M.; Cardellini, G.; Hosen, S.; Coosemans, T.; Messagie, M. Life cycle assessment of battery electric vehicles: Implications of future electricity mix and different battery end-of-life management. Sci. Total. Environ. 2022, 831, 154859. [Google Scholar] [CrossRef] [PubMed]
Figure 1.
System Boundary Diagram.
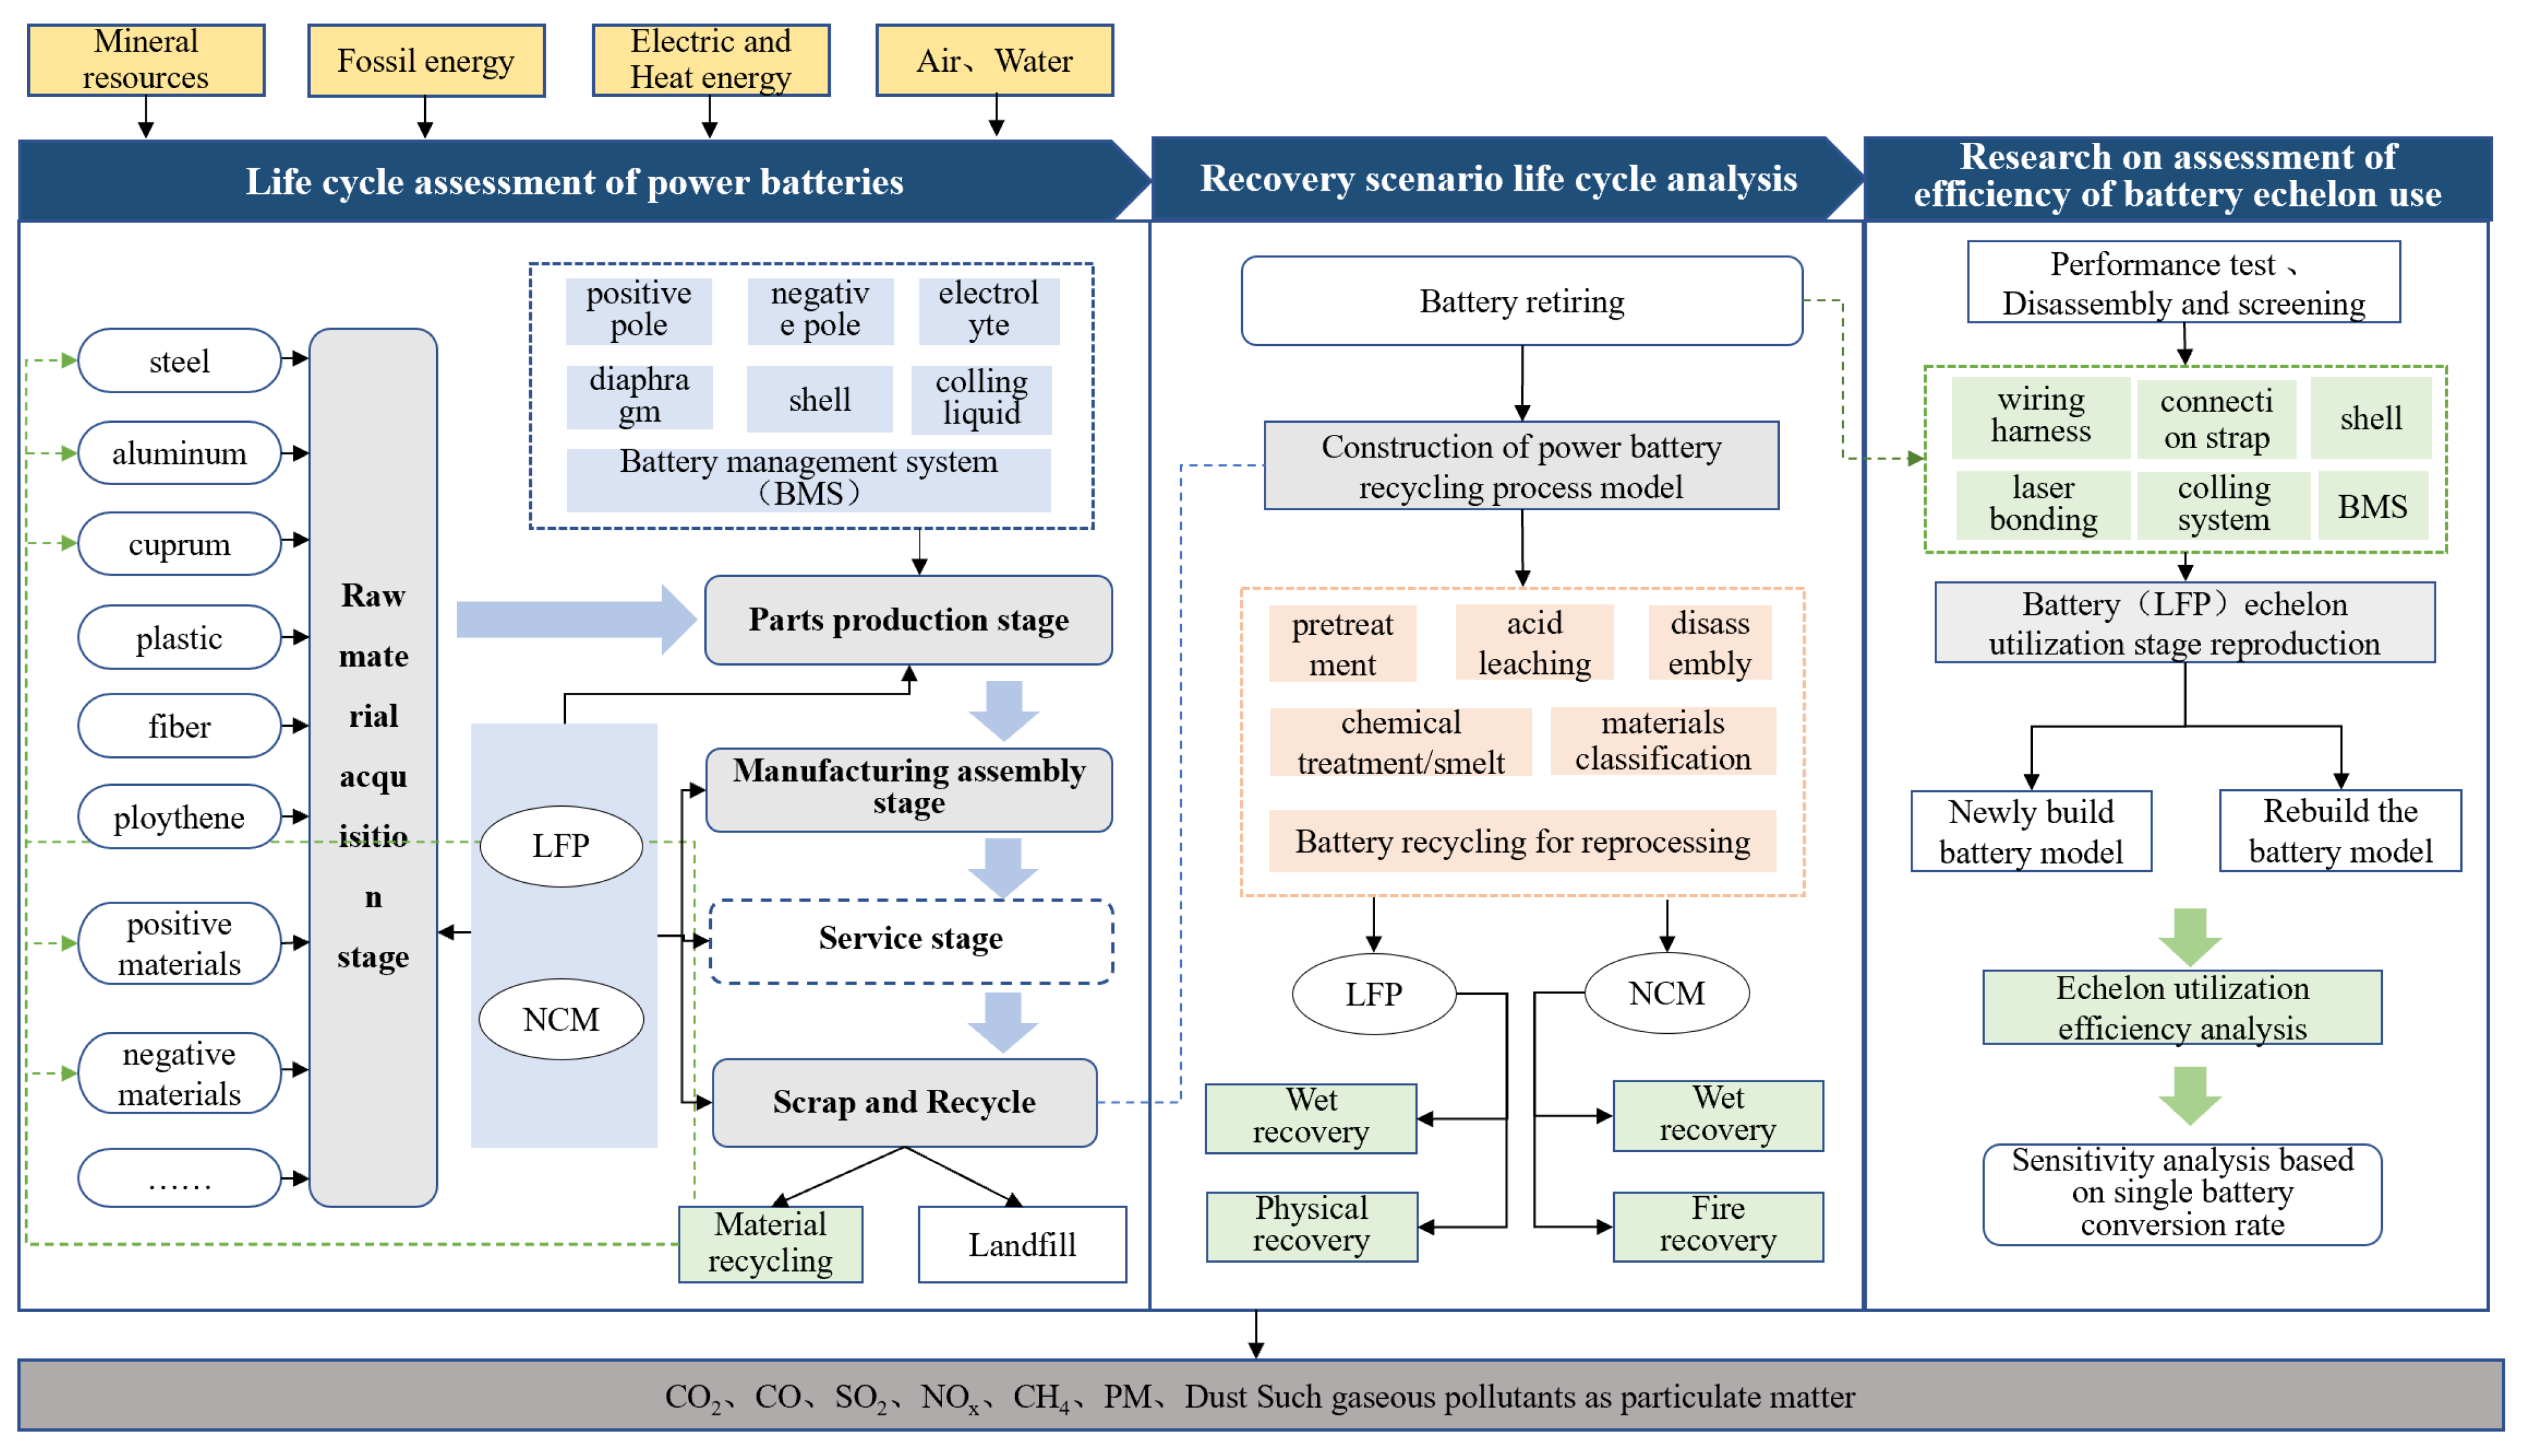
Figure 2.
Consumption ratio of mineral resources in each stage of the two power batteries. (a) LFP, (b) NCM.
Figure 2.
Consumption ratio of mineral resources in each stage of the two power batteries. (a) LFP, (b) NCM.
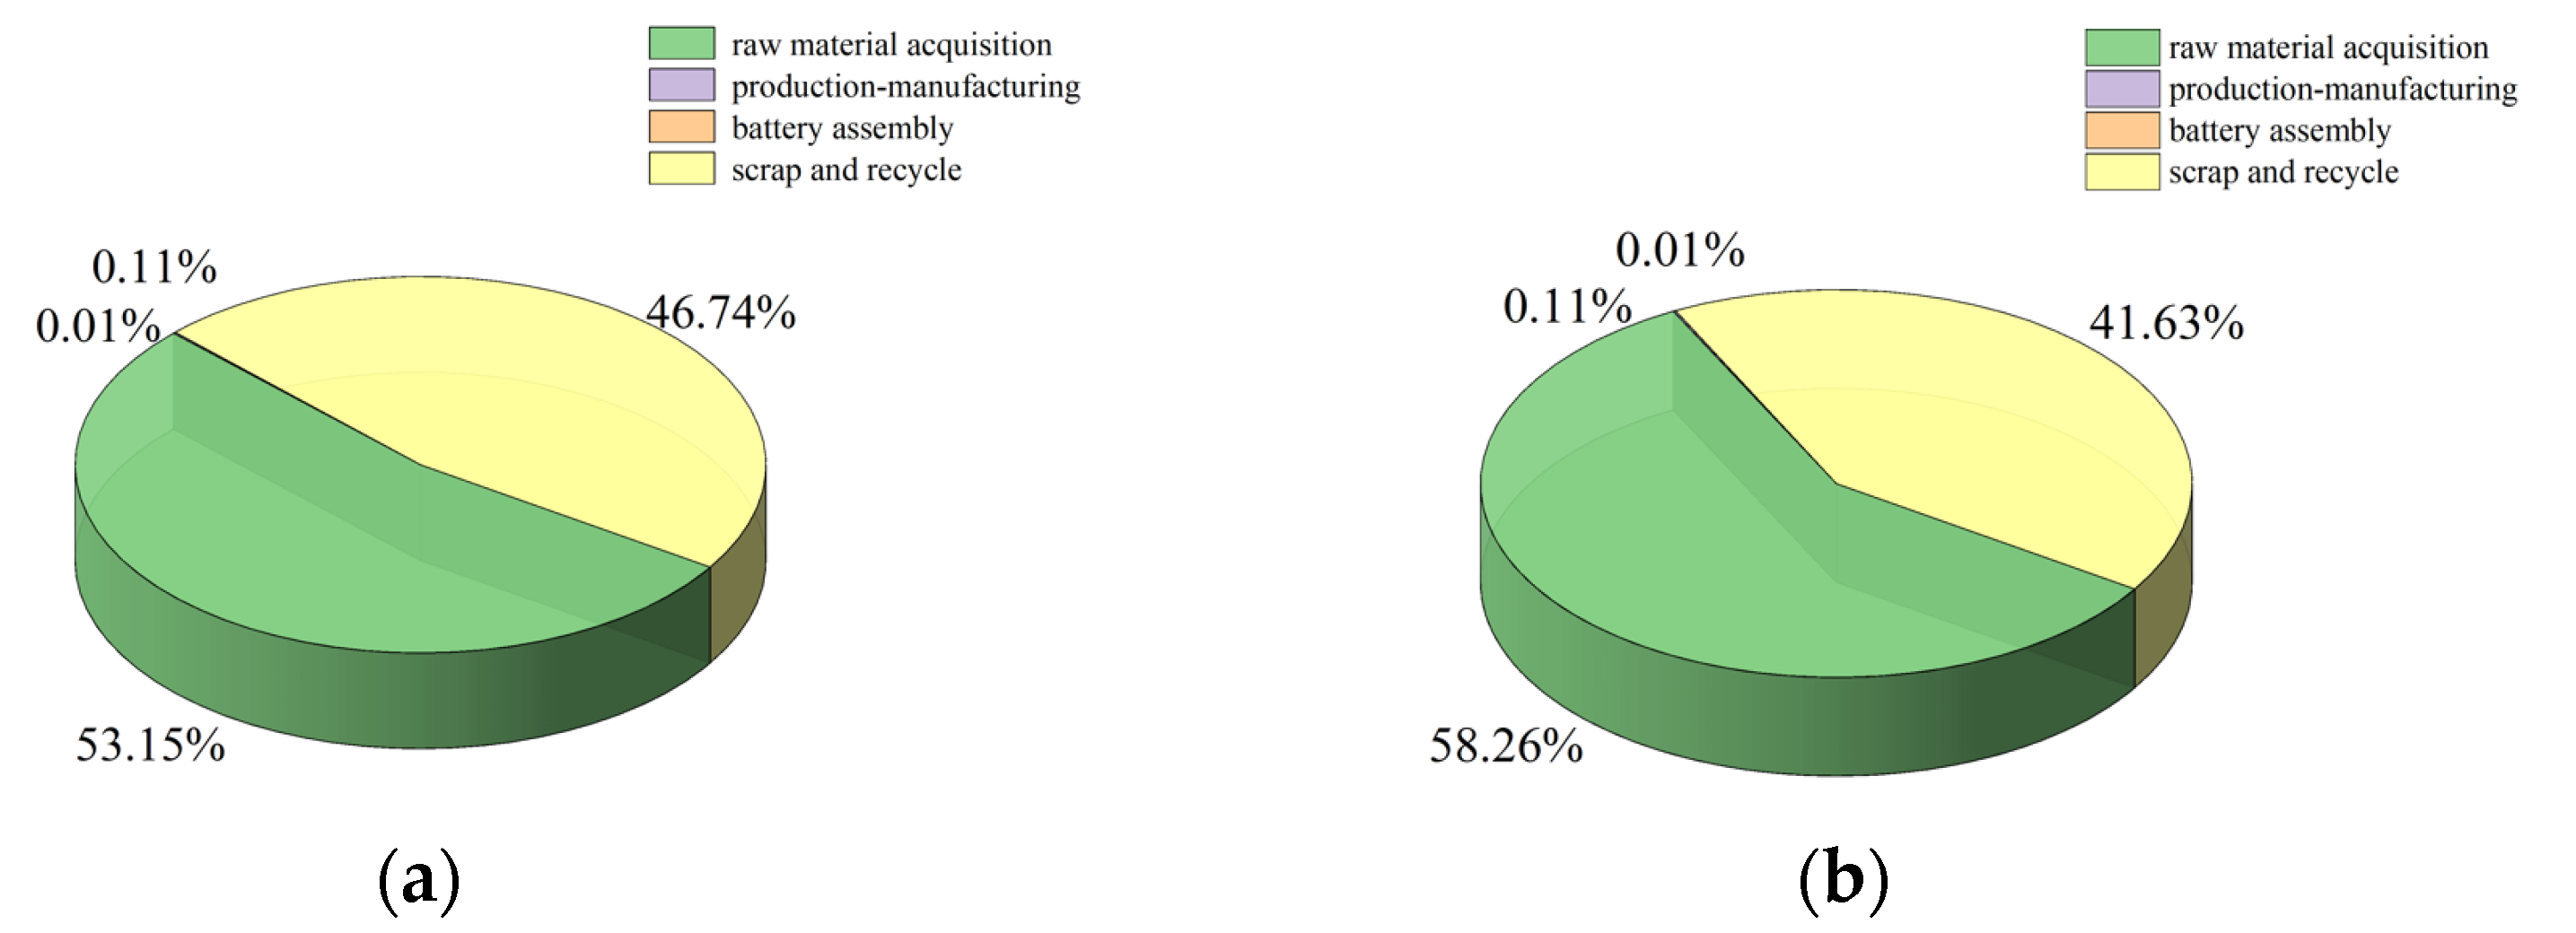
Figure 3.
Mineral resource depletion value.
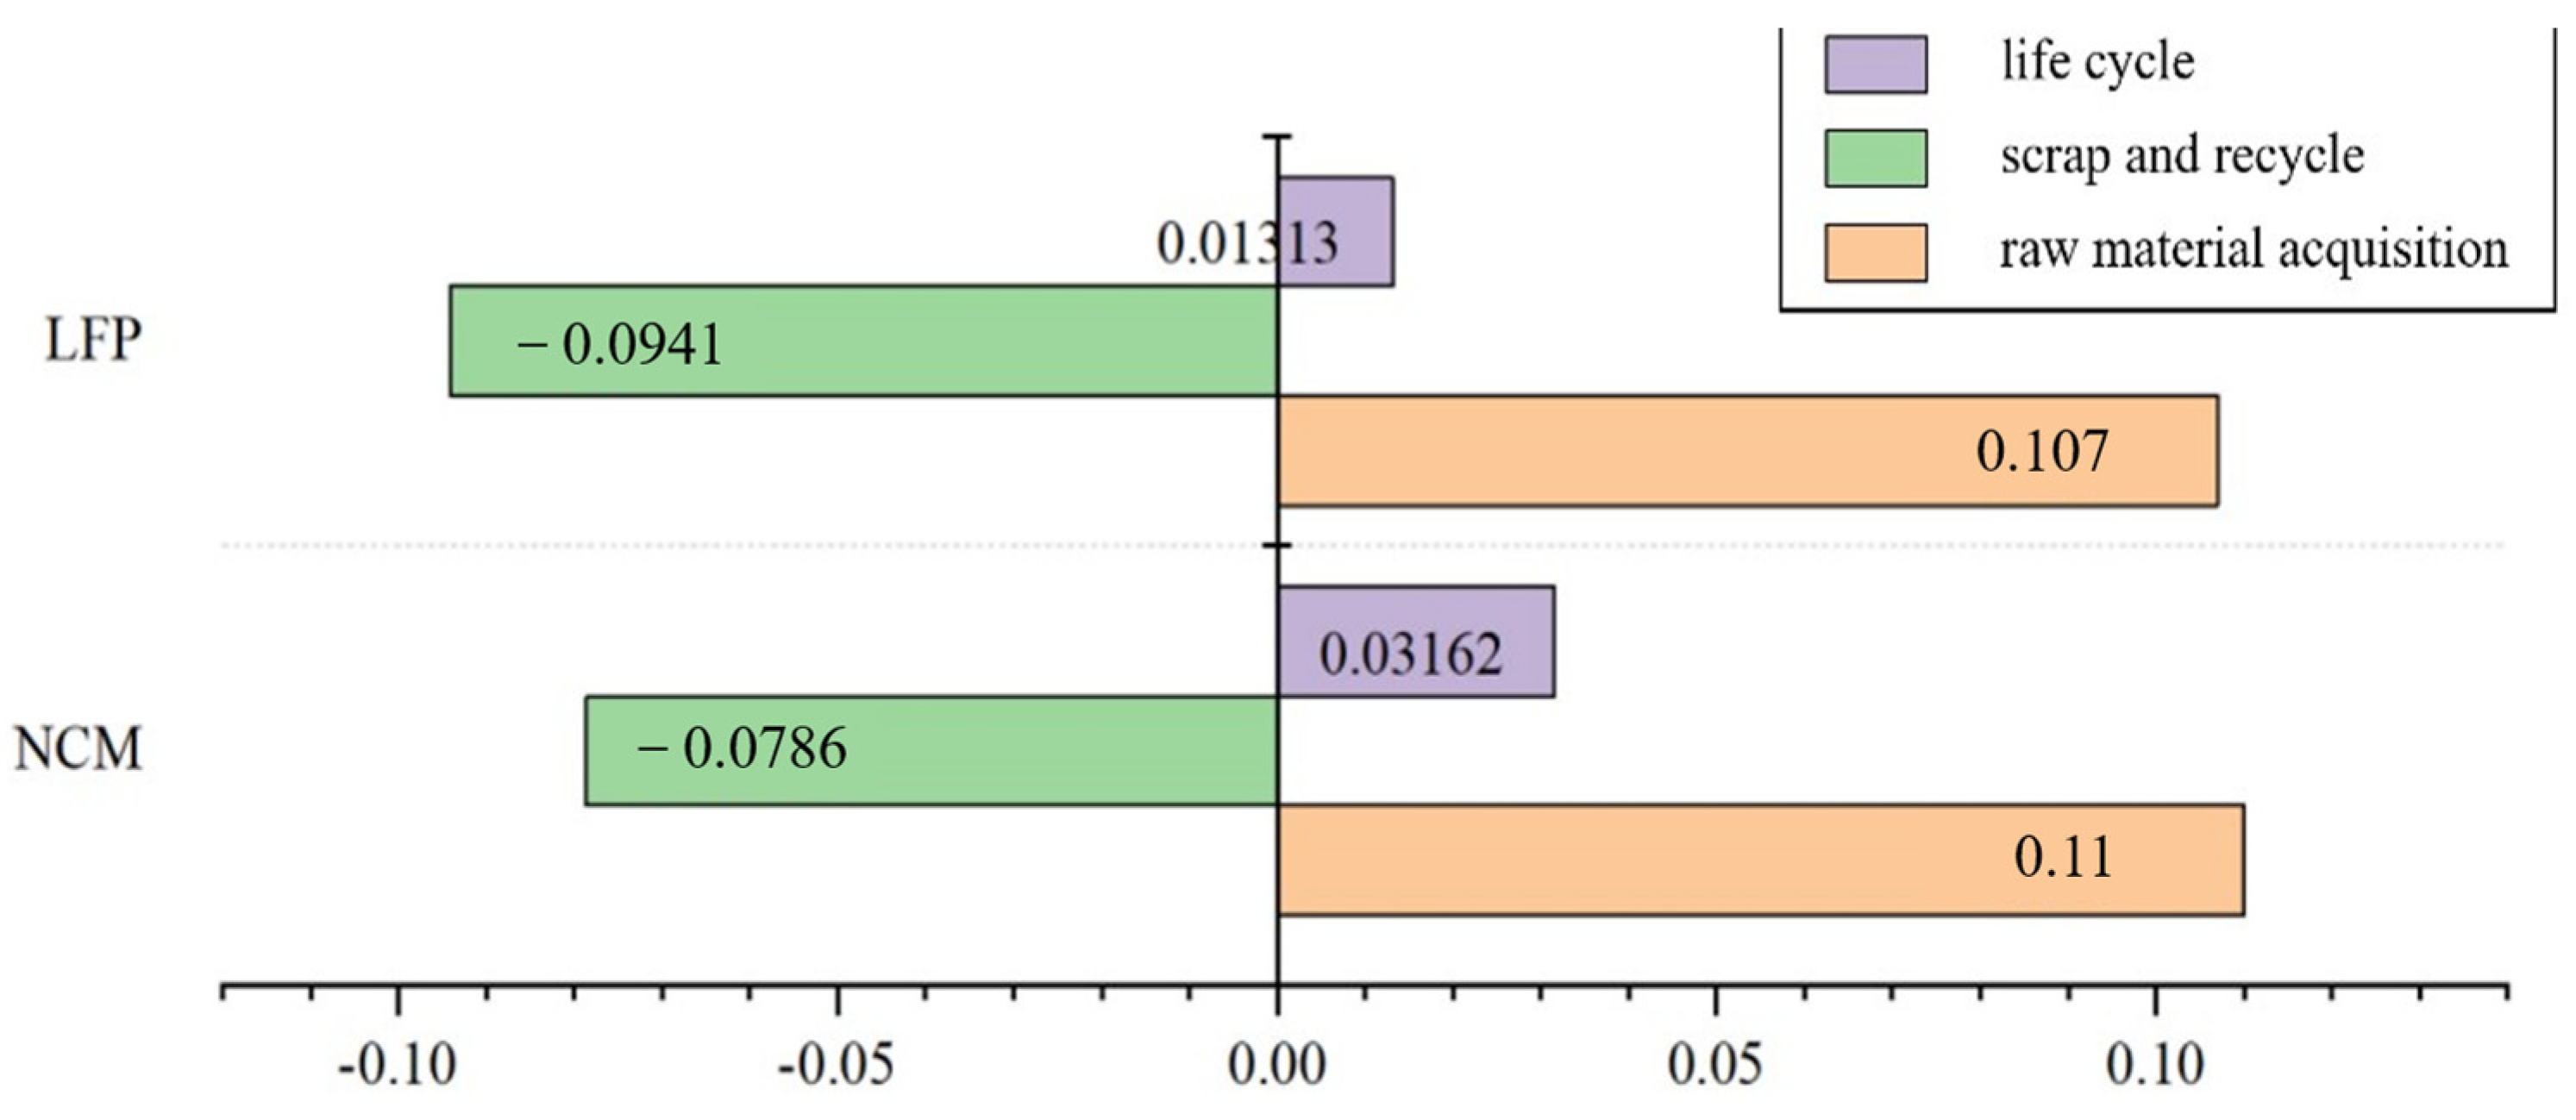
Figure 4.
Percentage of fossil energy depletion value at each stage of power battery life cycle. (a) LFP, (b) NCM.
Figure 4.
Percentage of fossil energy depletion value at each stage of power battery life cycle. (a) LFP, (b) NCM.

Figure 5.
Total fossil energy depletion value of power battery life cycle.
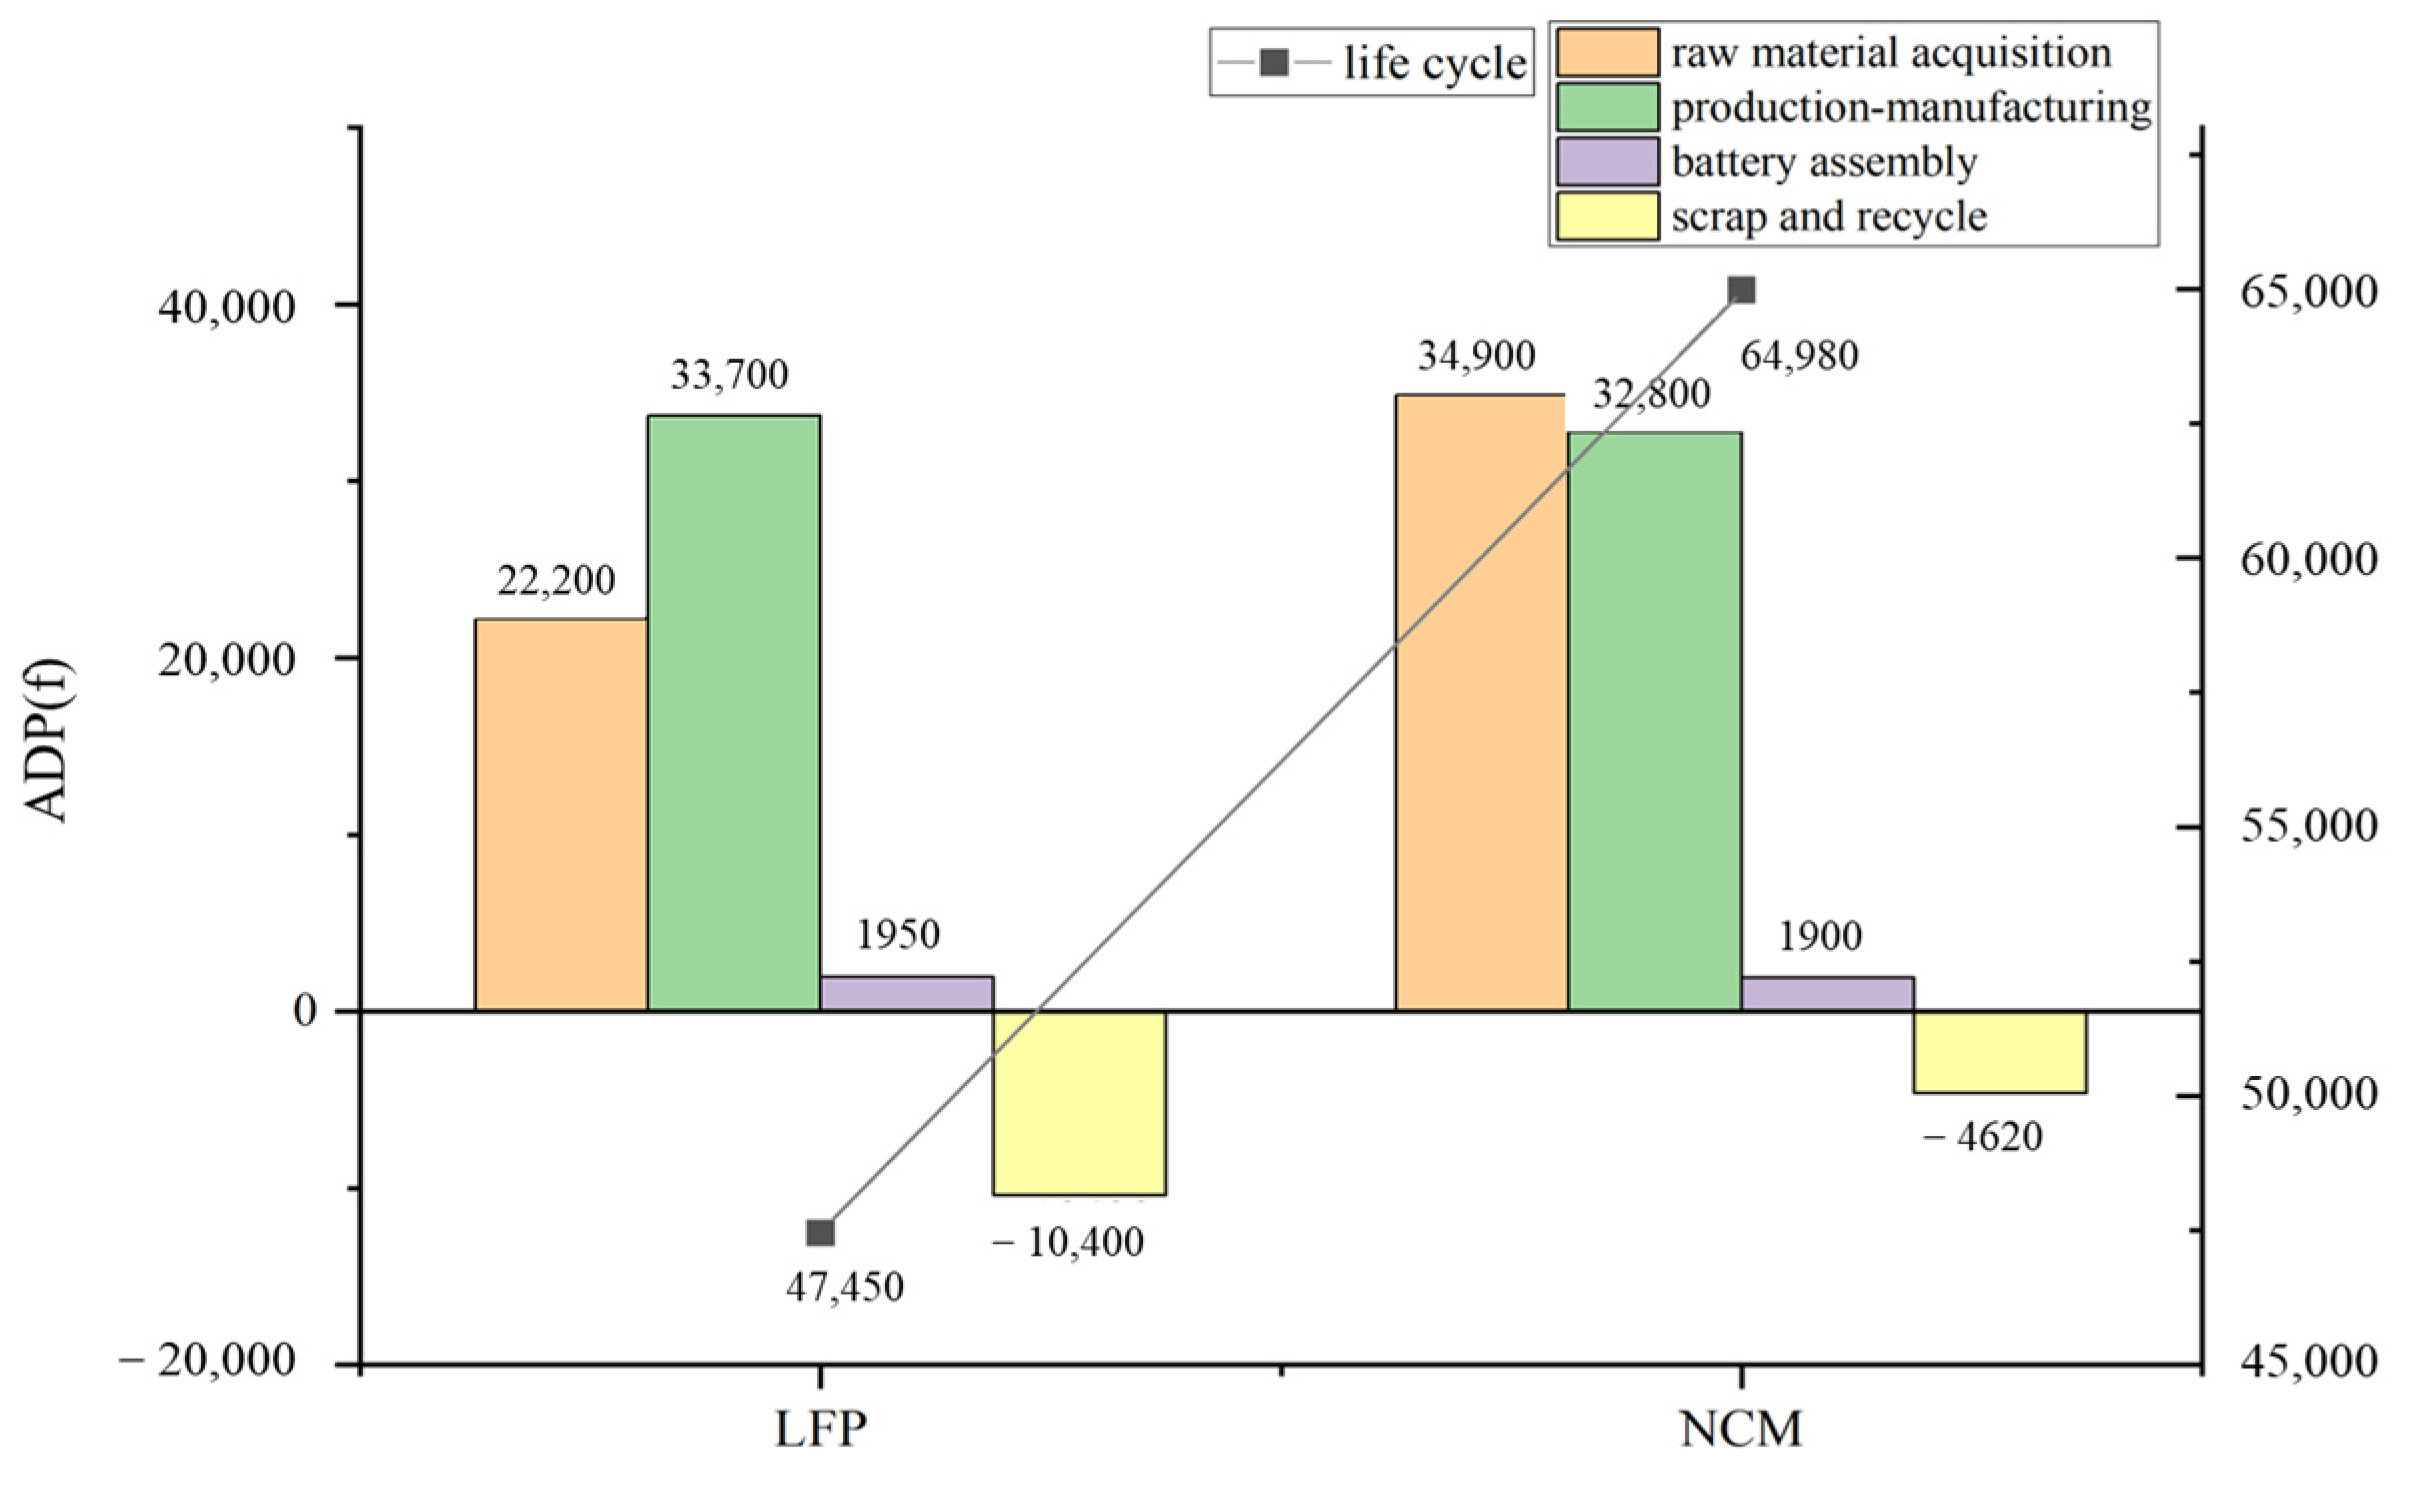
Figure 6.
Power battery life cycle environmental impact gas emissions.
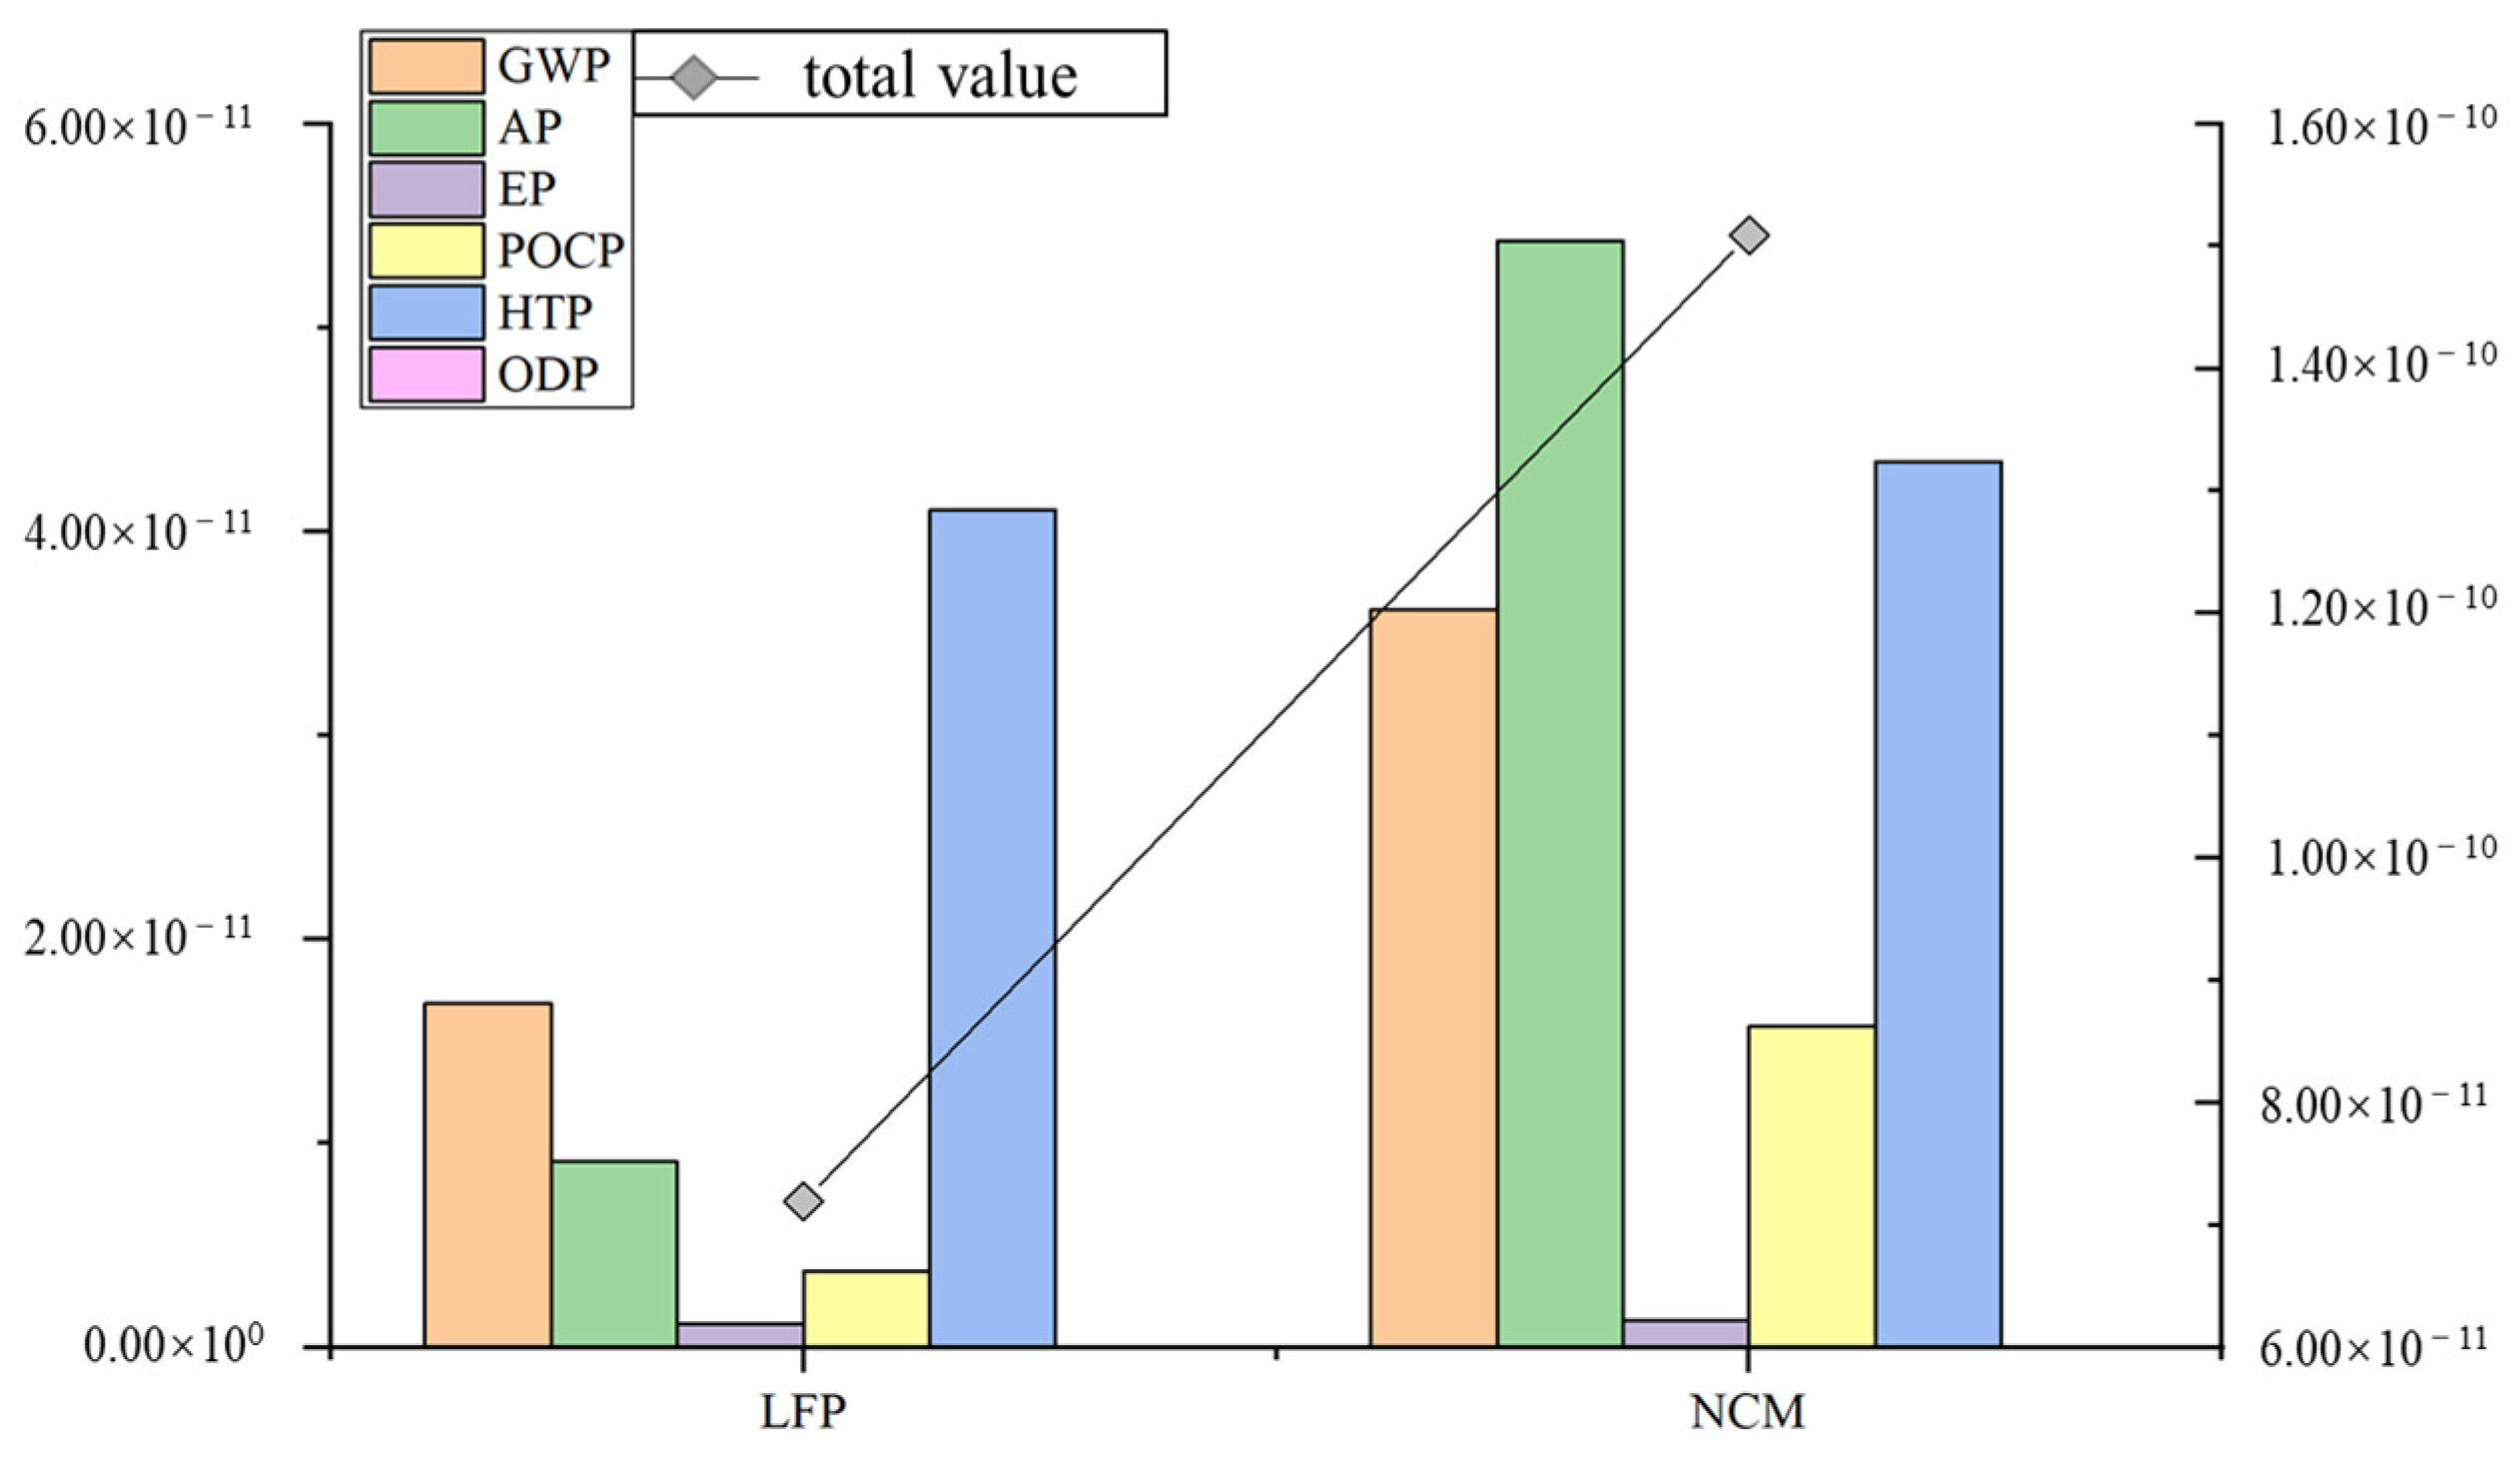
Figure 7.
Percentage of power battery life cycle environmental impact gas emission stage map.
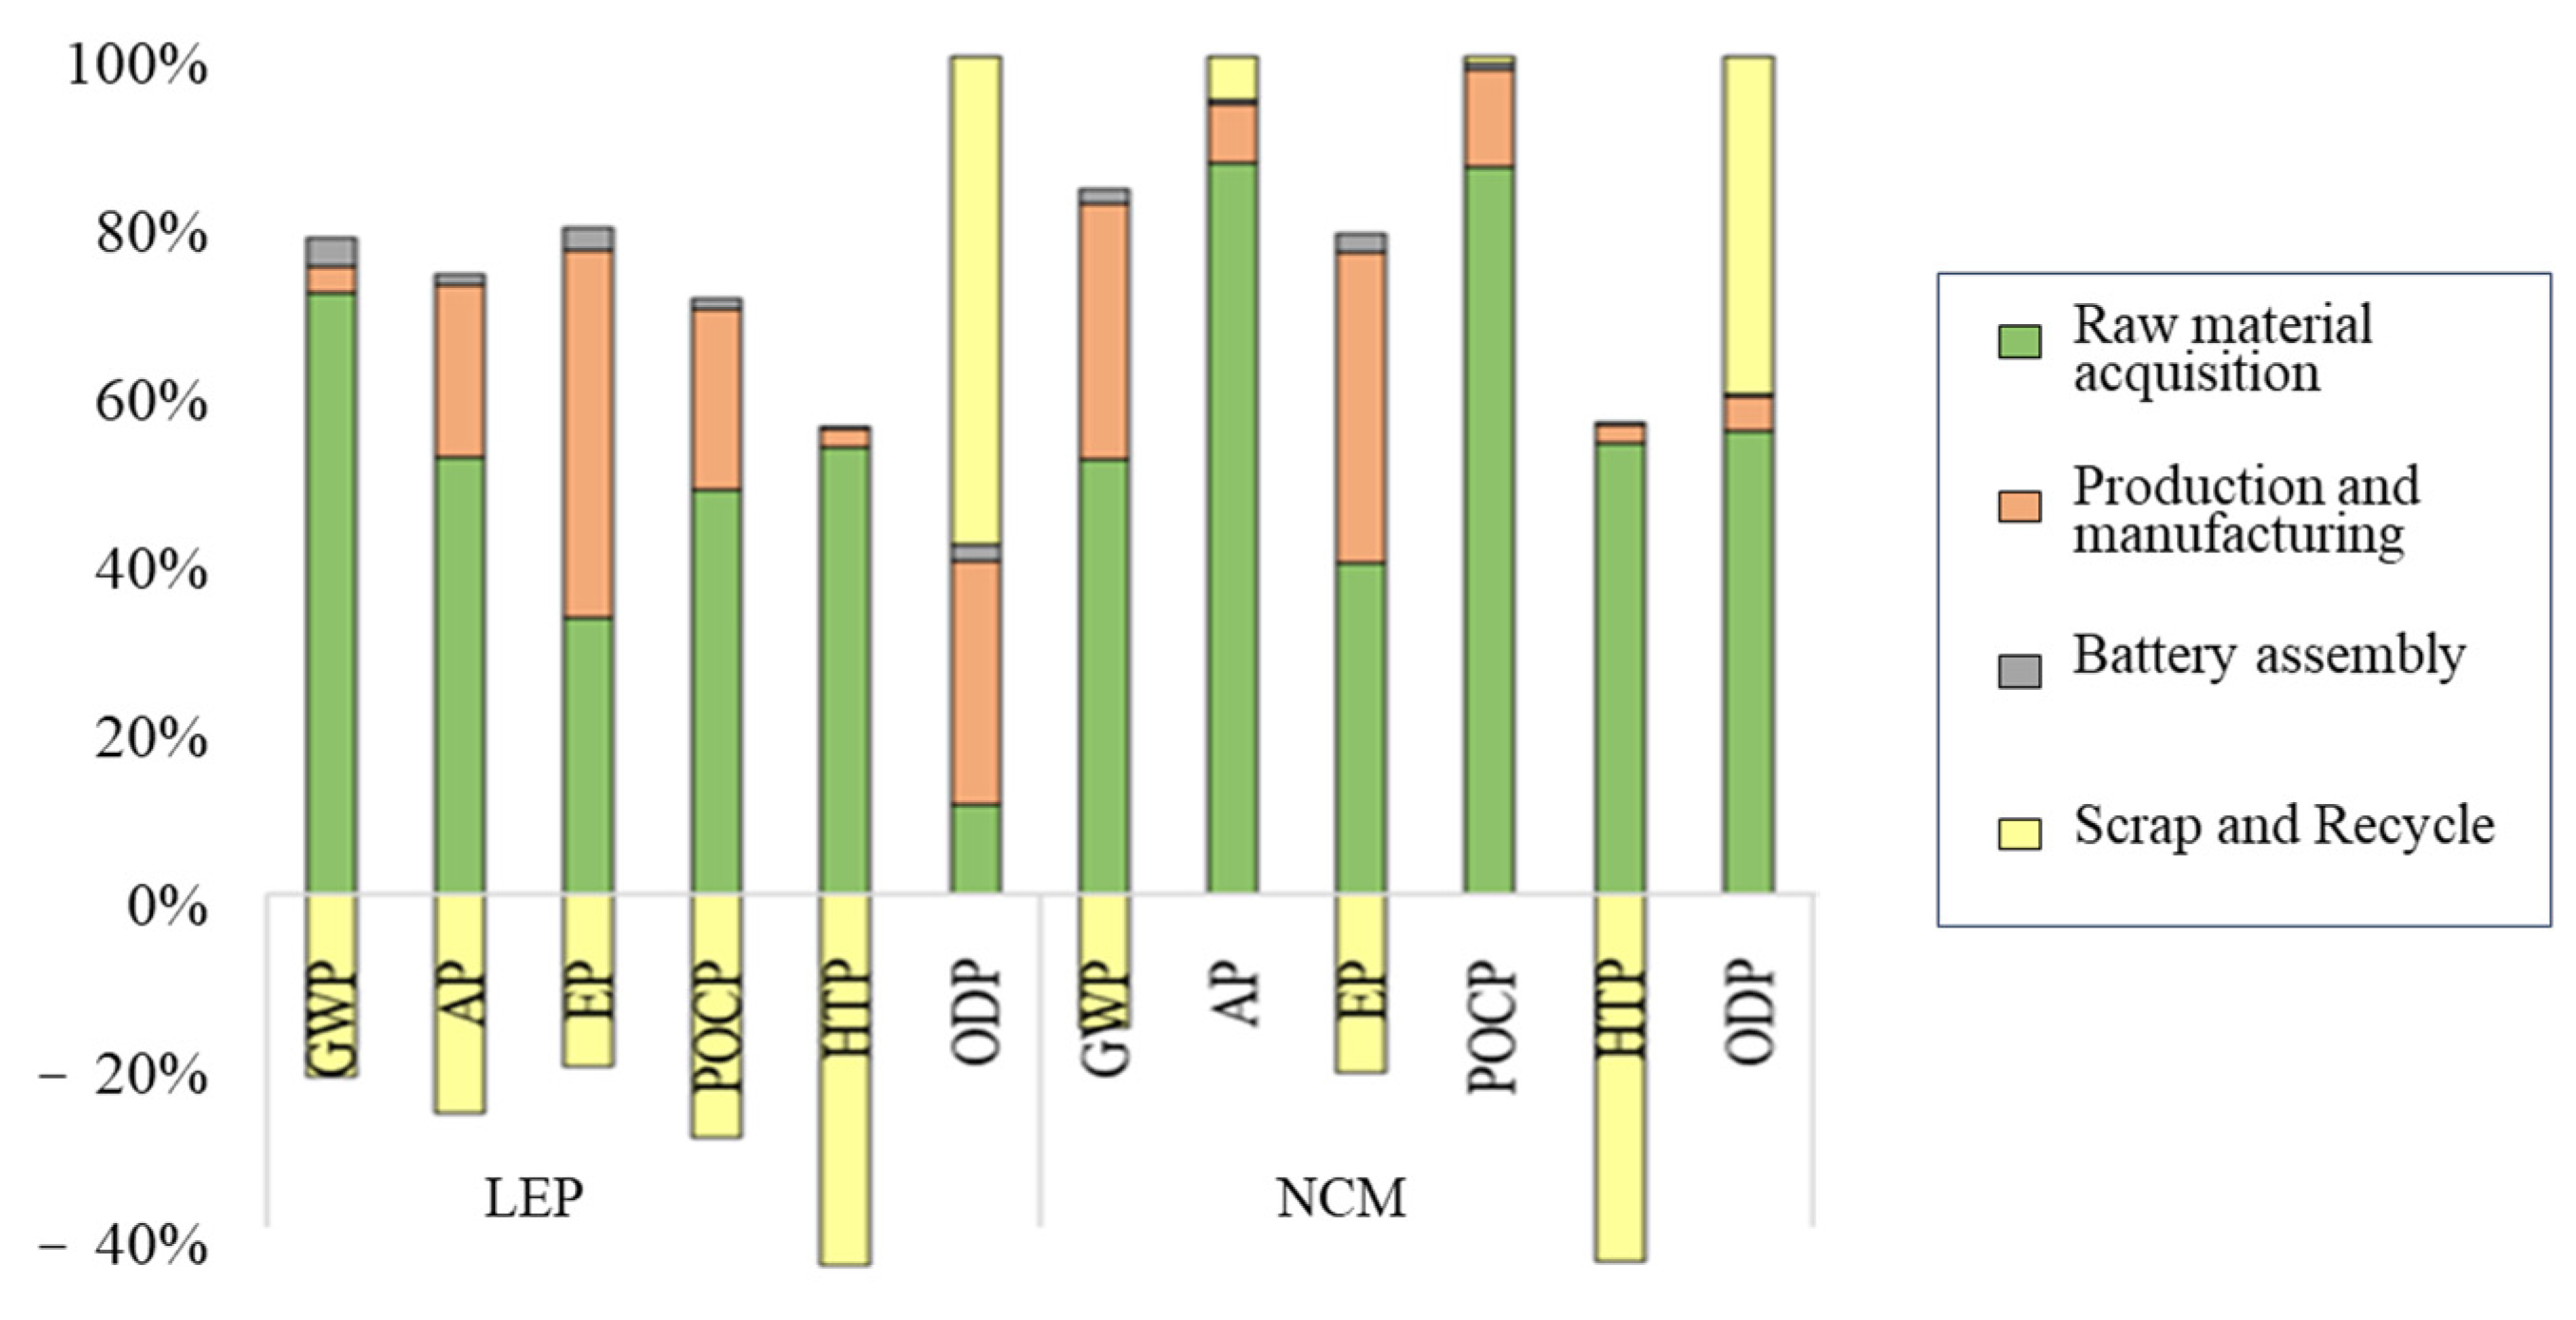
Figure 8.
Power Battery’s Different Processes.
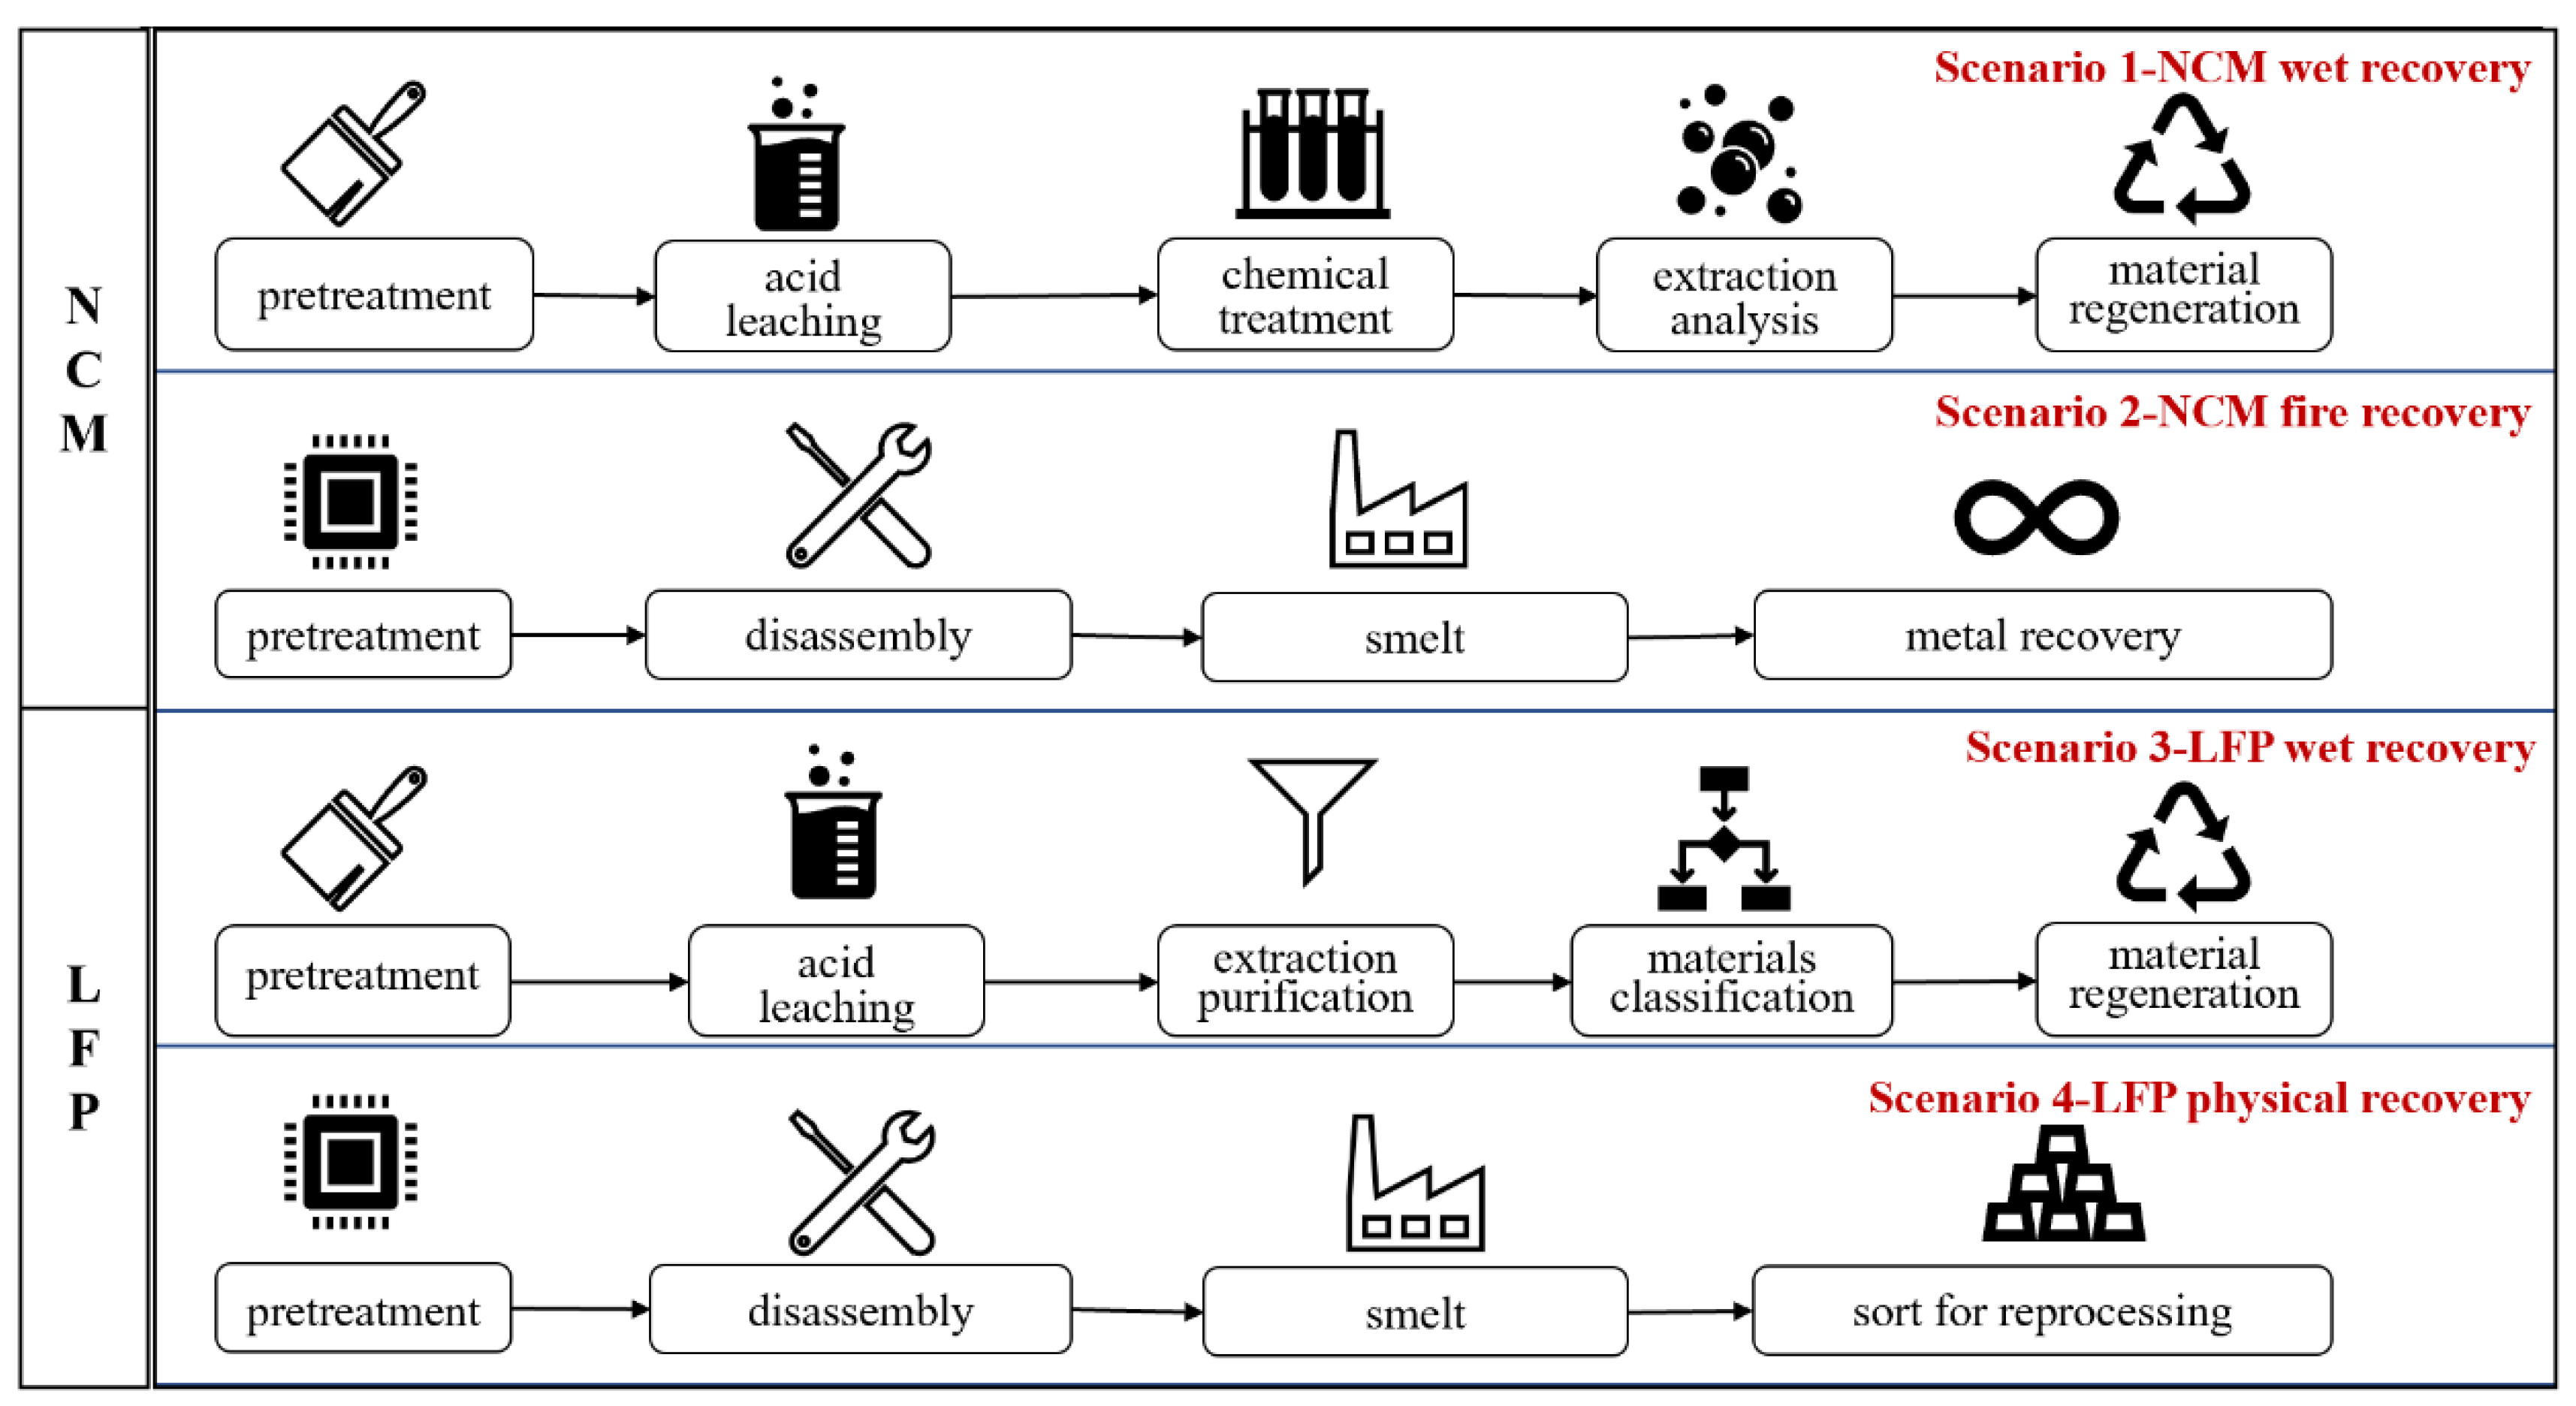
Figure 9.
ADP(f) and GWP values of power battery recycling stages under different recycling processes. (a) Fossil energy consumption, (b) Global warming potential (GWP).
Figure 9.
ADP(f) and GWP values of power battery recycling stages under different recycling processes. (a) Fossil energy consumption, (b) Global warming potential (GWP).

Figure 10.
Life cycle ADP(f) and GWP of power battery under different recycling processes. (a) Fossil energy consumption, (b) Global warming potential (GWP).
Figure 10.
Life cycle ADP(f) and GWP of power battery under different recycling processes. (a) Fossil energy consumption, (b) Global warming potential (GWP).
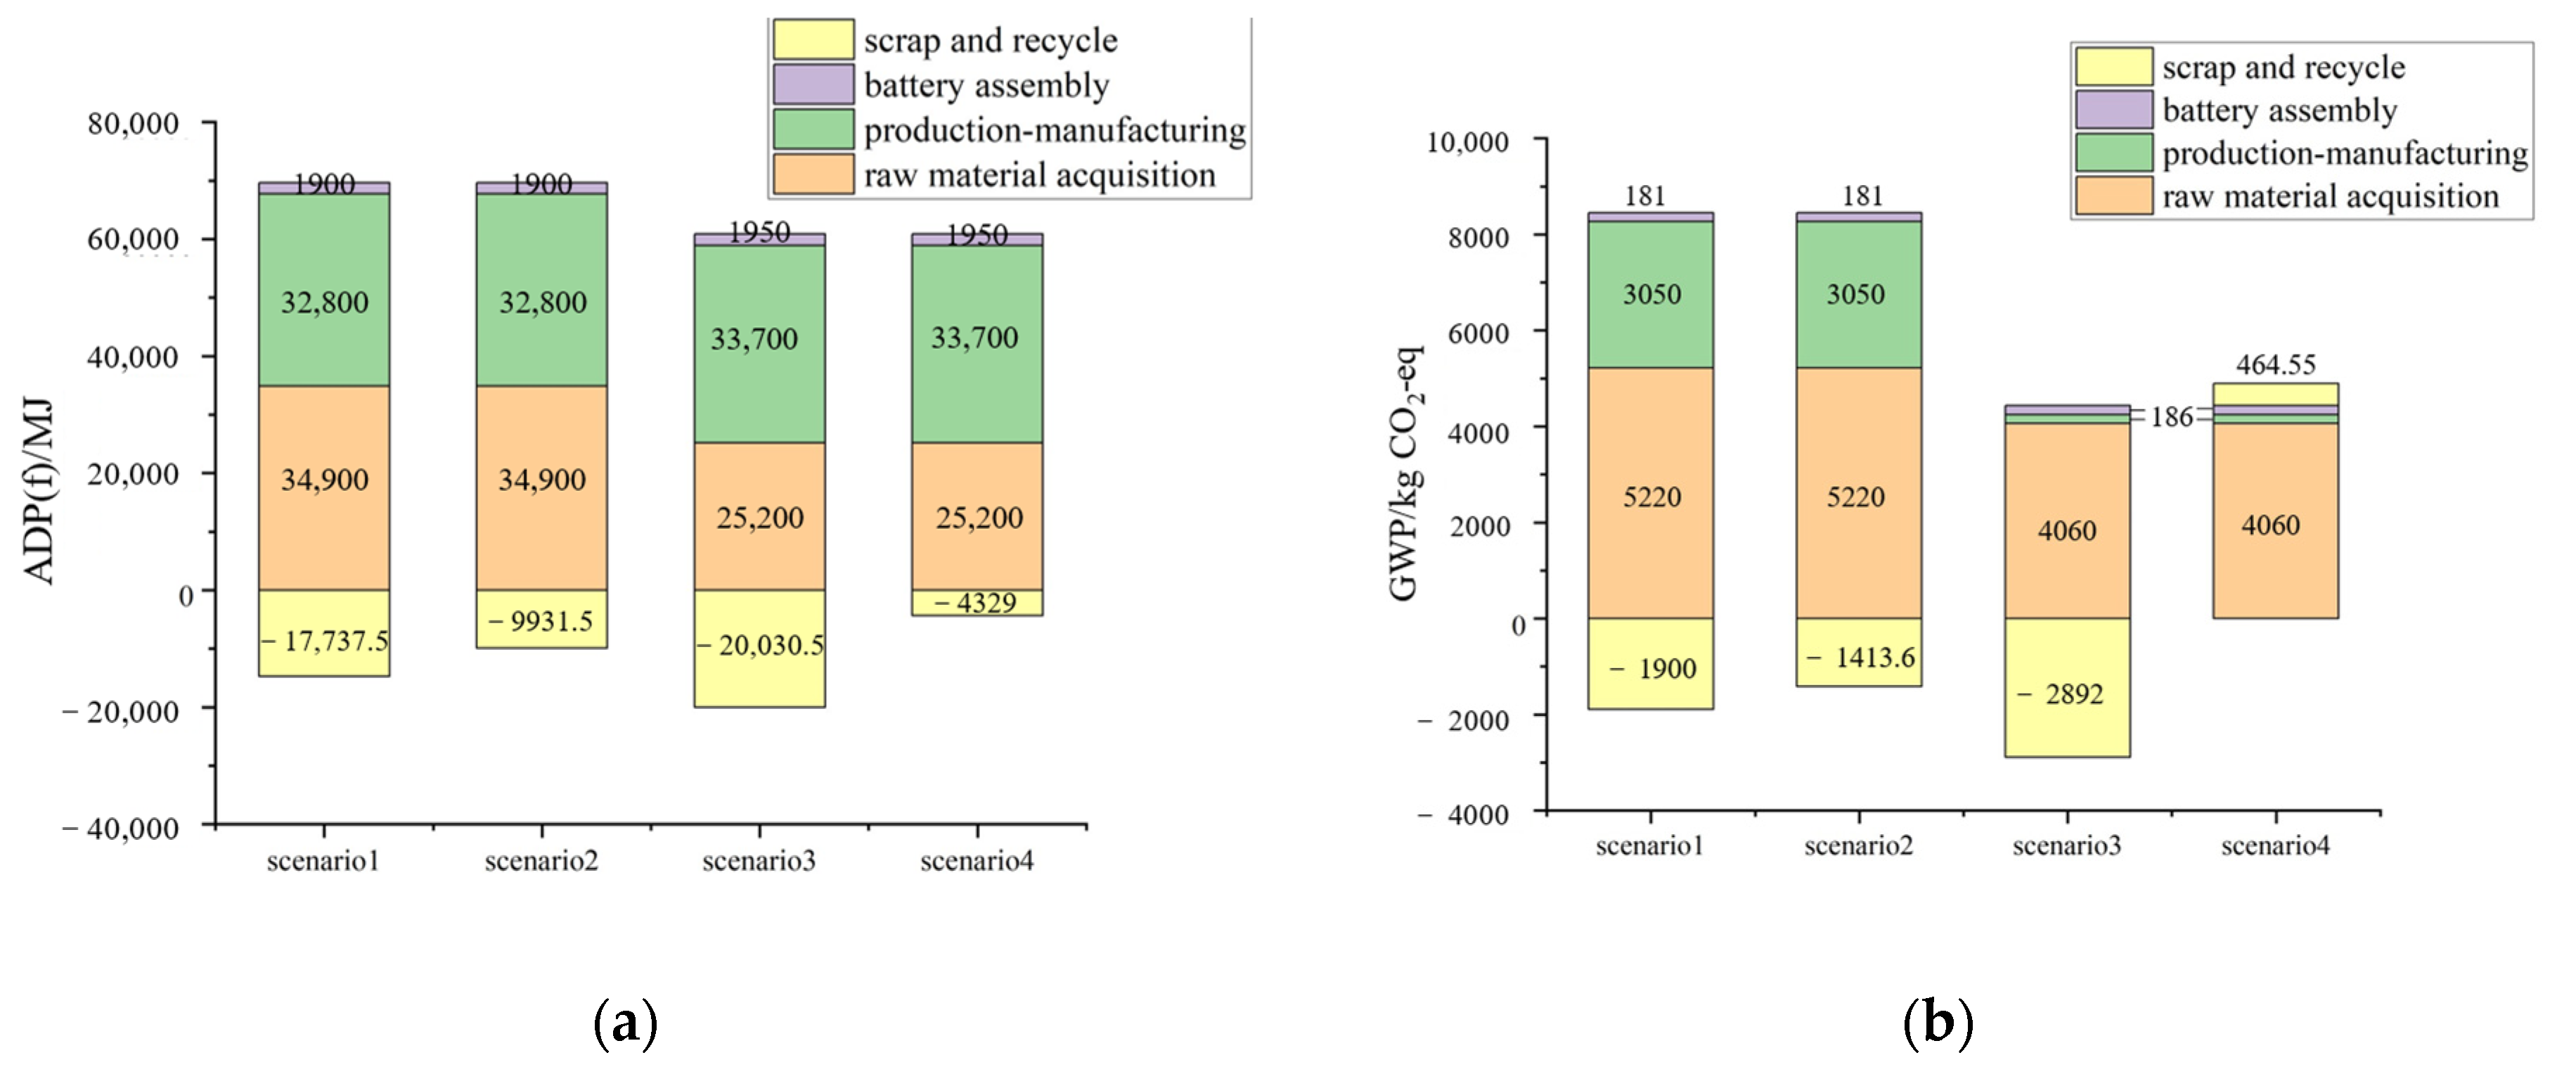
Figure 11.
Decommissioned battery ladder utilization system boundary.
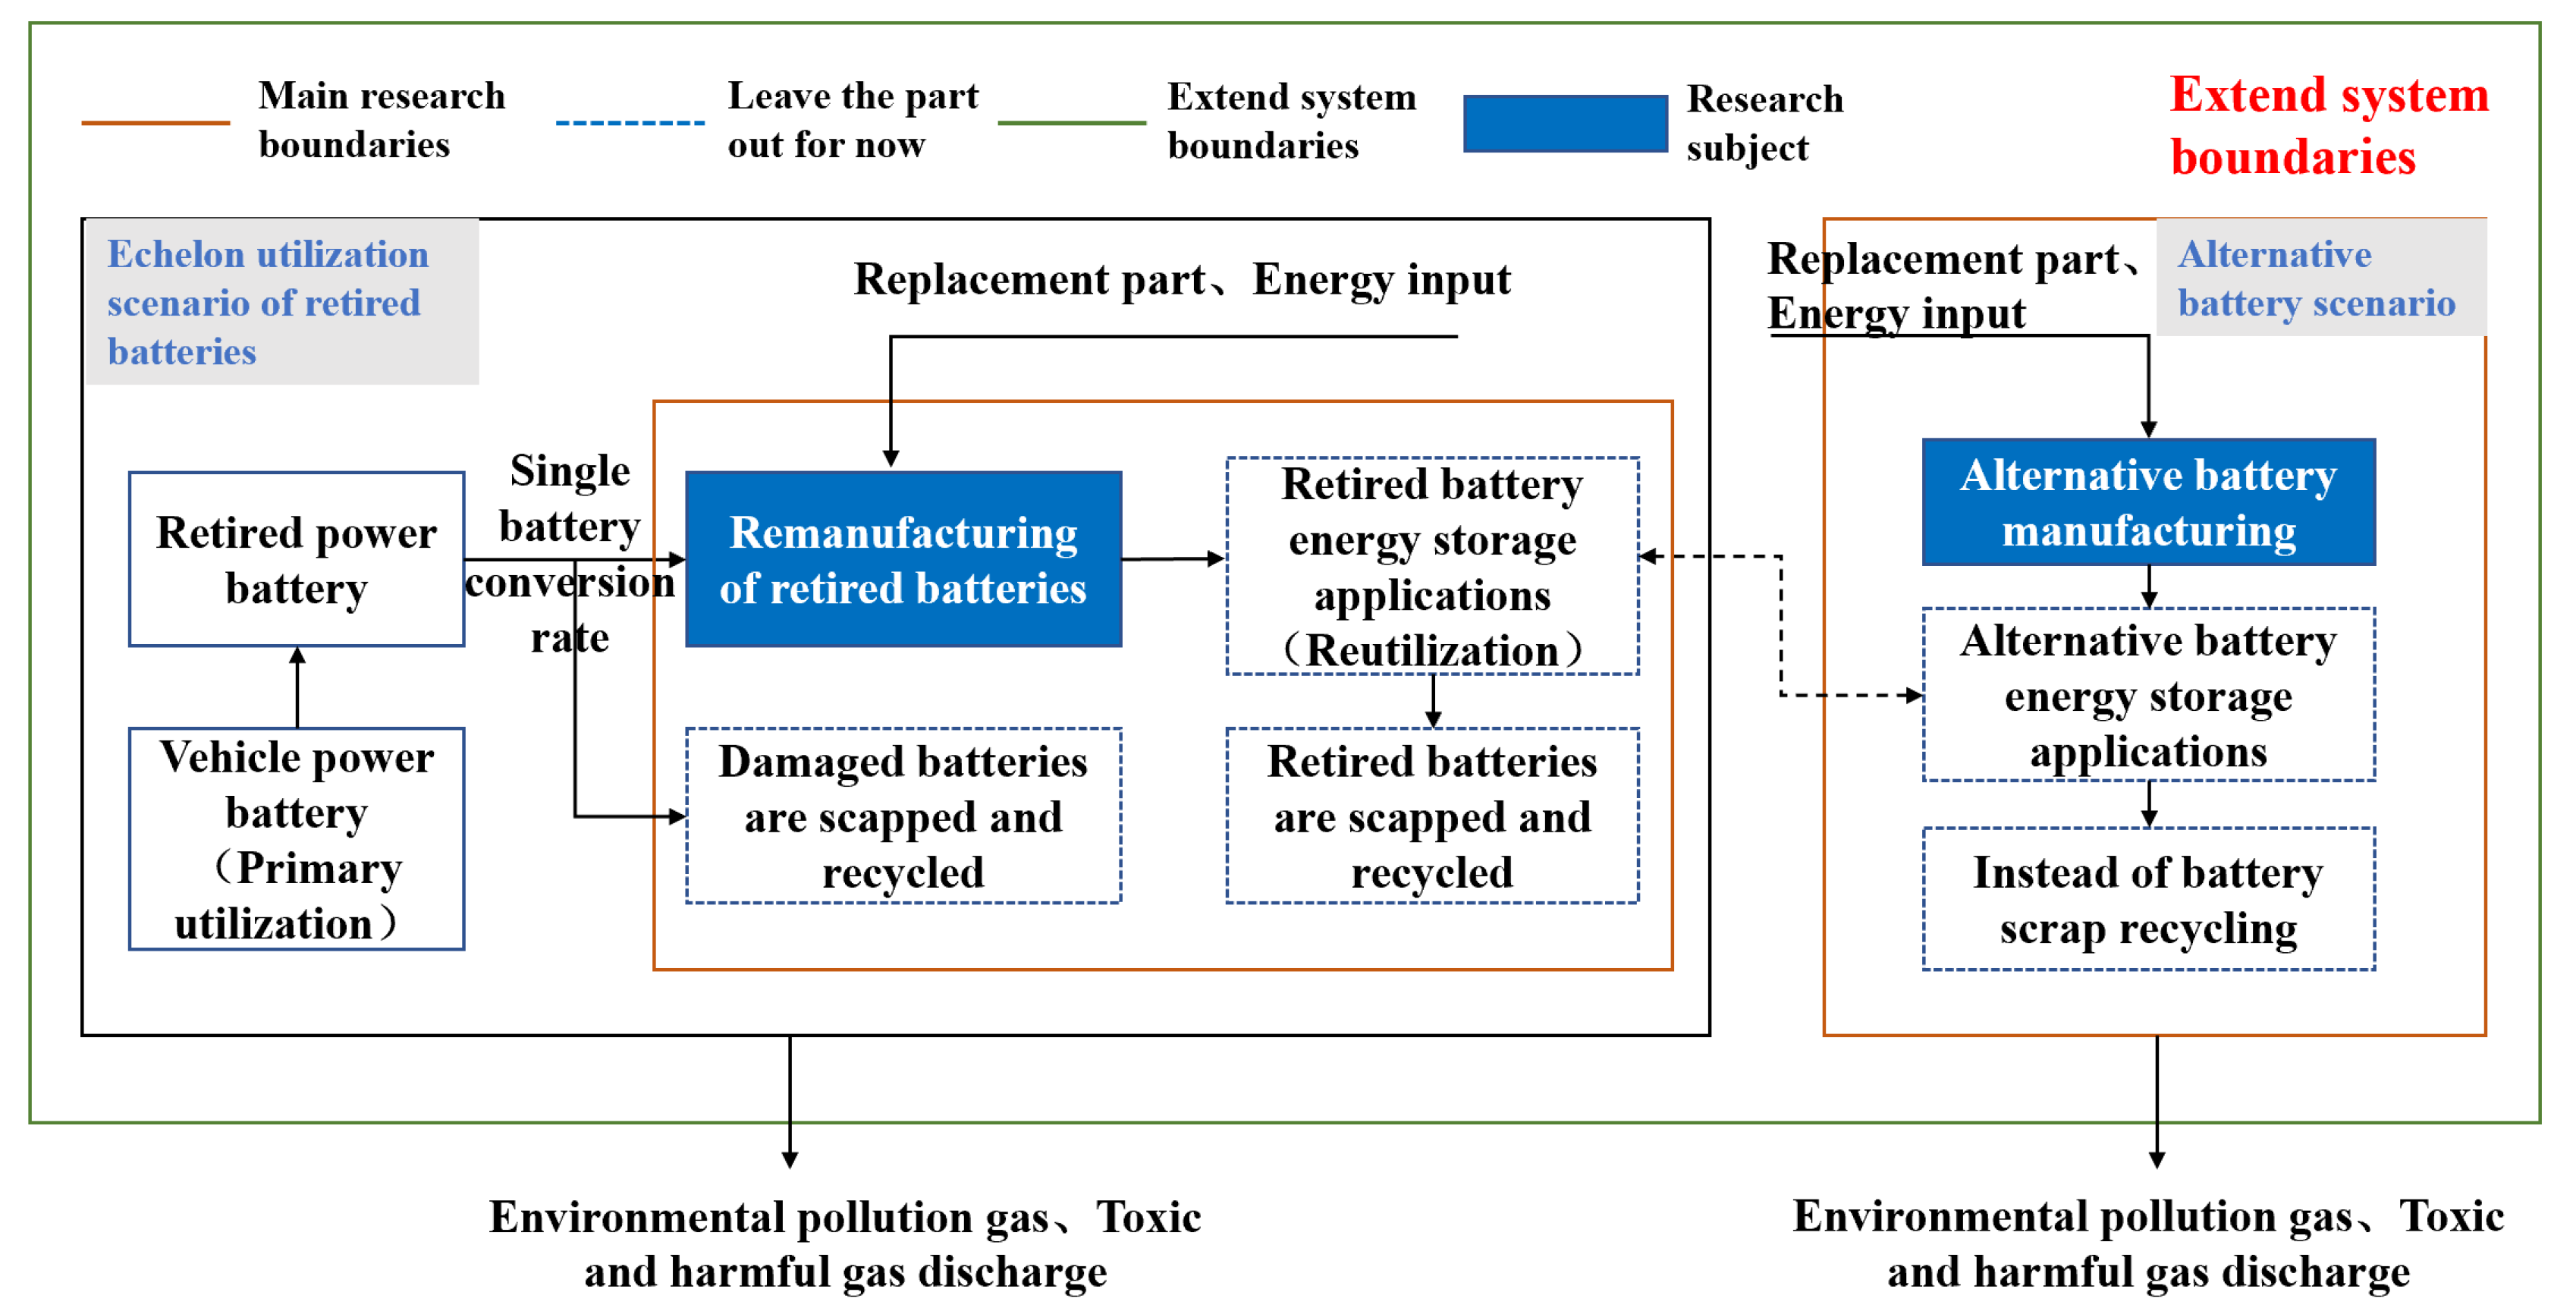
Figure 12.
Power battery laddering resource depletion and positive resource benefits. (a) ADP(e), (b) ADP(f).
Figure 12.
Power battery laddering resource depletion and positive resource benefits. (a) ADP(e), (b) ADP(f).
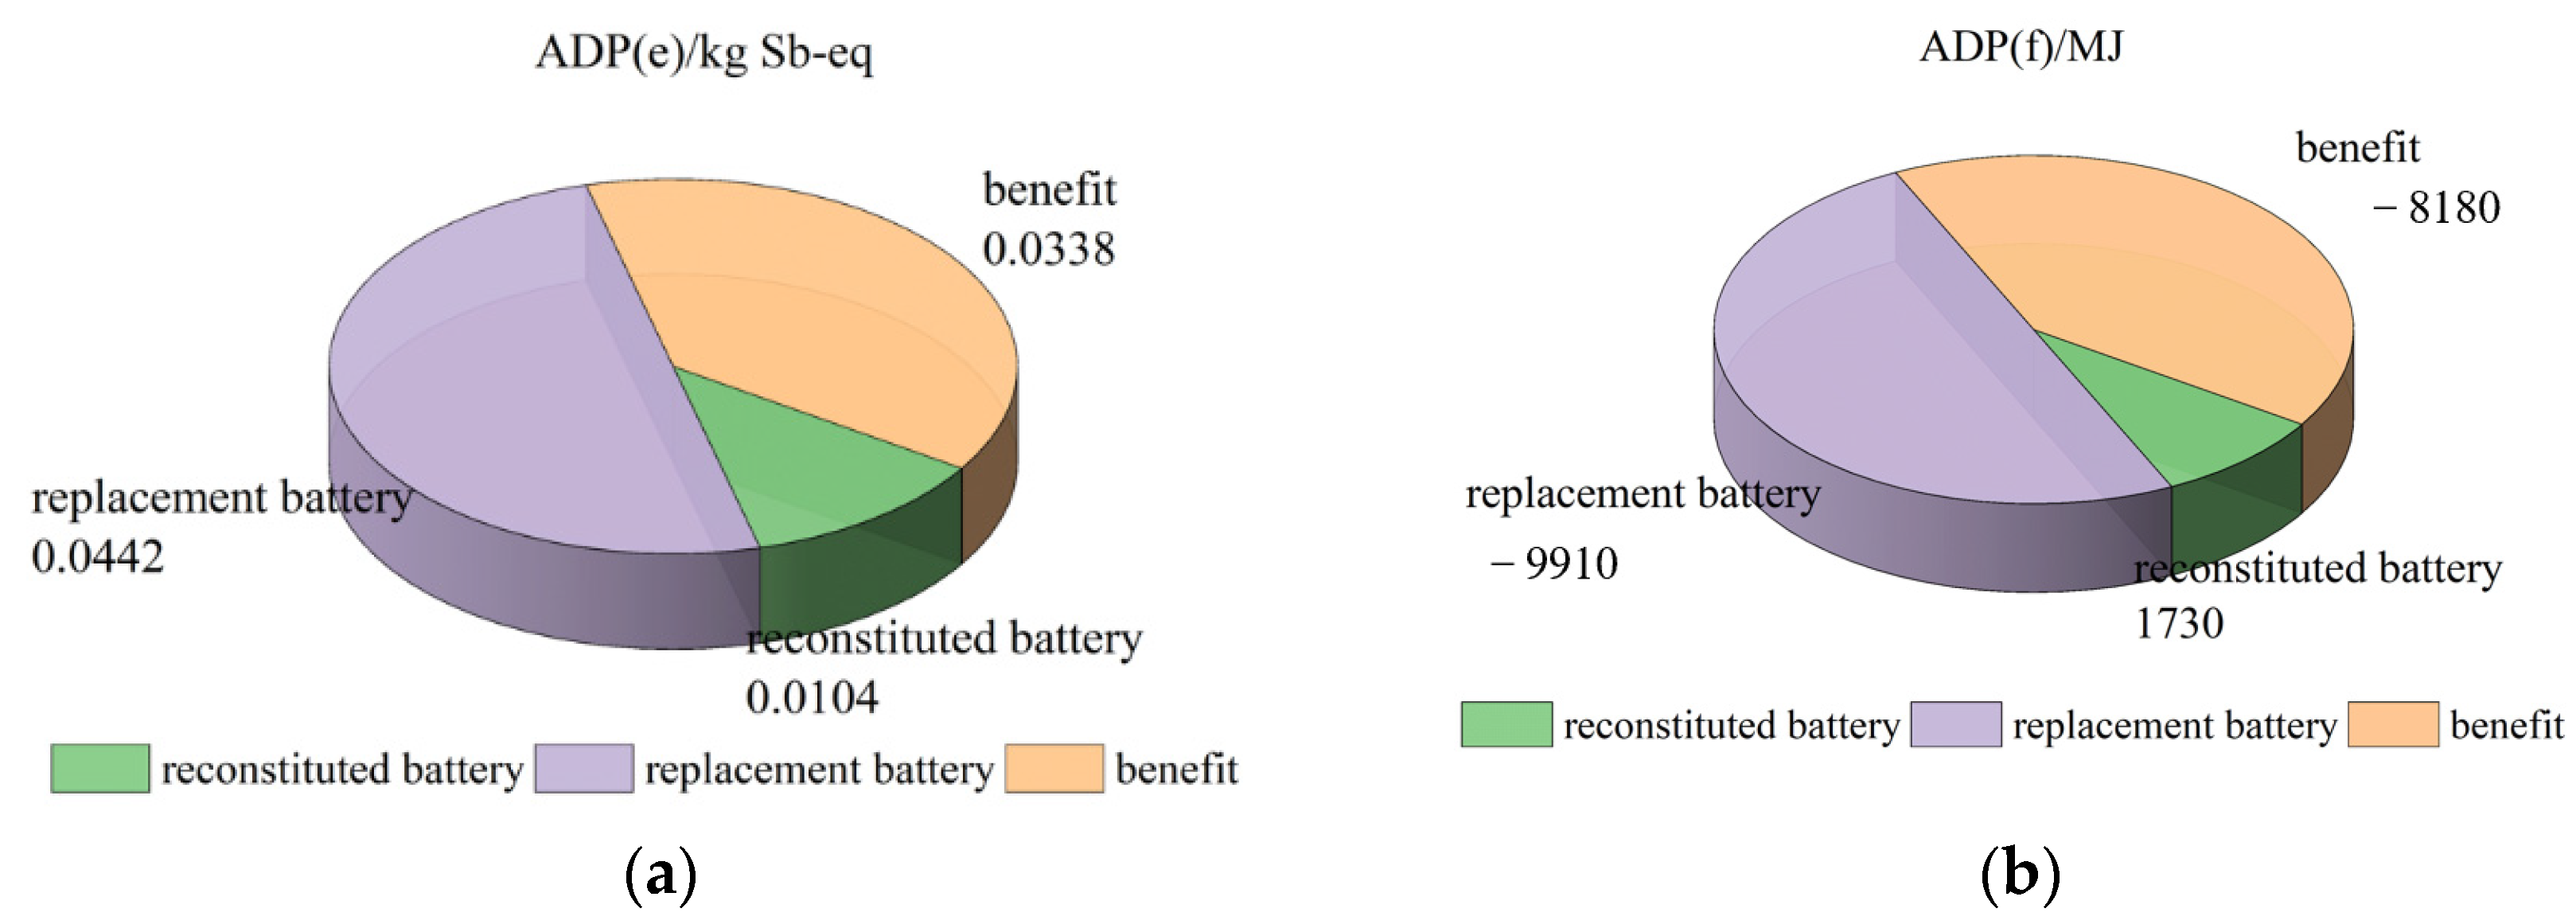
Figure 13.
The positive environmental impacts and emissions resulting from the cascaded utilization of power batteries. (a) Global warming potential (GWP), (b) Acidification potential (AP), (c) Eutrophication potential (EP), (d) Photochemical ozone creation potential (POCP), (e) Human toxicity potential (HTP), (f) Ozone depletion potential (ODP).
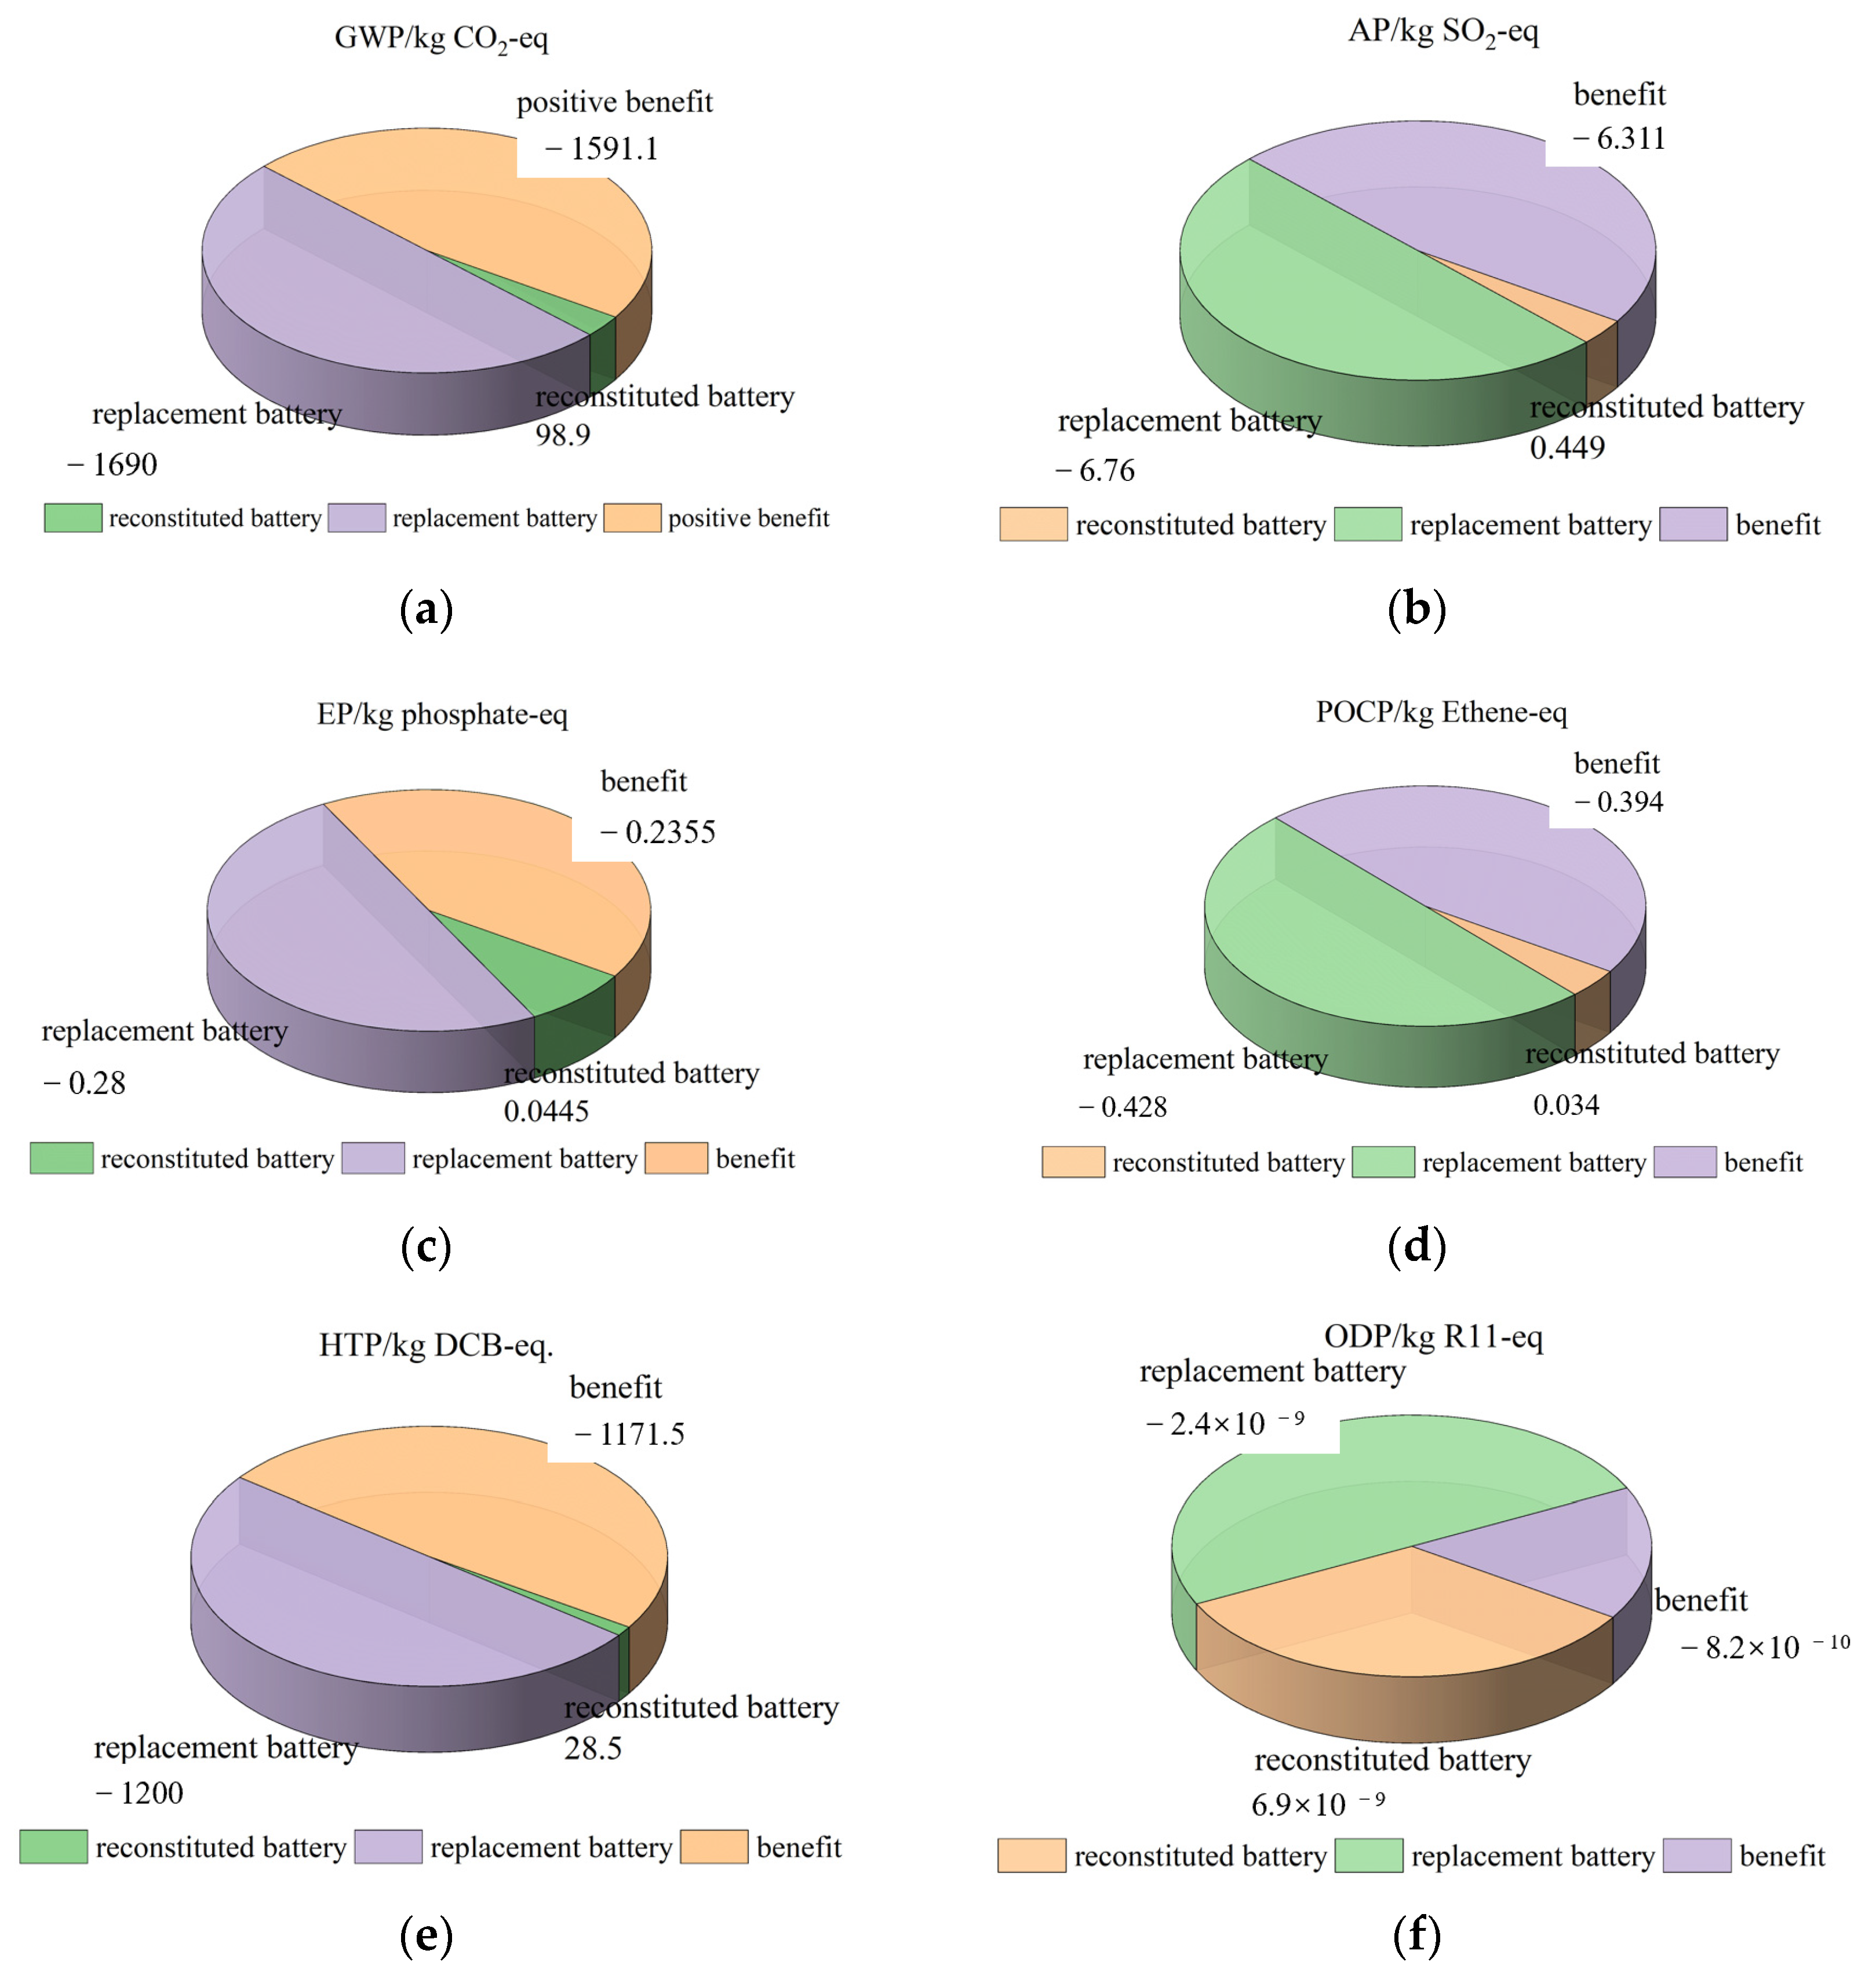
Figure 14.
The percentage of environmental emission benefits from the cascaded utilization of power batteries.
Figure 14.
The percentage of environmental emission benefits from the cascaded utilization of power batteries.
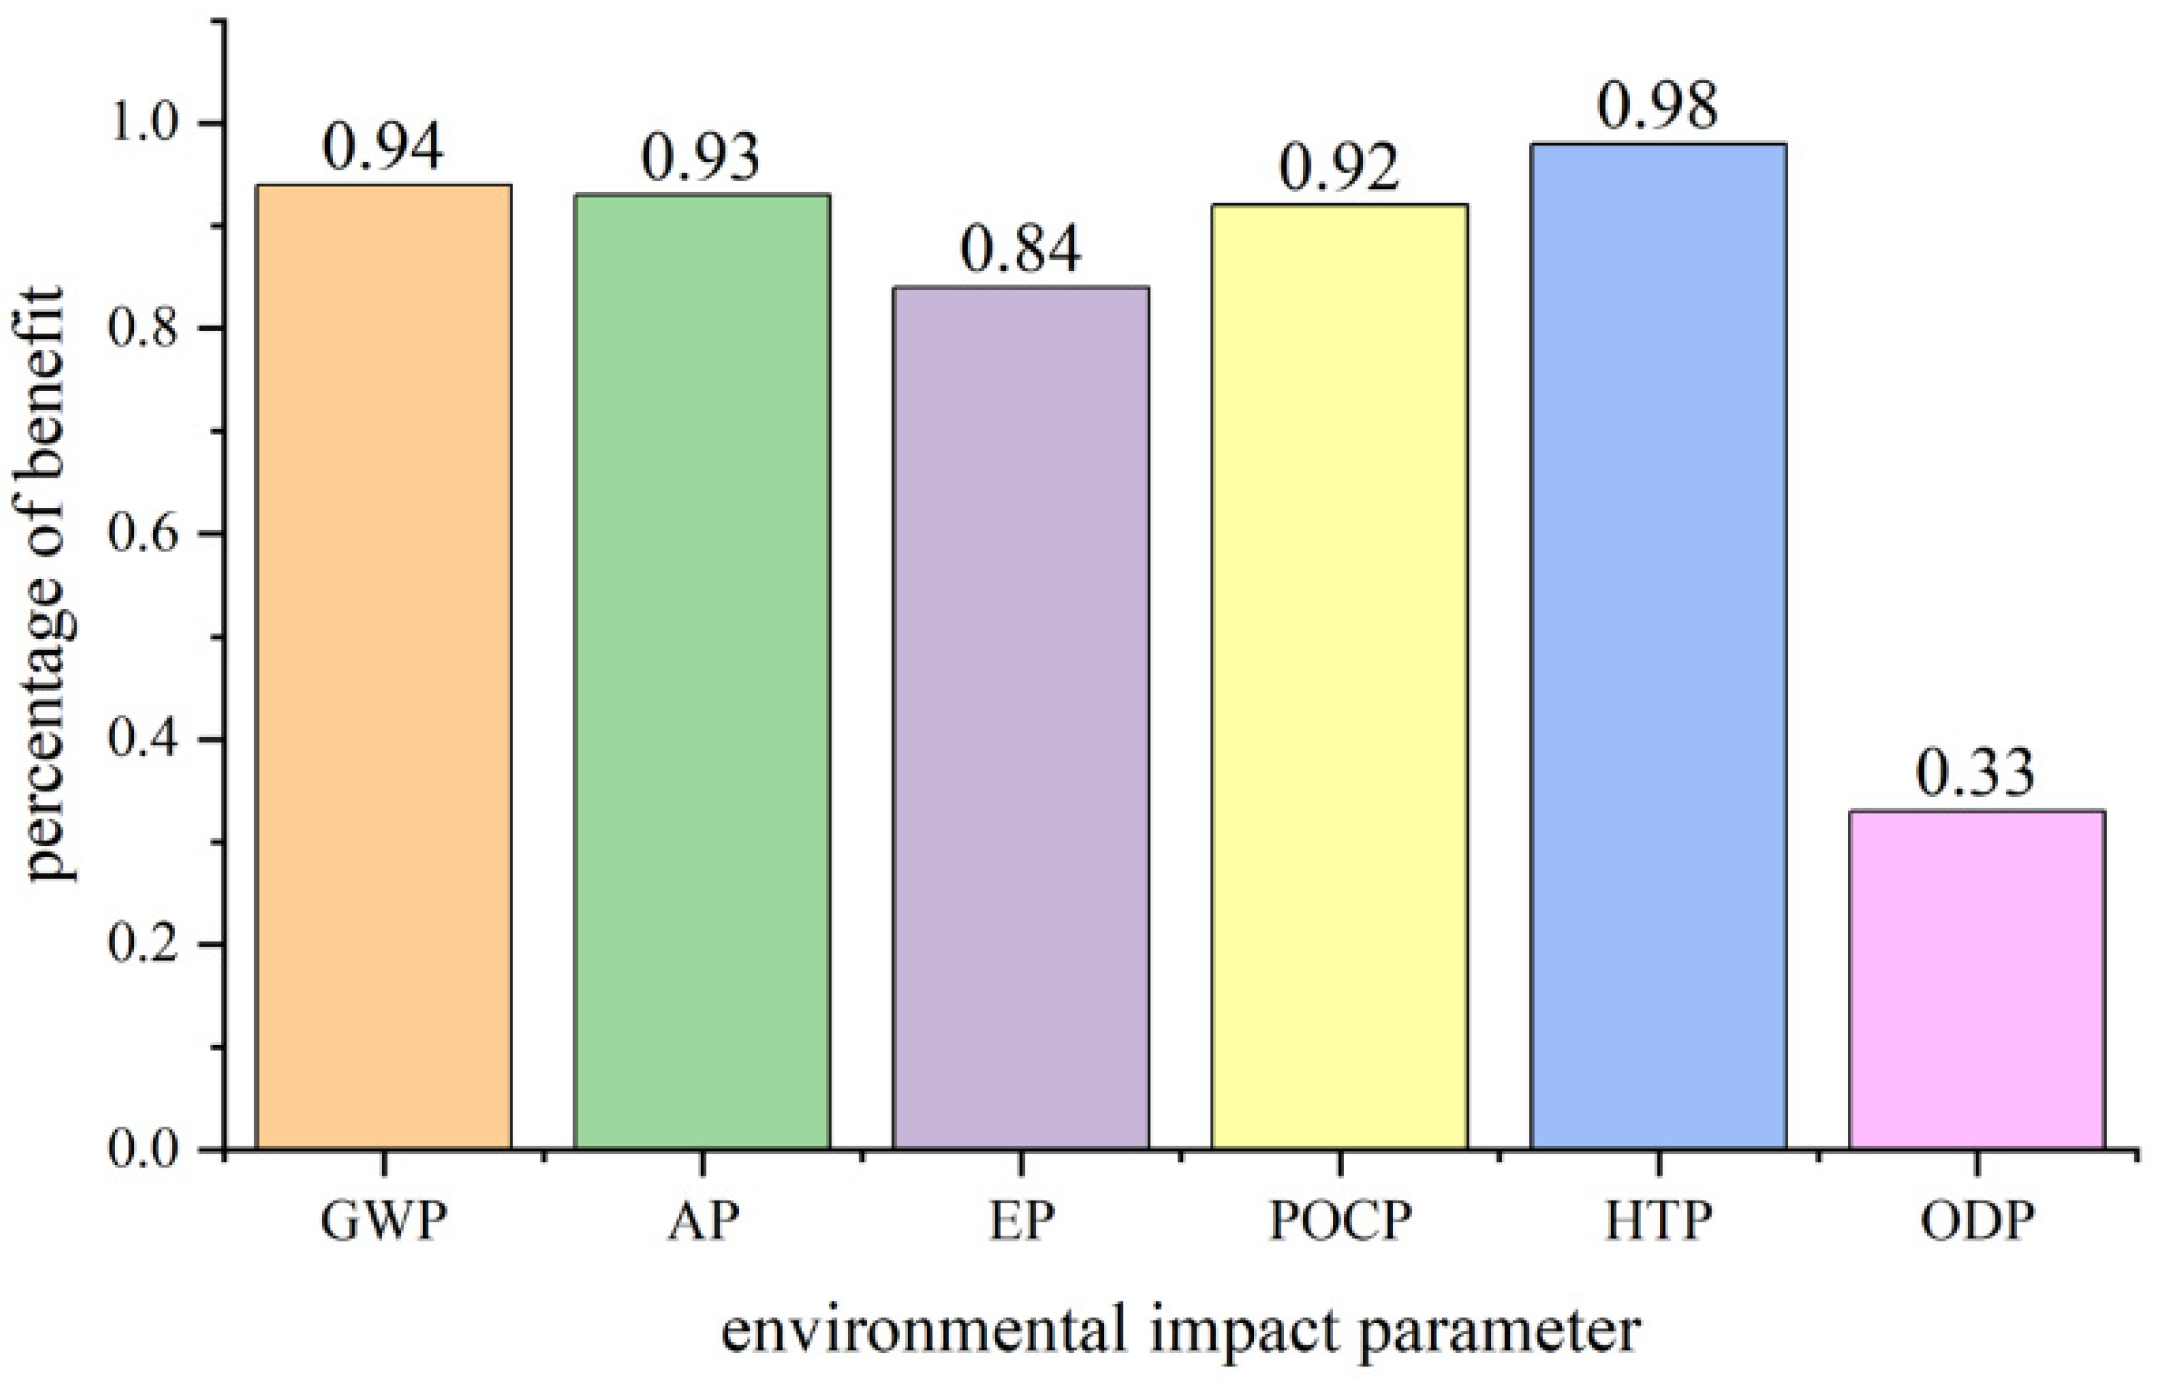
Figure 15.
The sensitivity of each evaluation indicator to changes in the individual CCR parameter.

Figure 16.
The sensitivity of evaluation indicator benefits percentage to variations in the individual CCR parameter.
Figure 16.
The sensitivity of evaluation indicator benefits percentage to variations in the individual CCR parameter.

Table 1.
Comparison of Performance Parameters between LFP Battery and NCM Battery.
| NCM | LFP | |
|---|---|---|
| anode material | nickel–cobalt–manganese ternary materials | lithium iron phosphate materials |
| cathode material | plumbago | plumbago |
| energy density | around 170 Wh/kg | around 160 Wh/kg |
| cycle life | around 800 | around 2000 |
| costs | general | general |
| safety | mediocre | high |
| low temperature resistance | general | mediocre |
| high temperature resistance | general | higher |
Table 2.
Normalization Coefficients for Environmental Impact.
| Type of Environmental Impact | Normalized Reference Value | Weights (Dimensionless) | Evaluation Calculation Model |
|---|---|---|---|
| GWP | 4.22 × 10¹³ kg CO2-eq. | 0.222488038 | |
| AP | 2.39 × 10¹¹ kg SO2-eq. | 0.145933014 | |
| EP | 1.58 × 10¹¹ kg Phosphate-eq. | 0.157894737 | |
| POCP | 3.68 × 10¹⁰ kg Ethene-eq. | 0.155502392 | |
| ODP | 2.27 × 10⁸ kg CFC-eq. | 0.148325359 | |
| HTP | 2.58 × 10¹² kg DCB-eq. | 0.169856459 |
Table 3.
Material Inventory for the LFP Battery Raw Materials Acquisition Stage [37].
Table 3.
Material Inventory for the LFP Battery Raw Materials Acquisition Stage [37].
| Battery Composition | Raw Materials | Mass/kg |
|---|---|---|
| anodal | lithium iron phosphate | 81.70 |
| aluminum | 68.01 | |
| Polyvinylidene chloride (PVDF) | 3.52 | |
| cathode | plumbago | 50.92 |
| copper | 41.54 | |
| PVDF | 3.52 | |
| electrolyte | lithium hexafluorophosphate | 9.05 |
| vinyl carbonate | 26.13 | |
| dimethyl acetate (CH3)2AsO2H | 26.13 | |
| clamshell | polypropylene | 4.34 |
| steel | 5.03 | |
| glass fiber | 1.01 | |
| distant | polypropylene | 6.37 |
| polyethylene | 1.01 | |
| coolant | Ethylene glycol (EU-28) | 3.35 |
| BMS | transistors | 1.68 |
| resistors | 1.68 |
Table 4.
The material and energy consumption list required for recycling 1 kWh of LFP battery, and the recovery rates of various metal materials [23,39].
| Input Material | Mass/kg | Modeling Mass/kg | Recycling of Metal Materials | Recovery Efficiency/% |
|---|---|---|---|---|
| common salt | 4.04 | 230.28 | copper | 90.00 |
| magnesium hydroxide | 0.59 | 33.35 | steel | 85.00 |
| caustic soda | 0.43 | 24.28 | foundry iron | 80.00 |
| thick water | 5.61 | 319.77 | aluminum | 85.00 |
| petroleum | 0.03 | 1.94 | lithium | 82.00 |
Table 5.
The material data inventory for the ternary lithium-ion battery.
| Battery Composition | Raw Materials | Ratio/% | Mass/kg |
|---|---|---|---|
| anodal | lithium ternary | 28.20 | 91.93 |
| aluminum | 19.70 | 64.22 | |
| Polyvinylidene chloride (PVDF) | 1.20 | 3.91 | |
| cathode | plumbago | 18.30 | 59.66 |
| copper | 11.40 | 37.16 | |
| PVDF | 1.20 | 3.91 | |
| electrolyte | lithium hexafluorophosphate | 1.90 | 6.19 |
| vinyl carbonate | 5.40 | 17.60 | |
| dimethyl acetate (CH3)2AsO2H | 5.40 | 17.60 | |
| clamshell | polypropylene | 1.30 | 4.24 |
| steel | 1.50 | 4.89 | |
| glass fiber | 0.30 | 0.99 | |
| distant | polypropylene | 1.90 | 6.19 |
| polyethylene | 0.30 | 0.99 | |
| coolant | Ethylene glycol (EU-28) | 1.00 | 3.26 |
| BMS | transistors | 0.50 | 1.63 |
| resistors | 0.50 | 1.63 |
Table 6.
List of materials required for end-of-life recycling of 1 kWh lithium ternary battery.
| Material Type | Unit | Number of Models |
|---|---|---|
| hydrogen peroxide (H2O2) | kg | 10.2 |
| sulfuric acid | kg | 19.7 |
| sodium hypochlorite | kg | 0.433 |
| pig iron | kg | 0.038 |
| calcium oxide | kg | 0.417 |
| hydrochloric acid | kg | 1.680 |
| 30% Liquid Soda Ash | kg | 20 |
| natural gas | Nm3 | 0.094 |
| electricity | kWh | 8.420 |
Table 7.
Power battery resource depletion life cycle characterization results.
| Raw Material Acquisition | Manufacturing | Battery Assembly | End-of-Life Recycling | ||
|---|---|---|---|---|---|
| LFP | ADP(e) | 1.34 × 10⁻¹ | 2.12 × 10⁻⁴ | 1.33 × 10⁻⁵ | −9.41 × 10⁻² |
| ADP(f) | 2.22 × 10⁴ | 3.37 × 10⁴ | 1.95 × 10³ | −1.04 × 10⁴ | |
| NCM | ADP(e) | 1.10 × 10⁻¹ | 2.06 × 10⁻⁴ | 1.29 × 10⁻⁵ | 4.21 × 10⁻² |
| ADP(f) | 3.49 × 10⁴ | 3.28 × 10⁴ | 1.90 × 10³ | 2.01 × 10⁴ |
Table 8.
Power battery life cycle normalization results.
| Raw Material Acquisition | Manufacturing | Battery Assembly | End-of-Life Recycling | Life Cycle | ||
|---|---|---|---|---|---|---|
| LFP | GWP | 2.14 × 10¹¹ | 9.81 × 10⁻¹³ | 9.81 × 10⁻¹³ | −6.48 × 10⁻¹² | 1.69 × 10⁻¹¹ |
| AP | 1.00 × 10⁻¹¹ | 3.90 × 10⁻¹² | 2.43 × 10⁻¹³ | −4.92 × 10⁻¹² | 9.23 × 10⁻¹² | |
| EP | 6.09 × 10⁻¹³ | 8.54 × 10⁻¹³ | 5.32 × 10⁻¹⁴ | −4.00 × 10⁻¹³ | 1.12 × 10⁻¹² | |
| POCP | 4.23 × 10⁻¹² | 1.89 × 10⁻¹² | 1.14 × 10⁻¹³ | −2.56 × 10⁻¹² | 3.67 × 10⁻¹² | |
| HTP | 8.36 × 10⁻¹¹ | 8.30 × 10⁻¹² | 5.15 × 10⁻¹³ | −6.65 × 10⁻¹¹ | 2.59 × 10⁻¹¹ | |
| ODP | 1.18 × 10⁻¹⁸ | 1.04 × 10⁻¹⁷ | 6.60 × 10⁻¹⁹ | 2.08 × 10⁻¹⁷ | 3.30 × 10⁻¹⁷ | |
| NCM | GWP | 2.75 × 10⁻¹¹ | 1.61 × 10⁻¹¹ | 9.54 × 10⁻¹³ | −8.38 × 10⁻¹² | 3.62 × 10⁻¹¹ |
| AP | 4.74 × 10⁻¹¹ | 3.79 × 10⁻¹² | 2.37 × 10⁻¹³ | 2.87 × 10⁻¹² | 5.43 × 10⁻¹¹ | |
| EP | 8.91 × 10⁻¹³ | 8.31 × 10⁻¹³ | 5.18 × 10⁻¹⁴ | 2.81 × 10⁻¹³ | 2.06 × 10⁻¹² | |
| POCP | 1.36 × 10⁻¹¹ | 1.84 × 10⁻¹² | 1.11 × 10⁻¹³ | 1.20 × 10⁻¹³ | 1.57 × 10⁻¹¹ | |
| HTP | 1.38 × 10⁻¹⁰ | 8.03 × 10⁻¹² | 5.02 × 10⁻¹³ | −8.49 × 10⁻¹¹ | 6.19 × 10⁻¹¹ | |
| ODP | 1.39 × 10⁻¹⁶ | 1.01 × 10⁻¹⁷ | 6.41 × 10⁻¹⁹ | 1.01 × 10⁻¹⁶ | 2.51 × 10⁻¹⁶ |
| Name | Unit | Number |
|---|---|---|
| BMS | kg | 3.00 |
| coolant | kg | 3.00 |
| clamshell | kg | 5.00 |
| plastic shell | kg | 15.03 |
| connection piece | kg | 16.7 |
| harness | kg | 4.45 |
| piped water | kg | 65.1 |
| electronic | kWh | 77.6 |
Table 10.
The characterization results and benefits values of the cascaded utilization of power batteries.
Table 10.
The characterization results and benefits values of the cascaded utilization of power batteries.
| Evaluation Indicators | Decommissioning Remanufactured Batteries | New Construction of Replacement Batteries | Positive Benefits of Laddering | Percentage of Benefits |
|---|---|---|---|---|
| ADP(e) | 1.04 × 10⁻² | −4.42 × 10⁻² | −3.38 × 10⁻² | 76% |
| ADP(f) | 1.73 × 10³ | −9.91 × 10³ | −8.18 × 10³ | 83% |
| GWP | 9.89 × 101 | −1.69 × 10³ | −1.59 × 10³ | 94% |
| AP | 4.49 × 10⁻¹ | −6.76 × 100 | −6.31 × 10+0 | 93% |
| EP | 4.45 × 10⁻² | −2.80 × 10⁻¹ | −2.36 × 10⁻¹ | 84% |
| POCP | 3.40 × 10⁻² | −4.28 × 10⁻¹ | −3.94 × 10⁻¹ | 92% |
| HTP | 2.85 × 101 | −1.20 × 10³ | −1.17 × 10³ | 98% |
| ODP | 1.67 × 10⁻⁹ | −2.49 × 10⁻⁹ | −8.20 × 10⁻¹⁰ | 33% |
Table 11.
Battery capacity and quality parameters under different individual cell conversion rates.
| CCR | Remaining Battery Capacity/kWh | Usable Battery Mass/kg | Mass of New Battery/kg |
|---|---|---|---|
| 30% | 13.68 | 95 | 80.47 |
| 40% | 18.42 | 126 | 108.35 |
| 50% | 22.8 | 158 | 134.12 |
| 60% | 27.36 | 190 | 160.94 |
| 70% | 31.93 | 220 | 187.76 |
Table 12.
The sensitivity of each evaluation indicator to changes in the individual CCR parameter.
| CCR | ADP(e) | ADP(f) | GWP | AP | EP | POCP | HTP | ODP |
|---|---|---|---|---|---|---|---|---|
| 30% | −0.52 | −0.48 | −0.42 | −0.43 | −0.48 | −0.44 | −0.41 | −0.80 |
| 40% | −0.25 | −0.23 | −0.20 | −0.20 | −0.23 | −0.21 | −0.20 | −0.57 |
| 60% | 0.26 | 0.24 | 0.21 | 0.22 | 0.37 | 0.22 | 0.20 | 0.62 |
| 70% | 0.52 | 0.48 | 0.43 | 0.43 | 0.48 | 0.44 | 0.41 | 1.23 |
Table 13.
The sensitivity of evaluation indicator benefits percentage to variations in the individual CCR parameter.
Table 13.
The sensitivity of evaluation indicator benefits percentage to variations in the individual CCR parameter.
| CCR | ADP(e) | ADP(f) | GWP | AP | EP | POCP | HTP |
|---|---|---|---|---|---|---|---|
| 30% | 0.61 | 0.71 | 0.90 | 0.89 | 0.74 | 0.87 | 0.96 |
| 40% | 0.71 | 0.78 | 0.93 | 0.92 | 0.80 | 0.90 | 0.97 |
| 50% | 0.76 | 0.83 | 0.94 | 0.93 | 0.84 | 0.92 | 0.98 |
| 60% | 0.80 | 0.85 | 0.95 | 0.94 | 0.88 | 0.93 | 0.98 |
| 70% | 0.83 | 0.88 | 0.96 | 0.95 | 0.89 | 0.94 | 0.98 |
Disclaimer/Publisher’s Note: The statements, opinions and data contained in all publications are solely those of the individual author(s) and contributor(s) and not of MDPI and/or the editor(s). MDPI and/or the editor(s) disclaim responsibility for any injury to people or property resulting from any ideas, methods, instructions or products referred to in the content. |
© 2023 by the authors. Licensee MDPI, Basel, Switzerland. This article is an open access article distributed under the terms and conditions of the Creative Commons Attribution (CC BY) license (https://creativecommons.org/licenses/by/4.0/).
Share and Cite
MDPI and ACS Style
Liu, Y.; Zhang, C.; Hao, Z.; Cai, X.; Liu, C.; Zhang, J.; Wang, S.; Chen, Y. Study on the Life Cycle Assessment of Automotive Power Batteries Considering Multi-Cycle Utilization. Energies 2023, 16, 6859. https://doi.org/10.3390/en16196859
AMA Style
Liu Y, Zhang C, Hao Z, Cai X, Liu C, Zhang J, Wang S, Chen Y. Study on the Life Cycle Assessment of Automotive Power Batteries Considering Multi-Cycle Utilization. Energies. 2023; 16(19):6859. https://doi.org/10.3390/en16196859
Chicago/Turabian StyleLiu, Yongtao, Chunmei Zhang, Zhuo Hao, Xu Cai, Chuanpan Liu, Jianzhang Zhang, Shu Wang, and Yisong Chen. 2023. "Study on the Life Cycle Assessment of Automotive Power Batteries Considering Multi-Cycle Utilization" Energies 16, no. 19: 6859. https://doi.org/10.3390/en16196859
Note that from the first issue of 2016, this journal uses article numbers instead of page numbers. See further details here.