Cooling Strategy Optimization of Cylindrical Lithium-Ion Battery Pack via Multi-Counter Cooling Channels


1
Department of Mechanical Engineering, Graduate School of Kongju National University, 1223-24, Cheonan-daero, Seobuk-gu, Cheonan-si 31080, Republic of Korea
2
Department of Future Automotive Engineering, Kongju National University, 1223-24, Cheonan-daero, Seobuk-gu, Cheonan-si 31080, Republic of Korea
3
Department of Energy and Mineral Resources Engineering, Dong-A University, 37, Nakdong-daero 550beon-gil, Saha-gu, Busan 49315, Republic of Korea
4
Institute of Green Car Technology, Kongju National University, 1223-24, Cheonan-daero, Seobuk-gu, Cheonan-si 31080, Republic of Korea
*
Authors to whom correspondence should be addressed.
Energies 2023, 16(23), 7860; https://doi.org/10.3390/en16237860
Submission received: 31 October 2023
/
Revised: 24 November 2023
/
Accepted: 28 November 2023
/
Published: 30 November 2023
(This article belongs to the Section D2: Electrochem: Batteries, Fuel Cells, Capacitors)
Abstract
:This study focused on the design of a battery pack cooling channel based on a Tesla Model S electric car. This study aimed to achieve a balance between cooling efficiency and pressure drop while maintaining safe and optimal operating temperatures for the batteries. A cooling channel design similar to the basic type employed in the Tesla Model S using 448 cylindrical Li-ion batteries was considered. Consequently, important parameters, such as the maximum temperature and temperature difference in the battery cells in a module, as well as the pressure drop of the coolant, were analyzed. In addition, the characteristics of the temperature changes in each cooling channel shape were investigated. The temperature limit for the battery in a module and the temperature limit difference were set to 40 °C and 5 °C, respectively, to evaluate the performance of the cooling system. Further, the effects of discharge rates (3C and 5C), cooling channel shapes (counter flow and parallel types), and coolant inlet velocities (0.1, 0.2, 0.3, and 0.4 m/s) on battery thermal management were analyzed. The results revealed that the parallel type channel yielded a lower pressure drop than the basic type channel; however, it was not as effective in removing heat from the battery. In contrast, the counter flow type channel effectively removed heat from the batteries with a higher coolant pressure drop in the channel. Therefore, a multi-counter flow type cooling channel combining the advantages of both these channels was proposed to decrease the pressure drop while maintaining appropriate operating temperatures for the battery module. The proposed cooling channel exhibited an excellent cooling performance with lower power consumption and better heat transfer characteristics. However, relatively minimal differences were confirmed for the maximum temperature and temperature difference in the battery module compared with the counter flow type. Therefore, the proposed cooling channel type can be implemented to ensure the optimal temperature operation of the battery module and to decrease system power consumption.
1. Introduction
1.1. Research Background
In response to recent environmental regulations and the energy crisis, an increasing number of countries worldwide are implementing or reviewing emissions trading systems (ETS) and carbon taxes to prevent carbon emissions at the national level [1,2,3]. Electric vehicles, as representative eco-friendly vehicles, offer advantages, such as relatively low fuel costs and reduced noise levels compared to internal combustion engines, which emit carbon dioxide, and the supply of electric vehicles has been steadily increasing every year [4,5,6,7]. According to the 2022 market research by SNE Research, the demand for electric vehicles in the first half of the year increased by 61.3% compared with the same period last year. Moreover, the electric vehicle market economy is expected to grow within the automobile industry in terms of its economic impact [8,9]. In general, Li-ion, nickel–manganese, and Li-polymer batteries are primarily used as power sources in electric vehicles. Among them, Li-ion batteries are used as the power source for most electric vehicles, including the Chevrolet Volt and Tesla models, owing to their advantages of high energy density, high capacity, long lifespan, and light weight [10,11]. However, when Li-ion batteries are used in vehicles, the high voltage requirements generate significant heat inside the battery during driving. This heat increases the internal temperature of the battery, which promotes electrochemical reactions. This increases the rate of charge transfer, expands the energy and power capacity, and improves the battery’s output and efficiency. This heat generation promotes better overall battery performance [12]. However, excessive temperatures can negatively impact the performance and lifespan of the battery by increasing internal resistance [13,14]. In particular, a battery used in a vehicle is likely to generate a high discharge rate owing to high-speed charging and repeated load changes related to frequent high-speed driving. Such high discharge rate can cause a rapid increase in the battery temperature, resulting in thermal runaway, which threatens the safety of the battery and the lives of passengers [15]. In addition, the temperature difference between the cells in the module is set as 5 °C in the optimal operating temperature range (25–40 °C) when considering the life and efficiency of the battery even within the operation limit. Upon exceeding this range, the performance of the module may be adversely affected owing to electrical imbalance in the battery [16,17]. Therefore, a battery thermal management strategy, which can maintain an optimal operating temperature range and minimize the temperature difference between battery cells for safe and efficient driving, must be developed [18,19].
1.2. Literature Review
Battery cooling methods are primarily categorized as air cooling [20,21], liquid cooling [22,23], heat pipes [24,25], and using phase change materials (PCM) [26,27]. Air cooling is a simple and inexpensive method, but the limitations of air’s thermal conductivity and heat capacity make it less efficient in large electric vehicle battery packs [28,29]. Methods utilizing phase change materials (PCM) are considered an effective thermal management method and require additional materials and space, but they have a limitation in that they can absorb heat generated by the battery but cannot transfer heat away [30]. Heat pipes are primarily used as a passive strategy, but they are relatively expensive, and their use is limited by local gravity [23]. On the other hand, liquid cooling methods work very effectively due to the higher thermal conductivity and heat capacity of liquid coolants than air [31], and they offer benefits such as a streamlined structure and straightforward arrangement, providing advantages in terms of compactness and ease of organization [32]. Given these advantages, certain prominent EV brands, such as Tesla Model S, BMW i8, and Chevrolet Volt, have embraced liquid cooling technology [33].
Water cooling is used as a cooling system to prevent the battery from overheating, but it can still be problematic as the coolant heats up along the flow path, which can lead to a gradual temperature rise and non-uniformity of heat [31]. Therefore, an effective battery thermal management system (BTMS) must ensure that all Li-ion batteries can operate within an appropriate temperature range. The evaluation of a BTMS is mainly performed using the maximum temperature and the temperature difference across the battery pack. This study specifically focuses on thermal non-uniformity. If the thermal non-uniformity is not addressed, the internal resistance of the Li-ion battery may appear different, resulting in non-uniformity of the current, which in turn leads to thermal non-uniformity of the battery [34]. Therefore, maintaining the thermal uniformity of the battery pack is a very important factor for the overall performance. In recent years, many efforts have been made to improve the thermal non-uniformity by attempting different strategies.
C. Zhao et al. [35] considered a Tesla Model S pack with wavy channels and 71 18650 Li-ion battery modules, showing the thermal characteristics under different charging and discharging conditions. H. Wang et al. [19] produced a design with 20 18,650 Li-ion batteries and aluminum boards with curved surfaces. The results showed that at 3C discharge rate, the parallel cooling method showed the best thermal characteristics with a maximum temperature of 35.74 °C and a temperature difference of 4.71 °C. L. Xie, Y. Huang et al. [36] showed the thermal characteristics of adding baffles to the cooling channel using 48 18650 Li-ion batteries. However, by increasing the height and number of baffles, the heat transfer effect was improved, but the pressure increased. H. Zhou et al. [37] proposed a liquid cooling scheme based on a semi-spiral duct considering nine 18650 Li-ion batteries. Changing the flow direction of the fluid was effective in improving the thermal characteristics of the batteries. At a 5C discharge rate, the temperature difference between the maximum temperature at the end of discharge and the battery was 30.5 °C and 4.6 °C. L. Sheng et al. [38] proposed a novel cellular cooling jacket (CCJ) cooling scheme considering seven 21700 Li-ion batteries. By changing the liquid channel diameter and cooling medium, they showed a maximum temperature of 39.67 °C with a maximum temperature deviation of 4.71 °C. Y. Zhuang et al. [39] proposed a honeycomb cooling scheme, consisting of seven 18650 Li-ion batteries, six hexagonal liquid cooling plates with 18 flow channels, and PCM. By optimizing the PCM and the cold plate, the hybrid BTMS showed good thermal uniformity, with a maximum temperature of 51 °C and a maximum temperature deviation of 4 °C. G. Liang et al. [40] used 20 18650 Li-ion batteries to design a six cooling channel configuration with a serpentine inner surface and an internal flow channel. By applying a counter flow strategy, more uniform and symmetrical temperatures were achieved at both the battery and module levels, with performance results showing a maximum temperature of 38.95 °C and a maximum temperature deviation of 4.36 °C.
However, most of the aforementioned studies applying water-cooled cooling used a much smaller number of cells than the number of cells in a real car. They also started with simple flow paths initially and later introduced complex flow paths and additional water-cooled components gradually. The studies so far have mainly focused on flow characteristics and design optimization. In addition, studies analyzing thermal management strategies under specific conditions using long cooling channels have a limitation, in that high pressure drops result in lower power consumption efficiency and non-uniform temperature control. Furthermore, predicting accurate temperature distributions based on thermal management strategies for battery unit modules applied in real-world vehicles is challenged by the limited number of cells used in the analysis.
1.3. Motivation and Novelty
With the recent surge in popularity of electric vehicles, battery stability and intra-cell temperature uniformity have been the subject of intensive research. However, this prior research initially started with simple cooling flow path geometries and gradually evolved to more complex geometries. While this approach is useful in theory, it can pose significant challenges when applied to real-world automotive designs.
In addition, a module in a real car has about 400 or more cells connected to it, which is a substantial difference from previous studies, which mainly performed thermal analysis on 70–100 cells, which may not accurately reflect the thermal characteristics of a real car module. Therefore, to overcome these challenges, this study formulated and analyzed a thermal management strategy based on the cooling flow path configuration for 448 cells in the module of a Tesla Model S. This allowed us to more accurately model and understand the thermal issues, which may occur in a real car module. The novelty of this research is that it considered modules from real cars, rather than complex cooling flows, and modified existing simplified cooling flow geometries to provide results, which more closely approximate thermal issues. We expect this to contribute to providing important information needed to improve battery reliability and performance in electric vehicles.
To analyze the temperature distribution according to the shape of the cooling channel at the battery module level, the battery cooling channel applied to the Tesla Model S was first investigated as the basic type of cooling channel in this study. Thus, a new counter flow cooling path type was implemented using the ANSYS 2022 R1 software to improve the temperature uniformity within the battery module, which is a disadvantage of the snake cooling path. Subsequently, heat exchange was performed in the two cooling channels to improve the temperature uniformity of the module. In addition, to solve the high-pressure loss problem, a new parallel type cooling passage was proposed, and the pressure drop was decreased using a short cooling passage.
Finally, a multi-counter flow type was proposed to enhance heat transfer and reduce the pressure drop effects within a battery module.
Therefore, by implementing the proposed cooling passage type to the thermal management system of an electric vehicle, the thermal management efficiency can be significantly enhanced compared to the conventional snake cooling passage type.
2. Computational Models and Verification
2.1. Geometry and Boundary Conditions
In this study, we utilized the ANSYS 2022 R1 SpaceClaim software to facilitate model creation, drawing inspiration from R. Pakrouh et al.’s [41] snake type. We modeled a cylindrical battery, designating the snake type model as the most basic type in this research. The size of the cylindrical battery cell was 18 mm × 65 mm (diameter × height), and that of the unit module of the battery cells was 609 mm × 242.9 mm × 65 mm (W × D × H). The module comprised 32 horizontal and 14 vertical cells, and the width of the cooling channel applied to the module was 3 mm. In this study, three cooling channels were configured—basic, parallel, and counter flow—and the cooling effect of each channel configuration was analyzed. The basic type was set as the basic cooling channel configuration in this study.
When cooling water flows through the cooling water channel inlet, the heat generated in the batteries is released via heat transfer between the batteries and the cooling channel. Therefore, the temperature of the coolant starts to increase as it flows into the channel, and that of the battery decreases owing to heat dissipation to the coolant. The basic type configuration shown in Figure 1a has a large energy loss owing to a high pressure drop and temperature imbalance between the batteries; therefore, the cooling efficiency is expected to be lower than that of other cases [42]. In addition, the path of the channel through which the cooling water passes is meandered, which causes a temperature imbalance inside the module. Moreover, a temperature difference occurs in the battery cells at the coolant inlet and outlet, which also causes a temperature imbalance inside the module. To solve these problems, this study first proposed parallel and counter flow type cooling channels, as shown in Figure 1b,c, respectively. By applying the parallel type configuration, the long channel length of the basic type was shortened, thereby minimizing the energy loss by reducing the friction factor due to pipe friction, whereas in the counter flow type, the length of the cooling water channel inside the module remained the same as that of the basic type; however, the cooling water channel was divided into two separate channels, one at the top and one at the bottom. Thus, the height of each cooling channel was half of that in the basic type.
The cooling water flows in through inlet 1 and flows out through outlet 1, and another coolant flows into inlet 2 and flows out through outlet 2. The cooling water flowing into cooling water channel 1 and that flowing into cooling water channel 2 exchange heat via heat transfer, e.g., via a counter flow heat exchanger.
Therefore, in this study, two novel cooling channel geometries were proposed and compared with a conventional basic type cooling channel in order to enhance the heat management of the battery module and improve the temperature uniformity among the cells.
Table 1 lists the geometric parameters for each model.
In this study, the commercial computational fluid dynamics program FLUENT 2022. R1 was used, and the finite volume method was used to discretize the governing equations. The pressure field and velocity field were considered in terms of coupling and computation time, and the SIMPLE algorithm was applied [43]. The spatial discretization of momentum and energy was set to quadratic. Therefore, the conservation equations of mass, momentum, and energy were solved using the Navier–Stokes equations. The flow velocities at the inlet of the cooling water channel were 0.05, 0.1, 0.2, 0.3, and 0.4 m/s, and the Reynolds numbers (Re) were 285, 571, 1141, 1712, and 2283, respectively. A laminar flow model was used, as all Re values were less than 2300. The fluid used in actual automotive cooling is a mixture of water and ethylene glycol, which is preferred by many automotive industries due to its high cooling efficiency and corrosion protection, but this study is a basic study for further in-depth research, and it focuses on providing a solution to increase battery cooling efficiency through a simple model. For this reason, the cooling fluid was assumed to be water, as it is the most common fluid, and this was done to produce more intuitive and understandable results. In addition, it was assumed that the cooling water was incompressible and that the flow of the cooling water was in a steady state. Table 2 lists the boundary conditions for the simulations used in this study. The boundary condition of the inlet for the cooling water was set to a flow velocity; the outlet was set to atmospheric pressure; and the external temperature was set to 25 °C. Since the inside of the battery module is filled with velocity-stopped air, and the battery surface (cell to cell) acts as the contact surface with the outside air, except for the contact surface between the battery and the coolant, convective heat transfer occurs. Therefore, natural convective heat transfer is applied, and the convective heat transfer coefficient is set to 5 [44]. In addition, all outer boundaries of the coolant channel in the simulation, except for the inlet and outlet of the cooling water, were assumed to be adiabatic, and the initial temperature of all parts was set to 25 °C. Table 3 lists the properties of the materials used in the simulations.
2.2. Governing Equations
The mathematical model applied in the simulation was based on the following assumptions:
- The physical properties of the battery material are uniform, and the heat generated by the battery is constant and uniform.
- The current density is uniform throughout the battery during the charge–discharge cycle.
- Thermal radiation is neglected.
While the assumed heat generation may differ from real-world situations, this is a fundamental study; therefore, rather than considering a complex non-linear heat generation model (transient), a simpler model (steady) was used to study the cooling characteristics under typical heat generation [46,47].
According to the above assumptions, the energy equation of the battery is expressed as
where is the thermal conductivity of the battery; is the temperature difference between the batteries; and is the battery heating rate. was based on a study by Bernardi et al. [48].
The exothermic equation is expressed as follows:
where is the irreversible heat; is the reversible heat; is the current; , are the open circuit voltages of the negative and positive electrodes, respectively; is the terminal voltage; and is the battery temperature.
For batteries, and , according to the state of charge (SOC) and depth of discharge (DOD), were referred to in the literature [49,50,51].
Because heat generation is assumed to be uniform, the calorific value per battery volume can be expressed as follows:
where is the volumetric heat generation rate; is the battery calorific value from Equation (2); and is the volume of the battery. The values were simulated by setting 3C (74,852.4 ) and 5C (165,654.4 ) as per the study by Pakrouh et al. [41].
The fluid-governing equations for calculating the mass and volume of the coolant, velocity and pressure of the fluid, and heat transfer are as follows:
where represent the density, specific heat, temperature, thermal conductivity, and temperature difference of the fluid, respectively.
The simulation was set to a laminar flow model by calculating the Reynolds number of the cooling water.
The boundary conditions of the battery at the interface are expressed by the laws of conservation of energy and Newton’s law of cooling, as follows:
where are the thermal conductivities of the battery and coolant, respectively; is the heat transfer by convection per unit area; is the convective heat transfer coefficient; is the temperature of the battery surface; and is the ambient temperature. According to Min et al., the value of h was set to 5 [44].
The mass flow rate of the coolant through the channels is expressed as
where is the cross-sectional area of the channel.
Subsequently, based on the pressure drop, the pump power can be expressed as
where P is the pump power; is the pressure drop; is the mass flow rate of the cooling water; and is the density of the cooling water [45].
A constant temperature of 25 °C was set at the inlet of the channel, and atmospheric pressure was set as the boundary condition at the outlet.
Further, as the initial condition of the simulation, the overall temperature, including that of the battery and coolant, was considered as starting from 25 °C.
2.3. Grid Independence Verification
This study focused on simulating the thermal behavior of a basic type model with 448 Li-ion batteries and cooling channels using the FLUENT 2022 R1 Meshing software and NVIDIA DGX STATION (Future Automotive Intelligent Electronics Core Technology Center, Cheonan, Republic of Korea) to generate the grid. A hexahedral mesh was used to ensure the accuracy and speed of the simulations. The accuracy of the simulation results is affected by the size and number of grids used in the mesh. In general, the higher the number of grids, the higher the accuracy of the simulation results. However, the cooling channel model independence must be verified to reduce the impact of grid number and size on the calculation results. To determine the grid independence of the model, the effect of grid size on the coolant outlet temperature was investigated.
The inlet mass flow rate of the cooling water used in the simulation was , and the cooling water temperature was set at 25 °C. This is because in order to ensure the reliability of the boundary conditions and grid quality for the subsequent comparative validation of this simulation model and R. Pakrouh et al.’s [41] model, the minimum flow rate and cooling water temperature of R. Pakrouh et al.’s [41] model were used as a reference. In the grid independence test, the grid size used for the simulation was changed stepwise to evaluate its effect on the accuracy of the results. This test aimed to determine the minimum grid size required to obtain accurate results while minimizing the computational cost of the simulation.
In this simulation, we used a cubic grid and compared the error rate between the theoretical value of the outlet temperature and the simulation results for each grid size, as shown in Table 4. It can be observed that the error rate increases as the grid size increases, indicating that the simulation does not converge more accurately. However, with the 1.4 mm and 1.6 mm grid sizes, the error rate exceeded 5%, indicating that the results were unreliable with these grid sizes. This is because the grid was too coarse to accurately capture the flow and heat transfer details. However, increasing the grid size from 1.2 mm to 1.0 mm resulted in a slight increase in the outlet temperature from 0.02% to 0.009 °C. This shows that the solution has already converged to a stable solution and that increasing the number of grids further will not significantly improve the accuracy and will only add unnecessary computational cost. Therefore, a grid size of 1.0 mm was chosen for this simulation to balance the computational cost with the accuracy of the results.
3. Results and Discussion
3.1. Reliability Verification of the Model
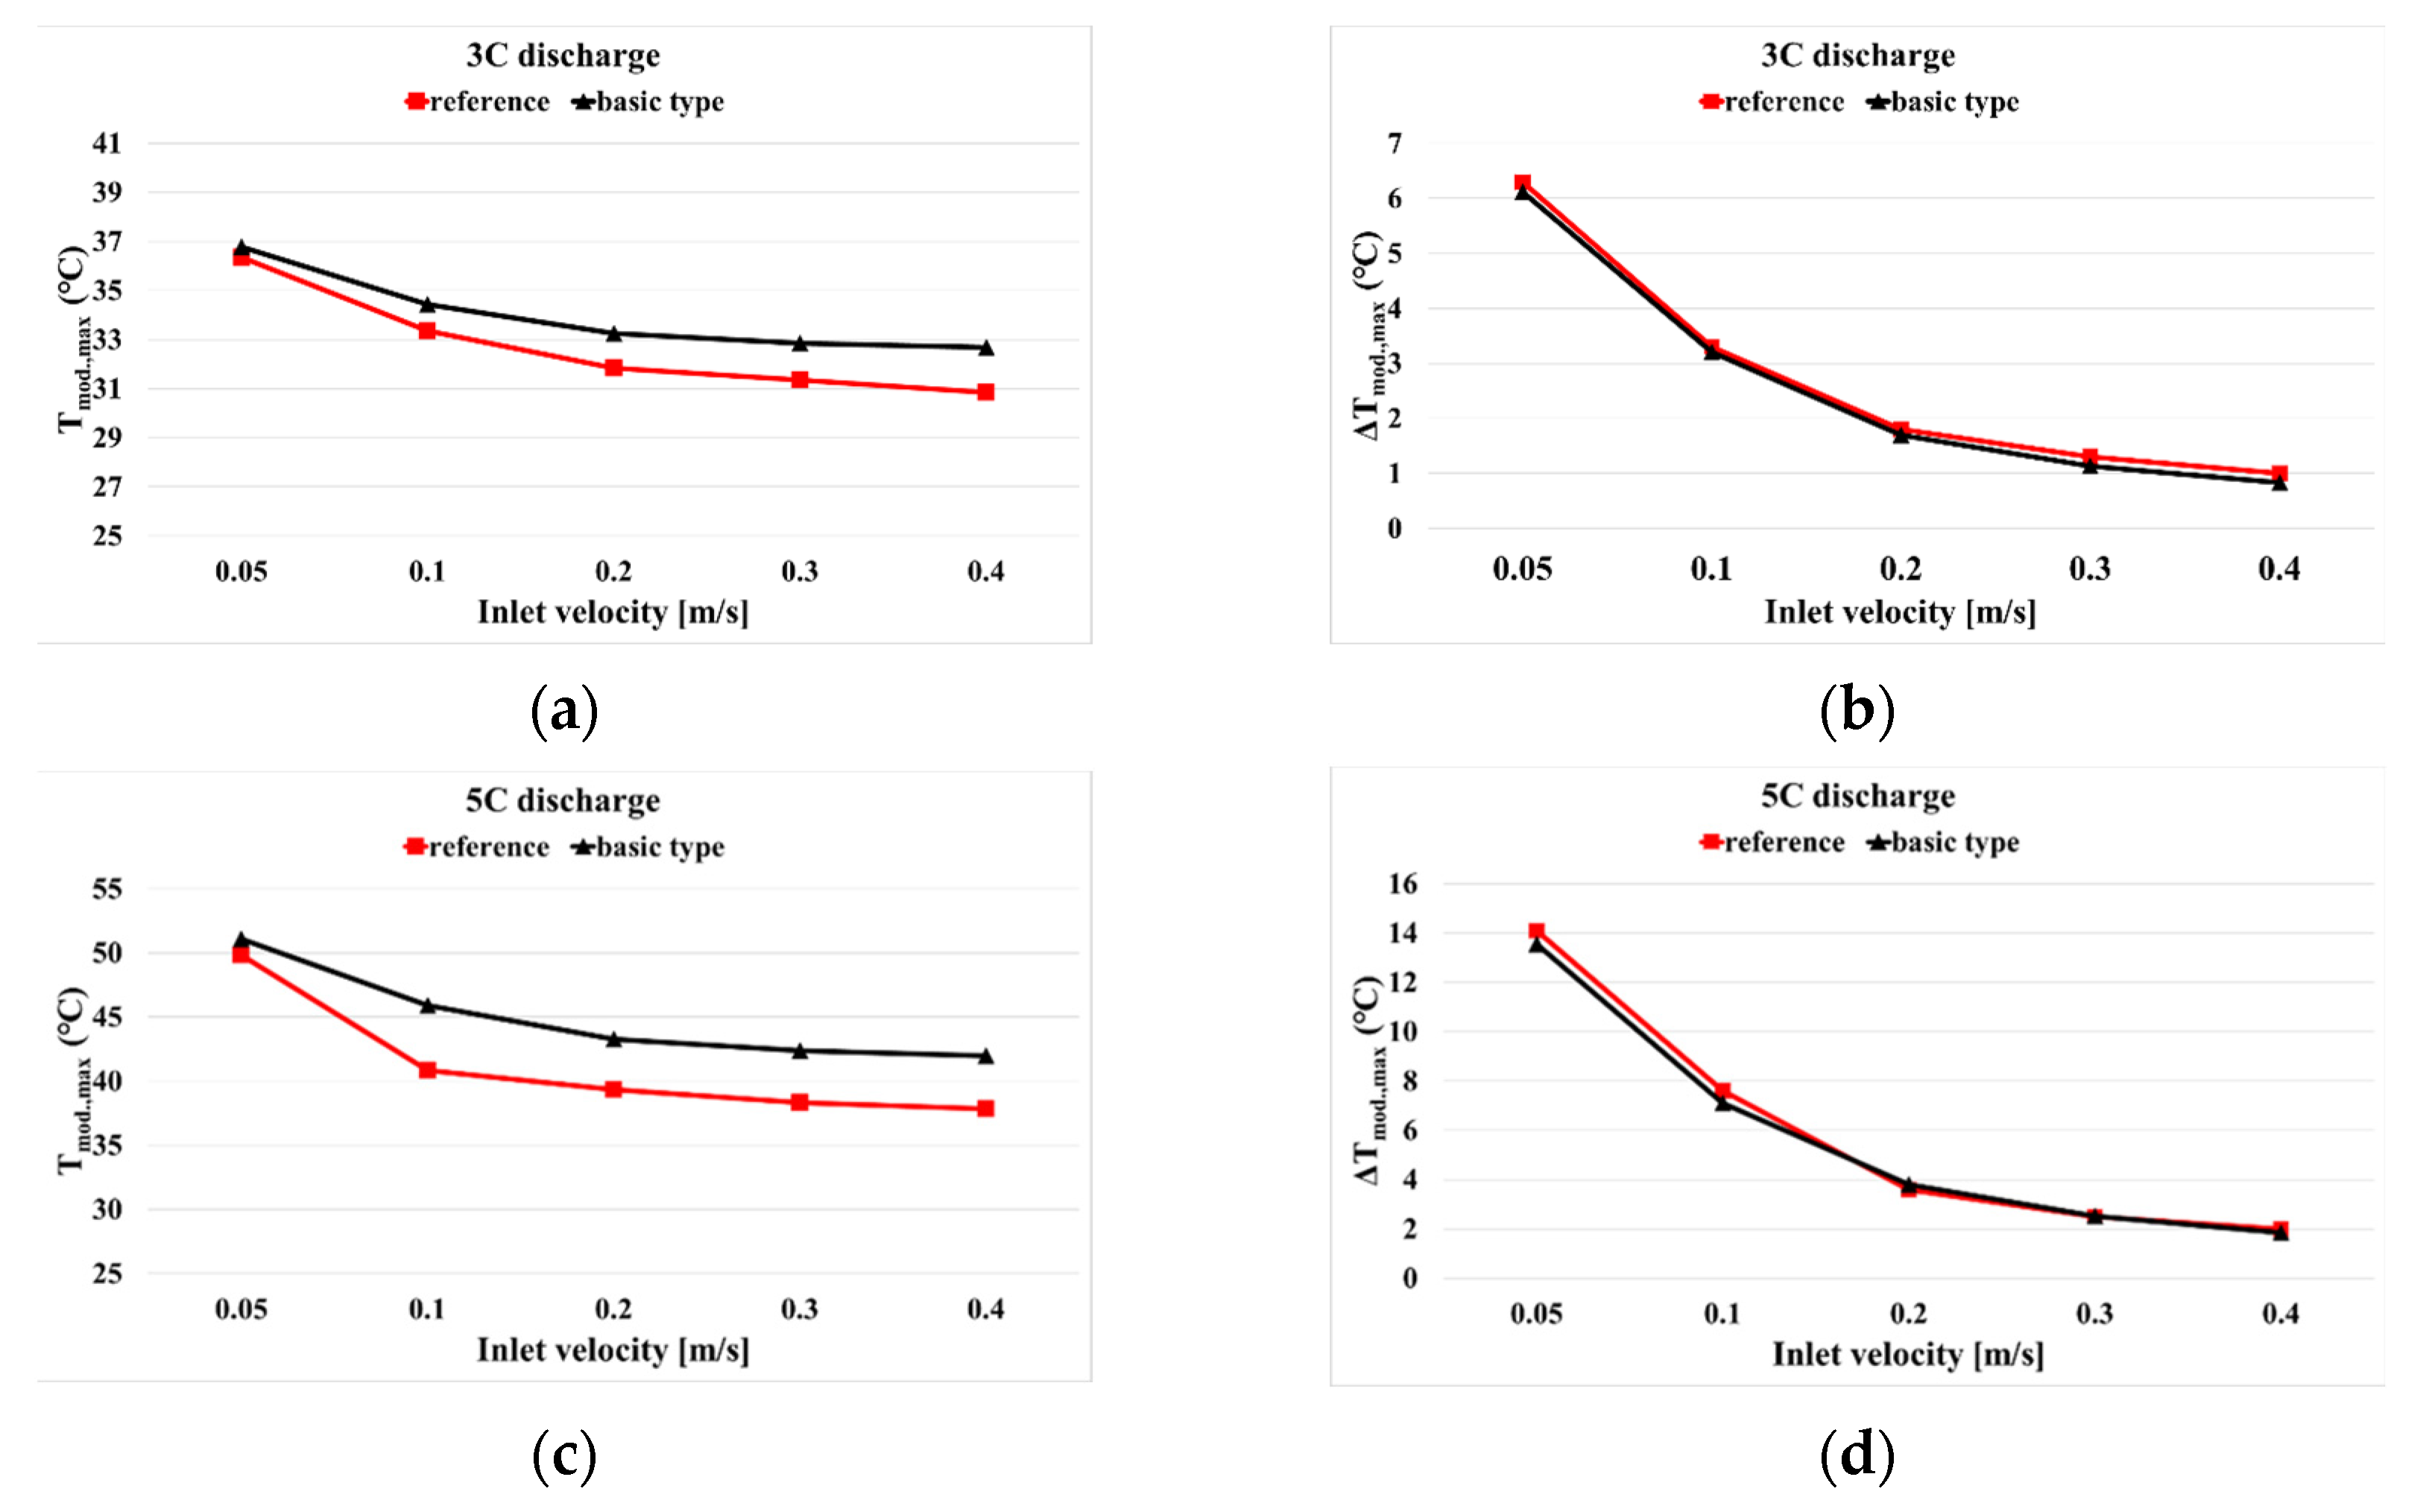
Thus, the reliability of the battery thermal management model developed in this study was verified. For this, the simulation data obtained in this study must be compared and verified with those obtained by other researchers. Such validation confirms the accuracy and reliability of the computational model and the results obtained. In this study, as shown in Figure 2, the maximum temperature of the battery in the module according to the change in discharge rates (3C, 5C) and inlet flow velocities (0.05, 0.1, 0.2, 0.3, and 0.4 m/s) of the Li-ion battery and the temperature difference between the maximum and minimum temperatures were verified through comparisons with the reference (Pakrouh et al. [41]) and basic type.
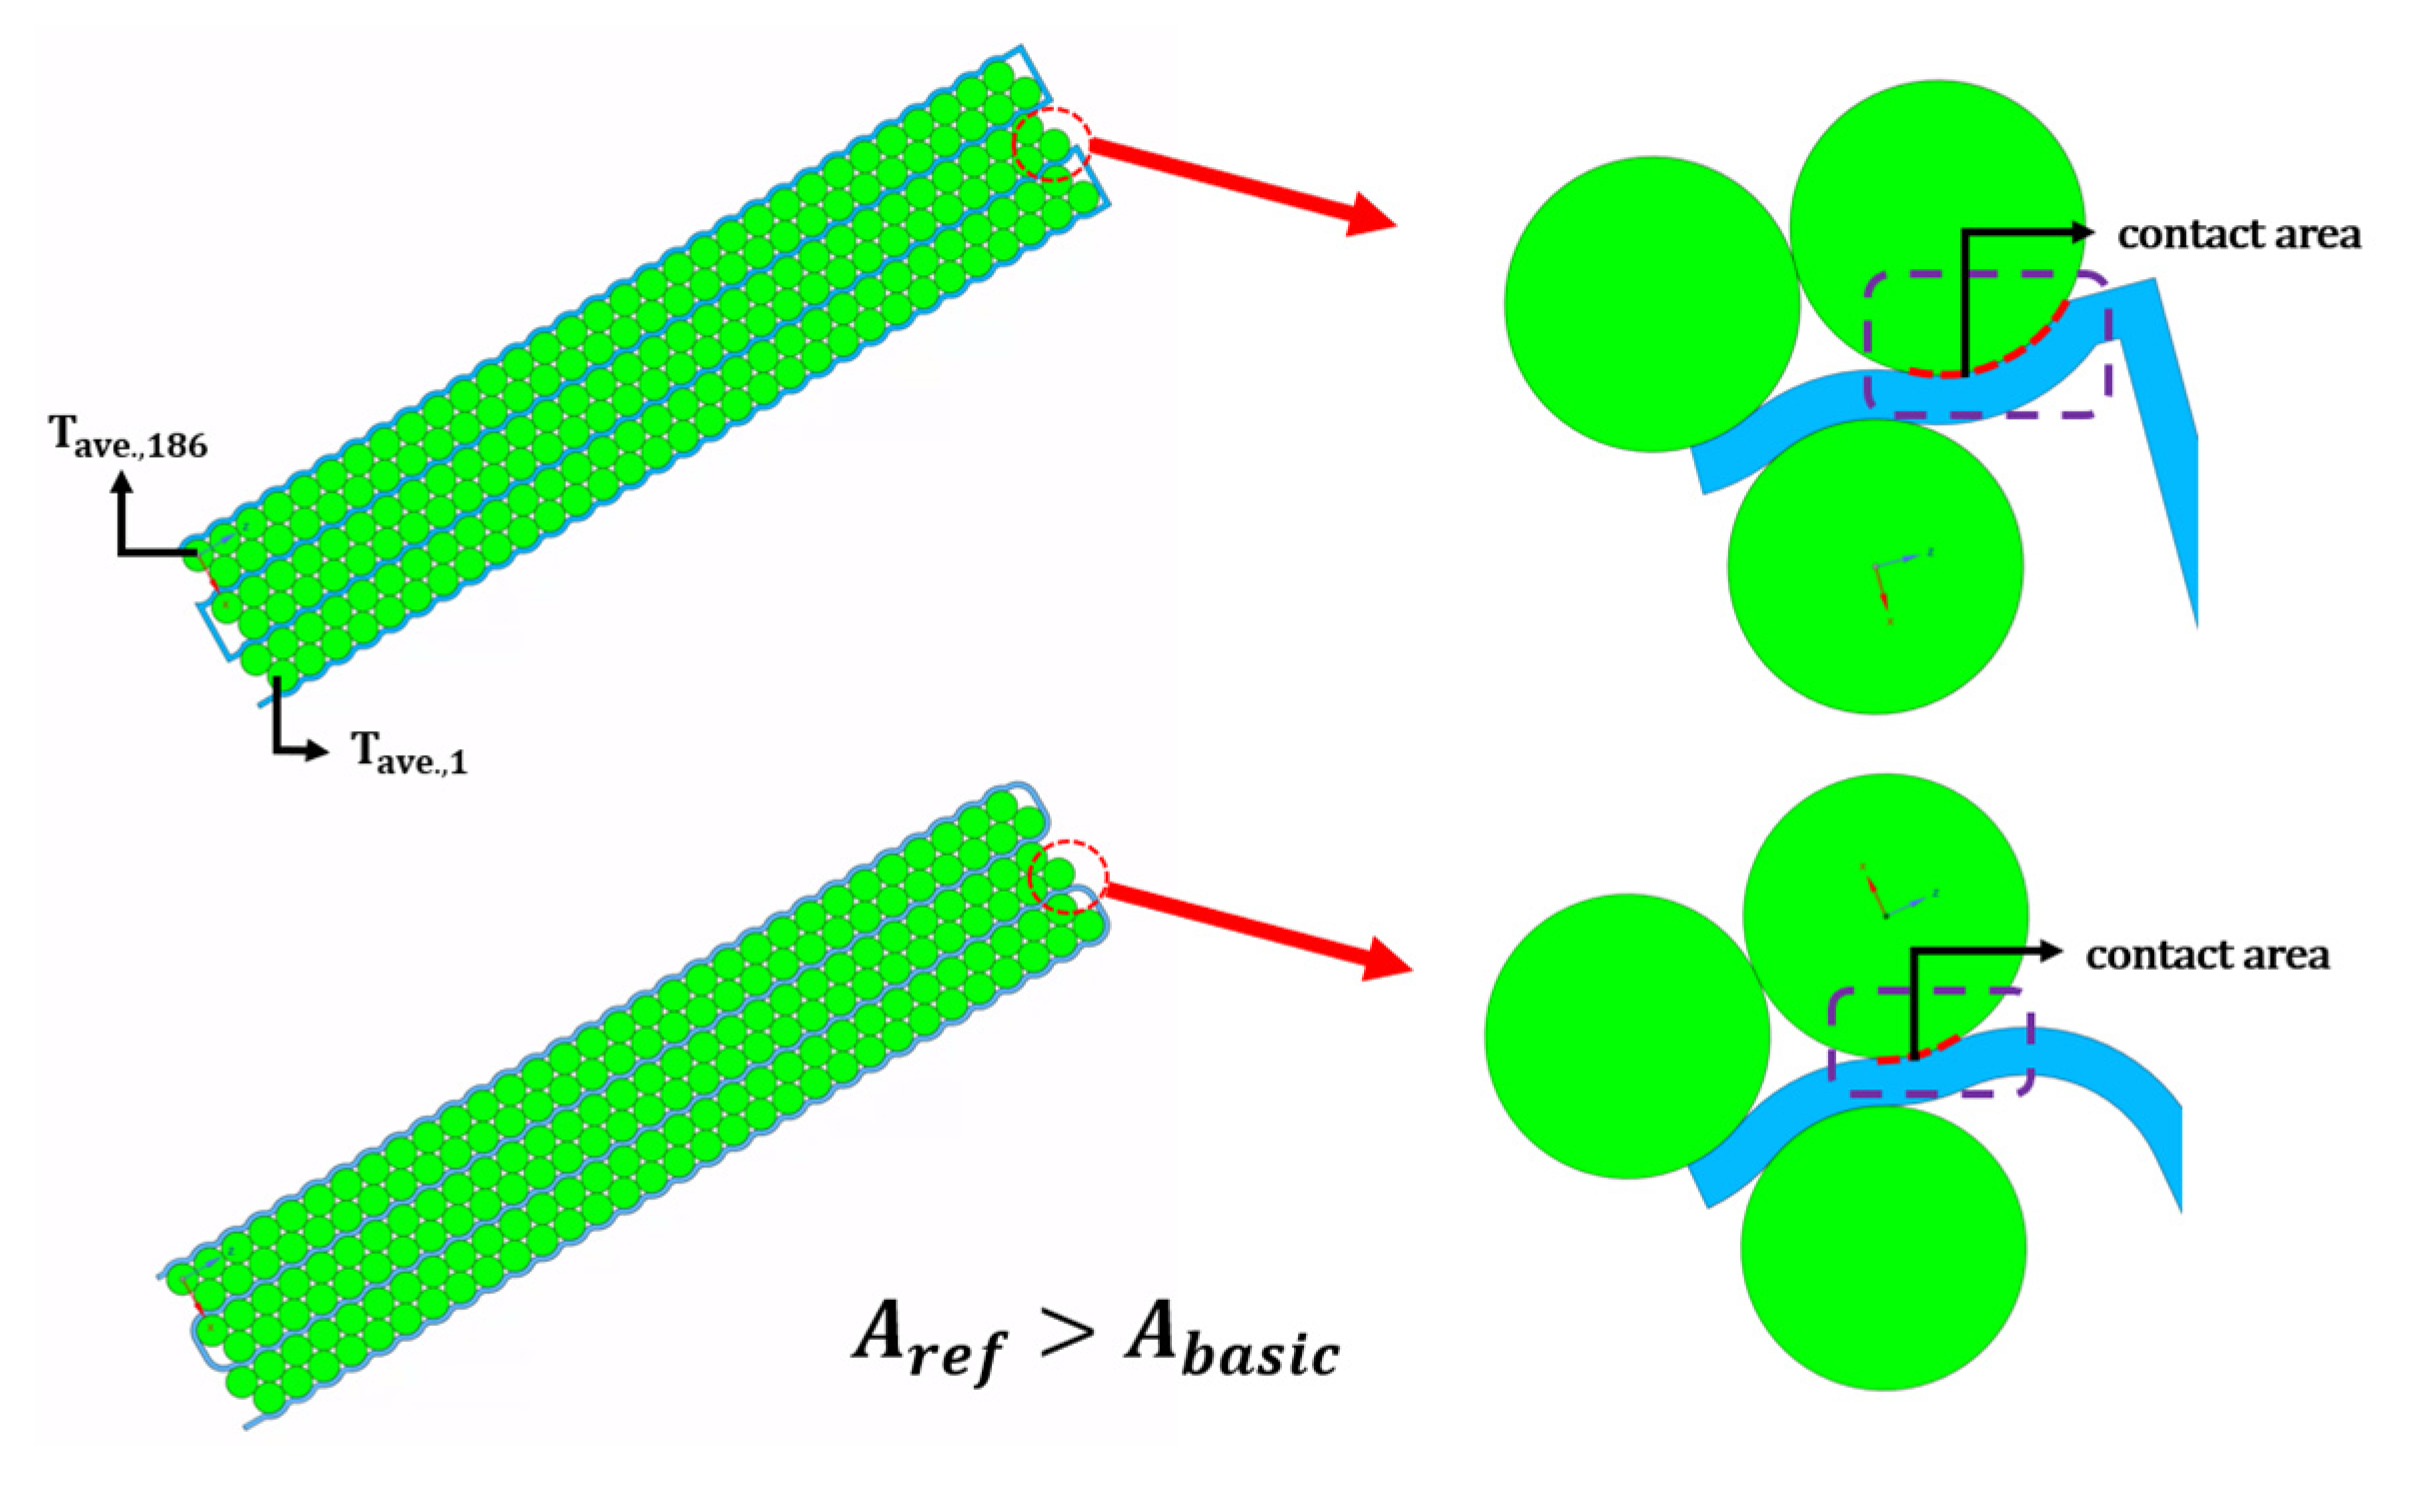
Figure 2a,d show the maximum temperature of the battery in the module () at different coolant inlet flow velocities. Evidently, the 3C discharge rate exhibited temperature differences of 0.4, 1.1, 1.4, 1.5, and 1.8 °C according to the flow velocity change; in the case of the 5C discharge rate, they were 1.2, 5.1, 3.9, 4, and 4.1 °C, respectively. A temperature difference occurred because of the slight geometric differences between the basic and reference models used in this study. In this study, since we modeled the battery cooling channels similar to those used in real Tesla electric vehicles, the contact area between the battery cells and the cooling channels is 659.4 for the reference model and 259.1 for the model developed in this study, as shown in Figure 3. This results in an area difference of 400.3 . This results in a difference in heat transfer between the cells at each corner, increasing the maximum temperature of the module by 1.18% at 3C and 2.44% at 5C discharge rate.
Figure 2b,c show the temperature difference () between the average temperature of the 186th cell of the battery ( and that of the 1st cell of the battery ( according to the calculation method of the reference model. The maximum temperature difference between the batteries within a module was calculated using Equation (16).
Consequently, temperature differences of 0.18, 0.09, 0.11, 0.16, and 0.17 °C were observed at the 3C discharge rate, and those of 0.56, 0.49, 0.21, 0.017, and 0.15 °C were observed at the 5C discharge rate according to the inlet flow velocity change, respectively. Therefore, the basic model developed in this study was similar to the simulation results of the reference model. Thus, the reliability of the model can be validated by showing similar trends in the discharge rate and cooling water velocity changes.
3.2. Effect of Cooling Channel Geometry on BTM
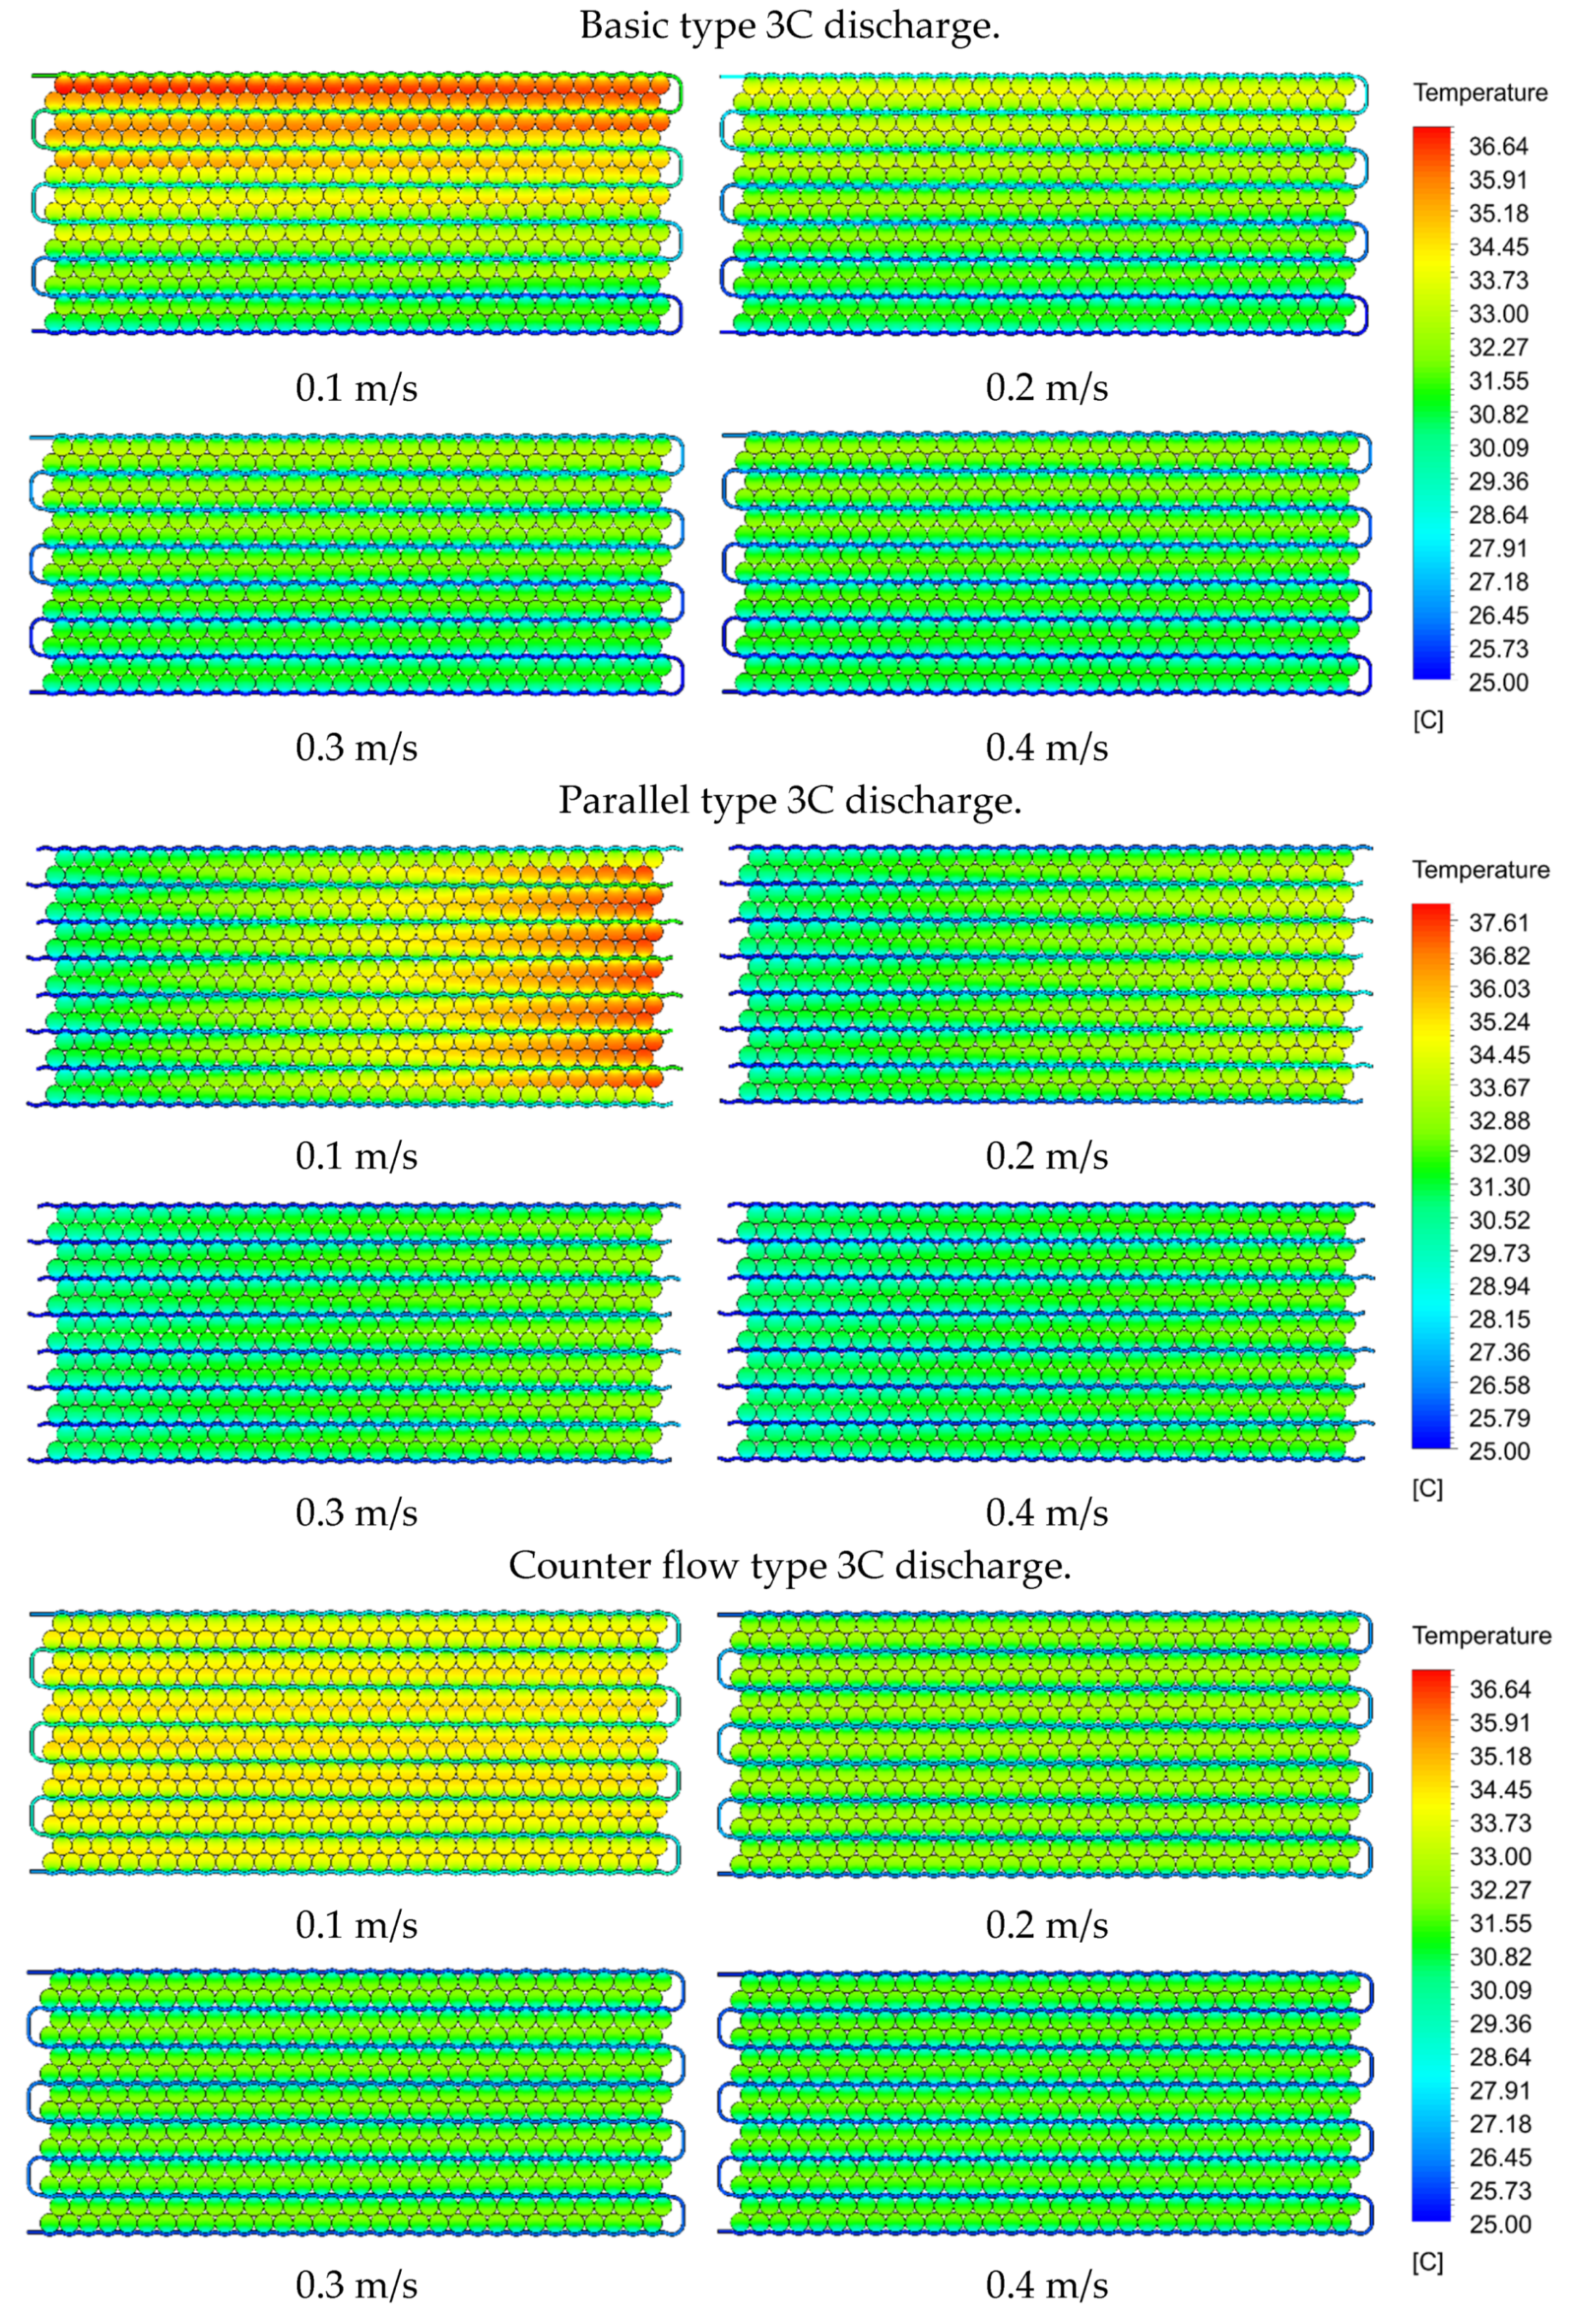
In this study, the effect of temperature on the BTM was analyzed using three channel types: basic, parallel, and counter flow types. The heat generated inside the battery increased the overall temperature of the battery module. To dissipate the heat generated by the battery, the coolant flows along the flow path, absorbs the heat generated by the battery, and increases the coolant temperature. Figure 4 shows the visualization of the temperature distribution of the 32.5 mm (1/2 battery height) part of the middle height of the battery cell for discharge rates of 3C and 5C. It was analyzed according to the type of flow path with the reference inlet flow velocity (0.05 m/s) used in the reference model.
Figure 4a shows that the coolant absorbs heat from the battery through a serpentine path using a basic type channel. Initially, the cold coolant at 25 °C entered the channels and absorbed a significant amount of heat generated by the battery. As the coolant flowed through the channels, the amount of heat absorbed from the battery gradually decreased, and the temperature of the batteries at the outlet gradually increased, forming a wide hot area at the outlet. This is because the cooling water had already absorbed a significant amount of heat at the outlet, and the cooling water temperature was significantly higher than the initial temperature of 25 °C. Figure 4b shows a parallel type channel with multiple channels instead of the single channel of the basic type, and the uniform mass flow rate of the cooling water entered eight flow paths. Evidently, the edge battery cells at the top and bottom of the cooling passage conducted heat exchange on only one side, whereas the central battery conducted heat exchange with the cooling passage on both sides, thereby forming a high-temperature region in the center.
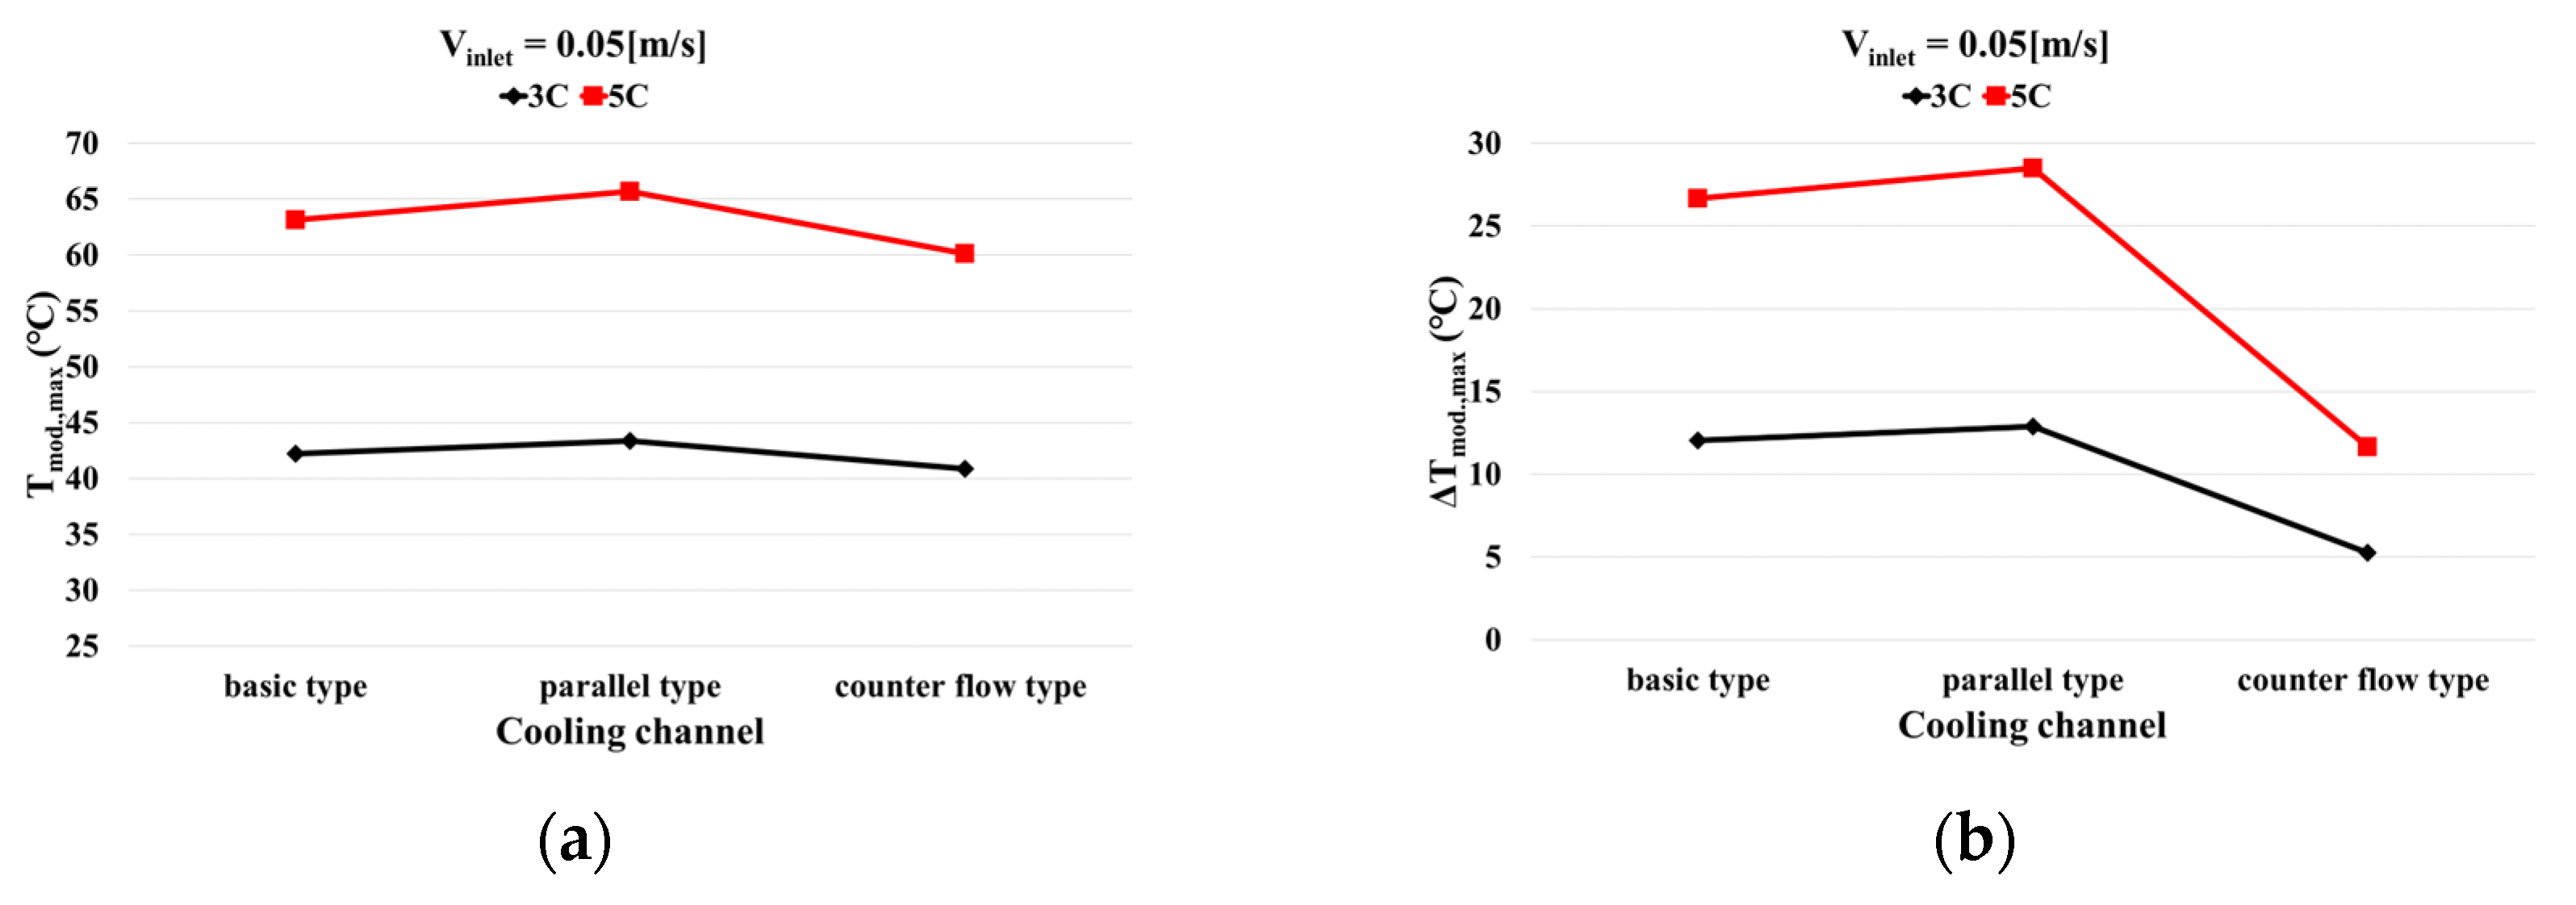
Figure 4c shows that the counter flow type channel has a similar cooling path to the basic type; however, the cooling water flowed into the upper and lower two channels from opposite entrances and exits. Therefore, when the coolant moved toward the outlet of the channel, the temperature of the fluid gradually increased owing to the heat absorbed by the battery; however, the temperature inside the module was evenly distributed because of the heat exchange generated by the cold coolant flow (25 °C) from the opposite inlets. Figure 5 shows the maximum temperature of the battery in the module, average temperature of the first battery cell, and temperature difference between the maximum temperature of the battery in the module and the average temperature of the first row of battery cells based on the temperature distribution visualization presented in Figure 4. The formula for calculating the temperature difference is as follows:
Basic and counter flow type temperature difference
Parallel type temperature difference
Figure 5a shows that the maximum temperature inside the battery module increased according to the cooling water channel shape at discharge rates of 3C and 5C. The maximum temperature of the parallel type channel increased by 1.14 and 2.52 °C at 3C and 5C discharge rates, respectively, compared to the basic type channel. This is because the length of the parallel type channel was shorter than that of the basic channel; therefore, relatively less heat was absorbed or discharged through the outlet. However, the counter flow type reduced the maximum temperature of the module by 1.36 and 3.02 °C at 3C and 5C discharge rates, respectively, compared to the basic type. This is attributed to more active heat exchange through the flow of cooling water in opposite directions. The heat exchange was improved, leading to more efficient cooling of the battery, owing to the configuration of two intersecting coolant channels.
Figure 5b shows that the temperature difference increased within the battery module because the basic and parallel types absorbed and dissipated battery heat only through a one-way passage. With an increase in the discharge rate, the temperature difference increased by a factor of approximately two. This implied that the temperature difference became more severe as the discharge rate increased for each part of the battery module, leading to reduced battery performance. Conversely, a counter flow type cooling flow path comprises two intersecting channels, thereby allowing the coolant and heat to be distributed more evenly throughout the battery module. Consequently, compared to the basic type, the temperature difference within the module was reduced by 6.78 and 15.01 °C at discharge rates of 3C and 5C, respectively, resulting in more uniform temperature distribution and improved battery performance.
Overall, the counter flow type cooling channel demonstrated superior performance in terms of both the maximum temperature and temperature difference in the battery module. Its design facilitated improved heat exchange between the coolant and the battery, resulting in more effective cooling.
3.3. Effect of Coolant Inlet Velocity on BTM
In this section, we investigate the effect of coolant inlet velocity on the performance of the battery cooling system.
In this study, the basic, parallel, and counter flow type cooling channels were compared under the conditions of cooling water inlet velocities () of 0.1, 0.2, 0.3, and 0.4 m/s and discharge rates of 3C and 5C.
Figure 6 shows the temperature distribution of each cooling channel according to different discharge rates (3C and 5C) and flow velocities (0.1, 0.2, 0.3, and 0.4 m/s). Figure 7 also shows the effect of the cooling water inlet flow velocity on the maximum temperature and temperature difference in the battery module based on the visualization of the temperature distribution presented in Figure 6. As described in Section 1, if the battery continues to maintain a high temperature, the life of the battery decreases, and the driver’s safety may also be threatened owing to thermal runaway. Therefore, the temperature range of 25–40 °C is considered ideal for the battery to ensure optimal performance, while the temperature difference within the module should be limited to within 5 °C. Therefore, when the fluid velocity increased, the maximum temperature and temperature difference in the battery module decreased regardless of the discharge rate. This is due to the occurrence of the enhanced convective heat transfer with an increase in the fluid velocity. Convective heat transfer is the heat transfer between a surface and a moving fluid. With an increase in fluid velocity, the heat transfer rate was increased, resulting in a decrease in the maximum temperature.
At the discharge rate of 3C, shown in Figure 7a, even when the coolant inlet flow velocity was the lowest (0.1 m/s), the maximum temperatures of the battery modules of the basic, parallel, and counter flow type cooling channels were maintained within the temperature limit () of 40 °C. In addition, the temperature difference according to the 3C discharge rate in Figure 7b was maintained within the temperature limit difference () of 5 °C when the velocity was over 0.2 m/s in each cooling channel. This is because when the flow velocity is low, the temperature distribution across the cooling channel becomes unbalanced, resulting in a large temperature difference. However, the counter flow type cooling channel was able to maintain the temperature difference () within the acceptable limit of 5 °C, even when the flow velocity was as low as 0.1 m/s.
At the discharge rate of 5C (Figure 7c), for the lowest flow velocity of 0.1 m/s, it was confirmed that the basic, parallel, and counter flow types all reached the temperature limit () of 40 °C or higher. In addition, even when the flow velocity increased, the maximum temperature was confirmed to be over 40 °C. However, at the 5C discharge rate and fluid velocity of 0.2 m/s or greater (Figure 7d), although the counter flow type temperature difference in the module was maintained within the temperature limit difference () of 5 °C, it was not maintained in the basic and parallel types. The most important outcome of this part is the counter flow type performance. The temperature difference in the counter flow type was within the range of 5 °C temperature difference limit despite the change in discharge rate (3C and 5C), and minimal change was observed with an increase in the flow rate (0.1, 0.2, 0.3, and 0.4 m/s). Therefore, the performance of the cooling system is dependent on the shape of the cooling channel, and it was confirmed that counter flow type cooling with opposite fluid flows in the two cooling water channels was the most effective.
3.4. Effect of Pressure Drop on BTM
For battery cooling systems, the pressure drop is an important factor to consider. A pressure drop indicates that the fluid pressure decreased as the coolant fluid flowed through the channels. Maintaining a proper pressure drop is essential for the efficient and effective operation of cooling systems. In battery cooling systems, a higher pressure drop can increase power consumption, which can ultimately affect battery performance and lifespan. Therefore, the selection of an optimal cooling system, which can provide an adequate pressure drop while efficiently cooling the battery, is crucial.
Figure 8 and Table 5 compare the pressure drop results of the basic, parallel, and counter flow type cooling channels with respect to the coolant flow velocity.
The basic and counter flow type channels exhibited an increased pressure drop with the increase in coolant flow velocity. This is attributed to frictional losses, which occur when a fluid passes through a long, narrow channel. As the flow velocity increased, the resistance of the fluid increased, resulting in a higher pressure drop. The frictional loss is proportional to the length of the channel; therefore, a longer length of the basic and counter flow type channels compared with the parallel type channel resulted in a higher pressure drop.
In particular, the counter flow type channel has an area of 97.5 mm2, and the basic type channel has a two-fold difference in area compared to the counter flow type channel. As a result, even at the same flow rate, a larger pressure drop occurs as the narrower channel is passed through.
For example, at a flow rate of 0.1 m/s, the pressure difference between the basic type and counter flow type was 23.72 Pa, but as the flow rate increased, this difference increased to 114.67 Pa at a flow rate of 0.4 m/s. This difference was caused by the different hydraulic diameters of the channels. On the other hand, the parallel type channel showed a much lower pressure drop than the basic type and counter flow type channels. This is because the length of the parallel type is 632.5 mm, while the length of the basic type and counter flow channels is 5186.1 mm, which is a difference of 4553.6 mm. Therefore, there is less friction loss, resulting in a lower pressure drop. The pressure drop difference between the basic type and parallel type is 741.16 and 4176.81 Pa at flow rates of 0.1 m/s and 0.4 m/s, respectively. Therefore, when designing a cooling channel, the length and cross-sectional area of the channel must be considered to minimize the friction loss and pressure drop. Moreover, design methods, which can increase the cooling efficiency while reducing the length, such as parallel type channels, must be considered.
The battery cooling system removes heat from the battery and maintains a stable battery temperature. The performances of these battery cooling systems are determined by the battery discharge rate and temperature limit requirements. Figure 9 shows the comprehensive results of () and () according to the 3C and 5C discharge rates and coolant flow velocities. Table 6 and Table 7 show whether each cooling channel satisfies the battery cooling system temperature limit requirements based on the results shown in Figure 9.
Table 6 presents the results for the battery discharge rate of 3C. Evidently, the only cooling channel, which maintained the temperature limit difference () within 5 °C even at the lowest flow velocity (0.1 m/s), was the counter flow type. It also satisfied the requirement of a temperature limit () of 40 °C or less. Therefore, the counter flow type channel is the only cooling channel, which can satisfy the performance requirements of the battery cooling system at a 3C discharge rate.
Table 7 presents the results for the case where the battery discharge rate was 5C.
In this case, the basic, parallel, and counter flow types all failed to satisfy the requirements at the temperature limit () of 40 °C. However, the counter flow type channel maintained the temperature limit difference () within 5 °C when the flow velocity was over 0.2 m/s. This is because the counter flow type channel is particularly effective in dissipating the heat generated during high battery discharge rates.
Therefore, counter flow type channels are the only channels, which can satisfy the performance requirements of battery cooling systems even at 5C discharge rates. Summarizing all the above results, the counter flow type exhibited better performance than the basic and parallel types in terms of temperature. However, it exhibited a higher pressure drop than the basic type. Therefore, for optimization, this study analyzed the effect of combining a parallel type cooling channel with the lowest pressure drop and a counter flow type cooling channel with excellent temperature on the battery cooling system. Thus, by combining the advantages of both types, an optimized cooling channel design was proposed for the battery cooling system.
3.5. Effect of Optimized Cooling Channel
The combination of parallel type and counter flow type channels is a new design solution to overcome the limitations of battery cooling systems. As shown in Figure 10, multi-counter flow type cooling channels provide approximately twice as many cooling channels as parallel type cooling channels. This was not considered in this study because the cost can vary with fluctuations in material prices, and in high-performance equipment, weight can also affect performance. The goal of this research is to provide a solution, which can effectively dissipate the heat generated by the battery while keeping pressure losses low. The counter flow type channel is effective in removing heat from the battery; however, it is longer, and the cross-section of the flow channel is 1/2 smaller than that of the basic channel, resulting in a higher pressure drop. In contrast, parallel type channels are short and have a low pressure drop, but they are not effective in removing heat from the battery. Therefore, the cooling channel shape was optimized by combining the advantages of both channels.
Figure 10 shows a schematic of a cooling channel, which combines the advantages of both types of channels (parallel type and counter flow type). The two passages have opposite fluid flows and are composed of a parallel channel structure rather than a single channel structure (basic type and counter flow type).
Figure 11 shows a temperature distribution comparison between the multi-counter flow types.
The figure shows that with an increase in the flow velocity, the high-temperature and low-temperature regions of the basic type cooling channel were clearly visible, whereas the multi-counter flow type cooling channel showed a uniform temperature distribution. In addition, the maximum temperature of the battery module was lower than that of the basic module as the flow rate increased. Figure 12 shows the maximum temperature and temperature difference in the battery module based on the temperature distribution visualization shown in Figure 11.
The results presented in Figure 12 show the maximum temperature and temperature difference in the battery module at various flow rates (0.1, 0.2, 0.3, 0.4 m/s) and discharge rates (3C, 5C). The results show that the maximum temperature is similar for the basic type and multi-counter flow type, but the temperature difference between cells in the battery module is significantly different. This is because, as mentioned in the Introduction, keeping the temperature difference between cells in the battery module within 5 °C has an important impact on battery life and efficiency. Especially in the low-speed section, the cooling flow path of the multi-counter flow type reached the target temperature of 5 °C earlier than the basic type, and we focused on this point. Specifically, in Figure 12a,b, the multi-counter flow type, compared to the basic type, reduced the maximum temperature to 0.16, 0.08, 0.05, and 0.04 °C at 3C discharge rate and 0.35, 0.19, 0.12, and 0.11 °C at 5C discharge rate. This implies that the multi-counter flow type is effective in reducing the maximum temperature of the battery module; however, the difference between the two types is relatively small.
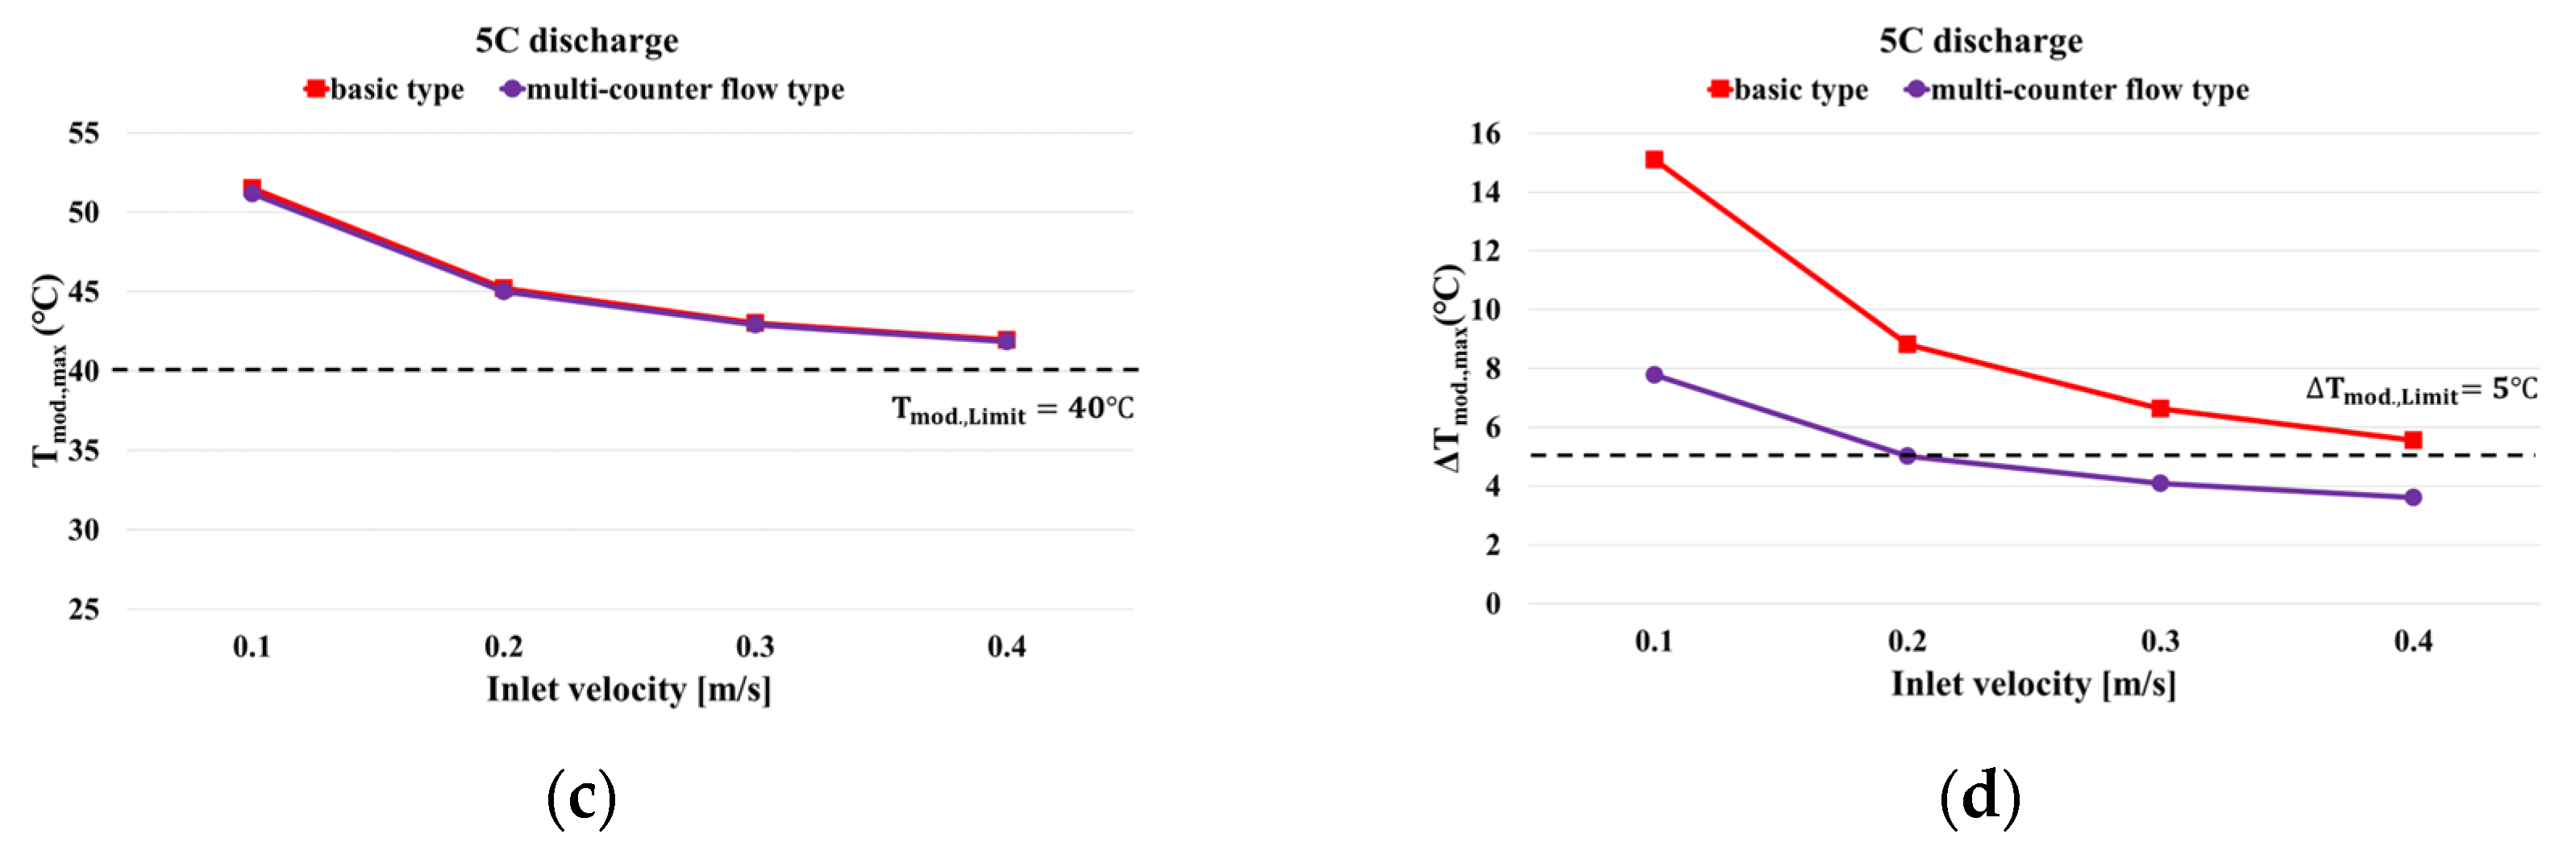
Further, Figure 12c,d show that the multi-counter flow type significantly reduced the temperature difference. Compared to the basic type, it was confirmed that the difference in temperature difference was greatly reduced by 3.31, 1.71, 1.15, and 0.87 °C at 3C discharge rate and by 7.32, 3.79, 2.54, and 1.93 °C at 5C discharge rate. The largest difference in temperature difference was observed at the 5C discharge rate, suggesting that the multi-counter flow type was particularly effective in reducing the temperature difference at high discharge rates. Overall, the multi-counter flow type was found to be effective in reducing both the peak temperature and temperature deviation of the battery module, particularly at high discharge rates. In addition, the maximum temperature and temperature deviation of the battery module were compared for the counter flow type—which was the best in terms of temperature—and the multi-counter flow type cases.
Figure 13 compares the maximum temperature and temperature difference in the battery module at various flow rates (0.1, 0.2, 0.3, 0.4 m/s) and discharge rates (3C and 5C) for the counter flow type cooling channel—which showed superior performance in terms of temperature compared to the basic type cooling channel—and the newly proposed multi-counter flow type cooling channel. The results show that the maximum temperature and temperature difference decrease in a similar trend. Although the counter flow type cooling channel reached the target temperature of 5 °C in the low-speed section first, we found that the multi-counter flow type also reached 5 °C in a similar way. Therefore, the multi-counter flow type cooling channel is not much different from the counter flow type, which showed the best performance in terms of temperature. It also showed superior performance compared to the basic type cooling channel, and we focused on this point to derive the results.
Specifically, the maximum temperature difference between the counter flow and multi-counter flow types decreased by 0.59, 0.29, 0.21, and 0.15 °C at 3C discharge rate and by 1.31 °C, 0.65 °C, 0.46 °C, and 0.33 °C at 5C discharge rate. In addition, the difference in the temperature difference between the counter flow and multi-counter flow types decreased by 0.34, 0.17, 0.11, and 0.09 °C at 3C discharge rate and by 0.76 °C, 0.37 °C, 0.26 °C, and 0.19 °C at 5C discharge rate. Therefore, it is evident that the counter flow type is effective in reducing the maximum temperature and temperature difference in the battery module, but the difference between the two types is relatively small. In addition, as the flow rate increased, the difference between the two cooling channels decreased, regardless of the discharge rate. However, the counter flow type consumes more power owing to the higher pressure drop. Although this can be effective in reducing the maximum temperature and temperature differences, it necessitates more power to cool the battery.
Figure 14 and Table 8 show the basic, counter flow, and multi-counter flow type pressure drop comparisons for various fluid velocities (0.1, 0.2, 0.3, and 0.4 m/s). The counter flow type exhibited a higher pressure drop than the basic and multi-counter flow types.
As shown in Figure 14a, with an increase in fluid velocity, the pressure drop of the multi-counter flow type decreased significantly compared with that of the basic type.
Specifically, the difference in pressure drop was reduced by 713.87, 1667.28, 2825.96, and 4175.48 Pa compared to the basic type at various fluid velocities (0.1, 0.2, 0.3, and 0.4 m/s). Further, Figure 14b shows that the difference in pressure drop was reduced by 737.6, 1717.61, 2907.47, and 4290.16 Pa compared to the counter flow type, respectively.
This is because the multi-counter flow type has a multi-channel design, and the fluid flow path is shorter than that of the basic and counter flow types. These short flow paths reduce the pressure drop, improve cooling efficiency, and reduce power consumption.
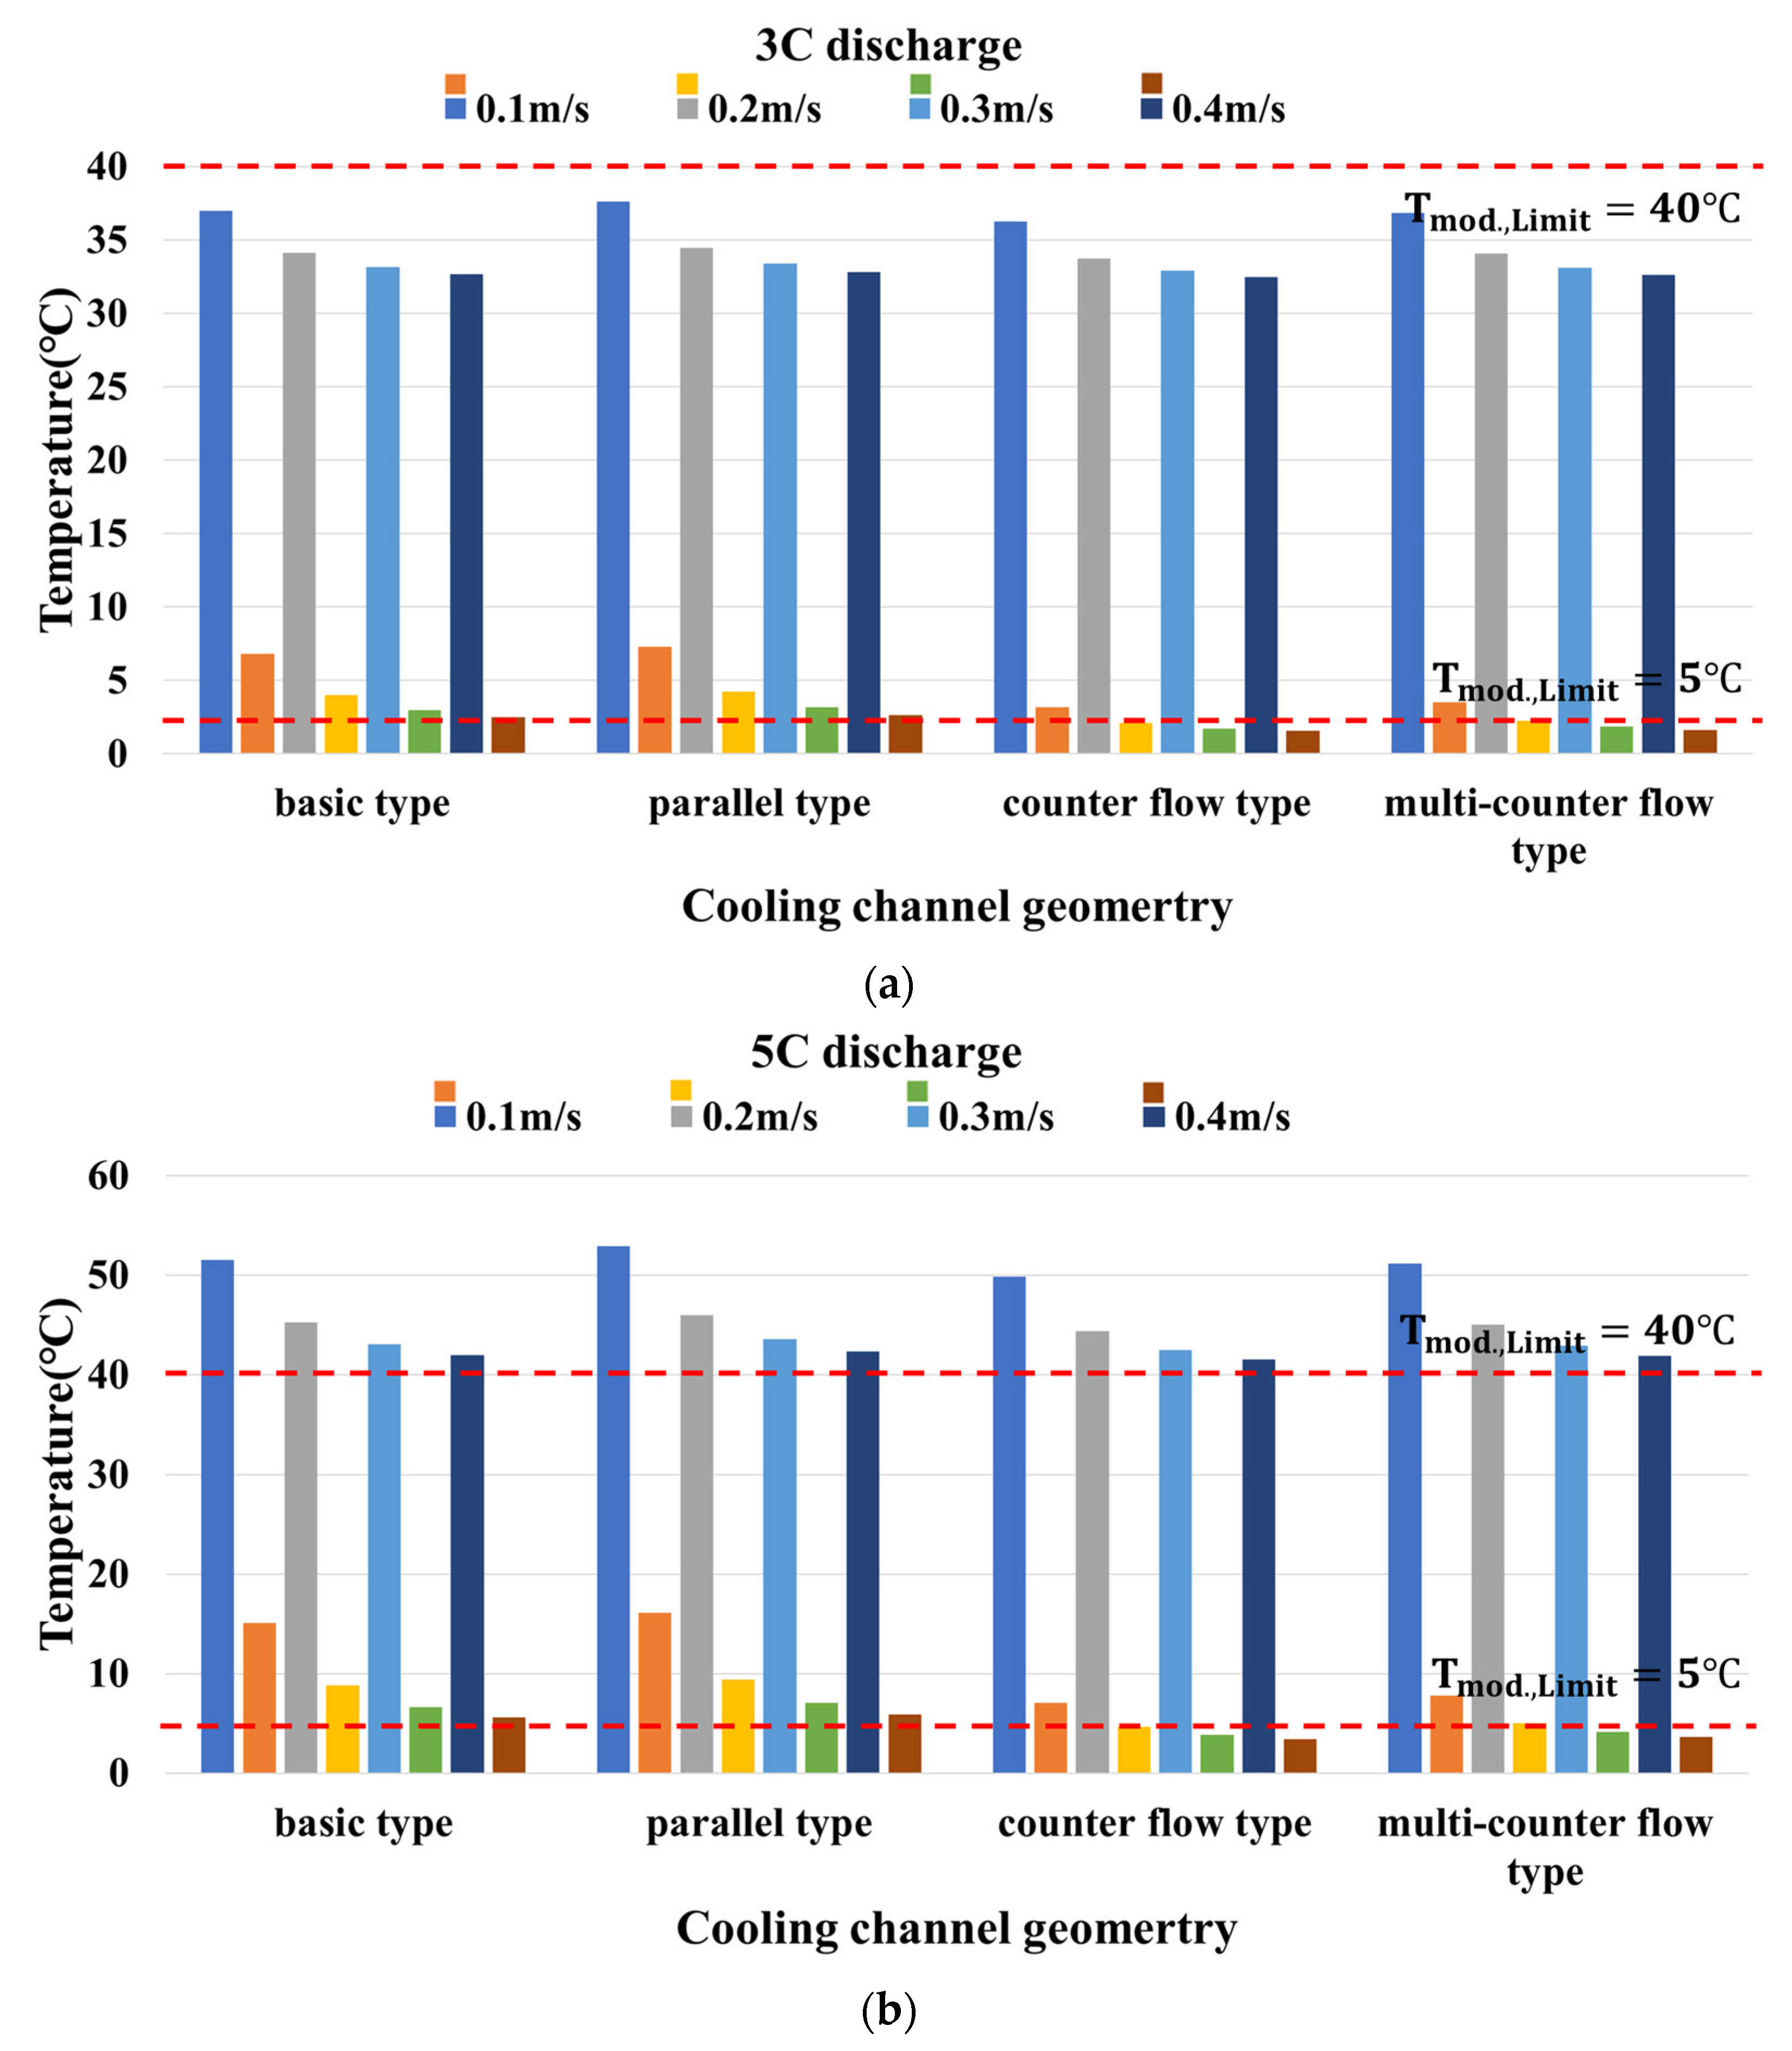
Figure 15 shows the comprehensive results of , , and under 3C and 5C discharge rates and various flow rates for all simulation results. Table 9 and Table 10 provide an assessment of whether the battery cooling system satisfied the temperature limit requirements.
Table 9 and Figure 15a show the results when the battery discharge rate was 3C. According to Table 9, the cooling channels, which maintained the module temperature difference within the temperature limit difference () of 5 °C, even at the lowest fluid speed of 0.1 m/s, were the counter flow and multi-counter flow types. In addition, the maximum temperature of the battery module remained within the specified limit of 40 °C, meeting the performance requirements for the battery cooling system, particularly at a 3C discharge rate. This demonstrates that the multi-counter flow type cooling channel is capable of satisfying the thermal management needs of the battery system under such operating conditions.
Table 10 and Figure 15b show the results when the battery discharge rate was 5C. In this case, all cooling channels did not meet the requirement to keep the maximum temperature of the battery module within the limit of 40 °C. In addition, the temperature difference () within the module was relatively poor in situations where the multi-counter flow type cooling channel had a very low inflow rate of 0.2 m/s compared with the counter flow type. This is because the multi-counter flow type cooling channel was about eight times shorter than the counter flow type. Because the multi-counter flow type has a relatively short flow path length, it exits the cooling channel before sufficient cooling is achieved in a relatively low fluid velocity section. This has been shown to reduce cooling efficiency. Nevertheless, the multi-counter flow type cooling channel meets the performance requirements of the battery cooling system at a 5C discharge rate. Figure 15c shows that the multi-counter flow type exhibited a very low pressure drop and low power consumption. Therefore, summarizing all the results, the multi-counter flow type exhibited better performance than the basic type in terms of temperature and pressure drop. This cooling channel reduced the battery temperature difference while maintaining a low pressure drop, which was the goal of this study. Thus, the multi-counter flow type is an optimized cooling channel suitable for use in battery cooling system designs.
4. Conclusions
The cylindrical Li-ion batteries used in electric vehicles require effective thermal management through liquid cooling for safe and efficient operation. The objective of this study was to investigate the utilization of liquid water as a coolant in the cooling system of a Tesla Model S vehicle. Subsequently, the effects of geometry of the cooling channel, coolant flow rate, and battery discharge rate on battery thermal management were confirmed.
- The superior cooling performance of the counter flow type compared to the basic type was confirmed, as evidenced by the reduced maximum temperature and temperature difference within the battery module. However, the counter flow type exhibited a higher pressure drop and power consumption than the basic type.
- The parallel type had a small pressure drop but did not properly remove the heat generated from the battery; meanwhile, the counter flow type had a high pressure drop but effectively removed the battery heat. Therefore, this study proposed the use of a multi-counter flow type cooling channel, which combined the advantages of both channels to reduce the pressure drop and maintain the battery module temperature appropriately.
- The multi-counter flow type channel achieved both efficient cooling and low power consumption. Further, it was confirmed that the maximum temperature and temperature difference in the module were relatively small compared with those of the counter flow type.
This study serves as a foundation for the development of a thermal management system for cylindrical Li-ion batteries utilized in electric vehicles.
Author Contributions
Conceptualization: H.J. and J.H.; investigation: H.J. and S.H.; writing—original draft preparation: H.J., J.Y. and S.H.; writing—review and editing: J.Y. and J.H.; supervision: J.Y. and J.H. All authors have read and agreed to the published version of the manuscript.
Funding
This research was supported by “Regional Innovation Strategy (RIS)” through the National Research Foundation of Korea (NRF) funded by the Ministry of Education (MOE)(2021RIS-004), and this work was supported by the National Research Foundation of Korea (NRF) grant funded by the Korean government (MSIT) (No. 2021R1G1A1009630).
Data Availability Statement
The data are contained within the article.
Conflicts of Interest
The authors declare that they have no known competing financial interest or personal relationships that could have appeared to influence the work reported in this paper. And The authors declare the following financial interests/personal relationships which may be considered as potential competing interests.
References
- Zhang, Q.; Niu, J.; Yang, J.; Liu, T.; Bao, F.; Wang, Q. In-situ explosion limit analysis and hazards research of vent gas from lithium-ion battery thermal runaway. J. Energy Storage 2022, 56, 106146. [Google Scholar] [CrossRef]
- Qiu, Y.; Jiang, F. A review on passive and active strategies of enhancing the safety of lithium-ion batteries. Int. J. Heat Mass Transf. 2022, 184, 122288. [Google Scholar] [CrossRef]
- Xin-Gang, Z.; Wenjie, L.; Wei, W.; Shuran, H. The impact of carbon emission trading on green innovation of China’s power industry. Environ. Impact Assess. Rev. 2023, 99, 107040. [Google Scholar] [CrossRef]
- Zhao, G.; Wang, X.; Negnevitsky, M.; Zhang, H. A review of air-cooling battery thermal management systems for electric and hybrid electric vehicles. J. Power Sources 2021, 501, 230001. [Google Scholar] [CrossRef]
- Zhou, H.; Zhou, F.; Xu, L.; Kong, J.; Yang, Q. Thermal performance of cylindrical Lithium-ion battery thermal management system based on air distribution pipe. Int. J. Heat Mass Trans. 2019, 131, 984–998. [Google Scholar] [CrossRef]
- Saechan, P.; Dhuchakallaya, I. Numerical study on the air-cooled thermal management of Lithium-ion battery pack for electrical vehicles. Energy Rep. 2022, 8, 1264–1270. [Google Scholar] [CrossRef]
- Sheng, L.; Su, L.; Zhang, H.; Li, K.; Fang, Y.; Ye, W.; Fang, Y. Numerical investigation on a lithium ion battery thermal management utilizing a serpentine-channel liquid cooling plate exchanger. Int. J. Heat Mass Transf. 2019, 141, 658–668. [Google Scholar] [CrossRef]
- Xu, C.; Steubing, B.; Hu, M.; Harpprecht, C.; van der Meide, M.; Tukker, A. Future greenhouse gas emissions of automotive lithium-ion battery cell production. Resour. Conserv. Recycl. 2022, 187, 106606. [Google Scholar] [CrossRef]
- Yang, Z.; Chen, H.; Peng, C.; Liu, X. Exploring the role of environmental regulations in the production and diffusion of electric vehicles. Comput. Ind. Eng. 2022, 173, 108675. [Google Scholar] [CrossRef]
- Zeng, W.; Niu, Y.; Li, S.; Hu, S.; Mao, B.; Zhang, Y. Cooling performance and optimization of a new hybrid thermal management system of cylindrical battery. Appl. Therm. Eng. 2022, 217, 119171. [Google Scholar] [CrossRef]
- Held, M.; Tuchschmid, M.; Zennegg, M.; Figi, R.; Schreiner, C.; Mellert, L.D.; Welte, U.; Kompatscher, M.; Hermann, M.; Nachef, L. Thermal runaway and fire of electric vehicle lithium-ion battery and contamination of infrastructure facility. Renew. Sustain. Energy Rev. 2022, 165, 112474. [Google Scholar] [CrossRef]
- Ma, S.; Jiang, M.; Tao, P.; Song, C.; Wu, J.; Wang, J.; Deng, T.; Shang, W. Temperature effect and thermal impact in lithium-ion batteries: A review. Prog. Nat. Sci. 2018, 28, 653–666. [Google Scholar] [CrossRef]
- Mathieu, R.; Briat, O.; Gyan, P.; Vinassa, J.-M. Comparison of the impact of fast charging on the cycle life of three lithium-ion cells under several parameters of charge protocol and temperatures. Appl. Energy 2021, 283, 116344. [Google Scholar] [CrossRef]
- Zhang, Z.; Yu, W.; Li, H.; Wan, W.; Zhang, W.; Zhuo, W.; Liu, Q. Heat transfer characteristics and low-temperature performance of a lithium-ion battery with an inner cooling/heating structure. Appl. Therm. Eng. 2023, 219, 119352. [Google Scholar] [CrossRef]
- Esho, I.; Shah, K.; Jain, A. Measurements and modeling to determine the critical temperature for preventing thermal runaway in Li-ion cells. Appl. Therm. Eng. 2018, 145, 287–294. [Google Scholar] [CrossRef]
- Appleberry, M.C.; Kowalski, J.A.; Africk, S.A.; Mitchell, J.; Ferree, T.C.; Chang, V.; Parekh, V.; Xu, Z.; Ye, Z.; Whitacre, J.F.; et al. Avoiding thermal runaway in lithium-ion batteries using ultrasound detection of early failure mechanisms. J. Power Sources 2022, 535, 231423. [Google Scholar] [CrossRef]
- Parekh, M.H.; Li, B.; Palanisamy, M.; Adams, T.E.; Tomar, V.; Pol, V.G. In Situ Thermal Runaway Detection in Lithium-Ion Batteries with an Integrated Internal Sensor. ACS Appl. Energy Mater. 2020, 3, 7997–8008. [Google Scholar] [CrossRef]
- Yang, W.; Zhou, F.; Zhou, H.; Wang, Q.; Kong, J. Thermal performance of cylindrical lithium-ion battery thermal management system integrated with mini-channel liquid cooling and air cooling. Appl. Therm. Eng. 2020, 175, 115331. [Google Scholar] [CrossRef]
- Wang, H.; Tao, T.; Xu, J.; Mei, X.; Liu, X.; Gou, P. Cooling capacity of a novel modular liquid-cooled battery thermal man-agement system for cylindrical lithium ion batteries. Appl. Therm. Eng. 2020, 178, 115591. [Google Scholar] [CrossRef]
- Mahamud, R.; Park, C. Reciprocating air flow for Li-ion battery thermal management to improve temperature uniformity. J. Power Sources 2011, 196, 5685–5696. [Google Scholar] [CrossRef]
- Yu, K.; Yang, X.; Cheng, Y.; Li, C. Thermal analysis and two-directional air flow thermal management for lithium-ion battery pack. J. Power Sources 2014, 270, 193–200. [Google Scholar] [CrossRef]
- Huo, Y.; Rao, Z.; Liu, X.; Zhao, J. Investigation of power battery thermal management by using mini-channel cold plate. Energy Convers. Manag. 2015, 89, 387–395. [Google Scholar] [CrossRef]
- Chen, D.; Jiang, J.; Kim, G.-H.; Yang, C.; Pesaran, A. Comparison of different cooling methods for lithium ion battery cells. Appl. Therm. Eng. 2016, 94, 846–854. [Google Scholar] [CrossRef]
- Zhao, R.; Gu, J.; Liu, J. An experimental study of heat pipe thermal management system with wet cooling method for lithium ion batteries. J. Power Sources 2015, 273, 1089–1097. [Google Scholar] [CrossRef]
- Greco, A.; Cao, D.; Jiang, X.; Yang, H. A theoretical and computational study of lithium-ion battery thermal management for electric vehicles using heat pipes. J. Power Sources 2014, 257, 344–355. [Google Scholar] [CrossRef]
- Rao, Z.; Huo, Y.; Liu, X.; Zhang, G. Experimental investigation of battery thermal management system for electric vehicle based on paraffin/copper foam. J. Energy Inst. 2015, 88, 241–246. [Google Scholar] [CrossRef]
- Coleman, B.; Ostanek, J.; Heinzel, J. Reducing cell-to-cell spacing for large-format lithium ion battery modules with aluminum or PCM heat sinks under failure conditions. Appl. Energy 2016, 180, 14–26. [Google Scholar] [CrossRef]
- Rao, Z.; Wang, S. A review of power battery thermal energy management. Renew. Sustain. Energy Rev. 2011, 15, 4554–4571. [Google Scholar] [CrossRef]
- Panchal, S.; Khasow, R.; Dincer, I.; Agelin-Chaab, M.; Fraser, R.; Fowler, M. Thermal design and simulation of mini-channel cold plate for water cooled large sized prismatic lithium-ion battery. Appl. Therm. Eng. 2017, 122, 80–90. [Google Scholar] [CrossRef]
- Shan, S.; Li, L.; Xu, Q.; Ling, L.; Xie, Y.; Wang, H.; Zheng, K.; Zhang, L.; Bei, S. Numerical investigation of a compact and lightweight thermal management system with axially mounted cooling tubes for cylindrical lithium-ion battery module. Energy 2023, 274, 127410. [Google Scholar] [CrossRef]
- Zhang, T.; Gao, C.; Gao, Q.; Wang, G.; Liu, M.; Guo, Y.; Xiao, C.; Yan, Y. Status and development of electric vehicle integrated thermal management from BTM to HVAC. Appl. Therm. Eng. 2015, 88, 398–409. [Google Scholar] [CrossRef]
- Xie, J.; Wang, Y.; He, S.; Zhang, G.; Liu, X.; Yang, X. A simple cooling structure with precisely-tailored liquid cooling plate for thermal management of large battery module. Appl. Therm. Eng. 2022, 212, 118575. [Google Scholar] [CrossRef]
- Huang, Y.; Wang, S.; Lu, Y.; Huang, R.; Yu, X. Study on a liquid cooled battery thermal management system pertaining to the transient regime. Appl. Therm. Eng. 2020, 180, 115793. [Google Scholar] [CrossRef]
- Zhao, C.; Sousa, A.C.; Jiang, F. Minimization of thermal non-uniformity in lithium-ion battery pack cooled by channeled liquid flow. Int. J. Heat Mass Transf. 2019, 129, 660–670. [Google Scholar] [CrossRef]
- Zhao, C.; Cao, W.; Dong, T.; Jiang, F. Thermal behavior study of discharging/charging cylindrical lithium-ion battery module cooled by channeled liquid flow. Int. J. Heat Mass Transf. 2018, 120, 751–762. [Google Scholar] [CrossRef]
- Xie, L.; Huang, Y.; Lai, H. Coupled prediction model of liquid-cooling based thermal management system for cylindrical lithium-ion module. Appl. Therm. Eng. 2020, 178, 115599. [Google Scholar] [CrossRef]
- Zhou, H.; Zhou, F.; Zhang, Q.; Wang, Q.; Song, Z. Thermal management of cylindrical lithium-ion battery based on a liquid cooling method with half-helical duct. Appl. Therm. Eng. 2019, 162, 114257. [Google Scholar] [CrossRef]
- Sheng, L.; Zhang, H.; Su, L.; Zhang, Z.; Zhang, H.; Li, K.; Fang, Y.; Ye, W. Effect analysis on thermal profile management of a cylindrical lithium-ion battery utilizing a cellular liquid cooling jacket. Energy 2021, 220, 119725. [Google Scholar] [CrossRef]
- Zhuang, Y.; Chen, T.; Chen, J.; Li, J.; Guan, M.; Chen, Y. Thermal uniformity performance of a hybrid battery thermal management system using phase change material and cooling plates arrayed in the manner of honeycomb. Therm. Sci. Eng. Prog. 2021, 26, 101094. [Google Scholar] [CrossRef]
- Liang, G.; Li, J.; He, J.; Tian, J.; Chen, X.; Chen, L. Numerical investigation on a unitization-based thermal management for cylindrical lithium-ion batteries. Energy Rep. 2022, 8, 4608–4621. [Google Scholar] [CrossRef]
- Pakrouh, R.; Hosseini, M.; Bahrampoury, R.; Ranjbar, A.; Borhani, S. Cylindrical battery thermal management based on microencapsulated phase change slurry. J. Energy Storage 2021, 40, 102602. [Google Scholar] [CrossRef]
- Wu, W.; Wang, S.; Wu, W.; Chen, K.; Hong, S.; Lai, Y. A critical review of battery thermal performance and liquid based battery thermal management. Energy Convers. Manag. 2019, 182, 262–281. [Google Scholar] [CrossRef]
- Qin, J.; Pan, H.; Rahman, M.; Tian, X.; Zhu, Z. Introducing compressibility with SIMPLE algorithm. Math. Comput. Simul. 2021, 180, 328–353. [Google Scholar] [CrossRef]
- Min, J.K.; Lee, C.-H. Numerical study on the thermal management system of a molten sodium-sulfur battery module. J. Power Sources 2012, 210, 101–109. [Google Scholar] [CrossRef]
- An, Z.; Chen, X.; Zhao, L.; Gao, Z. Numerical investigation on integrated thermal management for a lithium-ion battery module with a composite phase change material and liquid cooling. Appl. Therm. Eng. 2019, 163, 114345. [Google Scholar] [CrossRef]
- Saw, L.; Ye, Y.; Tay, A. Electrochemical–thermal analysis of 18650 Lithium Iron Phosphate cell. Energy Convers. Manag. 2013, 75, 162–174. [Google Scholar] [CrossRef]
- Chen, S.; Wan, C.; Wang, Y. Thermal analysis of lithium-ion batteries. J. Power Sources 2005, 140, 111–124. [Google Scholar] [CrossRef]
- Bernardi, D.; Pawlikowski, E.; Newman, J. A General Energy Balance for Battery Systems. J. Electrochem. Soc. 1985, 132, 5–12. [Google Scholar] [CrossRef]
- Basu, S.; Patil, R.S.; Ramachandran, S.; Hariharan, K.S.; Kolake, S.M.; Song, T.; Oh, D.; Yeo, T.; Doo, S. Non-isothermal electrochemical model for lithium-ion cells with composite cathodes. J. Power Sources 2015, 283, 132–150. [Google Scholar] [CrossRef]
- Williford, R.E.; Viswanathan, V.V.; Zhang, J.-G. Effects of entropy changes in anodes and cathodes on the thermal behavior of lithium ion batteries. J. Power Sources 2009, 189, 101–107. [Google Scholar] [CrossRef]
- Reynier, Y.F.; Yazami, R.; Fultz, B. Thermodynamics of Lithium Intercalation into Graphites and Disordered Carbons. J. Electrochem. Soc. 2004, 151, A422–A426. [Google Scholar] [CrossRef]
Figure 1.
Schematic and computational analysis area for each channel type: (a) Basic type, (b) Parallel type, (c) Counter flow type.
Figure 1.
Schematic and computational analysis area for each channel type: (a) Basic type, (b) Parallel type, (c) Counter flow type.


Figure 2.
Comparisons of temperatures between the reference and basic type with various coolant inlet velocities under 3C and 5C discharge rates. (a) maximum temperature within the module at a discharge rate of 3C; (b) temperature difference within the module at a discharge rate of 3C; (c) maximum temperature within the module at a discharge rate of 5C; (d) temperature difference within the module at a discharge rate of 5C.

Figure 3.
Comparisons of geometric differences between the reference and basic type.

Figure 4.
Comparisons of temperature distributions between basic, parallel, and counter flow types with 0.05 m/s coolant inlet velocity under 3C and 5C discharge rates.
Figure 4.
Comparisons of temperature distributions between basic, parallel, and counter flow types with 0.05 m/s coolant inlet velocity under 3C and 5C discharge rates.

Figure 5.
Comparisons of maximum temperatures and temperature differences in battery module between basic, parallel, and counter flow types with 0.05 m/s coolant inlet velocity under 3C and 5C discharge rates. (a) maximum temperature inside the module according to the cooling channel; (b) temperature difference inside the module according to the cooling channel.

Figure 6.
Comparisons of temperature distributions between basic, parallel, and counter flow types with various coolant inlet velocities under 3C and 5C discharge rates.
Figure 6.
Comparisons of temperature distributions between basic, parallel, and counter flow types with various coolant inlet velocities under 3C and 5C discharge rates.


Figure 7.
Comparisons of maximum temperatures and temperature differences in battery module between basic, parallel, and counter flow types with various coolant inlet velocities under 3C and 5C discharge rates. (a) maximum temperature inside the module according to a discharge rate of 3C; (b) temperature difference inside the module according to a discharge rate of 3C; (c) maximum temperature inside the module according to a discharge rate of 5C; (d) temperature difference inside the module according to a discharge rate of 5C.

Figure 8.
Comparisons of pressure drops between basic, parallel, and counter flow types with various coolant inlet velocities.
Figure 8.
Comparisons of pressure drops between basic, parallel, and counter flow types with various coolant inlet velocities.

Figure 9.
Comparisons of temperature limits and temperature limit differences in battery module between basic, parallel, and counter flow types with various coolant inlet velocities under 3C and 5C discharge rates. (a) According to the discharge rate of 3C and the coolant flow velocity (); (b) According to the discharge rate of 5C and the coolant flow velocity ().

Figure 10.
Schematic and computational analysis area for multi-counter flow.

Figure 11.
Comparisons of temperature distributions between basic and multi-counter flow types with various coolant inlet velocities under 3C and 5C discharge rates.
Figure 11.
Comparisons of temperature distributions between basic and multi-counter flow types with various coolant inlet velocities under 3C and 5C discharge rates.

Figure 12.
Comparisons of maximum temperatures and temperature differences in battery module between basic and multi-counter flow types with various coolant inlet velocities under 3C and 5C discharge rates. (a) According to the discharge rate of 3C and the coolant flow velocity (; (b) According to the discharge rate of 3C and the coolant flow velocity (); (c) According to the discharge rate of 5C and the coolant flow velocity (; (d) According to the discharge rate of 5C and the coolant flow velocity ().


Figure 13.
Comparisons of maximum temperatures and temperature differences in battery module between counter flow and multi-counter flow types with various coolant inlet velocities under 3C and 5C discharge rates. (a) According to the discharge rate of 3C and the coolant flow velocity (; (b) According to the discharge rate of 3C and the coolant flow velocity (); (c) According to the discharge rate of 5C and the coolant flow velocity (; (d) According to the discharge rate of 5C and the coolant flow velocity ().

Figure 14.
Comparisons of pressure drops between basic, counter flow, and multi-counter flow types with various coolant inlet velocities. (a) Comparison of pressure drop between basic type and multi-counter flow type; (b) Comparison of pressure drop between counter flow type and multi-counter flow type.

Figure 15.
Comparisons of maximum temperatures, temperature differences, and pressure drops in battery module between all cooling channel types with various coolant inlet velocities under 3C and 5C discharge rates.(a) Comparison of the maximum temperature in each cooling channel.; (b) Comparison of the temperature difference in each cooling channel.; (c) Comparison of the pressure drop in each cooling channel.


Table 1.
Geometric parameters for BTM simulations.
| Basic Type | Parallel Type | Counter Flow Type | Unit | |
|---|---|---|---|---|
| Battery diameter | 18 | 18 | 18 | mm |
| Battery height | 65 | 65 | 65 | mm |
| Cooling channel width | 3 | 3 | 3 | mm |
| Cooling channel height | 65 | 65 | 32.5 | mm |
| Heat transfer region | 50.75 | 50.75 | 50.75 | Angle |
| Number of cells | 448 | 448 | 448 | EA. |
Table 2.
Boundary conditions for BTM simulations.
| Condition | Value | Unit | |
|---|---|---|---|
| Battery | Convective heat transfer coefficient | 5 | |
| Ambient air temperature | 25 | °C | |
| Coolant | Inlet velocity | 0.05, 0.1, 0.2, 0.3, 0.4 | m/s |
| Inlet temperature | 25 | °C | |
| Outlet pressure | Ambient pressure | Pa | |
| Walls | All walls, except inlets and outlets | Insulated | - |
| Initialization | Initial temperature | 25 | °C |
Table 3.
Physical properties for BTM simulations.
| Material | Density | Heat Capacity | Thermal Conductivity | Viscosity |
|---|---|---|---|---|
| Battery cells [45] | 2720 | 300 | 3 | - |
| Coolant water | 998.2 | 4182 | 0.6 | 0.001003 |
Table 4.
Grid independence verification results.
| Grid Size | 1.6 mm | 1.4 mm | 1.2 mm | 1.0 mm |
|---|---|---|---|---|
| Theoretical coolant outlet temperature (°C) | 38.6 | 38.6 | 38.6 | 38.6 |
| Simulation coolant outlet temperature (°C) | 36.62 | 36.64 | 36.73 | 36.74 |
| Error rate | 5.13% | 5.1% | 4.84% | 4.82% |
Table 5.
Pressure drops and differences between the cooling channels with various coolant inlet velocities.
Table 5.
Pressure drops and differences between the cooling channels with various coolant inlet velocities.
| Inlet Velocity [m/s] | [Pa] | [Pa] | [Pa] | [Pa] | [Pa] |
|---|---|---|---|---|---|
| 0.1 | 723.29 | 9.14 | 714.15 | 747.02 | 23.72 |
| 0.2 | 1686.92 | 19.03 | 1667.89 | 1737.25 | 50.32 |
| 0.3 | 2856.43 | 29.50 | 2826.92 | 2937.94 | 81.51 |
| 0.4 | 4217.28 | 40.48 | 4331.96 | 4331.96 | 114.67 |
Table 6.
Confirmation of temperature requirements for BTM of three cooling channels under 3C discharge rate.
Table 6.
Confirmation of temperature requirements for BTM of three cooling channels under 3C discharge rate.
| Inlet Velocity [m/s] | Basic Type | Parallel Type | Counter Flow Type | |||
|---|---|---|---|---|---|---|
| 0.1 | o | x | o | x | o | o |
| 0.2 | o | o | o | o | o | o |
| 0.3 | o | o | o | o | o | o |
| 0.4 | o | o | o | o | o | o |
Table 7.
Confirmation of temperature requirements for BTM of three cooling channels under 5C discharge rate.
Table 7.
Confirmation of temperature requirements for BTM of three cooling channels under 5C discharge rate.
| Inlet Velocity [m/s] | Basic Type | Parallel Type | Counter Flow Type | |||
|---|---|---|---|---|---|---|
| 0.1 | x | x | x | x | x | x |
| 0.2 | x | x | x | x | x | o |
| 0.3 | x | x | x | x | x | o |
| 0.4 | x | x | x | x | x | o |
Table 8.
Pressure drops and differences between basic, counter flow, and multi-counter flow types with various coolant inlet velocities.
Table 8.
Pressure drops and differences between basic, counter flow, and multi-counter flow types with various coolant inlet velocities.
| Inlet Velocity [m/s] | [Pa] | [Pa] | [Pa] | [Pa] | [Pa] |
|---|---|---|---|---|---|
| 0.1 | 723.29 | 9.42 | 713.87 | 747.02 | 737.6 |
| 0.2 | 1686.92 | 19.64 | 1667.28 | 1737.25 | 1717.61 |
| 0.3 | 2856.43 | 30.47 | 2825.96 | 2937.94 | 2907.47 |
| 0.4 | 4217.28 | 41.80 | 4175.48 | 4331.96 | 4290.16 |
Table 9.
Confirmation of temperature requirements for BTM of all cooling channels under 3C discharge rate.
Table 9.
Confirmation of temperature requirements for BTM of all cooling channels under 3C discharge rate.
| Inlet Velocity [m/s] | Basic Type | Parallel Type | Counter Flow Type | Multi-Counter Flow Type | ||||
|---|---|---|---|---|---|---|---|---|
| 0.1 | o | x | o | x | o | o | o | o |
| 0.2 | o | o | o | o | o | o | o | o |
| 0.3 | o | o | o | o | o | o | o | o |
| 0.4 | o | o | o | o | o | o | o | o |
Table 10.
Confirmation of temperature requirements for BTM of all cooling channels under 5C discharge rate.
Table 10.
Confirmation of temperature requirements for BTM of all cooling channels under 5C discharge rate.
| Inlet Velocity [m/s] | Basic Type | Parallel Type | Counter Flow Type | Multi-Counter Flow Type | ||||
|---|---|---|---|---|---|---|---|---|
| 0.1 | x | x | x | x | x | x | x | x |
| 0.2 | x | x | x | x | x | o | x | x |
| 0.3 | x | x | x | x | x | o | x | o |
| 0.4 | x | x | x | x | x | o | x | o |
Disclaimer/Publisher’s Note: The statements, opinions and data contained in all publications are solely those of the individual author(s) and contributor(s) and not of MDPI and/or the editor(s). MDPI and/or the editor(s) disclaim responsibility for any injury to people or property resulting from any ideas, methods, instructions or products referred to in the content. |
© 2023 by the authors. Licensee MDPI, Basel, Switzerland. This article is an open access article distributed under the terms and conditions of the Creative Commons Attribution (CC BY) license (https://creativecommons.org/licenses/by/4.0/).
Share and Cite
MDPI and ACS Style
Jeon, H.; Hong, S.; Yun, J.; Han, J. Cooling Strategy Optimization of Cylindrical Lithium-Ion Battery Pack via Multi-Counter Cooling Channels. Energies 2023, 16, 7860. https://doi.org/10.3390/en16237860
AMA Style
Jeon H, Hong S, Yun J, Han J. Cooling Strategy Optimization of Cylindrical Lithium-Ion Battery Pack via Multi-Counter Cooling Channels. Energies. 2023; 16(23):7860. https://doi.org/10.3390/en16237860
Chicago/Turabian StyleJeon, Hyeonchang, Seokmoo Hong, Jinwon Yun, and Jaeyoung Han. 2023. "Cooling Strategy Optimization of Cylindrical Lithium-Ion Battery Pack via Multi-Counter Cooling Channels" Energies 16, no. 23: 7860. https://doi.org/10.3390/en16237860
Note that from the first issue of 2016, this journal uses article numbers instead of page numbers. See further details here.