Abstract
Maintenance work orders are commonly used to document information about wind turbine operation and maintenance. This includes details about proactive and reactive wind turbine downtimes, such as preventative and corrective maintenance. However, the information contained in maintenance work orders is often unstructured and difficult to analyze, presenting challenges for decision-makers wishing to use it for optimizing operation and maintenance. To address this issue, this work compares three different approaches to calculating reliability key performance indicators from maintenance work orders. The first approach involves manual labeling of the maintenance work orders by domain experts, using the schema defined in an industrial guideline to assign the label accordingly. The second approach involves the development of a model that automatically labels the maintenance work orders using text classification methods. Through this method, we are able to achieve macro average and weighted average -scores of 0.75 and 0.85 respectively. The third technique uses an AI-assisted tagging tool to tag and structure the raw maintenance information, together with a novel rule-based approach for extracting relevant maintenance work orders for failure rate calculation. In our experiments, the AI-assisted tool leads to an 88% drop in tagging time in comparison to the other two approaches, while expert labeling and text classification are more accurate in KPI extraction. Overall, our findings make extracting maintenance information from maintenance work orders more efficient, enable the assessment of reliability key performance indicators, and therefore support the optimization of wind turbine operation and maintenance.
1. Introduction
Operation and Maintenance (O&M) represent around 25 percent of the overall costs in the life cycle of a Wind Turbine (WT). After commissioning, costs related to maintenance are often the only variable costs [1]. Ways to reduce those variable costs therefore need to be addressed. Costs of Operation and Maintenance (O&M) can be divided into two main categories: proactive maintenance and reactive maintenance. Proactive maintenance, also known as preventive maintenance, is scheduled in advance and is intended to prevent equipment failure. Reactive maintenance, also known as corrective maintenance, is conversely performed in response to unpredicted or observed deterioration of a system, such as when equipment fails and needs to be repaired to restore it to normal working condition.
One of the challenges related to Operation and Maintenance (O&M) costs of Wind Turbines (WTs) is the lack of standardization in the acquisition, communication, and documentation of maintenance information (e.g., in the form of Maintenance Work Orders (MWOs) or service reports). MWOs are often prepared by different service technicians and can vary in both the level of detail provided and the format used. This makes it difficult to perform reliability analysis and subsequently to effectively plan and schedule maintenance activities. In order to reduce Operation and Maintenance (O&M) costs, it is important to develop standardized methods for the acquisition, communication, and documentation of MWOs and to use this information in a large quantity of MWOs to better understand faults and failures and for optimization of O&M itself.
Wind Turbine (WT) MWOs are often unstructured and difficult to use for reliability analysis and decision making [2]. This research explores three separate methods for investigating and extracting reliability Key Performance Indicators (KPIs) from the large volume of MWOs created in the WT industry. Our goal is to enable efficient and effective use of this underutilized source of information through both human-in-the-loop procedures and computer-accelerated tools.
The first approach involves manual labeling of textual MWOs according to the technical guidelines State-Event-Cause-Key (in German “Zustand-Eregnis-Ursachen-Schlüssel”) (ZEUS) [3]. In the second approach, models are developed to automate the classification of MWOs according to the ZEUS guidelines. The third approach involves the usage of a tool to tag MWOs. Once the MWOs have been classified using these methods, reliability KPIs can be calculated for each. The results are then compared and assessed qualitatively and quantitatively to determine which approach is the most effective at generating reliable and useful KPIs.
The research questions of this work can be summarized as follows: (1) How can manual classification, machine-learning-based text classification, and AI-assisted tagging be employed for KPI prediction from maintenance work orders? (2) How do the approaches compare against each other in terms of KPI prediction performance and manual effort, and what are the individual strengths and weaknesses?
The main contributions of this work are as follows: (1) We give a comparison of KPI extraction from wind turbine maintenance work orders based on, first, the AI-assisted tagging tool “Nestor” [4], and second, automated text classification through logistic regression and naive Bayes. To the best of our knowledge, the present work is the first to give a hands-on comparison of text classification and AI-based tagging for MWO KPI extraction. (2) For the tagging method, we introduce a novel tagging approach for tagging and extracting MWOs relevant for failure rate calculation. Through this process, we are able to save almost 90% of the effort required when compared to completely manual document labeling. (3) Based on an evaluation of the different methods concerning classification performance and manual effort, we document the strengths and weaknesses of the individual methods and give recommendations for their future application. We identify common pitfalls with maintenance work order classification, namely class imbalance and lack of training data. Our results show that different oversampling techniques are able to mitigate such problems to different degrees.
This research paper is structured as follows:
- Section 2: This section explores state-of-the-art research on existing initiatives that assess reliability KPI in Wind Turbine (WT) O&M. This includes a review of tools for tagging (e.g., textual maintenance data), as well as research on existing KPIs in WT and other industries.
- Section 3: This section outlines the methodology of the three different approaches for structuring the MWOs of WTs to extract reliability KPIs. The KPI calculation is outlined here. We demonstrate how they compare against each other.
- Section 7: This section concludes this research work and highlights future areas of research based on this work.
2. State of Research on Knowledge Discovery in Maintenance Work Orders
In this section, an overview of the state of research is given. First, relevant initiatives that have collected reliability KPIs of WTs are presented. However, those KPIs are not extracted from MWO but are stated as reference for the discussion of the results in Section 6. Second, research on knowledge discovery from MWOs is outlined. Other methods and approaches from different domains are listed. Third, existing results in the literature are shown with regards to KPIs based on MWOs of several types of machinery and WTs.
2.1. Relevant Initiatives and Their Reliability KPI for Wind Turbines
Much research is available for WT reliability assessment. Pfaffel et al. [5] compared different initiatives and collected O&M information to assess reliability KPIs. A review of data related to reliability, availability, and maintenance for the identification of trends in offshore WTs can be seen in Cevasco et al. [6]. Two other sources are briefly highlighted in this subsection, namely the Scientific measurement and evaluation program (in German “Wissenschaftliches Mess- und Evaluierungsprogramm”) (WMEP) [7] and Carroll et al. [8], where KPIs such as the failure rate are publicized.
2.1.1. WMEP
The WMEP program carried out by Fraunhofer IWES investigated maintenance data reported by approximately 1500 WTs. These included failure and operational performance details and served as a comprehensive collection of reliability data, with more than 60,000 reports on maintenance and repair measures. These reports also contain technical details and information about O&M costs. For these WTs, the program yielded a failure rate of 2.60 1/a [7].
2.1.2. Strathclyde
The University of Strathclyde researched data collected from WTs and provided failure rates and other KPIs. They analyzed and categorized each failure as a major repair, a minor repair, or a major replacement. For these WTs, Carroll et al. [8] reported a failure rate of approximately 8.27 1/a.
2.2. Knowledge Discovery Using MWOs
Different procedures and methods exist to extract knowledge from textual descriptions of MWOs. The most basic extract the knowledge through manual labeling and analysis. Text mining techniques like classification and clustering can also be employed to extract failure data from work orders [9]. Kazi et al. [9] propose a methodology for extracting failure data from MWOs based on downtime data and develop a classifier that associates a downtime event with one of two classes: nonfailure or failure. Machine Learning (ML) models are trained through supervised learning with large datasets. Processing and learning from the raw data directly does not guarantee that the correct patterns or trends will be captured or learned by the models, so training data must be labeled. Training data is tagged with target attributes that relate to the overall goal of the model as well as the intrinsic nature of the data entries to allow the ML agent to quickly and accurately converge on desirable trends useful for decision making [10]. This tagging process is performed either manually or through the use of tools. Using technical language processing techniques [4], relevant information can be extracted, such as the specific equipment or component mentioned in the MWOs, the nature of the maintenance task being performed, and any notes or instructions related to the work. Automating the maintenance process, tracking maintenance history, and performing predictive maintenance can then be achieved with this information [4].
2.3. KPI Using Knowledge Discovery
Monitoring and extracting KPIs is important for enterprises and industries to provide insight into their maintenance processes. Intuitively, MWOs contain much KPI-related information, either numeric or text-based, that can be extracted through the proper tools and procedures. Some of the MWO-based reliability KPIs are machine per time between failure, machine by problem action per time between failure, and so on [11]. Traditionally, the analysis of this information was done manually, requiring many man-hours and intimate expert knowledge of both the system and the domain. More recently, this task has been accelerated through the use of computer-aided tools and AI technologies that can automatically extract, process, and relate this information to user-selected KPIs. These more recent tools and techniques provide unique opportunities in the realms of maintenance and reliability, but are far from perfect. They face a multitude of challenges given the imperfect nature of real-world data collection. Text entries in the MWOs are often prone to misspellings, unique abbreviations, shorthand, and so on [12]. Mukherjee and Chakraborty present an unstructured text analysis method by developing diagnostic fault trees from historic maintenance logs of a power plant [13]. Navinchandran [12] also present a systematic workflow for discovering the right KPIs from MWOs to help perform sensitivity-type analyses to determine the significance and influence of identified concepts, which can then be interpreted within the facility context. Lutz et al. present a digitalization workflow in the wind energy domain, to extract and structure maintenance data as a basis for reliability KPI calculation [2]. Frank et al. [14] present a methodology that uses KPIs and key risk indicators to assess the safety and security of offshore wind farms.
3. Methods
We implement three different approaches to extracting reliability KPIs from MWOs. We then compare the resulting KPIs. The approaches and their comparison are visualized in Figure 1. The first approach is expert labeling. It is seen in the first row indicated by the boxes 1, 2, and 3. The steps of the expert labeling approach are as follows: The raw MWOs are manually labeled according to the ZEUS technical guidelines by domain experts (box 1 in Figure 1). The technical guidelines are more elaborately described in Section 3.1.1. Subsequently, relevant KPIs are defined and the defined KPIs are assessed (box 2 and box 3, respectively, in Figure 1).
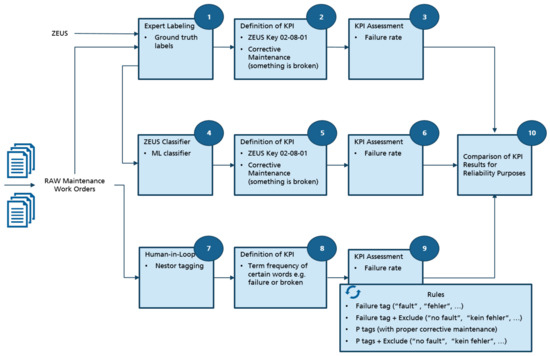
Figure 1.
Visualization of our methodology. We compare three different approaches: (1) expert labeling (first row), (2) machine-learning-based classification (second row), and (3) human-in-the-loop tagging (third row).
The second approach, ML-based text classification, is shown in the second row and is indicated by the boxes 4, 5, and 6. Instead of manually labeling MWOs according to a technical guideline, a classifier is trained that automatically predicts the corresponding label. This is indicated in box 4 in Figure 1. Like the expert labeling method, KPIs are defined and assessed (box 5 and box 6, respectively, in Figure 1).
The boxes 7, 8, and 9 are related to the third approach, human-in-the-loop tagging. The tool used to tag the raw MWOs is described in detail in Section 3.3. The KPI definition and assessment for this approach are indicated by box 8 and 9, respectively. Box 10 indicates a comparison of KPI results from the three different methods.
3.1. Expert Labeling
Manual labeling refers to the process of domain experts familiar with usage of the ZEUS technical guidelines labeling MWOs. Each MWO is manually assigned to a label according to the ZEUS technical guidelines by the experts, based on the information contained in the text descriptions in the MWOs. These tagged samples are referred to as ground truth labels. We further describe the expert labeling approach in the next section, where the ZEUS technical guidelines are outlined.
3.1.1. Technical Guidelines: ZEUS
Each state of the WT can be defined in a uniform fashion by using ZEUS [3]. Within ZEUS, several blocks are defined. Each block asks a question about the state of the turbine or component. By answering the question, an identifier is given. The set of all identifiers describe the state of the WT and the considered element in a uniform way. In this paper, only the ZEUS block 02-08 is used. It raises the question: “Which maintenance type is active or will be necessary to eliminate a deviation from the target condition?” The answers and the identifiers, namely the ZEUS code, can be seen in Table 1.

Table 1.
Overview of the ZEUS classification system [3]. Codes, levels, and names are given for ZEUS block 02-08, which was considered for MWO classification in this work.
3.1.2. Definition of KPIs
Although there are five classes in the third level of ZEUS block 02-08, only the MWOs that belong to the class 02-08-01 are considered for failure rate KPI calculation as this class indicates corrective maintenance activities that aim at fixing defects in a WT equipment in contrast to, for example, preventive or predictive maintenance measures.
3.1.3. KPIs Assessment
The failure rate calculation involves a series of steps. As the first step, Mean Time Between Failure (MTBF) is calculated for each WT (cf. Equation (1)). We assume that the maintenance event rate for the corrective maintenance ZEUS class can be considered as the failure rate of the WT. Hence, we only consider corrective maintenance events as failures for MTBF calculation, which in turn are determined from the MWOs corresponding to the WT. In the next step, the maintenance event rate is obtained by calculating the inverse of the MTBF values as given in Equation (2). We report the average failure rate over all WTs in our data. Intuitively, this number gives us the average number of corrective maintenance activities performed per year per wind facility.
where,
Table 2 contains a number of fictitious example MWOs. The failure rate for WT1 in this example can be computed by, first, extracting the four MWOs with ZEUS Code 02-08-01 (corrective maintenance). The time to the first failure is the time difference between the first corrective maintenance and the first day of operation of WT1. In this example, we assume days. The other time deltas are the number of days between each subsequent corrective maintenance, which can be inferred from the MWO dates. Hence, we obtain
Table 2.
Example maintenance work orders. We compute failure rates for each WT based on the corresponding maintenance work orders for ZEUS code 02-08-02 (corrective maintenance). Note that ZEUS codes are not part of the original MWOs but must be derived (e.g., through manual expert labeling or automated text classification).
The failure rate of WT1 is thus , that is, approximately eight failures per year. We may note that, in theory, through the same process as exemplified above, we may compute failure rates for events other than corrective maintenance, such as preventive maintenance, simply by considering MWOs from the corresponding ZEUS class. Similarly, instead of considering a wind turbine as the item in Equations (1) and (2), we may calculate the KPIs for wind turbine components (e.g., through MWO classification according to the RDS-PP standard [15]).
3.2. Automated Classification According to Technical Guidelines
In this section, the second approach is outlined. In this approach, ML-based text classifiers are used to automatically label and classify the MWOs into their respective ZEUS classes. We use two supervised MLs techniques, Naive Bayes (NB) [16] and Logistic Regression (LR) [17], to learn from the training data and classify the test set data into their respective ZEUS classes based on the knowledge gained after training. The dataset used for training the ML model is imbalanced because the majority (>90%) of the total datapoints belong to just the 02-08-01 and 02-08-02 classes. To mitigate this problem, the data is oversampled using two techniques, namely the Synthetic Minority Oversampling
Technique (SMOTE) [18] and Random Oversampling (RO) [19]. In combination, this results in four ML models: NB + SMOTE, NB + RO, LR + SMOTE, and LR + RO. Ground truth data labeled by the domain experts is required for training the ML model. However, because there is no human intervention in the training and classification, the classification of additional, unlabeled data occurs automatically, saving significant manual tagging effort.
For the tagged data resulting from this method, the failure rate KPI is calculated. The calculation of the failure rate involves the same steps mentioned in the first approach (i.e., calculation of MTBF and maintenance event rates).
3.3. Human-in-the-Loop Tagging
In the third approach, an AI-assisted human-in-the-loop tagging tool called Nestor [4] is used for tagging the MWOs (documentation available at https://nestor.readthedocs.io/en/latest/how_to_guide/using_nestor.html (accessed on 20th October 2023)). Nestor reads the raw maintenance data from a CSV file. Through a user interface, users can manually tag and group similar terms. The efficiency of the tagging process is ensured by presenting only the most relevant terms, as computed through their respective Term Frequency–Inverse Document Frequency (TF–IDF) scores [20]. Furthermore, for each such term, similar terms are suggested automatically, which may thus be grouped together without much effort and tagged with a common “alias” term (e.g., “failure”, “fault”, and “error”, which together may be mapped to the alias “failure”).
Additionally to the above alias term tagging, Nestor offers users an option to assign one of the following entities to the tagged words—“Problem”, “Solution”, “Item”, “Ambiguous”, and “Irrelevant”. The named entity “Problem” (P) indicates some kind of fault or error in a piece of equipment. The entity “Solution” (S) is assigned to the word if it indicates some form of solution to the problem. A word can also indicate an item, and in that case, it is assigned the entity “Item” (I). The entity “Irrelevant” (X) is assigned to a word if it indicates a stop word or if it is not very significant. Finally, words that take different forms are assigned the entity “Ambiguous” (U), meaning their semantics depend on the context within the MWO (i.e., homonyms).
For human-in-the-loop tagging, the calculation of failure rates does not follow the same steps as in approaches 1 and 2 as Nestor does not follow the ZEUS guidelines for tagging the MWOs. Instead, based on the Nestor tags described above, we define a set of four rules that are used to extract those MWOs, which are considered for failure rate calculation (cf. step 9 in Figure 1). In the first rule, we ensure that only MWOs containing a “failure” tag are considered. There are chances that the MWO text description contains the failure tag, but the usage of this term indicates absence of a fault or a failure due to a negation (e.g., ”no failure detected”). As Nestor only considers the tagged word instead of the meaning of the text description, the second rule excludes such MWOs. Rule 1 and 2 only consider the topmost tag (i.e, the word ”fault” for KPI calculation). However, there are further tags in the ”Problem” entity that can be related to corrective maintenance (e.g., ”defective component replaced” or ”replacement of broken sensor”). Thus, the third rule is introduced to consider all relevant tags belonging to the P entity for failure rate calculation. Finally, in rule 4, similar to rule 2, descriptions which contain P entity tags but which indicate absence of an error are eliminated from the failure rate calculation (e.g., “no broken sensor found. WT back in operation”).
3.4. Comparison of Reliability KPIs
Finally, in the last step (step 10 in Figure 1), the failure rate KPI results from all three approaches are compared. Because expert labeling is manually carried out by wind industry domain experts, the KPIs resulting from the first approach are referred to as ground truth labels, and they are used for benchmarking purposes. The failure rate values resulting from the second and the third techniques are compared against the KPI results of the first method in order to assess the tagging quality. Furthermore, in each of the three approaches, the total time taken for tagging is recorded to compare the speed of tagging the MWO data.
4. Dataset Description
The dataset consists of MWOs from forty WTs belonging to a wind farm. The samples were collected between January 2016 and December 2020, spanning a time window of 4 years. A total of 3896 MWOs were collected from all 40 WTs. The data distribution of the MWOs into ZEUS classes is depicted in Figure 2. More than 90% of the data samples belong to the ZEUS classes 02-08-01 (corrective maintenance) and 02-08-02 (preventive maintenance). The remaining MWOs belong to the other level-three ZEUS classes. This constituted the raw data after preprocessing it for training and tagging.
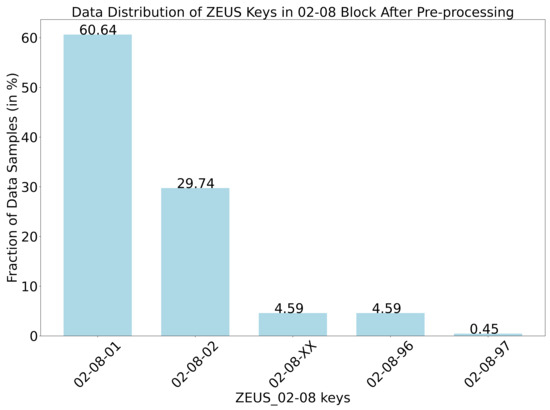
Figure 2.
Data distribution of ZEUS classes after MWO preprocessing. For classification, ZEUS level 3 is considered. Classes are distributed highly unevenly.
The preprocessing of texts in the MWOs consisted of the following steps [21,22]:
- Lower case conversion.
- Removal of white spaces.
- Removal of punctuation.
- Removal of numbers.
- Tokenization.
- Removal of unimportant words.
- Removal of stop words.
- Dropping of empty rows.
Figure 2 shows the data distribution after preprocessing. There is a slight decrease in the amount of data points belonging to the class 02-08-02, since empty reports were dropped as part of the preprocessing step. Note that the values are rounded to the second decimal. Therefore, the sum of the bars is greater than 100%. This, in turn, resulted in a slight percentage increase for the data points belonging to the classes 02-08-01, 02-08-XX, and 02-08-96, respectively.
5. Results
This section presents the failure rate KPI computation results of each approach and compares them against each other.
5.1. Expert Labeling
For the ground truth labels resulting from the first approach, MTBF is calculated for all five level-three classes of ZEUS block 02-08 by considering the difference between the start dates for subsequent MWOs. As the mean time between subsequent events is different for different maintenance types (e.g., corrective maintenance or preventive maintenance), the resulting MTBF values are different for each ZEUS class. Next, the maintenance event rate values are calculated for each class by the inverse of the MTBF values. As only the corrective maintenance tasks are associated with the failure, the corrective maintenance class (02-08-01) is considered for the calculation of the failure rate KPI. The failure rate for the 02-08-01 class is 8.85 1/a. It took 231 h in total for the experts to tag all the MWO samples. Along with ZEUS, which identifies the state of the WT, the component described in the MWO has also been labeled within this time period according to a domain standard. Only the total tagging time is assessed by the authors; within this time, the tagging with ZEUS has the biggest share.
5.2. Automated Classification according to Technical Guidelines
The failure rate KPI for the second approach is calculated as indicated in step 5 of Figure 1. Multiple ML models were developed as part of this step. The macro average precision, recall, and -score (i.e., average over all classes [23]) and weighted averages (i.e., averages weighted by the respective relative class frequencies) for all classification and oversampling method combinations are given in Table 3. The best performance values are highlighted in bold. For the calculation of these values, we removed the ZEUS class 02-08-97, since in three out of the four cases considered our classifiers did not predict any test sample to belong to this class. Hence, although oversampling methods were used in the training, calculation of precision and scores for this class, as well as the calculation of averages over all classes, was not possible.
Table 3.
Comparison of ZEUS classifier performance. We depict macro average and weighted averages for precision, recall, and -score. Results are given for Logistic Regression (LR) and Naive Bayes (NB) classifiers. Training data were oversampled using either SMOTE [18] or RO [19].
We may note that we also conducted a first experiment using a transformer-architecture-based [24] large language model (LLM), namely DistilROBERTa [25], since LLMs constitute the current state-of-the-art in text classification. However, as expected, due to the small amount of training data, this model was merely able to achieve macro average -scores of 0.63 and a weighted average of 0.79 (i.e., lower scores than both of the more traditional text classification methods). We suspect that, in the long run, better performance in MWO classification can be achieved through LLMs. However, they require additional optimization for the application to technical language and more elaborate methods for handling minority classes with few samples, such as domain adaptation, transfer learning [26], and active learning [27].
For KPI calculation, the best performing model was considered, which is LR with RO used for oversampling the minority class data. Somewhat surprisingly, random oversampling mostly leads to better scores than the more elaborate SMOTE for both classification models. The detailed classification results of the LR + RO model, including performances for each class, are given in Table 4. Figure 3 depicts the confusion matrix for the LR + RO classifier. It shows that nearly 90% of the data samples belonging to the ZEUS class 02-08-01 and 85% of the data samples belonging to the ZEUS class 02-08-02 have been classified correctly. In contrast to this, scores are lower for the remaining classes, possibly since they are minority classes and constitute only 10% of the total sample, which means that less training data was available. We may note that, in general, except for ZEUS class 02-08-97, the scores are considerably higher than the expected values that would result from a random classification (i.e., each class being predicted either with uniform random probability or with probabilities proportional to the class distribution).
Table 4.
Detailed classification results of the best performing model LR + RO. Next to macro and weighted averages, we also give scores for each ZEUS class. ZEUS class 02-08-97 was removed since there were too few samples.
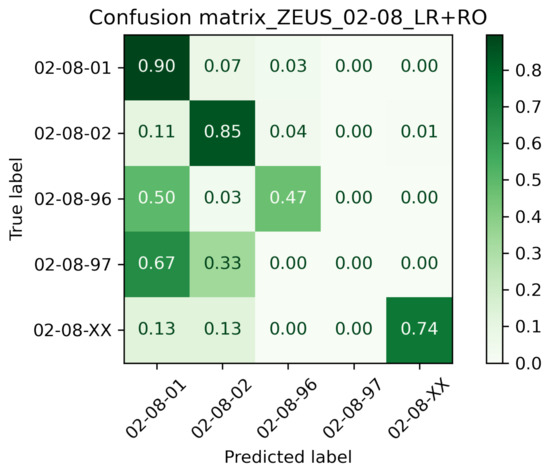
Figure 3.
Confusion matrix for the best performing model LR + RO. Classes with few samples pose a principal challenge in MWO classification.
The LR + RO model outperformed other ML models with an overall accuracy of 85%, and thus the tagged data resulting from this model are considered for KPI calculation. Following the ZEUS guidelines, the KPI calculation steps are the same as in the first approach (expert labeling). The event rate values were calculated for all ZEUS classes. As mentioned before, the maintenance event rate for the 02-08-01 class is considered as the failure rate, and the average value obtained over all WTs is 8.21 1/a. As the text classification method uses manually labeled MWOs from the domain experts for training and testing, the tagging time is still 231 h. However, labeling only needs to be conducted once, thus saving many hours across the remaining life cycle of the WTs.
5.3. Human-in-the-Loop Tagging
The failure rate calculation for the third method is based on a different approach since Nestor tagging does not follow the ZEUS guidelines. As four different rules are considered, the MTBF value may also be considered for each rule by itself. This results in four separate maintenance event rate values. Out of all the four rules, the fourth rule considers all the MWOs in the P entity and excludes descriptions in which the P entity tag is present but indicates the absence of a failure. Thus, we assume that Rule 4 is most robust. The failure rate computed from this rule is 6.89 1/a.
5.4. Comparison for Reliability KPI Calculation
As part of the final step 10 in Figure 1, the KPI results of the second and third approach are compared against the results of the first approach. Table 5 shows the results. The failure rate value for the first approach is 8.85 1/a, and this is considered to be the ground truth value as it is derived from the data that is tagged by the domain experts. For the second technique, the KPI results of the LR + RO model is considered as it is the best performing ML model. The failure rate value for the LR + RO model is 8.21 1/a. Since this value is close to the ground truth, we conclude that the second method yields reliable results. Considering the tagging time, the LR + RO model uses the data labeled by the experts in the first approach for training the classification models. Hence, the tagging time is the same for both (i.e., 231 h). For Nestor tagging, the fourth rule was considered for the calculation of the failure rate as it is the most robust of all introduced rules. The failure rate value obtained from this approach is 6.89 1/a. When comparing the KPI results of the first and the third approach, we observe that the results are less accurate than with the second approach. One possible reason for this is the different tagging and KPI calculation approach resulting from the Nestor tool. However, considering the tagging time of only 28 h for Nestor, the KPI results are still valuable to obtain a rough estimate with considerably less effort. The resulting 88% drop in manual labor hours provided a result within 22.5% of our ground truth value, despite the fact that the Nestor tool used does not directly align with the ZEUS criteria. From these results, we could expect that developing a human-in-the-loop tool like Nestor that is aligned with the ZEUS criteria could save thousands of man-hours while maintaining high levels of accuracy. The accuracy might benefit from further optimization of tagging procedures and extraction rules in future work.
Table 5.
Comparison of KPI results of the three approaches. Strathclyde results are added for additional comparison, as reported in Carroll et al. [8].
6. Discussion
From the results of Section 5, it is evident that in addition to expert labeling using the ZEUS approach, automatic classification through ML and Nestor tagging can also be applied to extract reliability KPIs from the WT MWOs. If we consider the quality of the KPI results in Table 5, it is evident that the second approach results are very close to the original results and thus automatic classification using the LR + RO model is the most precise automated method for extracting reliability KPIs. Nestor tagging, on the other hand, is still reliable enough for a rougher KPI estimate, considering that it helps to save 88% of manual tagging effort. Table 5 also contains the failure rate results of an additional initiative, namely Strathclyde, which was mentioned in Section 2. Interestingly, the calculated failure rate from this initiative is very similar to that of our text classification method, while the expert labeling approach, which served as our ground truth, leads to a slightly higher value. The reason for this may lie either in a similar accuracy of the method or in the difference of the dataset.
Based on our overall results, we are able to derive the following recommendations for KPI extraction from MWOs: To achieve the most accurate results, automated text classification should be used. In order to spare a considerable amount of working hours while achieving a coarser estimate of KPIs, AI-assisted tagging is the appropriate approach. Random oversampling can be used to improve MWO classification performance for less frequent classes.
7. Conclusions
In the present work, we exploited the benefits of supervised ML techniques to automatically classify MWO text descriptions into their respective ZEUS classes. We also investigated a human-in-the-loop Nestor tagging approach where single words were individually tagged and analyzed. Based on the ground truth derived from a manual expert labeling approach, we have compared the methods in terms of KPI calculation accuracy as well as tagging time. Our overall results indicate complementary strengths and weaknesses of the methods: Text classification leads to accurate KPI estimation, while tagging time for the creation of training data is very high. AI-assisted tagging through Nestor, while being slightly less accurate, leads to greatly reduced tagging times.
The used approaches also come with technical limitations. The used text classification methods do consider the frequency, but not the sequential order of tokens within each MWO. Furthermore, they are not able to distinguish between homonyms. A more elaborate method such as a large language model would improve upon this. Our first experiments in this field using DistilRoBERTa suffer from too few training data. However, we assume that LLMs and deep learning techniques bear great potential when further optimization for technical language and dealing with few training data is carried out (e.g., through transfer learning [26] or active learning [27]). We reserve further investigations within this area for future work. As a further direction, future research will explore the potential of using tools such as Nestor, and more elaborate ML methods to tag multiple words at once, improve tagging accuracy, and aid in diagnostic and predictive corrective action decision making.
Author Contributions
M.-A.L.: methodology, validation, writing; B.S.: methodology, validation, writing; R.S.: software, writing—review and editing; M.S.: software, writing—review and editing; A.D.: software, writing—review and editing; S.F.: writing—review and editing; J.M.A.: methodology, validation, writing. All authors have read and agreed to the published version of the manuscript.
Funding
This research is to a large part carried out within the research project “Digitalization of Maintenance Information” (DigMa) funded by the German Federal Ministry of Economic Affairs and Climate Action (BMWK), grant number 03EE2016A.
Data Availability Statement
Data is not available due to privacy restrictions.
Acknowledgments
The authors thank the project partners for providing field data and for sharing their requirements and experience.
Conflicts of Interest
The authors declare no conflict of interest. The funders had no role in the design of the study; in the collection, analyses, or interpretation of data; in the writing of the manuscript; or in the decision to publish the results.
References
- International Renewable Energy Agency. Renewable Energy Cost Analysis—Wind Power: Volume 1: Power Sector; International Renewable Energy Agency: Abu Dhabi, United Arab Emirates, 2016. [Google Scholar]
- Lutz, M.A.; Walgern, J.; Beckh, K.; Schneider, J.; Faulstich, S.; Pfaffel, S. Digitalization Workflow for Automated Structuring and Standardization of Maintenance Information of Wind Turbines into Domain Standard as a Basis for Reliability KPI Calculation. J. Phys. Conf. Ser. 2022, 2257, 012004. [Google Scholar] [CrossRef]
- Fördergesellschaft Windenergie und andere Erneuerbare Energien. Technical Guidelines for Power Generating Units—State-Event-Cause Code for Power Generating Units (ZEUS); FGW e.V.-Fördergesellschaft Windenergie und andere Dezentrale Energien: Berlin, Germany, 2013. [Google Scholar]
- Brundage, M.P.; Sexton, T.; Hodkiewicz, M.; Dima, A.; Lukens, S. Technical language processing: Unlocking maintenance knowledge. Manuf. Lett. 2021, 27, 42–46. [Google Scholar] [CrossRef]
- Pfaffel, S.; Faulstich, S.; Rohrig, K. Performance and Reliability of Wind Turbines: A Review. Energies 2017, 10, 1904. [Google Scholar] [CrossRef]
- Cevasco, D.; Koukoura, S.; Kolios, A. Reliability, availability, maintainability data review for the identification of trends in offshore wind energy applications. Renew. Sustain. Energy Rev. 2021, 136, 110414. [Google Scholar] [CrossRef]
- Echavarria, E.; Hahn, B.; Van Bussel, G.; Tomiyama, T. Reliability of wind turbine technology through time. J. Sol. Energy Eng. 2008, 130, 031005. [Google Scholar] [CrossRef]
- Carroll, J.; McDonald, A.; McMillan, D. Failure rate, repair time and unscheduled O&M cost analysis of offshore wind turbines. Wind Energy 2016, 19, 1107–1119. [Google Scholar]
- Arif-Uz-Zaman, K.; Cholette, M.E.; Ma, L.; Karim, A. Extracting failure time data from industrial maintenance records using text mining. Adv. Eng. Inform. 2017, 33, 388–396. [Google Scholar] [CrossRef]
- Monarch, R.M. Human-in-the-Loop Machine Learning: Active Learning and Annotation for Human-Centered AI; Simon and Schuster: New York, NY, USA, 2021. [Google Scholar]
- Brundage, M.P.; Morris, K.; Sexton, T.; Moccozet, S.; Hoffman, M. Developing maintenance key performance indicators from maintenance work order data. In Proceedings of the International Manufacturing Science and Engineering Conference, Pittsburgh, PA, USA, 9–15 November 2018; American Society of Mechanical Engineers: New York, NY, USA, 2018; Volume 51371, p. V003T02A027. [Google Scholar]
- Navinchandran, M.; Sharp, M.E.; Brundage, M.P.; Sexton, T.B. Discovering critical KPI factors from natural language in maintenance work orders. J. Intell. Manuf. 2021, 33, 1859–1877. [Google Scholar] [CrossRef]
- Mukherjee, S.; Chakraborty, A. Automated fault tree generation: Bridging reliability with text mining. In Proceedings of the 2007 Annual Reliability and Maintainability Symposium, Orlando, FL, USA, 22–25 January 2007; pp. 83–88. [Google Scholar]
- Torres, F.S.; Kulev, N.; Skobiej, B.; Meyer, M.; Eichhorn, O.; Schäfer-Frey, J. Indicator-based safety and security assessment of offshore wind farms. In Proceedings of the 2020 Resilience Week (RWS), Salt Lake City, UT, USA, 19–23 October 2020; pp. 26–33. [Google Scholar]
- VGB PowerTech, e.V. Reference Designation System for Power Plants®—Application Guideline; Part 32: Wind Power Plants; VGB PowerTech e.V.: Essen, Germany, 2014. [Google Scholar]
- Rish, I. An empirical study of the naive Bayes classifier. In Proceedings of the IJCAI 2001 Workshop on Empirical Methods in Artificial Intelligence, Seattle, WA, USA, 4–10 August 2001; Volume 3, pp. 41–46. [Google Scholar]
- Hosmer, D.W., Jr.; Lemeshow, S.; Sturdivant, R.X. Applied Logistic Regression; John Wiley & Sons: Hoboken, NJ, USA, 2013; Volume 398. [Google Scholar]
- Chawla, N.V.; Bowyer, K.W.; Hall, L.O.; Kegelmeyer, W.P. SMOTE: Synthetic Minority over-Sampling Technique. J. Artif. Int. Res. 2002, 16, 321–357. [Google Scholar] [CrossRef]
- He, H.; Garcia, E.A.; Li, S. Learning from imbalanced data. IEEE Trans. Knowl. Data Eng. 2009, 21, 1263–1284. [Google Scholar]
- Robertson, S. Understanding Inverse Document Frequency: On Theoretical Arguments for IDF. J. Doc. 2004, 60, 503–520. [Google Scholar] [CrossRef]
- Hotho, A.; Nürnberger, A.; Paaß, G. A brief survey of text mining. J. Lang. Technol. Comput. Linguist. 2005, 20, 19–62. [Google Scholar] [CrossRef]
- Denny, M.J.; Spirling, A. Text preprocessing for unsupervised learning: Why it matters, when it misleads, and what to do about it. Political Anal. 2018, 26, 168–189. [Google Scholar] [CrossRef]
- Takahashi, K.; Yamamoto, K.; Kuchiba, A.; Koyama, T. Confidence interval for micro-averaged F1 and macro-averaged F1 scores. Appl. Intell. 2022, 52, 4961–4972. [Google Scholar] [CrossRef] [PubMed]
- Vaswani, A.; Shazeer, N.; Parmar, N.; Uszkoreit, J.; Jones, L.; Gomez, A.N.; Kaiser, Ł.; Polosukhin, I. Attention is All you Need. In Advances in Neural Information Processing Systems 30; Guyon, I., Luxburg, U.V., Bengio, S., Wallach, H., Fergus, R., Vishwanathan, S., Garnett, R., Eds.; Curran Associates, Inc.: Red Hook, NY, USA, 2017; pp. 5998–6008. [Google Scholar]
- Liu, Y.; Ott, M.; Goyal, N.; Du, J.; Joshi, M.; Chen, D.; Levy, O.; Lewis, M.; Zettlemoyer, L.; Stoyanov, V. RoBERTa: A Robustly Optimized BERT Pretraining ApproacH. arXiv 2019, arXiv:1907.11692. [Google Scholar]
- Tan, C.; Sun, F.; Kong, T.; Zhang, W.; Yang, C.; Liu, C. A Survey on Deep Transfer Learning. In Proceedings of the Artificial Neural Networks and Machine Learning—ICANN, Rhodes, Greece, 4–7 October 2018; Kůrková, V., Manolopoulos, Y., Hammer, B., Iliadis, L., Maglogiannis, I., Eds.; Springer: Cham, Switzerland, 2018; pp. 270–279. [Google Scholar]
- Hazra, R.; Dutta, P.; Gupta, S.; Qaathir, M.A.; Dukkipati, A. Active2 Learning: Actively reducing redundancies in Active Learning methods for Sequence Tagging and Machine Translation. In Proceedings of the 2021 Conference of the North American Chapter of the Association for Computational Linguistics: Human Language Technologies, Virtual, 6–11 June 2021; Toutanova, K., Rumshisky, A., Zettlemoyer, L., Hakkani-Tur, D., Beltagy, I., Bethard, S., Cotterell, R., Chakraborty, T., Zhou, Y., Eds.; Association for Computational Linguistics: Toronto, ON, Canada, 2021; pp. 1982–1995. [Google Scholar] [CrossRef]
Disclaimer/Publisher’s Note: The statements, opinions and data contained in all publications are solely those of the individual author(s) and contributor(s) and not of MDPI and/or the editor(s). MDPI and/or the editor(s) disclaim responsibility for any injury to people or property resulting from any ideas, methods, instructions or products referred to in the content. |
© 2023 by the authors. Licensee MDPI, Basel, Switzerland. This article is an open access article distributed under the terms and conditions of the Creative Commons Attribution (CC BY) license (https://creativecommons.org/licenses/by/4.0/).