

Numerical Optimization of Triple-Phase Components in Order-Structured Cathode Catalyst Layer of a Proton Exchange Membrane Fuel Cell

Key Laboratory of Thermo-Fluid Science and Engineering of MOE, School of Energy and Power Engineering, Xi’an Jiaotong University, Xi’an 710049, China
*
Author to whom correspondence should be addressed.
Energies 2023, 16(4), 1623; https://doi.org/10.3390/en16041623
Submission received: 8 December 2022
/
Revised: 9 January 2023
/
Accepted: 14 January 2023
/
Published: 6 February 2023
(This article belongs to the Topic Thermal-Related Design, Application, and Optimization of Fuel Cells and Batteries)
Abstract
:Proton exchange membrane fuel cell (PEMFC) is generally regarded as a promising energy conversion device due to its low noise, high efficiency, low pollution, and quick startup. The design of the catalyst layer structure is crucial in boosting cell performance. The traditional catalyst layer has high oxygen transmission resistance, low utilization rate of Pt particles and high production cost. In this study, we offer a sub-model for an order-structured cathode catalyst layer coupled to a three-dimensional (3D) two-phase macroscopic PEMFC model. In the sub-model of the cathode catalyst layer, it is assumed that carbon nanowires are vertically arranged into the catalyst layer structure, platinum particles and ionomers adhere to the surface, and water films cover the cylindrical electrode. The impacts of triple-phase contents in the catalyst layer on cell performance are investigated and discussed in detail after the model has been validated using data from existing studies. The results show that when the triple-phase contents ratio of the order-structured cathode catalyst layer is the best, the overall cell power density of the cell can be maximized, that is, the Pt loading of 0.15 mg cm−2, carbon loading of 1.0 mg cm−2, and ionomer volume fraction of 0.2. The above study may provide guidance for constructing the PEMFC catalyst layer with high catalyst utilization and high performance.
1. Introduction
PEMFC is frequently regarded as a promising energy conversion technology due to its high conversion rate, low noise, low pollution, and quick start. However, the high cost of catalysts for fuel cells has significantly hampered the widespread commercialization of PEMFCs. The operating conditions of PEMFC are complex, so the choice of catalyst is not an easy task [1]. Pt is the most popular catalyst for PEMFCs, as we are all aware, but it is expensive and even accounts for half of the PEMFC manufacturing cost [2]. Consequently, it is a huge challenge to find the lowest Pt loading to satisfy commercialization requirements without compromising performance.
The membrane electrode assembly is made up of the proton exchange membrane, catalyst layer, and gas-diffusion layer, which significantly affects its performance [3]. The majority of electrochemical reactions take place near the triple-phase boundary, where electrolytes, reactants, and catalysts coexist. The transfer of species and charges in the catalyst layer (CL) is significantly influenced by the triple-phase boundary’s structure. It has been shown that the placement and arrangement of CL components can have a substantial impact on the triple-phase interface’s structure [4]. Therefore, optimizing catalyst composition and distribution is crucial for MEA performance.
Lee investigated the impacts of ionomer loading and arrangement experimentally, and the results revealed that ionomer distribution significantly affects fuel-cell performance. Shahgaldi et al. [5] designed the CL structure with gradient Pt loading distribution, and the results show that appropriate platinum load gradient changes are more conducive to gas transport and maintain stable cell performance. It can be seen from the literature [5] that the transport process of protons, reactants, water, and electrons in CL is required to enhance catalyst utilization and reduce cost loss, which poses a major challenge to the complexity of CL microstructure. Numerical simulations provide another approach. Andrei et al. [6] established a single-pore model that described oxygen transport in pores and polymer films. The analytical results of the single-pore model revealed that the restricting current density has a linear relationship with the thickness of the cathode CL, i.e., the smaller the cathode CL thickness, the lower the restricting current density. Wang et al. [7] investigated the mass transfer process by distinguishing the solid and pore components, reconstructing the CL’s microstructure, and using the method of numerical simulation. Chen et al. [8] used a quartet structure generation set to recreate the porous structure of CL and established a pore-scale model to predict the transfer properties of CL. The microstructure and void volume fraction of CL have quite a meaningful impact on the PEMFC’s performance stability [9]. Suzuki et al. [10] probed the composition of CL and found that ionomer content is a significant factor influencing CL void volume. To achieve a suitable porosity of CL, the triple-phase content of the catalyst must also be considered at the same time. Khajeh et al. [11] examined the sensitivity of six structural characteristics on the performance of fuel cells: Nafion volume fraction, Pt loading, carbon loading, degree of gas-diffusion layer penetration into CL, and porosity of gas-diffusion layer. It has been demonstrated that some basic parameters of CL structure, such as the thickness of CL, carbon loading, and ionomer volume fraction, have a significant influence on cell performance.
The Pt particles in the conventional catalyst layer are prone to agglomeration, resulting in a substantial overlapping of the electrochemical surface area [12]. Studies have shown that the utilization rate of the catalyst in the traditional catalyst layer is extremely low, even reaching 20% [13,14]. New varieties of microporous materials, such as metal and carbon nanowires, have garnered a lot of attention recently.
The concept of the order-structured cathode catalyst layer (OCCL) was, firstly, proposed by Middelman in 2002 [15]. By applying an electric field to provide driving force, the random morphology of the catalyst in the electrode can be transformed into a highly ordered structure perpendicular to the membrane plane. This ordered structure can reduce Pt loading while increasing the maximum power density. The vertically aligned carbon nanotube (VACNT) structure is an alternative to traditional carbon support, and by adopting such carbon nanotubes as carbon supports, the continuous pore structures and connected electron transport path can be formed in CL, which could help improve the CL structures and fuel-cell performance [16,17,18]. It has been experimentally demonstrated that the VACNT construction could enhance electrical conductivity, gas diffusion, and catalyst utilization of PEMFC [19,20]. Murata et al. [21] proved that the catalyst layers with VACNT structure could achieve great current densities at low Pt loadings owing to their unobstructed pore structures. Shin et al. [22] studied the properties of mass transport within the CL with ordered structures and found that the vertical arrangement of carbon supports could improve gas transport, resulting in increased catalyst utilization. Therefore, utilizing VACNTs to fabricate OCCL with oriented nanostructures is considered to be an efficacious solution to surmount the limitations of catalyst agglomeration [23]. Tian et al. [24] established an ordered catalyst layer with vertically arranged VACNTs supporting Pt particles. The results demonstrated that at a Pt concentration of 0.035 mg/cm2, the fuel cell performed at its best. Meng et al. [25] developed a bifunctional catalyst layer composed of VACNT and PtCo particles, which experimentally certificated that the bifunctional layer had a well-arranged transport path, which significantly promoted the transfer of reactant, electrons, protons, and water in CL. Deng et al. [26] fabricated a ZnO-based nanostructured CL with an ordered arrangement of Pt particles, which exhibited excellent performance. Sui et al. [27,28] introduced a carbon mold layer method to grow Pt particles on the electrode to solve the problem of lifeless surfaces for nucleation sites.
Existing macroscopic models can simulate the full fuel cell and forecast its performance [29], but they are only capable of simulating conventional catalyst layers. At present, the study on the effect of triple-phase content of CL is mostly using traditional CL. For example, He et al. [12] established a traditional CL model, considering the influence of geometric structure parameters of CCL on cell performance. However, compared with the traditional CL, the ordered catalyst layer has lower oxygen transmission resistance and more uniform oxygen distribution, which can achieve better cell performance. Most of the ordered catalyst layer PEMFC models currently in use are one-dimensional and little consideration is given to the effect of the accumulation of generated water on the effectiveness of oxygen transport. For example, Du et al. [30] established a one-dimensional model of OCCL, which showed a more uniform distribution of oxygen concentration and overpotential. Sanjeev et al. [31] used computer modeling to study the influence of spacing between the nanoelectrodes and catalyst layer thickness on cell performance. However, the triple-phase content of the catalyst layer has a significant impact on cell performance and production cost, so it is of great significance to explore the optimal triple-phase content of OCCL.
To more precisely assess the impact of triple-phase contents in the catalyst layer on cell power density and catalyst layer performance, we created an ordered sub-model of the cathode catalyst layer and connected it to the three-dimensional (3D) two-phase macroscopic model of PEMFC. The advantages of this model compared with other models are listed in Table 1. The purpose of this study is to build a macro model of proton exchange membrane fuel cells with coupled ordered catalyst layer submodel, study the influence of triple-phase content of catalyst layer on cell performance, and find the optimal triple-phase content under the combination of triple-phase content, so as to ensure the best cell performance and maximize the utilization of catalyst. Considering the effect of liquid water, the model provides a basis for further construction of more effective electrodes and useful suggestions for CL production.
2. Methods
In order to obtain the best triple-phase ratio of PEMFC, a macro-model of proton exchange membrane fuel cell coupled with a ordered catalyst layer model was established in this study, and the influence of liquid water accumulation was considered. The flowchart of this study is shown in Figure 1.
2.1. Computational Domain
According to Figure 2, the model primarily consists of the flow channels, bipolar plates (BPs), gas diffusion layers (GDLs), OCCL, traditional anode catalyst layer (ACL), and membrane. The carbon is made into wires and arranged vertically between the GDL and the film. Pt particles are evenly attached around the carbon nanotubes and covered with the ionomer. The liquid water encases the electrolyte. The electrolyte volume fraction “vn” in OCCL dictates the thickness of the ionomer membrane, whereas the water content “s” controls the thickness of the water film. The relationship between output current density and OCCL triple-phase content has been analyzed based on the existing model, and the optimal triple-phase content has been investigated. Table 2 lists the physicochemical characteristics and operational circumstances.
2.2. Numerical Model
2.2.1. Governing Equations
The present model is governed by conservation equations, including mass conservation, momentum conservation, species conservation, and charge conservation, where the expansions of the source terms are displayed in Table 3.
- Mass conservation equation
The mass conservation equations are calculated in GDLs, ACL, OCCL, and flow channels.
where Sm is the mass source term, which equals zero in GDLs and flow channels.
- Momentum conservation equation
The momentum conservation equations are calculated in GDLs, ACL, OCCL, and flow channels.
where Su is the mass source term, which equals zero in GDLs and flow channels.
- Energy conservation equation
The energy conservation equation is solved in the full computational domain.
where ST is the temperature source term, which is mainly composed of ohmic resistance heat, enthalpy change from water evaporation or condensation, and energy released by electrochemical reaction.
- Component conservation equation
The component conservation equation is solved in GDLs, ACL, OCCL, and flow channels.
where Si is the component source term, which is zero in flow channels and GDLs.
When accounting for porosity, the effective diffusion coefficient in OCCL could be computed by
where v stands for the OCCL’s porosity, vn represents ionomer volume fraction, vs represents carbon volume fraction, represents the mass percentage of Pt supported on the carbon black, represents Pt loading.
- Charge conservation equation
The transport of electrons in PEMFC satisfies the electron conservation equation, and the solution domains are the ACL, OCCL, GDLs, and BPs.
where Se is the electron generation rate, which is zero in BPs and GDLs.
The transport of protons in proton-conductive materials is described by the proton conservation equation, and the solution domains are ACL, OCCL, and membrane.
where is the proton generation rate, which is zero in the membrane.
- Liquid water transport equation
The amount of liquid water content is usually quantitatively described by the water saturation s, namely, the liquid water volume in the total space volume. The water saturation conservation equation is used to describe the transport of liquid water in flow channels.
where s is liquid water saturation, is water vapor condensation rate.
The transport of liquid water in GDLs, OCCL and ACL can be described as
2.2.2. Electrochemical Reaction Equation
The following condensed Butler–Volme equations are used to depict the electrochemical reaction in catalyst layers.
where and are the specific active surface area of anode and cathode; and represent the hydrogen and oxygen content in the OCCL triple-phase interface; and represent the overpotential of the electrode, which could be calculated by
where represents the open circuit voltage, which is related to temperature as
The specific active surface area of OCCL can be calculated by:
where represents the surface area of catalysts per mass, L is the thickness of the catalyst layer.
Reference exchange current density is related to temperature based on Parthasarathy’s experimental data:
2.2.3. Oxygen Transport in OCCL
The diffusion of oxygen in the pores can be described as:
where is oxygen concentration in pores, is diffusivity in pores.
As illustrated in Figure 3, the oxygen in the pores is dissolved in water film, and then transported to the triple-phase boundaries through water film and polymer film. The oxygen content dissolved in the outermost layer of the water film could be computed by Henry’s law:
where is oxygen content in pores, is Henry’s constant.
Oxygen concentration gradients of OCCL are caused by the resistance of oxygen as it passes through the water and polymers. The oxygen concentration at ionomer boundaries can be calculated by Equation (21). The oxygen content at the triple-phase interface could be determined by Equation (22).
2.2.4. Boundary Conditions
The stoichiometric number and the reference current density are utilized to determine the magnitude of the inlet mass flow. The mass flow of electrodes is expressed as:
where and are stoichiometric numbers of anode and cathode; stands for reference current density; and represent contents of hydrogen and oxygen at the inlet, which could be computed by
where and are relative humidity of inlet gas.
For proton potential, the external boundary conditions of the model are all set to zero. For electron potential, the end face of the anode bipolar plate is placed to zero, the end face of the cathode bipolar plate is placed to a positive value to indicate its operating voltage, and all other external boundaries are set to zero. Table 4 shows the parameter definitions and physical property correlations in the model and boundary conditions.
2.3. Model Validation
In this study, the grid independence test and experimental data verification of the model are conducted to examine the accuracy of the numerical model of the ordered PEMFC. This work establishes a three-dimensional model with an ordered catalyst layer structure. In comparison to the model in literature, the impacts of water accumulation and electrolyte film thickness on oxygen transfer are taken into consideration. In addition, the influence of triple-phase content of OCCL on the performance of PEMFC and the investigation of the optimal triple-phase content are the main objectives of this work. Figure 4 compares the current density at 0.6 V for five different mesh numbers (31,412, 47,075, 59,476, 66,572, 91,460). It has been noted that the difference between the present density with a grid number of 91,460 and 66,575 is only 0.7%. At this time, it is determined that the numerical calculation results are independent of the grid, so this paper adopts a grid of 66,576 cells for battery performance analysis. Figure 5 compares the cell polarization curves simulated in this chapter with the data of Du et al. [30] at the same operating conditions. It has been observed that the corresponding current densities are roughly consistent with the reference data, and the maximum error is less than 5.5%. Therefore, the numerical model of ordered PEMFC could be applied to investigate the optimal triple-phase content of OCCL.
3. Discussion
3.1. Effect of Carbon Loading in Cathode
The transfer of electrons, protons, and components in fuel cells was discovered to be significantly impacted by carbon loading. Assuming a constant Pt loading and an electrolyte film that just covers the Pt particles, Figure 6 shows the current densities and power densities of the cell at various voltages with five carbon loadings. It has been discovered that the cell performance gets better as the carbon loading goes from 0.5 mg cm−2 to 1.0 mg cm−2, but it gets dramatically worse when the carbon loading goes higher. When the carbon loading is increased from 0.5 mg cm−2 to 1.0 mg cm−2, cell performance increases for two key reasons: The electrolyte film is first assumed to merely wrap the Pt particles in this study, meaning that as the carbon loading increases, so would the electrolyte loading. As a result, the ohmic loss lowers and the proton conductivity rises. Additionally, as the carbon loading rises and the porosity declines, increasing the driving force for drainage. Therefore, water does not accumulate excessively, which facilitates the transport of oxygen. The fuel performance will decrease if the carbon loading is raised further because it causes an extremely tiny porosity, which increases the gas-transfer resistance and increases concentration loss.
The change in ohmic loss with four carbon loadings is seen in Figure 7. The decrease in ohmic loss with increased carbon loading may account for the improvement in cell performance between carbon loadings of 0.5 mg cm−2 and 1.0 mg cm−2. The impact of carbon loading on the distribution of liquid water in OCCL is seen in Figure 8. With the increase in carbon loading, the liquid water saturation decreases, which is because of the fact that more water is discharged due to increased water-driving force. In addition, generated water is also different under different carbon loadings.
From the research above, it can be inferred that when carbon loading increases, the power density first rises due to lower ohmic loss and later falls due to higher concentration loss. Consequently, under the combined effect of ohmic loss and concentration loss, there is an optimal carbon loading in OCCL, which makes the cell performance the best. The carbon loading of 1.0 mg cm−2 is compared to be the best for the aforementioned circumstances.
3.2. Effect of Pt Loading in Cathode
Increasing the total active reaction area of the cell is an effective measure to enhance the performance of the cell, one of which is to increase Pt loading. Therefore, finding an optimal Pt loading can thereby increase fuel-cell performance while decreasing manufacturing costs. The polarization and power density curves at five different Pt loadings, ranging from 0.06 mg cm−2 to 0.30 mg cm−2, are shown in Figure 9. The electrolyte film thickness and the carbon loading are assumed to be constants for the purposes of the simulation. It is clear that the fuel cell’s power density rises when Pt loading rises from 0.06 mg cm−2 to 0.12 mg cm−2, but with a further increase, the power density starts to drastically decline.
The change in ohmic loss with five Pt loadings is seen in Figure 10. It can be shown from Equation (17) that increased Pt loading causes the electrochemical surface area (ECSA) to rise. On the other hand, increased Pt loading reduces concentration and activation overpotentials. The above two points can explain why power density increases when the Pt loading increases from 0.06 mg cm−2 to 0.12 mg cm−2. However, the power density reduces with a further increase in Pt loading, which could be explained by the following two points: the continued increase in Pt loading will result in the accumulation of Pt particles and a decrease in ECSA. On the other hand, the ongoing rise in Pt loading will result in a decrease in electrolyte content, which will cause a decrease in proton conductivity and an increase in ohmic loss based on the assumption of constant electrolyte film thickness.
3.3. Effect of Ionomer Loading in Cathode
It was discovered that the ionomer loading had a significant impact on the transport of protons, membrane water, and oxygen. To increase proton conductivity, oxygen diffusivity, and membrane water diffusivity, it is crucial to select the optimal ionomer loading. As shown in Figure 11, with constant Pt loading and carbon loading, the impact of ionomer volume fraction is examined. As can be observed, the cell power density rises as the ionomer volume fraction rises from 0.05 to 0.15, but it declines as the volume fraction rises higher. When the thickness of the ionomer film is too thin to cover the Pt particles (with a volume fraction of 0.05), the utilization of Pt particles is lowered, which greatly affects the fuel-cell performance. Thickening ionomer film reasonably (the volume fraction increases from 0.05 to 0.15) is beneficial to proton conduction, giving rise to a low ohmic loss. At the same time, increased ionomers greatly reduce the resistance to proton and water transport. However, with a further increase in ionomer film thickness (the volume fraction increases from 0.15 to 0.20), oxygen transport resistance increases, and the porosity of OCCL is considerably diminished, resulting in impeding the delivery of reactive gases in OCCL.
The impact of ionomer volume fraction on ohmic losses is examined in Figure 12. As demonstrated, the ohmic loss decreases with increasing ionomer volume fraction due to increased proton transport paths. Figure 13 shows oxygen distributions in pores and in the ionomer at different ionomer volume fractions. Oxygen concentration in pores is decreased with the ionomer volume fraction, which indicates that the ionomer increases the the transmission resistance of oxygen in the pores. It is because an increase in ionomer volume fraction will reduce porosity, resulting in an increase in transmission resistance of oxygen. Oxygen distributions in ionomers first enhance and then reduce with increasing ionomer volume fractions, which is consistent with the effect of ionomer loading on cell performance. From the above discussion, we can conclude that the fuel-cell power density is preferred when the volume fraction of the ionomer is 0.15.
3.4. Optimum Triple-Phase Content
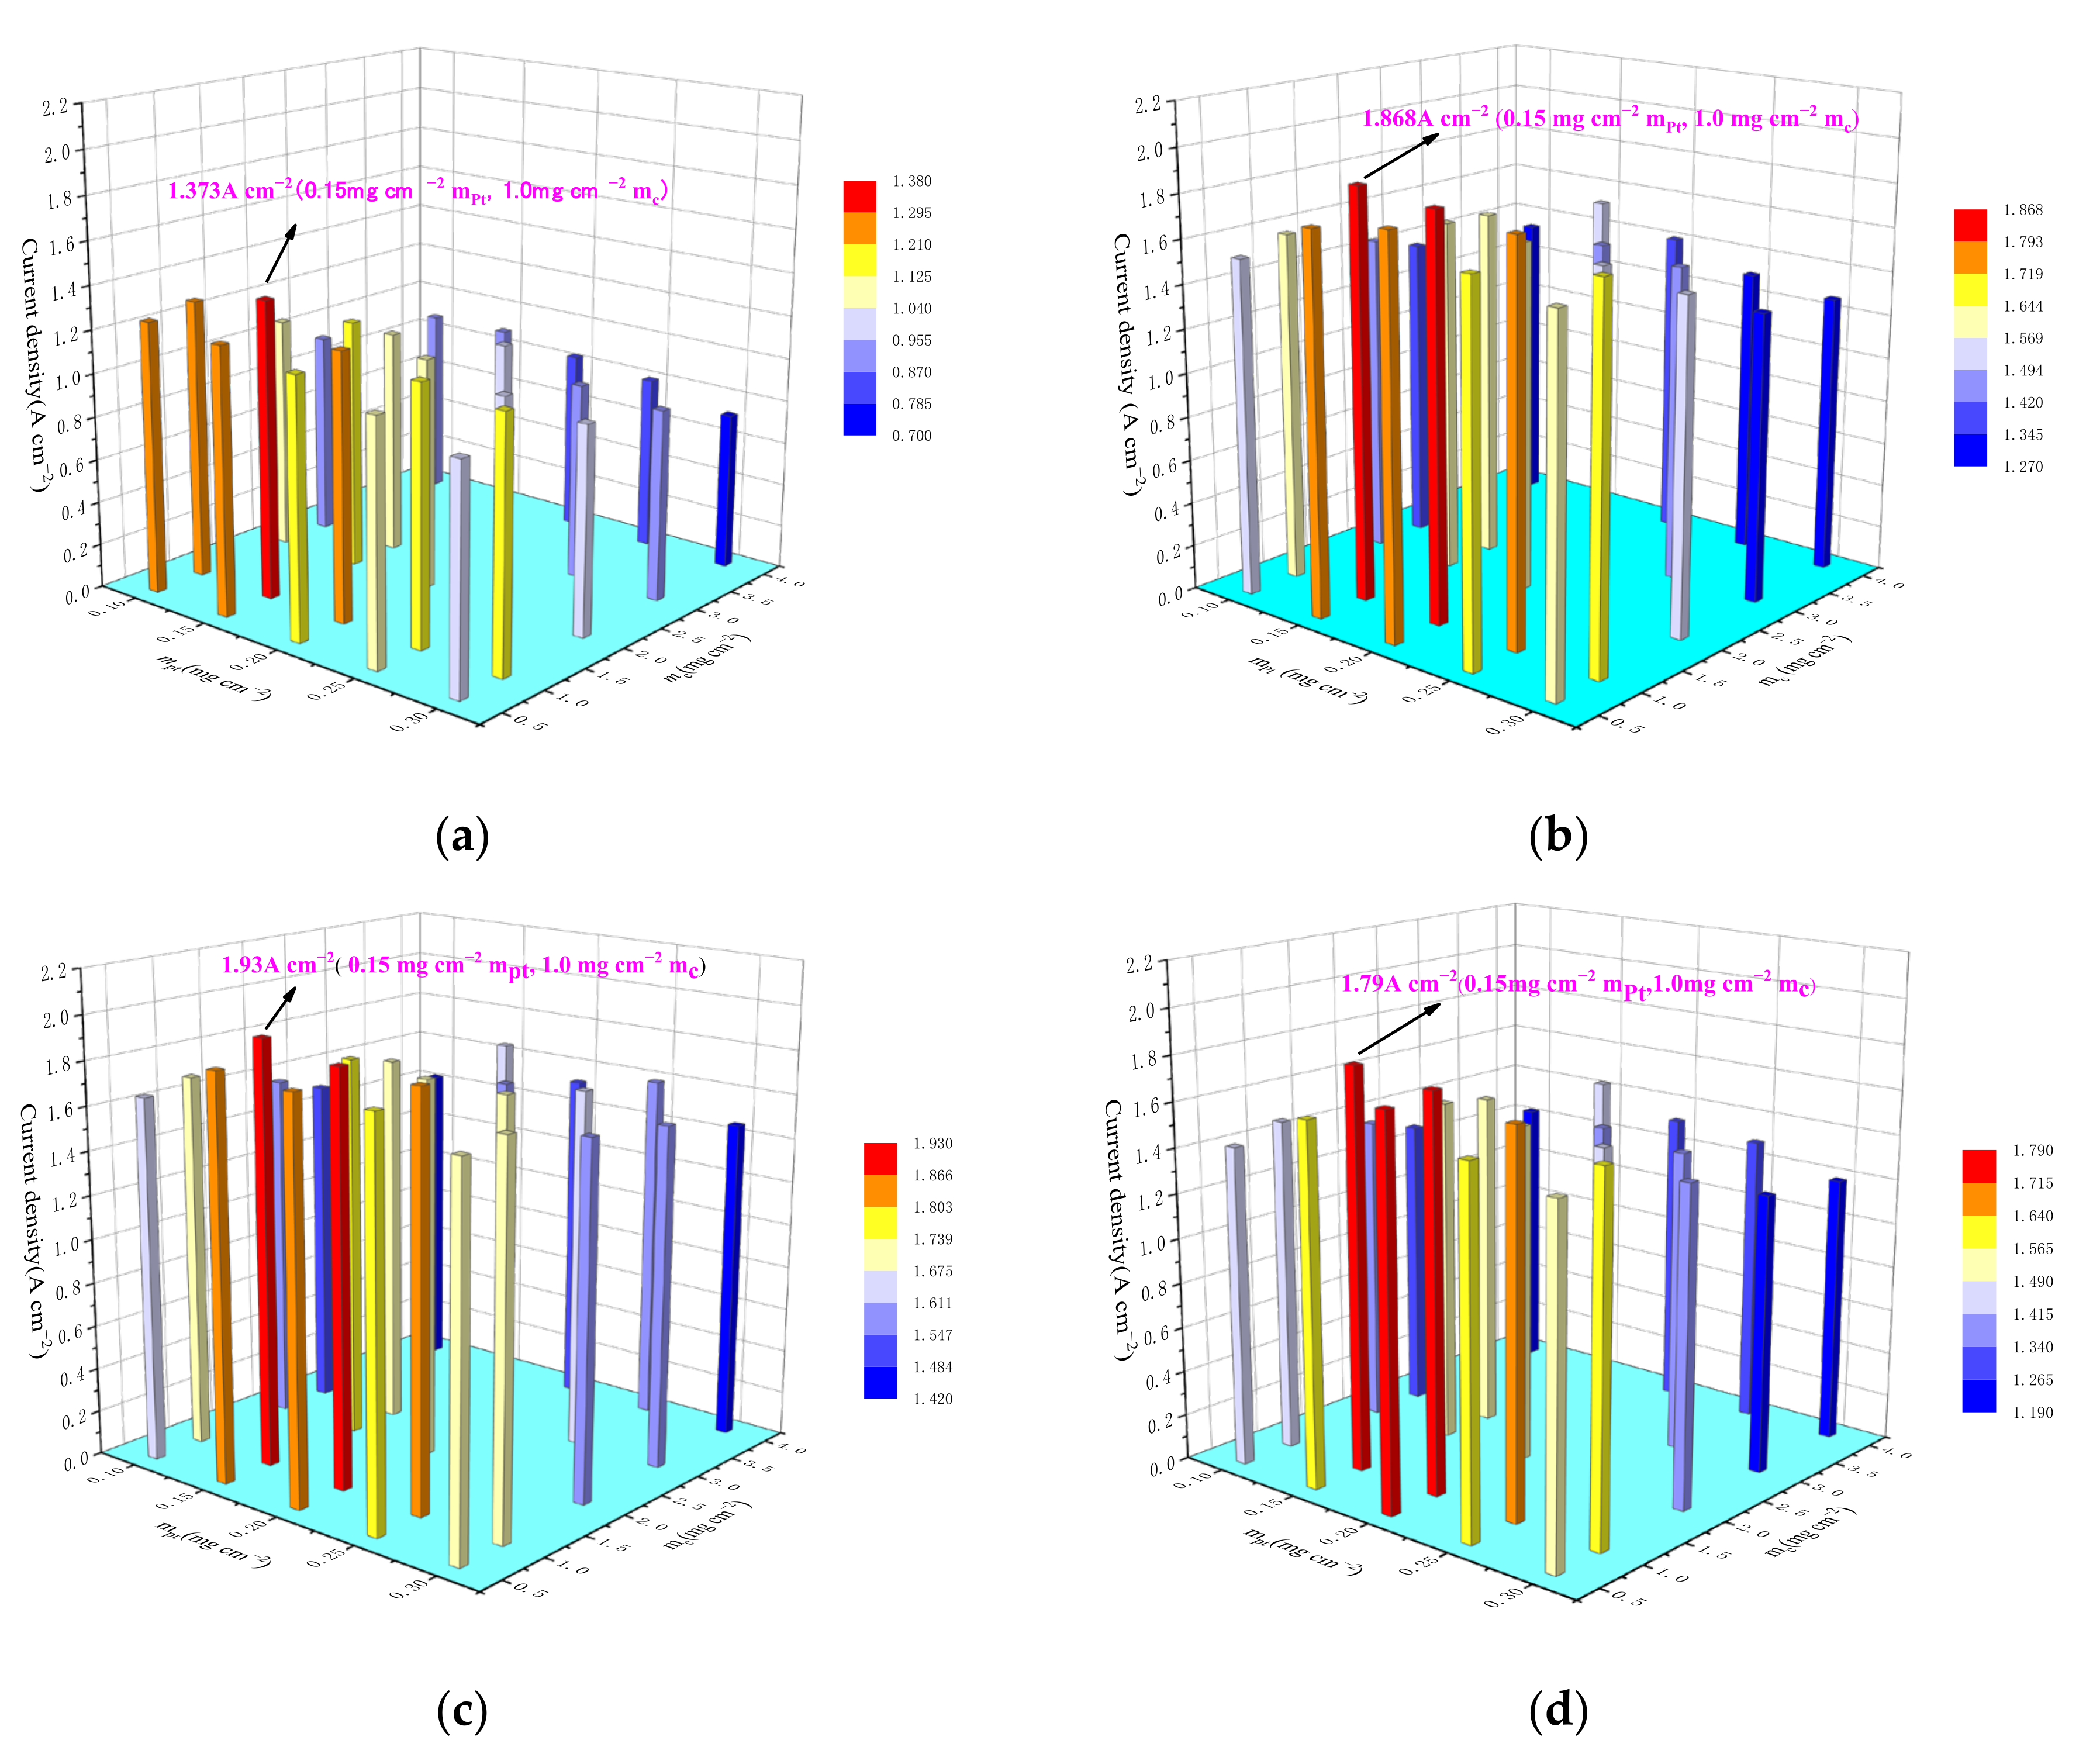
The optimal contents of carbon, Pt, and ionomers have been discussed, respectively, under the condition that the other two contents are the same. This study is a multi-objective optimization. The optimization objective of this study is the output current density of the fuel cell, which is determined by Pt loading, carbon loading, and ionomer volume fraction. Pt loading varies from 0.1 mg cm−2 to 0.3 mg cm−2, carbon loading varies from 0.5 mg cm−2 to 4 mg cm−2, and ionomer fraction varies from 0.05 to 0.25. Our aim is to find the ratio of the catalyst’s three phases to maximize the current density. Figure 14 displays the difference in polarization curves under different carbon loadings, Pt loadings and ionomer loadings. Each column represents a combination of carbon loading, Pt loading, and ionomer volume fraction. It is observed that under 100 combinations, the best fuel-cell performance was observed with a Pt loading of 0.15 mg cm−2, a carbon loading of 1.0 mg cm−2, and an ionomer volume fraction of 0.2. With this combination, the current density of the fuel cell is 1.93 A cm−2 and the maximum power density can reach 1.158 W cm−2. This conductive-ordered electrode structure can significantly help reduce manufacturing costs while improving cell performance.
4. Conclusions
In this research, a three-dimensional PEMFC model with order-structured CL was developed. Based on the developed model, the oxygen transport behaviors and structural design parameters in OCCL are investigated. Additionally, the impact of liquid water on the transport of reactive gases in OCCL has been taken into account. The following inferences can be made in light of the given model and assumption:
(1) Under the assumption of constant carbon loading and ionomer membrane thickness, the fuel-cell performance increases first and then reduces with increasing carbon loading. Under the combined effect of ohmic loss and concentration loss, there is an optimal carbon loading in OCCL, which makes the cell performance the best, and for the studied cases, the carbon loading of 1.0 mg cm−2 is compared to be the best.
(2) Pt loading has a similar influence on PEMFC performance. Fuel-cell performance first improves and then degrades with Pt loading, assuming constant carbon loading and ionomer film thickness. The increase in Pt loading is beneficial to reducing activation and concentration overpotentials, but it will lead to an increase in ohmic loss. Considering the trade-off results, the fuel-cell performance reaches its best when the Pt loading is 0.12 mg cm−2.
(3) The effects of ionomer loading are investigated while keeping the Pt loading and carbon loading constant. The fuel-cell performance first enhances and then reduces with ionomer loading, which is because that the too-thin ionomer is too thin to cover Pt particles, while the too-thick ionomer film will increase oxygen transport resistance. For the cases studied, the amount of 0.15 is preferred.
(4) Under 100 combinations, the overall effect of OCCL design parameters on PEMFC performance was achieved. It could be concluded that the PEMFC performance is the best when carbon loading, Pt loading and ionomer volume fraction are 1.0 mg cm−2, 0.15 mg cm−2 and 0.2, respectively. At this combination, the current density reaches 1.93 A cm−2, and the maximum power density of PEMFC is 1.158 W cm−2.
In this study, by establishing a macro-model of proton exchange membrane fuel cells with coupled ordered catalyst layer model, and considering the influence of liquid water accumulation, the optimal three-phase content of the catalyst layer is obtained, which can provide guidance for improving the utilization rate of catalyst components and constructing high-performance PEMFC catalyst layer. The research results can guarantee the performance of proton exchange membrane fuel cells and reduce the production cost of cells. This model is instructive to the design of PEMFC with OCCL, which provides valuable suggestions for fabricating CL.
Author Contributions
Conceptualization, M.Y. and W.Y.; methodology, M.Y.; software, L.R.; validation, X.M., and W.Y.; data curation, M.Y. and L.R.; writing—original draft preparation, M.Y. and X.M.; writing—review and editing, X.M. and W.Y.; supervision, W.Y. All authors have read and agreed to the published version of the manuscript.
Funding
This research was funded by National Natural Science Foundation of China, grant number 51876159, 52090063.
Data Availability Statement
The data presented in this study are available on reguest from the correspondina author.
Conflicts of Interest
The authors declare no conflict of interest.
Nomenclature
| A | area (cm2) |
| C | component concentration (kmol·m−3) |
| D | effective diffusion coefficient (m2·s−1) |
| F | faraday constant, 96,485 C mol−1 |
| I | cell current density (A m−2) |
| j | current density(A m−3) |
| k | thermal conductivity (W·m−1·K−1), or condensation and evaporation rate (s−1) |
| K | permeability (m2) |
| M | molecular weight (kg kmol−1) |
| p | pressure (Pa·s−1) |
| P | power (W) |
| R | universal gas constant (J·kmol−1k−1) |
| s | water saturation |
| t | time (s) |
| T | temperature (K) |
| U | cell voltage (V) |
| w | quality score |
| Greeks | |
| α | transfer coefficient |
| γ | concentration indices |
| δ | thickness (mm) |
| ζ | stoichiometric number |
| η | overpotential (V) |
| λ | water content |
| µ | viscosity (Pa·s) |
| ρ | density (kg m−3) |
| σ | conductivity (S·m−1), interfacial tension (N m−1) |
| φ | potential (V) |
| Superscripts and subscripts | |
| a | anode |
| c | cathode |
| d | dissolved |
| e | electronic |
| g | gas |
| i | component |
| u | momentum |
| w | water vapor |
| eff | effective value |
| fl | liquid phase |
| in | inlet value |
| ion | proton |
| ref | reference value |
| sat | saturated |
| sl | solid phase |
| wv | vapor |
References
- EAgyekum, B.; Ampah, J.D.; Wilberforce, T.; Afrane, S.; Nutakor, C. Research Progress, Trends, and Current State of Development on PEMFC-New Insights from a Bibliometric Analysis and Characteristics of Two Decades of Research Output. Membranes 2022, 12, 1103. [Google Scholar] [CrossRef] [PubMed]
- Du, L.; Prabhakaran, V.; Xie, X.; Park, S.; Wang, Y.; Shao, Y. Low-PGM and PGM-Free Catalysts for Proton Exchange Membrane Fuel Cells: Stability Challenges and Material Solutions. Adv. Mater. 2020, 33, e1908232. [Google Scholar] [CrossRef] [PubMed]
- Yoo, B.; Lim, K.; Salihi, H.; Ju, H. A parametric study on the performance requirements of key fuel cell components for the real-ization of high-power automotive fuel cells. Int. J. Heat Mass Transf. 2022, 186, 122477. [Google Scholar] [CrossRef]
- Lee, K.A.; Yoon, K.R.; Kwon, S.H.; Lee, K.J.; Jo, S.; Lee, J.S.; Lee, K.Y.; Lee, S.W.; Lee, S.G.; Kim, J.Y. Post-assembly modification of polymeric composite membranes using spin drying for fuel cell applications. J. Mater. Chem. A 2019, 7, 7380–7388. [Google Scholar] [CrossRef]
- Shahgaldi, S.; Alaefour, I.; Li, X. Impact of manufacturing processes on proton exchange membrane fuel cell performance. Appl. Energy 2018, 225, 1022–1032. [Google Scholar] [CrossRef]
- Kulikovsky, A. The effect of Nafion film on the cathode catalyst layer performance in a low–Pt PEM fuel cell. Electrochem. Commun. 2019, 103, 61–65. [Google Scholar] [CrossRef]
- Wang, G.; Mukherjee, P.P.; Wang, C.Y. Direct numerical simulation (DNS) modeling of PEFC electrodes: Part II. Random microstructure. Electrochim. Acta 2006, 51, 3151–3160. [Google Scholar] [CrossRef]
- Chen, L.; Wu, G.; Holby, E.F.; Zelenay, P.; Tao, W.Q.; Kang, Q. Lattice Boltzmann Pore-Scale Investigation of Coupled Physical-electrochemical Processes in C/Pt and Non-Precious Metal Cathode Catalyst Layers in Proton Exchange Membrane Fuel Cells. Electrochim. Acta 2015, 158, 175–186. [Google Scholar] [CrossRef]
- Vielstich, W.; Gasteiger, H.A. Handbook of Fuel Cells—Fundamentals, Technology and Applications; John Wiley & Sons Inc.: Hoboken, NJ, USA, 2009; p. 603. [Google Scholar]
- Suzuki, T.; Tsushima, S.; Hirai, S. Effects of Nafion ionomer and carbon particles on structure formation in a proton-exchange membrane fuel cell catalyst layer fabricated by the decal-transfer method. Hydrog. Energy 2011, 36, 12361–12369. [Google Scholar] [CrossRef]
- Khajeh-Hosseini-Dalasm, N.; Kermani, M.J.; Moghaddam, D.G.; Stockie, J.M. A parametric study of cathode catalyst layer structural parameters on the performance of a PEM fuel cell. Int. J. Hydrog. Energy 2010, 35, 2417–2427. [Google Scholar] [CrossRef]
- He, P.; Mu, Y.T.; Park, J.W.; Tao, W.Q. Modeling of the effects of cathode catalyst layer design parameters on performance of polymer electrolyte membrane fuel cell. Appl. Energy 2020, 277, 115555. [Google Scholar] [CrossRef]
- Zhu, S.; Wang, S.L.; Jiang, L.H.; Xia, Z.X.; Sun, H.; Sun, G.Q. High Pt utilization catalyst prepared by ion exchange method for direct methanol fuel cells. Int. J. Hydrog. Energy 2012, 37, 14543–14548. [Google Scholar] [CrossRef]
- Wang, Z.G.; Zhang, X.L.; Nie, L.; Zhang, Y.F.; Liu, X.W. Elimination of water flooding of cathode current collector of micro passive direct methanol fuel cell by super-hydrophilic surface treatment. Appl. Energy 2014, 126, 107–112. [Google Scholar] [CrossRef]
- Middelman, E. Improved PEM fuel cell electrodes by controlled self-assembly. Fuel Cells Bull. 2002, 2002, 9–12. [Google Scholar] [CrossRef]
- Lu, Z.; Yao, S.; Dong, Y.; Wu, D.; Pan, H.; Huang, X.; Wang, T.; Sun, Z.; Chen, X. Earth-abundant coal-derived carbon nanotube/carbon composites as efficient bifunctional oxygen electrocatalysts for rechargeable zinc-air batteries. J. Energy Chem. 2021, 56, 87–97. [Google Scholar] [CrossRef]
- Jing, Z.; Yi, X.B.; Liu, S.; Fan, H.L.; Ju, W.; Wang, Q.C.; Ma, J. Vertically aligned carbon nanotubes/carbon fiber paper composite to support Pt nanoparticles for direct methanol fuel cell application. J. Phys. Chem. Solids 2017, 102, 99–104. [Google Scholar]
- Wang, G.; Zou, L.; Huang, Q.; Zou, Z.; Yang, H. Multidimensional nanostructured membrane electrode assemblies for proton exchange membrane fuel cell applications. J. Mater. Chem. 2019, 7, 9447–9477. [Google Scholar] [CrossRef]
- Bonnefont, A.; Ruvinskiy, P.; Rouhet, M.; Orfanidi, A.; Neophytides, S.; Savinova, E. Advanced catalytic layer architectures for polymer electrolyte membrane fuel cells. Wiley Interdiscip. Rev. Energy Environ. 2014, 3, 505–521. [Google Scholar] [CrossRef]
- Yasuda, S.; Furuya, A.; Uchibori, Y.; Kim, J.; Murakoshi, K. Iron–Nitrogen-Doped Vertically Aligned Carbon Nanotube Electrocatalyst for the Oxygen Reduction Reaction. Adv. Funct. Mater. 2016, 26, 738–744. [Google Scholar] [CrossRef]
- Murata, S.; Imanishi, M.; Hasegawa, S.; Namba, R. Vertically aligned carbon nanotube electrodes for high current density operating proton exchange membrane fuel cells. J. Power Sources 2014, 253, 104–113. [Google Scholar] [CrossRef]
- Shin, S.; Liu, J.; Akbar, A.; Um, S. Nanoscale transport characteristics and catalyst utilization of vertically aligned carbon nanotube catalyst layers for fuel cell applications: Comprehensive stochastic modeling of composite morphological structures. J. Catal. 2019, 377, 465–479. [Google Scholar] [CrossRef]
- Huang, Z.H.; Song, Y.; Xu, X.X.; Liu, X.X. Ordered polypyrrole nanowire arrays grown on a carbon cloth substrate for a high-performance pseudocapacitor electrode. ACS Appl. Mater. Interfaces 2015, 7, 25506–25513. [Google Scholar] [CrossRef] [PubMed]
- Tian, Z.Q.; Lim, S.H.; Poh, C.K.; Tang, Z.; Xia, Z.; Luo, Z.; Shen, P.K.; Chua, D.; Feng, Y.P.; Shen, Z.; et al. A highly order-structured membrane electrode assembly with vertically aligned carbon nanotubes for ultra-low Pt loading PEM fuel cells. Adv. Energy Mater. 2011, 1, 1205–1214. [Google Scholar] [CrossRef]
- Meng, X.; Deng, X.; Zhou, L.; Hu, B.; Tan, W.; Zhou, W.; Liu, M.; Shao, Z. A highly ordered hydrophilic–hydrophobic janus Bi-functional layer with ultralow Pt loading and fast gas/water transport for fuel cells. Energy Environ. Mater. 2021, 1, 126–133. [Google Scholar] [CrossRef]
- Deng, R.; Xia, Z.; Sun, R.; Wang, S.; Sun, G. Nanostructured ultrathin catalyst layer with ordered platinum nanotube arrays for polymer electrolyte membrane fuel cells. J. Energy Chem. 2019, 43, 33–39. [Google Scholar] [CrossRef]
- Yao, X.; Su, K.; Sheng, S.; Mao, L.; He, A.; Zhang, J.; Du, S. A novel catalyst layer with carbon matrix for Pt nanowire growth in proton exchange membrane fuel cells (PEMFCs). Int. J. Hydrogen Energy 2013, 38, 12374–12378. [Google Scholar] [CrossRef]
- Su, K.; Yao, X.; Sui, S.; Wei, Z.; Zhang, J.; Du, S. Matrix Material Study for in situ Grown Pt Nanowire Electrocatalyst Layer in Proton Exchange Membrane Fuel Cells (PEMFCs). Fuel Cells 2015, 15, 449–455. [Google Scholar] [CrossRef]
- Tatyana, R.; Andrei, K. Impedance Spectroscopy Study of the PEM Fuel Cell Cathode with Nonuniform Nafion Loading. J. Electrochem. Soc. 2017, 164, 3016–3021. [Google Scholar]
- Du, C.Y.; Yang, T.; Shi, P.F.; Yin, G.P.; Cheng, X.Q. Performance analysis of the ordered and the conventional catalyst layers in proton exchange membrane fuel cells. Electrochim. Acta 2006, 51, 4934–4941. [Google Scholar] [CrossRef]
- Rao, S.M.; Xing, Y. Simulation of nanostructured electrodes for polymer electrolyte membrane fuel cells. J. Power Sources 2008, 185, 1094–1100. [Google Scholar] [CrossRef]
- Jiao, K.; Li, X. Three-dimensional multiphase modeling of cold start processes in polymer electrolyte membrane fuel cells. Electrochim. Acta 2009, 54, 6876–6891. [Google Scholar] [CrossRef]
- Yang, W.W.; Zhao, T.S. Two-phase, mass-transport model for direct methanol fuel cells with effect of non-equilibrium evaporation and condensation. Power Sources 2007, 174, 136–147. [Google Scholar] [CrossRef]
- Fan, L.; Zhang, G.; Jiao, K. Characteristics of PEMFC operating at high current density with low external humidification. Energy Convers. Manag. 2017, 150, 763–774. [Google Scholar] [CrossRef]
- Li, W.Z.; Yang, W.W.; Zhang, W.Y.; Qu, Z.G.; He, Y.L. Three-dimensional modeling of a PEMFC with serpentine flow field incorporating the impacts of electrode inhomogeneous compression deformation. Int. J. Hydrogen Energy 2019, 44, 22194–22209. [Google Scholar] [CrossRef]
- Ozen, D.N.; Timurkutluk, B.; Altinisik, K. Effects of operation temperature and reactant gas humidity levels on performance of PEM fuel cells. Renew Sustain. Energy Rev. 2016, 59, 1298–1306. [Google Scholar] [CrossRef]
Figure 1.
Flowchart of optimum triple-phase ratio of PEMFC.
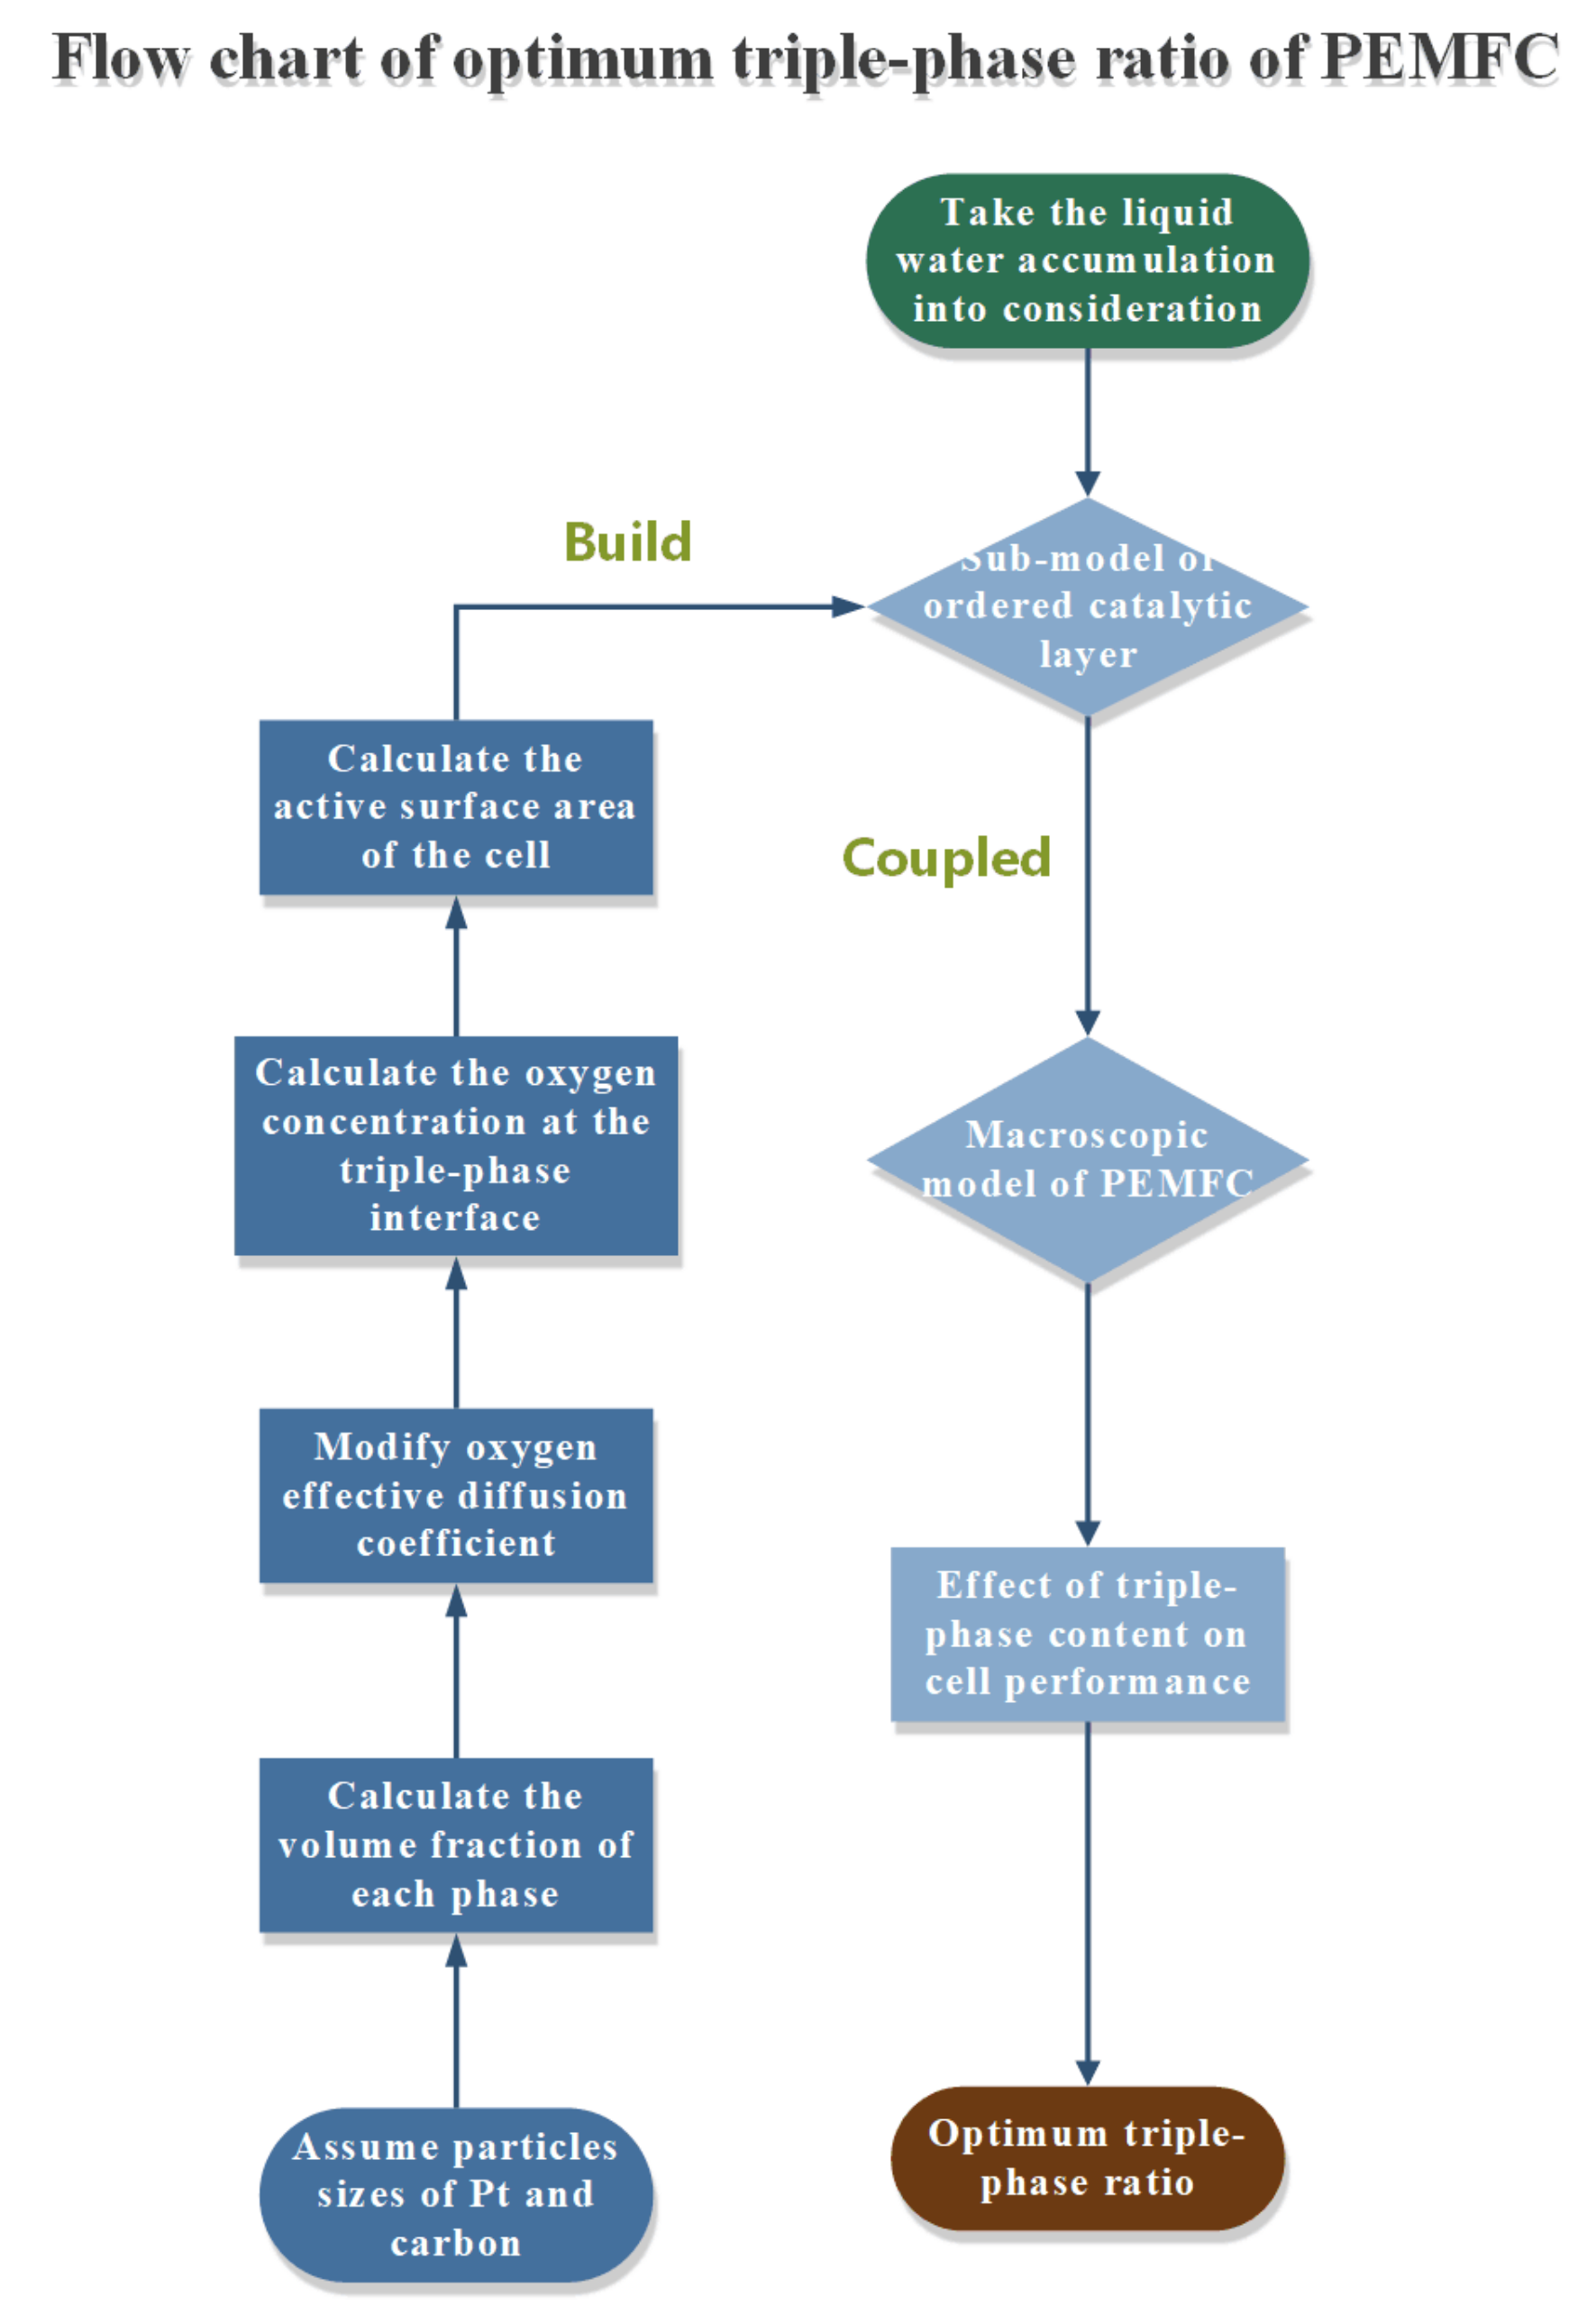
Figure 2.
Schematic of ordered proton exchange membrane fuel-cell model.
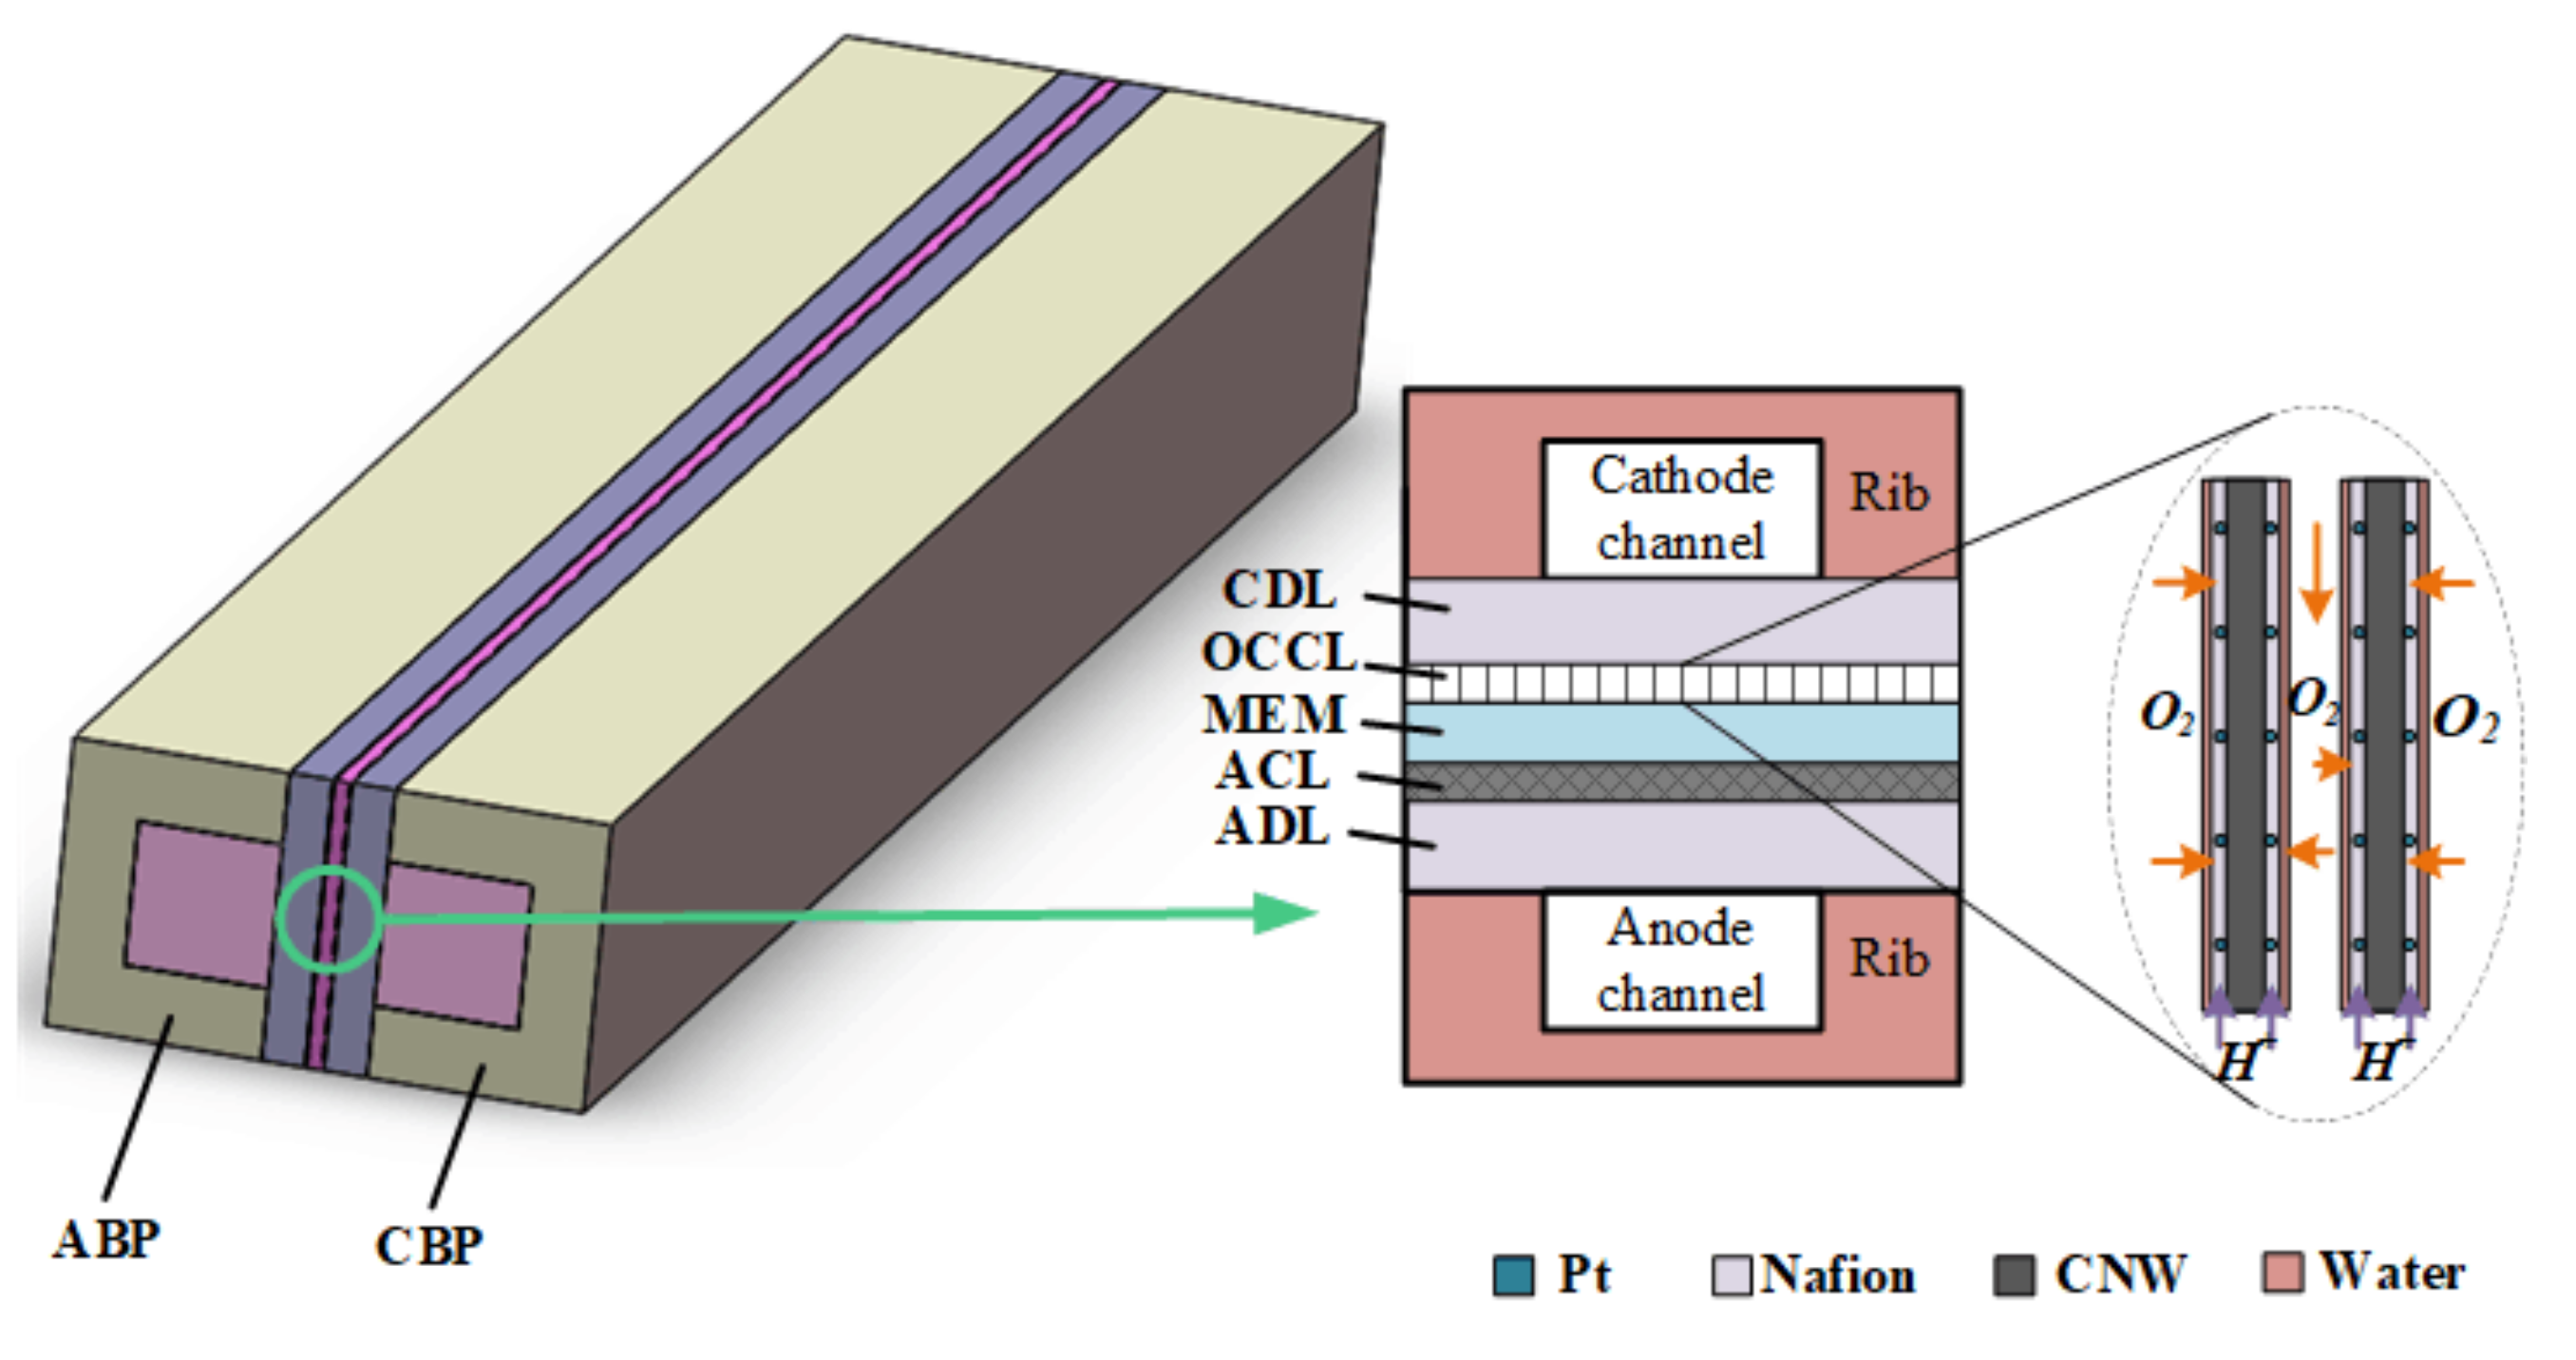
Figure 3.
Schematic of oxygen transport in ordered catalyst layer.
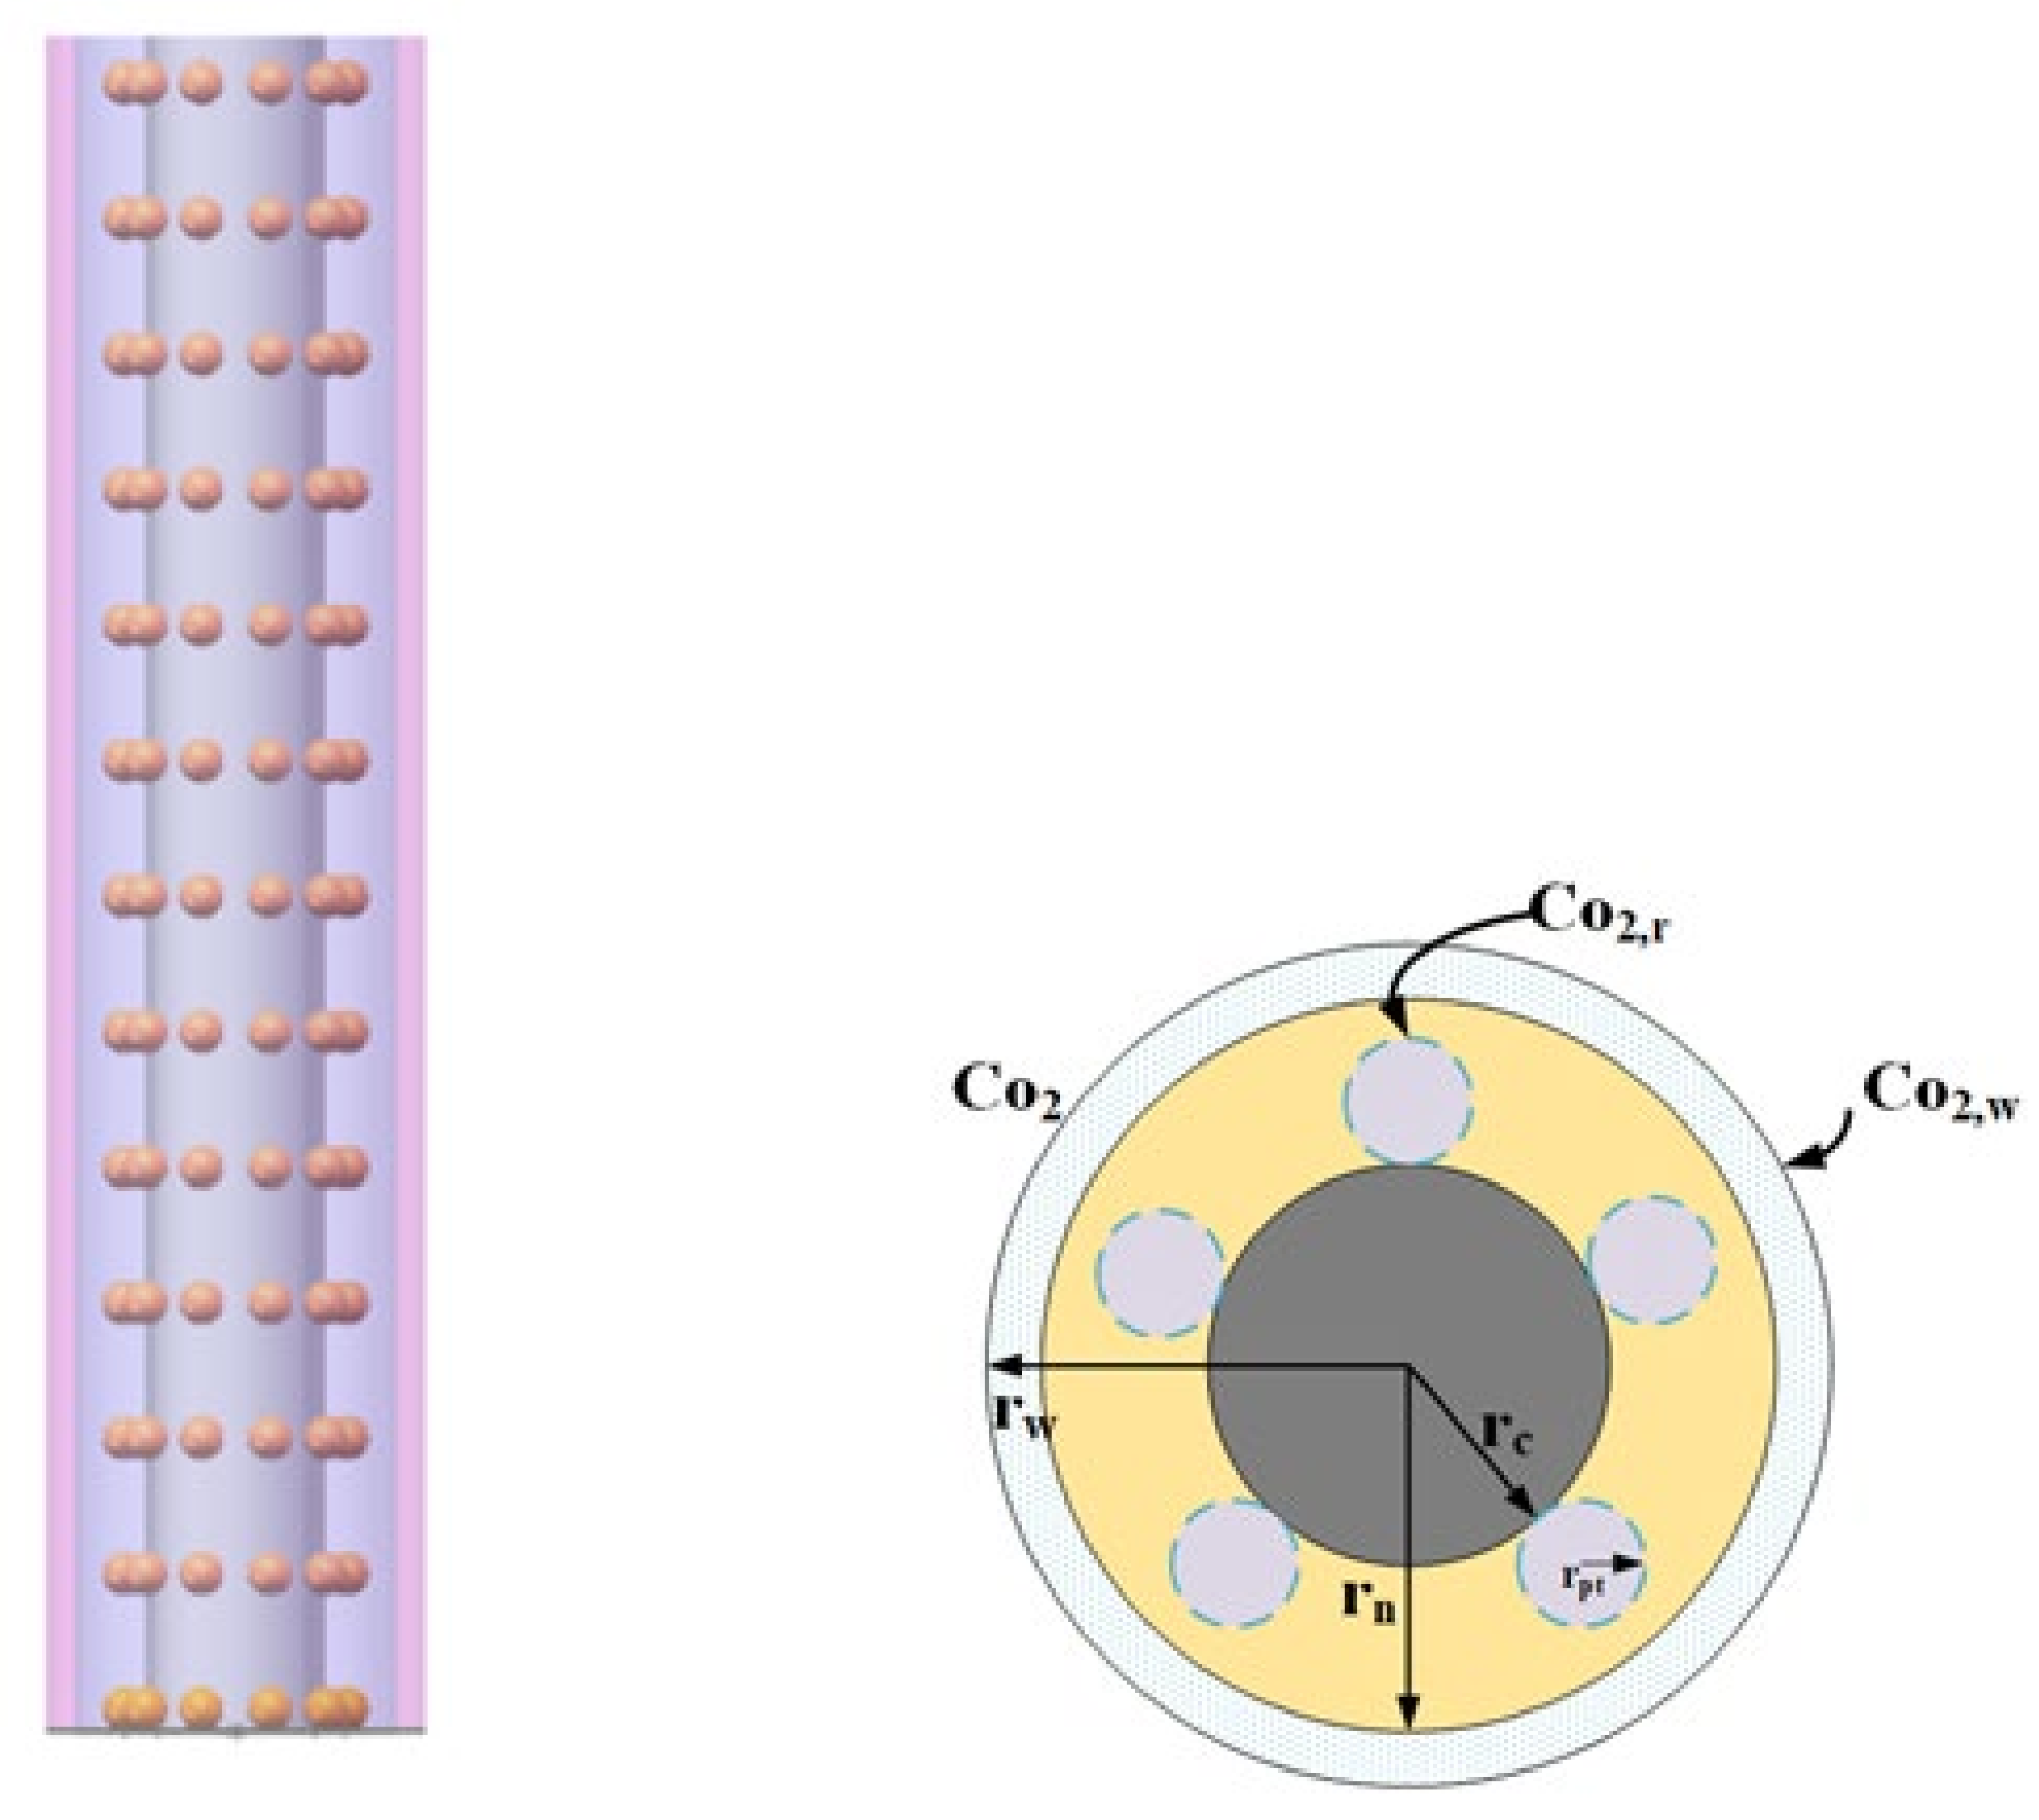
Figure 4.
The grid independence testing result.
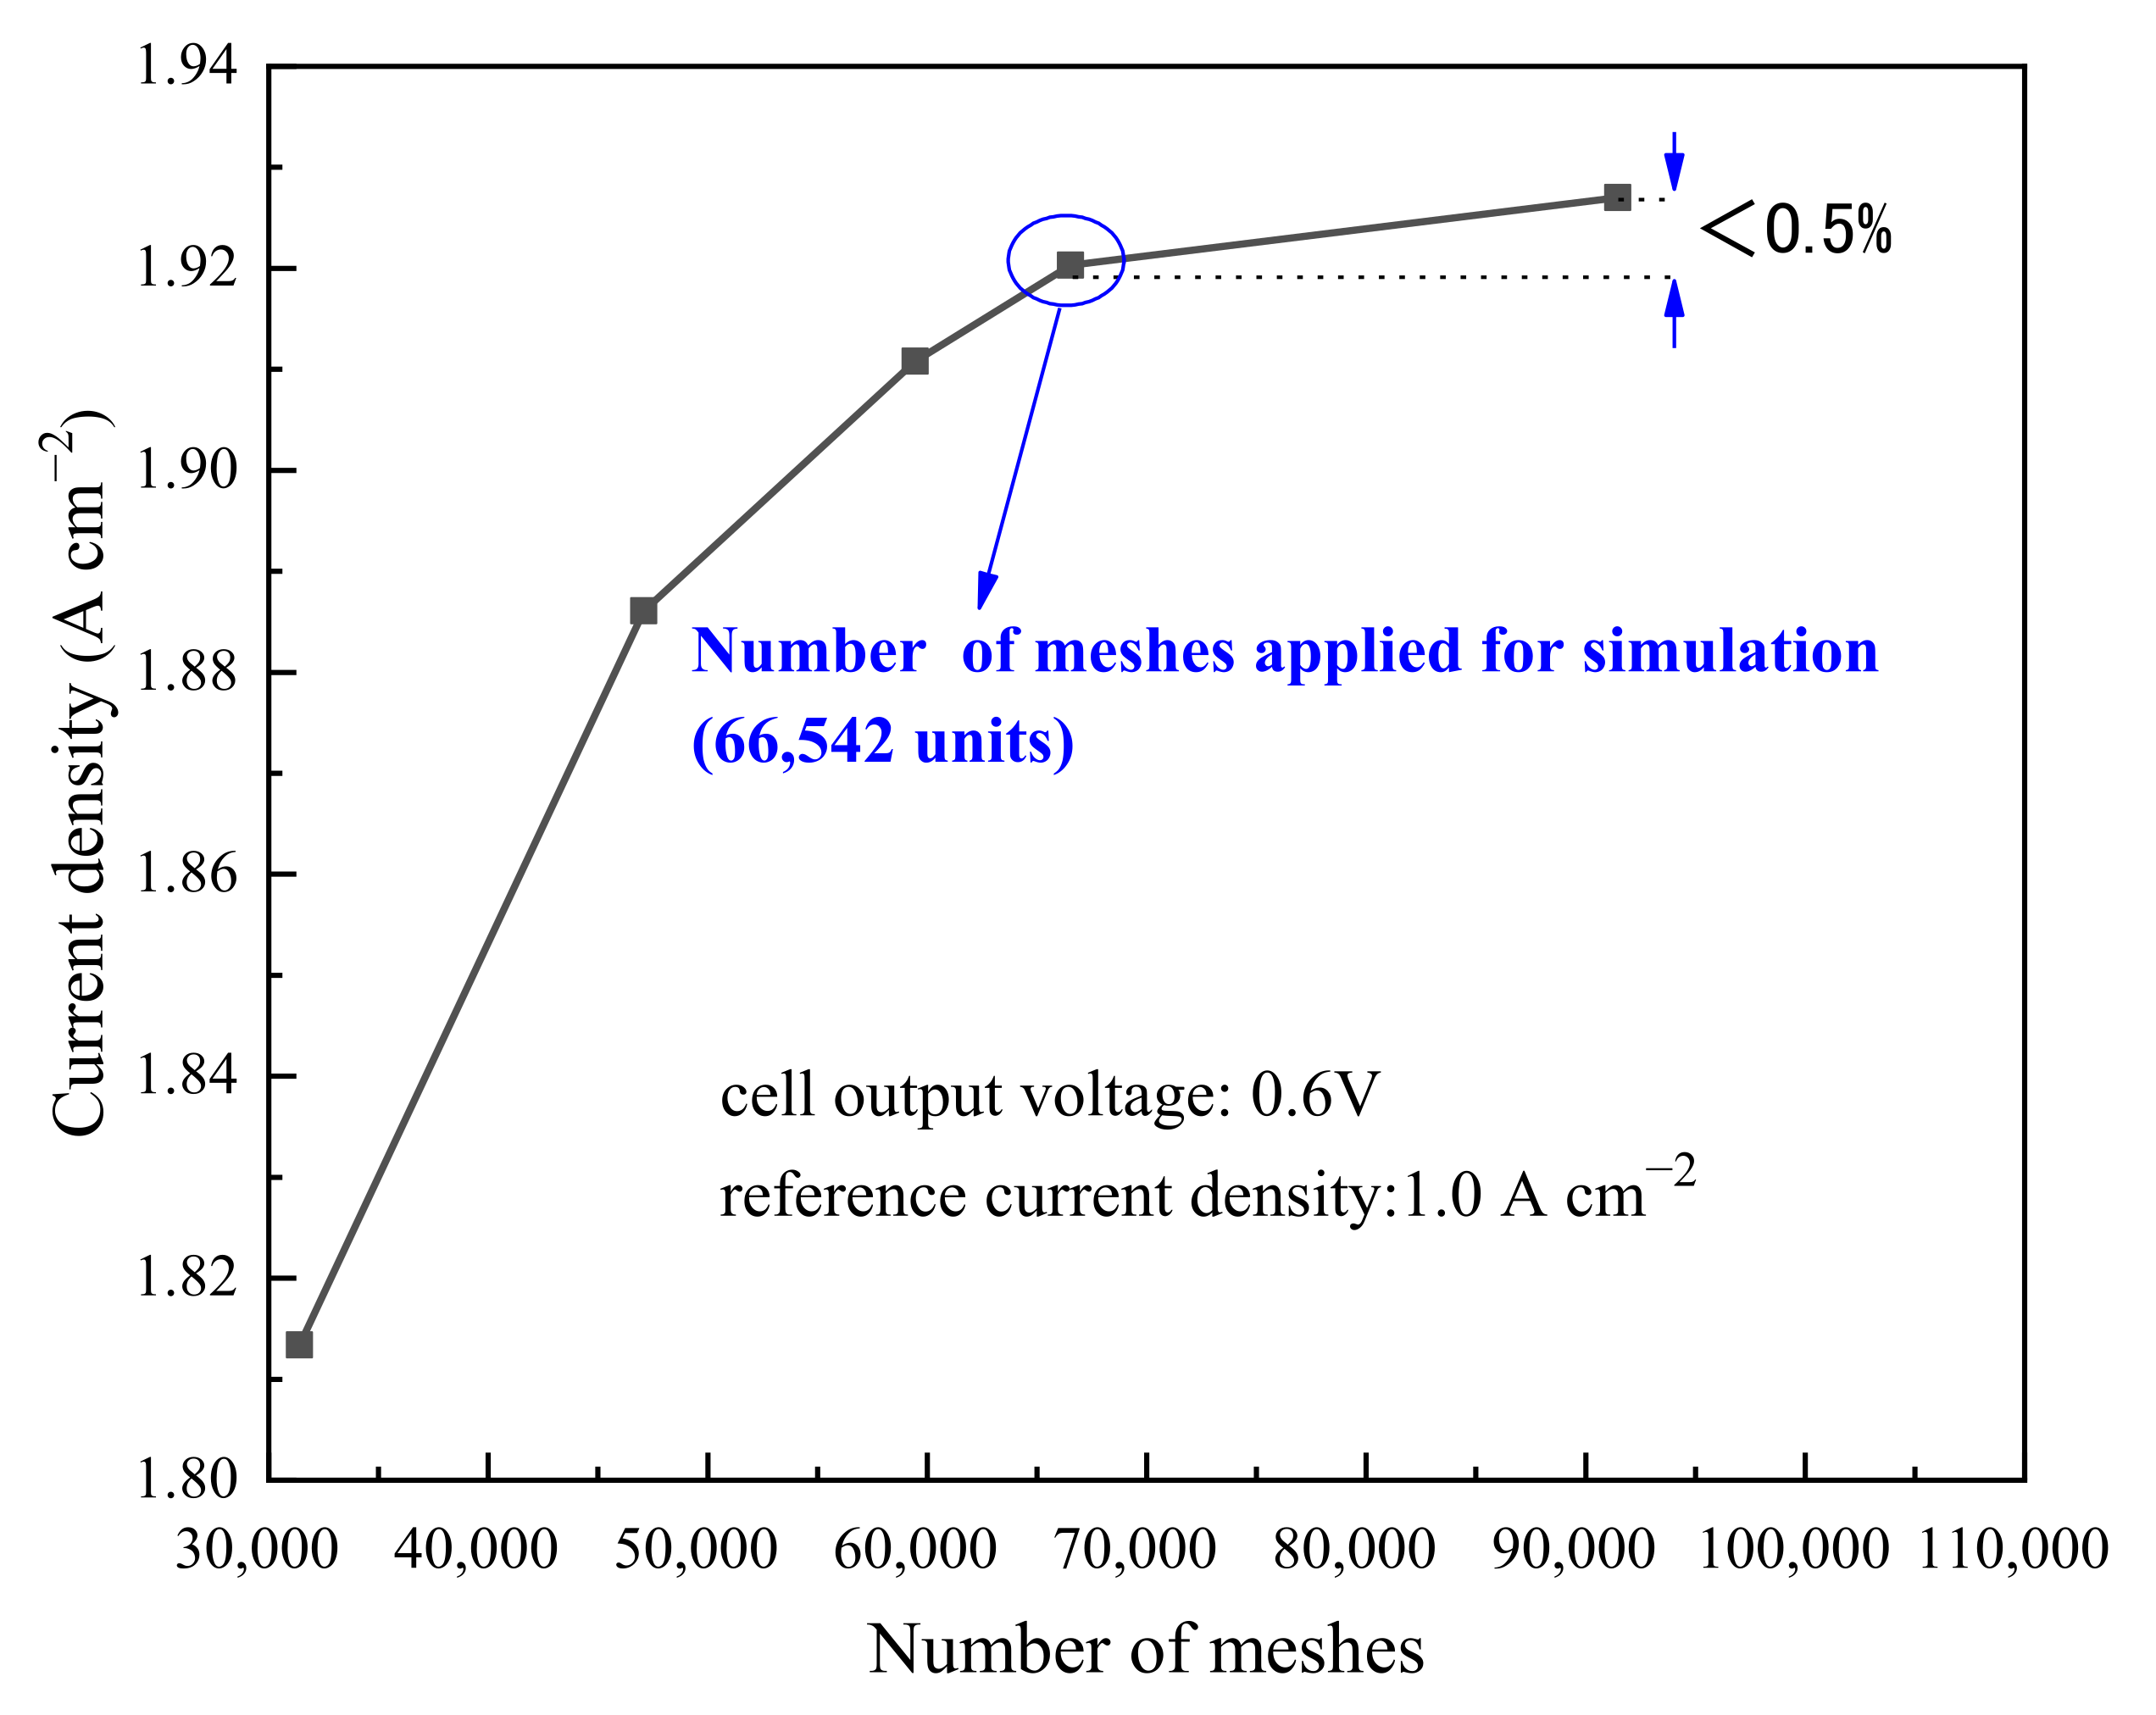
Figure 5.
The model validation results.
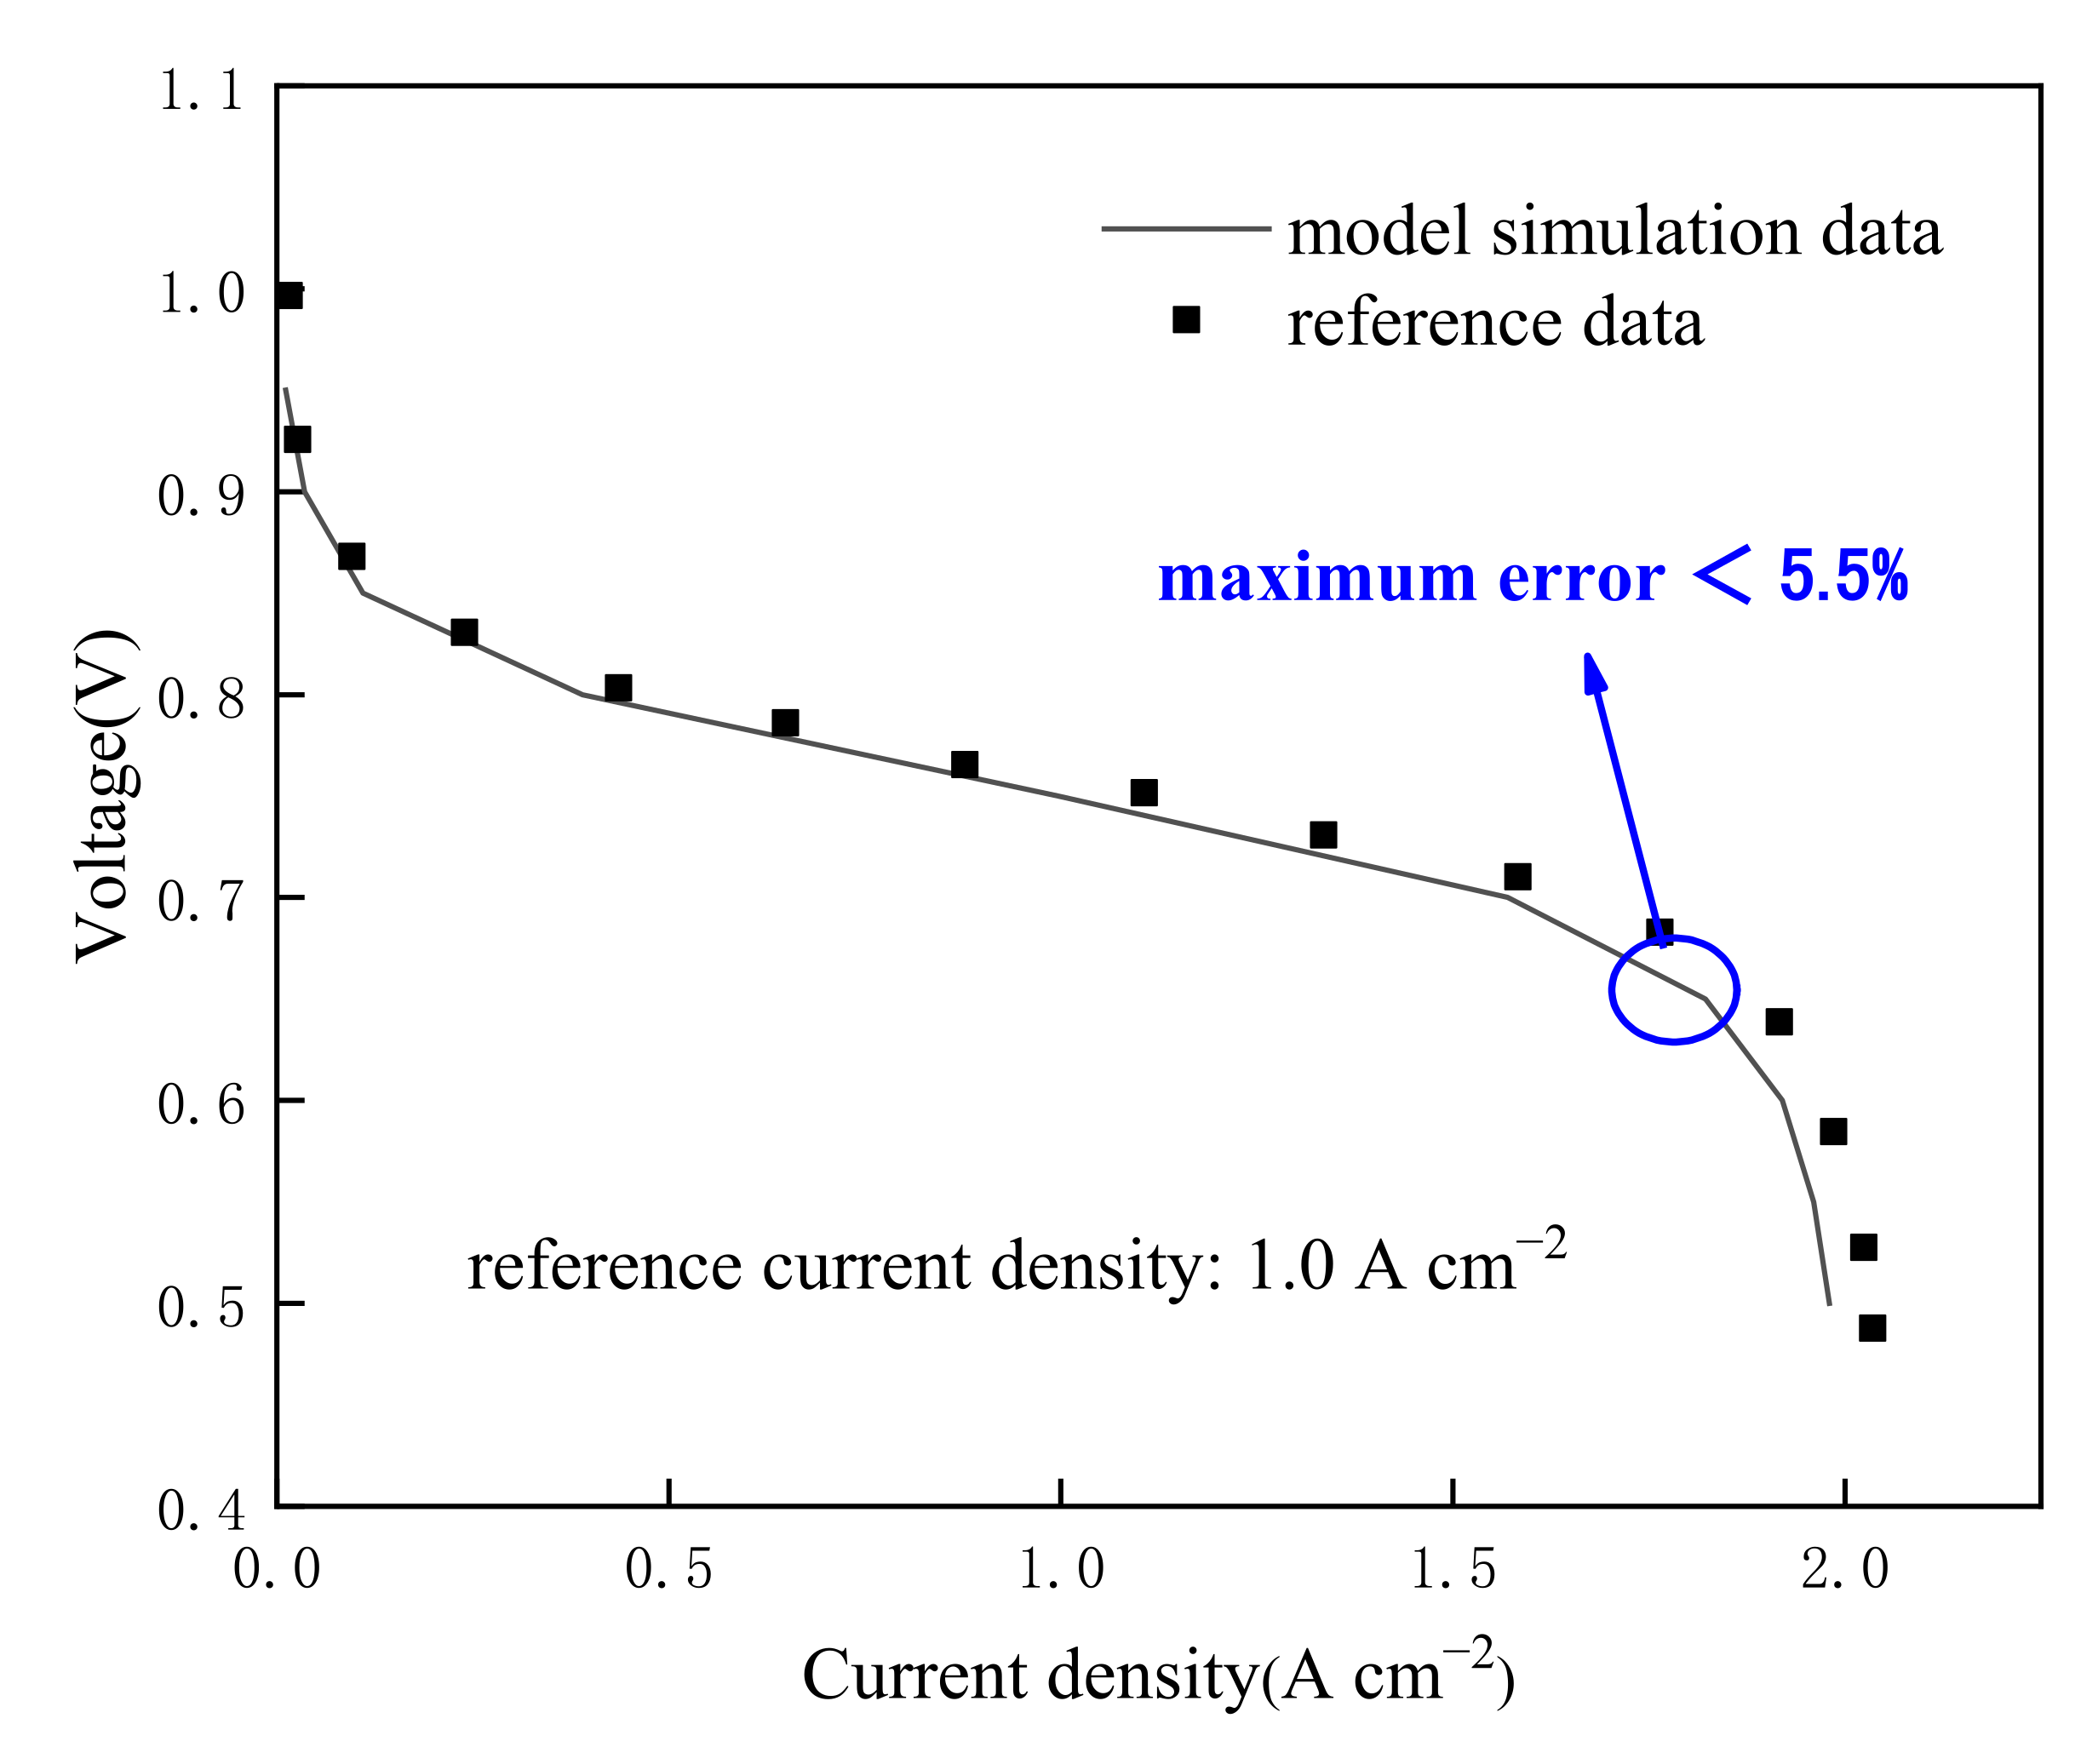
Figure 6.
Effect of carbon loading on cell performance.
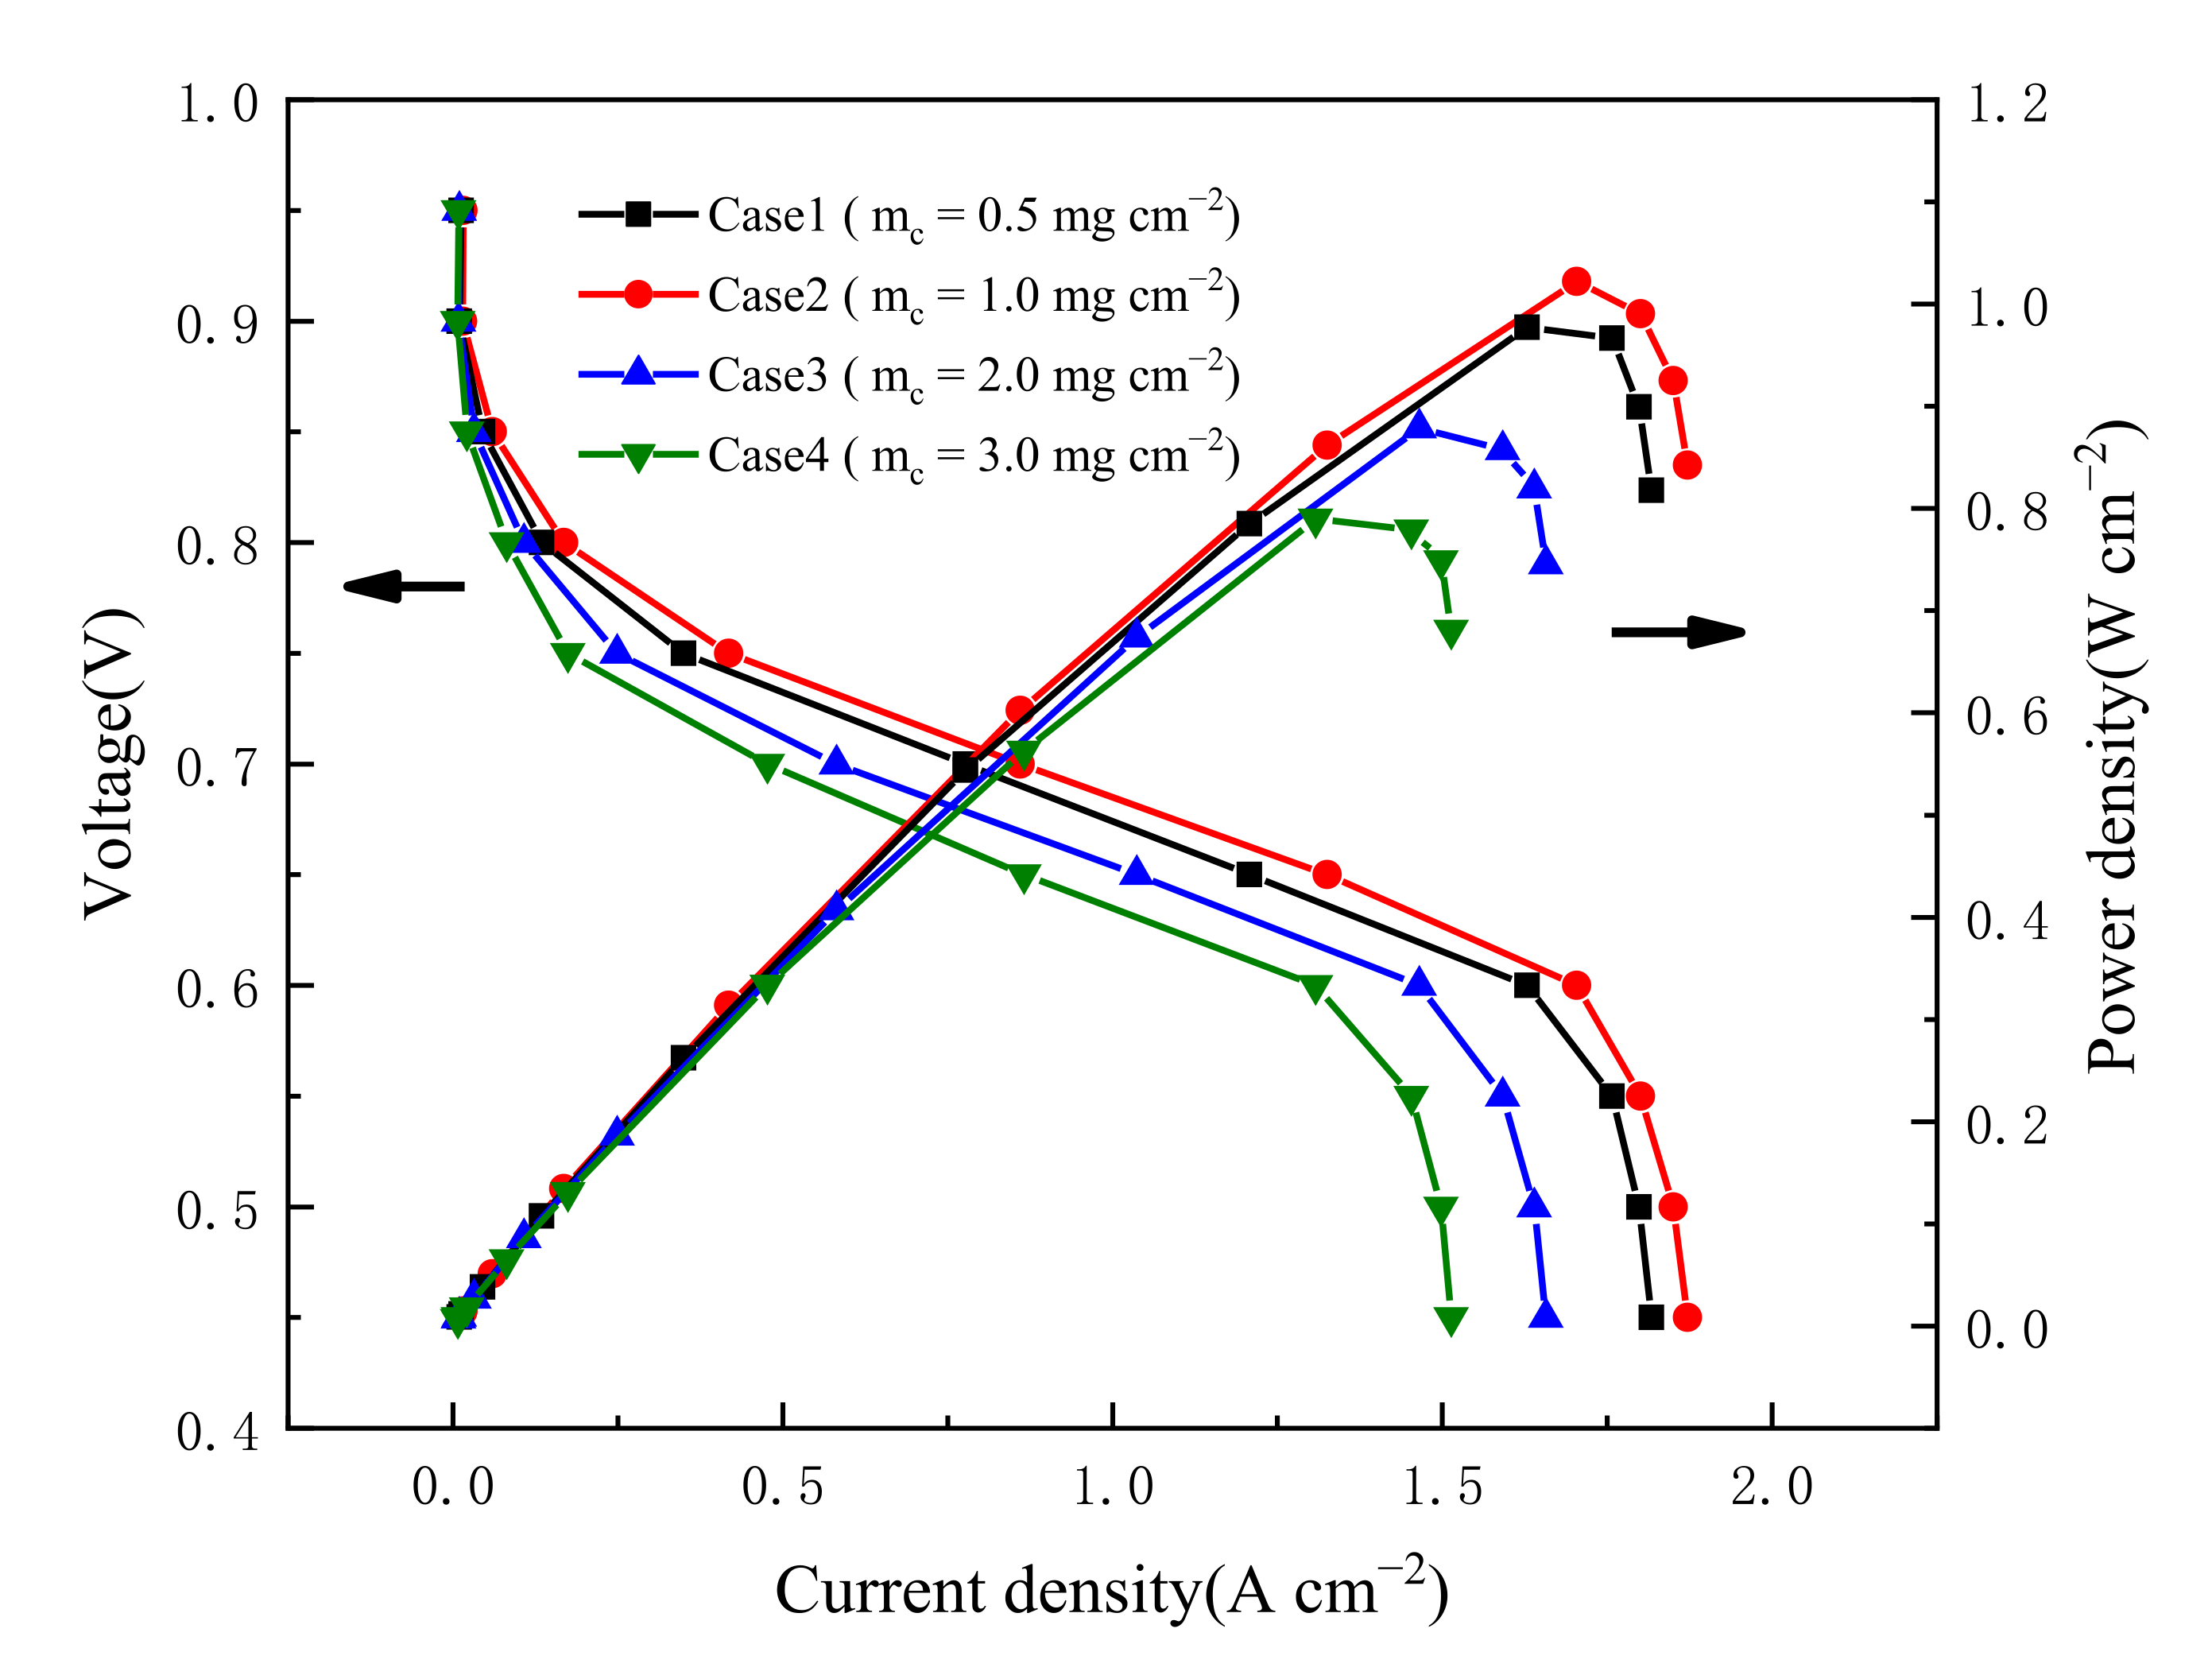
Figure 7.
Effect of carbon loading on Ohmic overpotential.

Figure 8.
Effect of carbon loading on liquid water saturation.
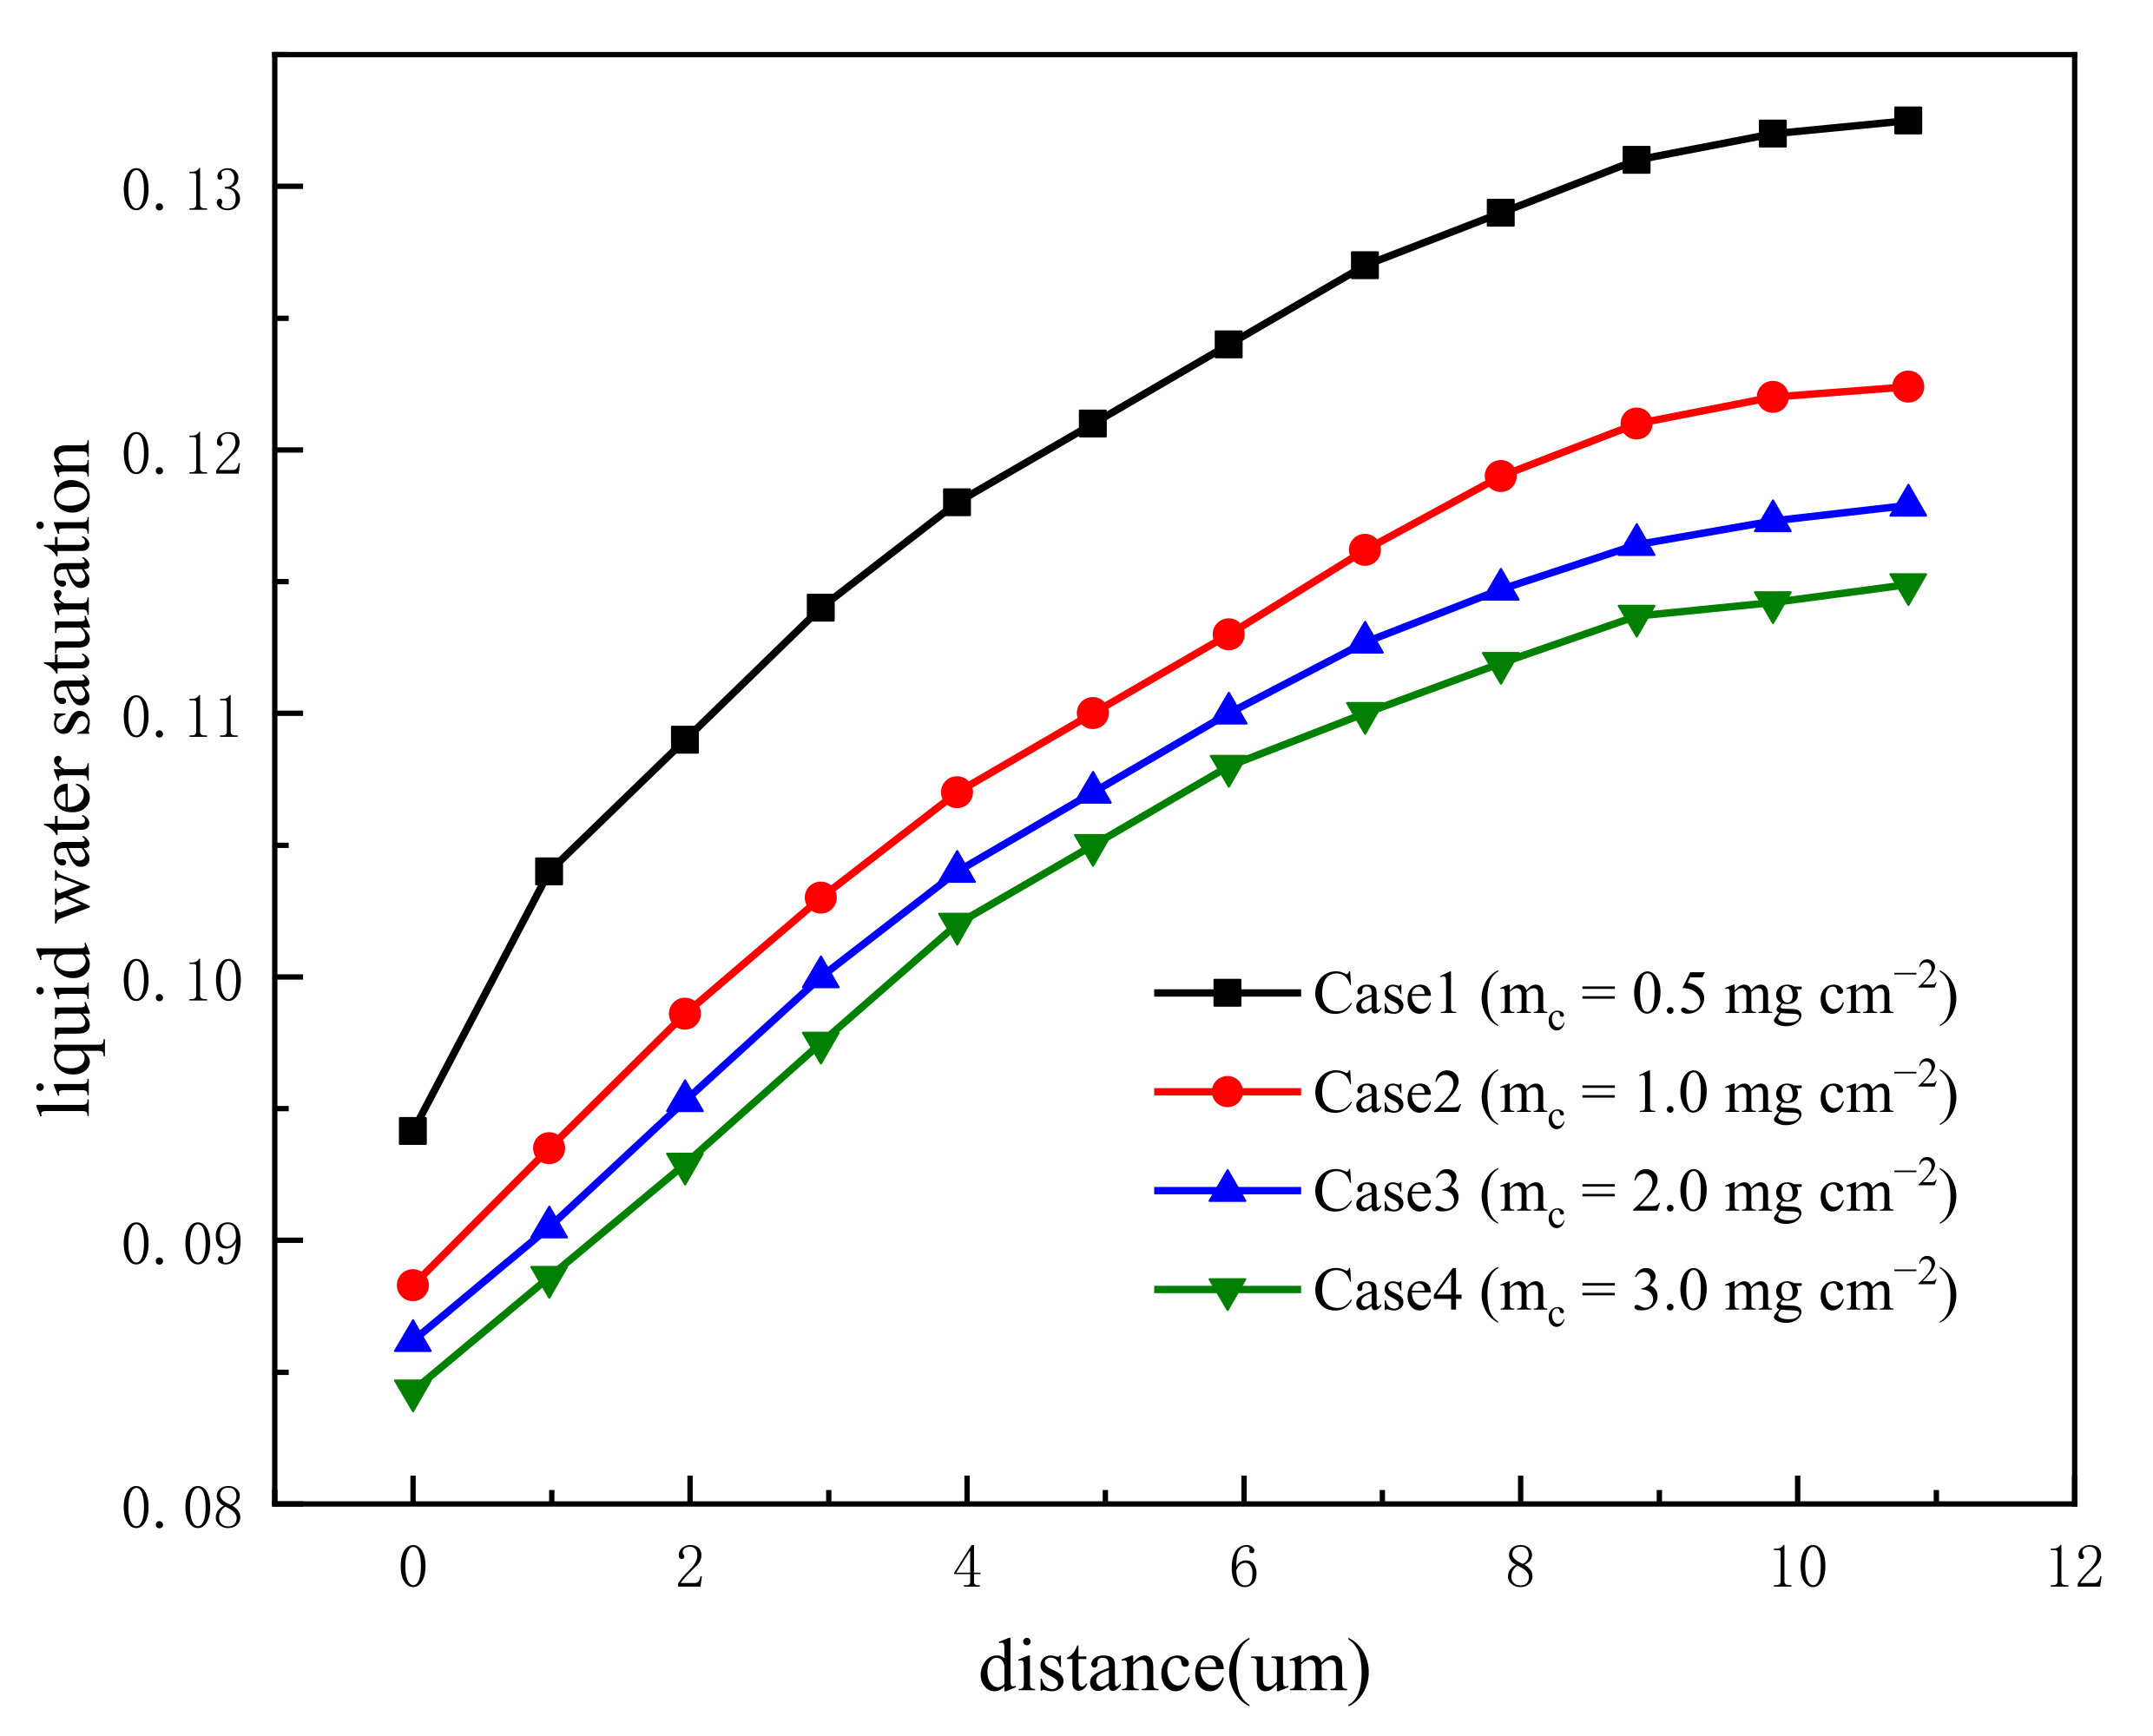
Figure 9.
Effect of Pt loading on cell performance.
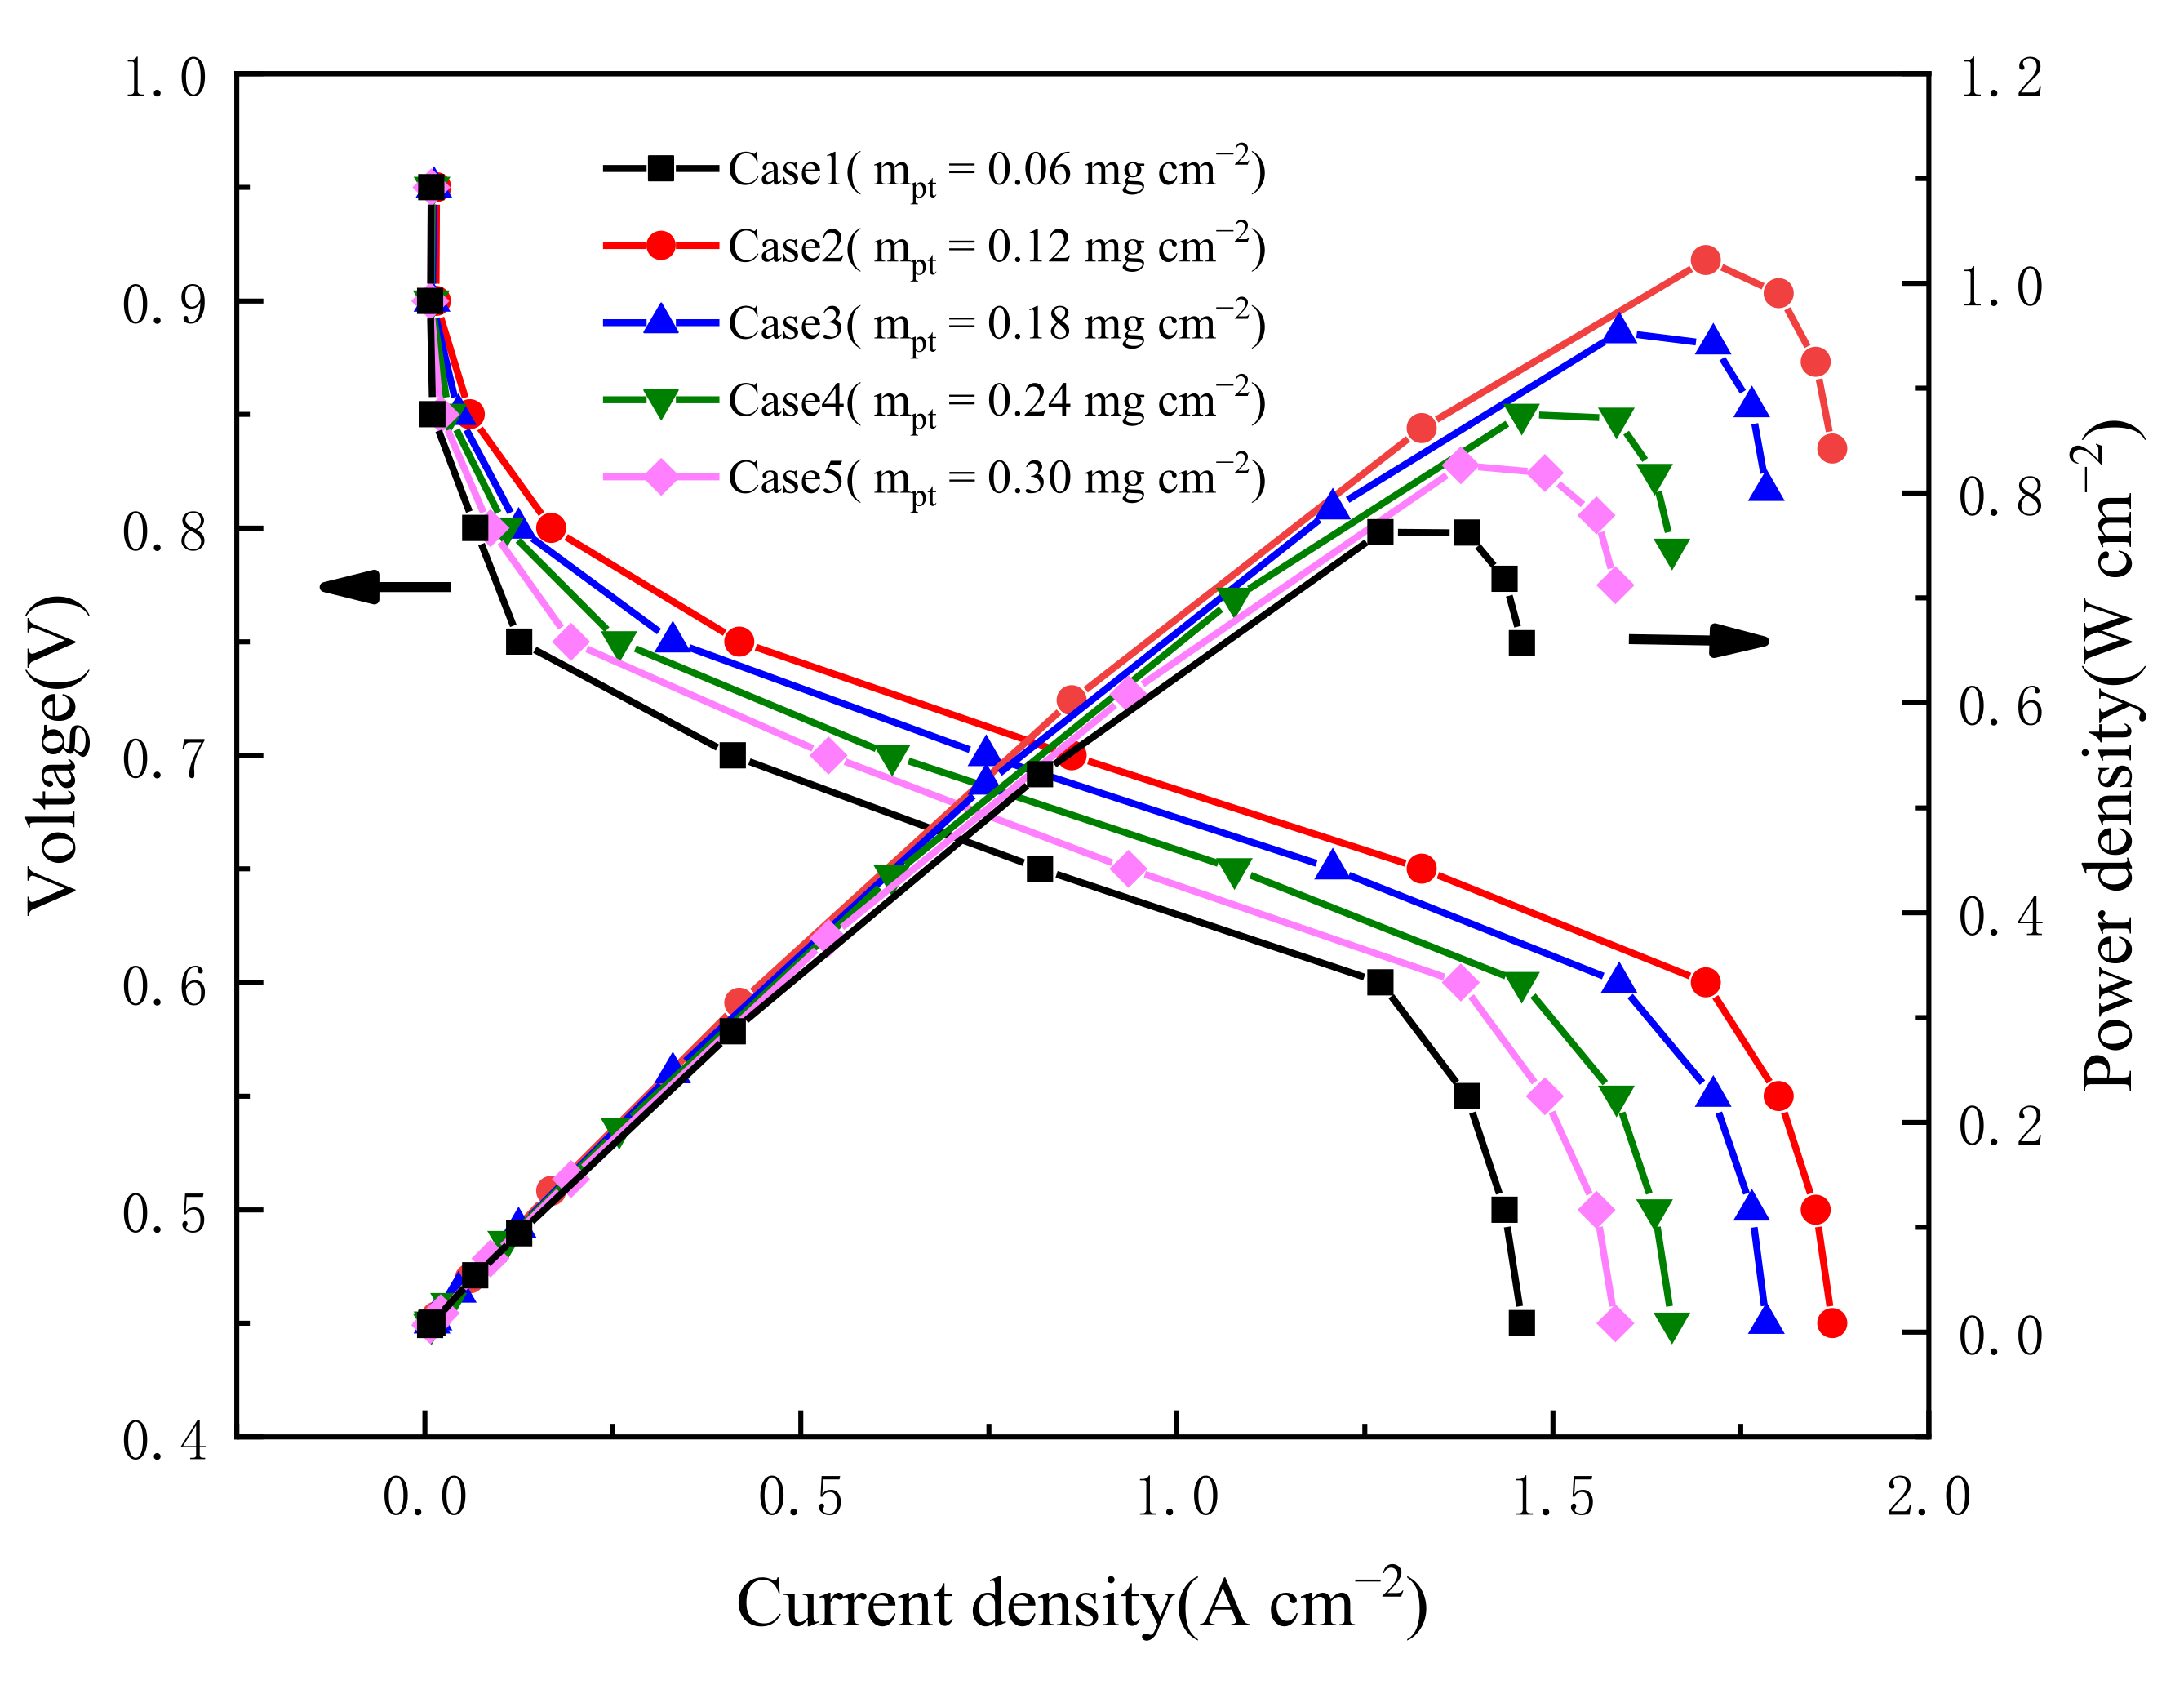
Figure 10.
Effect of Pt loading on Ohmic overpotential.
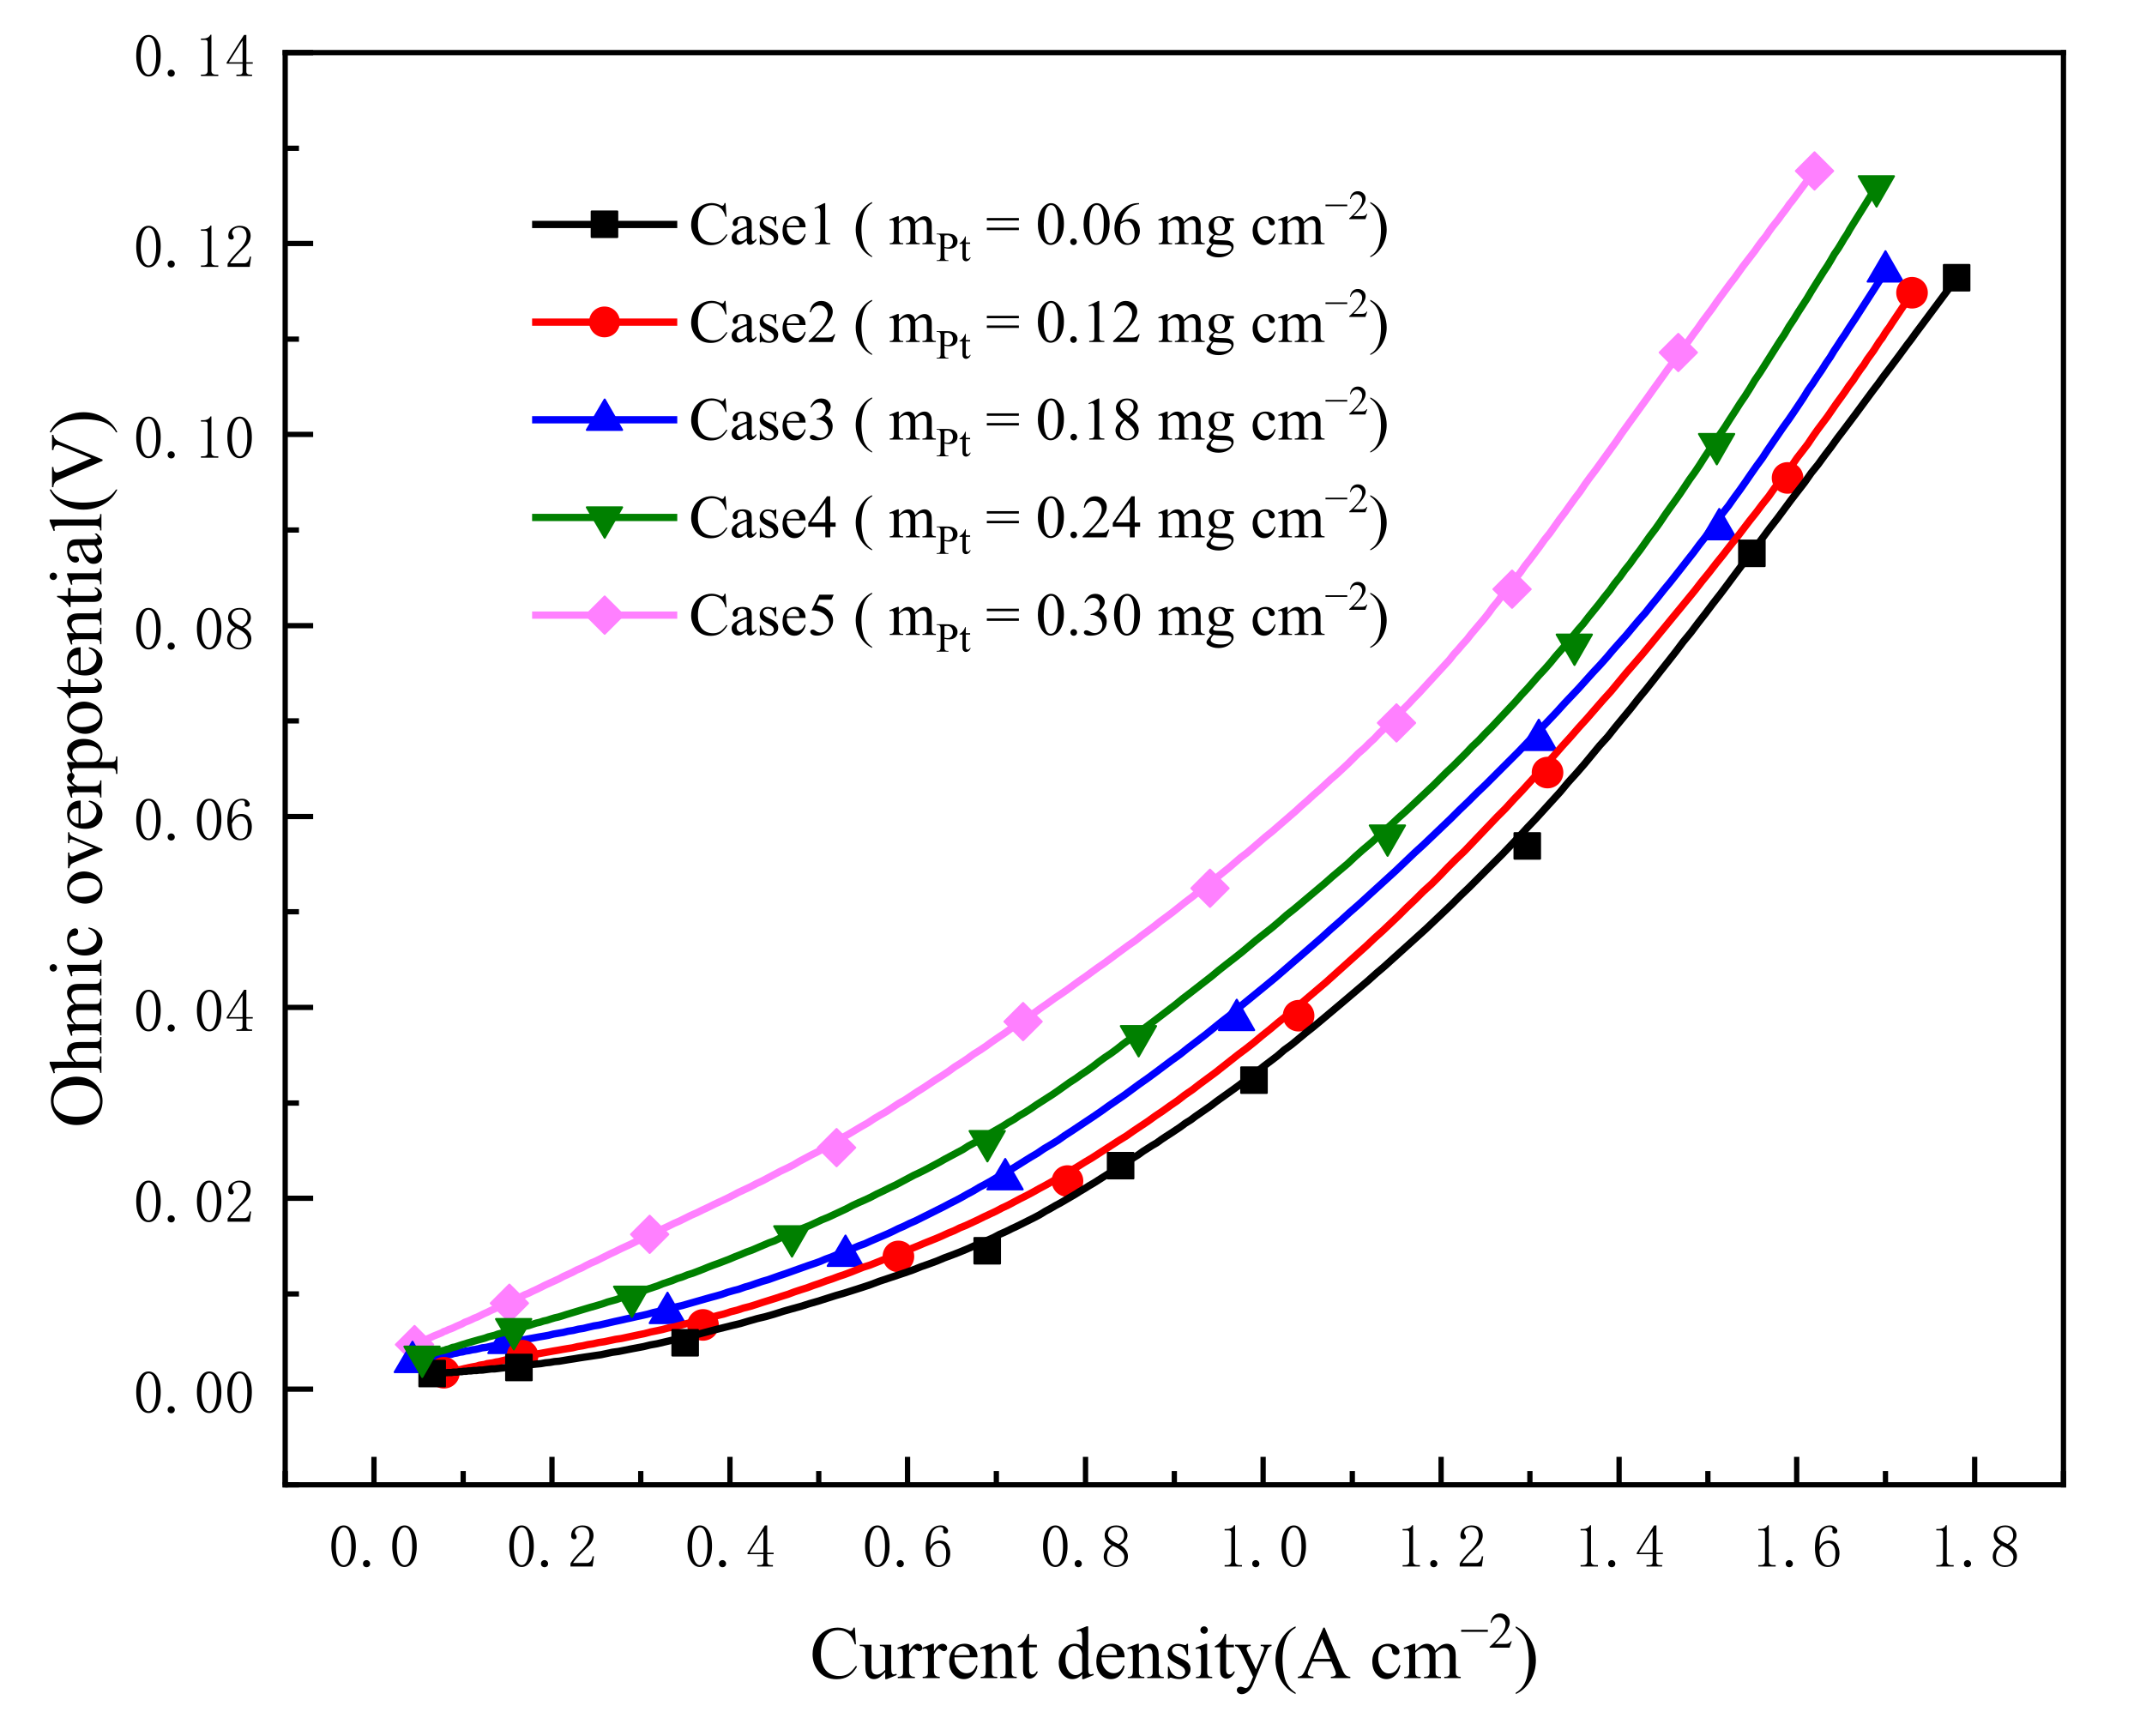
Figure 11.
Effect of ionomer volume fraction on cell performance.
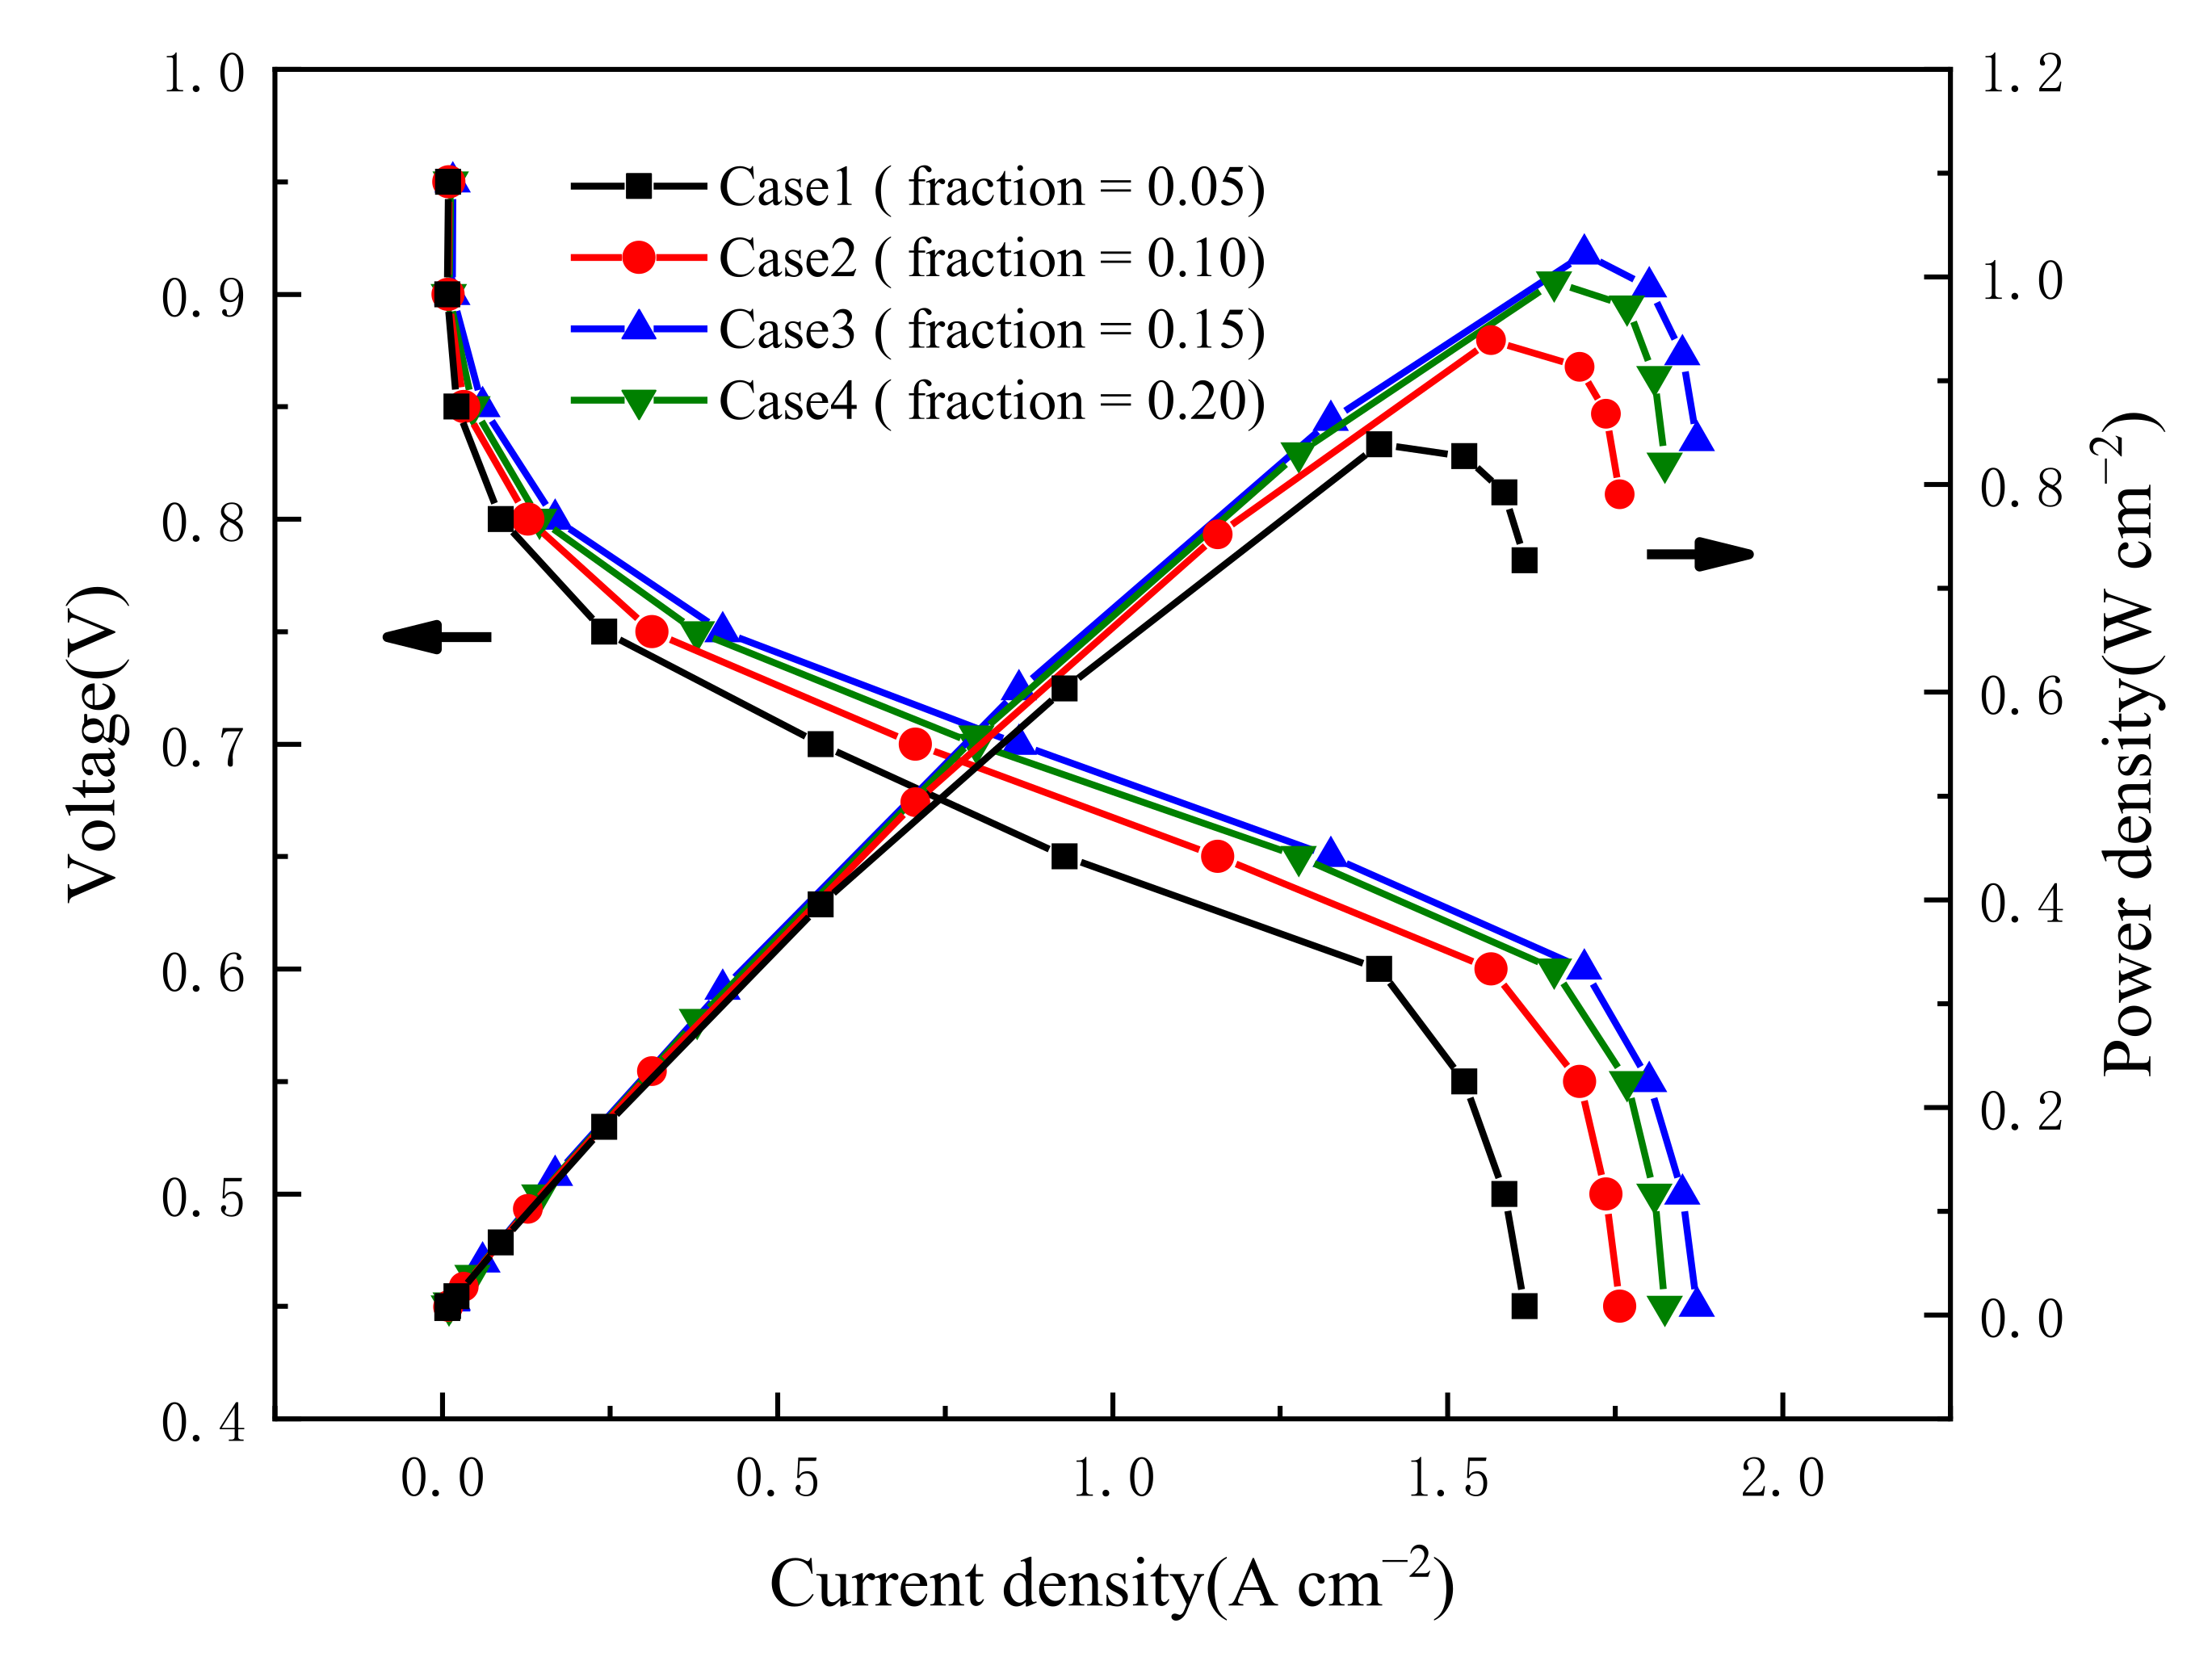
Figure 12.
Effect of ionomer volume fraction on Ohmic overpotential.
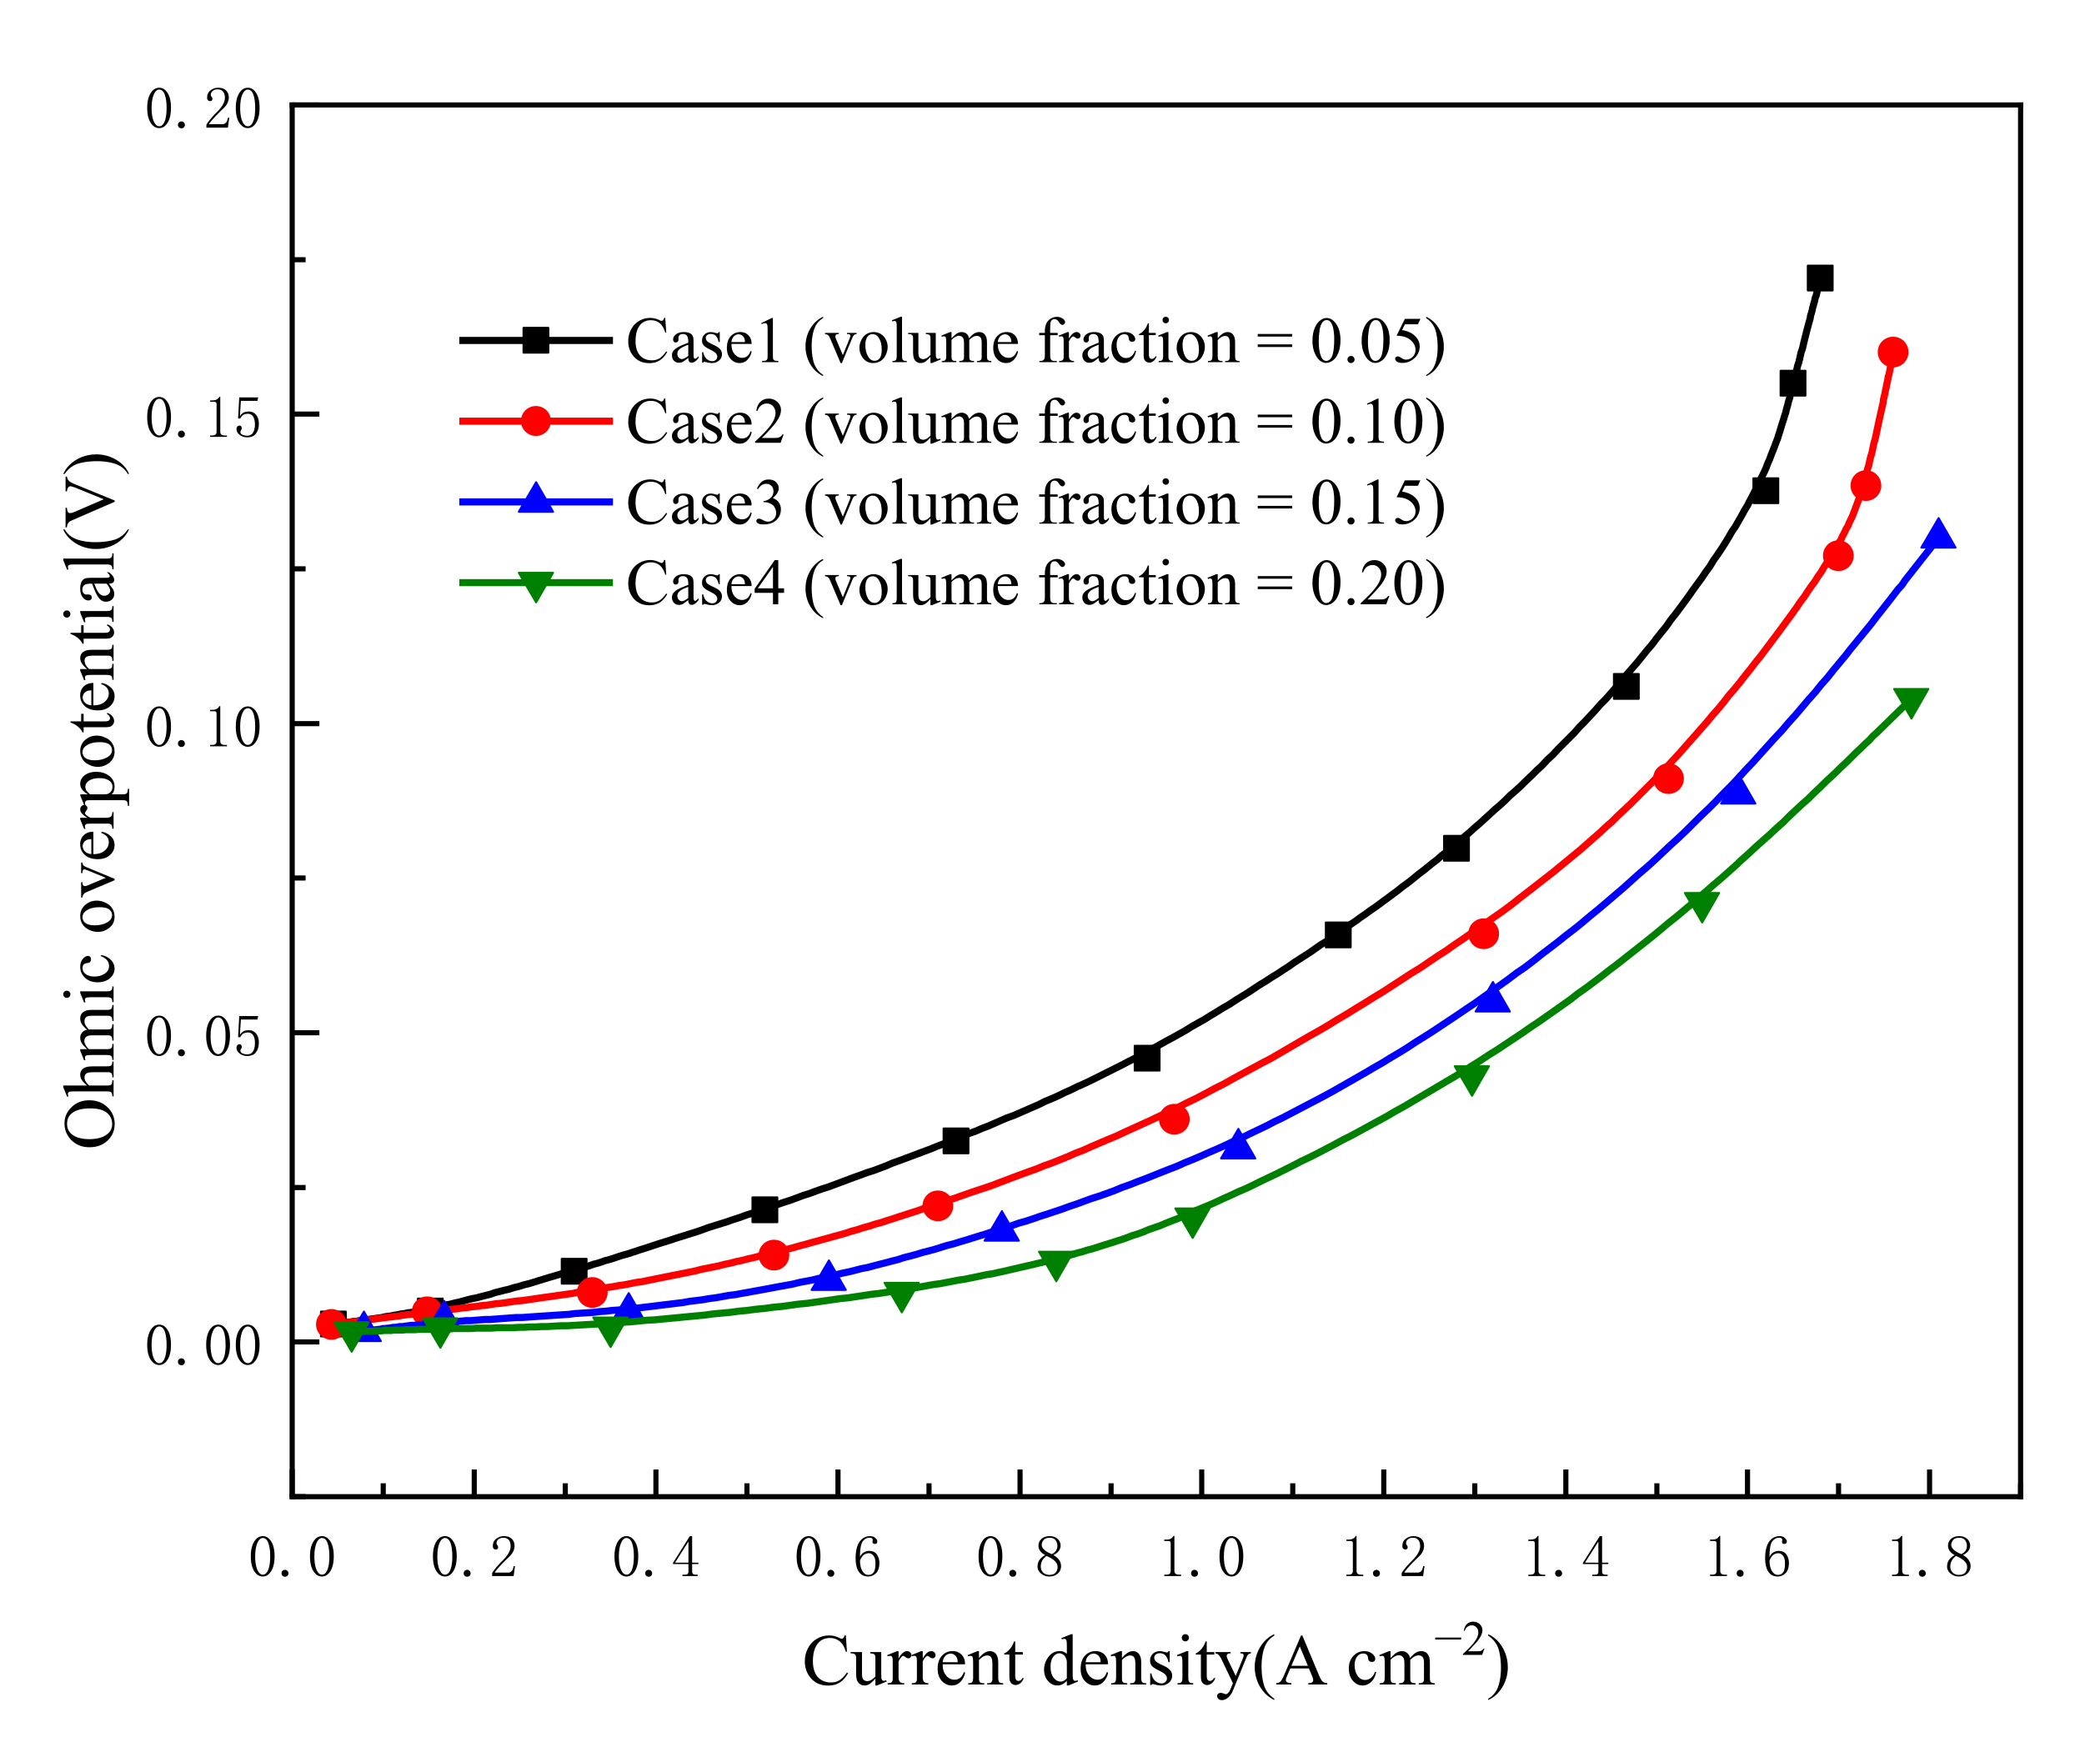
Figure 13.
Oxygen distribution in pores and in ionomer.
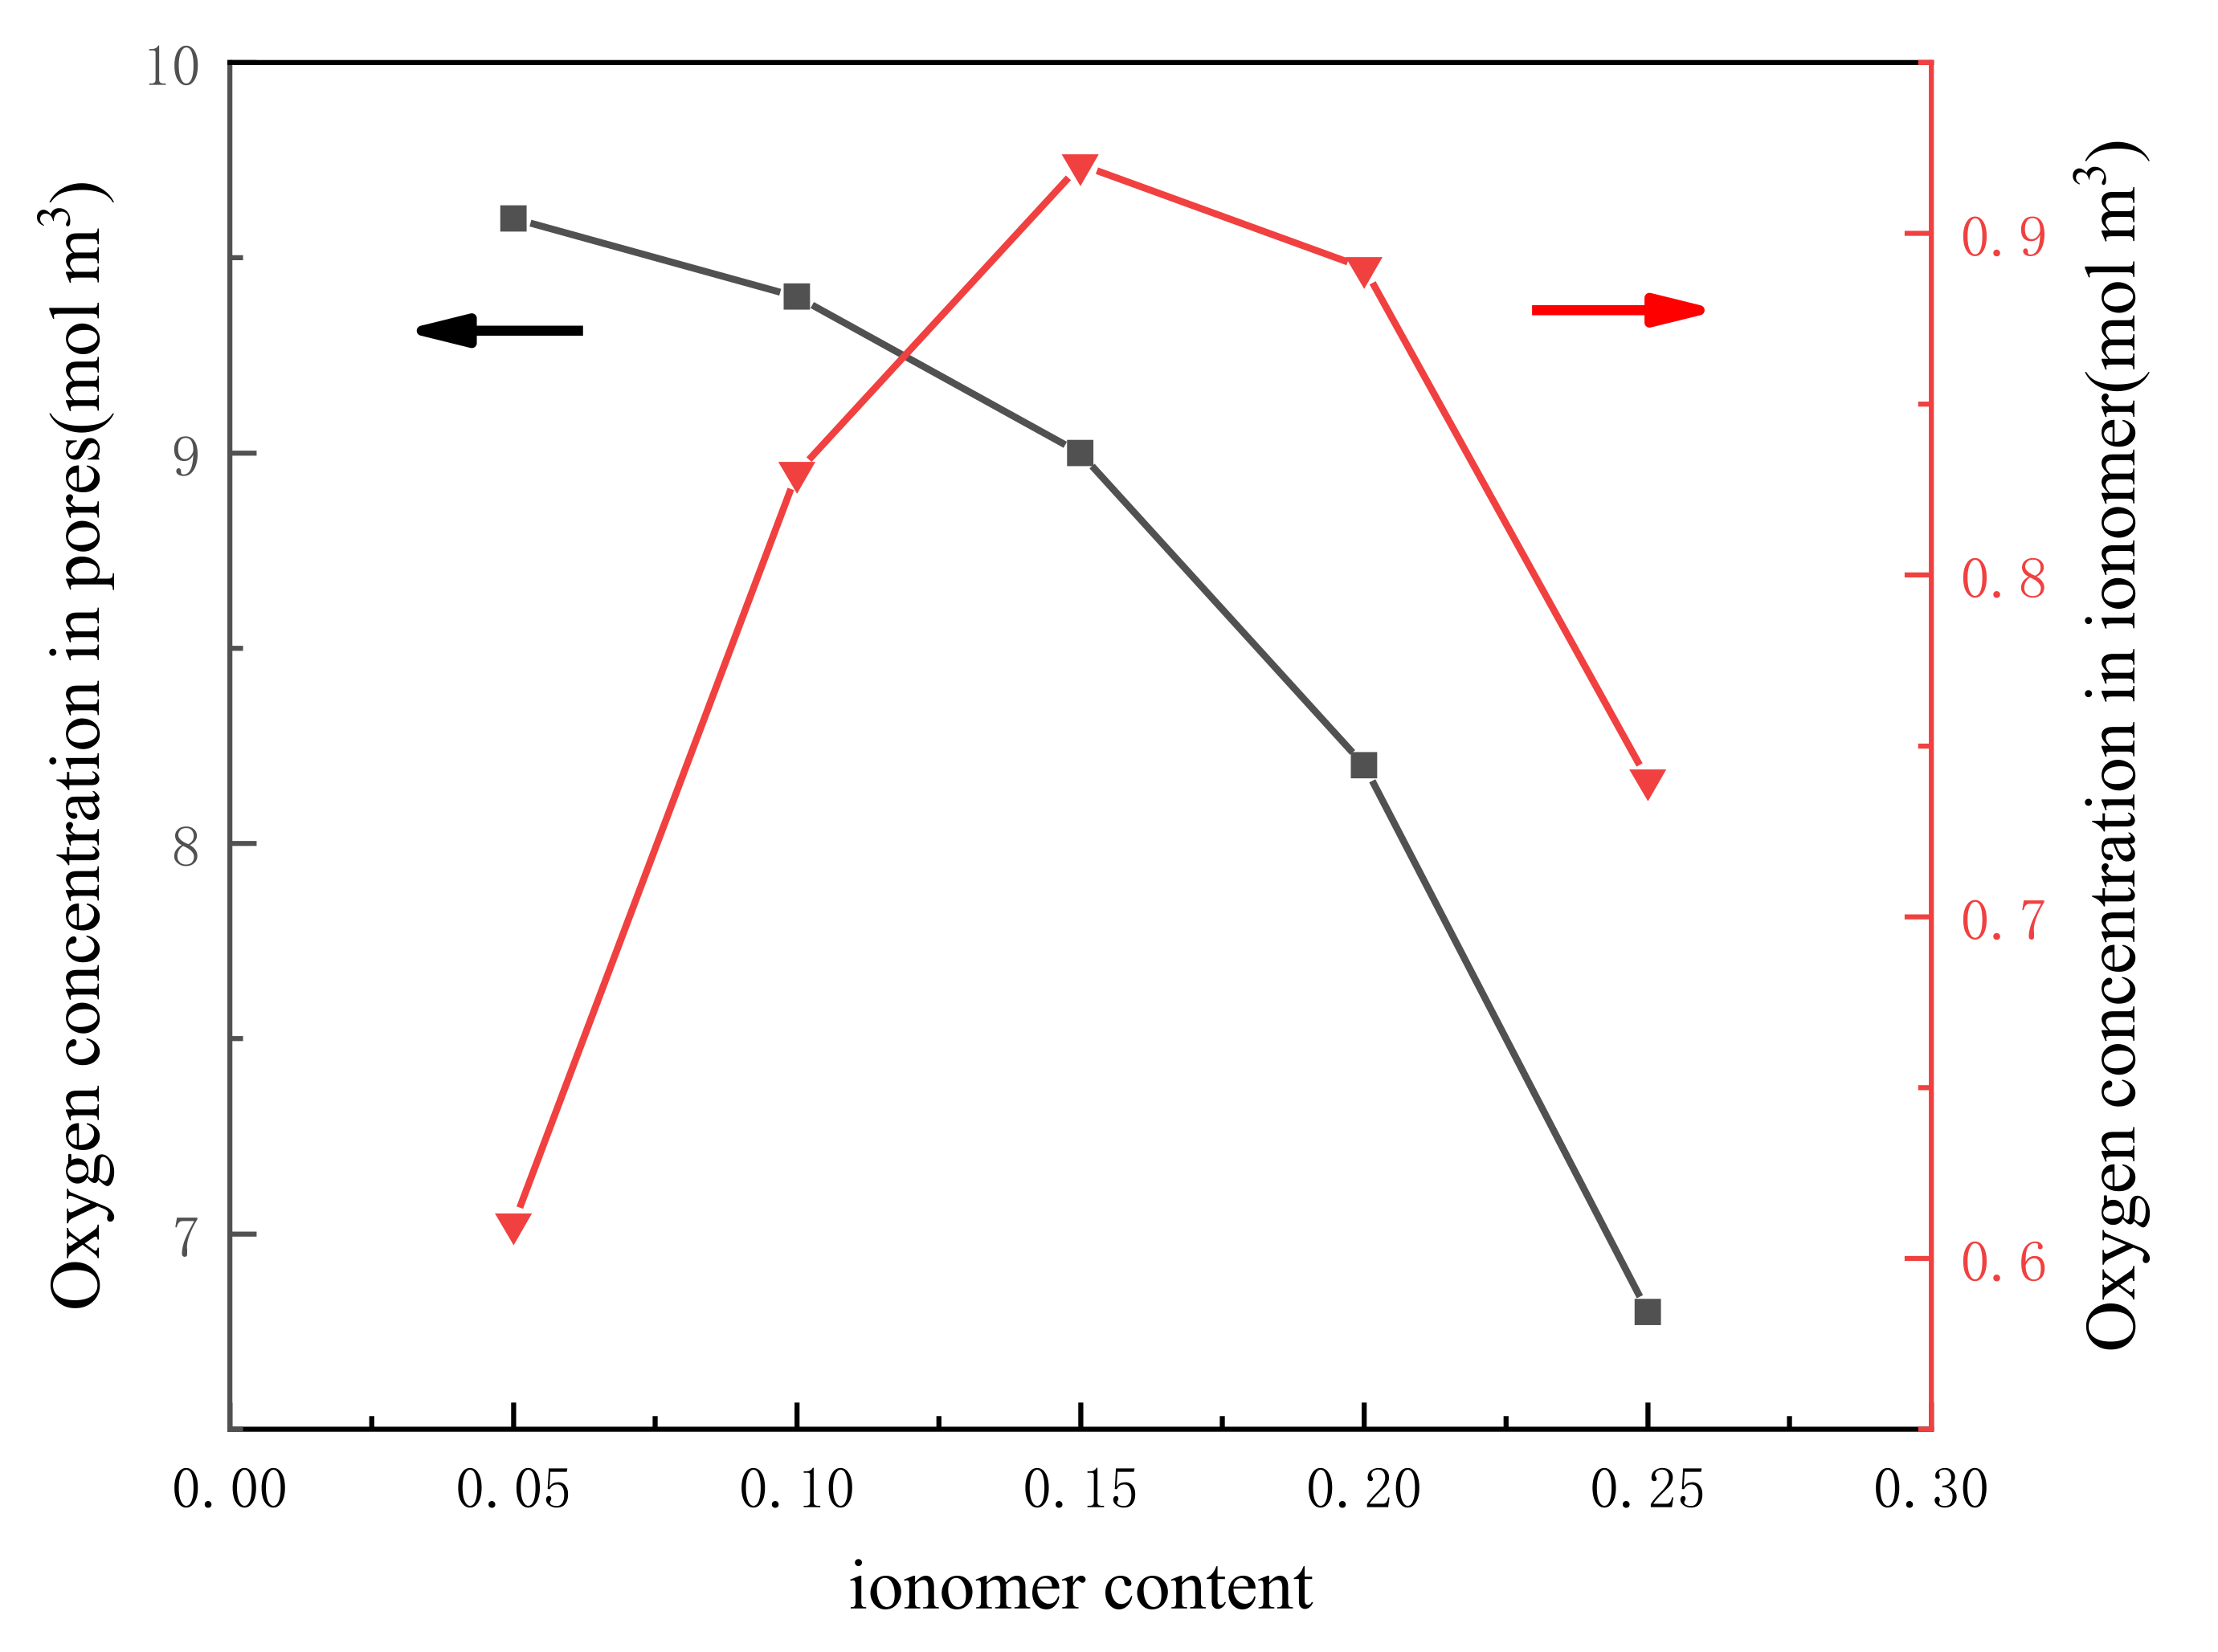
Figure 14.
Performance comparison of catalyst with (a) Nafion volume fraction of 0.10, (b) Nafion volume fraction of 0.15, (c) Nafion volume fraction of 0.20, and (d) Nafion volume fraction of 0.25.
Figure 14.
Performance comparison of catalyst with (a) Nafion volume fraction of 0.10, (b) Nafion volume fraction of 0.15, (c) Nafion volume fraction of 0.20, and (d) Nafion volume fraction of 0.25.

Table 1.
Comparison of the model used in this study with other models.
| Model | Advantages of the Model Adopted in This Study Compared with Other Model |
|---|---|
| Existing traditional model | Lower oxygen transmission resistance Higher utilization rate of Pt particles Lower production cost |
| Existing ordered catalyst layer model | Consider liquid water and ionomers The ordered submodel of the catalyst layer is coupled to the macroscopic model |
Table 2.
Physicochemical properties and operation conditions of model.
| Parameters | Value | Unit | Reference |
|---|---|---|---|
| Channel width; height | 1.0; 1.0 | mm | |
| Land width | 1.0 | mm | |
| BP length; width; height | 40; 2.0; 1.5 | mm | |
| Thicknesses of GDL; CL; MEM | 0.4; 0.011; 0.108 | mm | |
| Density of MEM | 1980 | kg m−3 | [32] |
| Equivalent weight of MEM | 1.1 | kg mol−1 | [32] |
| Porosity of GDL; CL | 0.6; 0.3 | / | [32] |
| Reference Concentration of anode; cathode | 12; 1.2 | mol m−3 | [30] |
| Diffusivity in water film | 3.032 × 10⁻⁹ | m2s−1 | [33] |
| Diffusivity in polymer | 6 × 10⁻¹⁰ | m2s−1 | [30] |
| Diffusivity in pores | 4 × 10⁻⁶ | m2s−1 | [30] |
| Henry law constant for oxygen | / | [33] | |
| Concentration Index of anode; cathode | 0.5; 1.0 | / | [34] |
| Evaporation rate constant | 100 | s−1 | [35] |
| Condensation rate constant | 100 | s−1 | [35] |
| Inlet gas relative humidity | 100% | / | [36] |
| Catalyst surface area per unit mass | 112 | m g−1 | [30] |
| Operating temperature | 353 | K | [36] |
| Proton conductivity | 7 | S m−1 | [30] |
| Pt nanoparticle radius | 2 | nm | Assumed |
Table 3.
Source term definitions.
| Parameters | Expressions |
|---|---|
| Source term in the mass conservation equation | |
| Source term in the momentum conservation equation | |
| Source term in temperature conservation equation | |
| Source term in component conservation equation | |
| Electron generation rate | |
| Proton generation rate | |
| Water vapor condensation rate |
Table 4.
Parameter definitions and physical property correlations.
| Title 1 | Title 2 | Title 3 |
|---|---|---|
| mixed density | kg·m−3 | |
| hybrid viscosity | kg·m−1·s−1 | |
| component mass fraction | ||
| effective thermal conductivity | W·m−1·K−1 | |
| effective gas-diffusion coefficient | m2·s−1 | |
| proton phase conductivity | S·m−1 | |
| capillary pressure | Pa | |
| water content | ||
| water activity | ||
| water vapor pressure | Pa | |
| water saturation vapor pressure | Pa | |
| penetration resistance coefficient | ||
| water content diffusion coefficient | m2·s−1 | |
| water back diffusion flux | kg·m−3·s−1 |
Disclaimer/Publisher’s Note: The statements, opinions and data contained in all publications are solely those of the individual author(s) and contributor(s) and not of MDPI and/or the editor(s). MDPI and/or the editor(s) disclaim responsibility for any injury to people or property resulting from any ideas, methods, instructions or products referred to in the content. |
© 2023 by the authors. Licensee MDPI, Basel, Switzerland. This article is an open access article distributed under the terms and conditions of the Creative Commons Attribution (CC BY) license (https://creativecommons.org/licenses/by/4.0/).
Share and Cite
MDPI and ACS Style
Ye, M.; Rong, L.; Ma, X.; Yang, W. Numerical Optimization of Triple-Phase Components in Order-Structured Cathode Catalyst Layer of a Proton Exchange Membrane Fuel Cell. Energies 2023, 16, 1623. https://doi.org/10.3390/en16041623
AMA Style
Ye M, Rong L, Ma X, Yang W. Numerical Optimization of Triple-Phase Components in Order-Structured Cathode Catalyst Layer of a Proton Exchange Membrane Fuel Cell. Energies. 2023; 16(4):1623. https://doi.org/10.3390/en16041623
Chicago/Turabian StyleYe, Miao, Long Rong, Xu Ma, and Weiwei Yang. 2023. "Numerical Optimization of Triple-Phase Components in Order-Structured Cathode Catalyst Layer of a Proton Exchange Membrane Fuel Cell" Energies 16, no. 4: 1623. https://doi.org/10.3390/en16041623
Note that from the first issue of 2016, this journal uses article numbers instead of page numbers. See further details here.