

Rock–Oil–Brine Dominant Mechanisms in Smart Water Flooding
by
 , , , and
Gustavo Maya
1,*,
Aurora L. Carreño Otero
1,*,
Fabián L. Monares Bueno
2,
Arnold R. Romero Bohórquez
2,
Farid B. Cortés
3,
Camilo A. Franco
3 and
Eduardo Manrique
1
1
ECOPETROL S.A., Piedecuesta 681012, Colombia
2
Grupo de Investigación en Química Estructural (GIQUE), Escuela de Química, Universidad Industrial de Santander, Bucaramanga 680002, Colombia
3
Grupo de Investigación en Fenómenos de Superficie—Michael Polanyi, Facultad de Minas, Universidad Nacional de Colombia Sede Medellín, Medellín 050010, Colombia
*
Authors to whom correspondence should be addressed.
Energies 2023, 16(4), 2043; https://doi.org/10.3390/en16042043
Submission received: 16 January 2023
/
Revised: 8 February 2023
/
Accepted: 16 February 2023
/
Published: 19 February 2023
(This article belongs to the Topic Enhanced Oil Recovery Technologies, 2nd Volume)
Abstract
:Recent research has highlighted wettability alteration as the main consequence of the different mechanisms involved in technologies such as adjusted brine composition water flooding (ABCW) and low-salinity water flooding (LSW). However, studies are still needed to give a phenomenological explanation, and the most influential components of the system (rock–oil–brine) must be clarified. This work focuses on determining the most relevant variables for the smart water effects to occur. Static (contact angles) and dynamic tests (coreflooding) were conducted. For the static tests, aged Berea slices, a specific crude oil (27° API, 10.5 cp at 60 °C), and mono and divalent inorganic salts (Na+, K+, Ca2+, and Mg2+/Cl−) were used in 3 different concentrations of 1000, 3000, and 5000 ppm (ionic strength variation between 0.015 and 0.06) to establish the wettability state by measuring the contact angles of the system. When salts containing chloride were evaluated, a decrease in oil wettability was observed at 5000 ppm. At 3000 and 1000 ppm, tendencies depended on the particular cation. Three brines were selected from the contact angle experiments to be used in coreflooding assays, considering a particular design to identify ion exchange from the rock–oil–brine system. The first assay was carried out in the absence of crude oil as a baseline to determine the ion exchange between the brine and the rock, and a second test considered crude oil to provide insight into ion exchange and its effect on displacement efficiency. Capillary electrophoresis was used in this research as a novel contribution to the systematic study of oil displacement tests, and it has proven to be a powerful tool for understanding the mechanisms involved. The results show that the variations in the concentrations detected in the displacement effluents were the product of the interactions between rock, oil, and brine since the concentrations measured in the absence of oil phase were comparable to those in the injection brine. Significant variations in the effluent ion concentrations were determined for the different brines used, and increases in the pressure differentials were observed for the KCl and CaCl2 brines. These results suggest that the oil–brine ion exchange (salting in/out) represents a relevant mechanism to explain the observed displacement efficiencies and differential pressures. The ionic enrichment of the water phase due to the salting in/out effect needs to be better understood.
1. Introduction
The U.S. Energy Information Administration (EIA) predicts that fossil fuels will provide a significant portion of our energy needs in the future [1]. It is worth mentioning that oil recovery processes can be divided into three steps. After the primary and secondary oil recovery operations, around 90–85% and 70–65% OOIP, respectively, a large quantity of oil remains unrecoverable and trapped in the reservoirs [2,3]. Different enhanced oil recovery (EOR) techniques, classified as thermal and nonthermal methods, stand out as attractive strategies to meet future energy demand [4]. Thermal EOR uses thermal energy to increase the reservoir temperatures, which decreases oil viscosity, specific gravity, and interfacial tension, facilitating oil flow. Nonthermal EOR methods are usually used for light to moderately viscous oils, and they seek to reduce the interfacial tension and to improve the mobility ratio. Most nonthermal methods require numerous laboratory studies for process selection and optimization, so they are less widely used than thermal EOR. Water flooding, gas injection, miscible and chemical flooding and other methods such as foam flooding, microbial, surfactant-steam, steam-foam, and alkali-surfactant-polymer (ASP) have been used successfully [5,6].
Low-salinity water injection has been proven to be a low-cost and eco-friendly technique to improve oil recovery since operational needs are similar to conventional water injection. This technique involves injecting brine with lower salinity than the brine present into the oil reservoirs [7,8]. Some authors have argued that this technology increases macroscopic sweep efficiency influenced by viscosity, heterogeneity, anisotropy, etc. Others have proposed microscopic sweep efficiency benefits attributed to interfacial and surface tension forces, capillary pressure, wettability, and permeability [9,10,11,12]. This strategy seeks to modify the distribution of oil and water in the porous media affecting capillary force, electrical properties, relative permeability, water and oil residual saturation, etc. [13,14].
Although it is accepted that modification of the rock-wetting properties to more water-wet increases oil recovery, the mechanism for this wettability modification is poorly understood and is one of the critical issues that still need to be clarified [2,15,16,17,18]. A significant number of research studies with both laboratory and field tests have been published, and more than a dozen mechanisms have been proposed in attempting to reach a common understanding [19,20,21]. Among the most important mechanisms are fines migration from clays, increased pH, interfacial tension reduction, multicomponent ion exchange (MIE), and the expansion of the ionic double-layer at the rock surface [10,22,23,24]. However, no mechanism has been conclusively proven. Therefore, a low-salinity process still needs to be properly designed or modeled.
Characteristics such as rock mineralogy, formation water concentration, organic crude oil components, initial wetting condition of oil reservoirs, and temperature, among others, should be considered when the salinity and ion composition of injected water are selected [25,26,27,28]. Determining these parameters is challenging in the field or even in laboratory conditions [29]. Because of this, many different approaches have been considered for rock (Berea, quartz, or glass), oil (with and without polar components), and brines (mono and divalent ions); however, a conclusive model has not been found [30,31,32,33].
To the best of our knowledge, the specialized literature has yet to find clear answers for the low-salinity mechanisms. This research seeks to understand the influence of different injection brines on the low-salinity effects for a particular rock–oil–brine system, delving into the mechanisms that generate these variations. Berea rock was used as a mineral model surface due to its high SiO2 content, the principal rock-forming mineral for Colombian sandstone reservoirs. In total, 3 different salt concentrations (1000, 3000, and 5000 ppm) were prepared with specific ions (Na+, K+, Mg2+, Ca2+, Cl−). Contact angle measurements were conducted on pretreated and aged Berea slices using Colombian crude oil and field brine (FB) from the same reservoir, understanding the wettability behavior. Coreflooding tests with and without crude oil were carried out to correlate with the contact angle results using a sequential mode in the same core sample for each displacement [34]. The rock–brine interactions in the presence (or not) of oil were tracked by the effluent’s inorganic and organic ionic composition using capillary electrophoresis (EC). This analytical technique represents an important contribution to coreflooding test interpretation. The results suggest that the oil–brine ion exchange (salting in/out) represents a relevant mechanism to explain low-salinity effects.
2. Experimental Section
2.1. Brines
Different brine solutions were prepared to assess the mono and divalent ion effect on wettability using single-component salts (NaCl, KCl, MgCl2, and CaCl2 reactive grade Merck products). Field brine (FB) obtained from a Colombian oil field was considered (Table 1). The FB concentration was 10,800 ppm (TDS), so 3 lower-concentration solutions were prepared (1000, 3000, and 5000 ppm) using the mentioned salts.
2.2. Crude Oil
All experiments used a 27 °API, 10.5 cP at 60 °C Colombian crude oil. The oil sample was dehydrated, centrifuged, and filtered to remove aqueous phases, suspended particles, and other possible contaminants. Characteristics such as SARA fractions, viscosity, API gravity, and acid number are presented in Table 2. It is important to mention that the crude oil used comes from a sandstone formation with carbonate cement (marine depositional environment), which means that the oil had been in contact with divalent cations over geologic periods [35]. The crude oil also shows a significant amount of naphthenate (0.9 to 9.6 %vol) in a wide range of distillation temperatures (350–650 °F) and identified in the water phase of smart water experiments reported by Maya et al. [7,8].
2.3. Rock Samples
2.3.1. Berea Slices
Berea rock chemical characterization is listed in Table 3. Berea cores were dried, cut, and smoothed with fine sandpaper to obtain a flat slice face with a 1.5 in diameter for this procedure. The slices were cleaned using an ultrasonic bath cleaner filled with deionized water and then dried in an oven at 105 °C until gravimetric variations were less than a relative percentage difference (RPD) of 5. Each slice was kept separately in FB at 60 °C until weight variations were not significant. Then, the rock samples were transferred to glass cells filled with crude oil at the same temperature until a constant weight was reached from 18 to 21 days. Each slice was then immersed in a specific brine solution under the same laboratory conditions for 16 days, and contact angle measurements were performed.
2.3.2. Berea Samples
Berea core plugs were also used to investigate the impact of altering the salinity and ionic composition of the injection water on fluid–fluid and fluid–rock interactions and oil recovery. Two core plugs were used and were taken from the same sample to perform displacement tests with and without oil. The main properties of the Berea samples used for contact angles and displacement tests are presented in Table 4.
2.4. Contact Angle and IFT Measurements
Contact angle and interfacial tension measurements were carried out on an Optical Contact Angle instrument (OCA 15 and OCA 25 PM-750, Dataphysics (Filderstadt, Germany) at ambient conditions (Figure 1). A specially shaped dosing needle with a Luer lock connector made of stainless steel and special optical cuvettes were used for contact angle measurements of captive drops or bubbles of nonmiscible liquids on substrates. A video measuring system with a high-performance USB camera combined with a high-resolution 6.5-fold zoom lens ensures pin-sharp drop images and facilitates the analysis of the deposited drops. These characteristics and the surface contact angle (SCA) software module allow for measuring static and dynamic contact angles on plane, convex, or concave surfaces and determining surface and interfacial tensions according to the pendant-captive drop method based on Young-Laplace evaluations. This equation relates the capillary pressure to surface tension and the principal radii of curvature of the interface between two immiscible fluids.
2.5. Coreflooding Tests
Contact angle results of the aged Berea slices were considered to design the coreflooding tests. A schematic representation of the coreflooding equipment is presented in Figure 2. Sodium, potassium, magnesium, and calcium brines and Berea plugs (Table 4) were employed. Synthetic formation water was prepared (ionic strength IS of 0.18, NaCl 6966 g/L, KCl 0.155 g/L, MgCl2 0.514 g/L, and CaCl2 1359 g/L) and employed during the plug saturation. The potential interactions between the Berea and the selected brines were evaluated in a displacement carried out in the absence of crude oil. This coreflood provided the baseline of brine–rock interaction compared to a similar test, including the oil phase. The same injection times, pore volumes, and experimental conditions were used in the second test with crude oil.
For the displacement efficiency tests, about six pore volumes (PV) of FB were injected to obtain the system’s absolute permeability to restore irreducible oil saturation before resaturating the rock sample with oil. Crude oil was injected to restore the rock and to find the effective oil permeability (Koe) to irreducible water saturation (Swir). After that, FB was injected to obtain displacement efficiency. When the oil production ended and the pressure drop was steady again, the effective water permeability to residual oil saturation was obtained (Kwe @ Sor). Next, the system was resaturated with oil, and the displacement efficiency with one of the selected brines was performed while collecting the effluents. The same protocol was followed to evaluate the other two brines, starting with the injection of FB followed by crude oil. Figure 3 summarizes the injection sequence followed in the experimental protocol.
2.6. Capillary Electrophoresis (CE)
Ionic determination analyses were accomplished using a CESI 8000 Plus High-Performance Separation System employing a fused silica OptiMS capillary cartridge (50 cm total length, 75 μm ID). SCIEX Cation and Anion Analysis Kits contained the necessary supplies to separate and quantify different ions using the P/ACE MDQ plus Capillary Electrophoresis Systems. Whereas the cation kit identifies and quantifies sodium, potassium, lithium, magnesium, and calcium ions, the anion kit allows for the analysis of chloride and low-molecular-weight organic acid anions. Since these ions are often UV-transparent, buffers containing a chromophore were used, and detection was achieved indirectly. The great advantage of EC is that these analyses can be developed using only 20 μL each. The basic procedure for performing the analysis is summarized below:
Effluents from the different corefloods are taken every 0.25 PV and filtered through 0.22 microns.
Determine the conductivity and pH. If needed, the pH needs to be adjusted (5 > pH < 6.5) as a requirement of the analytical technique.
Samples must be diluted to analyze cations (max. 50 ppm) and anions (max. 200 ppm).
After completing the procedure, the technique can automatically run a set of 25 samples. Duplicate random analyses were also performed. Although the absolute and relative errors are specific for each ion, both errors are equal to or below 0.66 and 3.30%, respectively.
3. Results and Discussion
Protocol considerations. Many authors have postulated diverse mechanisms to understand and determine the phenomena and properties responsible for the EOR in low salinity. Different rocks, crude oils, and brines in each experimental methodology can explain the contradictory results published. Sandstone reservoirs have shown remarkable potential for implementing smart-water-type projects. Sandstone contains clays and minerals (e.g., kaolinite, chlorite, illite, montmorillonite, anhydrite, calcite, feldspars, and mica) in different contents. Different authors have studied the clay’s effect on porous media and EOR processes [22]. Some clays, such as montmorillonite, tend to swell, and some, such as kaolinite, tend to migrate, reducing the absolute permeability of the porous. In CEOR, clays play a fundamental role because they can repeal or degrade chemicals such as surfactants or polymers and even generate effects such as emulsions.
Chemically, clay–water interactions could be written as in Equation (1), which, in addition to the destabilization of the clays, could cause phenomena such as a local increase in pH or expansion of the double layer [23].
However, recent studies have reported that the low-salinity effects (LSE) can be observed even in clay-free sandstone rocks. Some studies consider Berea sandstone a standard model material in its experimental approaches. In this research, contact angle evaluations were carried out in Berea sandstone slices. Each slice was previously placed in contact with crude oil and prepared brines. Later, the obtained results were used to design coreflooding experiments that allow an understanding of the mechanisms involved in smart water flooding.
3.1. Effect of Droplet Size and Stabilization Time on Contact Angle
The angle between solid–liquid and liquid–liquid interfaces was evaluated under the wettability regimen adapted from dos Santos et al. [36]. This regimen considers contact angles from 0° to 70° as a water-wet surface, 70° to 110° as neutral, and 110° to 180° as an oil-wet surface. As a schematic reference, Figure 4 presents oil droplets on cleaned quartz (120°), crude oil aged Berea (90° and 70°), and formation water treated Berea (30°).
The Berea slices used in our study were aged in FB at 60 °C until no significant changes in their weight were observed. Then, the contact angle of a representative number of slices was measured, and an initial average angle (ϴi) of 28.9° ± 1.3 was measured. This low ϴi value, found for droplet volumes up to 90 µL, showed that the Berea surface has a high hydrophilic character, explaining its water-wet behavior. After crude oil aging, contact angles were determined by evaluating different oil droplet volumes in formation water. In all cases, the right and left contact angles of each drop formed were determined. Those with significant differences were discarded. These variations were attributed to uniformities in the evaluated porous surfaces. Differences found for volumes below 10 µL were assigned to the addition of tiny droplets deposited on the drop surface that can significantly change the evaluated volume and affect the detected contact angle. Although this phenomenon can occur in all the drop sizes assessed, the resulting variation did not seem significant for those greater than 10 µL (Figure 5). Although measurements at 10 µL were shown to be independent of the droplet size, 20 µL was selected for this research. These results are in agreement with Aslan, Fathi & Firoozabadi [37]. As they emphasized, there are few systematic studies on this matter, so these results are an essential contribution.
Another evaluated parameter was the droplet stabilization time placed onto the Berea slices using a special J-shaped dosing needle. Contact angles on FB-aged Berea slices using FB and 1000, 3000, and 5000 ppm NaCl were recorded after stabilization times of 0, 0.5, 2, 24, and 36 h (Figure 6). After 24 h of evaluation, contact angle values showed a plateau, and a reduction of the standard deviation values was observed. Lines connecting the data points in the figures were placed to facilitate observation of their trends.
This evaluation showed that under these conditions, the 3000 NaCl ppm brine increased the contact angle to 52° (at 24 h), whereas 5000 ppm NaCl and 1000 ppm NaCl brines reached 29.2° and 31.6°, respectively. Field brine (FB) developed at 41.3° (at 24 h) without significant changes during the evaluation. This result indicates that using 3000 ppm NaCl brine could promote a notorious change in the rock’s wettability state; furthermore, the differences between the values at every concentration indicate that the smart water effects are ion dependent. Still, longer evaluation times are required to see this effect in laboratory conditions.
3.2. Effect of Brine Concentration on Contact Angle
After crude oil aging, all Berea slices were placed in sealed containers with brines of different concentrations for 16–18 days at a reservoir temperature of 60 °C. This study considered 4 brine solutions containing single-component salts (NaCl, KCl, MgCl2, and CaCl2), and each one was evaluated at 3 different concentrations (1000, 3000, and 5000 ppm).
As shown in Figure 7, NaCl brine presented the highest contact angle variations when chloride ions were evaluated. The initial 41.3°, when FB was used, decreased to 29.2° (−12.1°) for 5000 ppm NaCl brine and 31.6° (−9.7°) for 1000 ppm NaCl brine. However, using 3000 ppm NaCl brine, the contact angle increased to 52.6° (+11.3°). A similar trend was observed for the KCl brines; however, none of the concentrations tested for this salt generated a more oil-wet state. CaCl2 and MgCl2 brine developed more water-wet angles, except for 1000 ppm Ca brine, which led to a slightly more oil-wet surface. Again, these results indicate that the smart water effects are ion dependent.
Based on the results obtained from the contact angle determinations, it can be concluded that the differences of all chloride salts evaluated, except for NaCl, show contact angle variations below 12.4° in the salinity range tested (1000 to 5000 ppm). NaCl shows higher contact angle variations (up to 30°) in the same concentration range. It is worth noting that both monovalent cation salts (NaCl and KCl) show an important change in contact angles around 3,000 ppm, which was not evident when testing Ca2+ or Mg2+ salts. However, understanding this behavior is beyond the scope of this study. It is worth noting that MgCl2 showed the lowest change in contact angles (<4°) in the salt concentration interval studied.
Effect of Brine Concentration on Interfacial Tension (IFT): Oil–Brine Tests
Oil–water interfacial tensions for all the brines considered were determined (Table 5). For deionized water (DW) and field brine (FB), 35.24 ± 0.14 mN/m and 30.06 ± 0.14 mN/m were found, respectively. These values suggest that the crude oil sample used in this study was not contaminated with flow assurance chemicals or corrosion inhibitors. The IFT measured for the brines under investigation did not show significant differences compared to those measured for the FB and DW, and the differences are within the experimental error. The latter indicates no major impact on IFT changes in the type or concentration range of the chloride salts studied. Therefore, it is difficult to justify the increase in oil displacement efficiencies due to these marginal IFT changes.
3.3. Coreflooding Tests
The results obtained for oil–brine IFT (Table 5) do not allow the selection of a specific brine for the coreflooding tests. Considering the contact angle values (Figure 7), the 1000 ppm MgCl2, 1000 ppm KCl, and 2000 ppm CaCl2 were selected to run corefloods to evaluate salinity effects one order of magnitude below the field brine. CaCl2 concentration intends to maintain the concept of low salinity while analyzing changes to more water-wet states at similar contact angle values. A first coreflooding was carried out in the absence of crude oil, without considering the oil stages shown in Figure 8; this allows us to construct a baseline to compare with the ionic composition due to possible fluid–rock interaction when crude oil is in the system. After the cleaning and drying, core plug porosity and permeability were calculated. The coreflooding test consisted of an oil recovery evaluation in secondary mode. The conditions for the displacement tests are presented in Table 6.
The first step includes the core saturation with field brine (FB) under a confining pressure of 2000 psi for displacement efficiencies. The core permeability to the brine was calculated (460 mD, 17.4% less than the original Klinkenberg permeability; Table 4). The first displacement efficiency was developed using FB, which is considered the reference case for the experiments in the presence of oil. Then, the selected chloride brines were evaluated. It is essential to mention that before the injection of each brine, the system was carried to initial conditions flooding field brine and saturating with crude oil (Figure 8). The results of the different displacement efficiencies are summarized in Table 7.
No additional crude oil production was observed when FB was injected after each low-salinity brine. This result indicates that increasing the brine concentration after a low-salinity injection does not generate additional oil production, meaning no further oil mobility occurs as a tertiary recovery method, at least for the two salts considered (MgCl2 and KCl 1000 ppm). During the first three pore volumes injected (PVi) of KCl and CaCl2, a significant increase in system pressure was observed. For the CaCl2 brine, a maximum of 8.0 psi was reached close to the first PVi (Figure 9). The values observed in the differential pressure for each test show correspondence with the displacement efficiencies obtained. The Ca2+ and K+ ions generate fluid–fluid or/and fluid–rock effects that cause more significant oil displacement with a larger pressure constraint for CaCl2 than KCl. The drastic change in the type and concentration of the brine required more than 4.0 PVi for the differential pressure stabilization.
Differences in oil recovery, such as those observed in Table 7, can be associated with changes in the wettability condition of the rock. The different ionic characteristics of the injection waters considered (Table 8) in this study could alter this variable; however, the lack of clay content of the Berea sandstone makes it unlikely.
From these experiments, it is suggested that the injection of lower-salinity brines causes an important change in the rock toward less water-wet due to the decrease in the Swi (6.5 to 16.1%) with respect to the injection of FB. However, this apparent change in wettability can also be influenced by the formation of in situ dispersions, explaining the higher differential pressures (ΔP). This effect is more pronounced during the injection of KCl and CaCl2, where the highest ΔP and lower Swi were recorded. Maya et al. reported that this oil is prone to form spontaneous dispersions (water in oil emulsions) when exposed to low-salinity brines [8]. Additionally, Maya et al. also reported high ΔP when diluting the same field brine (FB) with deionized water (DW) using a Berea core and the same oil considering a different experimental protocol [7]. A relevant observation from these displacement efficiencies is that neither the FB (DE1) nor the MgCl2 (DE2) low-salinity brine suggests any fluid–fluid or fluid–rock interaction regardless of the salinity contrast (one order of magnitude) under the evaluated conditions. Therefore, to explain the importance of the oil phase in low-salinity and smart water flooding, all coreflood effluents with and without oil were collected to perform ionic composition analysis using CE, as described in the following section.
3.4. Ionic Analysis
Anion and cation profiles for each effluent and the prepared brine before injection were determined using a CESI 8000 Plus system. Initial brine concentrations before injection are presented in Table 8. It is important to mention that the injected brines’ ionic composition is represented with dashed lines in the figures describing the results of each coreflood.
3.4.1. Coreflooding Displacement in the Absence of Oil–Fluid–Rock Interaction Evaluation
For the proposed corefloods, the injection, restoration, saturation time, injected brine concentrations, and type and characteristics of the used rock were kept constant throughout the experiment. The ionic composition obtained during the corefloods without the oil phase generates a baseline to analyze those obtained during the displacement efficiencies in the presence of oil. The results of the ionic composition of the effluents of all the experiments will be discussed in three groups. First, the chloride concentration (Figure 10) will be discussed, followed by the monovalent cations (Figure 11) and divalent cations (Figure 12), respectively.
Anionic determination in different coreflood stages showed that the produced chloride concentration was similar to the injected concentration (Figure 10). The chloride injection and production profiles show a reasonably good correlation through the whole sequence of displacement tests (≈110 PVi). The delays observed during the change from FB to low-salinity brines to FB are related to the time required to displace the previous brine injected and to the dead volumes of the coreflood system.
When switching from FB to specific low-salinity brines, the dilution effects are evident, given the differences in salinities (Figure 10). It is also clear that the absence of sodium in the produced fluids confirms the replacement of FB in the core plug (Figure 11). This statement is based on the fact that sodium was not injected in either of the low-salinity brines used in this study (Table 8). Changes in sodium concentration during the shift from FB to low-salinity brines to FB follow a similar trend to that observed for chloride. However, it is noticeable that the potassium concentration took about 6 PVs to reach the injected concentration of 524, 3 ppm (Figure 11). Although this result may suggest some level of fluid–rock interaction between the KCl and minority minerals (i.e., microcline, plagioclase, kaolinite) present in the Berea core (Table 4), the cation exchange capacity of Berea is low due to its high quartz content. This behavior was not evidenced during the injection of MgCl2 or CaCl2. In these cases, Na+ reaches values close to zero faster after all the FB is displaced by the divalent cation salts injected (Figure 11).
Figure 12 shows the injection and production of divalent cations (Mg2+ and Ca2+) during the whole sequence of the corefloods injecting FB and low-salinity brine in the absence of oil. In this case, magnesium and calcium require large pore volumes to reach their injected concentrations due to both cations’ presence in the FB. However, it is evident that after several PVi, Ca2+ is not detected with the injection of MgCl2, and Mg2+ is not detected when CaCl2 is injected. This behavior is more evident during KCl injection, where after ≈14 PVi, divalent cations are not detected until the end of the flood.
Based on the composition and concentration of the injection and produced brines, the Berea core plug does not show strong evidence of major brine–rock interactions. The Berea rock can regulate the increased and decreased injected concentrations but does not suggest strong cationic exchange with the injected brines. From the coreflood experiments in the absence of crude oil, it can be inferred that the salinity of preflush brine plays an important role in the rock’s ion conditioning. The latter can explain the large volumes of low-salinity brine to displace divalent cations from the FB.
Due to Berea sandstone’s mineralogy and experimental conditions, the low level of brine–rock interactions observed in these single-phase corefloods are expected. These results agree with Farajzadeh et al. using Berea core samples and similar brines and temperature (60 °C) [38]. This research concluded that brine–rock cation exchange is insignificant under the experimental conditions evaluated. Understanding the basic brine–rock interactions of single-phase corefloods, the next section will demonstrate the importance of the oil phase in the system, considering the same experimental protocol verifying the ionic composition of the effluents using CE.
3.4.2. Coreflooding Displacement: Crude Oil–Rock–Brine
Figure 8 and Table 7 summarize the experimental protocol followed and the results of the displacement efficiencies, respectively. The results of these tests will be discussed following the sequence from DE1 to DE4 (Table 7 and Table 8). The ionic composition of the injected brines is represented with dashed lines (Figure 13, Figure 14, Figure 15 and Figure 16) to facilitate the interpretations of the effluent analysis of each coreflood. Figure 13 shows the first displacement (DE1) results performed with field brine (FB). Its composition is presented in Table 8. This experiment is compared with the first FB of the single-phase corefloods (Figure 10, Figure 11 and Figure 12), consisting of approximately 27 PVi. For this test, the concentration of the main ions of the injected and produced brine showed some deviations. Chloride anion shows a decreasing trend after one PVi. Beyond that point, Cl− stayed close but for most of the flood above (300–1465 ppm) the injected concentration. This trend was consistently observed but at different levels when injecting different brines, as described in this section. Regarding the elution of cations injected, sodium also showed a slight decrease at the early stages of the coreflood. After the first PVi, Na+ remained reasonably close to its injected concentration (3166 ppm) for 3.5 PVi when it started to decrease except for the last sample analyzed.
Calcium was otherwise always produced above (45–283 ppm) its injected concentration throughout most of the flood (503 ppm; Table 8). The results of this displacement are reasonably in agreement with the FB injection in the absence of oil, where the effluents showed similar injected and produced ion concentrations after approximately 20 PVi suggesting a low ionic exchange between FB and the Berea rock, except for potassium and magnesium. K+ and Mg2+ concentrations were slightly higher in a reduced amount of eluted fluid than in the injection brine. However, K+ concentration was consistently identified (330–377 ppm) at the end of the flood, even though this element was not injected in the field brine (Table 8). Fluctuations in the concentrations of all ions are considered reasonable. The low differential pressures recorded during this coreflood (Figure 9) support a reduced level of interaction in this oil–brine–rock system. Therefore, DE1 will be viewed as the baseline to compare the behavior of effluent ionic composition and concentration for displacement efficiencies using different brines.
After the DE1 test and the FB displacement, the Berea plug was restored with crude oil to continue with a displacement efficiency using a 1000 ppm MgCl2 brine (DE2), as depicted in Figure 14. To better capture the ion concentration elution of injection and production brines, field brine (FB) initial concentrations were not included in the figures due to the broad differences with lower-salinity brines tested. The most surprising observation was the abrupt reduction of Cl− and Na+ concentration (0.25 PVi, not shown in Figure 14 due to the scale). The decrease when shifting from FB to the lower-salinity MgCl2 brine occurred 1.75 PVi earlier than the experiment in the absence of oil (Figure 10 and Figure 11). However, despite the contrast of chloride concentration (difference of 5437 ppm between DE1 and DE2), the effluents of this test showed Cl− concentrations 75% higher than the injected brine (791 ppm; Table 8). This result differs from that obtained during the displacement with FB (Figure 13) and even more with the coreflood without crude oil (Figure 10).
On the contrary, magnesium concentration was constantly below the injected concentration (255 ppm), suggesting a possible cationic exchange with the oil phase, which can explain the composition of the effluents. The high concentration of cations (Na+, K+, and Ca2+) not included in the injected brine represents one of the most relevant findings of this test. A high concentration of these cations can be expected at the flood’s early stages due to FB displacement by MgCl2 (dilution effects). However, the elevated concentration of ions in the produced water is sustained after approximately 4 PVi when Cl−, Na+, and Ca2+ start showing a decreasing trend. Comparing the results of DE2 with the ionic concentrations and composition of the effluents of the experiment in the absence of oil (Figure 10), it is suggested that the identification of ions not present in the injection brine is produced from the crude oil. In this case, the low-salinity Mg2+ brine promotes the liberation of Na+, K+, and Ca2+ ions from the system, which did not happen in the single-phase corefloods. The observed brine–oil cationic exchange does not suggest the possible formation of in situ dispersions based on the displacement efficiency (Table 7) and differential pressures (Figure 9) obtained in this experiment. However, this will be further discussed at the end of this section.
After reaching irreducible oil conditions with MgCl2, the following step of the coreflood test was to resaturate the Berea sample with FB and restore with crude oil until reaching Swi conditions. In this stage, approximately a 61% reduction in the Swi compared to the first test with FB was obtained (Table 7), suggesting an important wettability change generated during the sequence of the corefloods. At this stage begins the displacement efficiency with 1000 ppm KCl brine (DE3). The ionic composition of this test is shown in Figure 15.
For the displacement efficiency with KCl (DE3), the rapid salinity reduction is also evidenced and is a consequence of the injection of a lower-salinity brine compared with the FB. This behavior was similar but slower to that observed during the previous displacement efficiency (DE2). However, the ionic composition profiles depicted in Figure 15 clearly show a different response than the injection of MgCl2 (Figure 14). The most relevant interpretations from the effluent’s composition are summarized below:
- Chloride and sodium dilution effects are observed. However, Cl− concentration in the effluents reached the injected concentration after 1.5 PVi, showing a slight increase during the second half of the flood (up to 53 ppm above the injected concentration). This behavior is similar to the one observed during the experiment without oil (Figure 10).
- Potassium concentration showed a similar trend to that observed during the coreflood test without oil. However, the injected concentration was reached faster (≈3.5 PVi) when the oil phase was included.
- The concentration of cations (Na+, Mg2+, and Ca2+) not included in the injected brine was produced during 6 PVi. Sodium showed its dilution stabilizing (40–60 ppm) until the end of the flood. Mg2+ elution evidenced its dilution and increased up to 58 ppm, decreasing gradually until reaching 18 ppm after the injection of 6 PVs. Nevertheless, calcium concentration showed completely different behavior. Ca2+ initially decreases due to the dilution effects of the FB saturating (Swi) the core plug reaching a minimum of 48 ppm (≈0.75 PVi). At this point, its concentration started increasing and stayed above 126 ppm for 2 PVi, and after 3 PVi, Ca2+ started decreasing but stayed above 45 ppm throughout the displacement test.
- Finally, the effluents of this coreflood showed the presence of low-molecular-weight (MW) organic anions such as formate (99–57 ppm) and acetate (63–43 ppm) at the early stages of production (0.5 PVi). However, these organic anions were not identified beyond this point.
The results of the DE3 test demonstrate the difference between injecting KCl vs. MgCl2 (DE2) in the same rock–brine–oil system evaluated. The increased cation concentrations not included in the injection brine also validates the desalting process and water-soluble high-MW organic anions (not detected by EC) reported by Maya et al. [8]. The reduction of the Swi (Table 8) combined with the desalting of crude oil in the porous media and the identification of low-MW carboxylates may explain the ΔP increase observed in this test compared to the injection of FB or MgCl2 (Figure 9).
Following the experimental protocol described in Figure 8, the last displacement efficiency (DE4) was performed by injecting CaCl2 at 2000 ppm. During the conditioning of the Berea core plug with FB and oil, the Swi increased approximately 40% with respect to the previous displacement efficiency (DE3). However, this Swi is still 45% lower than that obtained during the initial coreflood using field brine or DE1 (Table 7). The ionic composition profiles are shown in Figure 16 and clearly show a response different from the injection of previous low-salinity brines (MgCl2, Figure 14 and KCl, Figure 15).
Major observations of this displacement test include:
- The rapid salinity reduction was evidenced during the CaCl2 (DE4) injection, especially for chloride and sodium, given the major differences between the FB and the injected brine.
- A sharp chloride dilution effect (difference of 4919 ppm) was observed. The Cl− in the effluents reached the injected concentration after 1.5 PVi, staying close but always above (maximum of 344 ppm) the injected concentration of 1309 ppm throughout the displacement test. This behavior was also observed in the single-phase coreflood for at least 10 PVi until a decrease in Cl- concentration was recorded (Figure 10).
- Calcium concentration injected in the CaCl2 brine was 219 ppm higher than that included in the field brine (FB). Therefore, the dilution effect observed between 0.5 and 1.5 PVi is attributed to the displacement of the FB by CaCl2. After the 1.5 PVi, Ca2+ remained remarkably stable and close to the injected concentration (722 ppm). This suggests that the calcium in the crude oil (Table 2), exchanged with other low-salinity brines (Figure 14 and Figure 15), is somehow equilibrated with the Ca2+ in the injected brine, diminishing its exchange capacity.
- Sodium was not present in the CaCl2 brine injected, but it helps demonstrate this cation’s dilution effect during the coreflood test. Na+ reached a minimum concentration of 61 ppm at 2.5 PVi. Beyond this point, sodium was detected in some samples with concentrations ranging from 3 to 55 ppm. Other cations (K+ and Mg2+) not included in the injected brine showed a similar trend. Mg2+ also showed a dilution effect, and its concentration remained stable and higher (26 to 260 ppm) than the injected concentration (40 ppm) for 2.75 PVi. Still, it was not further detected during the second half of the flood. Potassium was only detected after 1 PVi for 1 pore volume (60 to 100 ppm).
- Effluents of this experiment also showed the presence of low-MW organic anions such as formate (180–7 ppm) and acetate (93–21 ppm) before the first PVi. It is worth mentioning that these carboxylate concentration were higher than those identified during DE3 injecting KCl (Figure 15).
From the displacement efficiencies experiments, it can be concluded that the presence of oil shows the elution of a completely different ionic composition compared to those observed during the single-phase corefloods. This conclusion is supported by the production of cations that were not present in the injected low-salinity brines and that were not detected during the experiments without oil. Additionally, the detection of low-MW carboxylates during the injection of KCl and CaCl2 also confirms the influence of brine–oil interactions during low-salinity or smart water flooding. Therefore, the results confirm that ionic exchange between oil and the aqueous phase is not fully considered in the literature, as described at the end of the following section.
3.4.3. Coreflooding Displacement Comparison
As a final approach, the ionic composition profile of the effluents, with and without oil, were compared to verify the importance of the crude oil phase. Specifically, the comparison of chloride sodium and calcium will be used as examples to show the differences in the elution of these ions during the injection of different brines during the corefloods with and without crude oil (Figure 17). It is important to mention that the stages of injection of field brine in between low-salinity brines were not included to facilitate the interpretation.
Figure 17 summarizes the elution of chlorides, sodium, and calcium during the corefloods with different brines in the absence (DEw-produced in color lines) and presence of crude oil (DE produced in black lines). The elution of Cl− and Na+ shows similar trends compared to Ca2+. Chloride concentration presents different behavior during the injection of different low-salinity brines (Figure 17a):
- Cl− concentration [Cl−] eluted during the displacement efficiency (with oil) is higher than the single-phase experiment.
- [Cl−] is very similar in both types of corefloods (no major effect is evidenced due to the presence of oil).
The main difference between the elution of the [Cl−] is that sodium was not detected after 2 to 3 PVi in the single-phase experiments. The major differences of [Na+] were observed during the displacement efficiency with MgCl2 (Figure 17b). These results are expected because sodium was not part of the low-salinity chloride brines.
For the elution of calcium concentration [Ca2+], the differences are evident during the injection of different brines (Figure 17c). The results show that the presence of oil can regulate and stabilize the [Ca2+] faster during the injection of MgCl2 and KCl to a lesser extent. Finally, in the early stages of CaCl2 injection, the elution of [Ca2+] shows similar behavior to that recorded for KCl. However, the dispersion of [Ca2+] during the last two PVi injected was higher for this final brine. It is important to mention that during the displacement efficiencies, higher differential pressures were observed only with KCl and CaCl2. However, the higher displacement efficiency was obtained with CaCl2 (Table 7 and Figure 9).
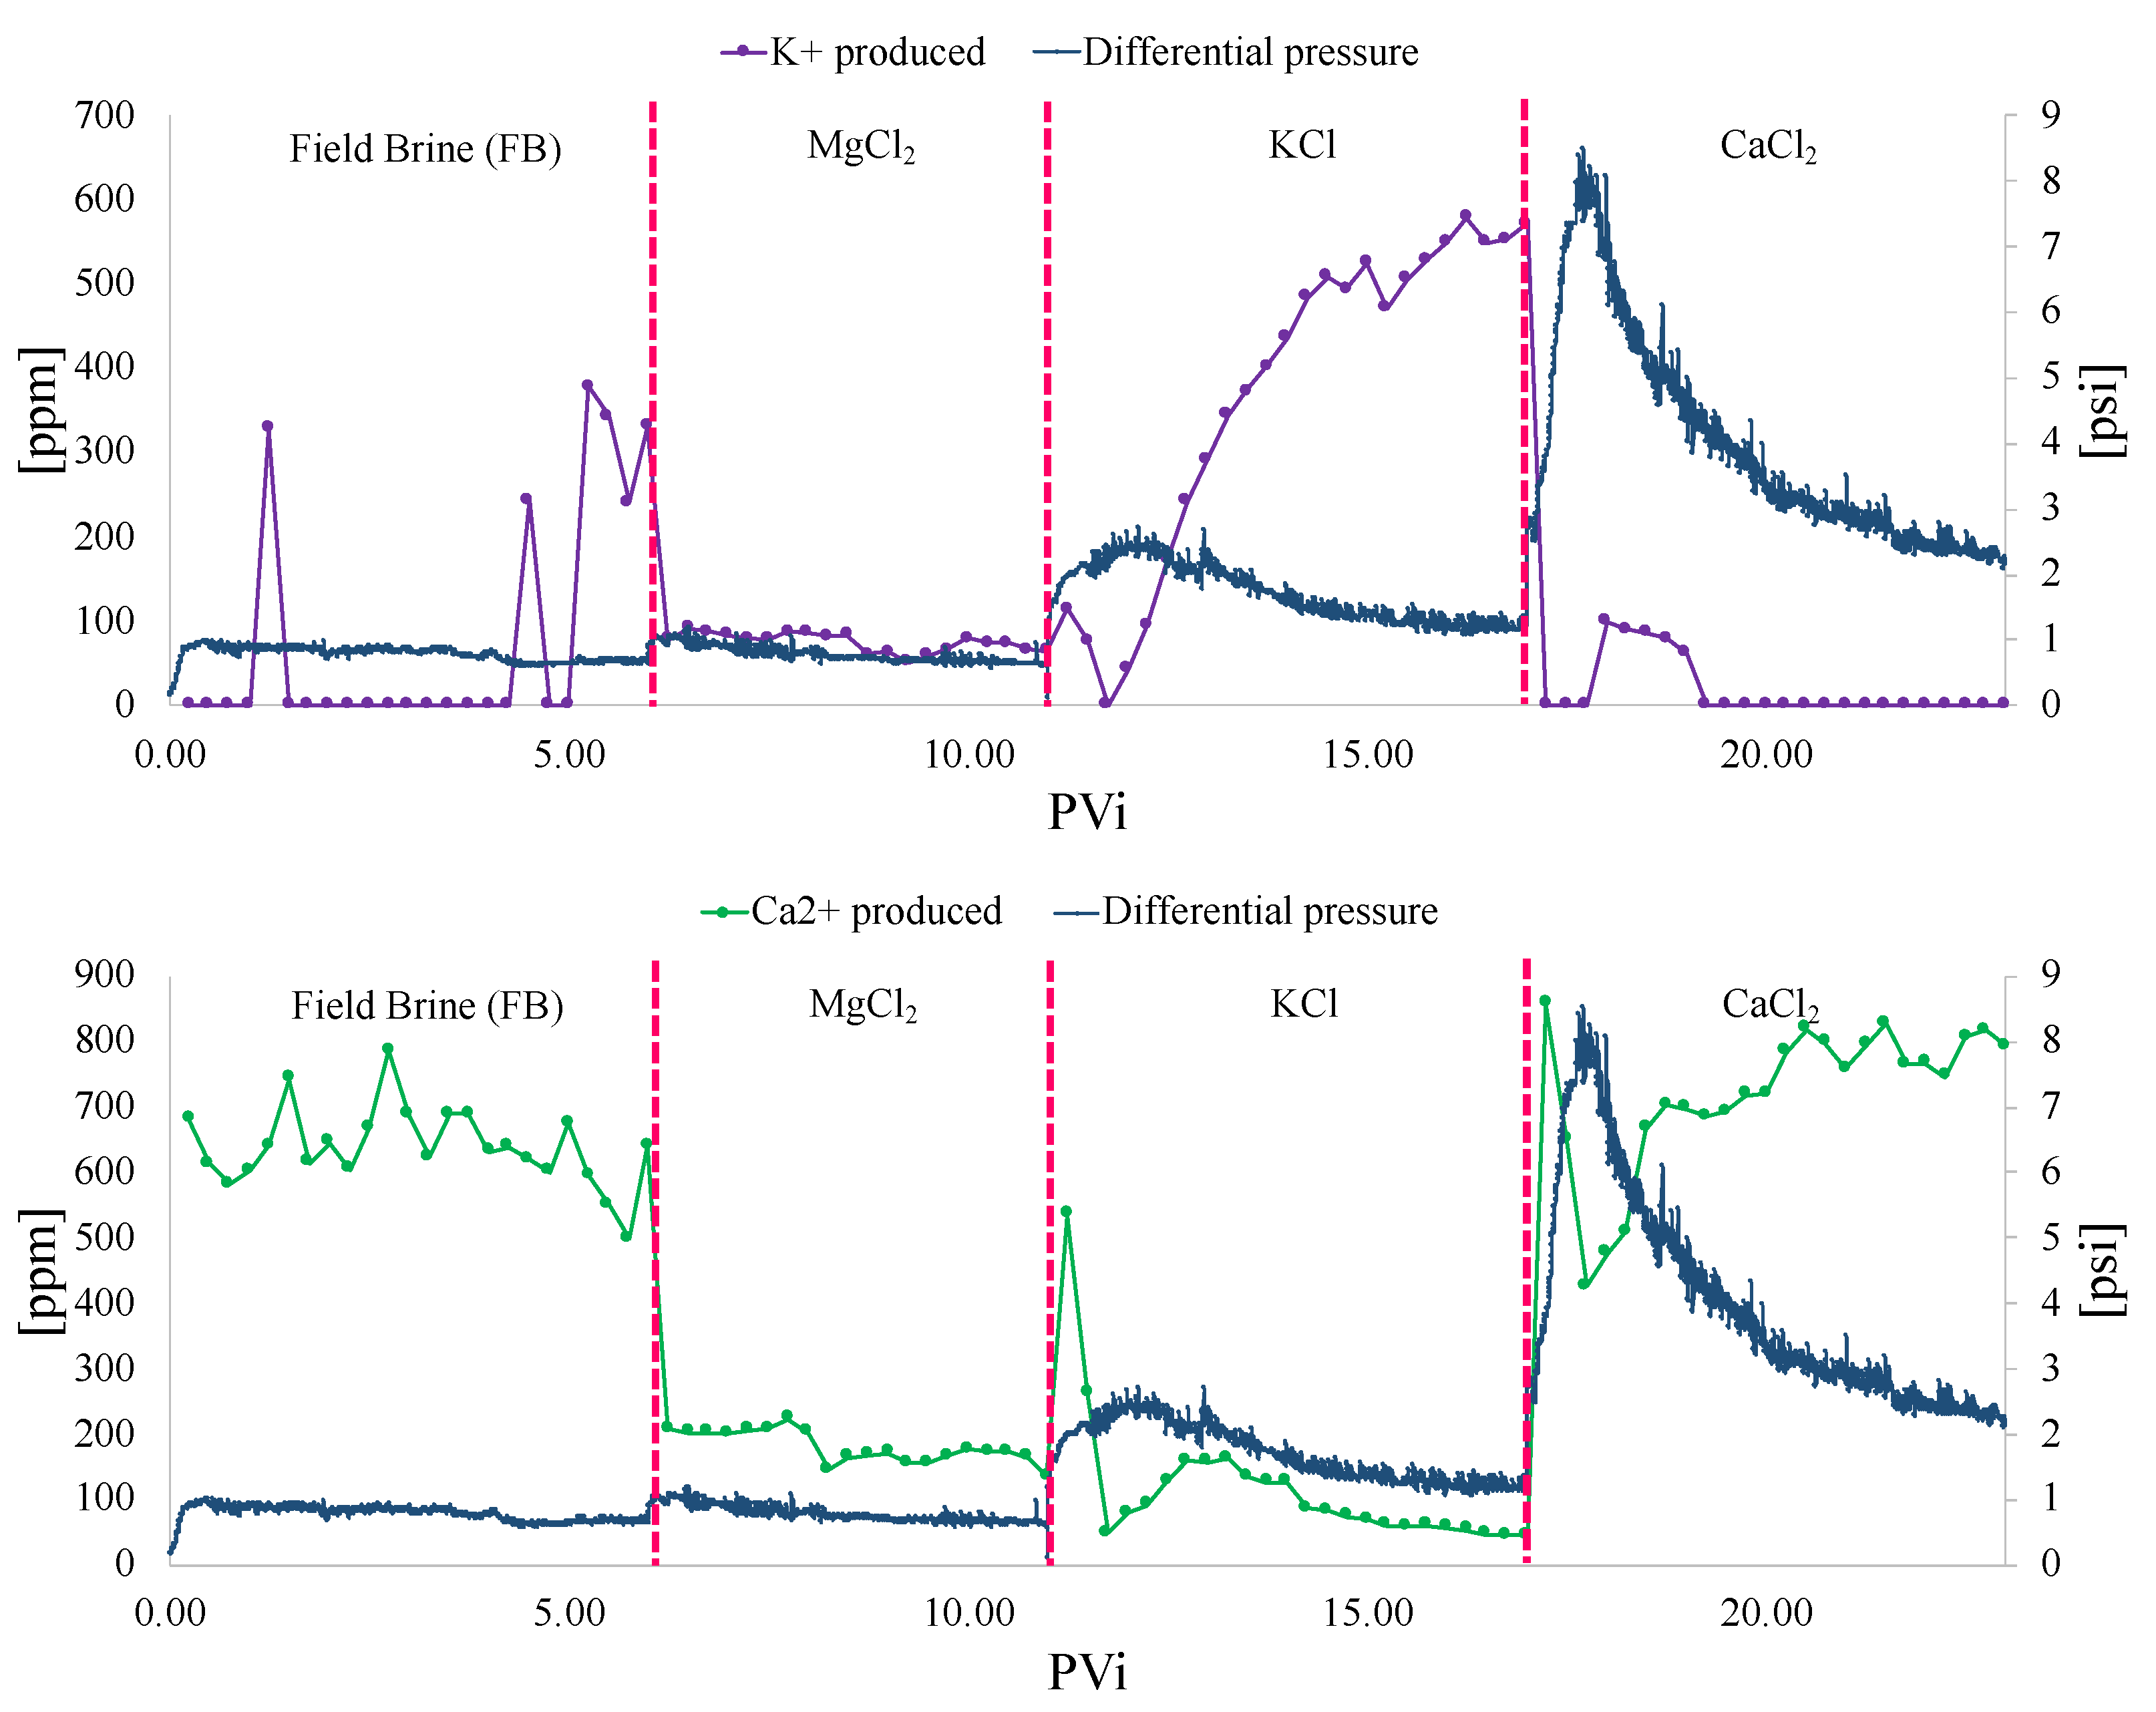
Figure 18 depicts potassium and calcium elution and the differential pressures for the displacement efficiencies with different brines. As discussed earlier, no major changes in ΔP were observed during the injection of FB and MgCl2. However, the only two tests reporting higher ΔP and displacement efficiencies were observed during the injection of KCl and CaCl2 (Table 7 and Figure 9). It is worth noting that the sharp ΔP increase observed in both experiments occurred during the period of the abrupt salinity reduction when switching from FB to KCl and CaCl2 (Figure 18).
Based on the effluent ionic composition of corefloods with and without crude oil, it is clear that the presence of oil alters the ionic composition of the produced water during the injection of low-salinity brines. The increase of the displacement efficiencies observed during the injection of KCl and CaCl2 cannot be explained due to wettability changes (Figure 7), IFT reduction (Table 5), or brine–rock interactions (Figure 10, Figure 11 and Figure 12) observed in this study. The possibility of fine migration effects is not expected to be important in Berea core samples, and the behavior of the ΔP was recorded during the corefloods. There was no evidence of solid produced during the filtration process (0.22 μm) before the effluent analysis by capillary electrophoresis (EC). Although the double-layer expansion (DLE) has been suggested as one of the primary oil recovery mechanisms in low-salinity water flooding in the literature [12,39], the results of this study show that the ionic exchange between the brine and the oil phase has been overlooked. A recent study evaluating the DLE mechanism supported by molecular simulation reports a shrinkage in the double layer under low-salinity conditions [40]. Therefore, these results bring some uncertainties supporting the DLE mechanism that needs to be further investigated.
The ionic composition of the effluents registered during the low-salinity brines (Figure 14, Figure 15 and Figure 16) strongly suggests the importance of oil–brine interactions. The ionic exchange between the reservoir oil used in this study with lower-salinity brines was first reported by Maya et al. [8]). Simple oil–brine interactions resulted in increased Ca2+ and Cl− concentrations after interacting for 7 days at reservoir temperature (60 °C). This result opened the door to fluid–fluid-type mechanisms, such as salting in/out, increasing the ionic content and water-soluble organic material. Crude oil desalting is a well-known oil cleanup operation with water to remove salts and other possible oil field chemicals before refining oil [41]. Metals and salts are commonly present in reservoir oils. In this case, the crude oil used in this study was produced from a sandstone reservoir with carbonate cement [35]. This explains the large variety of ions produced that were not present in the injection brines used in the displacement efficiencies and confirms that crude oil desalting can represent an important mechanism that can trigger multiple effects attributed to low-salinity water flooding.
The ionic exchange between the low-salinity brines and the reservoir oil can promote the formation of in situ dispersions (water in oil emulsions) that can explain the differential pressures (ΔP) and changes in the endpoints recorded in two out of the three displacement efficiencies (Figure 9 and Figure 18, Table 7). The only low-salinity brine that did not show relevant changes in ΔP was during the injection of MgCl2. The desalting effect observed throughout the ionic composition of the effluents in that displacement was remarkably higher than the [Cl−] injected, and multiple cations that were not present in the injection brine were produced. The latter suggests that the ionic composition generated during this coreflood limits the possibility of forming in situ dispersions. This behavior differs from those reported by Joonaki et al. [42], identifying that the most stable oil-in-water (O/W) microemulsions were obtained using Mg2+ compared to Ca2+ and Na+, which confirms that low-salinity effects are reservoir-specific. As mentioned earlier, the maximum ΔP increase observed with KCl and CaCl2 occurred during the sharp decrease in salinity observed during the first PVi and the identification of low-MW organic acid anions (Figure 15 and Figure 16). The presence of water-soluble organic compounds in low-salinity and smart water flooding has been documented [8,17,43]. Collins et al. also reported the compositional changes of crude oils during low-salinity water flooding, confirming the transference of polar organic molecules from the oil to the water phase, which is also consistent with the ion exchange between the oil and low-salinity brines observed in this study [44]. Additionally, the ΔP increase attributed to the formation of in situ dispersions is consistent with the observations reported by Mahzari and Sohrabi [45]. This study documented that micro-dispersions are crucial in improving oil recovery by low-salinity water injection.
4. Conclusions
This study focused on obtaining experimental data to identify the behavior of a rock–oil–brine system subjected to low-salinity/smart water injection processes. Contact angle tests and displacement efficiencies with brines of specific concentrations of certain ions were carried out to characterize the wettability of the system and to understand its behavior. A capillary electrophoresis system was used to analyze and interpret the ionic concentration in the effluents from the displacement tests.
This study presents the incorporation of capillary electrophoresis technology for the first time into improved and enhanced oil recovery research, improving the understanding of the system and allowing a detailed examination of the system’s ionic behavior.
This research demonstrated the importance of oil–brine mechanisms in mobilizing hydrocarbons. The experiments identified an ion exchange that cannot be explained with a single interaction with the rock, so the mechanism of the oil–brine ion exchange takes on more significance than the proposed DLE mechanism. It is also evident that salinity reduction alone cannot explain the percentage of hydrocarbons recovered nor the pressure differentials presented. The results are different depending on the dominant ion in the injected brine. In the system considered here, the injection of CaCl2 and KCl showed the best oil recovery performance, correlating with the highest differential pressure, respectively. However, MgCl2 did not show any effect on the evaluated system.
The ionic enrichment of the water phase due to the oil–brine interactions are a new mechanism that needs further exploration. This type of interaction (salting in/out) can have a strong influence on the design of not only smart water flooding but also chemical EOR.
Author Contributions
Conceptualization, G.M., A.R.R.B., F.B.C., C.A.F. and E.M.; validation, G.M., A.L.C.O., F.L.M.B., A.R.R.B., F.B.C., C.A.F. and E.M.; formal analysis, G.M.; investigation, G.M. and F.B.C.; resources, G.M. and F.B.C.; data curation, G.M., F.B.C. and E.M.; writing—original draft preparation, A.L.C.O. and F.L.M.B.; writing—review and editing, G.M., A.R.R.B., F.B.C., C.A.F. and E.M.; supervision, G.M., F.B.C. and E.M.; project administration, G.M.; funding acquisition, G.M. and F.B.C. All authors have read and agreed to the published version of the manuscript.
Funding
National Fund for Financing Science, Technology, and Innovation “Francisco Jose de Caldas”. MINCIENCIAS-ECOPETROL for grant 848—contract number 3033445.
Data Availability Statement
Data is unavailable due to privacy restrictions.
Acknowledgments
Thanks to MINCIENCIAS in the framework of call 758 (D.Nal.Empresa) for the financial support of the research. Thanks to Universidad Nacional de Colombia (UNALMED) as part of the agreement FP44842-338-2017 (Doctorado Empresa), ECOPETROL—UNALMED-MINCIENCIAS. Ecopetrol kindly provided the data. A.L.C.O. thanks MINCIENCIAS-ECOPETROL for grant 848—contract number 3033445 to carry out her postdoctoral stay.
Conflicts of Interest
The authors declare no conflict of interest.
References
- Short-Term Energy Outlook (STEO). U.S. Energy Information Administration. 2023. Available online: https://www.eia.gov/outlooks/steo/pdf/steo_full.pdf (accessed on 15 February 2023).
- Aghaeifar, Z.; Strand, S.; Puntervold, T.; Austad, T.; Sajjad, F.M. Smart Water injection strategies for optimized EOR in a high temperature offshore oil reservoir. J. Pet. Sci. Eng. 2018, 165, 743–751. [Google Scholar] [CrossRef]
- Qiao, C.; Li, L.; Johns, R.T.; Xu, J. A Mechanistic Model for Wettability Alteration by Chemically Tuned Waterflooding in Carbonate Reservoirs. SPE J. 2015, 20, 767–783. [Google Scholar] [CrossRef] [Green Version]
- Alvarado, V.; Manrique, E. Enhanced oil recovery: An update review. Energies 2010, 3, 1529–1575. [Google Scholar] [CrossRef]
- Hassan, A.M.; Ayoub, M.; Eissa, M.; Al-Shalabi, E.W.; Al-Mansour, A.; Al-Quraishi, A. Increasing Reservoir Recovery Efficiency through Laboratory-Proven Hybrid Smart Water-Assisted Foam (SWAF) Flooding in Carbonate Reservoirs. Energies 2022, 15, 3058. [Google Scholar] [CrossRef]
- Sarmah, S.; Gogoi, S.B.; Jagatheesan, K.; Hazarika, K. Formulation of a combined low saline water and polymer flooding for enhanced oil recovery. Int. J. Ambient. Energy 2019, 43, 1089–1097. [Google Scholar] [CrossRef]
- Maya, G.; Cardona, L.; Rueda, M.; Cortés, F. Effect of ionic strength in low salinity water injection processes. CTyF-Cienc. Tecnol. Futur. 2020, 10, 17–26. [Google Scholar] [CrossRef]
- Maya, G.; Herrera, J.J.; Orrego, J.A.; Rojas, F.A.; Rueda, M.F.; Eduardo, J. Efecto de la composición iónica en interacciones crudo salmuera en la inyección de agua de composición química controlada resultados preliminares. Revista Fuentes el Reventón Energético 2018, 16, 73–82. [Google Scholar]
- Liu, F.; Wang, M. Review of low salinity waterflooding mechanisms: Wettability alteration and its impact on oil recovery. Fuel 2020, 267, 117112. [Google Scholar] [CrossRef]
- Ai-Saedi, H.N.; Flori, R.E. Enhanced oil recovery of low salinity water flooding in sandstone and the role of clay. Pet. Explor. Dev. 2018, 45, 927–931. [Google Scholar] [CrossRef]
- Al-Shalabi, E.W.; Sepehrnoori, K.; Pope, G. An improved method for estimating volumetric sweep efficiency of low salinity water injection. SPE-172279-MS. In Proceedings of the SPE Annual Caspian Technical Conference and Exhibition, Astana, Kazakhstan, 12–14 November 2014. [Google Scholar]
- Shaker Shiran, B.; Skauge, A. Enhanced oil recovery (EOR) by combined low salinity water/polymer flooding. Energy Fuels 2013, 27, 1223–1235. [Google Scholar] [CrossRef]
- Fredriksen, S.B.; Rognmo, A.U.; Fernø, M.A. Pore-scale mechanisms during low salinity waterflooding: Oil mobilization by diffusion and osmosis. J. Pet. Sci. Eng. 2018, 163, 650–660. [Google Scholar] [CrossRef]
- Tang, G.Q.; Morrow, N.R. Salinity, Temperature, Oil Composition, and Oil Recovery by Waterflooding. SPE Reserv. Eng. 1997, 12, 269–276. [Google Scholar] [CrossRef]
- Liu, M.; Xu, S.; Zhu, S.; Wu, J.; Bai, B.; Sun, C. Ion-induced oil–water wettability alteration of rock surfaces. Part II: Base interactions between oil and solid. Chem. Eng. Sci. 2021, 236, 116521. [Google Scholar] [CrossRef]
- Nasralla, R.A.; Mahani, H.; van der Linde, H.A.; Marcelis, F.H.M.; Masalmeh, S.K.; Sergienko, E.; Brussee, N.J.; Pieterse, S.G.J.; Basu, S. Low salinity waterflooding for a carbonate reservoir: Experimental evaluation and numerical interpretation. J. Pet. Sci. Eng. 2018, 164, 640–654. [Google Scholar] [CrossRef]
- Piñerez Torrijos, I.D.; Puntervold, T.; Strand, S.; Austad, T.; Bleivik, T.H.; Abdullah, H.I. An experimental study of the low salinity Smart Water—Polymer hybrid EOR effect in sandstone material. J. Pet. Sci. Eng. 2018, 164, 219–229. [Google Scholar] [CrossRef]
- Takeya, M.; Shimokawara, M.; Elakneswaran, Y.; Nawa, T.; Takahashi, S. Predicting the electrokinetic properties of the crude oil/brine interface for enhanced oil recovery in low salinity water flooding. Fuel 2019, 235, 822–831. [Google Scholar] [CrossRef]
- Xie, Q.; Liu, F.; Chen, Y.; Yang, H.; Saeedi, A.; Hossain, M.M. Effect of electrical double layer and ion exchange on low salinity EOR in a pH controlled system. J. Pet. Sci. Eng. 2019, 174, 418–424. [Google Scholar] [CrossRef]
- Yu, M.; Zeinijahromi, A.; Bedrikovetsky, P.; Genolet, L.; Behr, A.; Kowollik, P.; Hussain, F. Effects of fines migration on oil displacement by low-salinity water. J. Pet. Sci. Eng. 2019, 175, 665–680. [Google Scholar] [CrossRef]
- Han, Y.; Zhou, C.; Yu, J.; Li, C.; Hu, F.; Xu, H.; Yuan, C. Experimental investigation on the effect of wettability on rock-electricity response in sandstone reservoirs. Fuel 2019, 239, 1246–1257. [Google Scholar] [CrossRef]
- Hazarika, K.; Gogoi, S.B. Clay Analysis of Upper Assam Basin for Chemical Enhanced Oil Recovery. J. Geol. Soc. India 2021, 97, 138–144. [Google Scholar] [CrossRef]
- Doust, A.R.; Puntervold, T.; Austad, T. Chemical verification of the EOR mechanism by using low saline/smart water in sandstone. Energy Fuels 2011, 25, 2151–2162. [Google Scholar] [CrossRef]
- Lashkarbolooki, M.; Ayatollahi, S.; Riazi, M. The impacts of aqueous ions on interfacial tension and wettability of an asphaltenic-acidic crude oil reservoir during smart water injection. J. Chem. Eng. Data 2014, 59, 3624–3634. [Google Scholar] [CrossRef]
- Ghorbani, M.; Rashidi, F.; Mousavi-Dehghani, A. Investigation of crude oil properties impact on wettability alteration during low salinity water flooding using an improved geochemical model. Sci. Rep. 2022, 12, 6600. [Google Scholar] [CrossRef]
- Tetteh, J.T.; Brady, P.; Barati Ghahfarokhi, R. Review of low salinity waterflooding in carbonate rocks: Mechanisms, investigation techniques, and future directions. Adv. Colloid Interface Sci. 2020, 284, 102253. [Google Scholar] [CrossRef]
- Strand, S.; Puntervold, T.; Austad, T. Water based EOR from clastic oil reservoirs by wettability alteration: A review of chemical aspects. J. Pet. Sci. Eng. 2016, 146, 1079–1091. [Google Scholar] [CrossRef]
- Rezaeidoust, A.; Puntervold, T.; Strand, S.; Austad, T. Smart water as wettability modifier in carbonate and sandstone: A discussion of similarities/differences in the chemical mechanisms. Energy Fuels 2009, 23, 4479–4485. [Google Scholar] [CrossRef]
- Gbadamosi, A.; Patil, S.; al Shehri, D.; Kamal, M.S.; Hussain SM, S.; Al-Shalabi, E.W.; Hassan, A.M. Recent advances on the application of low salinity waterflooding and chemical enhanced oil recovery. Energy Rep. 2022, 8, 9969–9996. [Google Scholar] [CrossRef]
- Snosy, M.F.; Abu El Ela, M.; El-Banbi, A.; Sayyouh, H. Comprehensive investigation of low-salinity waterflooding in sandstone reservoirs. J. Pet. Explor. Prod. Technol. 2020, 10, 2019–2034. [Google Scholar] [CrossRef] [Green Version]
- Song, J.; Wang, Q.; Shaik, I.; Puerto, M.; Bikkina, P.; Aichele, C.; Biswal, S.L.; Hirasaki, G.J. Effect of salinity, Mg2+ and SO42− on “smart water”-induced carbonate wettability alteration in a model oil system. J. Colloid Interface Sci. 2020, 563, 145–155. [Google Scholar] [CrossRef]
- Gandomkar, A.; Rahimpour, M.R. The impact of monovalent and divalent ions on wettability alteration in oil/low salinity brine/limestone systems. J. Mol. Liq. 2017, 248, 1003–1013. [Google Scholar] [CrossRef]
- Yang, J.; Dong, Z.; Dong, M.; Yang, Z.; Lin, M.; Zhang, J.; Chen, C. Wettability Alteration during Low-Salinity Waterflooding and the Relevance of Divalent Ions in This Process. Energy Fuels 2016, 30, 72–79. [Google Scholar] [CrossRef]
- Al-Saedi, H.N.; Alhuraishawy, A.K.; Flori, R.; Brady, P.V. Sequential injection mode of high-salinity/low-salinity water in sandstone reservoirs: Oil recovery and surface reactivity tests. J. Pet. Explor. Prod. Technol. 2019, 9, 261–270. [Google Scholar] [CrossRef] [Green Version]
- Manrique, E.; Delgadillo, C.; Maya, G.; Gelvis, J. EOR Screening Methods Assisted by Digital Rock Analysis: A Step Forward. In Proceedings of the SPE Latin American and Caribbean Petroleum Engineering Conference, Bogota, Colombia, 27–31 July 2020. [Google Scholar]
- dos Santos, R.G.; Mohamed, R.S.; Bannwart, A.C.; Loh, W. Contact angle measurements and wetting behavior of inner surfaces of pipelines exposed to heavy crude oil and water. J. Pet. Sci. Eng. 2006, 51, 9–16. [Google Scholar] [CrossRef]
- Aslan, S.; Fathi Najafabadi, N.; Firoozabadi, A. Non-monotonicity of the Contact Angle from NaCl and MgCl2 Concentrations in Two Petroleum Fluids on Atomistically Smooth Surfaces. Energy Fuels 2016, 30, 2858–2864. [Google Scholar] [CrossRef]
- Farajzadeh, R.; Guo, H.; van Winden, J.; Bruining, J. Cation Exchange in the Presence of Oil in Porous Media. ACS Earth Space Chem. 2017, 1, 101–112. [Google Scholar] [CrossRef] [Green Version]
- Nasralla, R.A.; Bataweel, M.A.; Nasr-El-Din, H.A. Investigation of wettability alteration and oil-recovery improvement by low-salinity water in sandstone rock. J. Can. Pet. Technol. 2013, 52, 144–154. [Google Scholar] [CrossRef]
- Mehana, M.; Fahes, M.; Kang, Q.; Viswanathan, H. Molecular simulation of double layer expansion mechanism during low-salinity waterflooding. J. Mol. Liq. 2020, 318, 114079. [Google Scholar] [CrossRef]
- Fahim, M.A.; Elkilani, A.; Alsahhaf, T. Fundamentals of Petroleum Refining, 1st ed.; Elsevier: Amsterdam, The Netherlands, 2010. [Google Scholar]
- Joonaki, E.; Hassanpouryouzband, A.; Burgass, R.; Tohidi, B. Effect of Water Chemistry on Asphaltene Stabilised Water in Oil Emulsions—A New Search for Low Salinity Water Injection Mechanism. In Proceedings of the 79th EAGE Conference & Exhibition, Paris, France, 12–15 July 2017. [Google Scholar] [CrossRef]
- Garcia-Olvera, G.; Alvarado, V. The Potential of Sulfate as Optimizer of Crude Oil-Water Interfacial Rheology to Increase Oil Recovery During Smart Water Injection in Carbonates. In Proceedings of the SPE Improved Oil Recovery Conference, Tulsa, OK, USA, 9–12 April 2016. [Google Scholar] [CrossRef]
- Collins, I.R.; Couves, J.W.; Hodges, M.; McBride, E.K.; Pedersen, C.S.; Salino, P.A.; Webb, K.J.; Wicking, C.; Zeng, H. Effect of Low Salinity Waterflooding on the Chemistry of the Produced Crude Oil. In Proceedings of the SPE Improved Oil Recovery Conference, Tulsa, OK, USA, 14–18 April 2018. [Google Scholar]
- Mahzari, P.; Sohrabi, M. Impact of Micro-Dispersion Formation on Effectiveness of Low Salinity Waterflooding. In Proceedings of the IOR 2015—18th European Symposium on Improved Oil Recovery, Dresden, Germany, 14–16 April 2015. [Google Scholar] [CrossRef]
Figure 1.
OCA 25 PMC 750 model used.

Figure 2.
Coreflooding equipment outline.
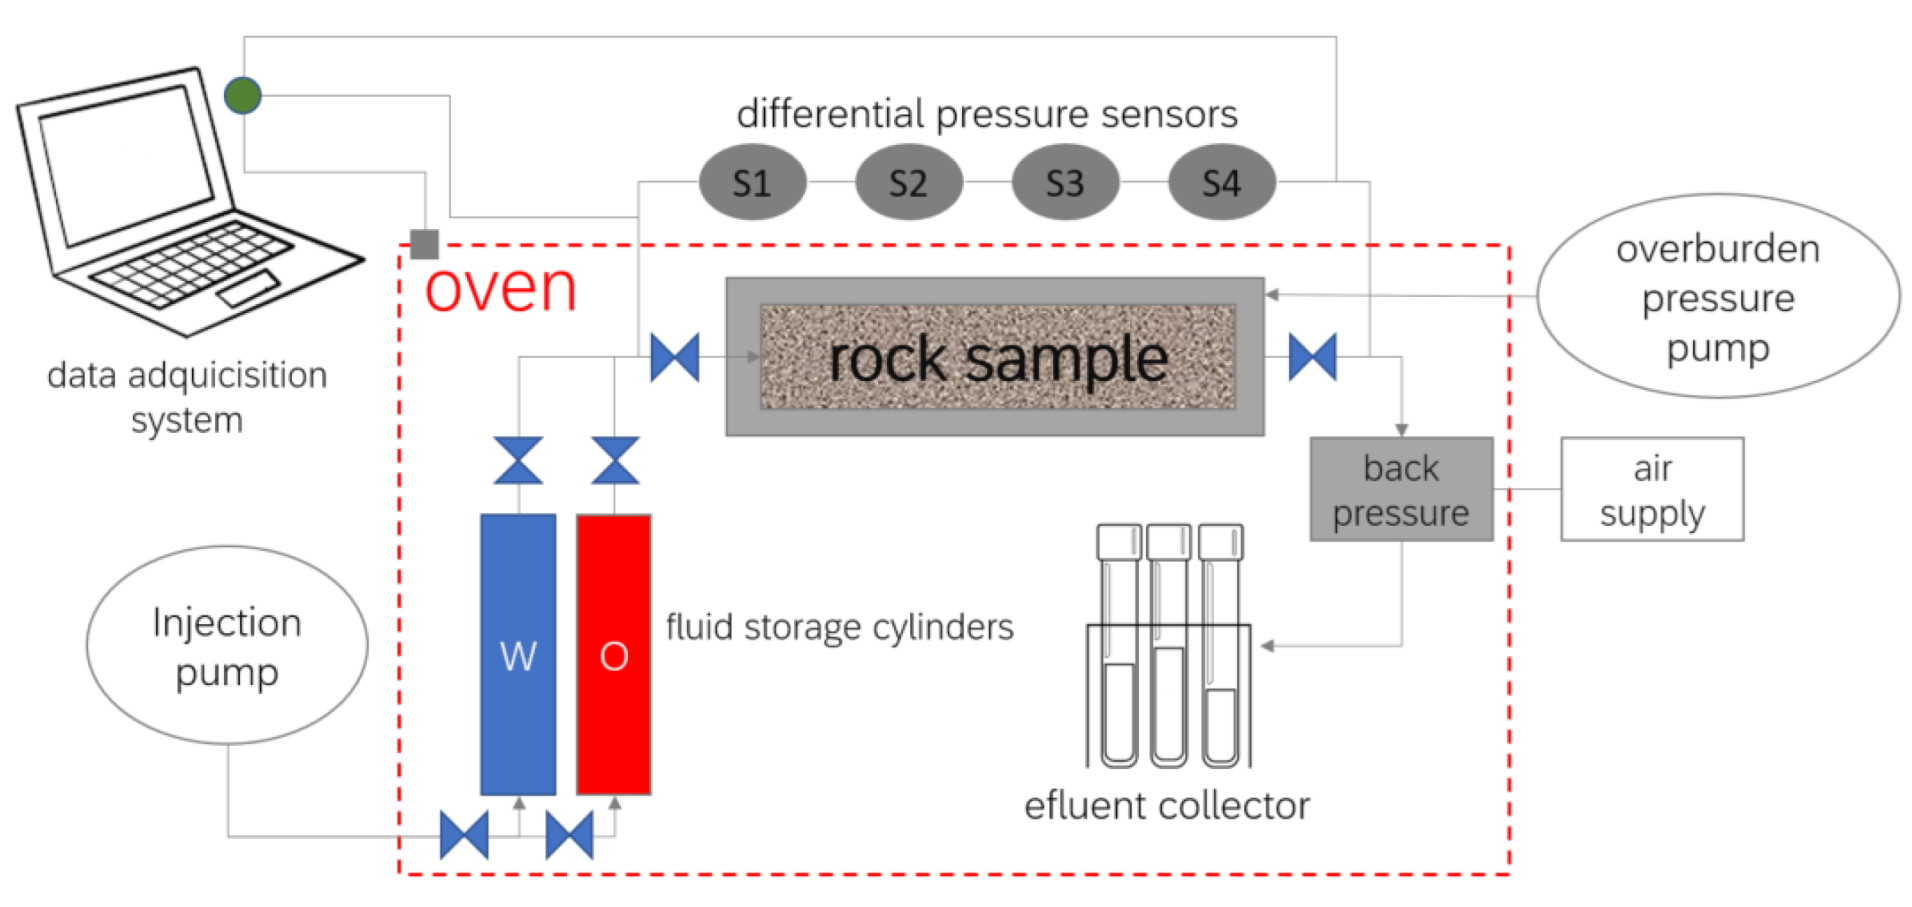
Figure 3.
Displacement efficiency protocol.
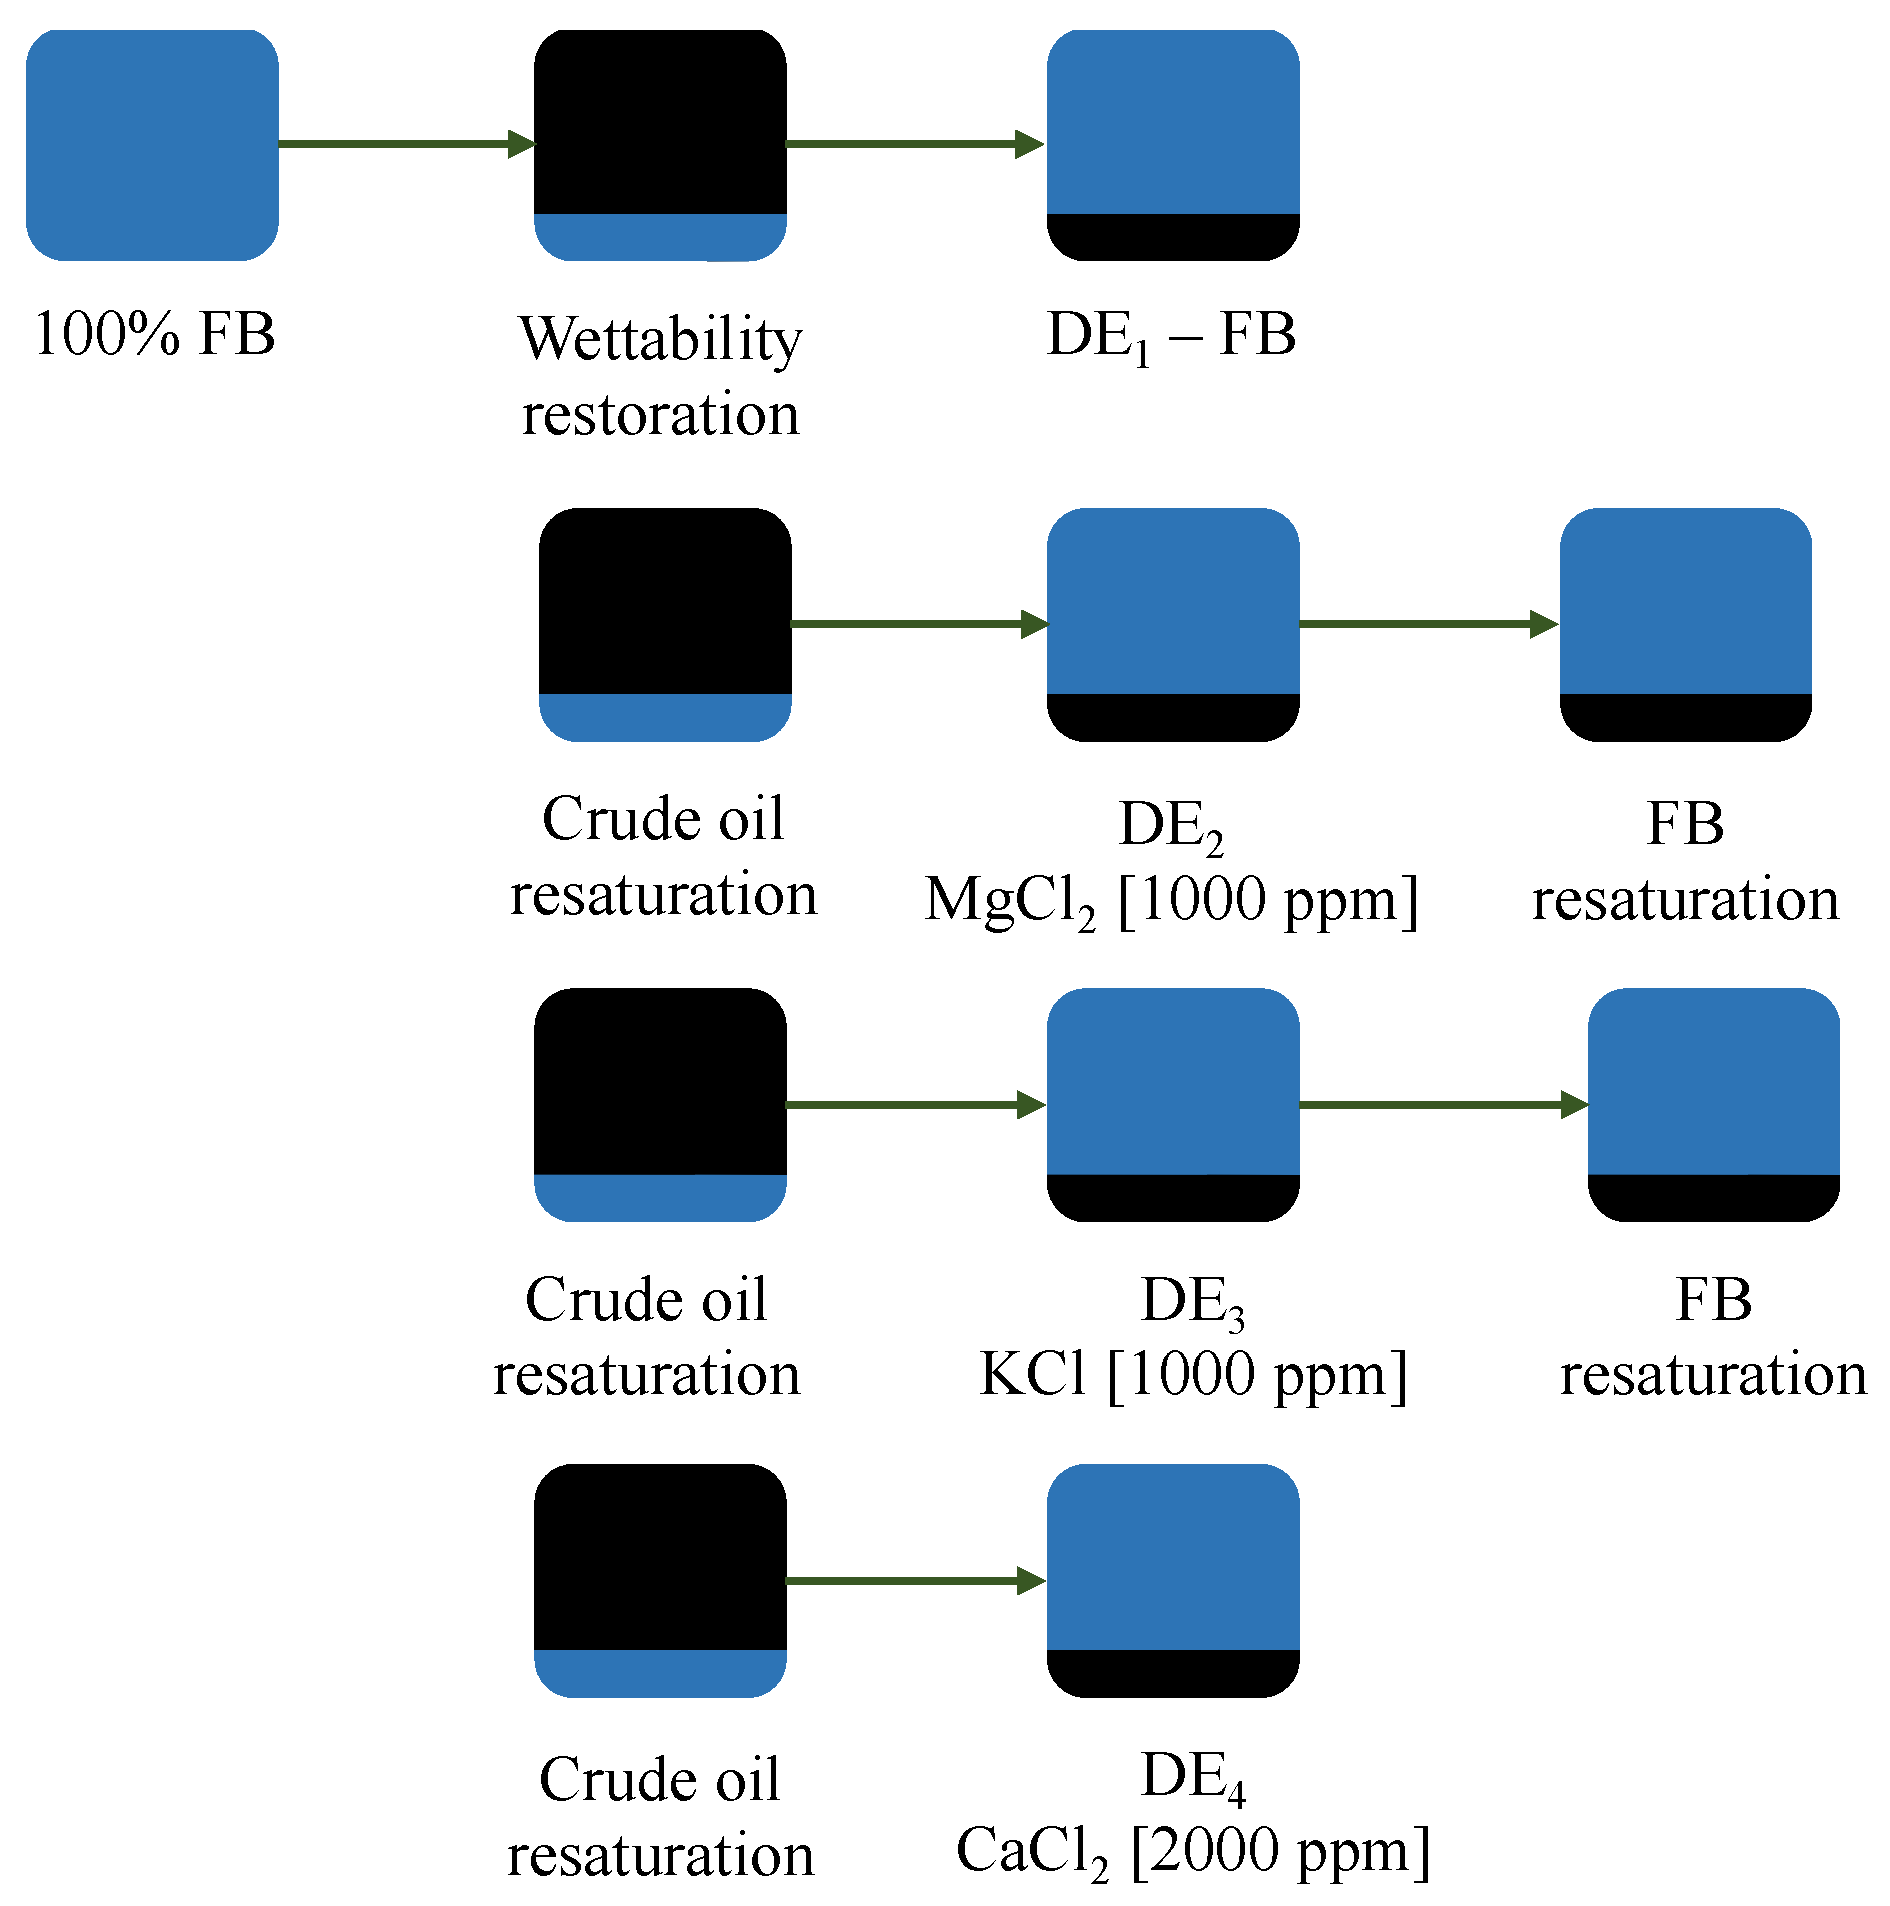
Figure 4.
Contact angle measurements of crude oil on Berea at different stabilization times.

Figure 5.
Evaluation of different oil droplet volumes in FB.
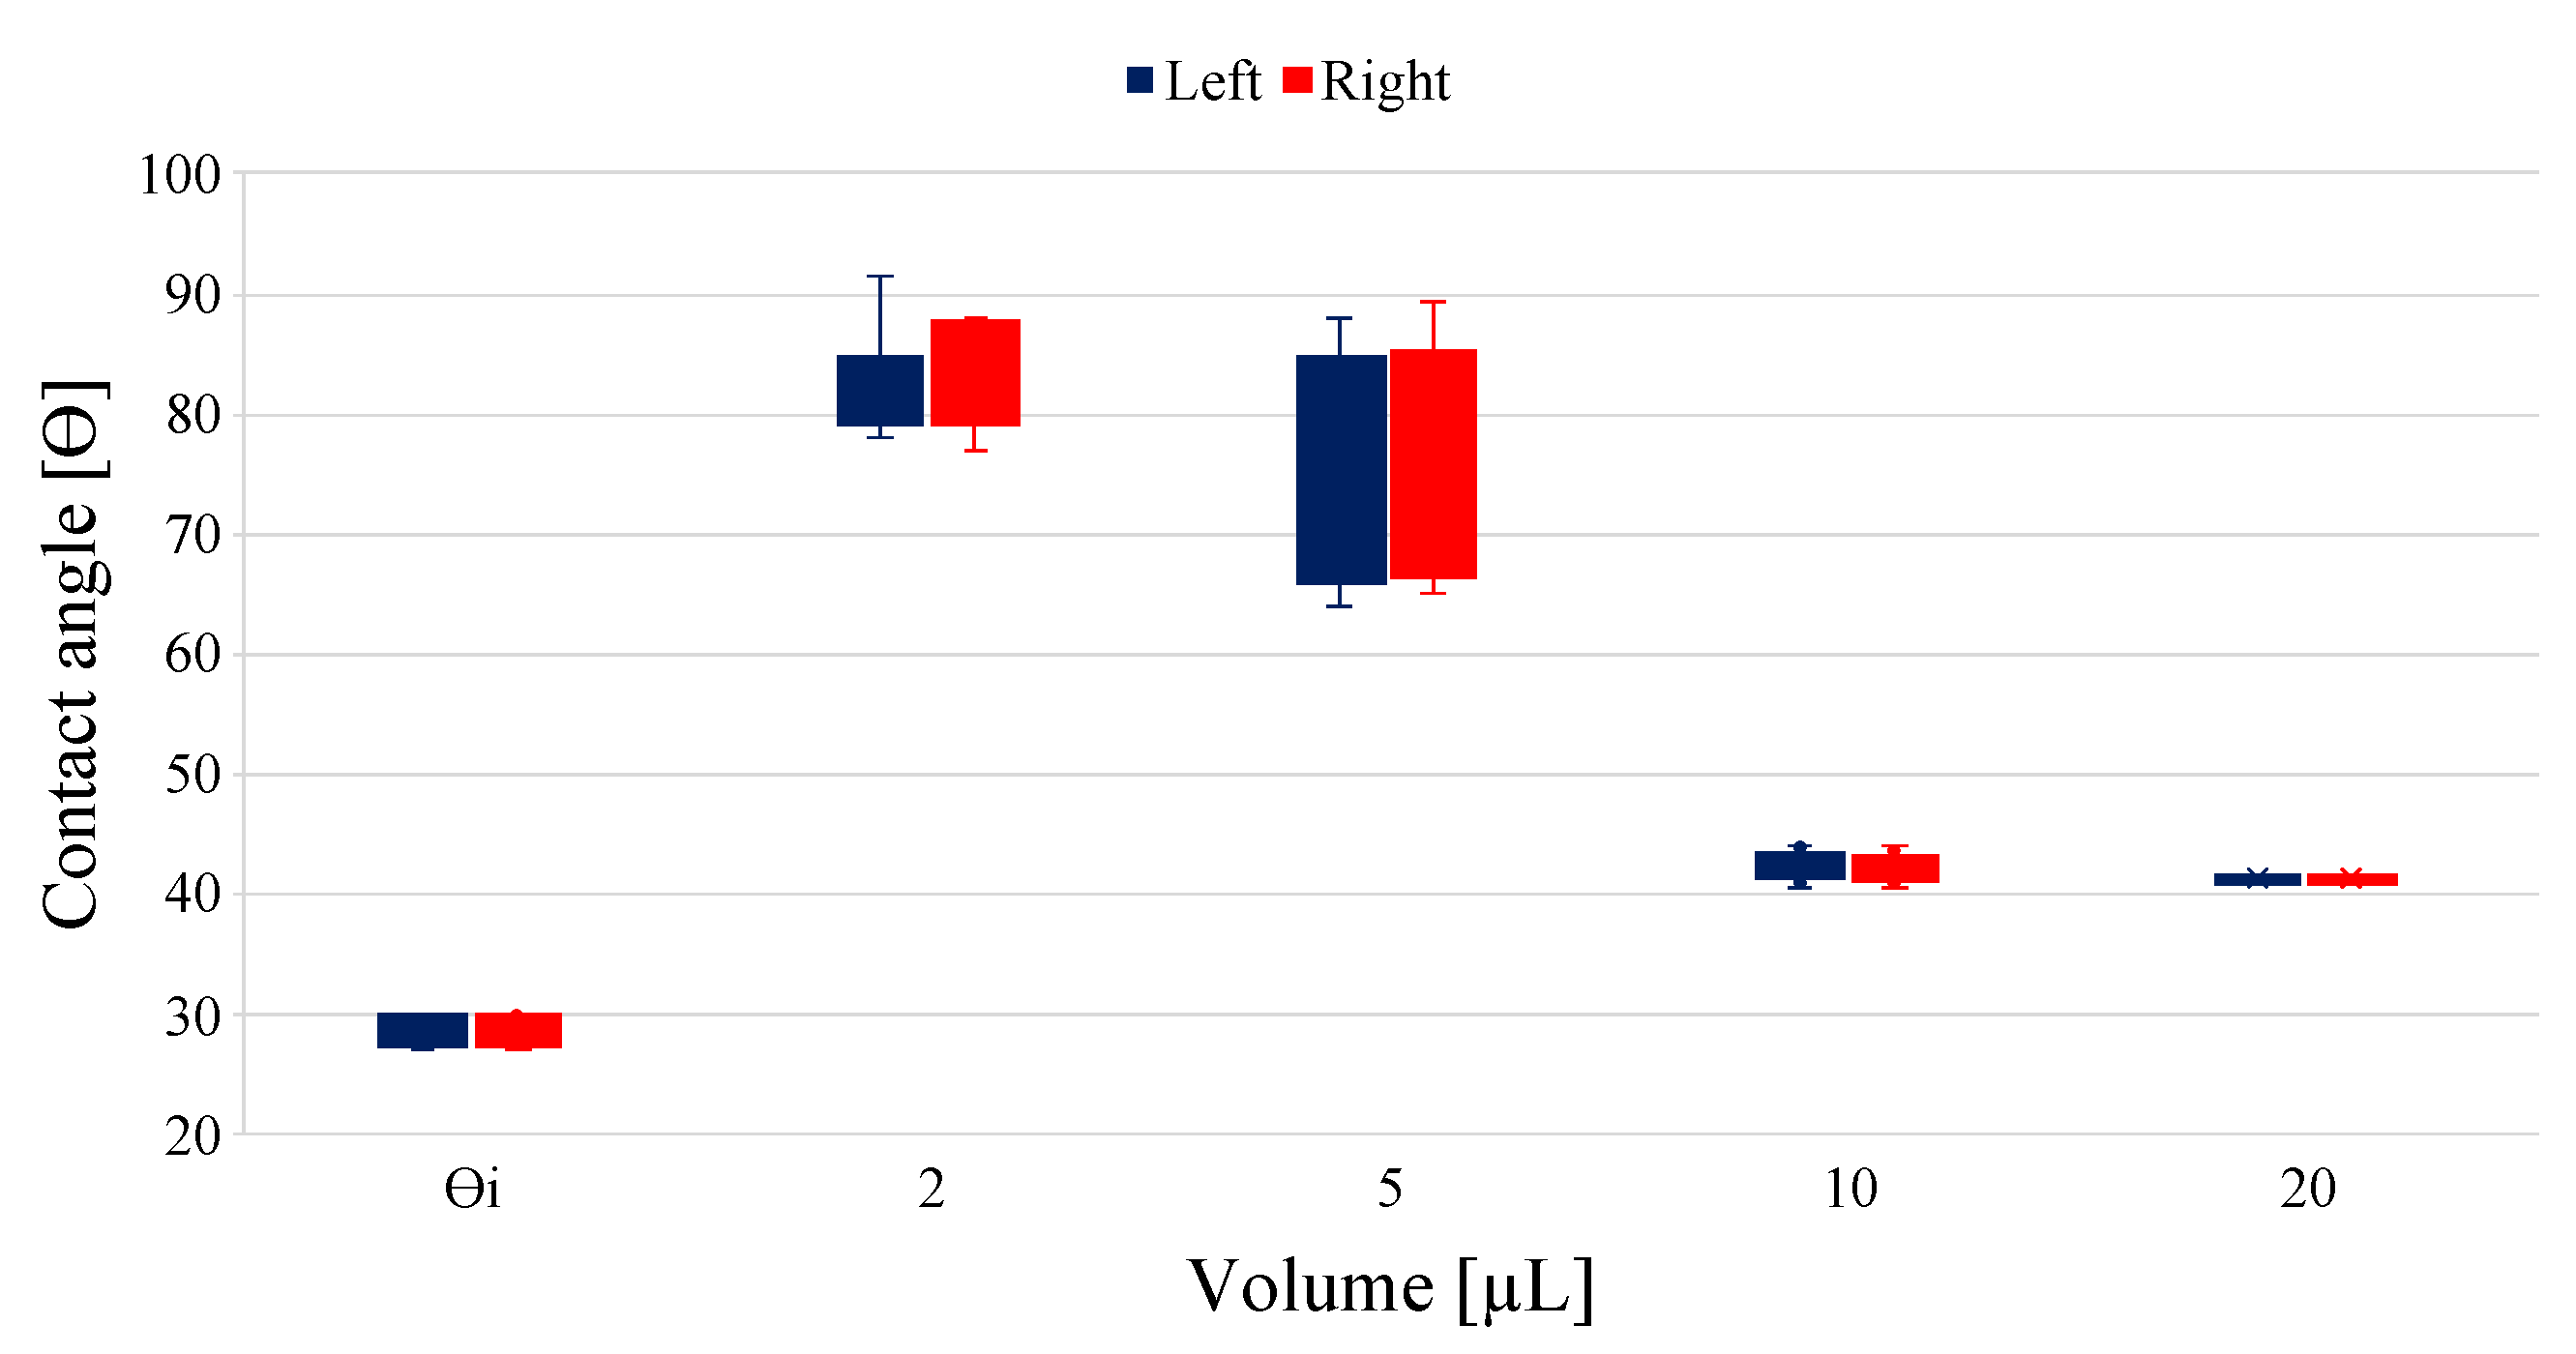
Figure 6.
Contact angle measurement of crude oil on Berea at different stabilization times in FB and NaCl brines.
Figure 6.
Contact angle measurement of crude oil on Berea at different stabilization times in FB and NaCl brines.
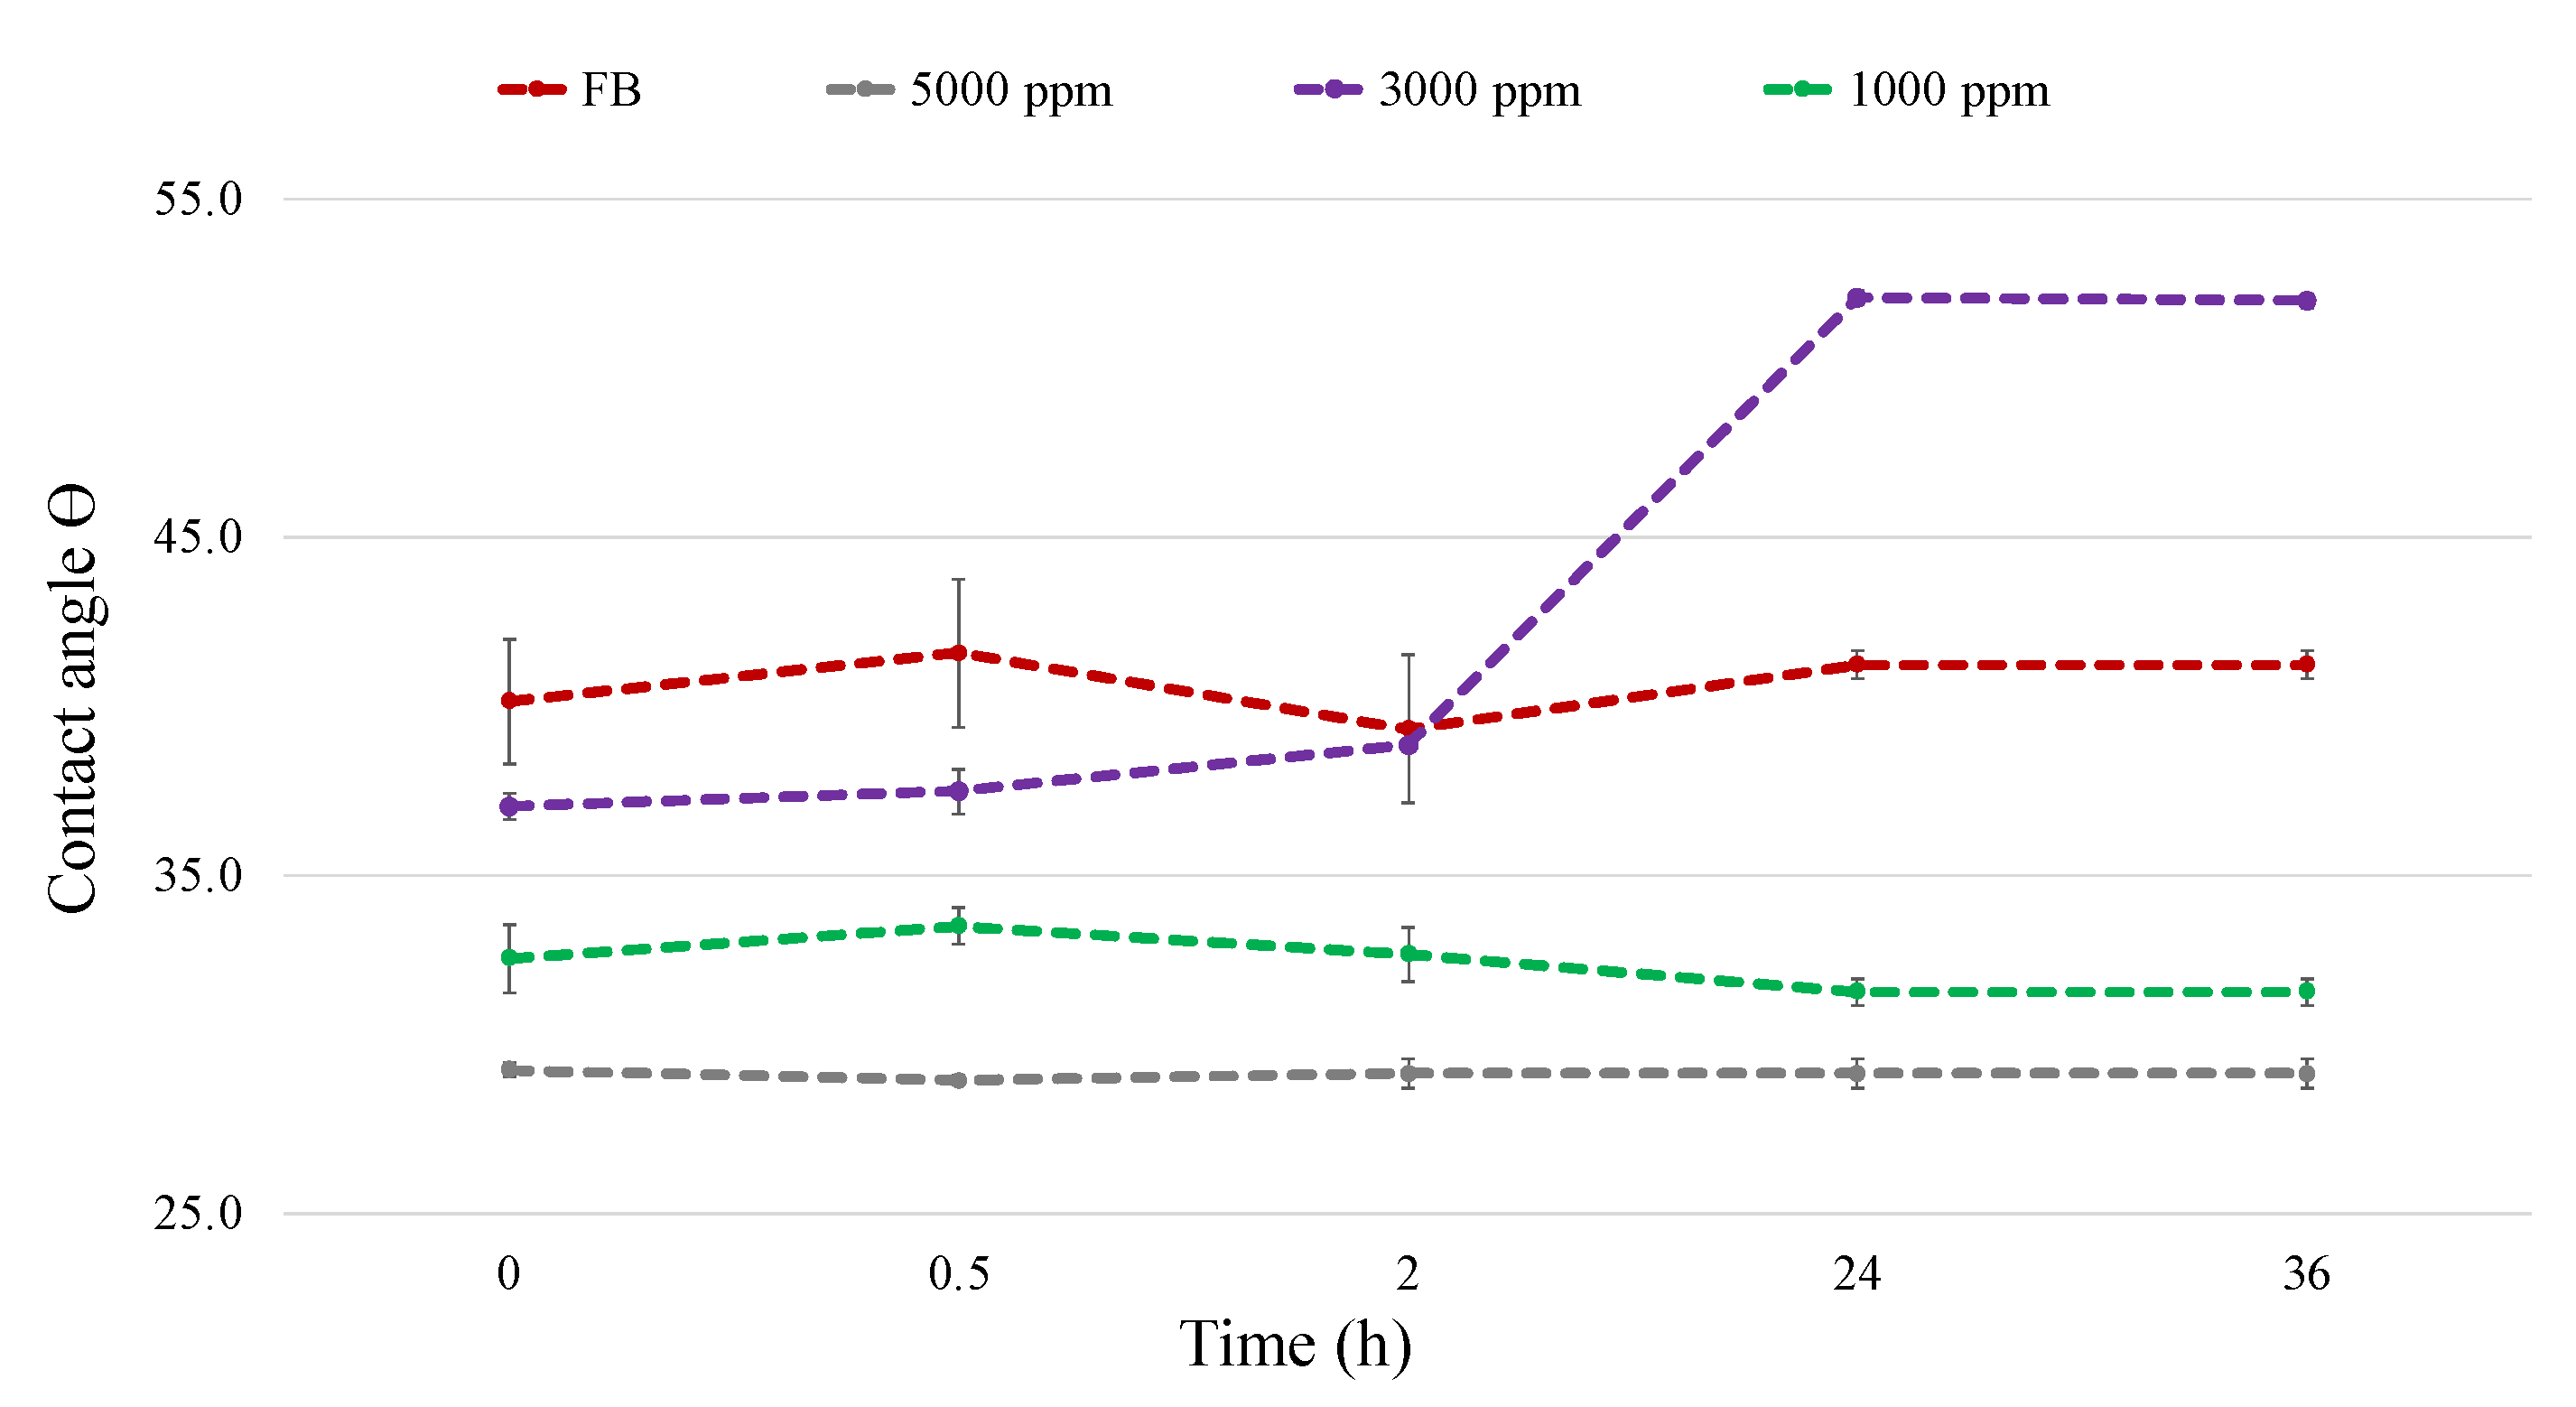
Figure 7.
Effect of brine and salinity on contact angle.

Figure 8.
Schematic of displacement efficiencies using the same Berea core sample.
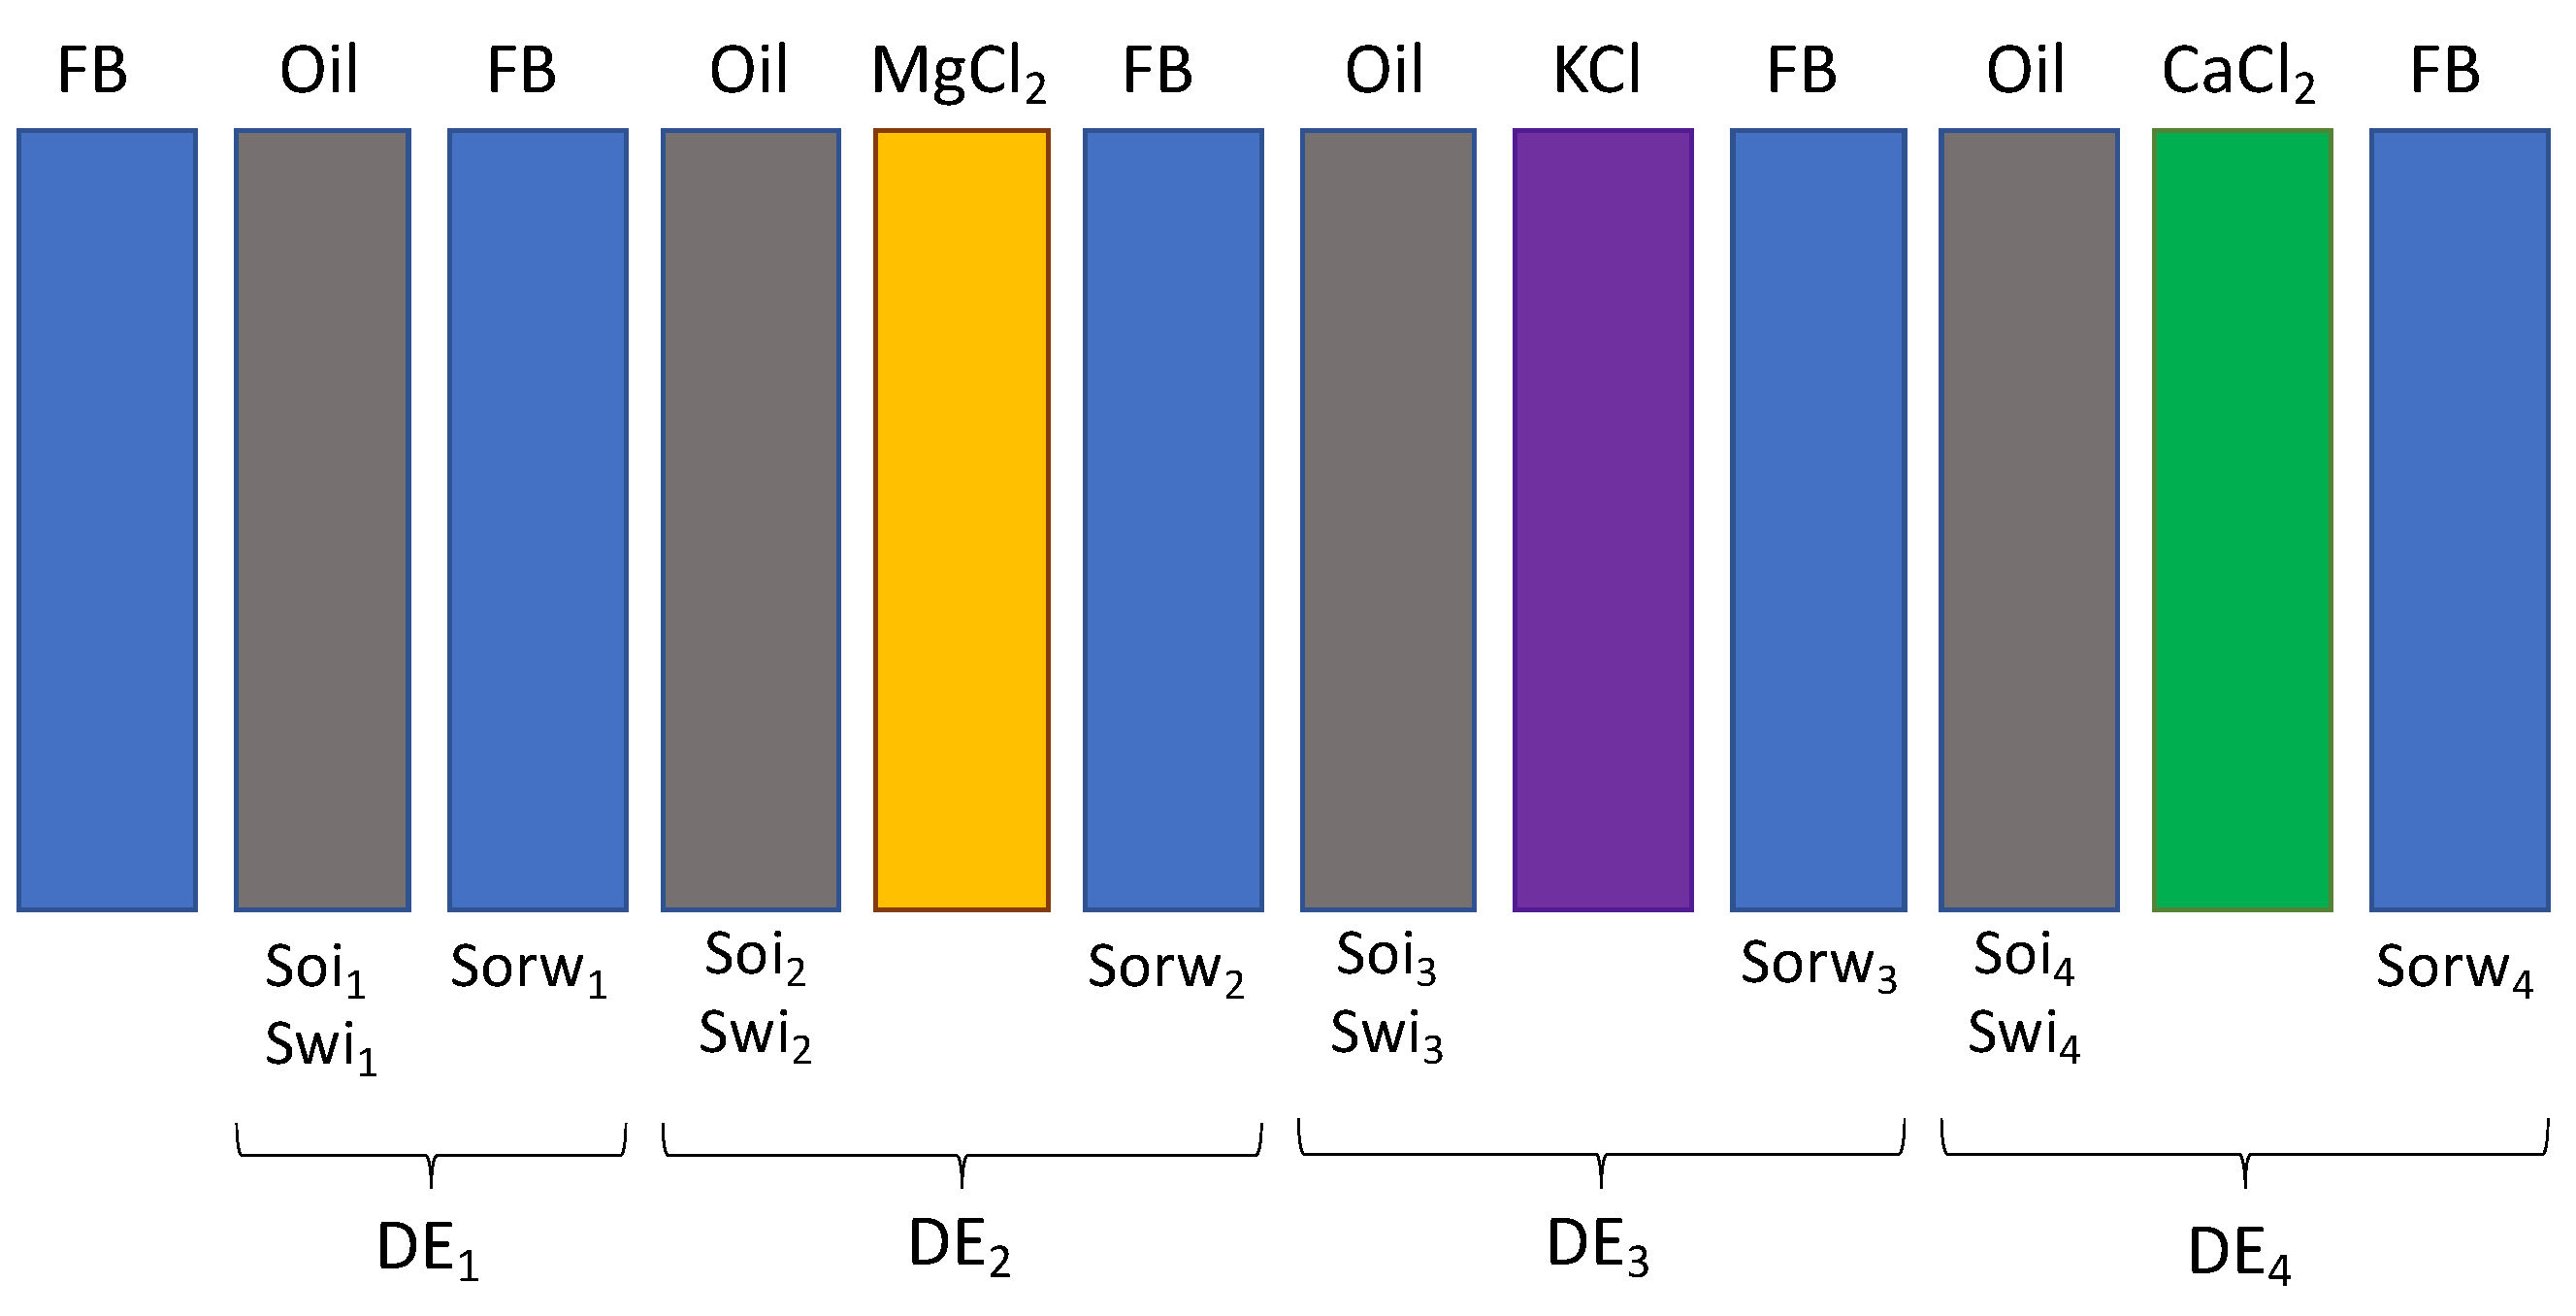
Figure 9.
Differential pressure profiles during displacement efficiencies with FB and low-salinity brine (MgCl2, KCl, and CaCl2) injection, q = 0.167 mL/min.
Figure 9.
Differential pressure profiles during displacement efficiencies with FB and low-salinity brine (MgCl2, KCl, and CaCl2) injection, q = 0.167 mL/min.

Figure 10.
Injected and produced chloride concentrations during the displacement tests without oil.
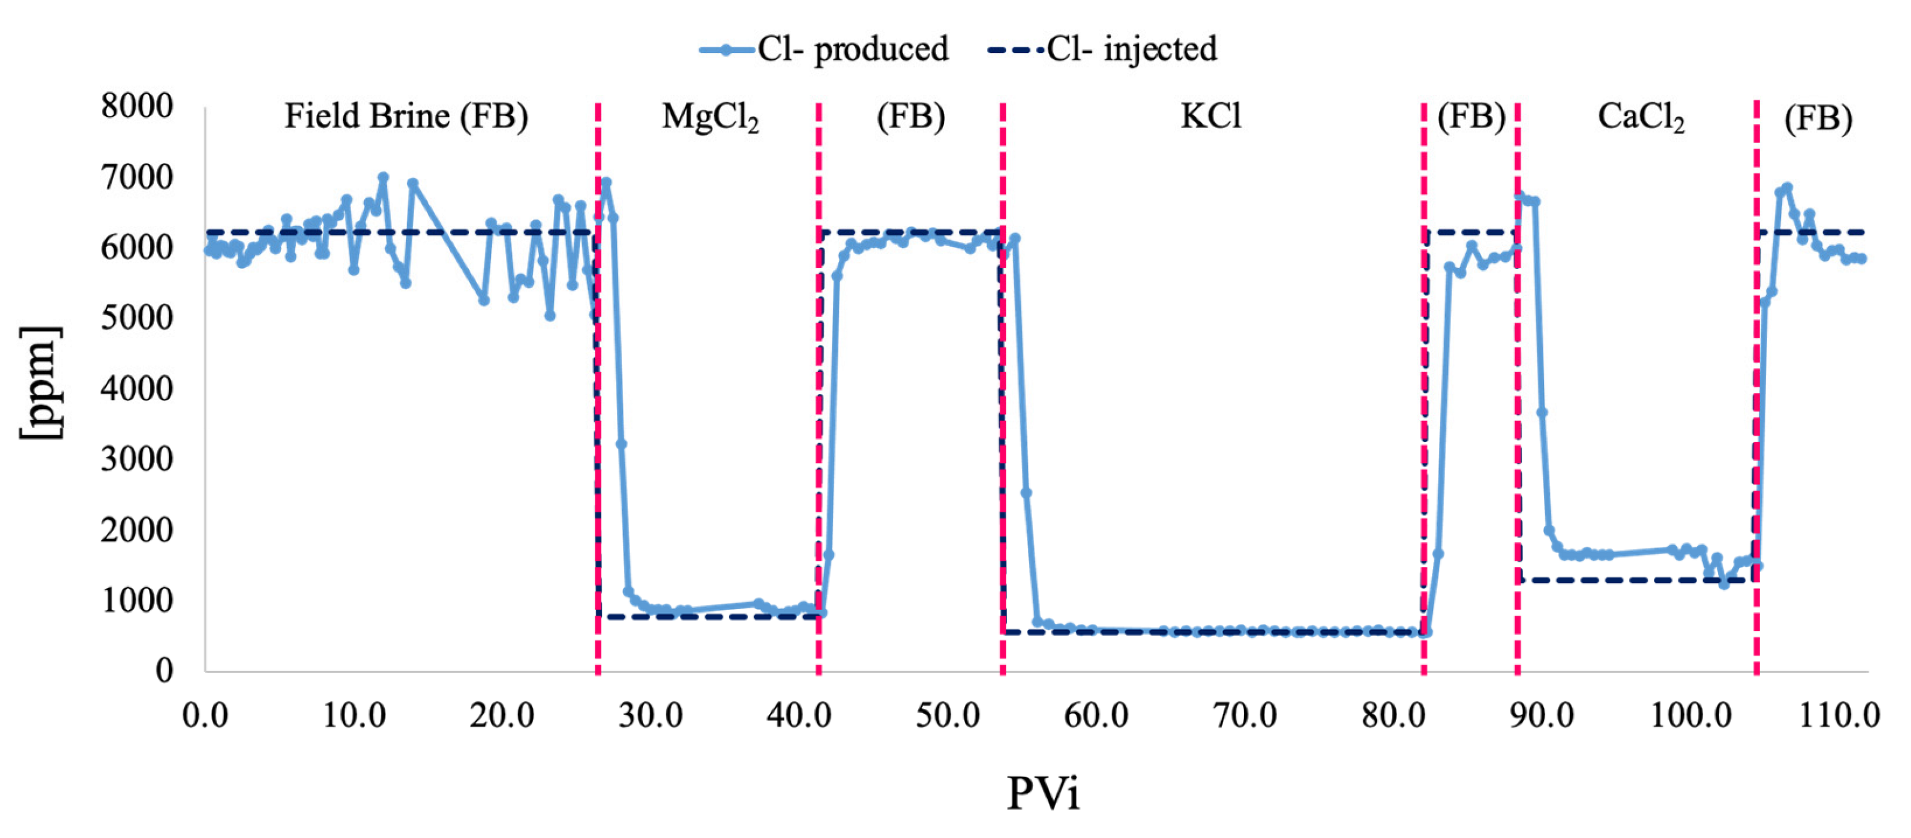
Figure 11.
Injected and produced monovalent cation concentrations during the DEw displacement.

Figure 12.
Injected and produced divalent cation concentrations during the DEw displacement.

Figure 13.
Ionic composition of injection and produced fluids during the DE1.

Figure 14.
Ionic composition of injection and produced fluids during the DE2.
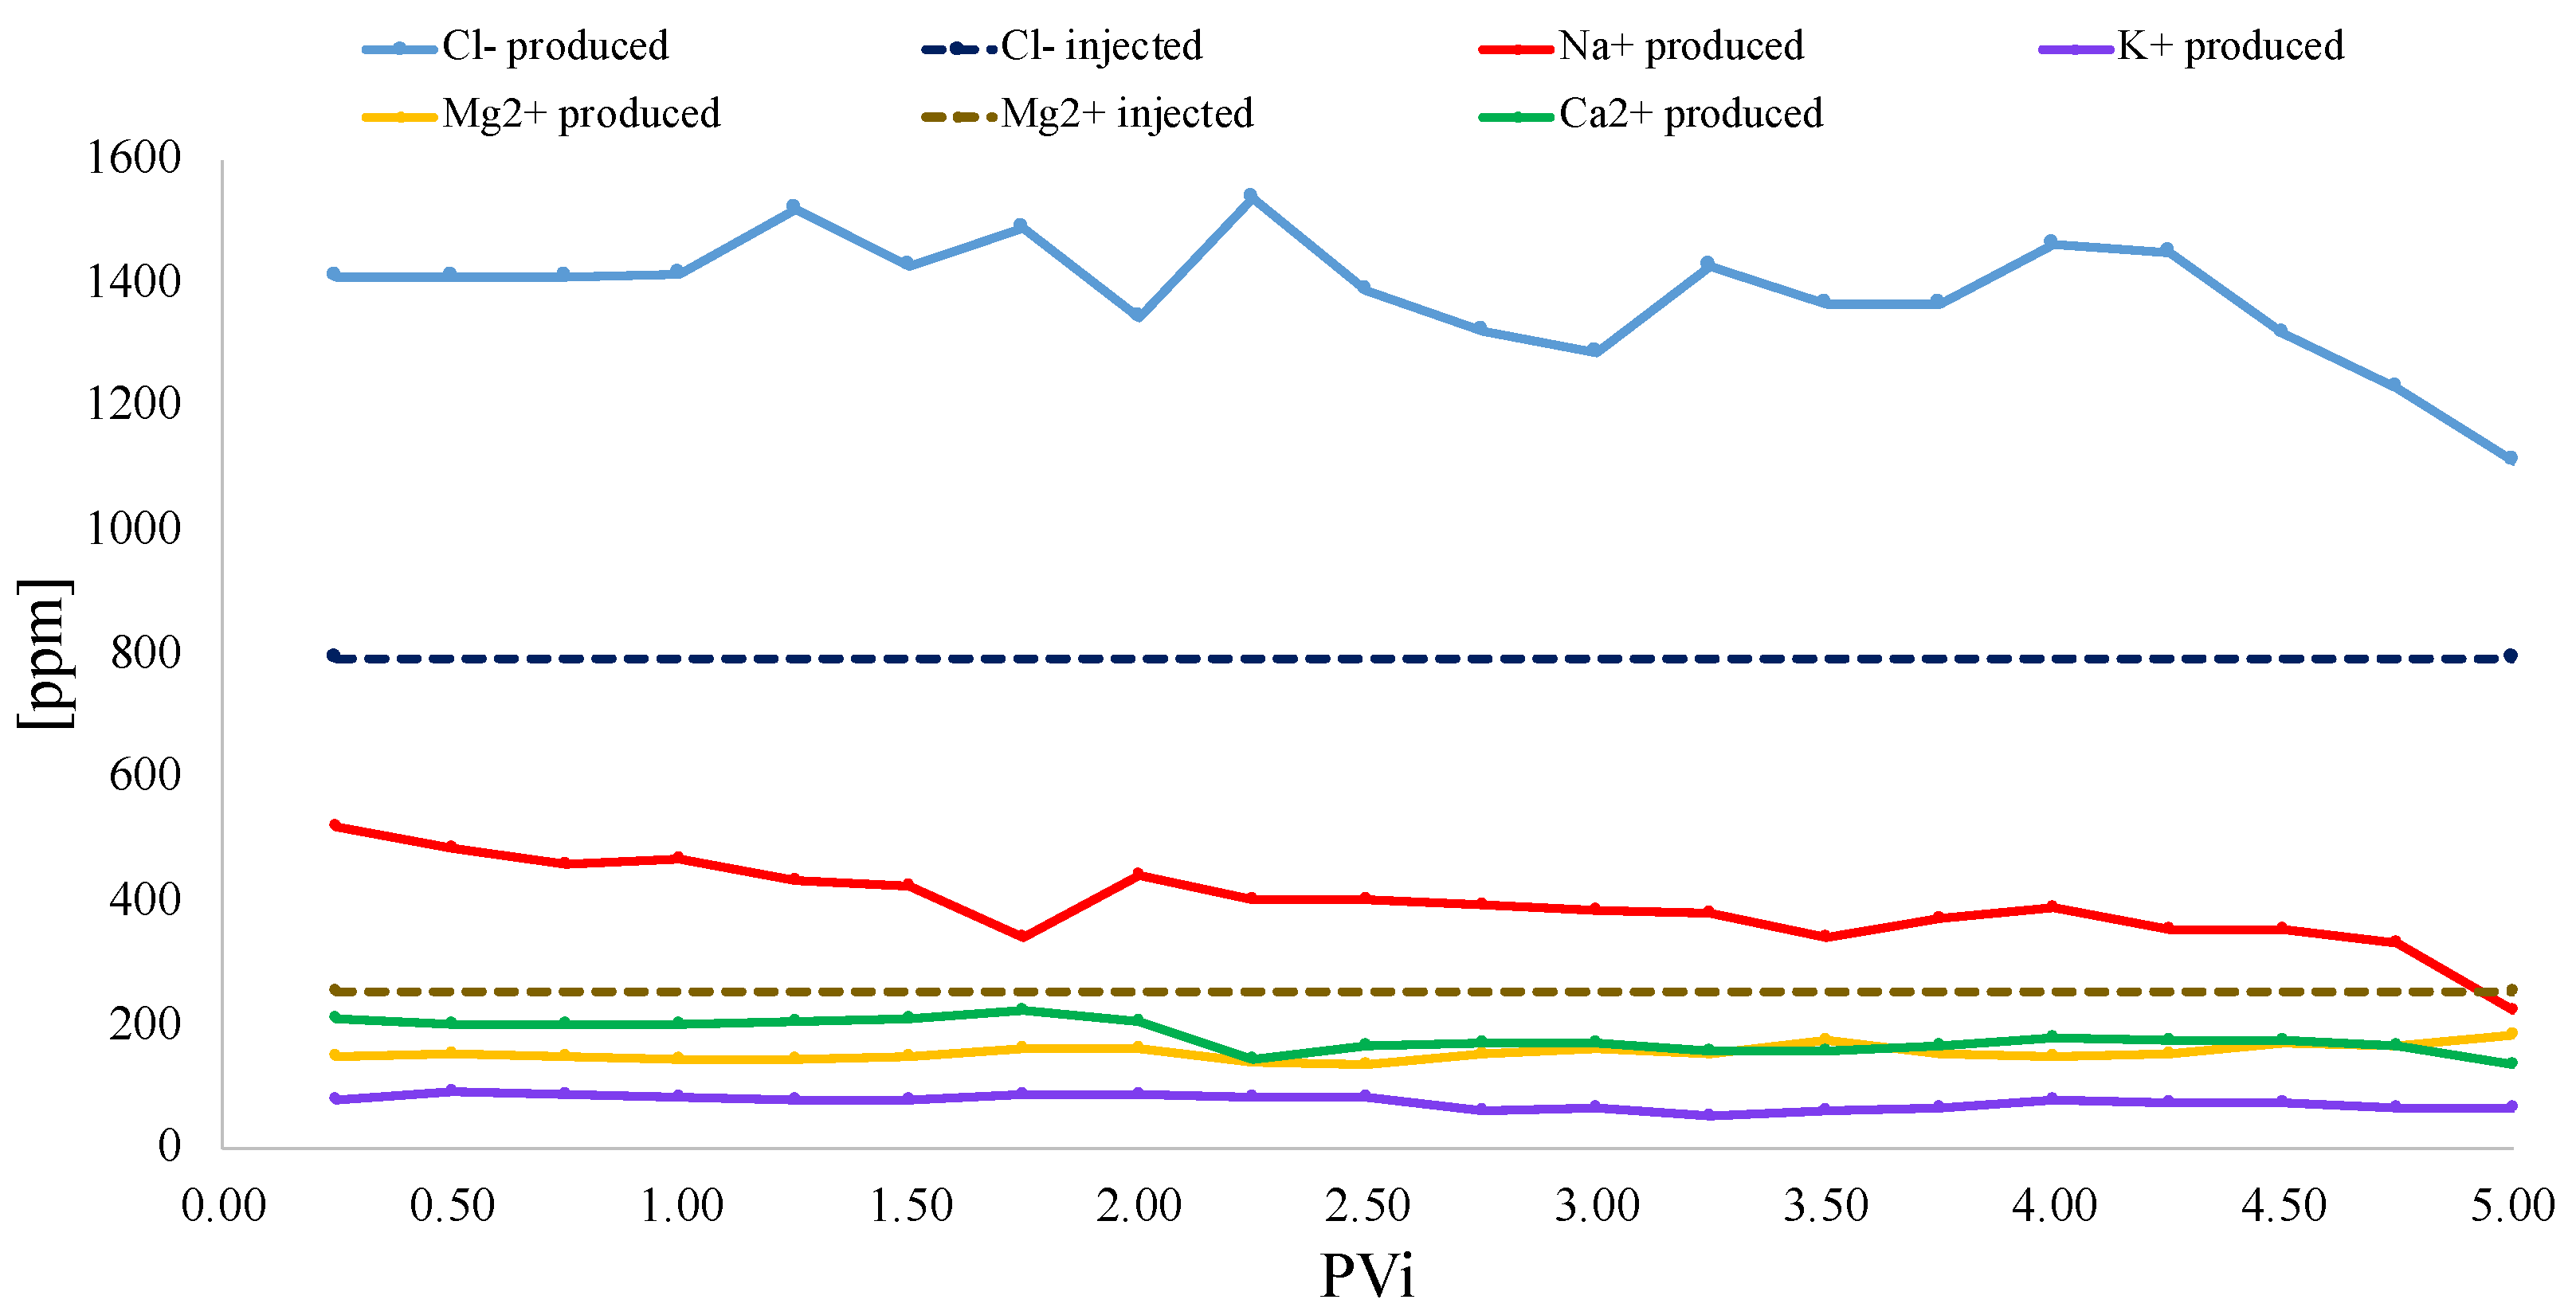
Figure 15.
Ionic composition of injection and produced fluids during the DE3.

Figure 16.
Ionic composition of injection and produced fluids during the DE4.
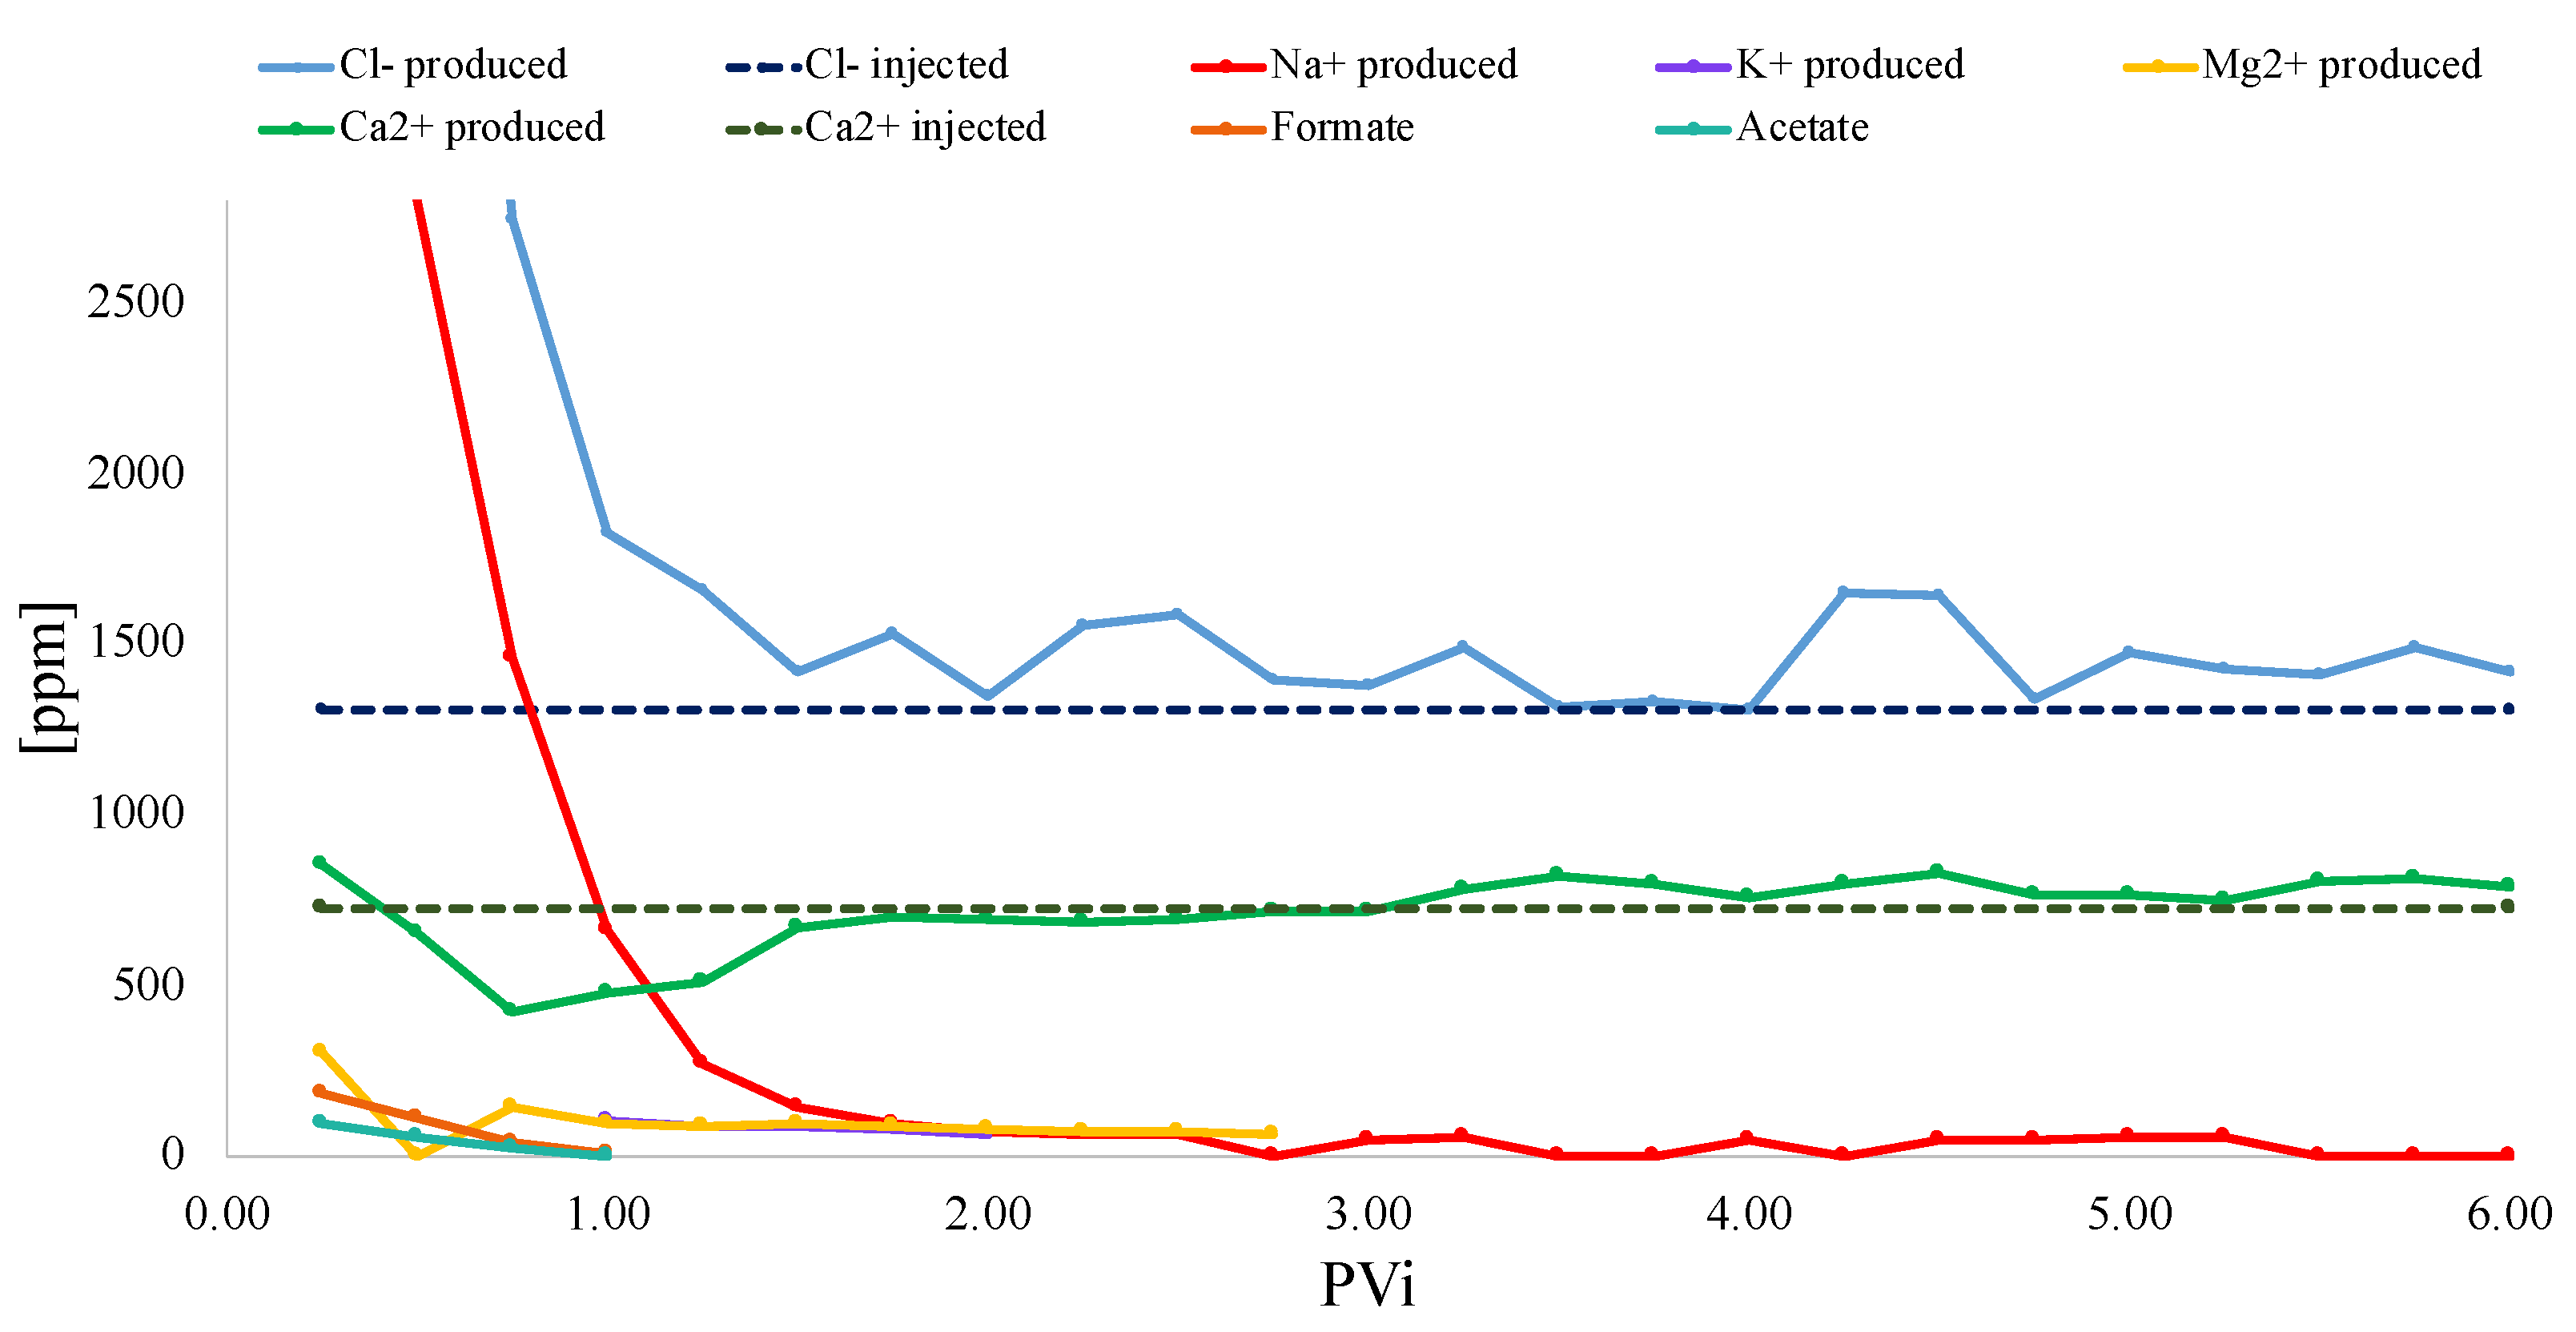
Figure 17.
Displacement ionic composition: (a) Chloride, (b) sodium and (c) calcium profiles.

Figure 18.
Potassium and calcium concentration in the effluent and ΔP of displacement efficiencies injecting different brines.
Figure 18.
Potassium and calcium concentration in the effluent and ΔP of displacement efficiencies injecting different brines.

Table 1.
Physicochemical properties of the formation brine.
| Ion | Field Brine [mg/L] |
|---|---|
| Na+ | 3297.39 |
| K+ | 81.13 |
| Ca++ | 370.62 |
| Mg++ | 61.41 |
| Ba++ | 36.55 |
| Sr++ | 23.25 |
| HCO3− | 1521.15 |
| SO4− | 4.00 |
| Cl− | 5366.23 |
| TDS | 10,800.00 |
Table 2.
Properties of crude oil.
| Property | Unit | Value |
|---|---|---|
| Saturated compounds | (wt%) | 41.94 |
| Aromatic compounds | (wt%) | 30.85 |
| Resins | (wt%) | 22.72 |
| Asphaltene content | (wt%) | 4.49 |
| Acid number (AN) | (mg KOH/g oil) | 0.21 |
| Specific gravity | °API | 27.00 |
| Viscosity 60 °C | cp | 10.50 |
Table 3.
EDXS Berea characterization.
| Elemental Chemical Composition by EDXS | |
|---|---|
| Major Elements Detected | % |
| SiO2 | 90.1 |
| Al2O3 | 6.93 |
| K2O | 1.85 |
| Fe2O3 | 0.7 |
| TiO2 | 0.21 |
| CaO | 0.06 |
Table 4.
Basic petrophysical properties of the porous media.
| Berea Slices—Contact Angle Determinations | |||||
|---|---|---|---|---|---|
| Length (cm) | Diameter (cm) | Pore Volume (cm3) | Porosity (%) | Klinkenberg Permeability (mD) | |
| 0.9–1.0 | 3.70 | 14.9 | 22.2 | 576 | |
| Berea plugs—Coreflooding Tests | |||||
| Water–Oil displacement | 6.75 | 3.84 | 16.7 | 21.6 | 557 |
| Water displacement | 6.94 | 3.84 | 17.2 | 21.6 | 547 |
Table 5.
Interfacial tensions of the analyzed fluids.
| Brine | [ ] | IFT | SD | Brine | [ ] | IFT | SD |
|---|---|---|---|---|---|---|---|
| ppm | [mN/m] | ppm | [mN/m] | ||||
| NaCl | 1000 | 32.78 | 0.15 | MgCl2 | 1000 | 32.24 | 0.15 |
| 3000 | 32.39 | 0.14 | 3000 | 32.81 | 0.17 | ||
| 5000 | 32.64 | 0.13 | 5000 | 32.45 | 0.17 | ||
| KCl | 1000 | 32.53 | 0.18 | CaCl2 | 1000 | 32.56 | 0.16 |
| 3000 | 32.07 | 0.11 | 3000 | 32.54 | 0.17 | ||
| 5000 | 32.38 | 0.14 | 5000 | 32.25 | 0.13 | ||
| DW | – | 35.24 | 0.14 | FB | 10,800 | 30.06 | 0.14 |
SD: standard deviation.
Table 6.
Test conditions for displacement efficiency measurement.
| Parameter | Value |
|---|---|
| Confining pressure (psi) | 2000 |
| Pore pressure (psi) | 200 |
| Temperature (°C) | 60 |
| Brine rate (mL/min) Displacement efficiencies | 0.167 |
| Oil/brine resaturation rate (mL/min) | 0.1–0.2 |
| Brine viscosity at 60 °C [cP] | 0.48 |
| Crude oil viscosity at 60 °C [cP] | 10.5 |
Table 7.
Displacement efficiencies.
| DE1 FB | DE2 MgCl2 1000 ppm | DE3 KCl 1000 ppm | DE4 CaCl2 2000 ppm | |
|---|---|---|---|---|
| Sw | 26.36% | 19.85% | 10.26% | 14.42% |
| Soi | 73.64% | 80.15% | 89.74% | 85.58% |
| %DE | 41.52% | 32.06% | 37.96% | 60.20% |
Table 8.
Concentrations of initial brine detected by CE.
| Cl− | Na+ | K+ | Mg2+ | Ca2+ | ||
|---|---|---|---|---|---|---|
| ID | Brine | ppm | ppm | ppm | ppm | ppm |
| DE1 | FB | 6228.0 | 3166.0 | ND | 40.4 | 503.1 |
| DE2 | MgCl2 | 791.2 | - | - | 255.3 | - |
| DE3 | KCl | 567.8 | - | 524.3 | - | - |
| DE4 | CaCl2 | 1308.7 | - | - | - | 722.3 |
Disclaimer/Publisher’s Note: The statements, opinions and data contained in all publications are solely those of the individual author(s) and contributor(s) and not of MDPI and/or the editor(s). MDPI and/or the editor(s) disclaim responsibility for any injury to people or property resulting from any ideas, methods, instructions or products referred to in the content. |
© 2023 by the authors. Licensee MDPI, Basel, Switzerland. This article is an open access article distributed under the terms and conditions of the Creative Commons Attribution (CC BY) license (https://creativecommons.org/licenses/by/4.0/).
Share and Cite
MDPI and ACS Style
Maya, G.; Carreño Otero, A.L.; Monares Bueno, F.L.; Romero Bohórquez, A.R.; Cortés, F.B.; Franco, C.A.; Manrique, E. Rock–Oil–Brine Dominant Mechanisms in Smart Water Flooding. Energies 2023, 16, 2043. https://doi.org/10.3390/en16042043
AMA Style
Maya G, Carreño Otero AL, Monares Bueno FL, Romero Bohórquez AR, Cortés FB, Franco CA, Manrique E. Rock–Oil–Brine Dominant Mechanisms in Smart Water Flooding. Energies. 2023; 16(4):2043. https://doi.org/10.3390/en16042043
Chicago/Turabian StyleMaya, Gustavo, Aurora L. Carreño Otero, Fabián L. Monares Bueno, Arnold R. Romero Bohórquez, Farid B. Cortés, Camilo A. Franco, and Eduardo Manrique. 2023. "Rock–Oil–Brine Dominant Mechanisms in Smart Water Flooding" Energies 16, no. 4: 2043. https://doi.org/10.3390/en16042043
Note that from the first issue of 2016, this journal uses article numbers instead of page numbers. See further details here.