
Linear Model for Two-Layer Porous Bed Suspended with Nano Sized Particles

1
Department of Mathematics, Gulbarga University, Gulbarga 585 106, Karnataka, India
2
Department of Theoretical Mechanics, Tomsk State University, 634050 Tomsk, Russia
3
Laboratory for Interdisciplinary Problems of Energy Production, Ulyanovsk State Technical University, 432027 Ulyanovsk, Russia
*
Author to whom correspondence should be addressed.
Energies 2023, 16(4), 2044; https://doi.org/10.3390/en16042044
Submission received: 31 December 2022
/
Revised: 14 February 2023
/
Accepted: 17 February 2023
/
Published: 19 February 2023
Abstract
:Two immiscible fluids flows are materialized in science and technology; the combined convection of the two immiscible fluids in a square conduit is reviewed in this study. The nanofluid and pure viscous fluid which do not mix are discussed, and both layers saturated with a porous matrix have different permeabilities. The Dupuit–Forchheimer and Tiwari–Das models are applied to outline the permeability of the layer and nanofluids, respectively. The finite difference method is utilized to find the solutions of conservation equations along with suitable boundary and interface conditions. The boundary condition for the velocity is no slip at all the boundaries, while continuity of velocity and shear stress are used at the interface. The left and right walls are kept at constant but different temperatures, the top and bottom walls are isolated, and the continuity of temperature and heat flux is assumed at the interface. Grashof number, Brinkman number, Darcy number, inertia parameter, permeability ratio, solid volume fraction, thermal conductivity and viscosity ratios, different nanoparticles, and various base liquids of the two-layered fluids are engaged. The velocity is depleted by the inertia and viscosity ratio while it is accelerated with the Darcy and Grashof numbers. The energy distribution was not modulated significantly with any of the dimensionless numbers. Using copper nanoparticles doped in mineral oil and ethylene glycol produced the peak momentum. Diamond nanoparticles dropped in water catalysis showed the best heat transfer rate.
1. Introduction
The modeling of convective flows is a vital downside in every applied and theoretical term. The convective flows contacting through the interface perform a necessary role in technology, the nuclear business, and cooling gadgets in electronics. The immediate position of multi-layer immiscible fluids can fill in diverse configurations [1,2,3,4]. Umavathi et al. [5], Liu et al. [6], and Umavathi and Sheremet [7] have examined the flow tendency of two immiscible fluids poured in various geometries such as vertical and horizontal channels, wavy vertical channels, and vertical ducts since 1997.
The difficulty with researching the multi-fluid flow state of affairs is the interplay among specific sorts of fluids, specifically inside the same geometry. Some pioneers have made progress to this point. Laminar flow in a horizontal channel filled with non-mixing fluids was measured by Packham and Shail [8]. Many problems in engineering are related to concurrent flow of multiple fluids through porous beds including ground water remediation and oil recuperation. Ghassemi and Pak [9] worked on relative permeabilities of non-mixing fluids past the porous matrix.
Low standard overall performance of conventional energy transfer fluids has intensified the research for developing many techniques to improve the rate of energy transfer for cooling systems in industrial applications. Researchers have been working on this topic for more than five decades. Initially research was carried by sprinkling micro- and millimeter sized particles since Maxwell [10] regulated the analytical model. However, this type of model created many obstacles such as jamming the small channels, settling very fast, etc. In 1995, Sus and Ja [11] prepared the nanofluid, and carried out their study in technological and industrial fields. Some predecessors’ thrilling investigations are included, however now no longer confined to, the subsequent instances. Bahiraei and Heshmatian [12] tried to study the fluid flow of the hybrid nanofluid suspended with graphene-silver particles inside micro-channels. The stability analysis of nanofluid saturated with Newtonian and/or non-Newtonian fluids was tested by [13,14,15]. The heat transfer of a double-pipe heat-exchanger of alumina nanofluid was analyzed by Shirvan et al. [16]. Natural convection through a porous wavy cavity filled with nanofluid was investigated by Sheremet et al. [17] including the impact of thermal dispersion by adopting the Forchheimer–Buongiorno approach. Further Sheikholeslami and Ganji [18] furnished diversified semi analytical methods and nanotechnology applications to open doors for researchers. Heris et al. [19] designed an experiment to calculate rate of heat transfer of Al2O3/water nanofluid flowing through a square duct. They proved that there was a reinforcement of the coefficient of heat transfer up to 27.6% (2.5% volume fraction) compared with only the base fluid (in the absence of nanoparticles). Moreover, they observed that heat transfer was augmented by increasing the nanoparticles’ concentration at high flow rates. Nassan et al. [20] carried out the comparative analysis of heat transfer between CuO/water and Al2O3/water nanofluids flowing through a square cupric duct using constant heat flux. Both the nanofluids increased the heat transfer in comparison with the base fluid. However, the CuO/water nanofluid proved to be a better nanofluid compared with the Al2O3/water nanofluid to strengthen the heat transfer. Heris et al. [21] also proved that 20.7% enhancement was achieved in Nusselt values for 1.5% volume concentration using distilled water as the base fluid and CuO as the nanoparticle for the fluid poured inside the square duct. They also claimed that the reason for the reduction in rate of heat transfer near the corners of the square duct was due to the existence of a static section in the square duct.
Li et al. [22] explored the flow characteristics of non-miscible fluids stuffed inside a two-dimensional horizontal annulus. They found that the initial distribution using denser fluid was fussy to resolve the final fluid distribution. They further continued the analysis by adding nanoparticles and discussed some aspects on the control of two-fluid gravity-driven flow which has applications in heating power generation technologies and in solar cooling. Li et al. [23] also explored flow in a vertical channel filled with two different fluids. They concluded that the nanofluid with lower volume fraction was a better model to achieve higher fluid flow and that increasing volume fraction of nanoparticles in one layer boosted heat transfer in both layers. Farooq et al. [24] also deliberated the nanofluid properties in a duct. Similar work was carried out by Khan et al. [25] for the nano Eyring–Powel adjacent to a clear Eyring–Powel fluid stuffed in a channel.
By citing the prior literature on two immiscible fluid layers, the present work is focused on reckoning distinct nanoparticles in the upper fluid layer and saturating two immiscible layers by porous bed having different permeabilities. The work is not focused only on the rate of heat transfer as related to antecedent works, but also reports the data of the nanoparticles volume fraction and ratio of permeabilities to resolve the effects of interfacial drag in two-layer fluids. This study has applications in petroleum reservoir simulations and in energy conservation.
2. Mathematical Formulation
Figure 1 exhibits that the duct is filled with two Newtonian non-miscible fluids which are marked as layer-1 (upper layer) and layer-2 (lower layer). The upper layer has a porous matrix with permeability κ1 saturated with nanofluid and the lower layer is filled with a porous bed with permeability κ2. The Darcy and viscous dissipations are considered. The porous beds and nanofluids are modeled mathematically with Forchheimer and Tiwari–Das, respectively. The boundary conditions on temperature are flux at the top and bottom and Tw1 and Tw2 at the vertical left and right boundaries in such a way that Tw2 > Tw1. Velocity is zero on all the boundaries. The width of the duct is b whereas the height of layer-1 is a1/2 and layer-2 is a2/2. The physical aspects such as viscosity and thermal conductivity are assumed to be constant. Further, the interface conditions are simulated to have continuity of shear stress, heat flux, temperature, and velocity. The nanofluid in layer-1 is detailed to have ρnf (density), μnf (viscosity), Knf (thermal conductivity), βnf (thermal expansion coefficient), and κ1 (permeability) and layer-2 is said to have viscosity μ2, density ρ2, thermal expansion coefficient β2, thermal conductivity K2, and permeability κ2. Three combinations of two layers such as (a) engine oil and mineral oil, (b) ethylene glycol and mineral oil, and (c) ethylene oil and kerosene are acknowledged for base fluids along with copper as the nanoparticle. Using water as the base fluid in both layers, the prospects of copper, diamond, and titanium oxide nanoparticles are prepared. Following Sus and Ja [11], the Navier–Stokes equations are defined as follows.
- -
- Layer-1 (Permeable nanofluid)
- -
- Layer-2 (Permeable fluid)
The boundary and interface conditions as prescribed are
- -
- Layer-1
- -
- Interface
- -
- Layer-2
Equations (1)–(7) are expressed in zero dimensions adopting the following relations.
and the reduced forms are
- -
- Layer-1
- -
- Layer-2
The conditions on the walls and at the interface are
- -
- Layer-1
- -
- Interface
- -
- Layer-2
3. Numerical Solutions
Equations (9)–(12) are solved using the finite difference method along with Equations (9)–(12). Layer-1 is divided into Nx1 and layer-2 is divided into Nx2 grids along the x-axis with Δx as the length of one step and Ny grids along the y-axis with Δy step length. By applying the central finite difference of the first and second kind, the finite difference equations become
- -
- Layer-1
- -
- Layer-2
The discretized boundary and interface wall conditions take the form
- -
- Layer-1
- -
- Interface
- -
- Layer-2
The numerical iterations are stopped by adopting the condition that if the difference between two iterations is 10–8 then computations are stopped. The validation of the code is justified by two methods. One method is the grid independence test. The second is to compare the average Nusselt values with the literature. The values of the average Nusselt number using different grids are tabulated in Table 1. This table confirms that the grid of 101 × 101 nodes is sufficient to attain the accuracy. In the absence of nanoparticles and a porous bed, the solutions correspond with Umavathi and Bég [26] which are shown in Table 2. To further validate the code, the solutions obtained by Oztop et al. [27], Moshkin [28] (two-layer fluid flows), and De Vahl Davis [29,30] correspond with Umavathi and Bég [26].
The results are laid out in the form of charts and tables. The values of all the parameters are taken for P = –1, ϕ = 0.01, Da = 0.01, I = 4, κ = 1, λ = 1, K = 1, Gr = 10, Br = 0.1 except the varying one. Water is taken as base fluid and copper as nanoparticle while computing the influence of ϕ, Da, I, κ, λ, K, Gr, and Br. The different nanoparticles considered are copper, diamond, and titanium oxide. Engine oil—mineral oil, ethylene glycol–mineral oil, and ethylene oil–kerosene are three types of base fluids considered.
4. Results and Discussion
The analysis was performed for wide ranges of Darcy numbers, inertial parameters, ratio of permeabilities, Grashof and Brinkman numbers taking into account different base fluids, and different nanoparticles. The graphs in 3D portray good flow visualization, the graphs in 2D mark the contours, and the graphs in 1D designate the profiles (the 1D graphs are drawn at x = 0.5 for variations in y from 0 to 1).
4.1. Velocity for Different Combinations of Base Fluid
Figure 2a,b detail the velocity distributions using the mixture of engine oil (layer-1)—mineral oil (layer-2), ethylene glycol (layer-1)—mineral oil (layer-2), and ethylene glycol (layer-1)—kerosene oil (layer-2). The 3D plots visualize that there is almost no flow in layer-1 and the curvature is convexly bent on the top and bottom plates of the duct for engine oil—mineral oil, there is almost equal distribution of fluid in both the layers and the contours are flat at the top and bottom plates for ethylene glycol—mineral oil and for ethylene glycol—kerosene oil. Flow occurs in both layers but convexity is drenched in layer-2 compared with layer-1. The flow is better viewed in the 2D picture which shows that there are no contours in layer-1 and two cells are formed in layer-2, which are almost symmetric for the combination of engine oil–mineral oil; flow contours appear in both the layers and are proportional for ethylene glycol–mineral oil; and for the mixture of ethylene glycol–kerosene, contours are formed in both the layers and the distributions are not symmetric. The 1D chart clearly manifests that at the interface point, engine oil–mineral oil takes the minimum at the left half and maximum at the right half of the duct whereas the other two mixtures are not much reformed. That is to say that the flow patterns are almost same for the other two mixtures.
4.2. Velocity Distributions for Different Nanoparticles Materials Using Water as the Base Fluid
Figure 3 presents the repercussion of the presence of nanoparticles. Copper, diamond, and titanium oxide are utilized as nanoparticles with water as the base fluid in both layers for equal permeabilities. Both the 3D and 2D plots visualize that there is no difference on the flow when using different nanoparticles. The number of contours is balanced in both the fluid layers. The 1D graph also does not reflect any changes. Hence, values of velocity are provided in Table 3 which exhibits that the copper nanoparticle produces slightly more flow in comparison with the other two materials.
4.3. Velocity Distributions for Different Values of Solid Volume Fraction
Figure 4 shows the influence of solid volume fraction. For regular fluid (ϕ = 0), the flow structure is flat in the upper and lower fluid layers and symmetric contours are captured. The similar 3D and 2D view is anticipated for ϕ = 0.0 and ϕ = 0.01 but by appending more nanoparticles (ϕ = 0.05) the flow is almost nil in layer-1 and the flow is convexly symmetric in both the upper and lower plates of the duct (3D) and the number of contours are five in layer-2 and is one in layer-1. Hence the occurrence of extensive nanoparticles reduces the flow. This is further justified by Figure 4b (1D) which exposes that as ϕ increases, the velocity reduces. The reason for the reduction in velocity by increasing ϕ is due to the fact the viscosity of the base fluid increases as ϕ increases.
4.4. Velocity and Temperature Distributions for Different Values of Darcy Number
The leverage of Da on the momentum and energy are manifested in Figure 5a–c. For Da = 0.001 the 3D plot shows that the flow is flat in both layers and the contours (2D) are linear and symmetric in both layers, indicating that flow is almost stagnant. For higher values of Da the shape of the flow is bulging outside in both layers (3D). The flow contours (2D) are circular at the core region and become flat at the boundaries. Figure 5b (1D) also shows that the line is almost linear for Da = 0.001 and there is not much difference in the flow for values of Da = 1, 2. The presence of a porous bed does not pressurize the energy distributions as can be sighted in Figure 5c. However, when a portion of the profiles is enlarged, the temperature is low for Da = 0.001. The suppression in the velocity and temperature for low values of Da physically indicates that the porous bed is packed thickly and hence fluid cannot flow fast which also reduces the transfer of heat.
4.5. Velocity and Temperature Distributions for Different Values of Inertial Parameter
Figure 6 shows the inertial parameter on the velocity. The 3D and 2D contours are not altered for all values of I. However, Table 3 infers that velocity decreases as I increases. The values of velocity are equal to three decimal places and differ from fourth decimal place. Though the reduction is very small, I suppresses the velocity. The presence of inertial parameter generates the dragging effect, hence the flow is reduced. Since both layers are kept at equal permeabilities and the equal drag effect is created and there is no significant diversity in both layers. Table 3 also depicts that the values of temperature are equal for all values of I as there is no noticeable change in the velocity, hence the temperature is constant with occurrence of I.
4.6. Velocity Distributions for Different Values of Permeability Ratio
The holdings of different permeabilities in two layers is exhibited in Figure 7a,b. The parameter κ is treated as the ratio of the permeability in layer-1 to layer-2. Hence assigning the values of κ = 0.1 indicates that the permeability in layer-2 is ten times that of layer-1, κ = 1.0 implies that both layers pose equal permeabilities and κ = 2.0 means that the permeability in layer-1 is two times that of layer-2. Figure 7a shows that the curvature peaks in the upper portion when κ = 0.1 and peaks in the lower portion for κ = 2.0. The 2D plots set out that the curves are close at y = 1 and sparse at y = 0 for κ = 0.1, dense at the left wall and sparse at the right wall for κ = 2.0, and symmetric contours at both the left and right walls of the duct. Figure 7b (1D) also shows that as κ increases, velocity decreases in the range 0.5 ≤ y ≤ 1 (right wall) and increases in the range 0.0 ≤ y ≤ 0.5 (left wall). The low values of permeability represent a densely packed porous bed, and high values represent a sparsely packed porous bed.
4.7. Velocity Distributions for Different Values of Viscosity Ratios
Figure 8a,b show the response of λ. The sharp convex contours are attained for λ = 0.1, 1.0; the contours are flat in the lower zone compared with the upper zone (in 3D). The number of contours is less in layer-2 than in layer-1 as viewed in the 2D plots. Figure 7b shows that as λ increases as velocity decreases in the right plate.
4.8. Velocity Distributions for Different Values of Thermal Conductivity Ratio
The occurrence of K can be viewed in Figure 9. The number of contours is symmetric in both the layers for all values of K. Table 1 conveys that both the velocity and temperature decrease but the values are equal for all values of K up to three decimal places and hence the thermal conductivity ratio does not disturb the flow.
4.9. Velocity and Temperature Distributions for Different Values of Grashof Number
The inspections of Gr are presented in Figure 10a,b (velocity) and Figure 2c,d (temperature). As Gr increases, flow is expanded and are symmetric for Gr = ±25. However, the direction of flow is from left to right for Gr = –25 and from right to left for Gr = 25. For Gr = 0, the flow is only in the upward direction (3D). The 2D contours are regular in two layers for Gr = ±25 and there are two cell formations, whereas for Gr = 0 the lineaments are compact and only one cell is formed (Figure 2a). For Gr = –25 the velocity is gained at the cold wall and sapped at the hot wall while it is reversed for Gr = 25. The temperature contours are pictured in Figure 2c,d. The 3D and 1D figures explain that the energy is not intimately reacted in the presence of Gr. However, when the figure is elaborated, the temperature is upsurged (Figure 2d).
4.10. Velocity and Temperature Distributions for Different Values of Brikman Number
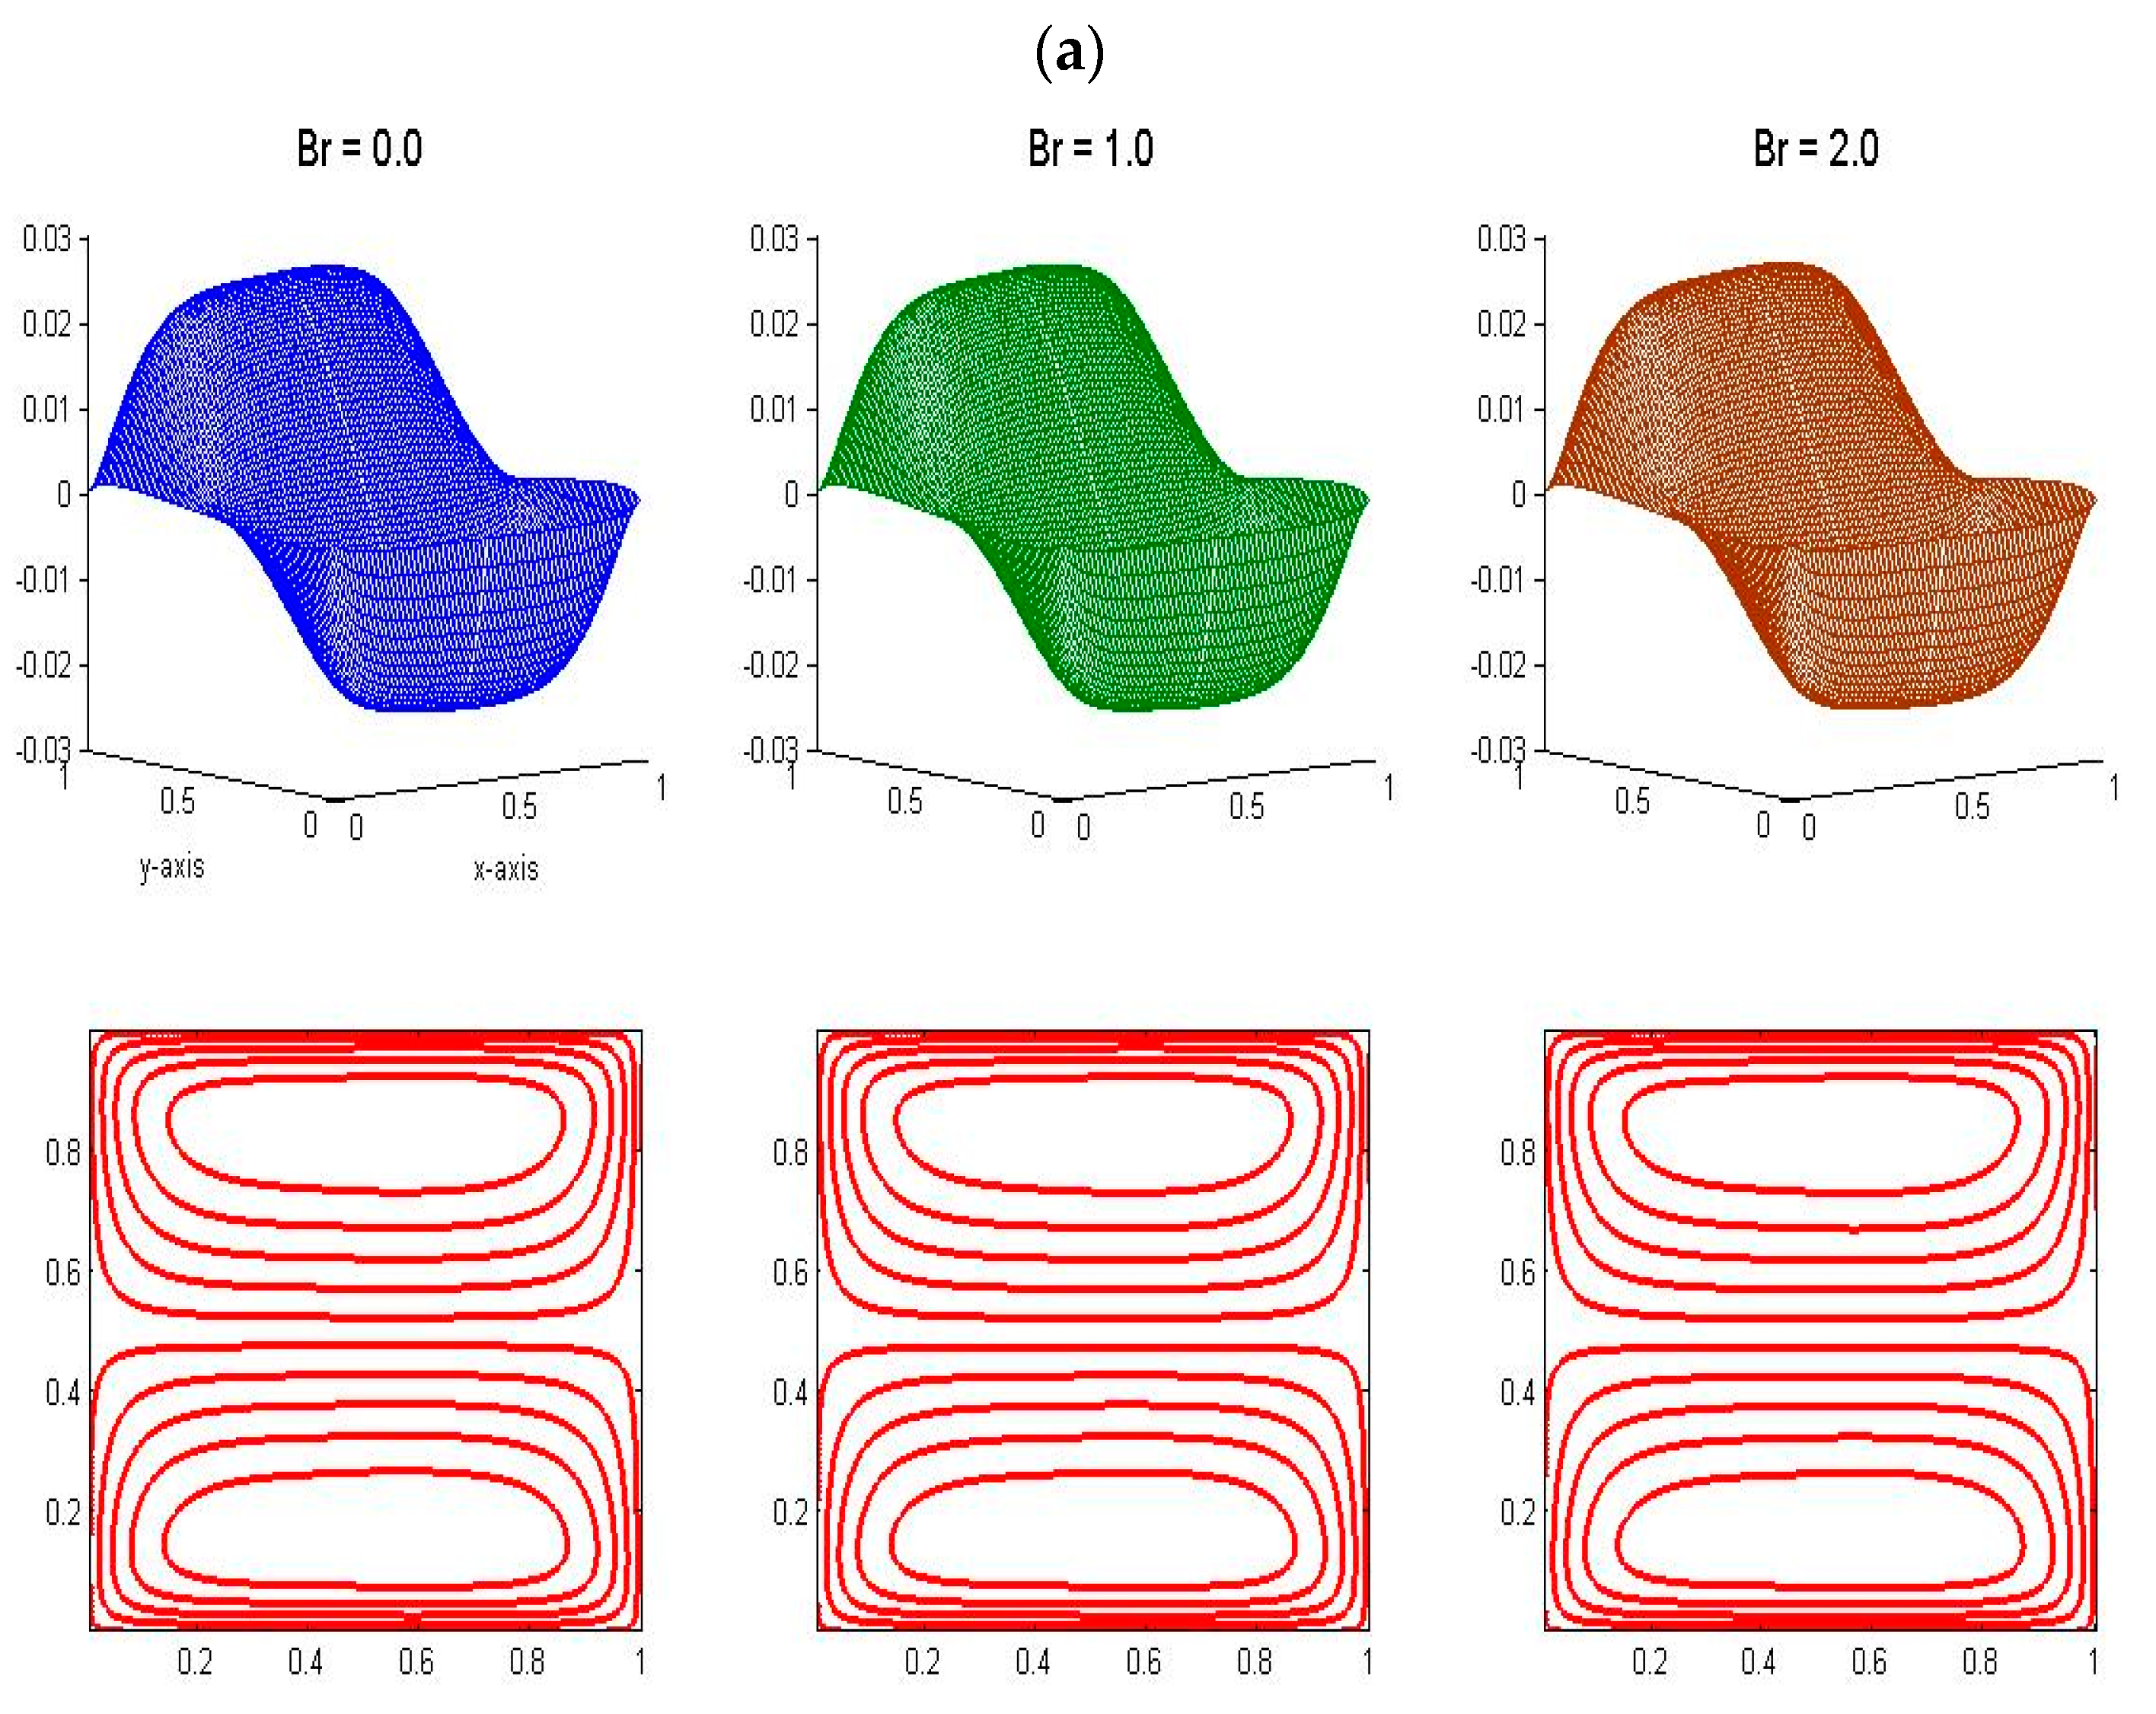
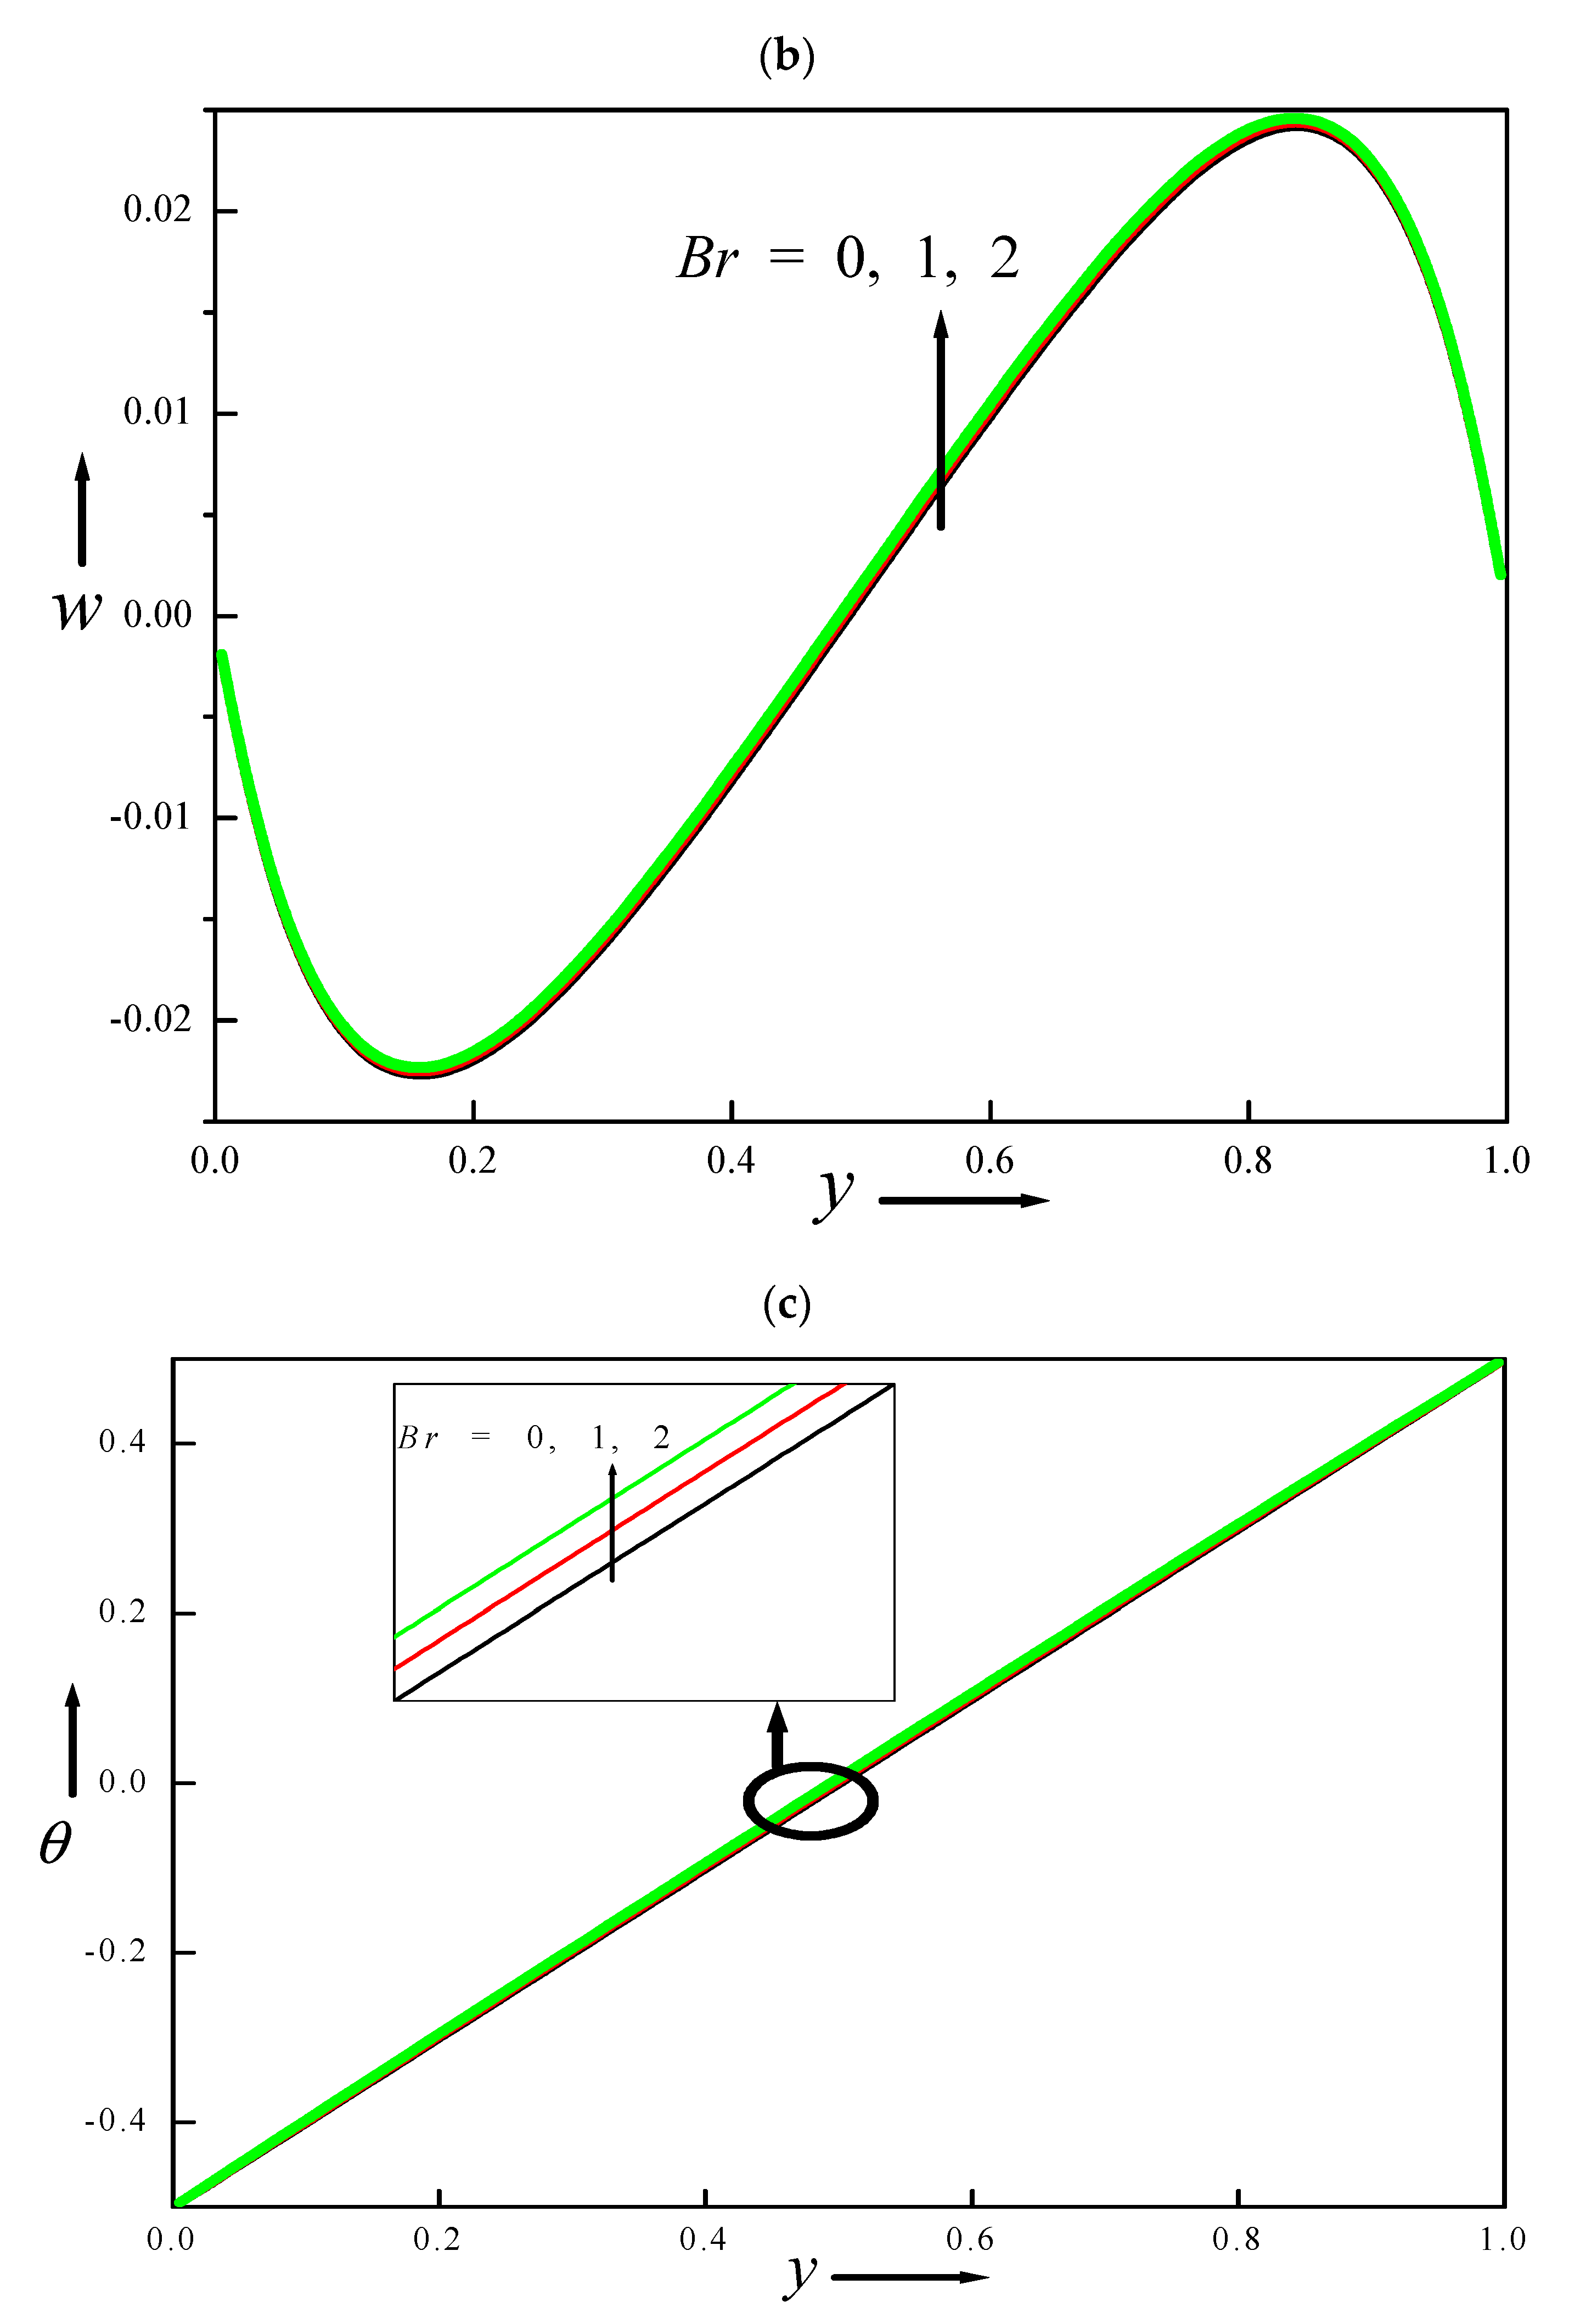
The significance of Br on the flow is shown in Figure 11a–c. The 3D visualization confers that the convex curvatures are flat in both the layers, and are symmetric for all values of Br. The 2D pictures also reveal that the number of contours is equal and symmetric in both the layers for all values of Br. However, the momentum (Figure 11b) and energy (Figure 11c) advance as Br is improved, which is shown in 1D. This is due to the fact that fluids in both layers are similar as all the remaining parameters are fixed. The 3D and 2D pictures are not presented for the significance of different base fluids, different nanoparticles, ϕ, Da, I, κ, λ, K, and Br, because the contours are similar to that of the effects on Gr. The temperature contours are not transformed much as the top and bottom plates are insulated.
4.11. Values of Volumetric Flow Rate and Skin Friction
The volumetric flow rate is declined by the inertia, volume fraction, ratios of permeability, viscosity, and conductivity and is surged by the Grashof, Brinkman, and Darcy values. The presence of nanoparticles does not alter Q (Table 4). The Darcy number improves the friction whereas the other parameters deplete the friction at both ends of the duct. The maximum friction is attained using copper as a nanoparticle.
4.12. Values of Average Nusselt Number
In layer-1, the average Nu values decrease from Gr = –25 to Gr = 0 and then increase from Gr = 0 to Gr = 25; Br, Da, and ϕ help to gain but I, κ, λ, and K deplete the Nu at the left plate (see Table 5). In layer-2 the effect of Gr is similar to layer-1 at both walls. The parameters Br and Da boost but I, κ, ϕ, λ, and K drop the Nusselt values at the left wall. At the right wall, I, κ, ϕ, λ, and K surge whereas Br and Da decline the rate of heat transfer. The diamond nanoparticles cause for highest values of Nu at both the plates in both the layers, but in layer-2 the presence of nanoparticles do not deteriorate the rate of heat transfer. The engine oil–mineral oil combination provides the highest Nu values at the left plate but the ethylene glycol–kerosene combination causes the rate of heat transfer to rise in layer-1 and layer-2.
5. Conclusions
Two fluids which are not miscible are poured in a duct. The upper portion is filled with a nanofluid saturated with a porous medium and the lower portion is filled with only viscous fluid saturated with a porous medium whose permeability is different from the upper portion. The Tiwari–Das model and Forchheimer effects are incorporated. The numerical values recomputed using difference equations along with the Southwell over-relaxation technique. The validation of the code is carried out with a grid independence analysis and compared with the published papers under limitations. The consequences are:
(a) The engine oil (layer-1)–mineral oil (layer-2) combination does not show any flow in layer-1 and two cell formations are attained in layer-2 whereas ethylene glycol (layer-1)—mineral oil (layer-2) combination and ethylene glycol (layer-1)—kerosene oil (layer-2) combination cause the fluid to flow in both the layers;
(b) Using copper, diamond, or titanium oxide nanoparticles in water does not develop noticeable variations on the velocity and temperature. At the same time, skin friction and average Nusselt number can be changed with the variation in nanoparticles material. It is worth noting that the base fluid is more essential compared with nanoparticles material within the considered nanofluids with low nanoparticles volume fraction;
(c) Gr, Br, and Da expand but ϕ and λ shrink the velocity and I and K do not alter the flow;
(d) Engine oil–mineral oil provides the highest Nusselt values at the left plate but ethylene glycol–kerosene is the cause to rise the rate of heat transfer in layer-1 and layer-2. The diamond nanoparticle causes the highest rate of heat transfer at both the plates in both the layers but in layer-2 the presence of nanoparticles does not deteriorate the rate of heat transfer. Br and Da increase but ϕ, I, κ, λ, and K reduce the rate of heat transfer at the left wall, and the opposite impact is observed at the right wall.
Author Contributions
Conceptualization, J.C.U.; methodology, J.C.U. and M.A.S.; investigation, J.C.U.; writing—original draft preparation, J.C.U. and M.A.S.; writing—review and editing, J.C.U. and M.A.S. All authors have read and agreed to the published version of the manuscript.
Funding
This work of the second author was supported by a Megagrant from the Government of the Russian Federation within the framework of federal project No. 075-15-2021-584.
Data Availability Statement
All data are included in the paper.
Conflicts of Interest
The authors declare no conflict of interest.
References
- Li, H.; Yap, Y.; Lou, J.; Shang, Z. Numerical investigation of heat transfer in three-fluid stratified flows. Int. J. Heat Mass Transf. 2015, 89, 576–587. [Google Scholar] [CrossRef]
- Khaled, A.R.A. Heat transfer enhancement in a vertical tube confining two immiscible falling co-flows. Int. J. Therm. Sci. 2014, 85, 138–150. [Google Scholar] [CrossRef]
- Huang, Y.; Li, H.; Wong, T.N. Two immiscible layers of electro-osmotic driven flow with a layer of conducting non-Newtonian fluid. Int. J. Heat Mass Transf. 2014, 74, 368–375. [Google Scholar] [CrossRef]
- Redapangu, P.R.; Vanka, S.; Sahu, K.C. Multiphase lattice Boltzmann simulations of buoyancy-induced flow of two immiscible fluids with different viscosities. Eur. J. Mech.-B/Fluids 2012, 34, 105–114. [Google Scholar] [CrossRef]
- Umavathi, J.C.; Chamkha, A.J.; Sridhar, K.S.R. Generalised plain Couette flow heat transfer in a composite channel. Transp. Porous Media 2010, 85, 157–169. [Google Scholar] [CrossRef]
- Liu, I.-C.; Wang, H.-H.; Umavathi, J.C. Poiseuille-Couette flow and heat transfer in an inclined composite porous medium. J. Mech. 2012, 28, 559–566. [Google Scholar] [CrossRef]
- Umavathi, J.C.; Sheremet, M.A. Heat transfer of viscous fluid in a vertical channel sandwiched between nanofluid porous zones. J. Therm. Anal. Calorim. 2021, 144, 1389–1399. [Google Scholar] [CrossRef]
- Packham, B.A.; Shail, R. Stratified laminar flow of two immiscible fluids. Math. Proc. Camb. Philos. Soc. 1971, 69, 443–448. [Google Scholar] [CrossRef]
- Ghassemi, A.; Pak, A. Numerical study of factors influencing relative permeabilities of two immiscible fluids flowing through porous media using lattice Boltzmann method. J. Pet. Sci. Eng. 2011, 77, 135–145. [Google Scholar] [CrossRef]
- Maxwell, J.C. A Treatise on Electricity and Magnetism, 2nd ed.; Oxford University Press: Cambridge, UK, 1904. [Google Scholar]
- Sus, C.; Ja, E. Enhancing Thermal conductivity of fluids with nanoparticles. In Proceedings of the 1995 International Mechanical Engineering Congress and Exhibition, San Francisco, CA, USA, 12–17 November 1995. [Google Scholar]
- Bahiraei, M.; Heshmatian, S. Thermal performance and second law characteristics of two new microchannel heat sinks operated with hybrid nanofluid containing grapheme-silver nanoparticles. Energy Convers. Manag. 2018, 168, 357–370. [Google Scholar] [CrossRef]
- Khashi’Ie, N.S.; Waini, I.; Kasim, A.R.M.; Zainal, N.A.; Arifin, N.M.; Pop, I. Thermal progress of a non-Newtonian hybrid nanofluid flow on a permeable Riga plate with temporal stability analysis. Chin. J. Phys. 2022, 77, 279–290. [Google Scholar] [CrossRef]
- Ketchate, C.G.N.; Kapen, P.T.; Fokwa, D.; Tchuen, G. Stability analysis of mixed convection in a porous horizontal channel filled with a Newtonian Al2O3/Water nanofluid in presence of magnetic field and thermal radiation. Chin. J. Phys. 2022, 79, 514–530. [Google Scholar] [CrossRef]
- ur Rehman, A.; Abbas, Z. Stability analysis of heat transfer in nanomaterial flow of boundary layer towards a shrinking surface: Hybrid nanofluid versus nanofluid. Alex. Eng. J. 2022, 61, 10757–10768. [Google Scholar] [CrossRef]
- Shirvan, K.M.; Mamourian, M.; Mirzakhanlari, S.; Ellahi, R. Numerical investigation of heat exchanger effectiveness in a double pipe heat exchanger filled with nanofluid: A sensitivity analysis by response surface methodology. Powder Technol. 2017, 313, 99–111. [Google Scholar] [CrossRef]
- Sheremet, M.A.; Revnic, C.; Pop, I. Free convection in a porous wavy cavity filled with a nanofluid using Buongiorno’s mathematical model with thermal dispersion effect. Appl. Math. Comput. 2017, 299, 1–15. [Google Scholar] [CrossRef]
- Sheikholeslami, M.; Ganji, D.D. Applications of Semi Analytical Methods for Nanofluid Flow and Heat Transfer; Elsevier Inc.: Amsterdam, The Netherlands, 2018. [Google Scholar]
- Heris, S.Z.; Nassan, T.H.; Noie, S.H.; Sardarabadi, H.; Sardarabadi, M. Laminar convective heat transfer of Al2O3/water nanofluid through square cross-sectional duct. Int. J. Heat Fluid Flow 2013, 44, 375–382. [Google Scholar] [CrossRef]
- Nassan, T.H.; Heris, S.Z.; Noie, S.H. A comparison of experimental heat transfer characteristics for Al2O3/water and CuO/water nanofluids in square cross-section duct. Int. Commun. Heat Mass Transf. 2010, 37, 924–928. [Google Scholar] [CrossRef]
- Heris, S.Z.; Nassan, T.H.; Noie, S.H. CuO/water nanofluid convective heat transfer through square duct under uniform heat flux. Int. J. Nanosci. Nanotechnol. 2011, 7, 111–120. [Google Scholar]
- Li, B.; Ding, Y.; Chen, X. Two immiscible stratified fluids with one nanofluid layer in a horizontal annulus. Eur. Phys. J. Plus 2020, 135, 135. [Google Scholar] [CrossRef]
- Li, B.; Ding, Y.; Zheng, L.; Liu, X.; Zhang, X. Mixed convection heat transfer of double immiscible fluids in functional gradient material preparation. Int. J. Heat Mass Transf. 2018, 121, 812–818. [Google Scholar] [CrossRef]
- Farooq, U.; Hayat, T.; Alsaedi, A.; Liao, S. Heat and mass transfer of two-layer flows of third-grade nano-fluids in a vertical channel. Appl. Math. Comput. 2014, 242, 528–540. [Google Scholar] [CrossRef]
- Alam Khan, N.; Sultan, F.; Rubbab, Q. Optimal solution of nonlinear heat and mass transfer in a two-layer flow with nano-Eyring–Powell fluid. Results Phys. 2015, 5, 199–205. [Google Scholar] [CrossRef] [Green Version]
- Umavathi, J.C.; Anwar Bég, O. Effects of thermophysical properties on heat transfer at the interface of two immiscible fluids in a vertical duct: Numerical study. Int. J. Heat Mass Transf. 2020, 154, 119613. [Google Scholar] [CrossRef]
- Oztop, H.F.; Yasin, V.; Ahmet, K. Natural convection in a vertically divided square enclosure by a solid partition into air and water regions. Int. J. Heat Mass Transf. 2009, 52, 5909–5921. [Google Scholar] [CrossRef]
- Moshkin, N.P. Numerical model to study natural convection in a rectangular enclosure filled with two immiscible fluids. Int. J. Heat Fluid Flow 2002, 23, 373–379. [Google Scholar] [CrossRef]
- De Vahl Davis, G. Laminar natural convection in an enclosed rectangular cavity. Int. J. Heat Mass Transf. 1968, 1, 1167–1693. [Google Scholar] [CrossRef]
- De Vahl Davis, G. Natural convection of air in a square cavity. Int. J. Numer. Methods Fluids 1983, 3, 249–264. [Google Scholar] [CrossRef]
Figure 1.
Physical configuration.
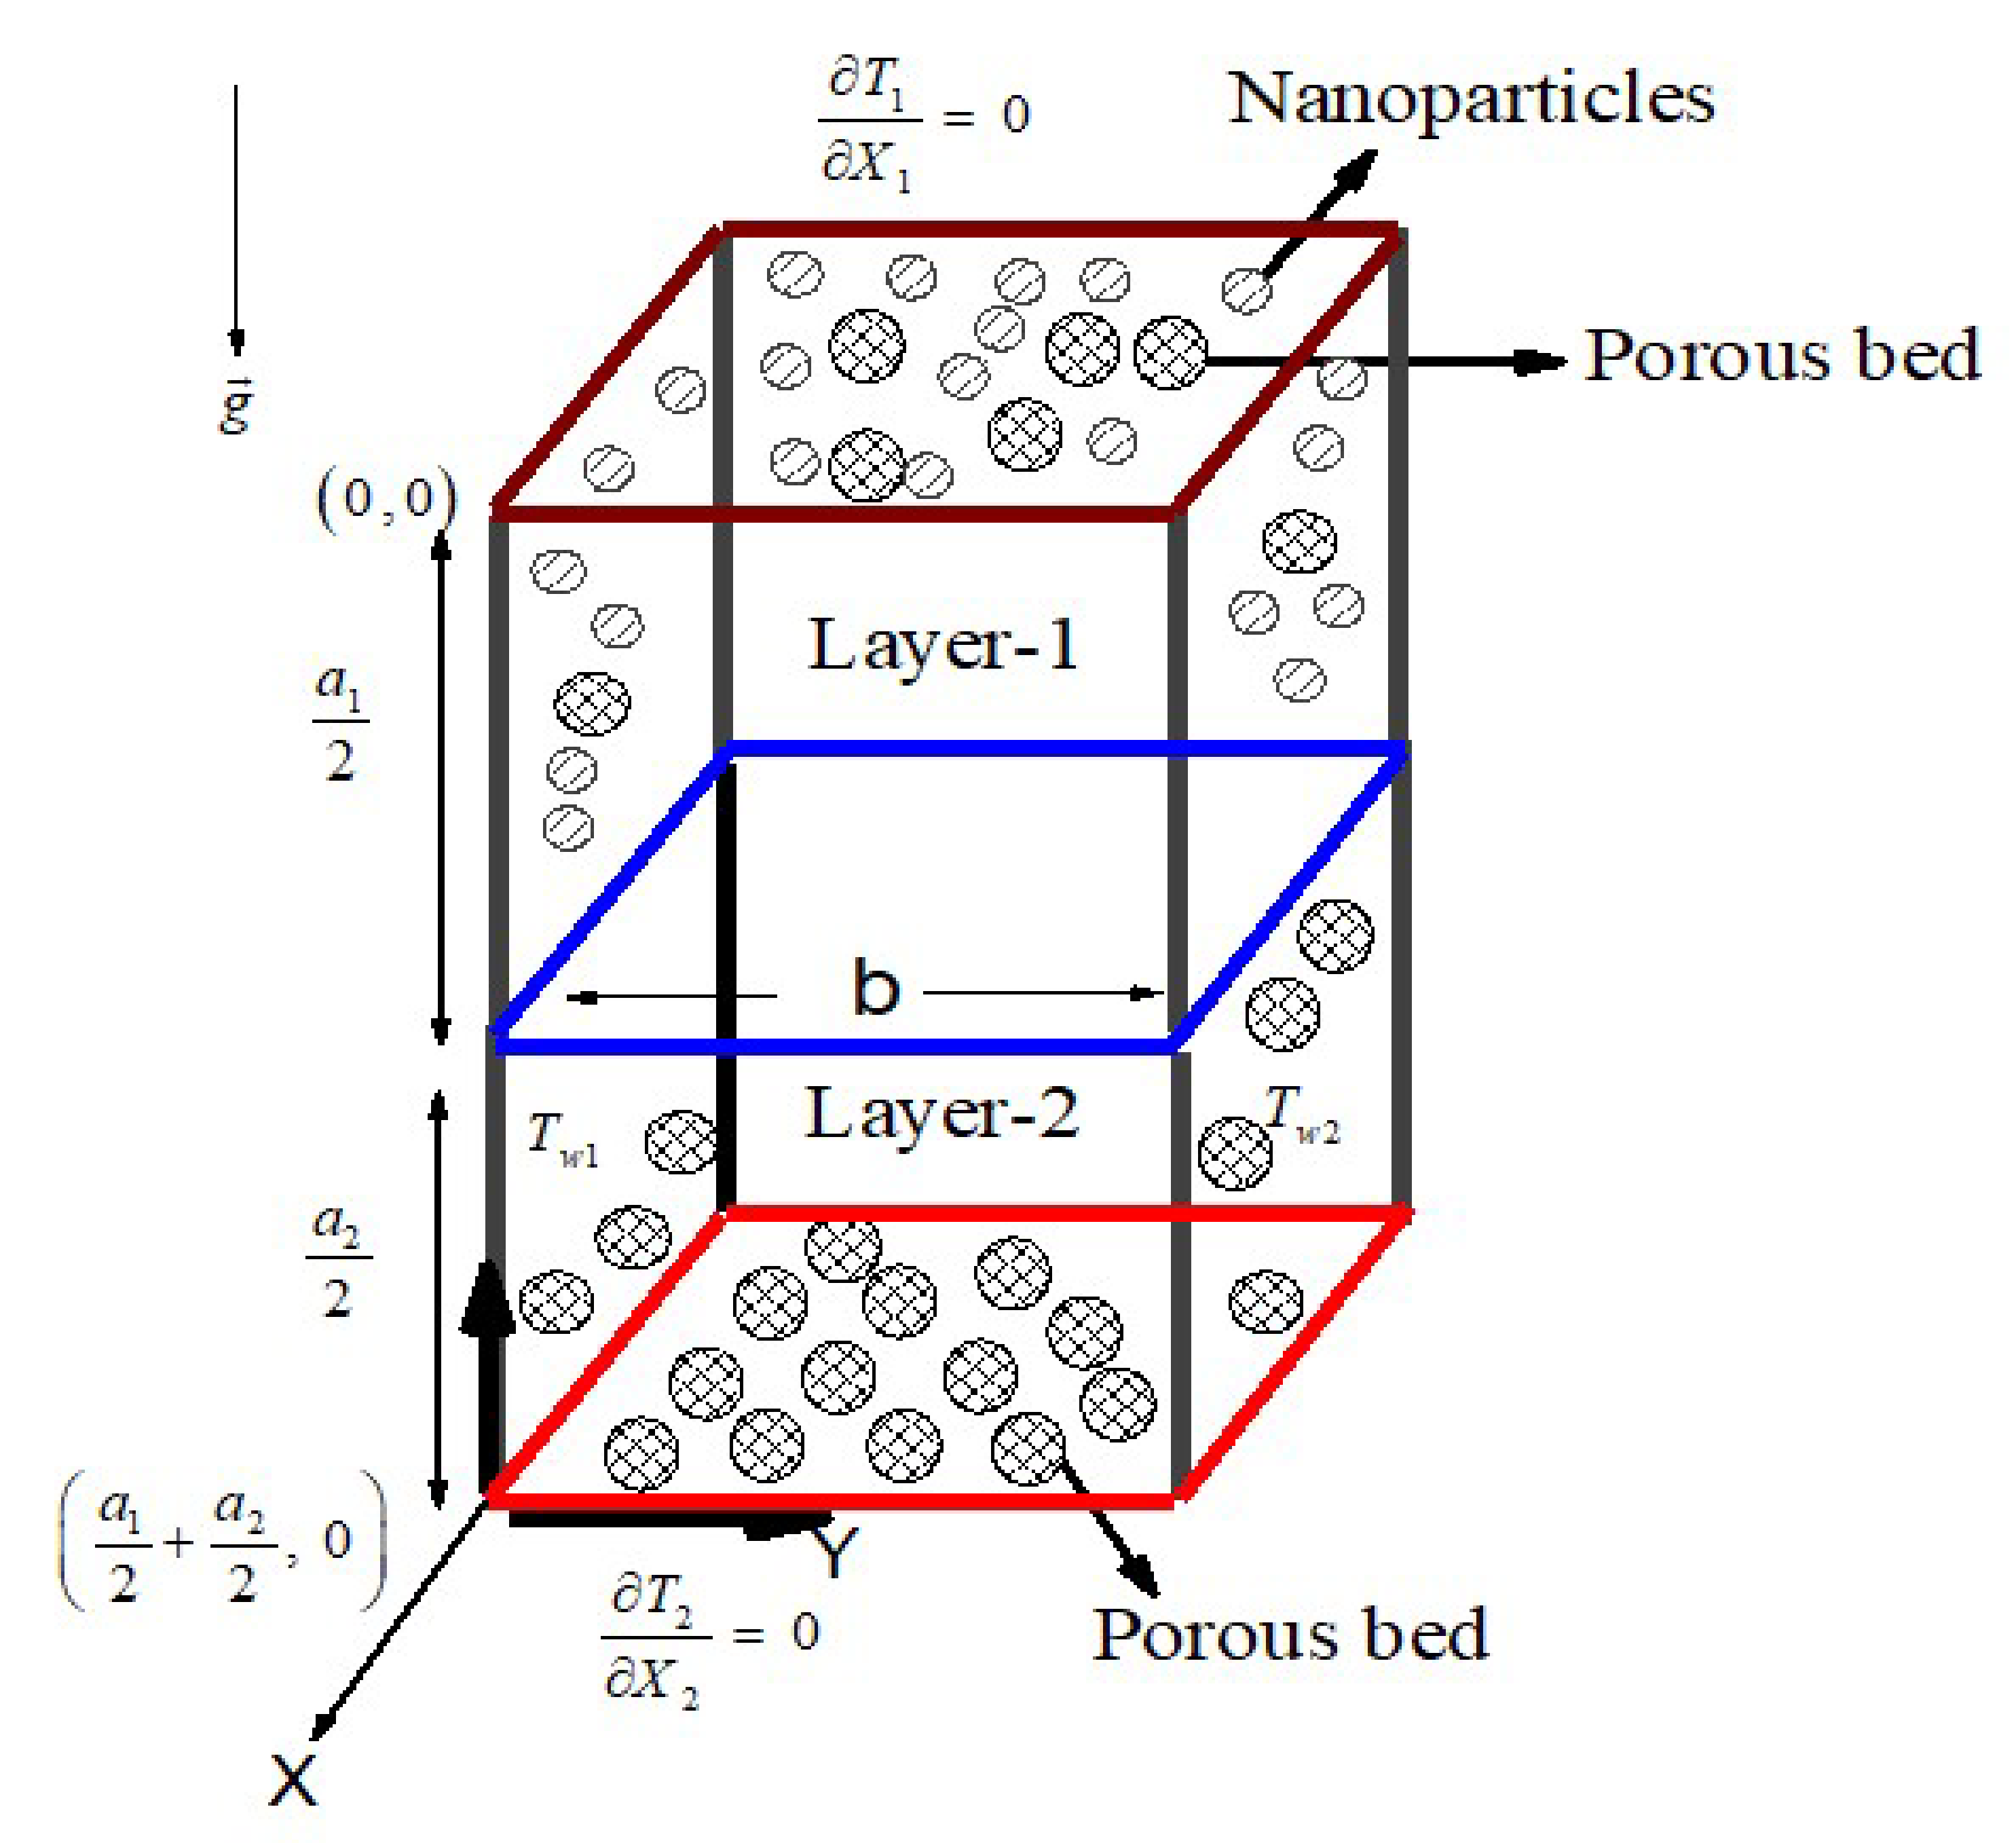
Figure 2.
Velocity (a) contours and (b) profiles for altered base fluids.

Figure 3.
Velocity contours for altered nanoparticles.

Figure 4.
Velocity (a) contours and (b) profiles for altered solid volume fraction.

Figure 5.
Velocity (a) contours, (b) profiles, and (c) temperature profiles for altered Darcy number.
Figure 5.
Velocity (a) contours, (b) profiles, and (c) temperature profiles for altered Darcy number.
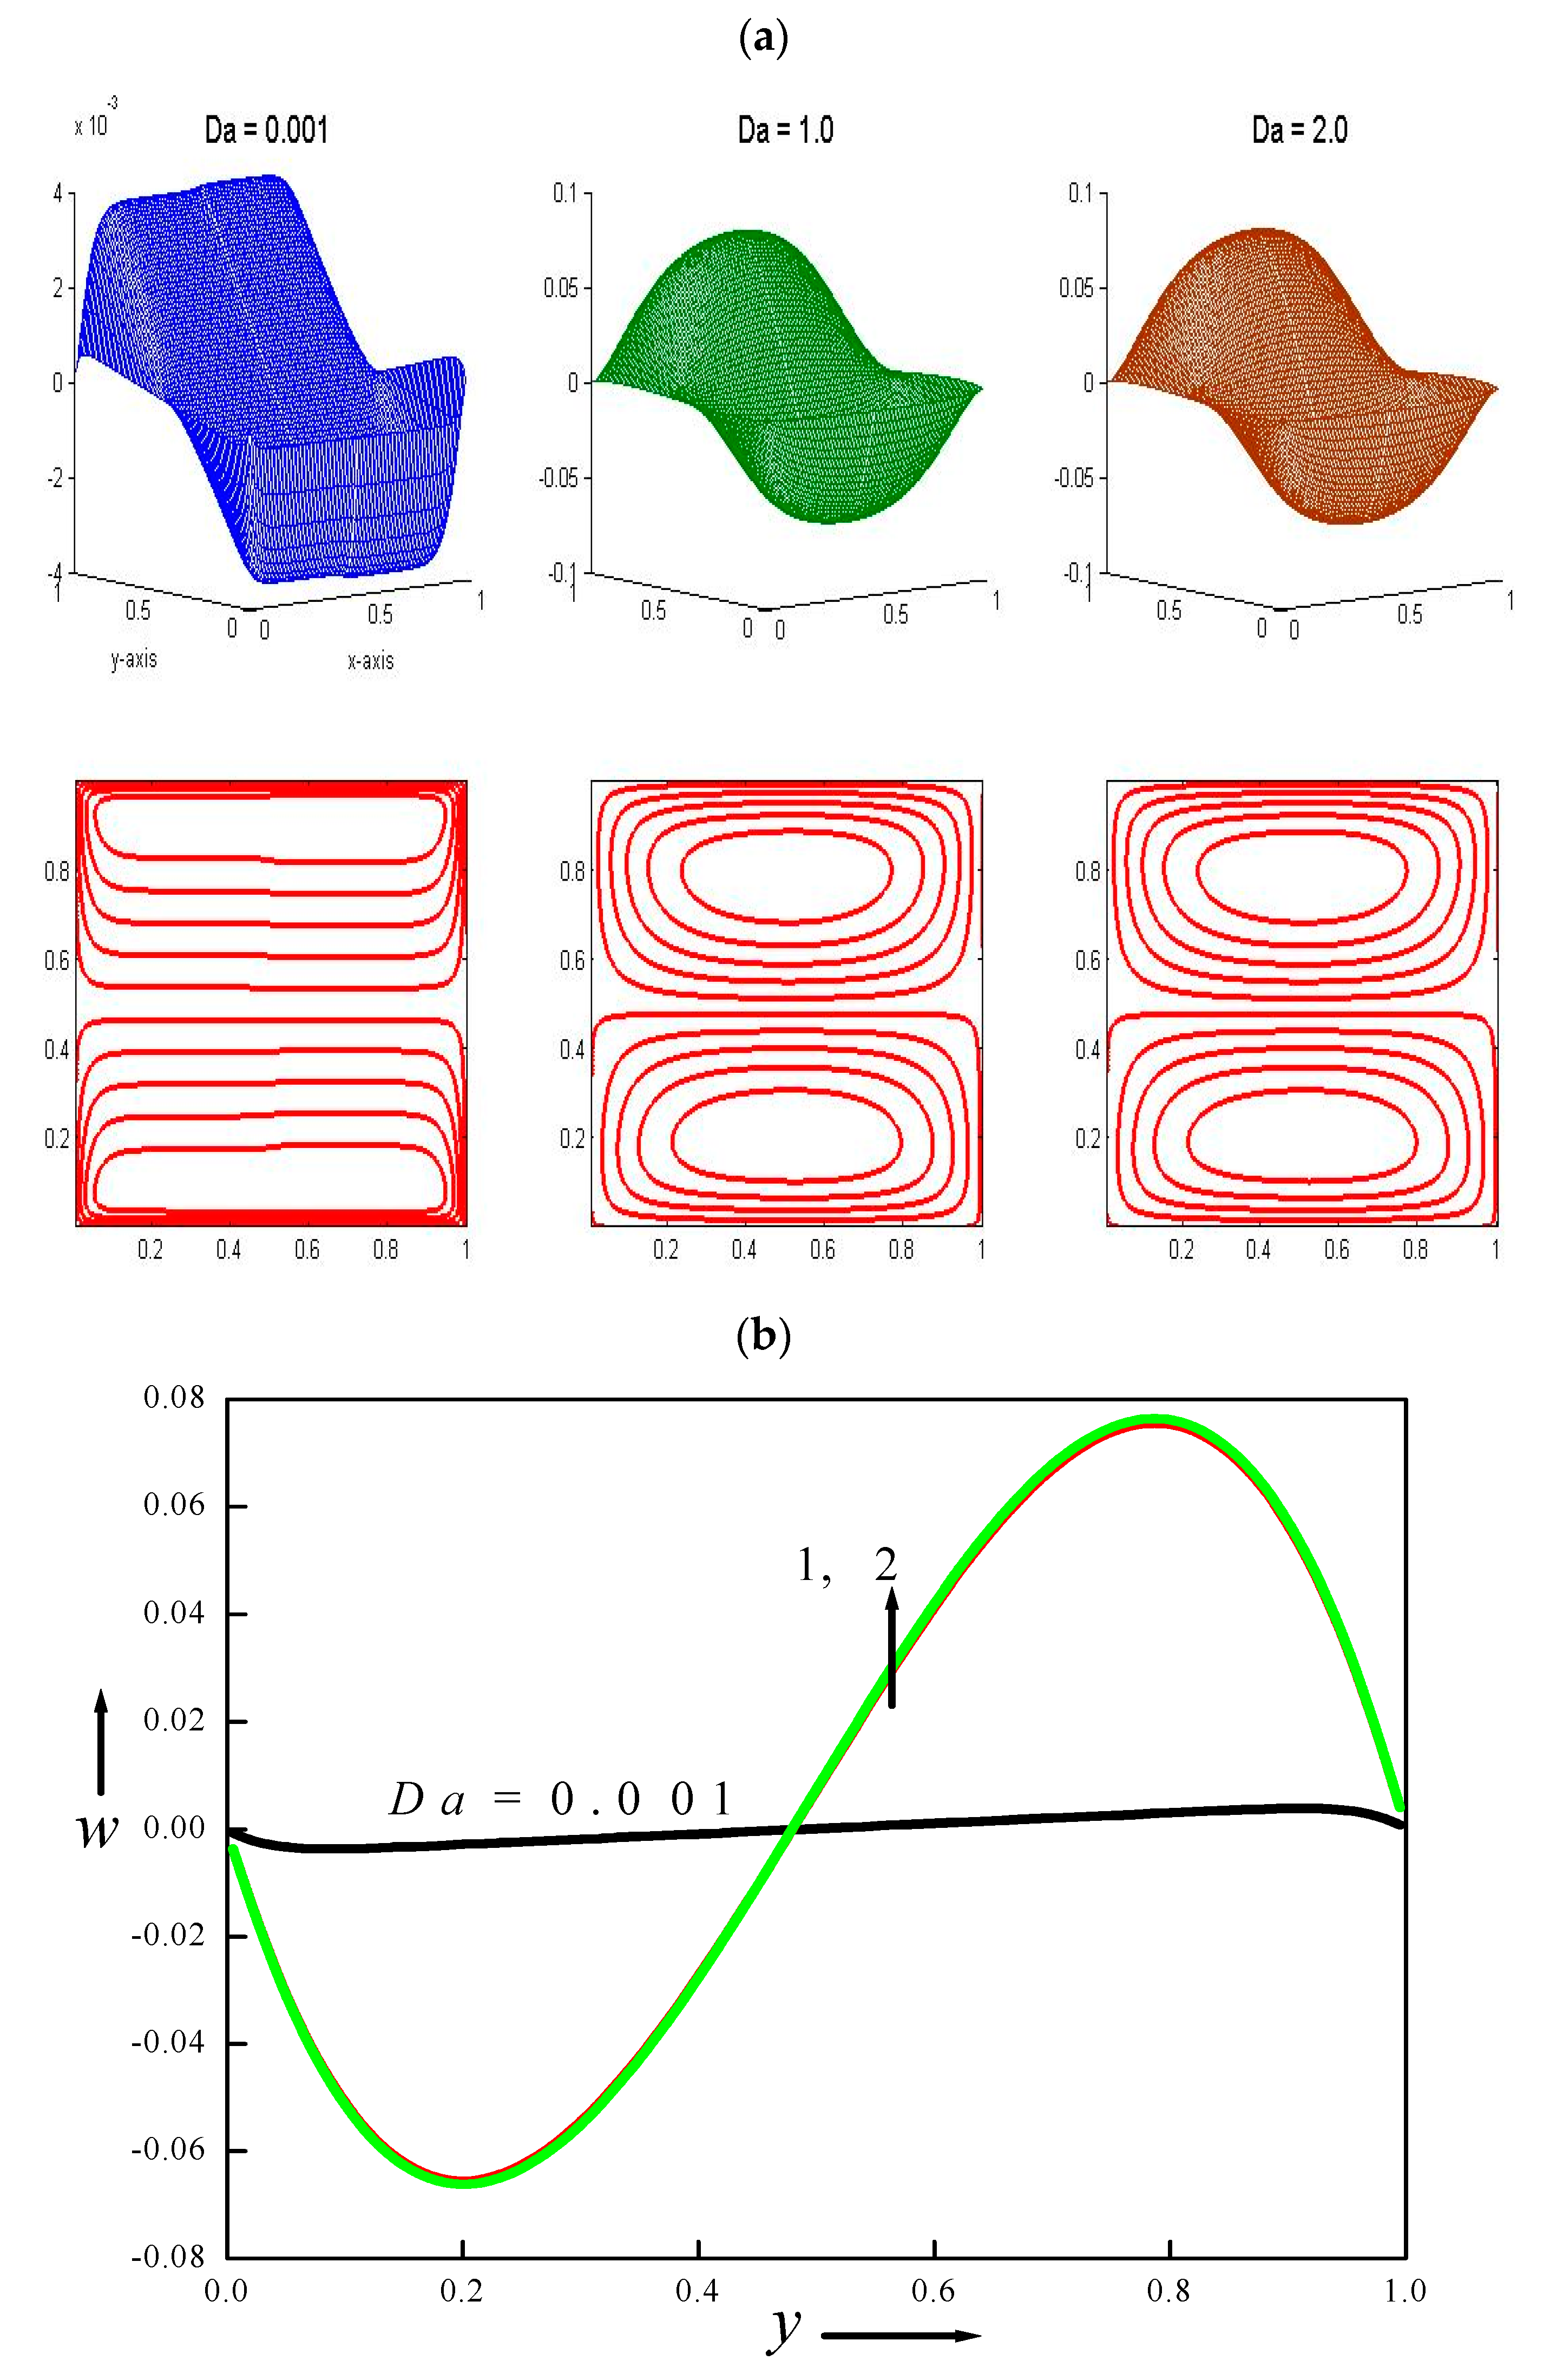

Figure 6.
Velocity contours for altered inertial parameter.
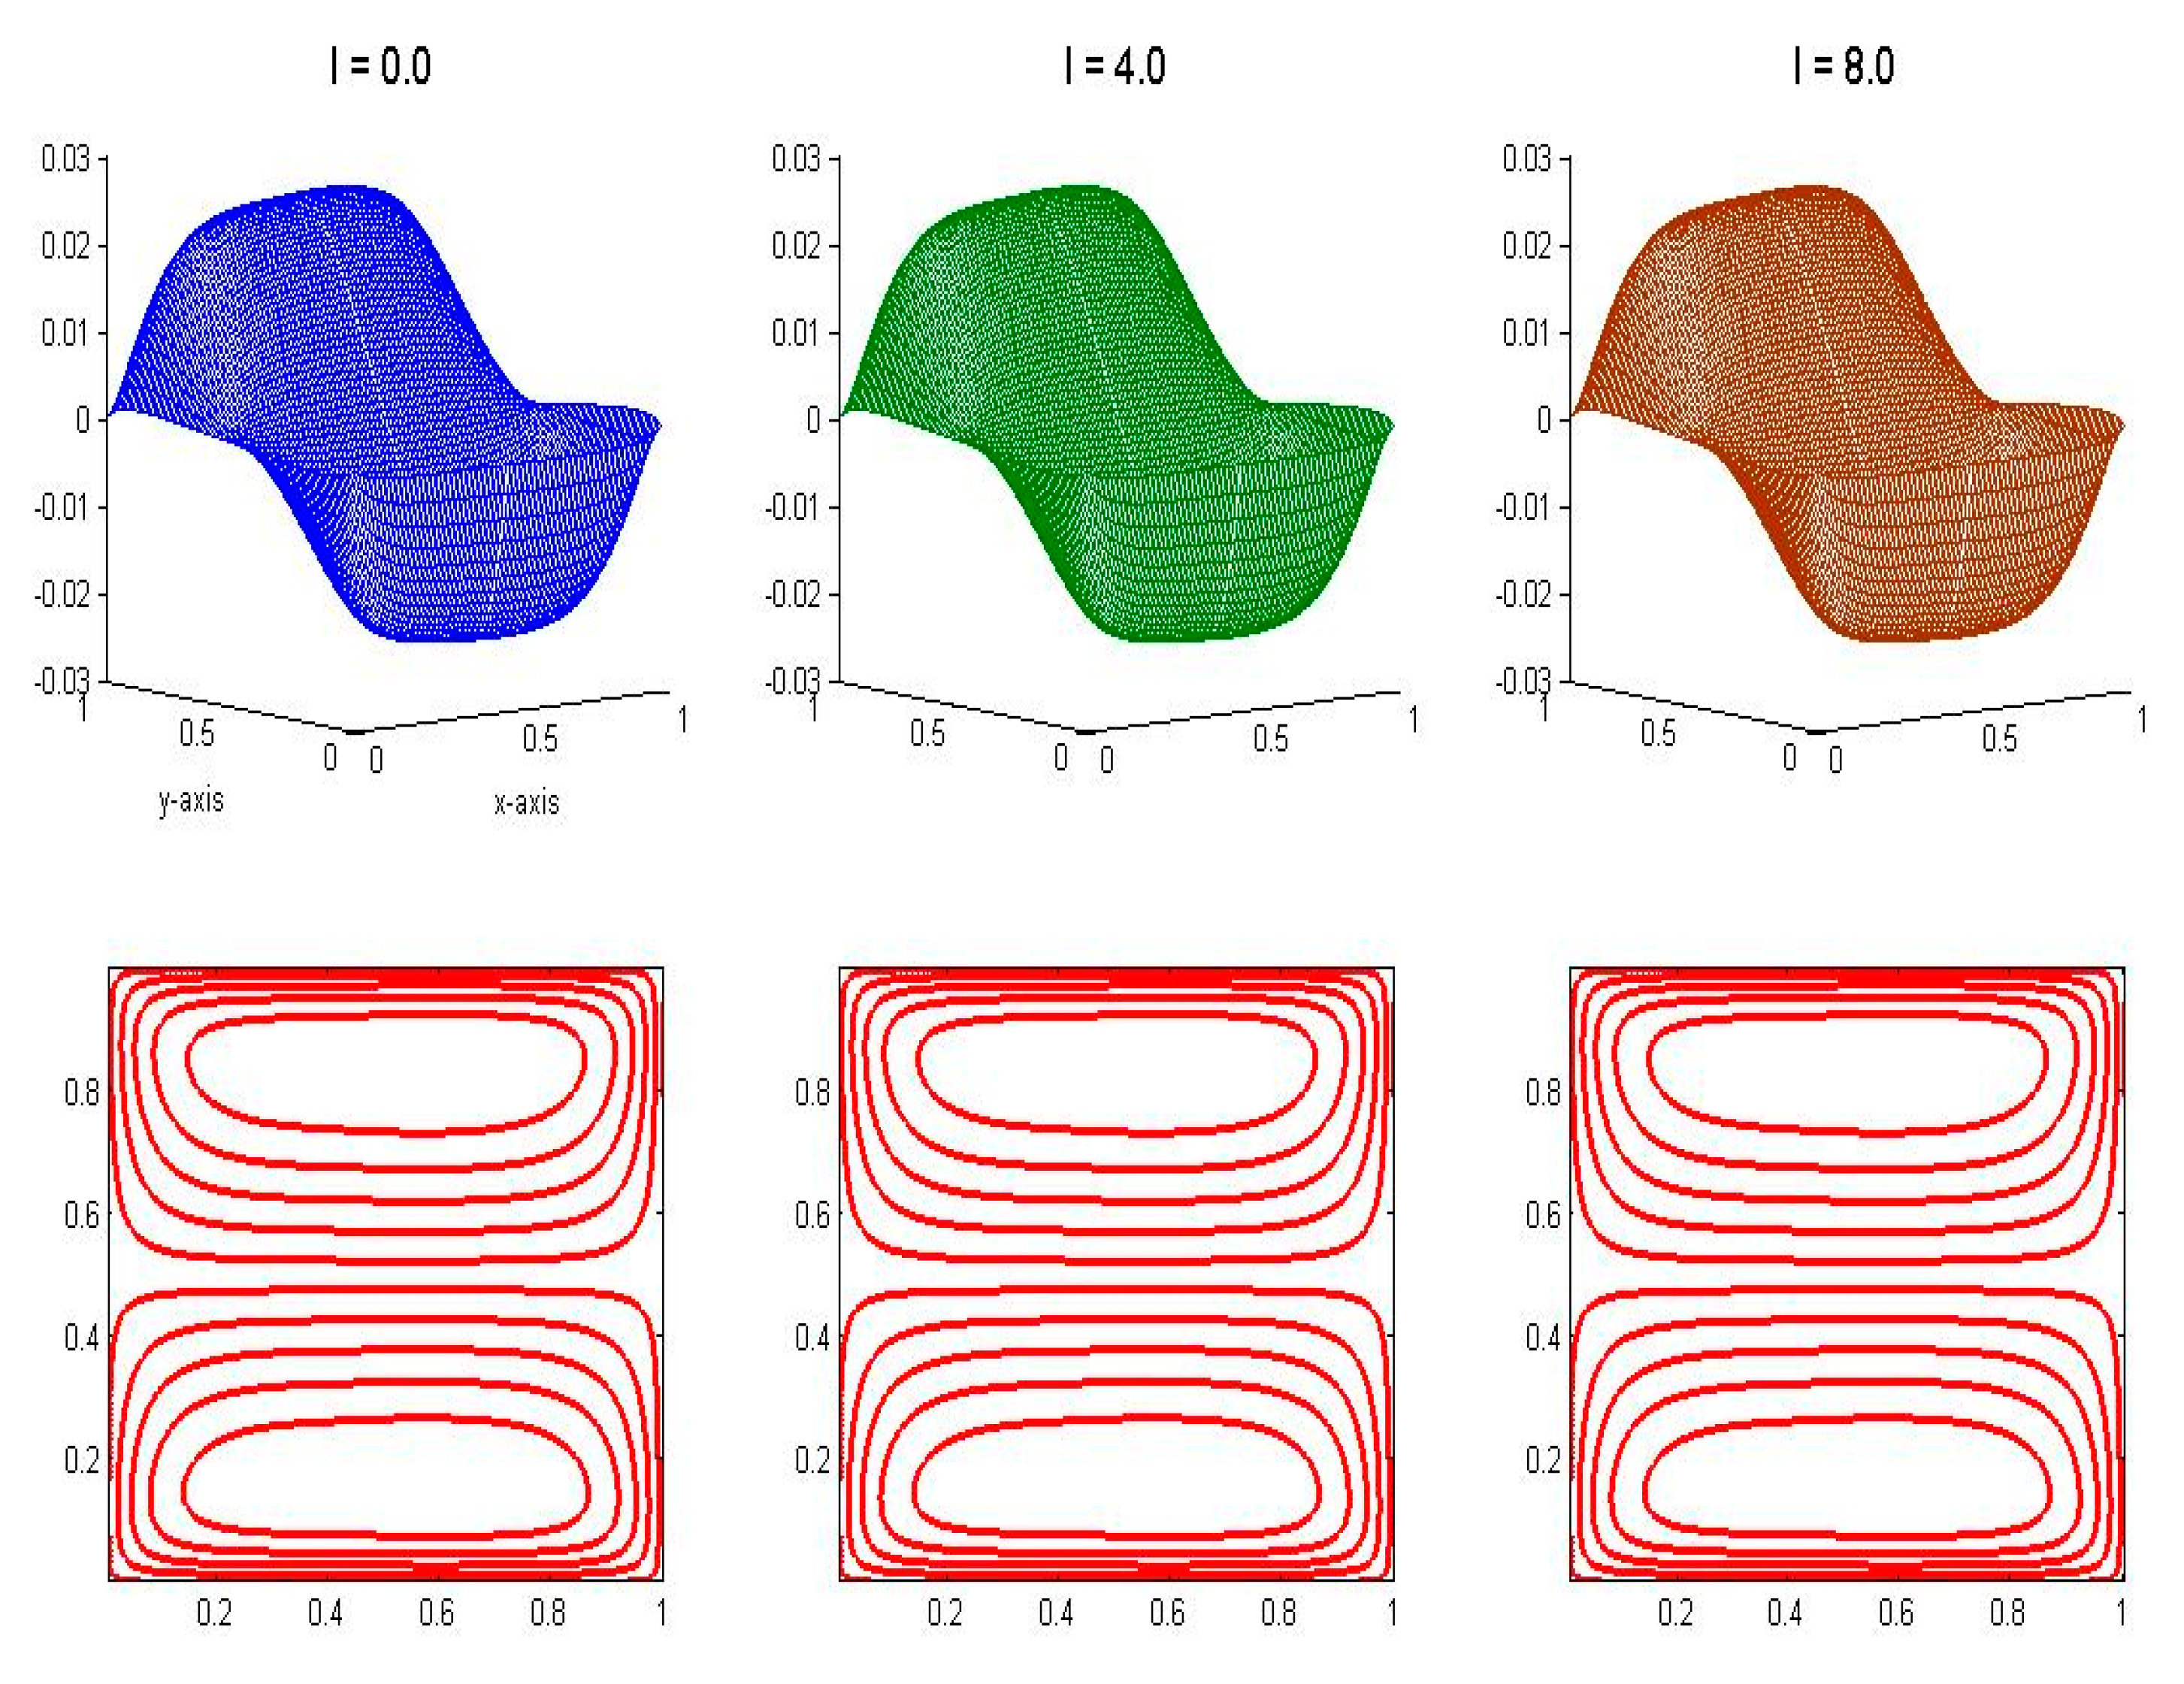
Figure 7.
Velocity (a) contours (b) and profiles for altered ratio of permeabilities.

Figure 8.
Velocity (a) contours and (b) profiles for altered ratio of viscosities.

Figure 9.
Velocity contours for altered ratio of thermal conductivities.
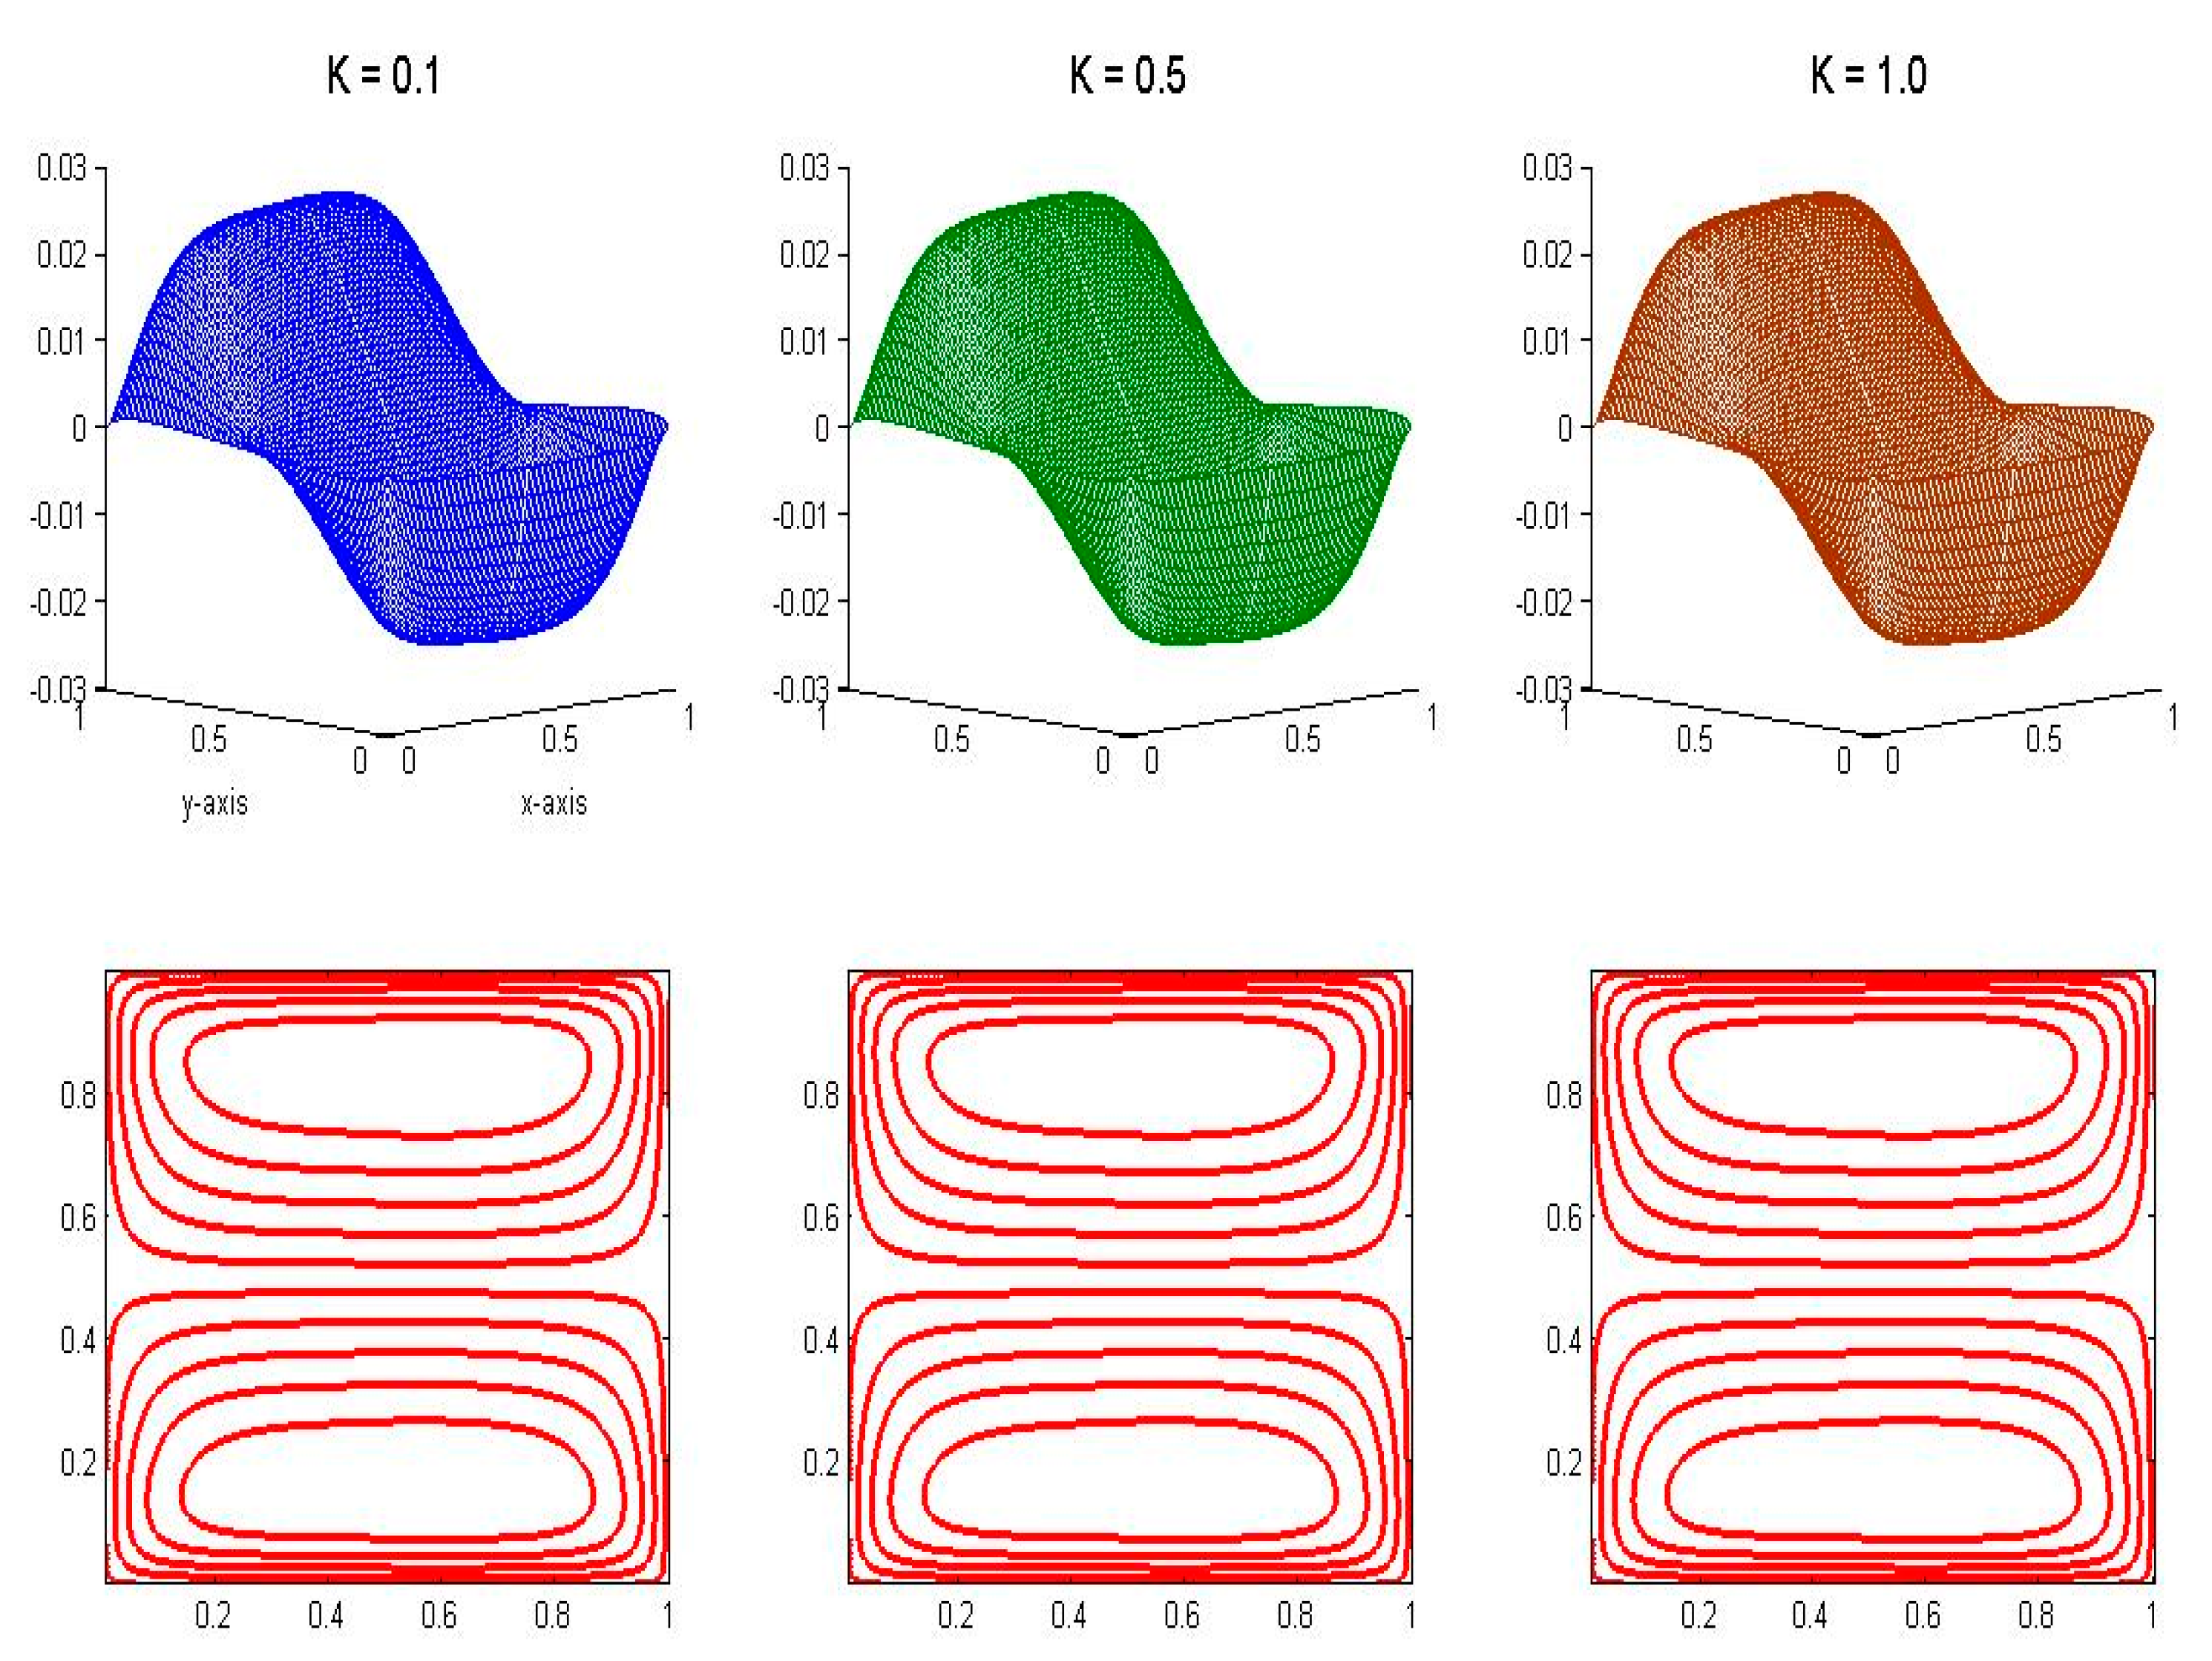
Figure 10.
Velocity (a) contours, (b) profiles; and temperature (c) contours (d) and profiles for altered Grashof number.
Figure 10.
Velocity (a) contours, (b) profiles; and temperature (c) contours (d) and profiles for altered Grashof number.

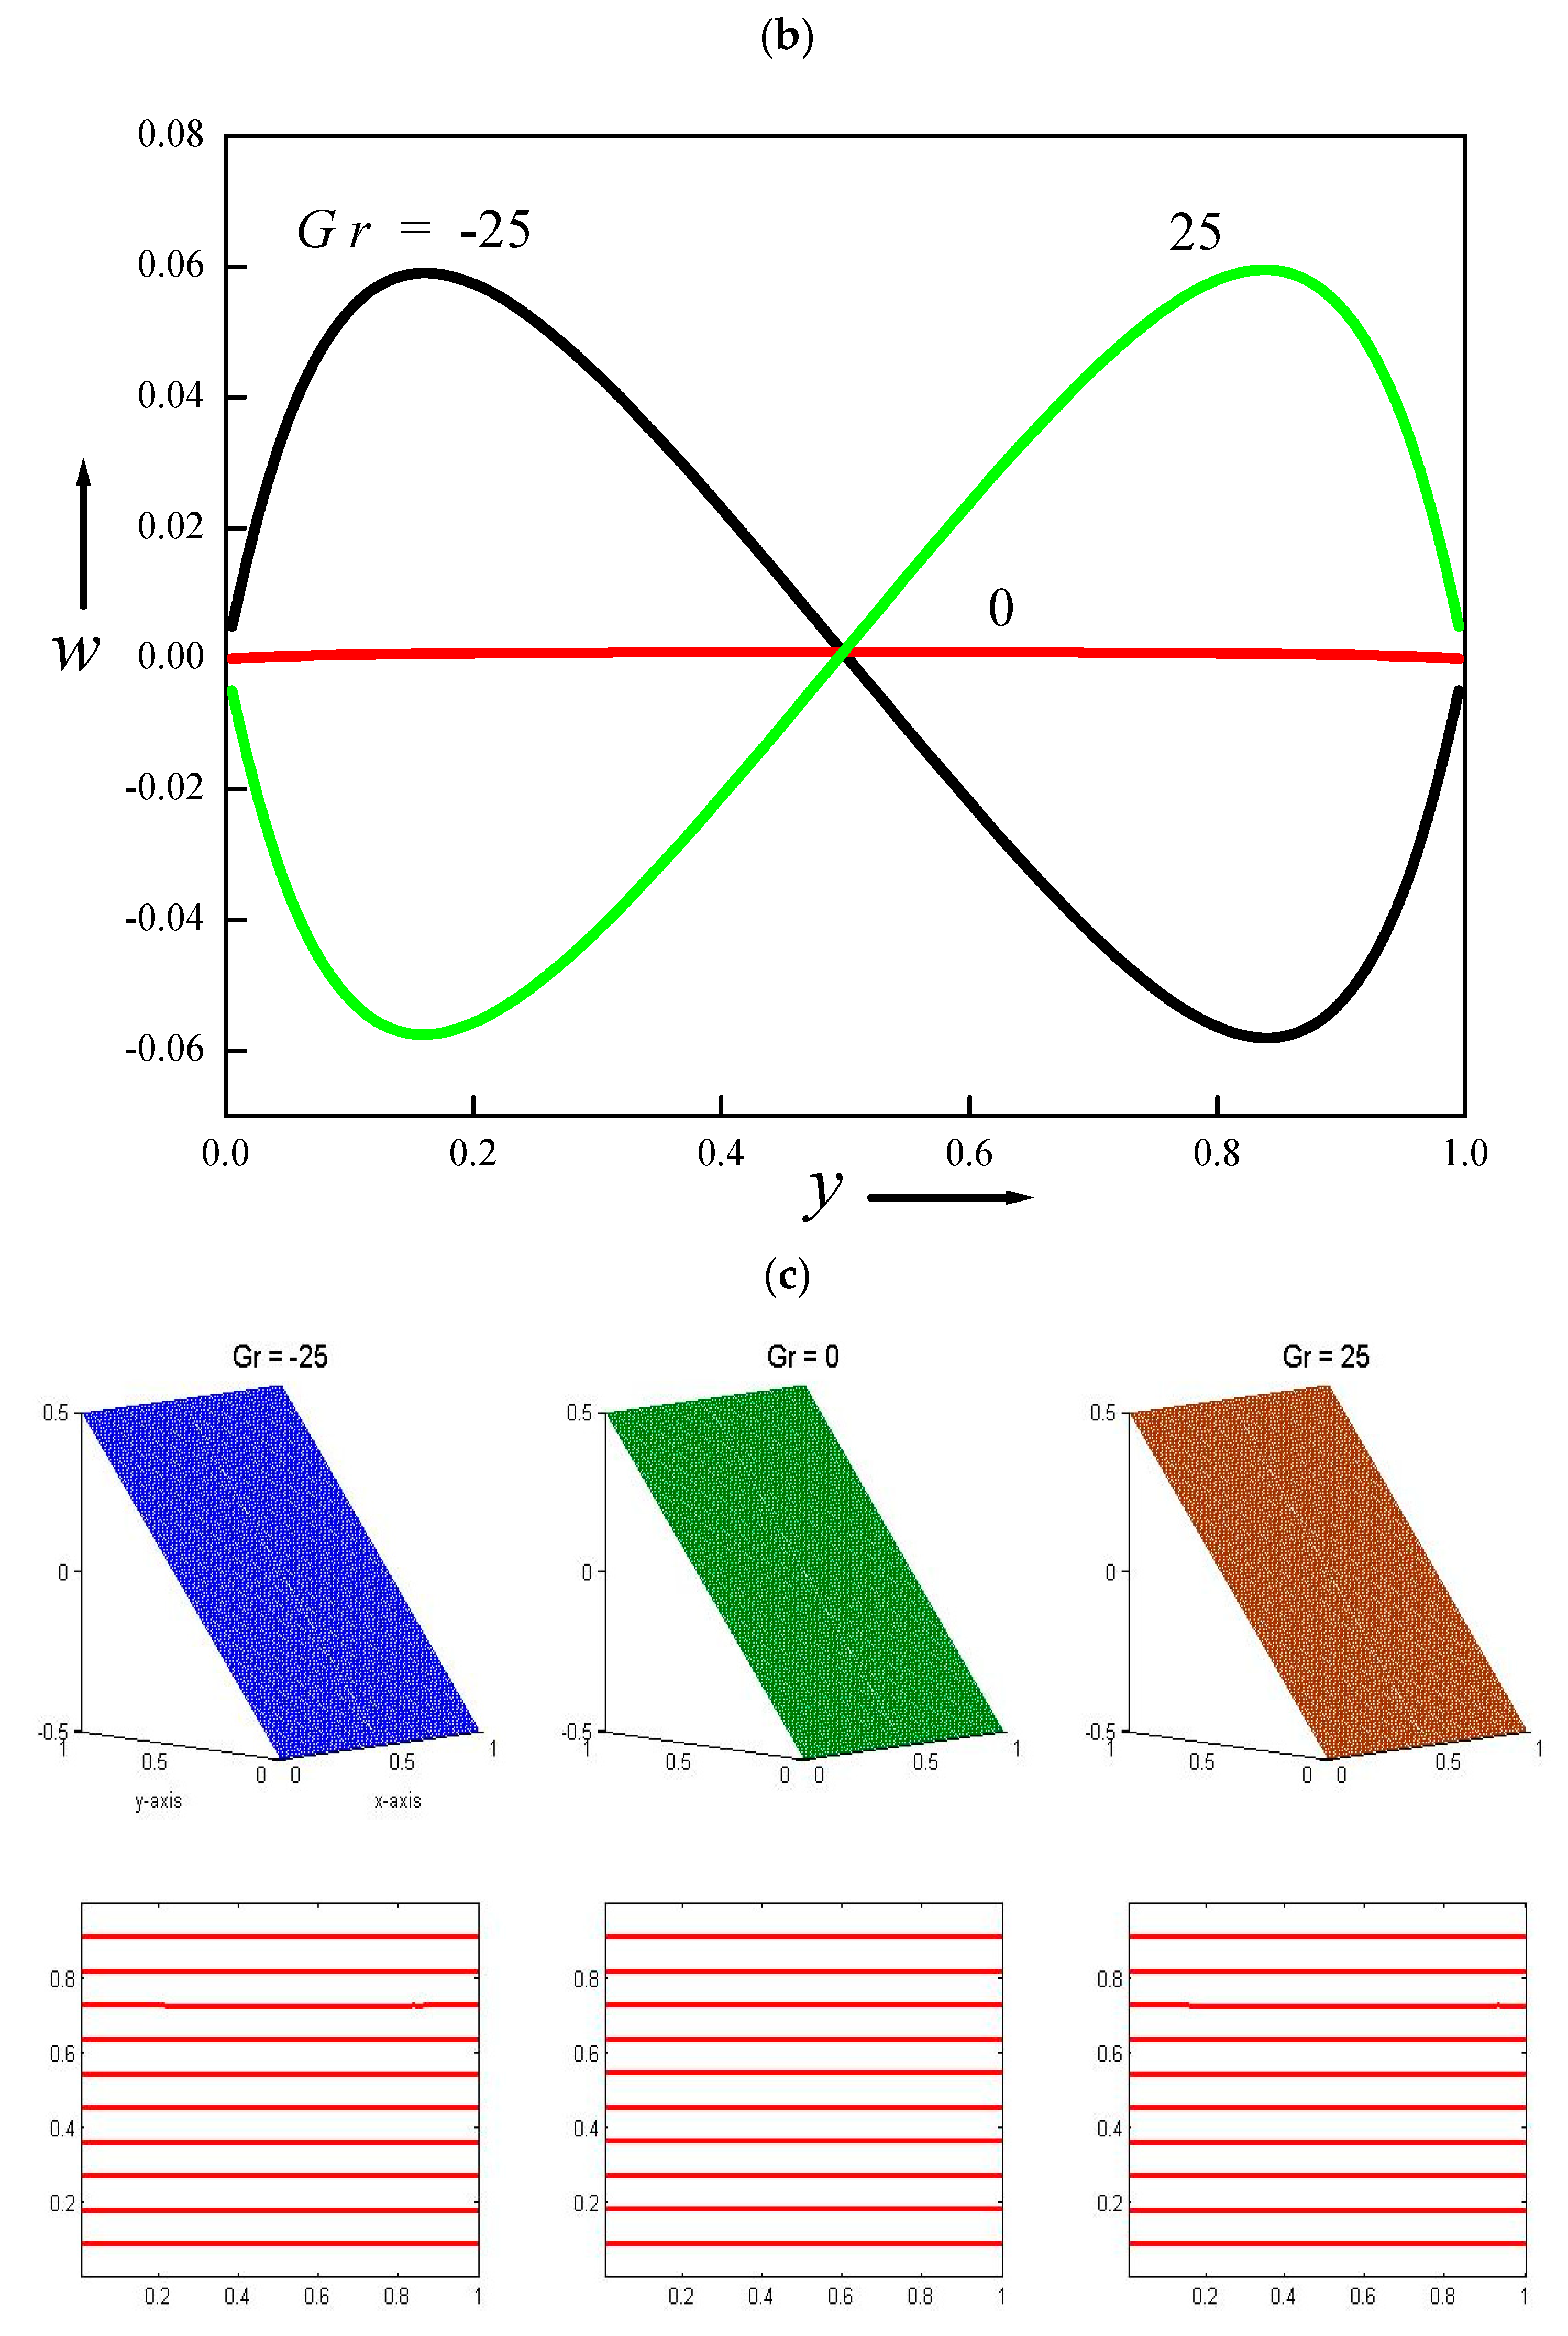
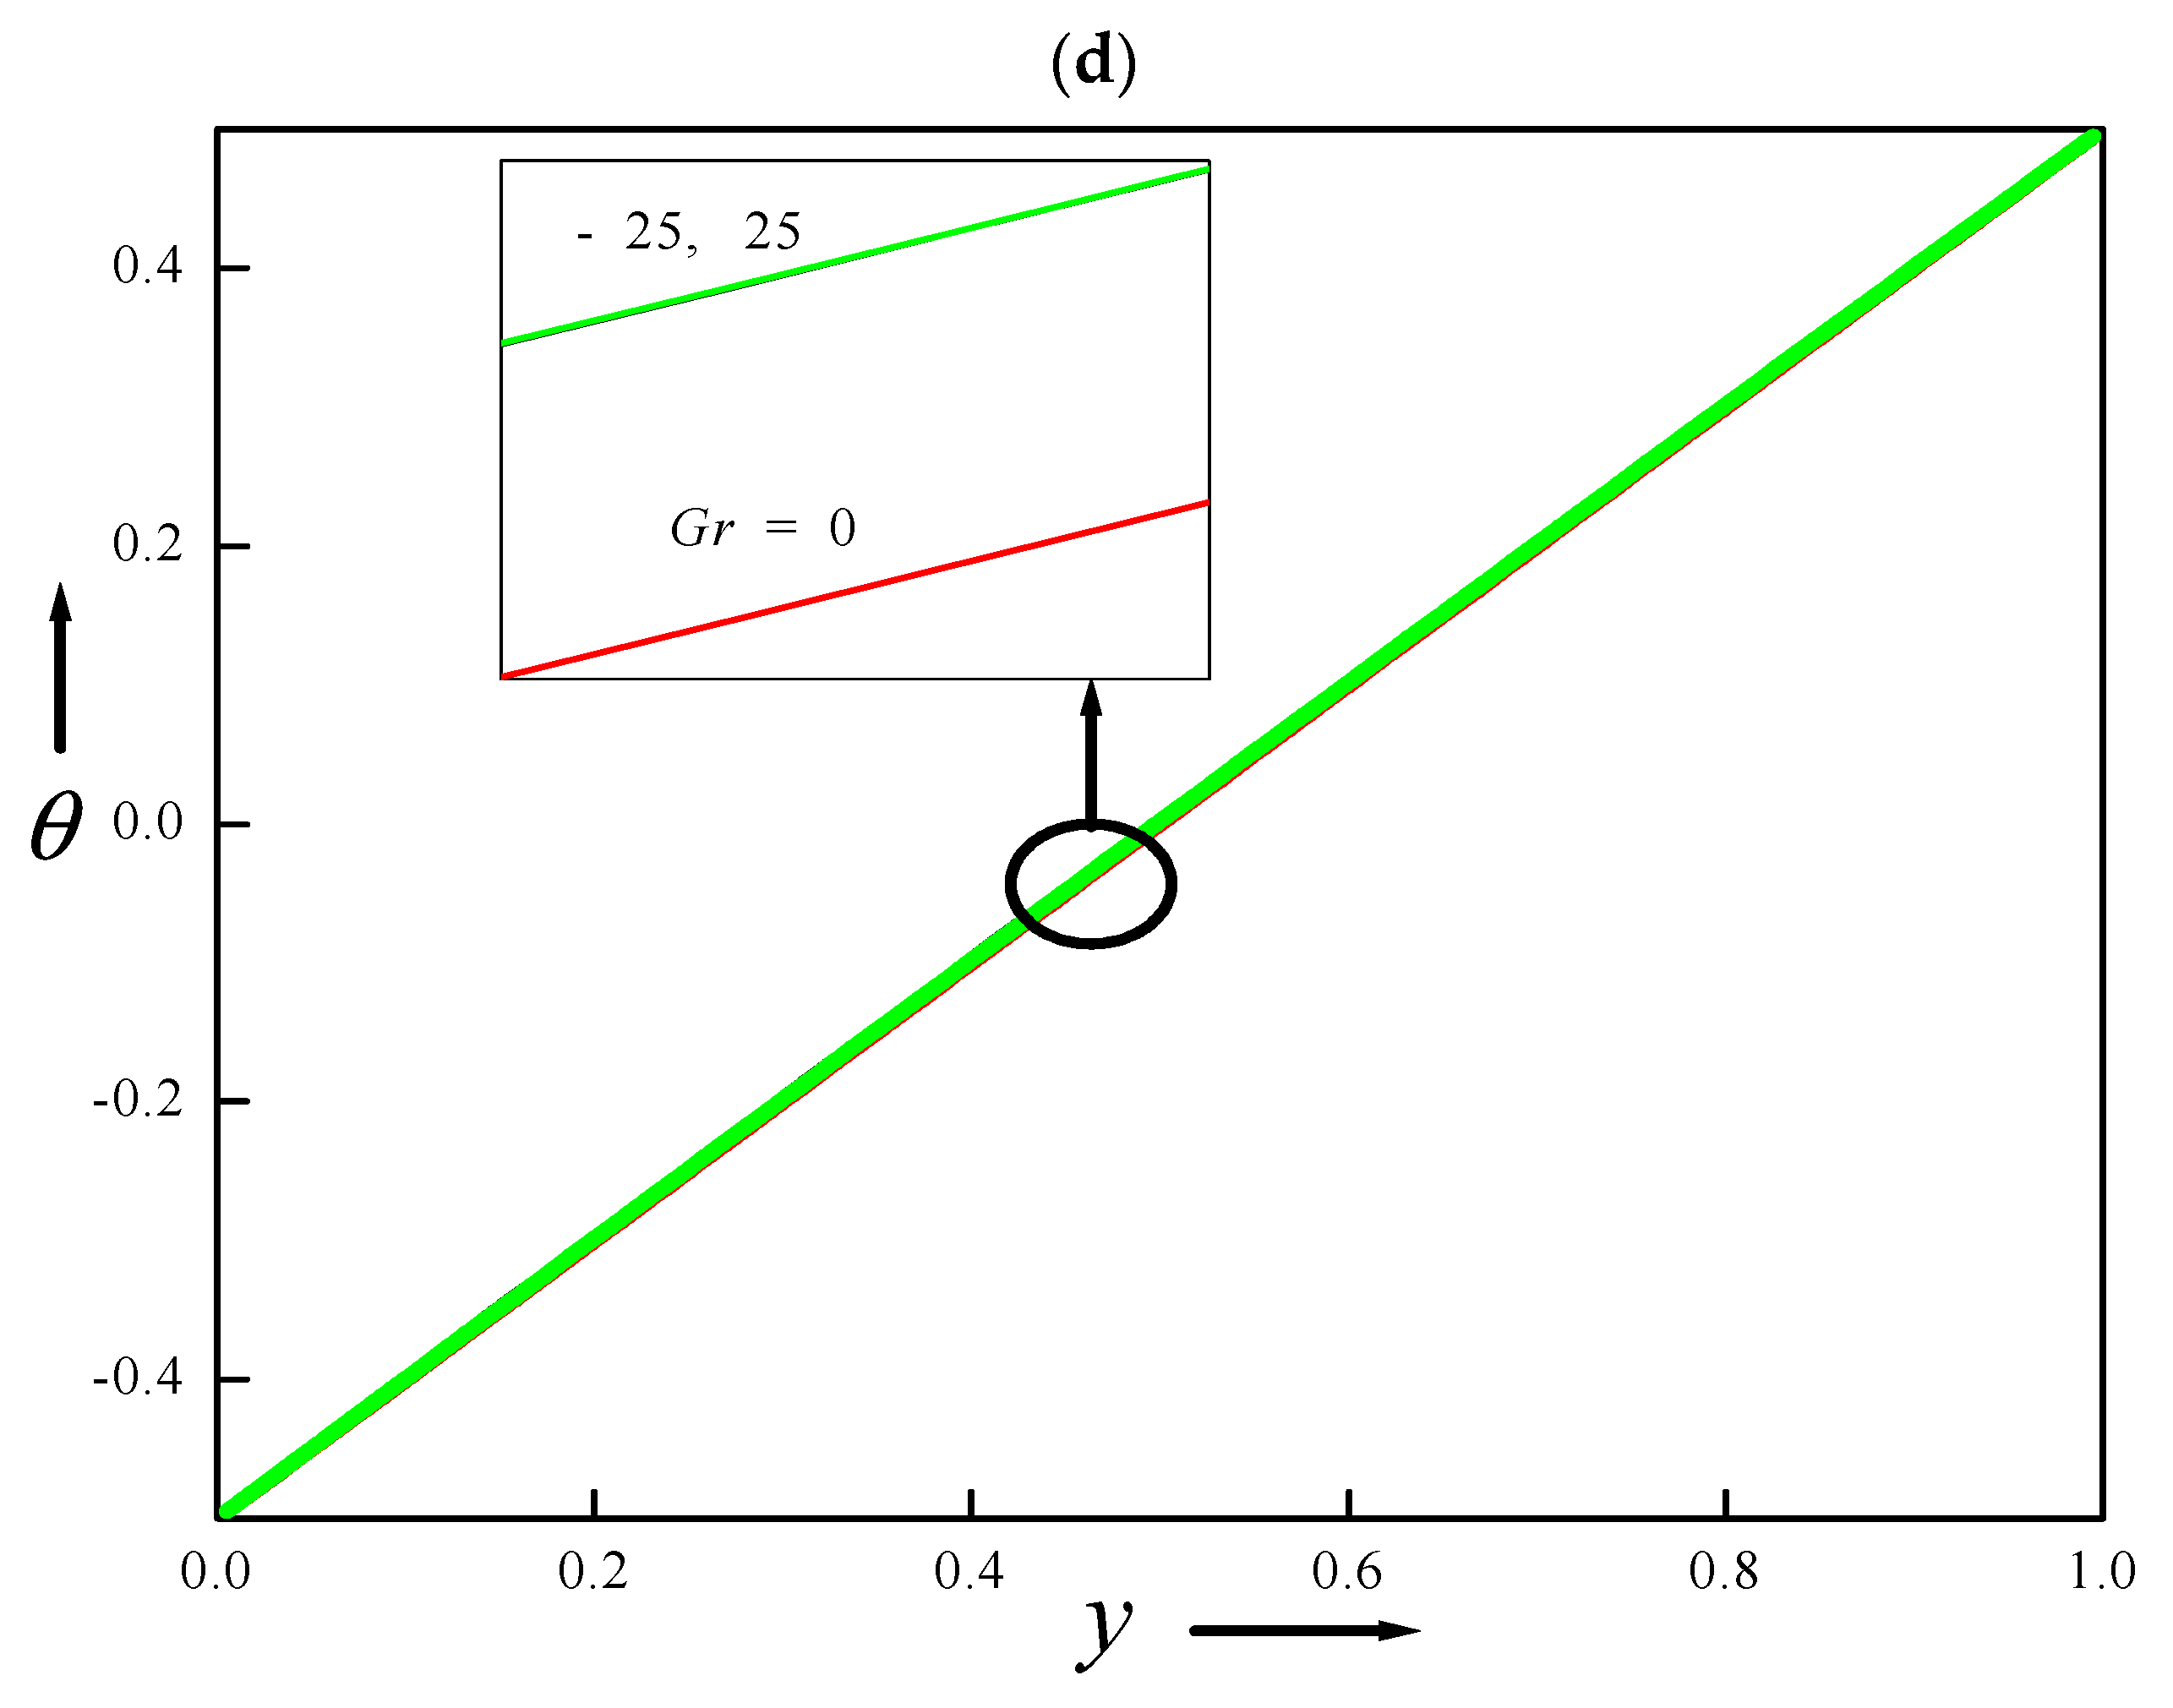
Figure 11.
Velocity (a) contours, (b) profiles, and (c) temperature profiles for altered Brinkman number.
Figure 11.
Velocity (a) contours, (b) profiles, and (c) temperature profiles for altered Brinkman number.

Table 1.
Grid independence test using water as base fluid and copper as nanoparticle.
| Grid size | ||
|---|---|---|
| 11 × 11 | 1.031892 | 1.00173 |
| 51 × 51 | 1.031877 | 1.001716 |
| 101 × 101 | 1.031878 | 1.001717 |
| 151 × 151 | 1.031879 | 1.001717 |
| 201 × 201 | 1.031879 | 1.001717 |
Table 2.
Similarity of .
| Present for ϕ= 0.01, Da = 0.01, I = 4.0, κ = 1.0 | Present for ϕ = 0.0, Da = 0.0, I = 0.0, κ = 0.0 | Umavathi and Bég [26] for ϕ = 0.0, Da = 0.0, I = 0.0 | |||
|---|---|---|---|---|---|
| Layer-1 | Layer-2 | Layer-1 | Layer-2 | Layer-1 | Layer-2 |
| 1.0319 | 1.0017 | 1.0046 | 1.0046 | 1.0046 | 1.0046 |
Table 3.
Values of velocity and temperature at x = 0.5.
| I | ||||||
|---|---|---|---|---|---|---|
| y | Velocity | Temperature | ||||
| 0.0 | 4.0 | 8.0 | 0.0 | 4.0 | 8.0 | |
| 0.005 | −0.00191 | −0.00191 | −0.00191 | −0.49499 | −0.49499 | −0.49499 |
| 0.205 | −0.02175 | −0.02174 | −0.02173 | −0.29476 | −0.29476 | −0.29476 |
| 0.405 | −0.00758 | −0.00758 | −0.00757 | −0.0947 | −0.0947 | −0.0947 |
| 0.605 | 0.01042 | 0.01042 | 0.01041 | 0.10531 | 0.10531 | 0.10531 |
| 0.805 | 0.0238 | 0.02379 | 0.02377 | 0.30525 | 0.30525 | 0.30525 |
| 0.995 | 0.00201 | 0.00201 | 0.00201 | 0.45508 | 0.45508 | 0.45508 |
| K | ||||||
| Velocity | Temperature | |||||
| 0.1 | 0.5 | 1.0 | 0.5 | 0.5 | 1.0 | |
| 0.005 | −0.00191 | −0.00191 | −0.00191 | −0.49498 | −0.49498 | −0.49498 |
| 0.205 | −0.02171 | −0.02173 | −0.02174 | −0.29458 | −0.29469 | −0.29476 |
| 0.405 | −0.00754 | −0.00757 | −0.00758 | −0.09446 | −0.0946 | −0.0947 |
| 0.605 | 0.01046 | 0.01043 | 0.01042 | 0.10556 | 0.10541 | 0.10531 |
| 0.805 | 0.02382 | 0.02379 | 0.02379 | 0.30544 | 0.30533 | 0.30525 |
| 0.995 | 0.00201 | 0.00201 | 0.00201 | 0.49502 | 0.49501 | 0.49501 |
| Different Nanoparticles | ||||||
| Velocity | Temperature | |||||
| Copper | Diamond | TiO2 | Copper | Diamond | TiO2 | |
| 0.005 | −0.00191 | −0.00191 | −0.00191 | −0.49499 | −0.49499 | −0.49499 |
| 0.205 | −0.02174 | −0.02167 | −0.02166 | −0.29476 | −0.29476 | −0.29476 |
| 0.405 | −0.00758 | −0.00755 | −0.00755 | −0.0947 | −0.0947 | −0.0947 |
| 0.605 | 0.01042 | 0.01039 | 0.01038 | 0.10531 | 0.10531 | 0.10531 |
| 0.805 | 0.02379 | 0.02372 | 0.0237 | 0.30525 | 0.30525 | 0.30525 |
| 0.995 | 0.00201 | 0.002 | 0.002 | 0.49501 | 0.49501 | 0.49501 |
Table 4.
Volumetric flow rate and skin friction.
| Layer-1 | Layer-2 | Layer-1 | Layer-2 | |||
|---|---|---|---|---|---|---|
| Q | ||||||
| Gr | ||||||
| −25 | 0.000393 | 0.000395 | 0.849089 | 0.835412 | 0.894193 | 0.87991 |
| 0.0 | 0.000637 | 0.00065 | 0.008279 | −0.008279 | 0.0087 | −0.0087 |
| 25 | 0.00088 | 0.0009 | −0.832576 | −0.852003 | −0.876882 | −0.897309 |
| Br | ||||||
| 0.0 | 0.000637 | 0.000649 | −0.328675 | −0.345231 | −0.34635 | −0.363732 |
| 1.0 | 0.000794 | 0.000811 | −0.327791 | −0.346196 | −0.345403 | −0.364767 |
| 2.0 | −0.32692 | −0.347180 | −0.344466 | −0.365822 | 0.000951 | 0.000975 |
| Da | ||||||
| 0.001 | 0.000086 | 0.000088 | −0.130087 | −0.135780 | −0.137434 | −0.143431 |
| 1.0 | 0.003476 | 0.003481 | −0.575485 | −0.62336 | −0.603157 | −0.652663 |
| 2.0 | 0.003559 | 0.003563 | −0.578577 | −0.627279 | −0.606351 | −0.656694 |
| I | ||||||
| 0.0 | 0.000653 | 0.000666 | −0.328617 | −0.345361 | −0.34639 | −0.363988 |
| 4.0 | 0.000652 | 0.000665 | −0.328586 | −0.345326 | −0.346255 | −0.363834 |
| 8.0 | 0.000652 | 0.000664 | −0.328555 | −0.345292 | −0.346121 | −0.363681 |
| κ | ||||||
| 0.1 | 0.000806 | 0.001812 | −0.344783 | −0.363251 | −0.513519 | −0.545572 |
| 1.0 | 0.000652 | 0.000665 | −0.328586 | −0.345326 | −0.346255 | −0.363834 |
| 2.0 | 0.000611 | 0.000399 | −0.321512 | −0.337719 | −0.275789 | −0.289002 |
| ϕ | ||||||
| 0.0 | −0.346946 | −0.364576 | −0.346842 | −0.364458 | 0.000668 | 0.000667 |
| 0.01 | 0.000652 | 0.000665 | −0.328586 | −0.345326 | −0.346255 | −0.363834 |
| 0.5 | 0.000134 | 0.000555 | −0.00873 | −0.009244 | −0.316545 | −0.332298 |
| λ | ||||||
| 0.1 | 0.000806 | 0.005461 | −0.359596 | −0.37863 | −3.032725 | −3.184318 |
| 0.5 | 0.000706 | 0.001244 | −0.341728 | −0.359329 | −0.663855 | −0.697464 |
| 1.0 | 0.000652 | 0.000665 | −0.328586 | −0.345326 | −0.346255 | −0.363834 |
| K | ||||||
| 0.1 | 0.000664 | 0.000725 | −0.328525 | −0.345392 | −0.345856 | −0.36428 |
| 0.5 | 0.000656 | 0.000674 | −0.328567 | −0.345346 | −0.346198 | −0.363897 |
| 1.0 | 0.000652 | 0.000665 | −0.328586 | −0.345326 | −0.346255 | −0.363834 |
| Nanoparticles | ||||||
| Copper | 0.000652 | 0.000665 | −0.328586 | −0.345326 | −0.346255 | −0.363834 |
| Diamond | 0.000652 | 0.000665 | −0.325075 | −0.341721 | −0.346139 | −0.363718 |
| Titanium oxide | 0.000652 | 0.000665 | −0.324219 | −0.340843 | −0.346111 | −0.363689 |
| Base fluids | ||||||
| Engine oil−Mineral oil | 0.000822 | 0.011935 | −0.354553 | −0.373580 | −8.154155 | −8.529412 |
| Ethylene Glycol−Mineral oil | 0.000661 | 0.000721 | −0.325498 | −0.342285 | −0.346757 | −0.36578 |
| Ethylene Glycol−Kerosene | 0.000763 | 0.005056 | −0.324544 | −0.343057 | −0.322369 | −0.468768 |
Table 5.
Average Nusselt number.
| Layer-1 | Layer-2 | |||
|---|---|---|---|---|
| Gr | ||||
| −25 | 1.041466 | 1.019122 | 1.011303 | 0.988959 |
| 0.0 | 1.030166 | 1.03016 | 1.000003 | 0.999997 |
| 25 | 1.041095 | 1.018737 | 1.010931 | 0.988572 |
| Br | ||||
| 0.0 | 1.030163 | 1.030163 | 1.0 | 1.0 |
| 1.0 | 1.047208 | 1.011305 | 1.017056 | 0.981116 |
| 2.0 | 1.064024 | 0.992075 | 1.033876 | 0.961852 |
| Da | ||||
| 0.001 | 1.030467 | 1.029834 | 1.000306 | 0.999668 |
| 1.0 | 1.034555 | 1.025214 | 1.004361 | 0.995088 |
| 2.0 | 1.034592 | 1.025167 | 1.004398 | 0.995042 |
| I | ||||
| 0.0 | 1.03188 | 1.028292 | 1.001719 | 0.998125 |
| 4.0 | 1.031878 | 1.028293 | 1.001717 | 0.998128 |
| 8.0 | 1.031877 | 1.028294 | 1.001715 | 0.99813 |
| Κ | ||||
| 0.1 | 1.032403 | 1.02772 | 1.003029 | 0.996647 |
| 1 | 1.031878 | 1.028293 | 1.001717 | 0.998128 |
| 2 | 1.031692 | 1.028494 | 1.00125 | 0.998643 |
| ϕ | ||||
| 0.0 | 1.001743 | 0.998099 | 1.001742 | 0.998101 |
| 0.01 | 1.031878 | 1.028293 | 1.001717 | 0.998128 |
| 0.5 | 3.973438 | 3.971892 | 1.001020 | 0.998873 |
| λ | ||||
| 0.1 | 1.03447 | 1.025534 | 1.010732 | 0.988207 |
| 0.5 | 1.032297 | 1.027845 | 1.002908 | 0.996818 |
| 1.0 | 1.031878 | 1.028293 | 1.001717 | 0.998128 |
| K | ||||
| 0.1 | 1.032476 | 1.027657 | 1.011136 | 0.987557 |
| 0.5 | 1.032124 | 1.028033 | 1.002941 | 0.996774 |
| 1.0 | 1.031878 | 1.028293 | 1.001717 | 0.998128 |
| Nanoparticles | ||||
| Copper | 1.031878 | 1.028293 | 1.001717 | 0.998128 |
| Diamond | 1.031948 | 1.028392 | 1.001712 | 0.998133 |
| Titanium oxide | 1.026479 | 1.022934 | 1.001713 | 0.998132 |
| Base fluids | ||||
| Engine oil–Mineral oil | 1.036451 | 1.023681 | 1.020135 | 0.978092 |
| Ethylene Glycol–Mineral oil | 1.032169 | 1.028151 | 1.002844 | 0.996861 |
| Ethylene Glycol–Kerosene | 1.031712 | 1.028603 | 1.000655 | 0.999104 |
Disclaimer/Publisher’s Note: The statements, opinions and data contained in all publications are solely those of the individual author(s) and contributor(s) and not of MDPI and/or the editor(s). MDPI and/or the editor(s) disclaim responsibility for any injury to people or property resulting from any ideas, methods, instructions or products referred to in the content. |
© 2023 by the authors. Licensee MDPI, Basel, Switzerland. This article is an open access article distributed under the terms and conditions of the Creative Commons Attribution (CC BY) license (https://creativecommons.org/licenses/by/4.0/).
Share and Cite
MDPI and ACS Style
Umavathi, J.C.; Sheremet, M.A. Linear Model for Two-Layer Porous Bed Suspended with Nano Sized Particles. Energies 2023, 16, 2044. https://doi.org/10.3390/en16042044
AMA Style
Umavathi JC, Sheremet MA. Linear Model for Two-Layer Porous Bed Suspended with Nano Sized Particles. Energies. 2023; 16(4):2044. https://doi.org/10.3390/en16042044
Chicago/Turabian StyleUmavathi, Jawali C., and Mikhail A. Sheremet. 2023. "Linear Model for Two-Layer Porous Bed Suspended with Nano Sized Particles" Energies 16, no. 4: 2044. https://doi.org/10.3390/en16042044
Note that from the first issue of 2016, this journal uses article numbers instead of page numbers. See further details here.