Article

Performance of Deep Learning Techniques for Forecasting PV Power Generation: A Case Study on a 1.5 MWp Floating PV Power Plant

by
Nonthawat Khortsriwong
1,
Promphak Boonraksa
2,
Terapong Boonraksa
3,
Thipwan Fangsuwannarak
1,
Asada Boonsrirat
4,
Watcharakorn Pinthurat
5,6 and
Boonruang Marungsri
1,*
1
School of Electrical Engineering, Suranaree University of Technology, Nakhon Ratchasima 30000, Thailand
2
School of Electrical Engineering, Rajamangala University of Technology Suvarnabhumi, Nonthaburi 11000, Thailand
3
School of Electrical Engineering, Rajamangala University of Technology Rattanakosin, Nakhon Pathom 73170, Thailand
4
Energy Solution Business, SCG Chemicals Public Co., Ltd., Bangsue, Bangkok 10800, Thailand
5
School of Electrical Engineering and Telecommunications, The University of New South Wales, Sydney 2052, Australia
6
Department of Electrical Engineering, Rajamangala University of Technology Tawan-Ok, Chanthaburi 22210, Thailand
*
Author to whom correspondence should be addressed.
Energies 2023, 16(5), 2119; https://doi.org/10.3390/en16052119
Submission received: 2 February 2023 / Revised: 17 February 2023 / Accepted: 20 February 2023 / Published: 22 February 2023
(This article belongs to the Special Issue Big Data Analytics for Smart Power/Energy Systems)

Abstract

:
Recently, deep learning techniques have become popular and are widely employed in several research areas, such as optimization, pattern recognition, object identification, and forecasting, due to the advanced development of computer programming technologies. A significant number of renewable energy sources (RESs) as environmentally friendly sources, especially solar photovoltaic (PV) sources, have been integrated into modern power systems. However, the PV source is highly fluctuating and difficult to predict accurately for short-term PV output power generation, leading to ineffective system planning and affecting energy security. Compared to conventional predictive approaches, such as linear regression, predictive-based deep learning methods are promising in predicting short-term PV power generation with high accuracy. This paper investigates the performance of several well-known deep learning techniques to forecast short-term PV power generation in the real-site floating PV power plant of 1.5 MWp capacity at Suranaree University of Technology Hospital, Thailand. The considered deep learning techniques include single models (RNN, CNN, LSTM, GRU, BiLSTM, and BiGRU) and hybrid models (CNN-LSTM, CNN-BiLSTM, CNN-GRU, and CNN-BiGRU). Five-minute resolution data from the real floating PV power plant is used to train and test the deep learning models. Accuracy indices of MAE, MAPE, and RMSE are applied to quantify errors between actual and forecasted values obtained from the different deep learning techniques. The obtained results show that, with the same training dataset, the performance of the deep learning models differs when testing under different weather conditions and time horizons. The CNN-BiGRU model offers the best performance for one-day PV forecasting, while the BiLSTM model is the most preferable for one-week PV forecasting.

1. Introduction

In recent years, renewable energy sources (RESs), particularly photovoltaic (PV) sources, have substantially penetrated modern power systems [1]. A number of solar PV sources are expected to integrate into the residential power sector due to their abundant and environmentally-friendly nature, as well as their proximity to end-users. The adoption of solar PV sources can reduce system losses, improve reliability, security, and stability, as well as minimize transmission congestion [2]. However, the solar source is intermittent and is is difficult to accurately predict its power generation. This issue can directly affect power generation planning and may exacerbate power quality and security. Several state-of-the-art deep learning techniques have been proposed in the literature to accurately forecast solar PV power generation in modern power networks.
Deep learning techniques are a subset of machine learning that model the neurons in the human brain. It has evolved from the artificial neural network (ANN), which was pioneered in 1943 by Warren McCulloch and Walter Pitts [3]. The ANN was later developed as a recurrent neural network (RNN) by David Everett [4] to address the problem of so-called very deep learning caused by neurons greater than 1000 [5]. Subsequently, the RNN evolved into the long short-term memory (LSTM) model in 1997 with the addition of cell state [6]. The gate recurrent unit (GRU) model was developed from the LSTM model in 2014 and is similar conceptually, but requires fewer parameters [7]. In 1997, the bidirectional RNN was developed to allow forward and backward processing, which later evolved into BiRNN, BiLSTM, and BiGRU [8]. Another branch of machine learning is the convolutional neural network (CNN), which emerged in the 1980s and is designed to process pixel data [9].
The deep learning technique has been applied to several research projects. The detection of physical damage on insulators has been studied using a deep learning technique [10]. Additionally, this technique has been applied to calculate reactive power in an IEEE 14-Bus test system and optimize power flow [11,12,13]. In [14], several recent deep learning approaches were applied for short-term Net-PV forecasting, while the authors in [15] proposed frequency-domain analysis and deep learning for ultra-short-term PV power generation forecasting.
Different deep learning models have recently been combined to form a hybrid model for the enhancement of model efficiency. CNN-GRU is a new hybrid predictive model used for short-term wind speed forecasting, in which numerical weather forecasting (NWP) and actual wind speeds are used as the inputs. The CNN-GRU model is a standard used to resolve size differences between data types [16]. The CNN-BiGRU (bidirectional GRU) hybrid model can fully extract text properties, solve distance sequence dependency, and improve training reliability [17].
Among the applications of deep learning techniques, forecasting is quite popular. Deep learning techniques are also applied in short-term forecasting and mid-term peak load forecasting [18,19,20]. Moreover, the RNN model has been used in forecasting due to its high efficiency [21,22]. Furthermore, the LSTM model was developed for the forecasting application. The LSTM model consists of the cell state or memory, which involves the addition of the RNN model. It was also found that the LSTM model yields high accuracy in forecasting [19,20,23]. Later, the LSTM model was developed into the GRU model by removing the cell state. Only the update gate and reset gate have been used for short-term forecasts [16,24,25,26]. Typically, CNN has been used for image processing, but some studies have applied it to electrical forecasting [27]. Both CNN-GRU and CNN-BiGRU models were used to forecast short-term residential loads [17,28]. Based on a literature survey, it was found that deep learning techniques have been widely applied in forecasting applications. In [29], air conditioning loads were forecasted in the short term for effective demand response using the Levenberg–Marquardt algorithm-based ANN. The proposed Levenberg–Marquardt algorithm-based ANN yielded better performance compared to the scaled conjugate gradient (SCG) and statistical regression approach. To promote net-zero emissions, many countries worldwide have adopted PV power generation systems into distribution networks and microgrids [30,31]. The authors in [32] studied the effects of dust on PV panels. The voltage of the panels decreased when the dust was high, thus the efficiency decreased. The dust also caused a partial shading fault that, if not carefully monitored, could lead to a hot spot on the PV panels [33]. To prevent this situation and detect the hot spot, global maximum power point tracking (GMPPT) is employed [34]. Due to the uncertainty and variability of the PV source, it is necessary to use highly accurate techniques to predict the output power generation from the PV power plants. So far, many researchers have applied deep learning techniques in energy forecasting to maximize the utilization of PV power plants and for effective energy planning [35].
Motivated by the above discussion, this paper examines the performances of different well-known deep learning techniques for forecasting short-term PV power generation. The selected deep learning techniques include RNN, CNN, GRU, LSTM, BiLSTM, BiGRU, CNN-LSTM, CNN-BiLSTM, CNN-GRU, and CNN-BiGRU. A real-site floating PV power plant with a capacity of 1.5 MWp at Suranaree University of Technology Hospital in Thailand was selected as the study area. Several input data variables with a resolution of five minutes were utilized for training and testing deep learning models under different weather conditions and time horizons. Furthermore, the root mean square error (RMSE), mean absolute percentage error (MAPE), and mean absolute error (MAE) were used to quantify error values between actual and forecasted values from different deep learning methods. Table 1 illustrates the differences between our work and existing studies. The main objective of our work was to investigate the performances of widely used deep learning techniques for short-term forecasting of PV power generation on a real site of a floating PV power plant using real datasets.
The main contributions of this paper are as follows:
  • We have investigated and examined the effectiveness of several well-known deep learning techniques for forecasting the PV power generation of a real-site floating PV power plant located at the Suranaree University of Technology Hospital in Thailand. The selected deep learning techniques were classified into single models (RNN, CNN, LSTM, GRU, BiLSTM, and BiGRU) and hybrid models (CNN-LSTM, CNN-BiLSTM, CNN-GRU, and CNN-BiGRU).
  • We considered short-term forecasting of the PV power generation. Input variables of the PV power generation, solar irradiance, PV module temperature, and wind speed with five-minute resolution obtained from the floating PV power plant (1.5 MWp in capacity) were utilized to verify the performances of the proposed deep learning techniques. Three scenarios, including one-day PV power generation forecasting under regular and cloudy weather and one-week PV power generation forecasting, are extensively examined and discussed.
  • Widely used error measurements of RMSE, MAPE, and MAE were applied to quantify the errors between actual and forecasted values from the different deep learning models. The accurate performances of the deep learning models were determined based on these measurements. The proposed deep learning techniques were implemented using Keras based on TensorFlow in Python via the Jupyter notebook.
The rest of the paper is organized as follows: Section 2 presents the details of the real-site floating PV power plant used as a case study in this paper. Section 3 introduces the application of the selected deep learning techniques for short-term PV power generation forecasting, including implementation setup and model accuracy analysis. Section 4 presents the verification results obtained by different deep learning models. Finally, Section 5 concludes the paper. Note that the theoretical backgrounds of the deep learning models are provided in the Appendix A, Appendix B, Appendix C, Appendix D, Appendix E, Appendix F, Appendix G, Appendix H, Appendix I and Appendix J.

2. A 1.5 MWp Floating PV Power Plant

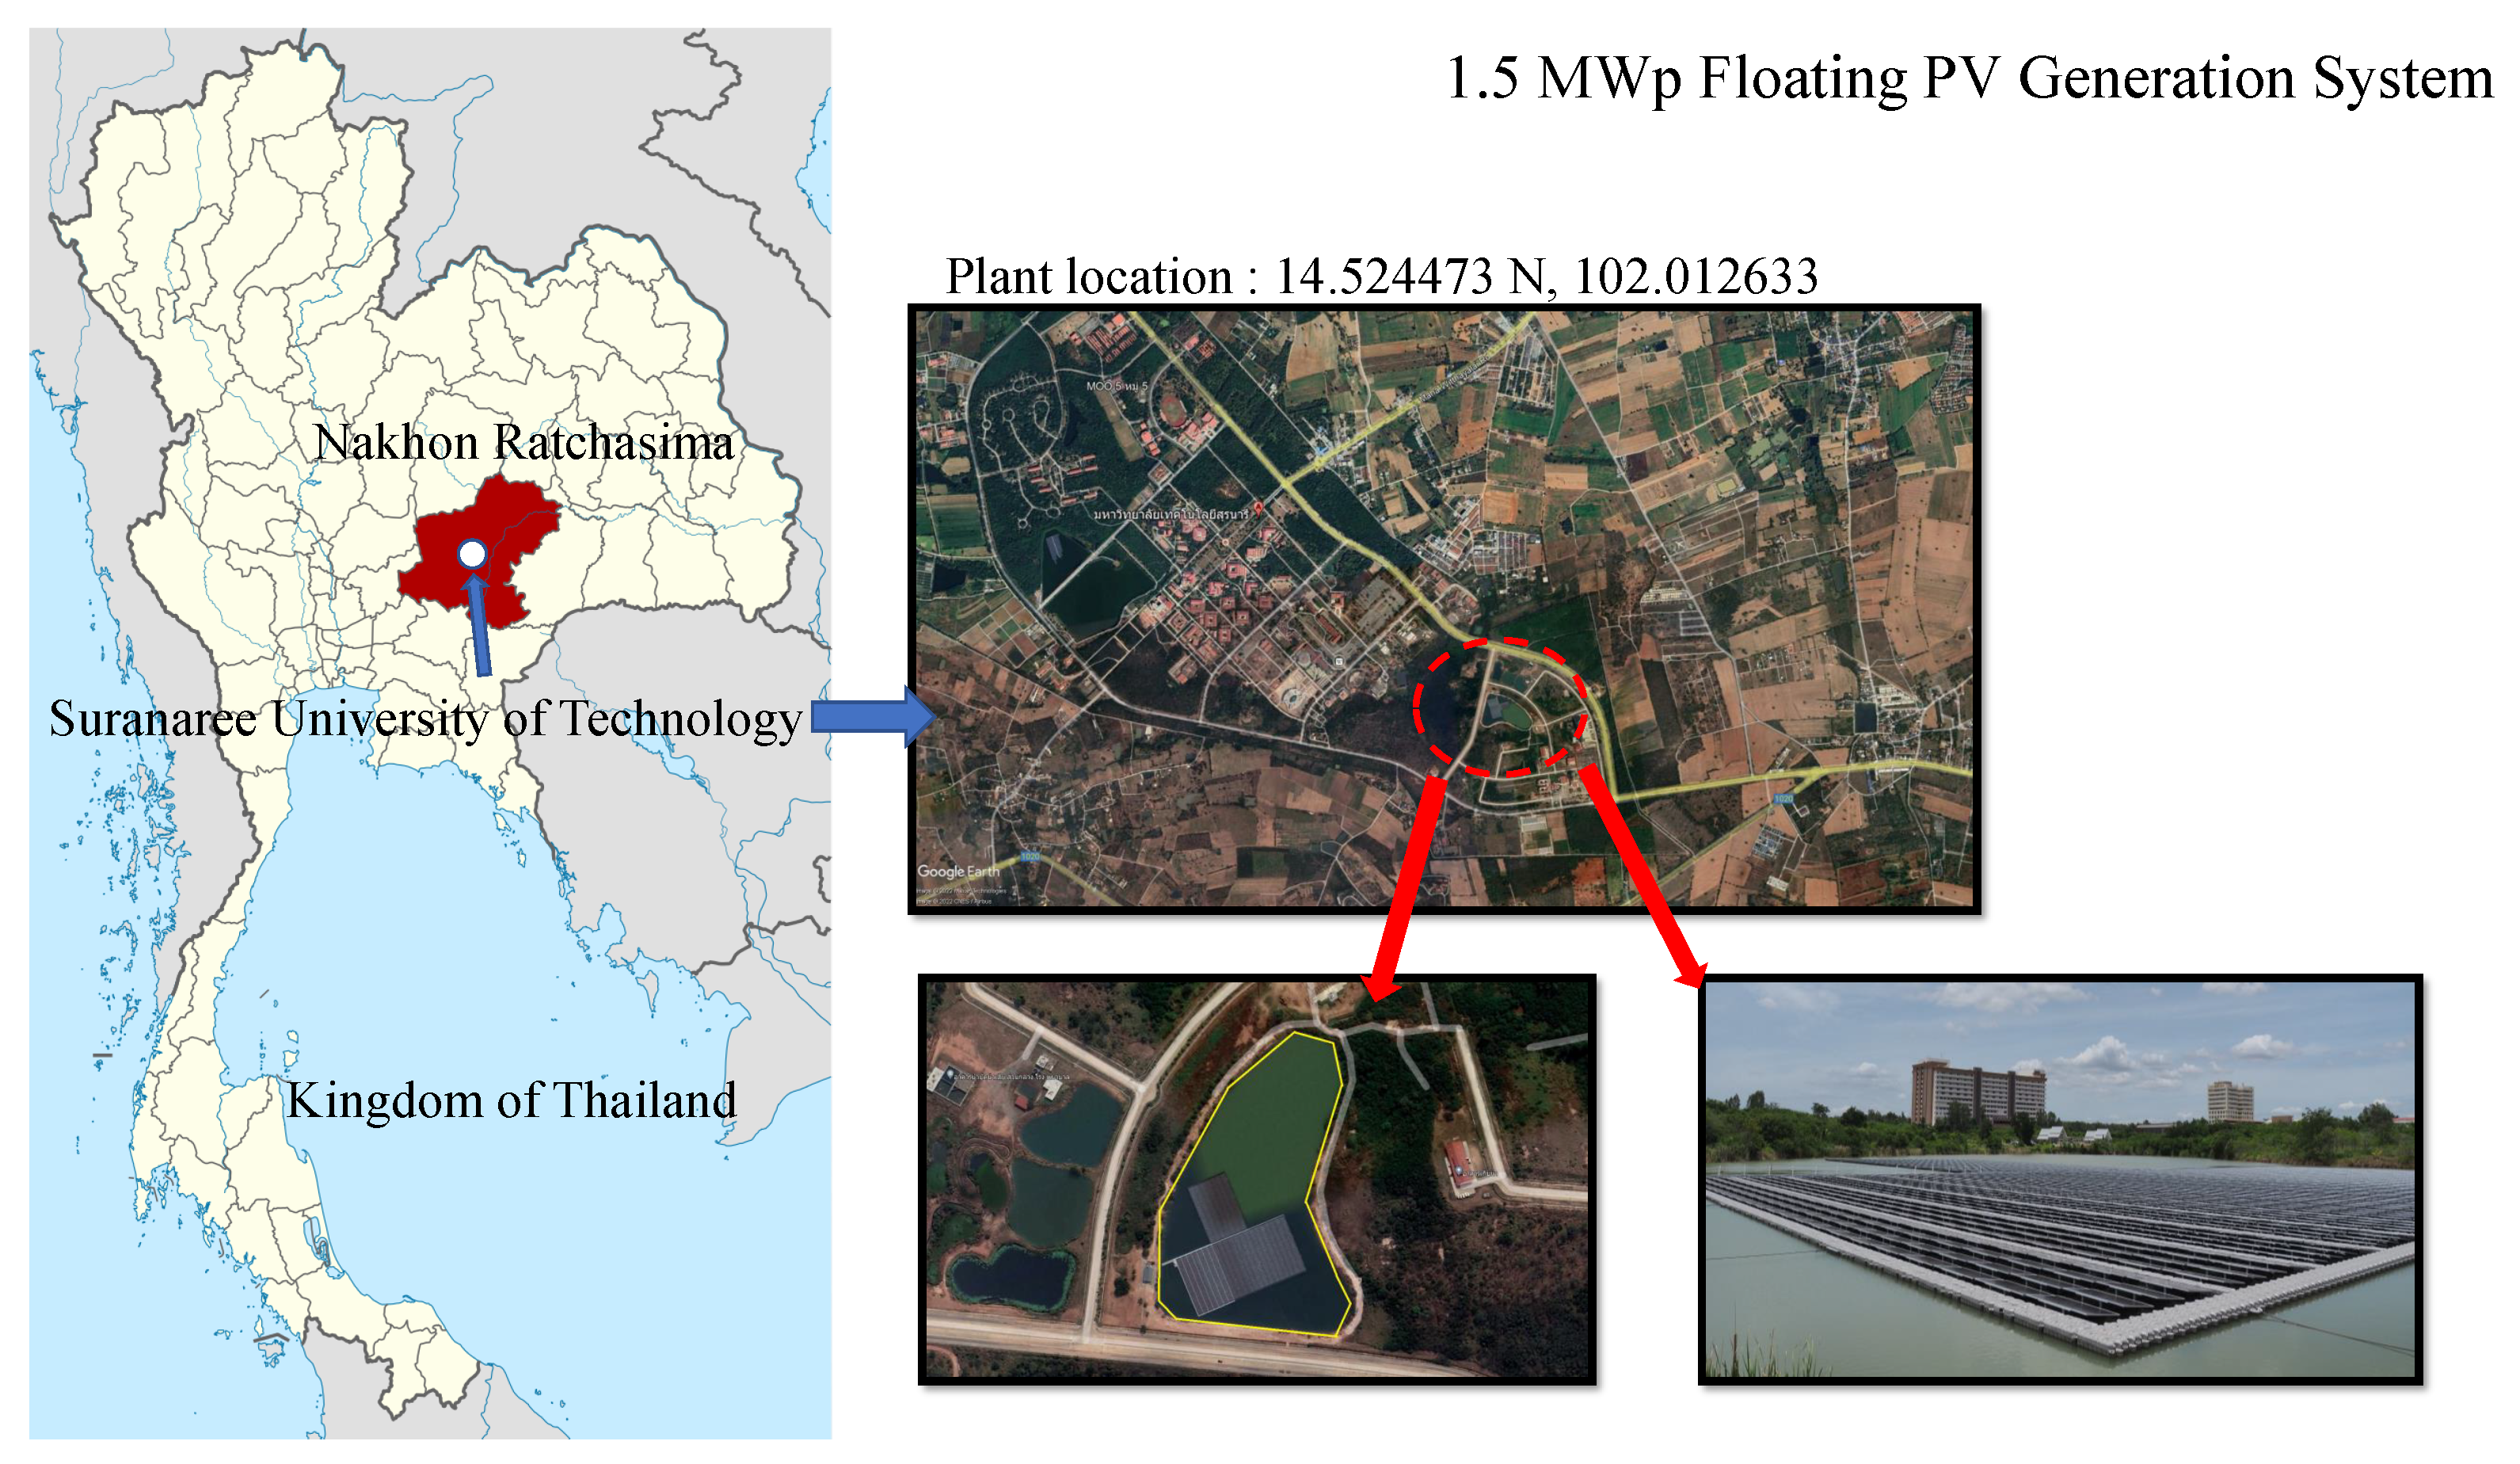
In this study, a floating PV power plant, located at 111 University Road, Suranaree Sub-district, Mueang Nakhon Ratchasima District, Nakhon Ratchasima Province, Thailand, with a population of 30,000, was selected as the study area to investigate the performances of the proposed deep learning models. The installed capacity of the floating PV plant was 1.5 MWp. The floating PV plant cooperated with the Global Power Synergy Public Co., Ltd., Bangkok, Thailand 10120. In the floating PV plant, bi-facial cells and mono-facial panels were installed with a total of 8 inverters; each contains 14 strings with 25 panels. Detail of the PV modules are given in Table 2; the installed floating PV site is illustrated in Figure 1.
Specifically, we focus on short-term PV power forecasting, using five-minute resolution data for training and testing deep learning models. The forecasts include one-day and one-week periods, with the one-day forecast further divided into two events: (i) regular weather conditions and (ii) cloudy weather conditions. Input data for the deep learning models include PV power generation, solar irradiance, wind speed, and PV module temperature. The data used for forecasting were selected from a three-month period, between 1 February and 23 April 2022, and divided into training and testing sets. For the one-day forecast under regular weather conditions, the training set includes data from 1 February to 15 April (74 days), with the testing set consisting of data from 16 April (1 day). For the one-day forecast under cloudy weather conditions, the training set also includes data from 1 February to 15 April (74 days), with the testing set consisting of data from 18 April (1 day). Finally, for the one-week forecast, the training set includes data from 1 February to 15 April (74 days), with the testing set consisting of data from 16 April to 23 April (7 days). The training and testing data are shown in Figure 2.

3. Application of Deep Learning Techniques for PV Power Generation Forecasting

In this section, the detailed setup for implementing the deep learning models is provided. Moreover, the model accuracy for quantifying the performance of each deep learning model is briefly presented.

3.1. Implementation Setup

In this paper, we used Keras based on TensorFlow in Python writing on a Jupyter notebook. The proposed deep learning models were trained and tested using the Intel(R) Core(TM) i7-8750H CPU @ 2.20 GHz processor. The setup parameters for implementation were determined based on references [17,26,41,42], and are presented in Table 3. To prevent model over-fitting, the early stopping function was utilized to help select the number of epochs. Training stopped if the weight loss increased; the results for all models fell between 9 and 12 epochs. Therefore, an epoch number of 10 was used for all deep learning models during the training process. Additionally, the Adam optimizer was used to update the learning rate for all models.
Figure 3 illustrates the procedure for implementing the proposed deep learning techniques. As mentioned earlier, the deep earning techniques in this study are broadly divided into the single model and hybrid model. At the beginning of the process, the weight parameters of each model were initialized, and then the input data of the floating PV power plant were read. Next, each deep learning model was trained based on the input dataset until the results of the training converged to the optimal value or the predefined number of epochs. Finally, the well-trained models were tested with the test dataset in order to assess the performance of each deep learning technique. Three widely accepted accuracy measurements of RMSE, MAPE, and MAE were used to quantify the errors between actual and forecasted values of the PV power generations.

3.2. Model Accuracy Analysis

Statistical calculations were used to measure the accuracies of the forecasted values obtained by different deep learning methods. In this paper, we used MAE, MAPE, and RMSE to assess the accuracy of each deep learning technique. Forecasted and actual values, respectively, are used in the calculations [43].
The MAE simply calculates the sum of the absolute errors between the actual value y and the forecasted value y ^ , and can be obtained as,
MAE = 1 n 1 n | y y ^ | .
The MAPE is the mean absolute of the percentage errors of the forecasts and is defined by
MAPE = 100 n 1 n | y y ^ y ^ | .
The RMSE is similar to MSE but takes the square root of the error values between the actual and forecasted data [23]:
RMSE = 1 n 1 n ( y y ^ ) 2 .

4. Results and Discussions

In this section, the training performance of each deep learning model is given and discussed. Moreover, there are three case studies used for verifying the performances of the proposed deep learning models. The given case studies include (A) one-day PV power generation forecasting on a regular weather day, (B) one-day PV power generation forecasting on a cloudy weather day, and (C) one-week PV power generation forecasting.

4.1. Training Performance

The training and validation losses of the deep learning models were performed by using the MAE indicator to verify the ability of the deep learning models to forecasting PV power generation. An example of one-day PV power generation data of training and testing datasets was used. In this case, the deep learning models did not see the test data before. The same data were applied to all deep learning models. Figure 4 and Figure 5 show the training loss and validation loss of BiLSTM and CNN-BiLSTM models, respectively. It is observed that the models are neither over-fitting nor under-fitting. The verified results from other models aligned with the results in Figure 4 and Figure 5, but are not included in the paper. In the next subsection, the three case studies are given and discussed.

4.2. Case Study A: One-Day PV Power Generation Forecasting on a Regular Weather Day

In this section, we discuss the one-day PV power generation forecasting results on a regular weather day obtained from the proposed deep learning models. Figure 6 and Figure 7 show the one-day PV power generation forecasting results on a regular weather day from single and hybrid deep learning models, respectively.
For the single deep learning model in Figure 6, considering the obtained results of RNN and CNN models with actual PV data, the performance of the RNN model in forecasting PV power generation on a regular weather day is better than the result of the CNN model. This is because the structure of RNN consists of a recurrent layer, which takes the output from the previous time step to the current time step. Thus, the RNN model is suitable for predicting time-series input data. However, the GRU model is the most accurate in this case study, with the MAE, MAPE, and RMSE being 28.34 kW, 8.32% and 67.53 kW, respectively. This is because the GRU model has structure memory, which is developed from the recurrent layer, see the inset of Figure 6. Figure 8 and Table 4 provide the errors of each model in this case study.
For the hybrid deep learning model, as seen in Figure 7, the hybrid model has the CNN model as the basis. The hybrid model yields better performance compared to the single deep learning model. In this case, the forecasting result of the CNN-BiGRU model is the closest to the actual PV data because it has properties of forward and backward sequences, which has the ability to process the data in a bidirectional way, see the inset of Figure 7. The performance errors of the CNN-BiGRU model are 32.16 kW, 9.07%, and 72.56 kW of MAE, MAPE, and RMSE, respectively. Moreover, Figure 8 and Table 4 show the errors of each model in this case study.

4.3. Case Study B: One-Day PV Power Generation Forecasting on a Cloudy Weather Day

In this section, one-day PV power generation forecasting results on a cloudy weather day are given and discussed. Figure 9 and Figure 10 show the one-day PV power generation forecasting results on a cloudy weather day obtained from the single and hybrid deep learning models, respectively.
As given in Figure 9 for the single deep learning model, the performance of the CNN model is as poor as expected since it is unable to deal with the high fluctuation of the PV data on a cloudy weather day. In this circumstance, the LSTM model provides the best performance with MAE, MAPE, and RMSE at 36.44 kW, 11.19%, and 70.24 kW, respectively, as given in the inset of Figure 9. Based on the obtained results, it can be concluded that the LSTM model is preferable for predicting highly fluctuated PV power generation. Figure 11 and Table 5 provide the errors of each model in this case study.
Furthermore, the results obtained by the hybrid deep learning model are illustrated in Figure 10. As mentioned before, the hybrid model consisted of the CNN model as a basis. Based on the high randomness of the PV data, the CNN-BiGRU model has the best performance for forecasting, with MAE, MAPE, and RMSE at 28.89 kW 8.37%, and 72.53 kW, respectively, see the inset of Figure 10. Moreover, Figure 11 and Table 5 provide the errors of each model in this case study.

4.4. Case Study C: One-Week PV Power Generation Forecasting

In this section, one-week PV power generation forecasting results of the proposed deep learning models are given and discussed. Figure 12 and Figure 13 show the one-week PV generation forecasting results obtained from the single and hybrid deep learning models, respectively.
Similar to the previous two case studies, for the single deep learning model, the performance of the CNN model yields the worst because the CNN model itself is more suitable for pixel data rather than time-series data. As seen in Figure 12, the BiLSTM model is the most accurate model for predicting one-week PV generation, with the MAE, MAPE, and RMSE at 34.67 kW, 10.56%, and 75.06 kW, respectively. The zoomed-in data can be seen in the two insets of Figure 12 for the constant (left) and fluctuated (right) PV generations. Figure 14 and Table 6 provide the errors of each model in this case study.
In addition, the results of the hybrid model for predicting one-week PV generation are shown in Figure 13. The CNN-BiLSTM model was the most accurate. The MAE, MAPE, and RMSE errors were 45.97 kW, 15.75%, and 72.08 kW, respectively. The zoomed-in data can be seen in the two inset figures in Figure 13 for the constant (left) and fluctuated (right) PV generations. Moreover, Figure 14 and Table 6 provide the errors of each model in this case study.

4.5. Discussion

In the single deep learning model, the LSTM model is the most accurate model for forecasting one-day PV generation. For one-week PV power generation forecasting, the BiLSTM model yielded the best result. Both LSTM and BiLSTM models have memory storage, so they can effectively deal with highly unpredictable data. The CNN model itself yielded a poor performance as it is more suitable for image or pixel data rather than time-series data. Moreover, the hybrid deep learning model, by using some properties of the CNN model as the basis, such as convolution and pooling layers, can improve the performance of the single deep learning model. In this type of model, the CNN-BiGRU model performed better in predicting one-day PV power generation while the BiLSTM model is suitable for one-week PV power generation forecasting since it has memory storage to store the historical prediction. Thus, it can be concluded that the CNN-BiGRU model is the most suitable for one-day PV forecasting while the BiLSTM model is more appropriate for one-week PV forecasting under the same training dataset. The performances of the deep learning models from the three case studies are summarized in Table 7. Furthermore, some merits and demerits of the proposed deep learning models are given in Table 8. Thus, it can be concluded that the CNN-BiGRU model gave the best performance for one-day PV forecasting while the BiLSTM model was the most accurate for one-week PV forecasting.

5. Conclusions

Due to the advancement of computing technologies, various novel deep learning techniques have been proposed. One area where these techniques have been extensively applied is power generation forecasting from renewable energy sources, which enables effective system planning and enhances energy security. In this paper, we investigated the performances of several deep learning techniques for short-term forecasting of PV power generation at a real-site floating PV power plant located at the Suranaree University of Technology Hospital in Thailand. The selected deep learning techniques include RNN, CNN, LSTM, GRU, BiLSTM, BiGRU, CNN-LSTM, CNN-BiLSTM, CNN-GRU, and CNN-BiGRU. Several input data variables with a five-minute resolution from the real floating PV power plant were used to train and test the deep learning models. The performance of the models was quantified using MAE, MAPE, and RMSE errors. Three case studies, based on different weather conditions and time durations, were provided for verification. All three case studies were trained using the same dataset. The effectiveness of the deep learning models varied under different weather conditions and time durations. The CNN-BiGRU model yielded the best performance for one-day PV forecasting, while the BiLSTM model was the most suitable for one-week PV forecasting.

Author Contributions

Conceptualization, N.K., P.B., T.B., W.P. and B.M.; methodology, N.K., T.B. and W.P.; software N.K., P.B. and T.B.; validation, N.K., P.B., T.B., T.F., A.B., W.P. and B.M.; formal analysis, N.K., P.B., T.B., T.F., A.B., W.P. and B.M.; investigate T.B., W.P. and B.M.; data curation, P.B. and T.B.; writing—original draft preparation, N.K., T.B. and W.P.; writing—review and editing, N.K., P.B., T.B., T.F., A.B., W.P. and B.M.; supervision, B.M.; funding acquisition, B.M. All authors have read and agreed to the published version of the manuscript.

Funding

This research received no external funding.

Institutional Review Board Statement

Not applicable.

Informed Consent Statement

Not applicable.

Data Availability Statement

Not applicable.

Acknowledgments

Authors gratefully acknowledge financial support from Suranaree University of Technology, Thailand.

Conflicts of Interest

The authors declare no conflict of interest.

Appendix A. Theoretical Backgrounds of Deep Learning Techniques

In this section, theoretical backgrounds of the employed deep learning techniques are briefly explained. Typically, sigmoid and tanh activation functions are used in deep learning, which can be expressed as,
s i g m o i d ( x ) = 1 1 + e x , t a n h ( x ) = e x e x e x + e x .

Appendix B. Recurrent Neural Network

In general, an artificial neural network (ANN) is a function that takes the input and processes it as an output. The ANN model can accept information in any order. In the RNN model, however, the output of the hidden layer node is fed back to be the new input of the node. The RNN model can be defined by,
y j = f t = 1 n ( w i j α j ) · h t 1 ,
where y j is the output vector; w i j is the weight between node i and node j; α j is the bias at node j; f ( · ) is the activation function; h t 1 represents the previous hidden layer vector.

Appendix C. Convolution Neural Network

A CNN model simulates human vision as a sub-spatial area. The CNN model uses a convolution layer to extract different data features so that it can learn the nature of the data efficiently and accurately. The performance will be decreased if the model has several convolution layers. This issue can be addressed by padding, in which the dimensions of output data will be equal to those of input data. In the pooling layer, the dimensions of the hidden layer are reduced by combining the outputs of neuron clusters at the previous layer into a single neuron in the next layer [24,44]. The result of the convolution layer and the processing of the pooling layer can be defined as
s b i = f ( w b x i : i + b 1 + c a ) , h p o o l = M A X ( s 1 , s 2 , , s n h + 1 ) ,
where s b i represents the output of the convolution layer; w b represents the weights; c a is the bias vector; x i : i + b 1 is the vector from i to i + b 1 ; f ( · ) represents the activation function; b is the size of the convolution windows; h p o o l is the pooling layer.

Appendix D. Long Short-Term Memory

An LSTM model is developed from the RNN model, where memory (cell state), forget gate, input gate, and output gate are included [43,44]. The forget gate takes data from x t and h t 1 and decides whether to forget the data or to let them pass through the following process. The sigmoid activation function is adopted. If the value is 1, the data will be passed through, whereas the data are forgotten if the value is 0. The forget gate can be calculated as,
f t = s i g m o i d ( W f x t + U f h t 1 ) ,
where f t is the activation vector of the forget gate; W s is the weights of the input; x t is the input vector to the LSTM unit; U i is the weight matrix of the recurrent connections; and h t 1 is the previous hidden state vector.
Then, the input data can be chosen to be updated by the input gate. The sigmoid function is also used in the LSTM model. Thus, the input/update gate’s activation vector i t can be expressed by,
i t = s i g m o i d ( W i x t + U i h t 1 ) .
Next, the new value is set for the cell input activation vector and it can be obtained as,
C t = t a n h ( W c x t + U c h t 1 ) ,
where C t is the new value of the cell state.
Moreover, the updated cell state C t can be expressed by,
C t = f t · C t 1 + i t · C t .
Next, at the output gate, the sigmoid function is applied again. The output gate’s activation vector o t can be defined as
o t = s i g m o i d ( W o x t + U o h t 1 ) ,
Then, the output vector of the LSTM unit h t obtained from C t is passed through the tanh function as
h t = o t · t a n h ( C t ) .

Appendix E. Gated Recurrent Unit

A GRU is also a NN developed after the LSTM model. The structure of the GRU is similar to that of the LSTM but with the cell state removed [16,44]. Moreover, the working principle of the GRU model is similar to the LSTM model, from the x t and h t 1 inputs to the reset gate. The reset gate vector r t is expressed as
r t = s i g m o i d ( W r · [ h t 1 , x t ] ) ,
where W r is the weight matrix; h t 1 is the previous hidden layer vector; and x t is the input vector.
At the update gate, the values x t and h t 1 are used to determine which values should be stored or added, defined by:
z t = s i g m o i d ( W u · [ h t 1 , x t ] ) ,
where z t is the updated gate vector and W u is the parameter matrix.
After passing to the reset gate, the candidate activation vector h t can be obtained as follows:
h t = t a n h ( W h · [ r t × h t 1 , x t ] ) ,
where W h is the weight matrix.
Consequently, the output of the GRU model is calculated as,
h t = ( I u t ) × h t 1 + u t × h t ,
where I represents the identity matrix and u t is the weight matrix.

Appendix F. Bidirectional Long Short-Term Memory and Bidirectional Gated Recurrent Unit

Usually, BiLSTM and BiGRU processes have a direction called forward sequence, but in a bidirectional way. The bidirectional way increases the processing direction within the NN, also known as the backward sequence [17,35,41,42,45]; it is defined by
h t = ( I u t × h t 1 ) + u t × h t , h t = ( I u t × h t 1 ) + u t × h t , h t = h t h t ,
where ⊕ is the concatenation operator; h t is the result of the forward sequence; h t is the result of the backward sequence; h t represents the result of the forward–backward sequence; ht−1 is the result of the previous step; u t is the weight matrix; I represents the identity matrix.

Appendix G. Convolution Neural Network Long Short-Term Memory

A hybrid model between CNN and LSTM is called CNN-LSTM. The input data passes through the convolution layer and then to the pooling layer of the CNN model. Next, the output of the CNN model goes to the LSTM and the dense layer, respectively [46]. The CNN-LSTM model is defined as,
y i = h p o o l = M A X ( s 1 , s 2 , , s n n h + 1 ) , h t = L S T M ( y i , h t 1 ) ,
where y i is the result of the CNN model; h t is the CNN-LSTM processed result; h t 1 is the previously processed result; and s n h + 1 is the result of the convolution layer.

Appendix H. Convolution Neural Network Bidirectional Long Short-Term Memory

A hybrid model between CNN and BiLSTM, known as CNN-BiLSTM, is similar to the CNN-LSTM model. It only increases the input direction of the LSTM to be bidirectional [47]. Its working process can be expressed as
y i = h p o o l = M A X ( s 1 , s 2 , , s n h + 1 ) , h t = LSTM ( y i , h t 1 ) , h t = LSTM ( y i , h t 1 ) , h t = LSTM ( y i , h t 1 ) LSTM ( y i , h t 1 ) ,
where y i is the result of the CNN model; LSTM represents the forward-operated gated recurrent unit; LSTM is operated backward; h t is the CNN-BiLSTM processed result; h t 1 represents the result at the previous step; and s n h + 1 is the result of the convolution layer.

Appendix I. Convolution Neural Network Gated Recurrent Unit

The CNN-GRU model originates from the traditional CNN model consisting of the convolution layer, pooling layer, fully-connected layer, and output layer. The outputs of the CNN model are then used as inputs to the GRU. The GRU has an update gate and a reset gate to process the consequent output [43,48]. The working process of the CNN-GRU can be defined as,
y i = M A X ( s 1 , s 2 , . . . , s n h + 1 ) , h t = G R U ( y i , h t 1 ) ,
where y i is the CNN processed result; h t denotes the CNN-GRU processed result; h t 1 is the previously-processed result; and s n h + 1 is the result of the convolution layer.

Appendix J. Convolution Neural Network Bidirectional Gated Recurrent Unit

CNN-BiGRU model is added from the original CNN-GRU. Within the system, the values are transmitted by the feed-forward sequence method within the GRU network. However, in the BiGRU function, it will add one more value (i.e., the feed-reverse sequence). Then, the values obtained from both the feed-forward sequence and feed-reverse sequence are processed and sent to the output layer [17,45]. The CNN-BiGRU model can be defined as
y i = h p o o l = M A X ( s 1 , s 2 , , s n h + 1 ) , h t = GRU ( y i , h t 1 ) , h t = GRU ( y i , h t 1 ) , h t = GRU ( y i , h t 1 ) GRU ( y i , h t 1 ) ,
where y i is the CNN-processed result; GRU is the operated forward; GRU is the operated backward; h t represents the CNN-GRU-processed result; h t 1 is the result from previous step; and s n h + 1 represents the result of the convolution layer.

References

  1. Pinthurat, W.; Hredzak, B.; Konstantinou, G.; Fletcher, J. Techniques for compensation of unbalanced conditions in LV distribution networks with integrated renewable generation: An overview. Electr. Power Syst. Res. 2023, 214, 108932. [Google Scholar] [CrossRef]
  2. Wynn, S.L.L.; Boonraksa, T.; Boonraksa, P.; Pinthurat, W.; Marungsri, B. Decentralized Energy Management System in Microgrid Considering Uncertainty and Demand Response. Electronics 2023, 12, 237. [Google Scholar] [CrossRef]
  3. McCulloch, W.S.; Pitts, W. A logical calculus of the ideas immanent in nervous activity. Bull. Math. Biophys. 1943, 5, 115–133. [Google Scholar] [CrossRef]
  4. Rumelhart, G.; Hinton, R. Williams, Learning representations by back-propagating errors. Nature 1986, 323, 533–536. [Google Scholar] [CrossRef]
  5. Jürgen, S. First Very Deep Learning with Unsupervised Pre-Training. Available online: https://people.idsia.ch/~juergen/very-deep-learning-1991.html (accessed on 12 June 2022).
  6. Hochreiter, S.; Schmidhuber, J. Long short-term memory. Neural Comput. 1997, 9, 1735–1780. [Google Scholar] [CrossRef]
  7. Cho, K.; Van Merriënboer, B.; Bahdanau, D.; Bengio, Y. On the properties of neural machine translation: Encoder-decoder approaches. arXiv 2014, arXiv:1409.1259. [Google Scholar]
  8. Graves, A.; Schmidhuber, J. Framewise phoneme classification with bidirectional LSTM and other neural network architectures. Neural Netw. 2005, 18, 602–610. [Google Scholar] [CrossRef] [PubMed]
  9. Fukushima, K.; Miyake, S. Neocognitron: A self-organizing neural network model for a mechanism of visual pattern recognition. In Competition and Cooperation in Neural Nets; Springer: Berlin/Heidelberg, Germany, 1982; pp. 267–285. [Google Scholar]
  10. El Haj, Y.; Milman, R.; Kaplan, I.; Ashasi-Sorkhabi, A. Hybrid Algorithm Based on Machine Learning and Deep Learning to Identify Ceramic Insulators and Detect Physical Damages. In Proceedings of the 2021 IEEE Conference on Electrical Insulation and Dielectric Phenomena (CEIDP), Vancouver, BC, Canada, 12–15 December 2021; pp. 235–238. [Google Scholar]
  11. Long, G.; Mu, H.; Li, Y.; Zhang, D.; Ding, N.; Zhang, G. Fault Identification Technology of Series Arc Based on Deep Learning Algorithm. In Proceedings of the 2020 IEEE International Conference on High Voltage Engineering and Application (ICHVE), Beijing, China, 6–10 September 2020; pp. 1–4. [Google Scholar]
  12. Ali, M.; Mujeeb, A.; Ullah, H.; Zeb, S. Reactive Power Optimization Using Feed Forward Neural Deep Reinforcement Learning Method: (Deep Reinforcement Learning DQN algorithm). In Proceedings of the 2020 Asia Energy and Electrical Engineering Symposium (AEEES), Chengdu, China, 28–31 May 2020; pp. 497–501. [Google Scholar]
  13. Yan, Z.; Xu, Y. Real-Time Optimal Power Flow: A Lagrangian Based Deep Reinforcement Learning Approach. IEEE Trans. Power Syst. 2020, 35, 3270–3273. [Google Scholar] [CrossRef]
  14. Abdel-Basset, M.; Hawash, H.; Chakrabortty, R.K.; Ryan, M. PV-Net: An innovative deep learning approach for efficient forecasting of short-term photovoltaic energy production. J. Clean. Prod. 2021, 303, 127037. [Google Scholar] [CrossRef]
  15. Yan, J.; Hu, L.; Zhen, Z.; Wang, F.; Qiu, G.; Li, Y.; Yao, L.; Shafie-khah, M.; Catal ao, J.P. Frequency-domain decomposition and deep learning based solar PV power ultra-short-term forecasting model. IEEE Trans. Ind. Appl. 2021, 57, 3282–3295. [Google Scholar] [CrossRef]
  16. Nana, H.; Lei, D.; Lijie, W.; Ying, H.; Zhongjian, D.; Bo, W. Short-term Wind Speed Prediction Based on CNN_GRU Model. In Proceedings of the 2019 Chinese Control And Decision Conference (CCDC), Nanchang, China, 3–5 June 2019; pp. 2243–2247. [Google Scholar]
  17. Gao, Z.; Li, Z.; Luo, J.; Li, X. Short Text Aspect-Based Sentiment Analysis Based on CNN+ BiGRU. Appl. Sci. 2022, 12, 2707. [Google Scholar] [CrossRef]
  18. Khashei, M.; Bijari, M. An artificial neural network (p, d, q) model for timeseries forecasting. Expert Syst. Appl. 2010, 37, 479–489. [Google Scholar] [CrossRef]
  19. Cui, C.; He, M.; Di, F.; Lu, Y.; Dai, Y.; Lv, F. Research on Power Load Forecasting Method Based on LSTM Model. In Proceedings of the 2020 IEEE 5th Information Technology and Mechatronics Engineering Conference (ITOEC), Chongqing, China, 12–14 June 2020; pp. 1657–1660. [Google Scholar]
  20. Islam, M.R.; Al Mamun, A.; Sohel, M.; Hossain, M.L.; Uddin, M.M. LSTM-Based Electrical Load Forecasting for Chattogram City of Bangladesh. In Proceedings of the 2020 International Conference on Emerging Smart Computing and Informatics (ESCI), Pune, India, 12–14 March 2020; pp. 188–192. [Google Scholar]
  21. Yahya, M.A.; Hadi, S.P.; Putranto, L.M. Short-Term Electric Load Forecasting Using Recurrent Neural Network (Study Case of Load Forecasting in Central Java and Special Region of Yogyakarta). In Proceedings of the 2018 4th International Conference on Science and Technology (ICST), Yogyakarta, Indonesia, 7–8 August 2018; pp. 1–6. [Google Scholar]
  22. Bui, V.; Nguyen, V.H.; Pham, T.L.; Kim, J.; Jang, Y.M. RNN-based Deep Learning for One-hour ahead Load Forecasting. In Proceedings of the 2020 International Conference on Artificial Intelligence in Information and Communication (ICAIIC), Fukuoka, Japan, 19–21 February 2020; pp. 587–589. [Google Scholar]
  23. Yin, X.; Liu, C.; Fang, X. Sentiment analysis based on BiGRU information enhancement. Proc. J. Phys. Conf. Ser. 2021, 1748, 032054. [Google Scholar] [CrossRef]
  24. Zhang, D.; Tian, L.; Hong, M.; Han, F.; Ren, Y.; Chen, Y. Combining Convolution Neural Network and Bidirectional Gated Recurrent Unit for Sentence Semantic Classification. IEEE Access 2018, 6, 73750–73759. [Google Scholar] [CrossRef]
  25. Xiuyun, G.; Ying, W.; Yang, G.; Chengzhi, S.; Wen, X.; Yimiao, Y. Short-term Load Forecasting Model of GRU Network Based on Deep Learning Framework. In Proceedings of the 2018 2nd IEEE Conference on Energy Internet and Energy System Integration (EI2), Beijing, China, 20–22 October 2018; pp. 1–4. [Google Scholar]
  26. Kumar, S.; Hussain, L.; Banarjee, S.; Reza, M. Energy Load Forecasting using Deep Learning Approach-LSTM and GRU in Spark Cluster. In Proceedings of the 2018 Fifth International Conference on Emerging Applications of Information Technology (EAIT), Kolkata, India, 12–13 January 2018; pp. 1–4. [Google Scholar]
  27. Luo, S.; Rao, Y.; Chen, J.; Wang, H.; Wang, Z. Short-Term Load Forecasting Model of Distribution Transformer Based on CNN and LSTM. In Proceedings of the 2020 IEEE International Conference on High Voltage Engineering and Application (ICHVE), Beijing, China, 6–10 September 2020; pp. 1–4. [Google Scholar]
  28. Sun, T.; Huang, D.; Yu, J. Market Making Strategy Optimization via Deep Reinforcement Learning. IEEE Access 2022, 10, 9085–9093. [Google Scholar] [CrossRef]
  29. Waseem, M.; Lin, Z.; Yang, L. Data-driven load forecasting of air conditioners for demand response using levenberg–marquardt algorithm-based ANN. Big Data Cogn. Comput. 2019, 3, 36. [Google Scholar] [CrossRef] [Green Version]
  30. Ohene, E.; Chan, A.P.; Darko, A. Review of global research advances towards net-zero emissions buildings. Energy Build. 2022, 266, 112142. [Google Scholar] [CrossRef]
  31. Pinthurat, W.; Hredzak, B. Distributed Control Strategy of Single-Phase Battery Systems for Compensation of Unbalanced Active Powers in a Three-Phase Four-Wire Microgrid. Energies 2021, 14, 8287. [Google Scholar] [CrossRef]
  32. Coşgun, A.E.; Demir, H. The experimental study of dust effect on solar panel efficiency. Politek. Derg. 2022, 25, 1429–1434. [Google Scholar] [CrossRef]
  33. Dhanraj, J.A.; Mostafaeipour, A.; Velmurugan, K.; Techato, K.; Chaurasiya, P.K.; Solomon, J.M.; Gopalan, A.; Phoungthong, K. An effective evaluation on fault detection in solar panels. Energies 2021, 14, 7770. [Google Scholar] [CrossRef]
  34. Gosumbonggot, J.; Fujita, G. Global maximum power point tracking under shading condition and hotspot detection algorithms for photovoltaic systems. Energies 2019, 12, 882. [Google Scholar] [CrossRef] [Green Version]
  35. Dawan, P.; Sriprapha, K.; Kittisontirak, S.; Boonraksa, T.; Junhuathon, N.; Titiroongruang, W.; Niemcharoen, S. Comparison of power output forecasting on the photovoltaic system using adaptive neuro-fuzzy inference systems and particle swarm optimization-artificial neural network model. Energies 2020, 13, 351. [Google Scholar] [CrossRef] [Green Version]
  36. Jeong, H.S.; Choi, J.; Lee, H.H.; Jo, H.S. A study on the power generation prediction model considering environmental characteristics of Floating Photovoltaic System. Appl. Sci. 2020, 10, 4526. [Google Scholar] [CrossRef]
  37. Li, G.; Xie, S.; Wang, B.; Xin, J.; Li, Y.; Du, S. Photovoltaic Power Forecasting with a hybrid deep learning approach. IEEE Access 2020, 8, 175871–175880. [Google Scholar] [CrossRef]
  38. Wang, K.; Qi, X.; Liu, H. A comparison of day-ahead photovoltaic power forecasting models based on deep learning neural network. Appl. Energy 2019, 251, 113315. [Google Scholar] [CrossRef]
  39. Dairi, A.; Harrou, F.; Sun, Y.; Khadraoui, S. Short-term forecasting of photovoltaic solar power production using variational auto-encoder driven deep learning approac. Appl. Energy 2020, 10, 23. [Google Scholar]
  40. Kuo, W.C.; Chen, C.H.; Hua, S.H.; Wang, C.C. Assessment of different deep learning methods of power generation forecasting for solar PV system. Appl. Energy 2022, 12, 7529. [Google Scholar] [CrossRef]
  41. Afaq, S.; Rao, S. Significance of epochs on training a neural network. Int. J. Sci. Technol. Res. 2020, 9, 485–488. [Google Scholar]
  42. Hameed, Z.; Shapoval, S.; Garcia-Zapirain, B.; Zorilla, A.M. Sentiment analysis using an ensemble approach of BiGRU model: A case study of AMIS tweets. In Proceedings of the 2020 IEEE International Symposium on Signal Processing and Information Technology (ISSPIT), Louisville, KY, USA, 9–11 December 2020; pp. 1–5. [Google Scholar]
  43. Skansi, S. Introduction to Deep Learning: From lOgical Calculus to Artificial Intelligence; Springer: Berlin/Heidelberg, Germany, 2018. [Google Scholar]
  44. Lewis, N. Deep Time Series Forecasting with Python; Create Space Independent Publishing Platform: Scotts Valley, CA, USA, 2016. [Google Scholar]
  45. Shi, H.; Wang, L.; Scherer, R.; Woźniak, M.; Zhang, P.; Wei, W. Short-Term Load Forecasting Based on Adabelief Optimized Temporal Convolutional Network and Gated Recurrent Unit Hybrid Neural Network. IEEE Access 2021, 9, 66965–66981. [Google Scholar] [CrossRef]
  46. Rafi, S.H.; Nahid-Al-Masood; Deeba, S.R.; Hossain, E. A Short-Term Load Forecasting Method Using Integrated CNN and LSTM Network. IEEE Access 2021, 9, 32436–32448. [Google Scholar] [CrossRef]
  47. Wu, K.; Wu, J.; Feng, L.; Yang, B.; Liang, R.; Yang, S.; Zhao, R. An attention-based CNN-LSTM-BiLSTM model for short-term electric load forecasting in integrated energy system. Int. Trans. Electr. Energy Syst. 2021, 31, e12637. [Google Scholar] [CrossRef]
  48. Sajjad, M.; Khan, Z.A.; Ullah, A.; Hussain, T.; Ullah, W.; Lee, M.Y.; Baik, S.W. A Novel CNN-GRU-Based Hybrid Approach for Short-Term Residential Load Forecasting. IEEE Access 2020, 8, 143759–143768. [Google Scholar] [CrossRef]
Figure 1. The installation site of the 1.5 MWp floating PV power plant is located at 111 University Road, Suranaree, Mueang Nakhon Ratchasima District, Nakhon Ratchasima Province, Thailand, with a population of 30,000. The selected location has a tropical wet and dry or savanna climate type. Because the plant is located in a tropical area, it has great solar potential.
Energies 16 02119 g001
Figure 2. Training and testing dataset. In our work, four types of input data directly affecting PV power generation were used for training and testing the deep learning models; (a) PV power generation data; (b) solar irradiance data; (c) PV module temperature data; (d) wind speed data.
Energies 16 02119 g002aEnergies 16 02119 g002b
Figure 3. Flow chart for implementation of the proposed deep learning models.
Energies 16 02119 g003
Figure 4. The training and validation losses of the BiLSTM model (single model).
Energies 16 02119 g004
Figure 5. The training and validation losses of the CNN-BiLSTM model (the hybrid model).
Energies 16 02119 g005
Figure 6. One-day PV generation forecasting on a regular weather day obtained by a single model and compared with actual PV generation data. The inset figure shows the forecasting performance of the single model between 12 and 16 h. In the single deep learning model, the most preferable model for the short-term prediction of the PV power generation on a regular weather day is the GRU model.
Energies 16 02119 g006
Figure 7. One-day PV generation forecasting on a regular weather day obtained by the hybrid model and compared with actual PV generation data. The inset figure shows the forecasting performance of the hybrid model between 12 and 16 h. In the hybrid deep learning model, the most preferable model for short-term prediction of the PV power generation on a regular weather day is CNN-BiGRU model.
Energies 16 02119 g007
Figure 8. Performance comparison of the single model with one-day PV generation data on a regular weather day.
Energies 16 02119 g008
Figure 9. One-day PV generation forecasting on a cloudy weather day obtained by a single model and compared with actual PV generation data. The inset figure shows the forecasting performance of the single model between 12 and 16 h. In the single deep learning model, the most preferable model for short-term prediction of PV power generation on a cloudy weather day is the LSTM model.
Energies 16 02119 g009
Figure 10. One-day PV generation forecasting on a cloudy weather day obtained by the hybrid model and compared with actual PV generation data. The inset figure shows the forecasting performance of the hybrid model between 12 and 16 h. In the hybrid deep learning model, the most preferable model for the short-term prediction of the PV power generation on a cloudy weather day is CNN-BiGRU model.
Energies 16 02119 g010
Figure 11. Performance comparison of the single model with one-day PV generation data on a cloudy weather day.
Energies 16 02119 g011
Figure 12. One-week PV generation forecasting obtained by a single model and compared with actual PV generation data. The left inset of the figure shows the forecasting performance of the hybrid model during constant PV generation, while the left inset figure illustrates the forecasting performance during highly fluctuated PV generation. In the single deep learning model, the most preferable model for short-term prediction of PV power generation on a cloudy weather day is BiLSTM model.
Energies 16 02119 g012
Figure 13. One-week PV generation forecasting obtained by the hybrid model and compared with actual PV generation data. The left inset figure show the forecasting performance of the hybrid model during constant PV generation, while the left inset of the figure illustrates the forecasting performance in highly fluctuated PV generation. In the hybrid deep learning model, the most preferable model for the short-term prediction of PV power generation on a cloudy weather day is CNN-BiGRU model.
Energies 16 02119 g013
Figure 14. Performance comparison of the single model with one-week PV generation data.
Energies 16 02119 g014
Table 1. Comparison with existing works.
ReferenceTechniqueInput DataShort Summary
[36]NNPV module temperature, slope irradiation, water temperature, temperature, solar irradiation, wind speed, and wind directionThis paper proposes verifying environmental factors affecting the power generation of a floating PV system, and presents a power generation prediction model considering environmental factors by using regression analysis and neural networks.
[37]CNN-LSTMSeasonal PV power generationHybrid model of CNN-LSTM was applied for power generation forecasting. Actual PV capacity data from Limburg, Belgium, were used to test the predictive accuracy of the model.
[38]NN, LSTM, and CNN-LSTMAverage phase current, wind speed, temperature, humidity, solar irradiation, and PV power generationThe work examined the effectiveness of CNN, LSTM, and the hybrid model by using data from terrestrial PV power plants. Moreover, the input sequence learning effect of the deep learning model was studied.
[39]RNN, LSTM, BiLSTM, GRU, and CNN-LSTMPV power generationThe performance of the traditional forecasting method and deep learning techniques of RNN, LSTM, BiLSTM, GRU, and CNN-LSTM models in the forecasting were compared.
[40]ANN, LSTM, and GRUTemperature, humidity, wind speed, wind direction, rainfall, and air pressureANN, LSTM, and GRU models were presented for forecasting PV power generation. It was concluded that the LSTM model was the most accurate model when considering weekly and monthly forecasts.
Our workRNN, CNN, LSTM, BiLSTM, GRU, BiGRU, CNN-LSTM, CNN-BiLSTM, CNN-GRU, and CNN-BiGRUPV power generation, solar irradiance, PV module temperature and wind speedIn our study, the performances of several recent deep learning techniques, classified as the single model and hybrid model, were studied and investigated. Different types of input data variables that directly caused PV generation were used for training and testing the deep learning model. A real site of a 1.5 MWp PV floating power plant was selected as the case study. area.
Table 2. Installation details of the floating PV power plant.
Inv. No.PV ModuleRated Power (W)TypePV String No.Total DC Power (kWp)
1JKM535M-72HL4-BDVP535Bi-Facial25187.25
2JKM535M-72HL4-BDVP535Bi-Facial25187.25
3JKM540M-72HL4-V540Mono-Facial25189
4JKM540M-72HL4-V540Mono-Facial25189
5JKM540M-72HL4-V540Mono-Facial25189
6JKM540M-72HL4-V540Mono-Facial25189
7JKM540M-72HL4-V540Mono-Facial25189
8JKM540M-72HL4-V540Mono-Facial25189
Total installation (MWp) 1.509
Table 3. Set up parameters for implementations.
ModelParameterValue
RNNNumber of RNN layers3 = (50, 100, 100)
Number of neural layers2 = (1, 256)
Activation function s i g m o i d
Dropout0.1
OptimizerAdam
LossMean Absolute Error
CNNConvolution 1-D layer128
Pooling layer1
Max pooling3
Activation function s i g m o i d
Dropout0.1
OptimizerAdam
LossMean Absolute Error
LSTM, GRU, BiLSTMNumber of FC-layers3 = (50, 100, 100)
& BiGRUNumber of neural layers2 = (1, 256)
Activation function s i g m o i d
Dropout0.1
OptimizerAdam
LossMean Absolute Error
CNN-LSTM, CNN-GRUConvolution 1-D layer128
CNN-BiLSTM & CNN-BiGRUNumber of FC-layers3 = (50, 100, 100)
Number of neural layers2 = (1, 256)
Pooling layer1
Max pooling3
Activation function s i g m o i d
Dropout0.1
OptimizerAdam
LossMean Absolute Error
Table 4. MAE, MAPE, and RMSE values for one-day PV generation forecasting on a regular weather day.
ModelMAE (kW)MAPE (%)RMSE (kW)
RNN41.8812.6077.29
CNN121.5033.74171.95
LSTM37.1710.1975.68
GRU28.348.3267.53
BiLSTM32.869.9768.29
BiGRU45.9114.0674.68
CNN-LSTM32.9710.0671.53
CNN-GRU39.8411.9571.85
CNN-BiLSTM38.5511.1170.65
CNN-BiGRU32.169.0772.56
Table 5. MAE, MAPE, and RMSE values of one-day PV generation forecasting on a cloudy weather day.
ModelMAE (kW)MAPE (%)RMSE (kW)
RNN74.2324.0594.81
CNN82.8023.77115.34
LSTM36.4411.1970.24
GRU51.9613.1087.47
BiLSTM38.0710.0576.39
BiGRU51.4614.4880.18
CNN-LSTM40.9111.1180.99
CNN-GRU36.0010.1873.74
CNN-BiLSTM35.3710.7570.78
CNN-BiGRU29.898.3772.53
Table 6. MAE, MAPE, and RMSE values of one-week PV generation forecasting.
ModelMAE (kW)MAPE (%)RMSE (kW)
RNN67.2323.25119.81
CNN191.6262.43250.35
LSTM43.2413.70109.47
GRU50.1715.34112.99
BiLSTM34.6710.5675.06
BiGRU54.3018.38112.74
CNN-LSTM48.4114.2182.92
CNN-GRU48.3015.27111.31
CNN-BiLSTM45.9715.7572.08
CNN-BiGRU49.5117.06110.64
Table 7. A summary of the performances of the proposed deep earning models for the three case studies.
Case Study Most Accurate and Preferable Model
Case Study ASingle modelGRU
Hybrid modelCNN-BiGRU
Case Study BSingle modelLSTM
Hybrid modelCNN-BiGRU
Case Study CSingle modelBiLSTM
Hybrid modelCNN-BiGRU
Table 8. A summary of the advantages and disadvantages of the proposed deep learning models.
ModelAdvantagesDisadvantages
RNNUseful for time-series predictionComputationally intensive
CNNSupervision from humans is unnecessarySlower because of operations, e.g., max pooling
LSTMWorks well over a broad range of parameters, e.g., learning rateNot suitable for online learning tasks
GRUStructure is simpler than LSTM but has a comparable performanceLower performance than LSTM if training with the large dataset
BiLSTMDeeper than LSTM in updating weightsTends to be over-fitting if the training time is long
BiGRUDeeper in updating weights with comparable training times with GRUTends to be over-fitting
CNN-LSTMSuitable time-series and batch dataTraining time is longer than the single model
CNN-GRUHigh computational efficiency and easy to modifyStructure is more complex
CNN-BiLSTMAllows extracting the maximum amount of information from the datasetTends to be over-fitting if the training time is long, and is more suitable for opinion analysis
CNN-BiGRUHigher accuracy in updating weightings compared to BiGRURequires a long time for the raining process
Disclaimer/Publisher’s Note: The statements, opinions and data contained in all publications are solely those of the individual author(s) and contributor(s) and not of MDPI and/or the editor(s). MDPI and/or the editor(s) disclaim responsibility for any injury to people or property resulting from any ideas, methods, instructions or products referred to in the content.

