Article

Distribution Network Reconfiguration Based on Hybrid Golden Flower Algorithm for Smart Cities Evolution

by
Dhivya Swaminathan
1,
Arul Rajagopalan
1,*,
Oscar Danilo Montoya
2,
Savitha Arul
3 and
Luis Fernando Grisales-Noreña
4,*
1
School of Electrical Engineering, Vellore Institute of Technology, Chennai 600127, Tamil Nadu, India
2
Grupo de Compatibilidad e Interferencia Electromagnética (GCEM), Facultad de Ingeniería, Universidad Distrital Francisco José de Caldas, Bogotá 110231, Colombia
3
Department of Electrical and Electronics Engineering, Rajalakshmi Engineering College, Chennai 602105, Tamil Nadu, India
4
Department of Electrical Engineering, Faculty of Engineering, Universidad de Talca, Curicó 3340000, Chile
*
Authors to whom correspondence should be addressed.
Energies 2023, 16(5), 2454; https://doi.org/10.3390/en16052454
Submission received: 26 December 2022 / Revised: 27 February 2023 / Accepted: 2 March 2023 / Published: 4 March 2023
(This article belongs to the Special Issue Emerging Topics in Power Electronic Converters of Microgrids)

Abstract

:
Power losses (PL) are one of the most—if not the most—vital concerns in power distribution networks (DN). With respect to sustainability, distribution network reconfiguration (DNR) is an effective course of action to minimize power losses. However, the optimal DNR is usually a non-convex optimization process that necessitates the employment of powerful global optimization methods. This paper proposes a novel hybrid metaheuristic optimization (MO) method called the chaotic golden flower algorithm (CGFA) for PL minimization. As the name implies, the proposed method combines the golden search method with the flower pollination algorithm to multiply their benefits, guarantee the best solution, and reduce convergence time. The performance of the algorithm has been evaluated under different test systems, including the IEEE 33-bus, IEEE 69-bus, and IEEE 119-bus systems and the smart city (SC) network, each of which includes distributed-generation (DG) units and energy storage systems (ESS). In addition, the locations of tie-switches in the DN, which used to be considered as given information in previous studies, are assumed to be variable, and a branch-exchange adaption is included in the reconfiguration process. Furthermore, uncertainty analysis, such as bus and/or line fault conditions, are studied, and the performance of the proposed method is compared with other pioneering MO algorithms with minimal standard deviations ranging from 0.0012 to 0.0101. The case study of SC is considered and the obtained simulation results show the superiority of the algorithm in finding higher PL reduction under different scenarios, with the lowest standard deviations ranging from 0.012 to 0.0432.

1. Introduction

The three sides of a power system (PS) triangle’s distribution zone for power are extremely important today. It is composed of generation, transmission, and distribution because it is nearest to the end-user or customers. However, PL at the distribution stage is more effective due to the low voltage and high currents greater than 13% of the total power generation. Numerous solutions have been proposed to address this, such as distributed-flexible AC transmission (D-FACTS) devices installed in a distribution network (DN) [1], distributed-generation (DG) units [2] or capacitors [3], and distribution network reconfiguration (DNR) [4]. In this regard, DNR, considered to be the least expensive solution, is a process that entails changing the on and off states of switches at the various DNs regarding demand variations in such a way that the new configuration is more suitable and more efficient [5].
One of the more efficient operational options is to use DGs to deliver active and reactive power to the power network in order to maintain the voltage profile and lower the PL. However, the reconfigurations of the DN are a big challenge for obtaining the optimal results in minimizing the PL and maintaining the voltage profile. Radial DN are often composed of a normally open (NO) tie switch and a normally closed (NC) sectionalizing switch. Changing the status of these switches alters the network configuration if the network is radial. This can lead to a new configuration for the network and to a transfer of the demand among different feeders. The determination of the best configuration for the specific demand of the system at each feeder can be introduced as an optimization process, the so-called optimal reconfiguration.
On other hand, smart city (SC) development can be conceptualized as an incorporation of technical and social applications that highlight major aspects of today’s world community, such as mobility, smart health care, and smart PSs [6]. Smart cities in today’s global era include the collection of abundant data and the development of sophisticated techniques to utilize data gathered through various digital sensing devices. The sensors collect the data from various application devices using communication networks such as the Internet, which renders the whole SC network as an IoT-based reconfigurable network [7], as shown in Figure 1.
A proper plan, design, and advanced architecture are required for SC operation. Smart transportation system issues and information and communication technology (ICT) issues have been considered by many researchers. However, the application of the SC in real cases has been neglected. The adoption of ICT for smart traffic management has been discussed, while the idea of smart parking development using genetic algorithms (GAs) has been presented [8]. The impact of physical processes and environments while designing SC architecture has been analysed [9]. However, there are some constraints on physical structures that need to be addressed in the designing phase of the SC.
Meanwhile, in the development of advanced and social infrastructure, PSs have played a vital role and cannot be ignored in the SC revolution. In recent decades, the main sources of power have been based on fossil fuels, and almost every energy sector and every industry were dependent on them. However, with the rapid increase in demand, the concept of renewable energy systems was introduced, where the energy sector obtains power from different energy sources, such as batteries [10], photovoltaic (PV) systems [11], and wind [12]. The notion of microgrids, smart grids [13], and an energy internet have been introduced because of their better communication and control infrastructures, which are crucial for the growth of smart cities.
The intelligent design of power grids is only possible if the different factors that affect it and its important role in SC development are carefully analysed. If those factors are not considered during design, a smart PS might lead to economic and operational instability in SC. One possible solution to that problem is the use of hierarchical energy and control management based on microgrids [14]. The microgrid concept in SCs is illustrated in Figure 2. These scenarios make the design and control of SCs more complex, and if mismatches in communication occur, the whole SC infrastructure will be less reliable in the sense that power will not be delivered. For that scenario, a reconfigurable network is required, as discussed in this paper.
The rest of this paper is structured as follows. Section 2 incorporates some related works and Section 3 proceeds with problem formulation. Section 4 describes the proposed approach for computing the optimal reconfiguration in a power system. Section 5 illustrates the outcomes of the proposed methodology. Section 6 provides a conclusion and discusses future work.

2. Related Works

As there are copious possible switching combinations for a DN, each of which is modelled on a binary variable, a complex combinatorial optimization problem is presented [15]. In addition, the power flow equations are non-convex and have non-linear constraints. Hence, the entire optimization problem is a non-convex combinatorial problem. Therefore, establishing the optimal DNR necessitates applying global optimization methods to handle large-scale problems with non-convexities in the constraints. One of the best strategies for addressing non-convex problems, which are otherwise challenging with the use of other techniques, is the use of metaheuristic optimization (MO) algorithms [16]. These algorithms are usually easy to apply, do not need the objective function gradient, and often find a sufficient solution. However, the performance and convergence speed of these algorithms vary according to the size and the constraints of the problem. Therefore, finding the best algorithm for optimal reconfiguration has received considerable attention in PS research.
To resolve this problem, a variety of MO algorithms have been used, including genetic algorithms (GA) [17], the particle swarm optimization (PSO) algorithm [18], the ant colony optimization (ACO) algorithm [19], the butterfly optimizer algorithm [20], the gravitational search (GS) algorithm [21], the cuckoo search algorithm (CSA) [22], the artificial bee colony (ABC) algorithm [23], the teaching–learning-based optimization (TLBO) algorithm [24], and the flower pollination algorithm (FPA) [25]. The efficiency of these algorithms has been found to be low. The GA, the PSO, the ABC, and the FPA have efficiencies of 37.74%, 33.5%, 49.36%, and 31.12%, respectively, in achieving loss reduction, according to an analysis of the relevant literature. The lowest percentage, that of the FPA, is considered here for hybridization for the purpose of enhancing its efficiency.
The main drawback of these algorithms, in addition to their comparatively long simulation times, is that they cannot be guaranteed to locate the global optimum solution and, therefore, they may become trapped in a local optimum. This drawback can be increasingly significant when applied to large-scale problems with many variables and non-convex constraints [26]. To better understand the ideal DNR, multiple studies have mainly focused on optimizing the efficacy of various promising metaheuristic algorithms. In this regard, a modified PSO [27] has been proposed to solve the problem and demonstrated that the method converges to a solution like that of the PSO, but in fewer iterations. Other authors [28] have developed an enhanced GA, in which the crossover and mutation operators have been modified to solve the DNR problem. An enhanced GA can assist in the solution of the DNR problem by combining with a DG placement. Additionally, the improved harmony search algorithm (IHSA) [29] has been recommended to solve the DNR problem, as it helped to show that a regular harmony search algorithm (HSA) does not have satisfactory performance in addressing this problem. According to another study [30], a modified TLBO algorithm demonstrated the necessity of improving the original TLBO. A modified fireworks algorithm (MFA) was suggested, and the algorithm was contrasted with other algorithms to show the dominance of the combinatorial approach. A hybrid Fuzzy-FPA [31] has been devised, which showed that this combinatorial approach guarantees a solution that is almost universally applicable. Although improved versions of metaheuristic algorithms can improve the algorithms’ performances and solve the DNR problem, they still have some shortcomings, such as long convergence times and heavy computational burdens [32]. A comparison of these algorithms, based on merits and demerits, is provided in Table 1.
Recent studies have taken a step forward and focused on integrating optimization algorithms to build new hybrid algorithms [33] that benefit from the specific advantages of the individual algorithms and mitigate their inherent drawbacks. In this regard, authors [34] have developed a hybrid PSO–ACO algorithm and proved that the hybrid algorithm takes advantage of both algorithms and shows better performance than the individual algorithms. The integration of the PSO algorithm and the dragonfly algorithm (DA) has been proposed, in which the optimization problem has been broken down into two parts, each of which is sequentially solved by one of the algorithms. The PSO and GA algorithms [35] has been compared, and a performance evaluation has been developed. The results suggested that the PSO algorithm outperforms the individual algorithms and diminishes their inherent drawbacks. A combination of the PSO and GS algorithms [36] has been proposed, and the combined algorithm’s efficiency has been discussed. These integrated algorithms have usually shown better performance than the individual algorithms or the improved versions of the MO algorithms in solving the optimal DNR problem. They generally require lower iterations to converge and find a better solution in a lower simulation time. The literature includes various methods that significantly reduce PLs in DNs based on an optimal reconfiguration of DNs with DGs. The long convergence time, the complexity in implementation, and the high costs were the main drawbacks of the methods discussed in the literature review.
However, there is still a research gap in finding an algorithm that can solve the large-scale optimal reconfiguration problem, which has so many continuous and integer variables, in a reasonable time, such as in a smart city network. In this study, a novel hybrid algorithm called the chaotic golden-search-based flower algorithm (CGFA) is recommended. It involves the integration of the FPA and the golden search algorithm (GSA). In this integrated algorithm, the GSA efficiently reduces the interval using the golden search ratio in each interval, and the FPA searches the updated interval to come up with a solution. This means that the FPA explores the global search space and is determined by the GSA’s unimodal local search conditions. This helps the integrated algorithm to carry out deep searching with a lower convergence time. The main advantages of the CGFA over other algorithms are fast and guaranteed convergence and easy implementation. To determine how the CGFA performs, we compared it with widely used optimization algorithms, including the FPA and modified versions of the FPA, such as the chaos-enhanced FPA (CFPA) [37] and the golden-search-based FPA (GSFA) [38], and its superiority was thoroughly demonstrated.
In addition, this study went beyond consideration of the regular DNR, and a branch-exchange adaption was also included in considering the reconfiguration process. Adaptive tie-switch combinations incur marginal reductions in maintenance costs, due to ageing effects that could be economical. Tie-switches, which are in the DN, used to be considered given information in previous studies, are assumed to be variables in this study, so a thorough DNR process and re-designing are conducted simultaneously. This leads to a larger optimization problem that is more difficult to solve, indicating the effectiveness of the proposed algorithm. The proposed algorithm’s performance was evaluated under different test systems, including the IEEE 33-bus system [39], the IEEE 69-bus system [40], the IEEE 119-bus system [41], and the Indian 52-bus system [42] assigned to the smart city network, including DG units and energy storage systems (ESSs). In addition, further uncertainty analyses, such as bus analysis and/or line fault condition analysis, were also carried out.

3. Problem Formulation

After the exhaustive review of the literature, as discussed in the previous section, we introduced a novel method for minimizing power losses through reconfiguring the distribution network. The main idea was to use the CGFA and compute the optimal reconfiguration of the main feeder located within the radial distribution system (RDS) to reduce the power losses, in order to manage fair operation. The average power loss of the system was identified with the assistance of the forward–backward-sweep technique [43].

3.1. Objective Function

As a single objective, our primary aim was to reduce the power loss [44] of the system. This objective function is determined via Equation (1).
O B J F = M I N   ( P L o s s )
where,
  • P L o s s is the power loss and
  • O B J F is the objective function.
The brief mathematical notation of the power loss is represented in Equation (2).
P L o s s = I = 1 N B R R I × P I 2 + Q I 2 V I 2  
where,
  • N B R is the distribution network’s total number of branches,
  • V I 2 is the voltage magnitude at I th bus,
  • P I 2 is the active power load at I th bus,
  • Q I 2 is the reactive power load at I th bus, and
  • R I is the resistance of the I th branch, respectively.
The optimal reconfiguration of the distribution network is achieved with the proposed algorithm. In addition, all the constraints of the power system are detailed in the next section.

3.2. Power System Constraints

Power system limitations are connected to the PL’s goal function. These constraints should meet in the PS to maintain efficient power flow operation [45]. The primary constraints are formulated as follows:

3.2.1. Feeder Capacity Limits

In the PS, the branch current flow should be within the maximum limit, which is formulated in Equation (3):
0 I I I M A X , I ; I = 1 , . , N B R
where, I M A X , I is the maximum current flow in the PS with the branch details and I I can be defined as the current passing in the I th branch.

3.2.2. Bus Voltage Limits

In the PS, the bus voltages must follow within their maximum and minimum, as set out in Equation (4):
V M I N , I V I V M A X , I ; I = 1 , . , N B
where,
  • V M A X , I is the maximum voltage of the I th bus, and
  • V M I N , I is the minimum voltage of the I th bus, respectively.

3.2.3. Real and Reactive Power Balance

In the PS, real and reactive power should be within their limits, as set out in Equations (5) and (6):
P S L A C K + I = 1 N D G P D G , I = I = 1 N B P D , J + I = 1 N B R P L , K
Q S L A C K + I = 1 N D G Q D G , I = I = 1 N B Q D , J + I = 1 N B R Q L , K
where,
  • P L , K is the active PL in the K th branch,
  • Q L , K is the reactive PL in the K th branch,
  • P D , J is the real power load demand of the J th bus,
  • Q D , J is the reactive power load demand of the J th bus,
  • P D G , I is the real power output of the I th DG unit,
  • Q D G , I is the reactive power output of the I th DG unit,
  • P S L A C K is the real power provided from the slack bus,
  • Q S L A C K is the reactive power provided from the slack bus,
  • N B is the total number. of buses in the DN, and
  • N D G is the total number of DG units in the PS, respectively.

3.2.4. Radial Configuration Constraint

To minimize the fault level while saving energy to protect the device, the distribution network must be operated as a radial network. Thus, it is necessary to determine the configuration of the radial network when working on a reconfiguration problem, mainly for the distribution networks. The proposed approach is feasible for the radial configuration of power distribution networks. The proposed approach could not be applied to a meshed distribution system because negative short circuit consequences would result. The number of branches and tie switches could be fixed as set out in Equations (7) and (8).
N B r = ( N B 1 )
N T S = N L l o o p N L r a d i a l
where,
  • N T S is the total number of tie switches in the DN,
  • N L l o o p is the total number of lines in the loop network, and
  • N L r a d i a l is the total number of lines in the RDS.
The power network should provide clarity about radial configuration and supply complete loads after reconfiguration. The proposed system should meet the mentioned constraints set out in Equations (3)–(8) beforehand, while selecting the optimal tie-switch connections in a power system. The suggested algorithm calculates the best positions of feeders for reducing the power loss of the system. A detailed description of the proposed algorithm is presented in the next section.

4. Proposed Methodology

Using the CGFA, the problem of optimal reconfiguration is solved by identifying the innovative tie-switch connections that help in PL minimization. The FPA and the GSA with chaos were combined in the suggested algorithm. Notably, the chaotic GSA (CGSA) was used to make it possible for the FPA to operate effectively in the feeder allocation. The following section lists the properties of the FPA, the GSA, and the CGFA.

4.1. Flower Pollination Algorithm

In 2012, Xin-She Yang [46] developed the FPA method. It draws most of its principles from the pollination process in flowering plants. Undoubtedly, the FPA has helped to solve optimization problems. There are four main principles in FPA optimization:
Rule 1: Global pollination is noted to be a process of cross-pollination and biotic pollination. Based on levy flight operation, it moves away to carry pollinators.
Rule 2: Local pollination relies on abiotic and self-pollinating activities.
Rule 3: Insects/pollinators are considered to have flowers constancy that is equivalent to the probability of reproduction. The likelihood of reproduction is inversely correlated with the resemblance functions of the two flowers in question.
Rule 4: Based on the switch possibility, the global and local substituting or interaction of pollination should be controlled and biased lightly toward local pollination.
These four rules are modified into accurate updating computations when formulating the updating functions in the FPA. Pollinators that lick, such as insects, help in carrying flower pollen during the worldwide pollination process [47]. Additionally, the pollen can migrate because long-distance insects can move or fly a longer distance. Hence, the first rule is mathematically formulated as set out in Equation (9):
X I T + 1 = X I T + γ   L ( λ ) ( g * X I T )
where,
  • L ( λ ) is the levy flight step size, which is correlated with pollination strength,
  • γ is the scaling factor used to regulate step size,
  • g * is the current best solution,
  • X I T is the pollen I or solution vector, XI, at iteration T,
  • X I T + 1 is the pollen I or solution vector, XI, at iteration T + 1.
In the FPA, insects could fly and move in different-sized steps for a great distance. Levy flight is a moving scenario that is used to best simulate the movement feature. Therefore, L > 0 is regarded as a levy distribution, which could be expressed in Equation (10):
L ~ λ Γ ( λ ) s i n ( π λ 2 ) π 1 M 1 + λ , ( M M 0 > 0 )
where, the symbol for the common gamma function is Γ(λ), Additionally, this distribution function holds true for the lengthy process M > 0. In theory, this is necessary, but this value is thought to be as low as 0.1. Additionally, it avoids the pseudo-random step sizes that are an issue for this levy-distribution function (8). Various techniques are available to manage random numbers [47].
The local pollination can then be considered, collaborating with Rules 2 and 3 set out in Section 4.1. The local pollination can be mathematically determined via Equation (11).
X I T + 1 = X I T + ϵ ( X J T X K T )
where,
  • X J T and X K T are the various flowers of the same plant varieties, and
  • ϵ is the scaling factor for controlling the step size.
The pseudocode of the FPA is determined via Algorithm 1.
Algorithm 1: Pseudocode of the FPA
objective MIN function
initialize population
find the best solution
define a switch probability
while (t > max generation)
for I = 1 : N
      if random > p,
draw a step vector L using levy distribution
global pollination-based Equation (9)
or else
draw uniform distribution
local pollination-based Equation (11)
      end if
compute new solutions
if new solutions are best, carry out an updating process
end for
compute the current best solution
end while
output the best solution
In a limited neighbourhood, this pseudocode completely mimics flower constancy [48]. A similar population, which is also a local random walk with uniform distribution in [0, 1], might be used by the same species to make its selection. The GSA is used in the FPA to improve the local pollination process. Below is a detailed breakdown of the GSA information.

4.2. Golden Search Algorithm

This method is recommended for computing objective functions that are not subject to variation or that are difficult to distinguish. The golden section ratio is calculated via Equation (12).
C = 1 + 5 2
The main objective is to find the lowest possible F(X), X ϵ R, within the period [ l , u ] . Two boundaries’ points X 1 , X 2   ϵ   [ l , u ] can be computed via Equations (13) and (14):
X 1 = C l + ( 1 C ) u
X 2 = C l + C u
where,
  • X 1 and X 2 are boundaries at unimodal optimization curve,
The lower and upper constraints for the interval points are denoted by l and u, and
  • C is a golden ratio.
The objective function is evaluated at these two points as functions f ( X 1 )   and   f ( X 2 ) , respectively. If f ( X 1 ) < f ( X 2 ) , then the optimal variants are related to [ l , u ] . Otherwise, the most advantageous options relate to [ X 1 , u ] . This process should be repeated until one of the termination conditions is fulfilled. The search sections [ X 1 , u ] and [ l , u ] in each iteration must be determined [49]. After that, the successive iterations are reliant on the selection procedure. The initial iteration of the GSA is computing the minor point within the interval [ l , u ] . Several rounds are used to determine the convergence rate. Therefore, the performance of the convergence progress is improved by using the golden-search-based technique along with tent chaos mapping. Additionally, it is used in the process of improving local search results. The following subsection discusses the suggested algorithm’s detailed process.

4.3. Hybrid Golden Flower Pollination Algorithm

The hybrid algorithm is a grouping of the FPA and the GSA with tent chaotic mapping [50]. In the FPA, the local pollination process is enhanced with the help of the golden-section ratio. A poor optimization strategy that causes stagnation and traps local optima, together with premature convergence, may lead to the worst balance between exploitation and exploration. The GSFA is created to enhance global convergence and prevent traps on a local solution of the FPA. The local pollination of the FPA is improved in the suggested algorithm and is expressed similarly to Equation (11). However, instead of randomly determining the scaling factor ϵ , it can be considered as dependent on the value of X 1 and X 2 , respectively. The scale factor affects the generation of a new source, which is a black-box operation. Updating the scale factor and creating solutions that are tied to a specific likelihood are the major goals. The scale factor is the best option for picking better options. The local search of the FPA is optimally processed with a new scaling factor in the suggested algorithm to obtain the best performance. The technique proceeds and finally generates two intermediate points, which are presented as set out in Equation (15).
ϵ 1 = l l u C ; ϵ 2 = u + l u C  
The GSA is used to choose the scaling factor in the best possible way. Figure 3 depicts the overall procedure of the CGFA algorithm.
The FPA is processed with local and global pollination. The golden-search strategy, which expedites convergence, enhances local pollination by maximizing the scaling factor. We tested this CGFA with mathematical test functions. Its results were proven to be fine. Here, the proposed algorithm CGFA is developed to optimally allocating tie switches in the PS to reduce active PL. With the objective function of PL minimization considered, the best power network reconfigurations were identified.
The proposed algorithm provides the best reconfiguration in the PS by minimizing the PL. The credibility of consumers on the PS is also enabled to consider the proposed algorithm through the distribution system’s optimal reconfiguration.
The process starts by reading the data of the test bus system, including the data of the lines and buses. Shortly after, the CGFA solves problems associated with load flow using the forward and backward sweep technique and calculates the PL. Then, the optimum configurations are calculated based on the CGFA by minimizing the PL, as the main goal. It then examines the satisfaction of the constraints. If some conflicts arise with the constraints, the process will be repeated. Otherwise, the optimum configuration results are saved and the process stops. The performance parameters are investigated and shown in the next section.

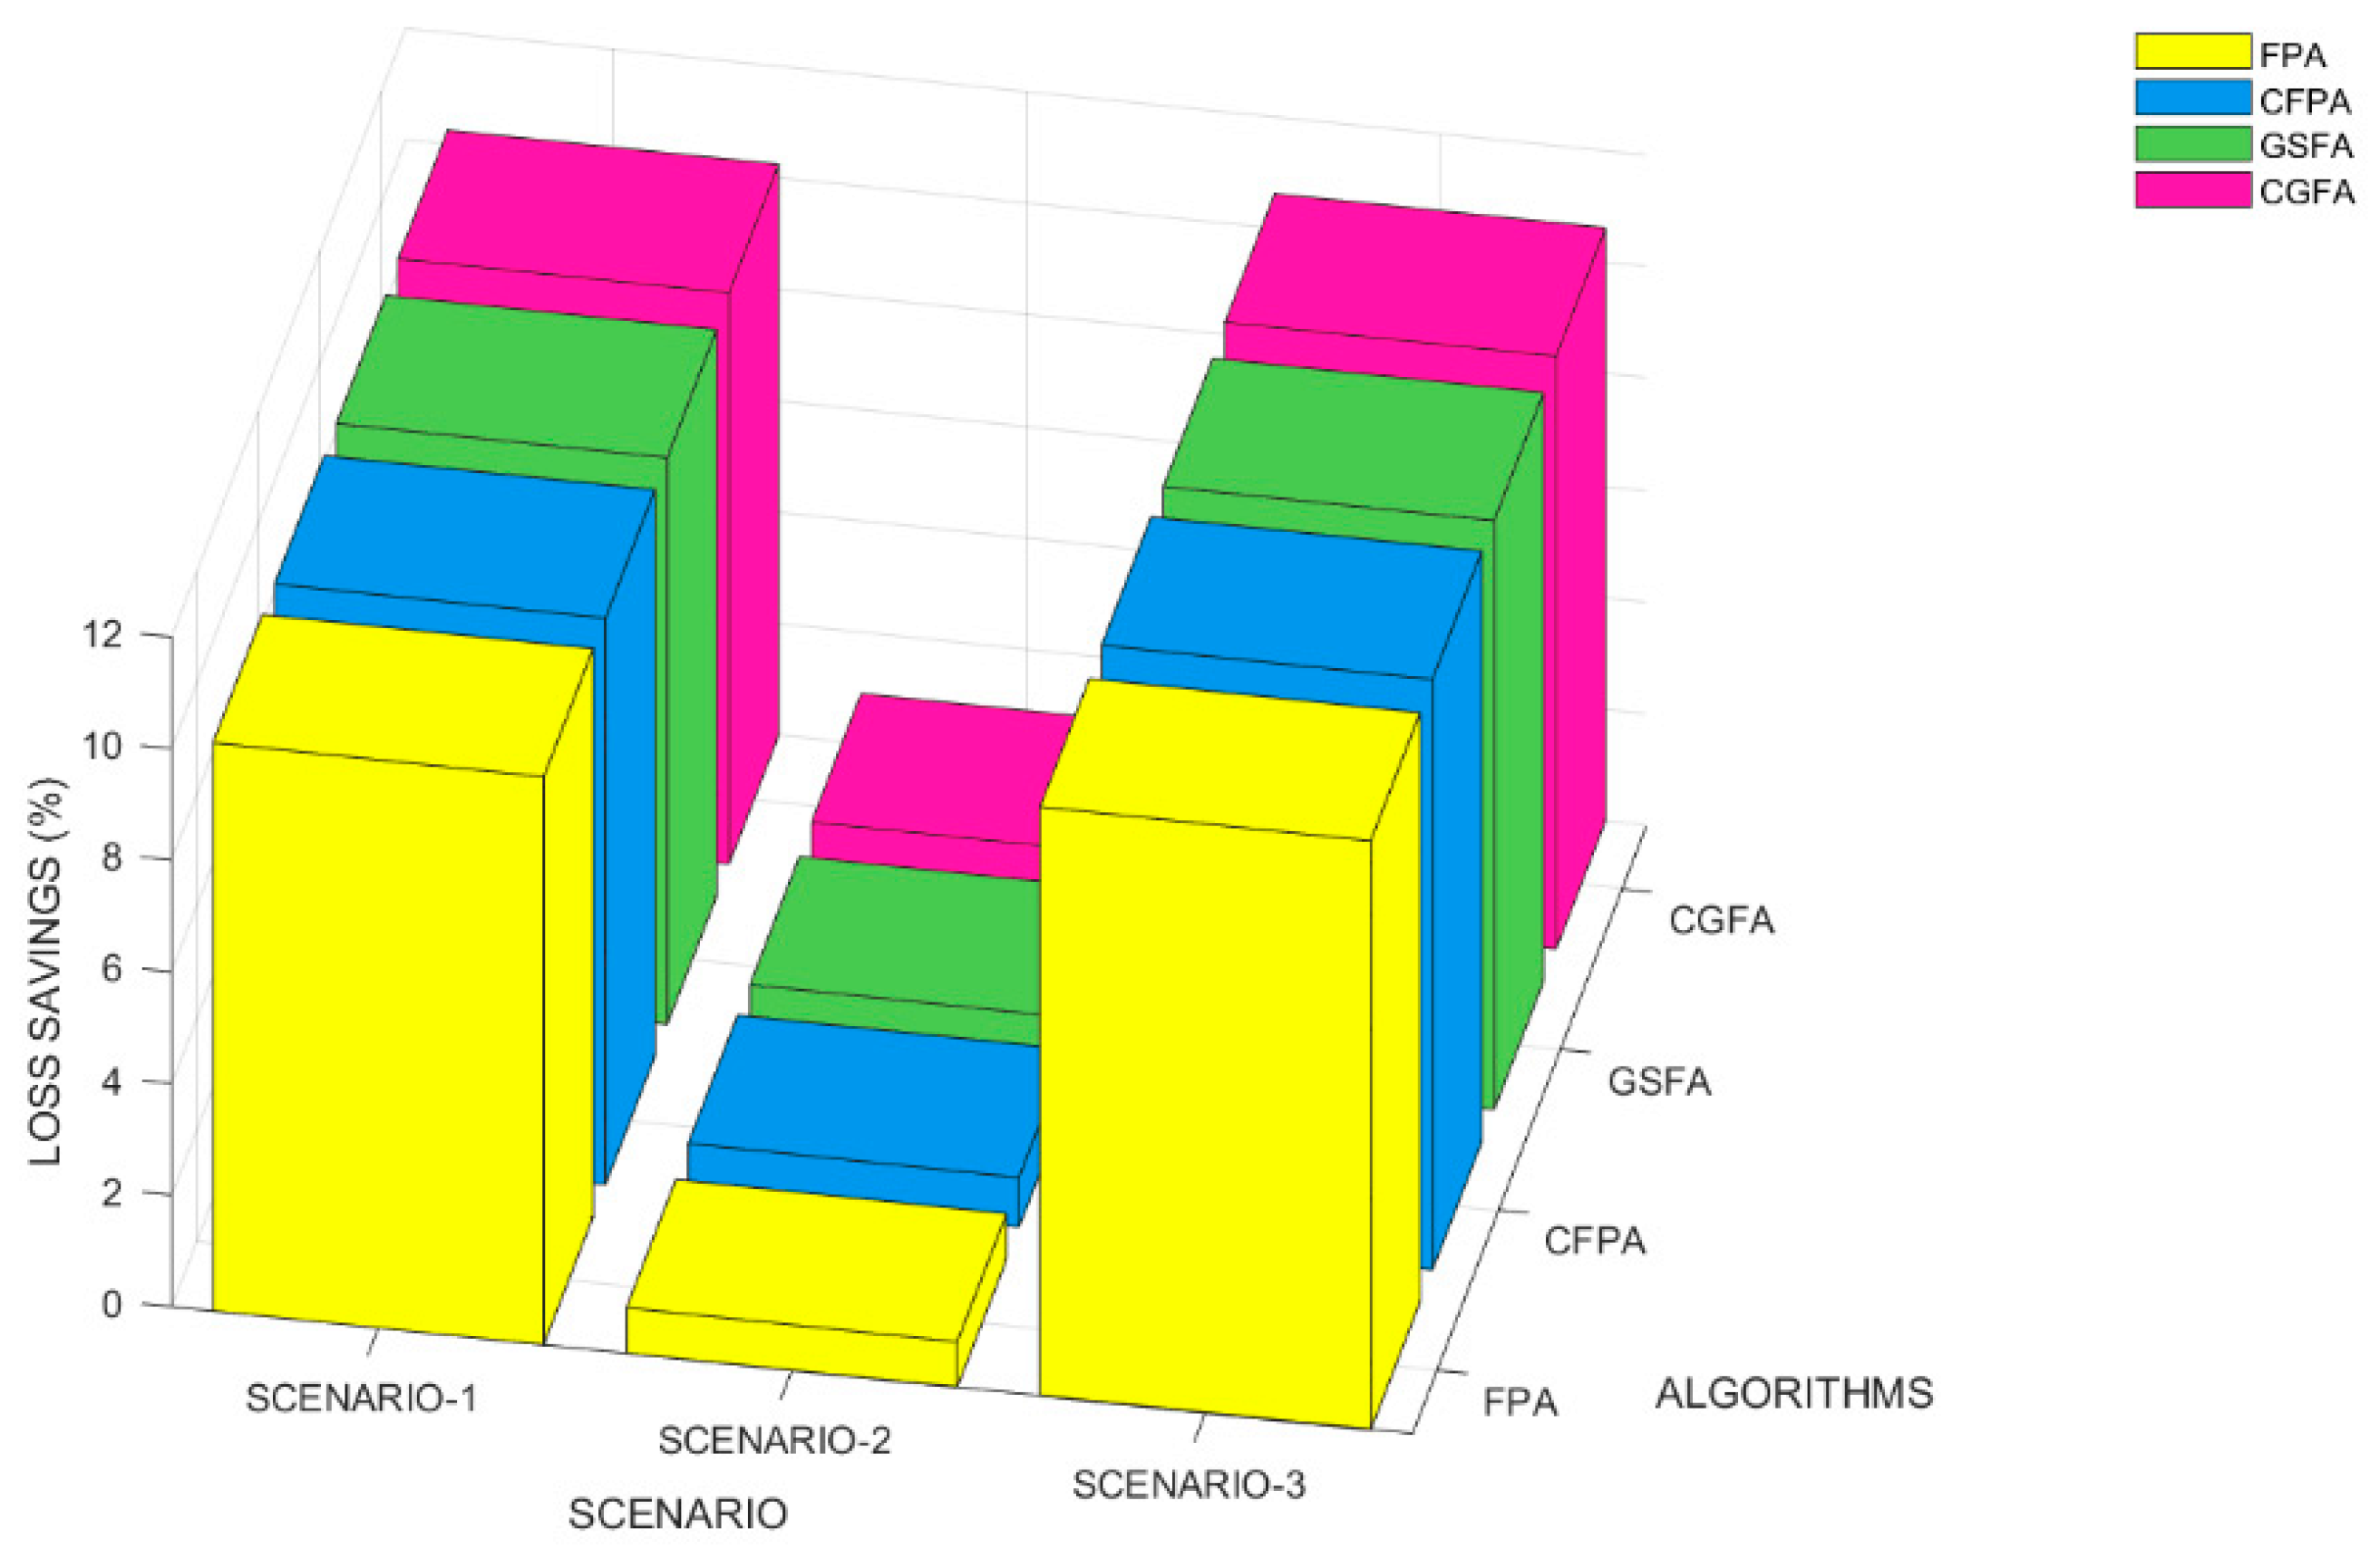
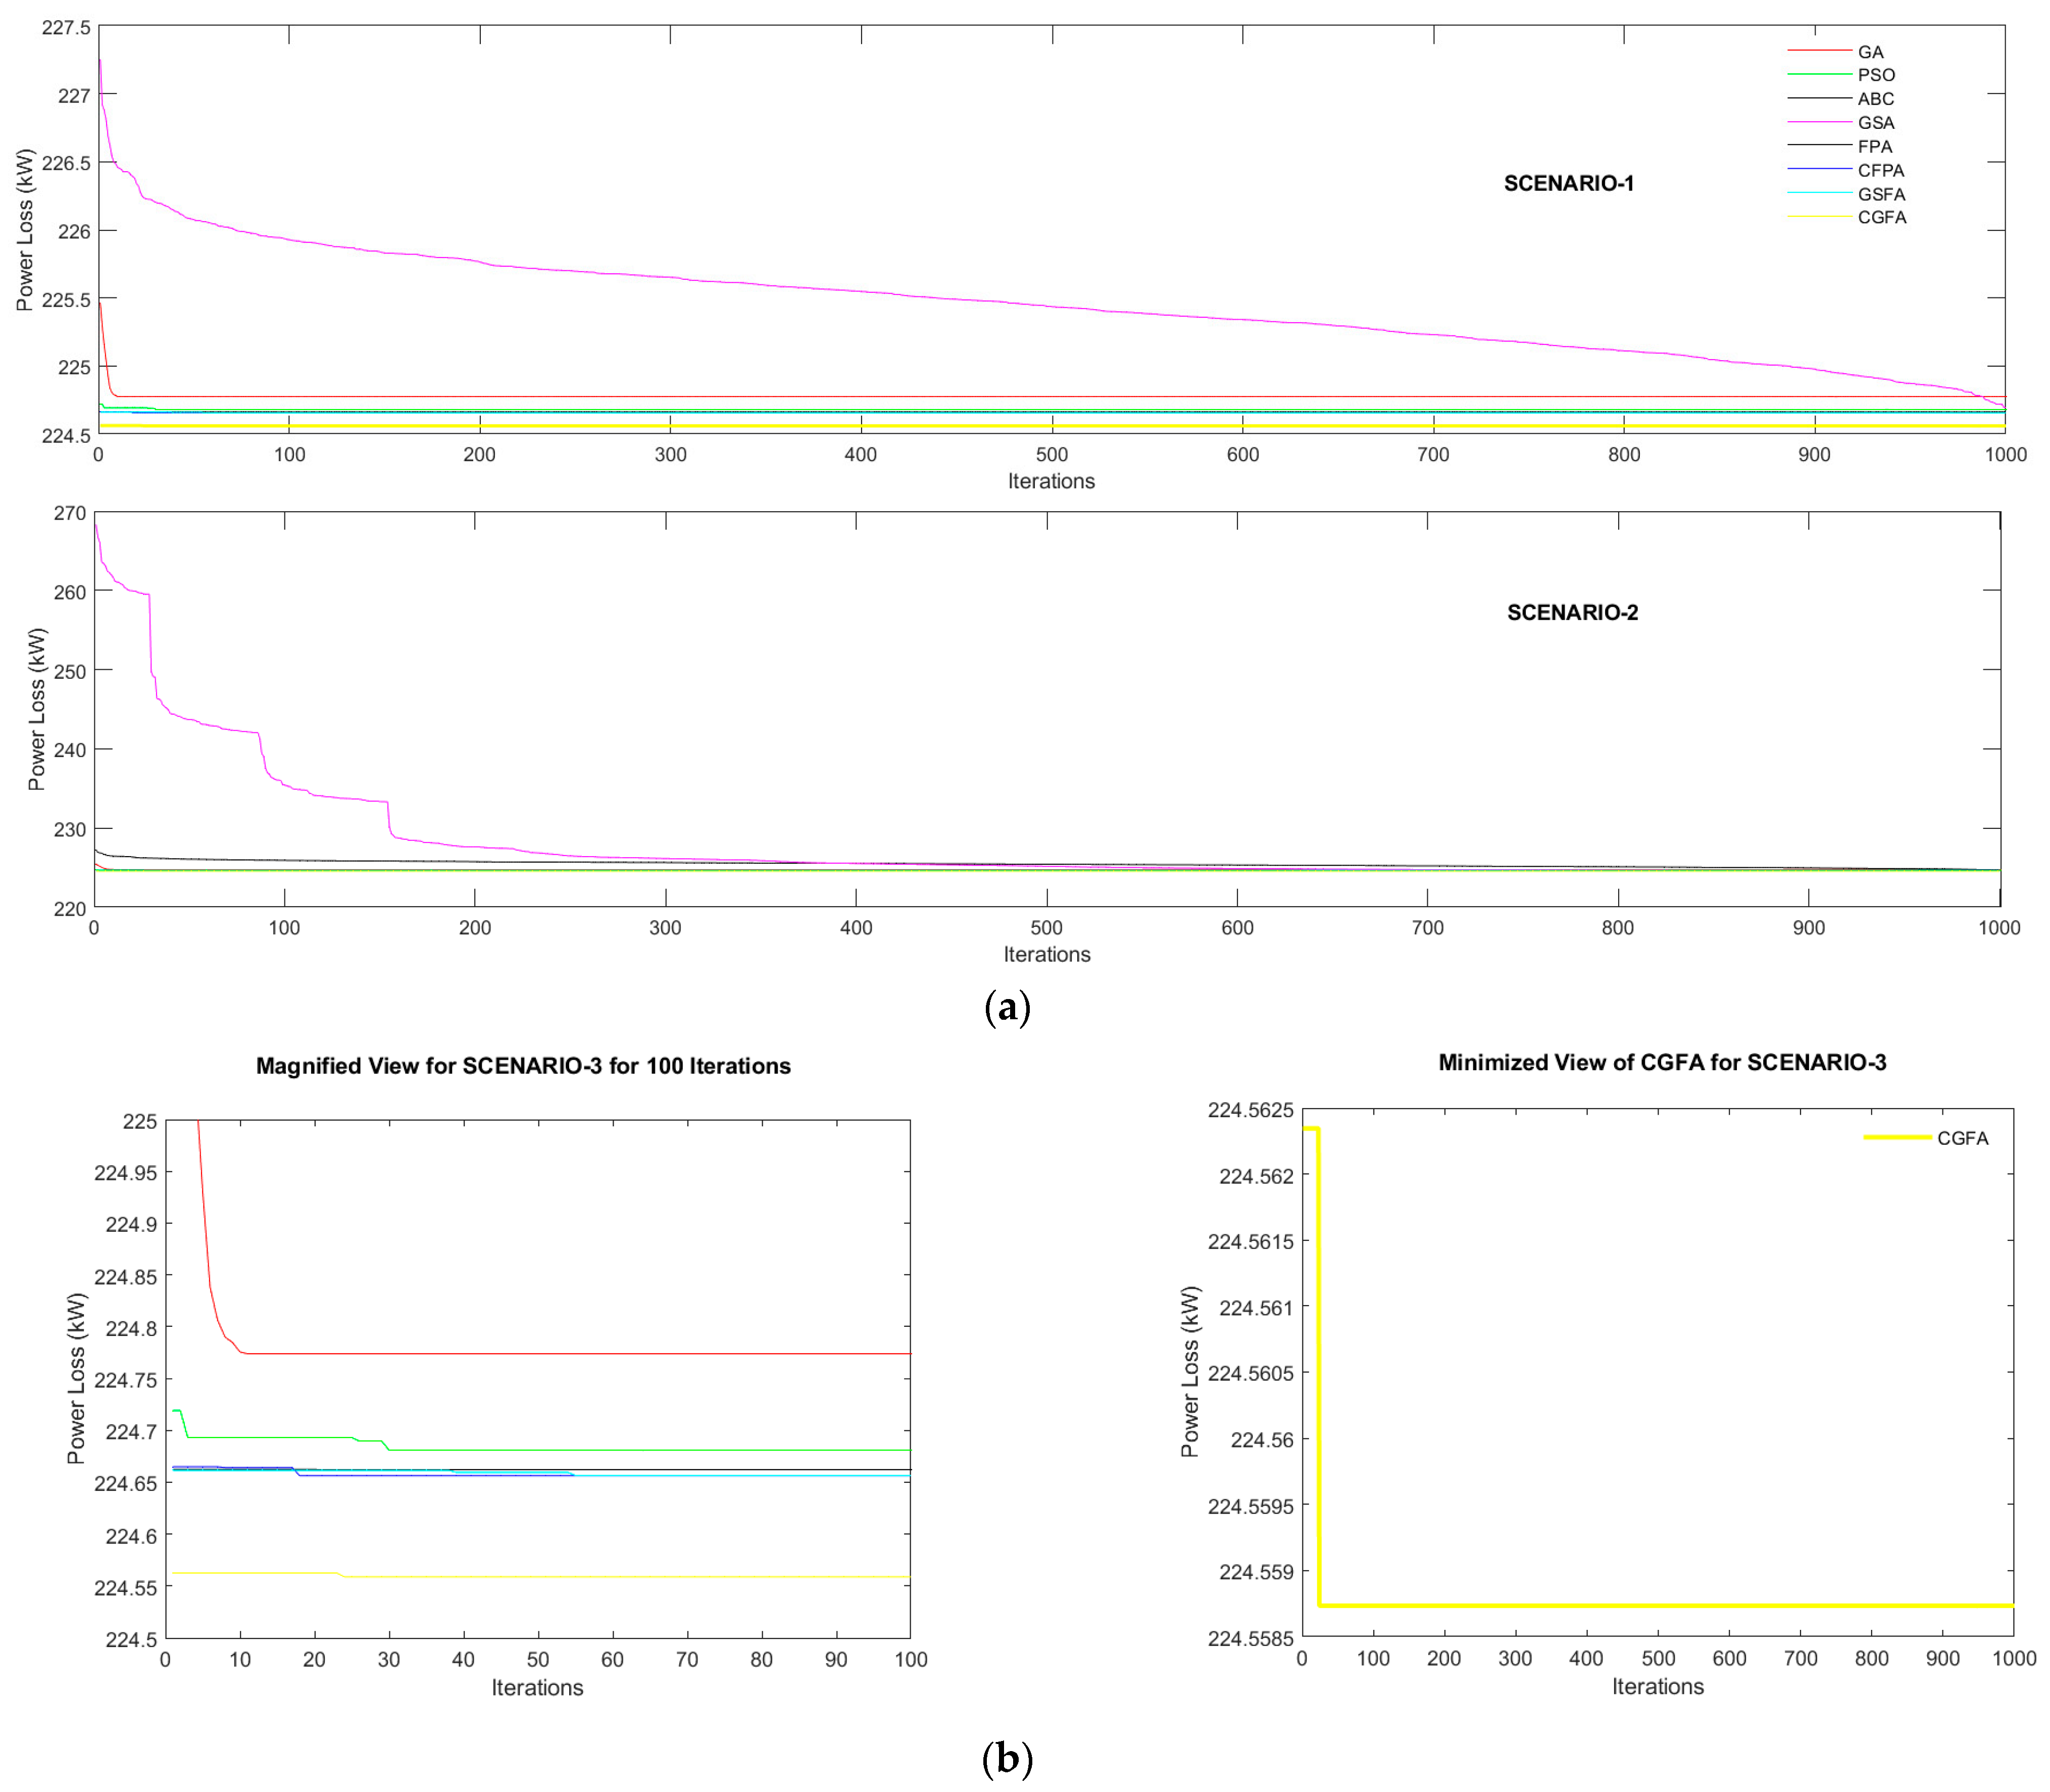
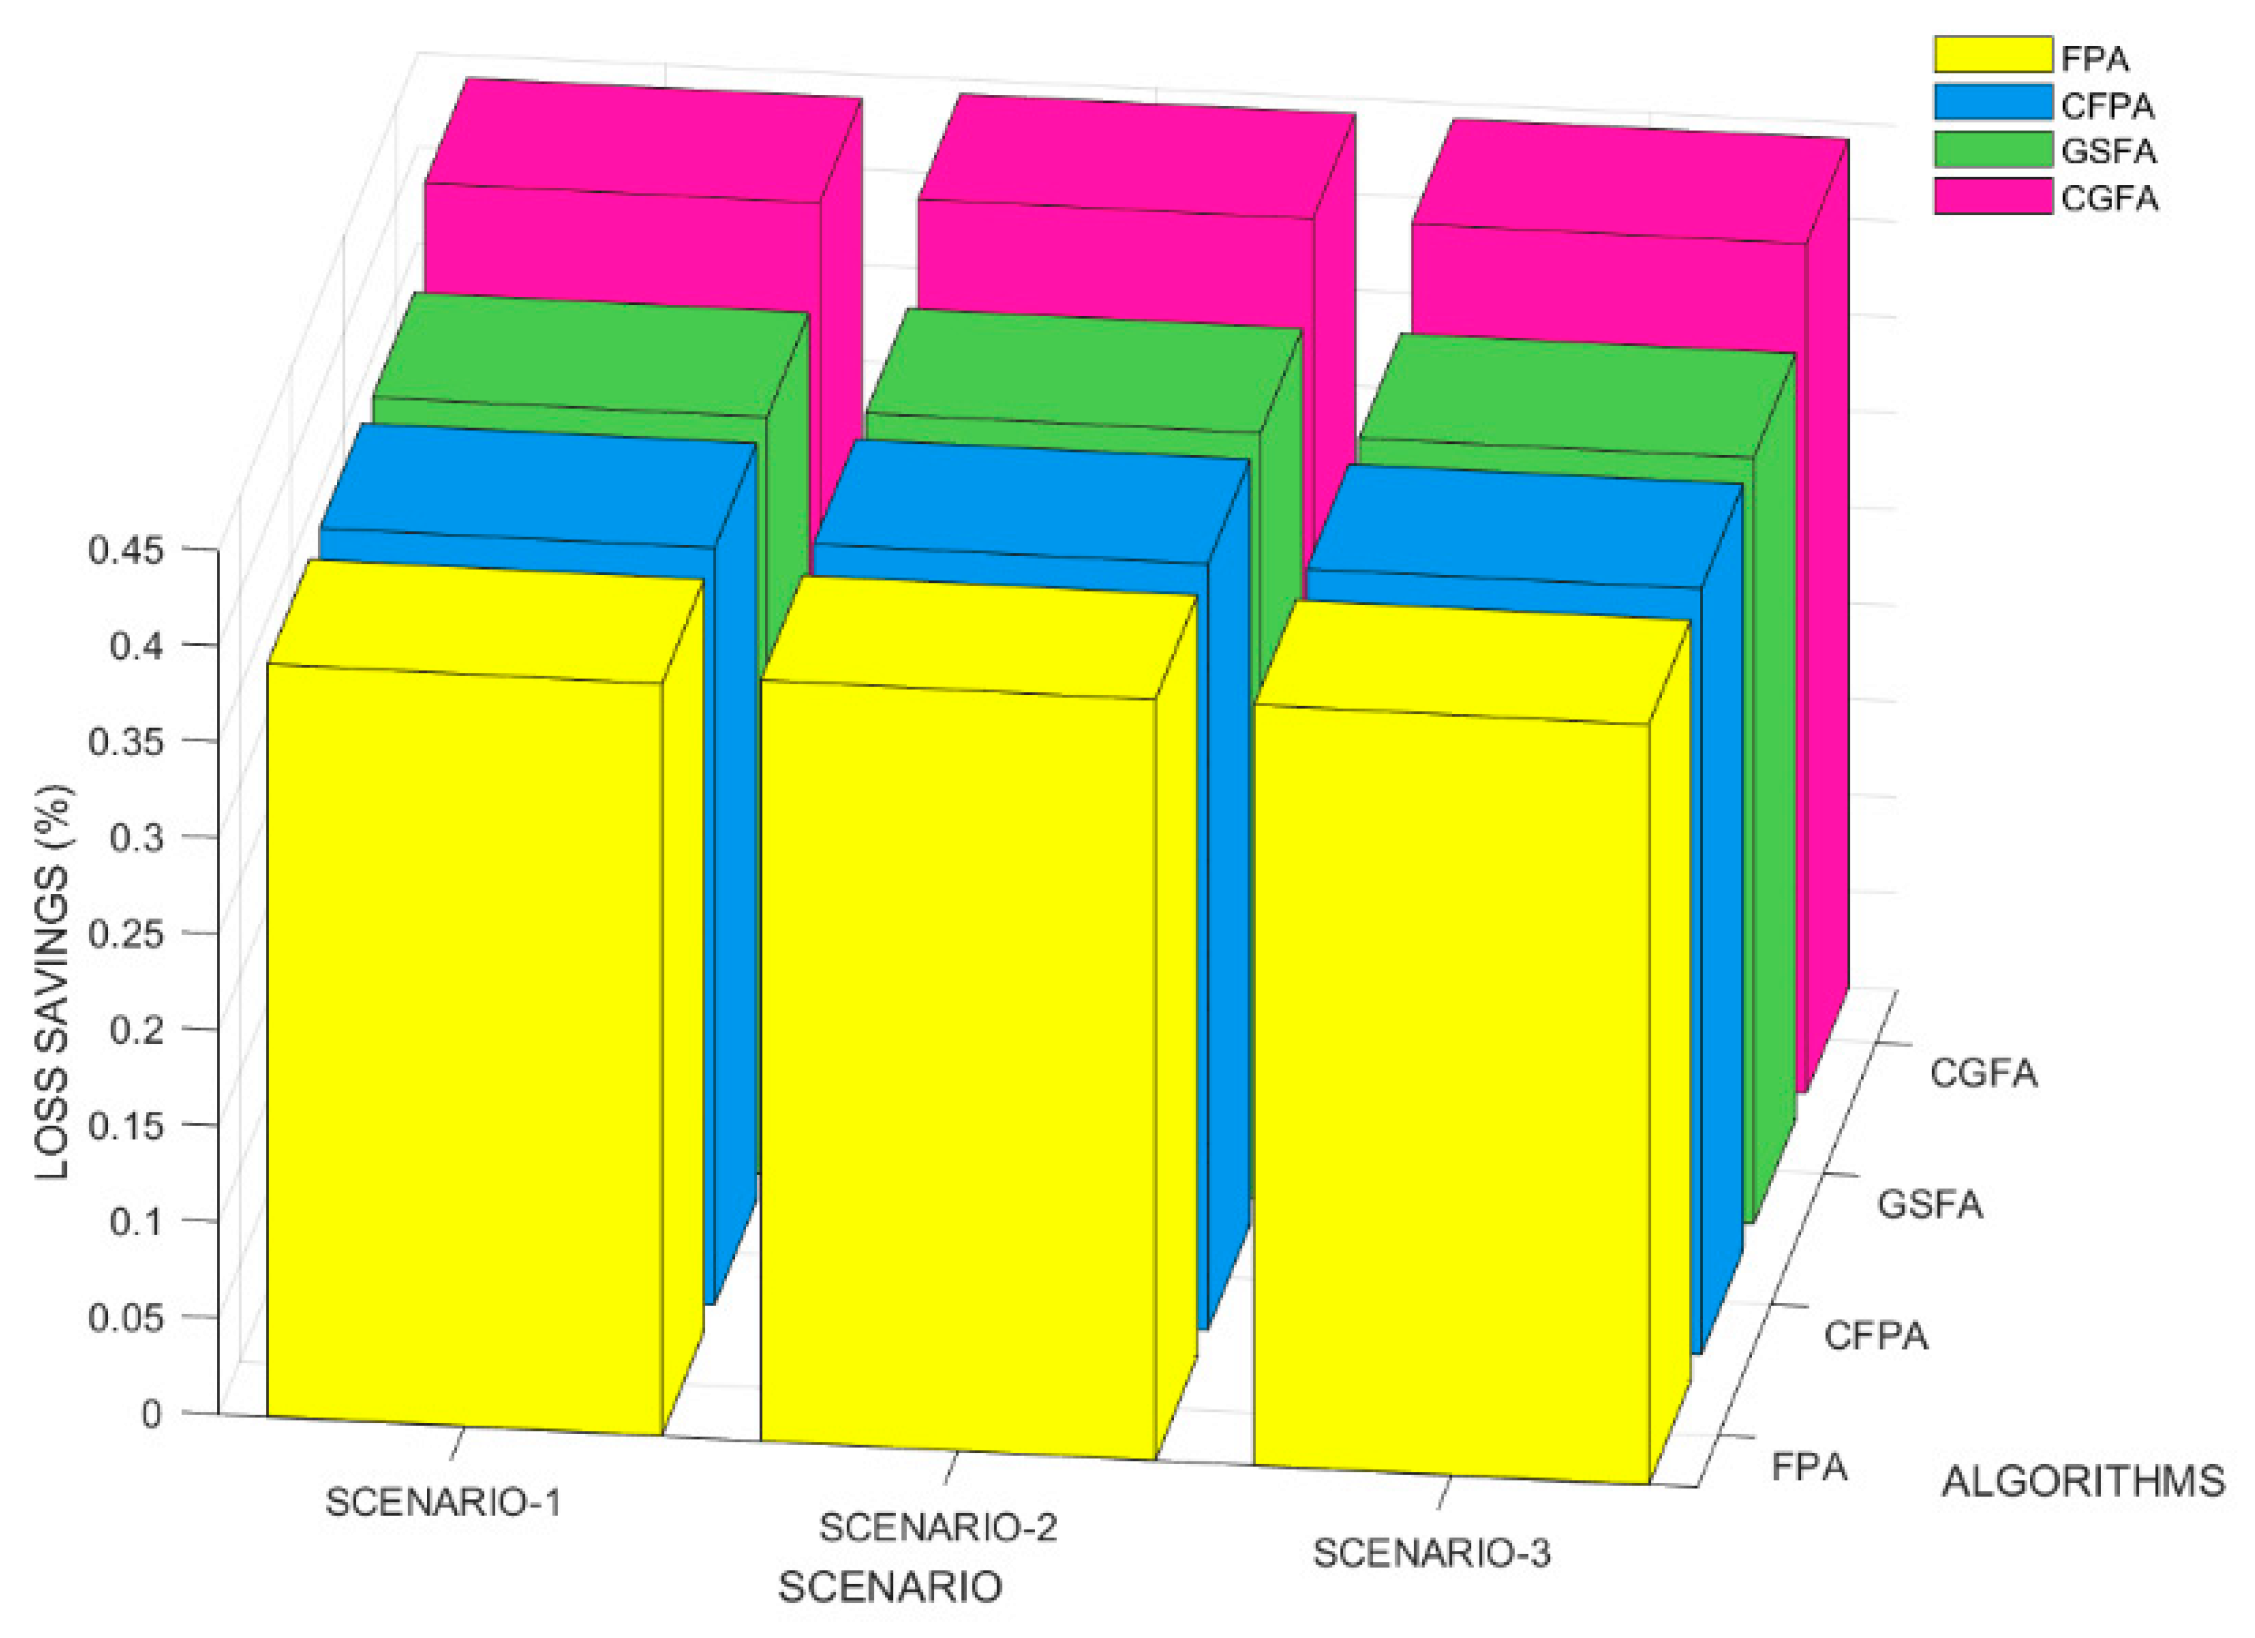
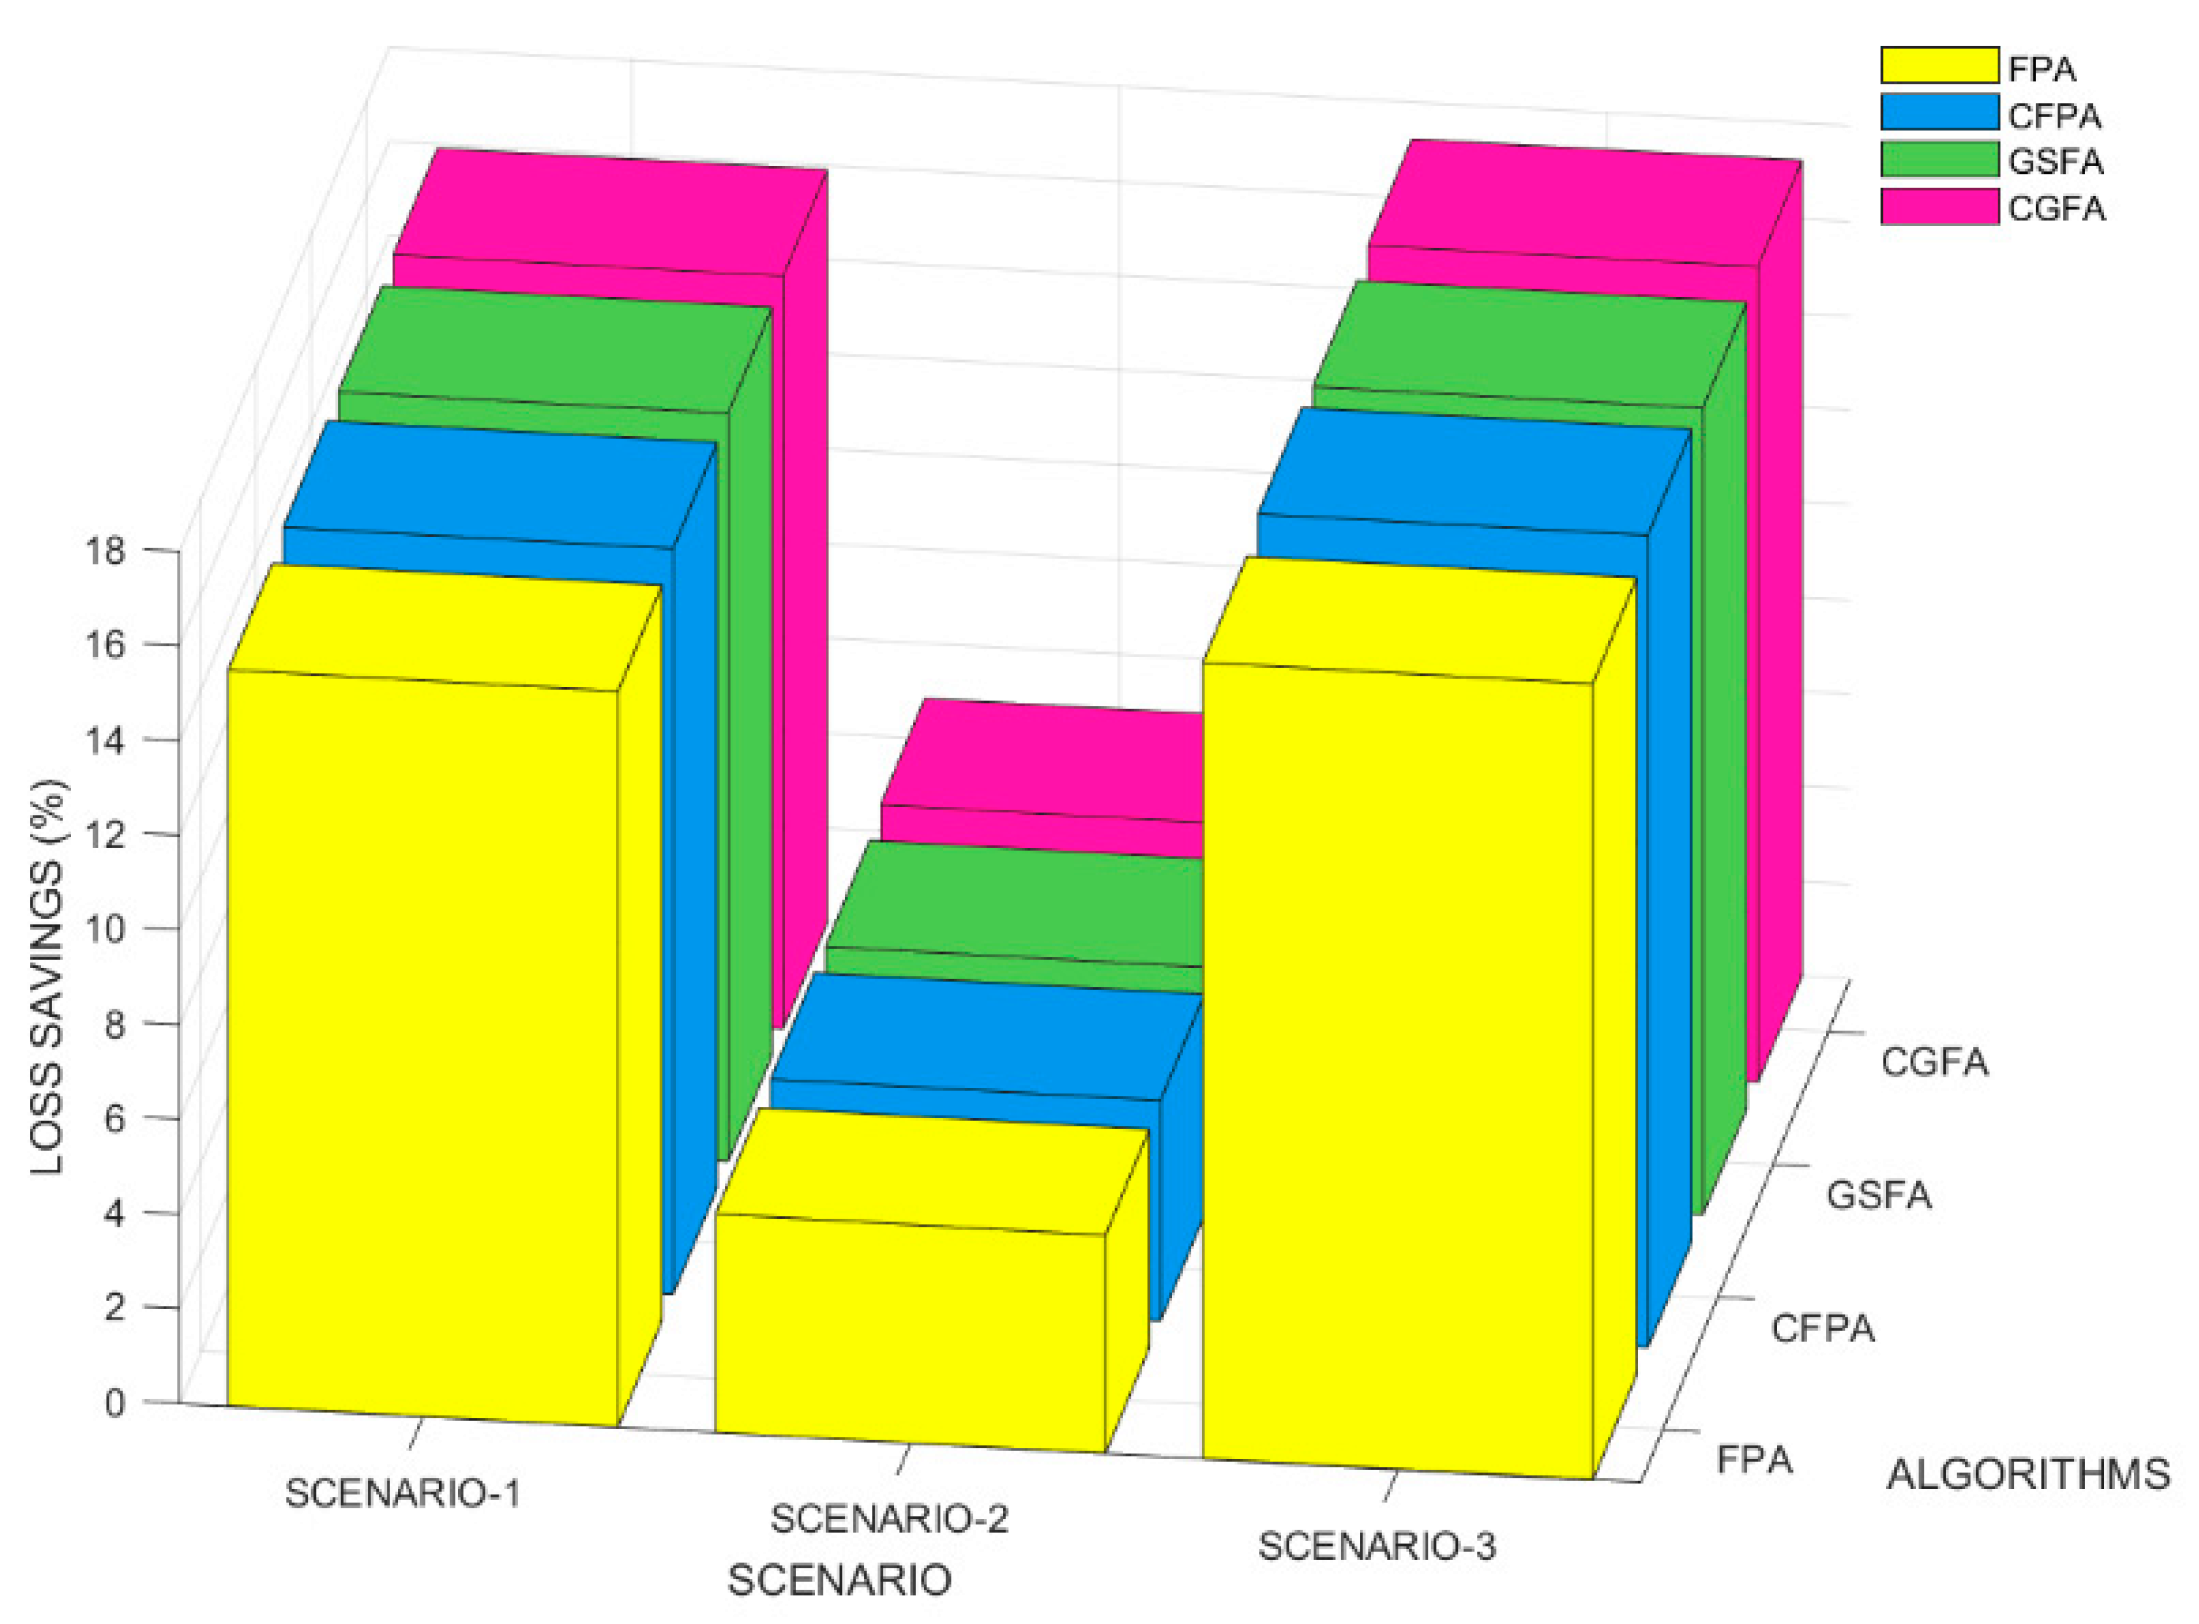
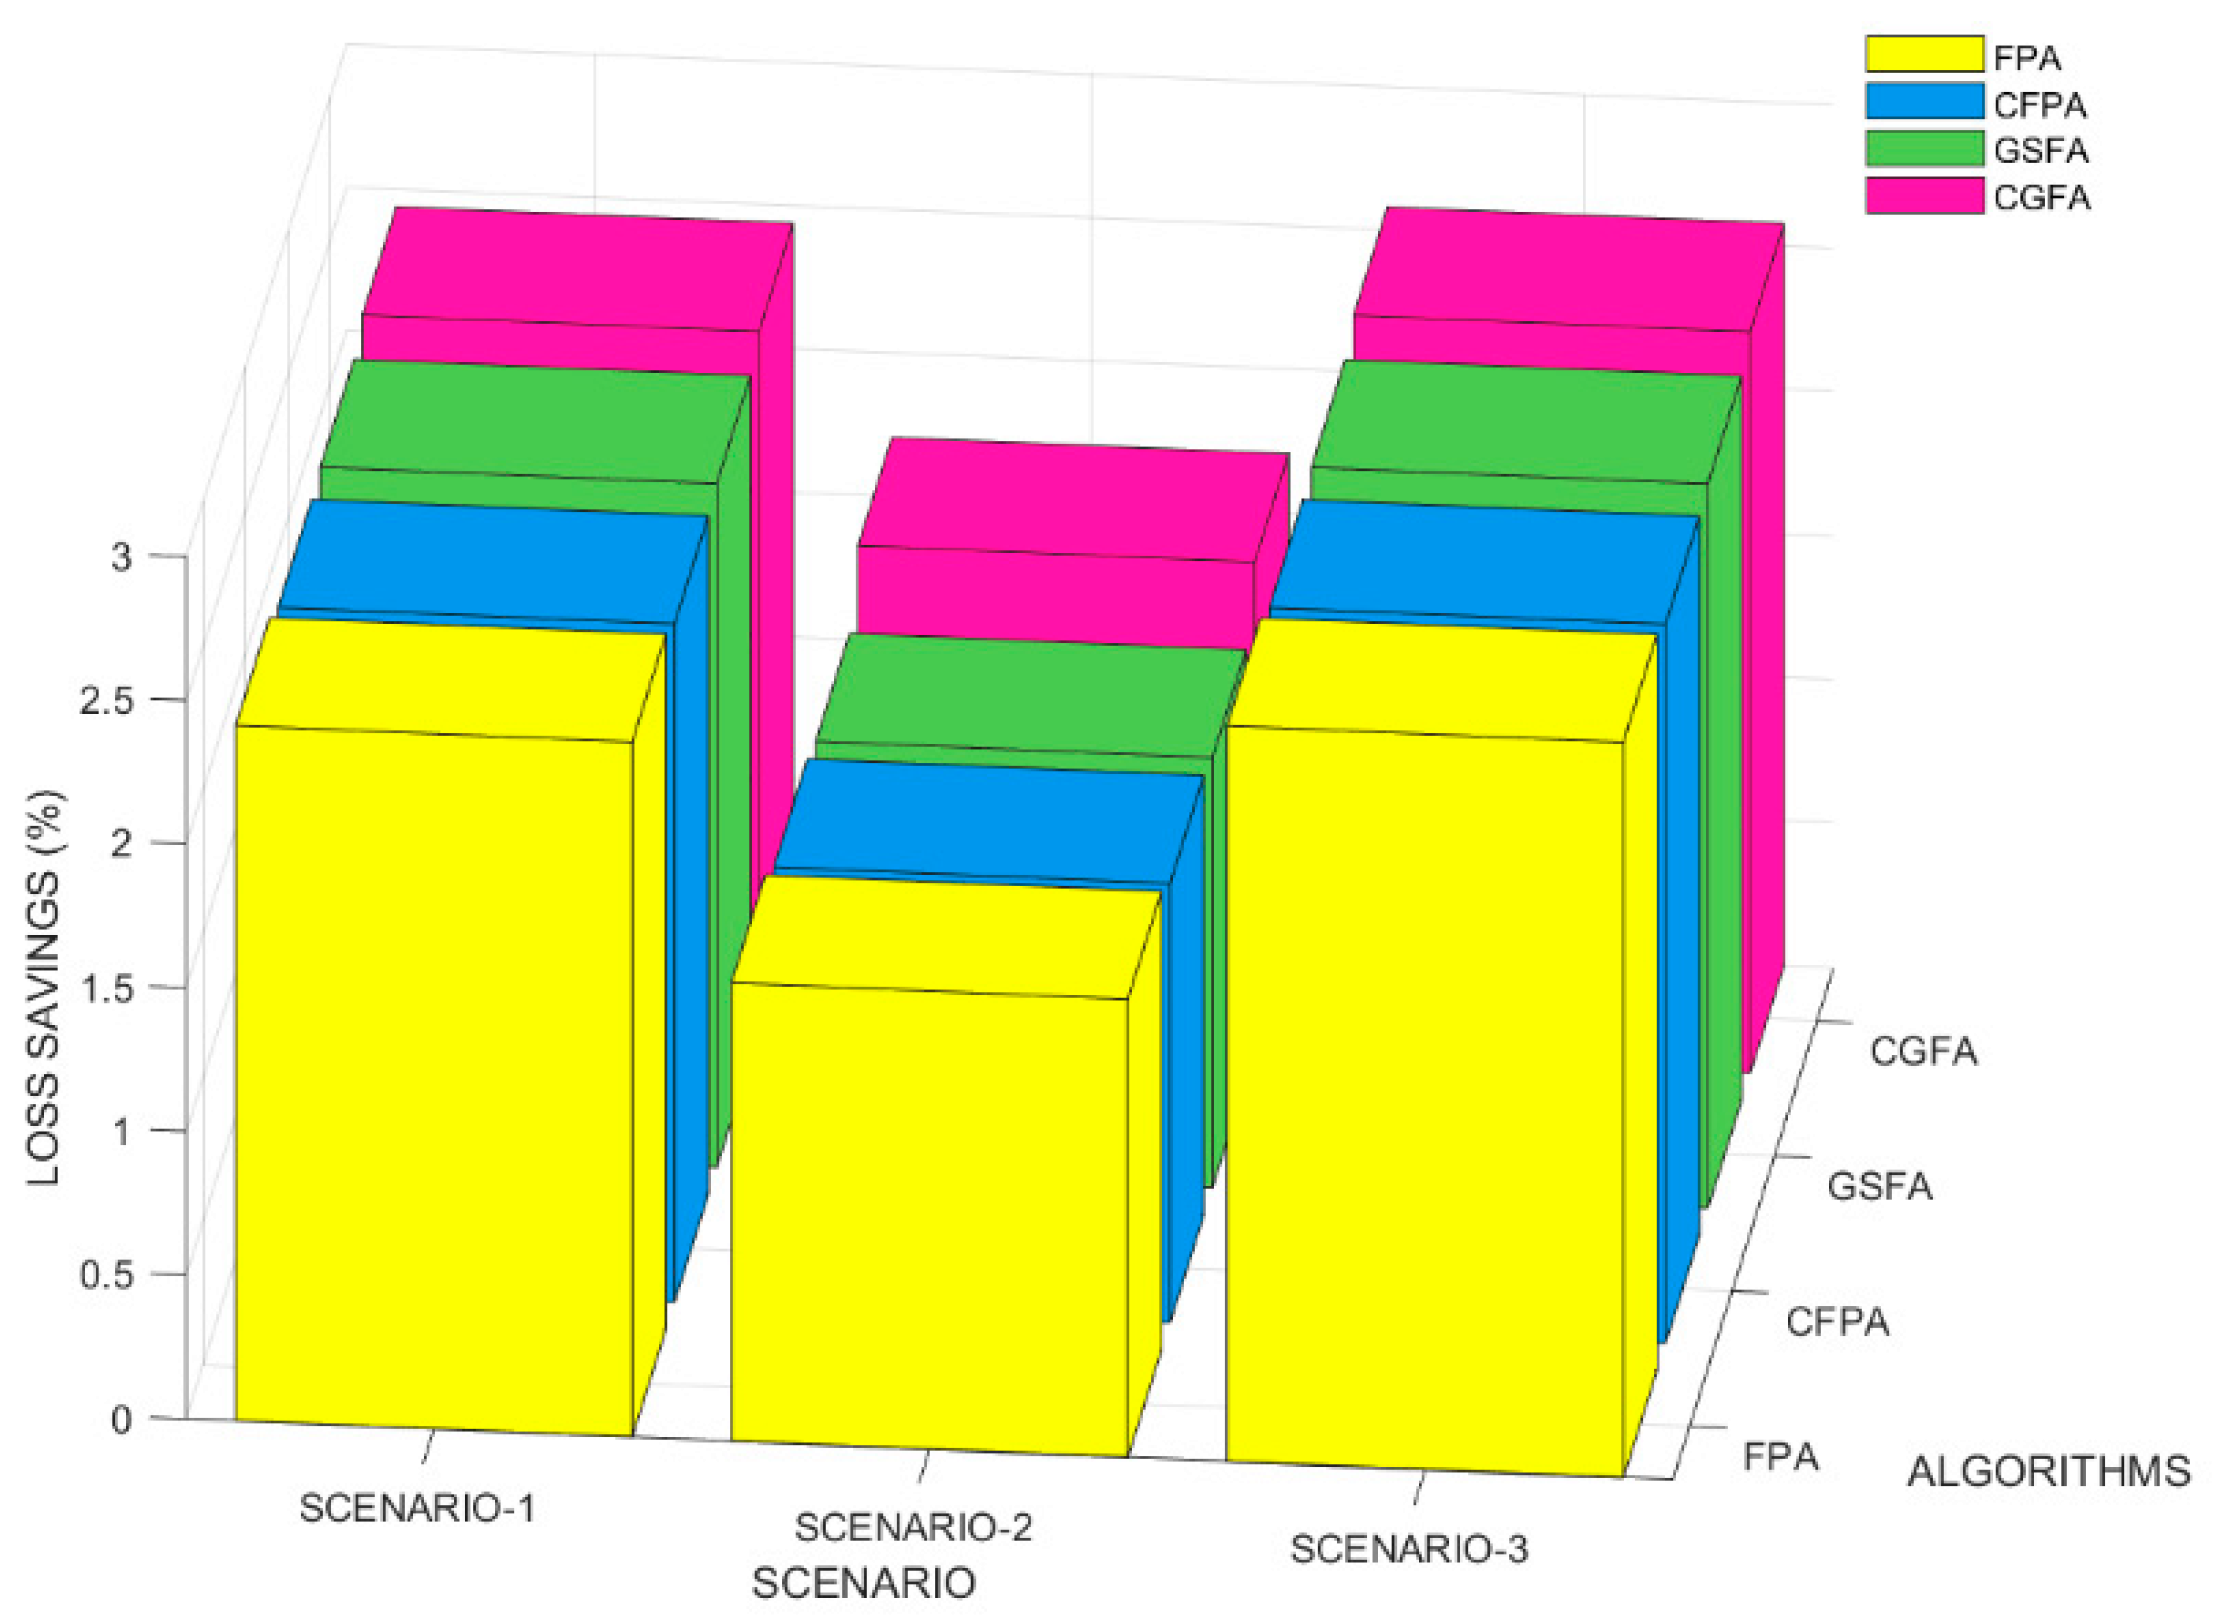
5. Results and Discussion

MATLAB R2020 software was used for the simulation and modelling work on a system with the specifications of 4 GHz Core i7 CPU of Intel with RAM of 16 GB. It reduced the PLs by optimizing their feeder connections in the RDS. The said approach is related to existing algorithms such as the FPA, the CFPA, and the GSFA. The main objective was to reduce the PLs of the system. It was tested via three major scenarios:
  • Scenario 1: bus fault (BF)
  • Scenario 2: line fault (LF)
  • Scenario 3: bus and line fault (BLF)
The proposed algorithm was validated by applying these cases in the four bus systems. In the first scenario, the bus with a higher load was being disconnected. In comparison, the line with higher resistance was being disconnected in the second scenario. The third case combined scenarios 1 and 2. The disconnected bus and line for all test systems are set out in Table 2.
The main reason to study these uncertainty conditions was to assess the resiliency of the RDS. The implementation criteria of the proposed technique are outlined in Table 3. Table 4 lists the specifications of the four test bus systems, including the base kV and the MVA, the bus locations of the DG and the ESS, the tie switches, the power of the DG and the ESS, and the base case power loss. Here, a real power modelling of the DG and the ESS is considered.

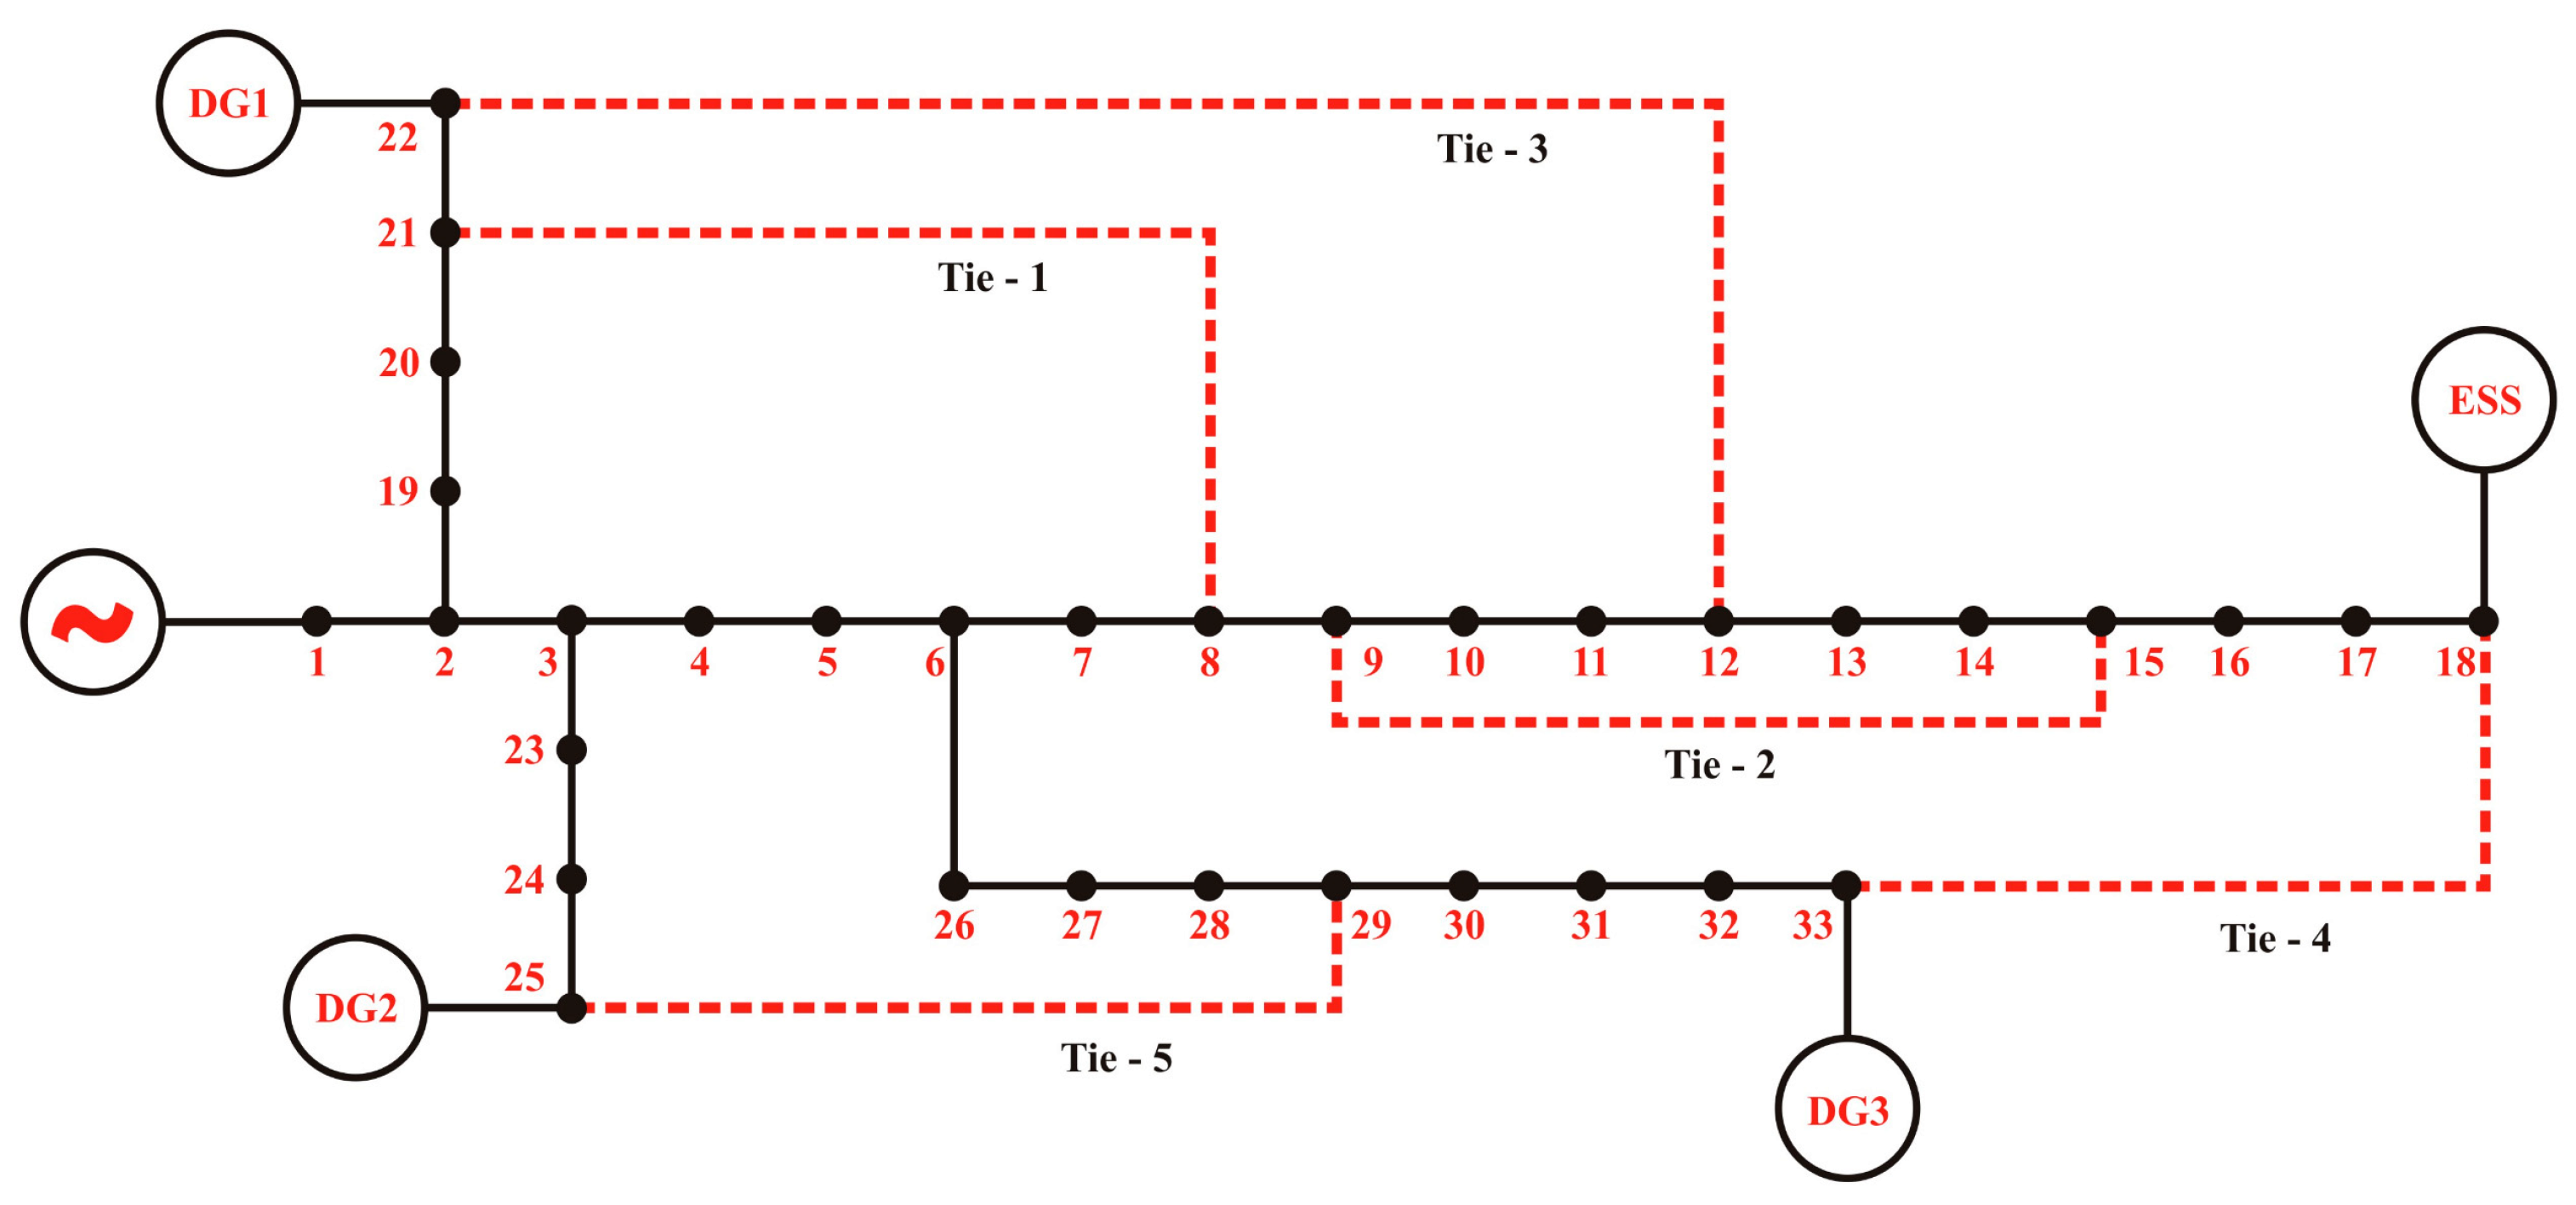
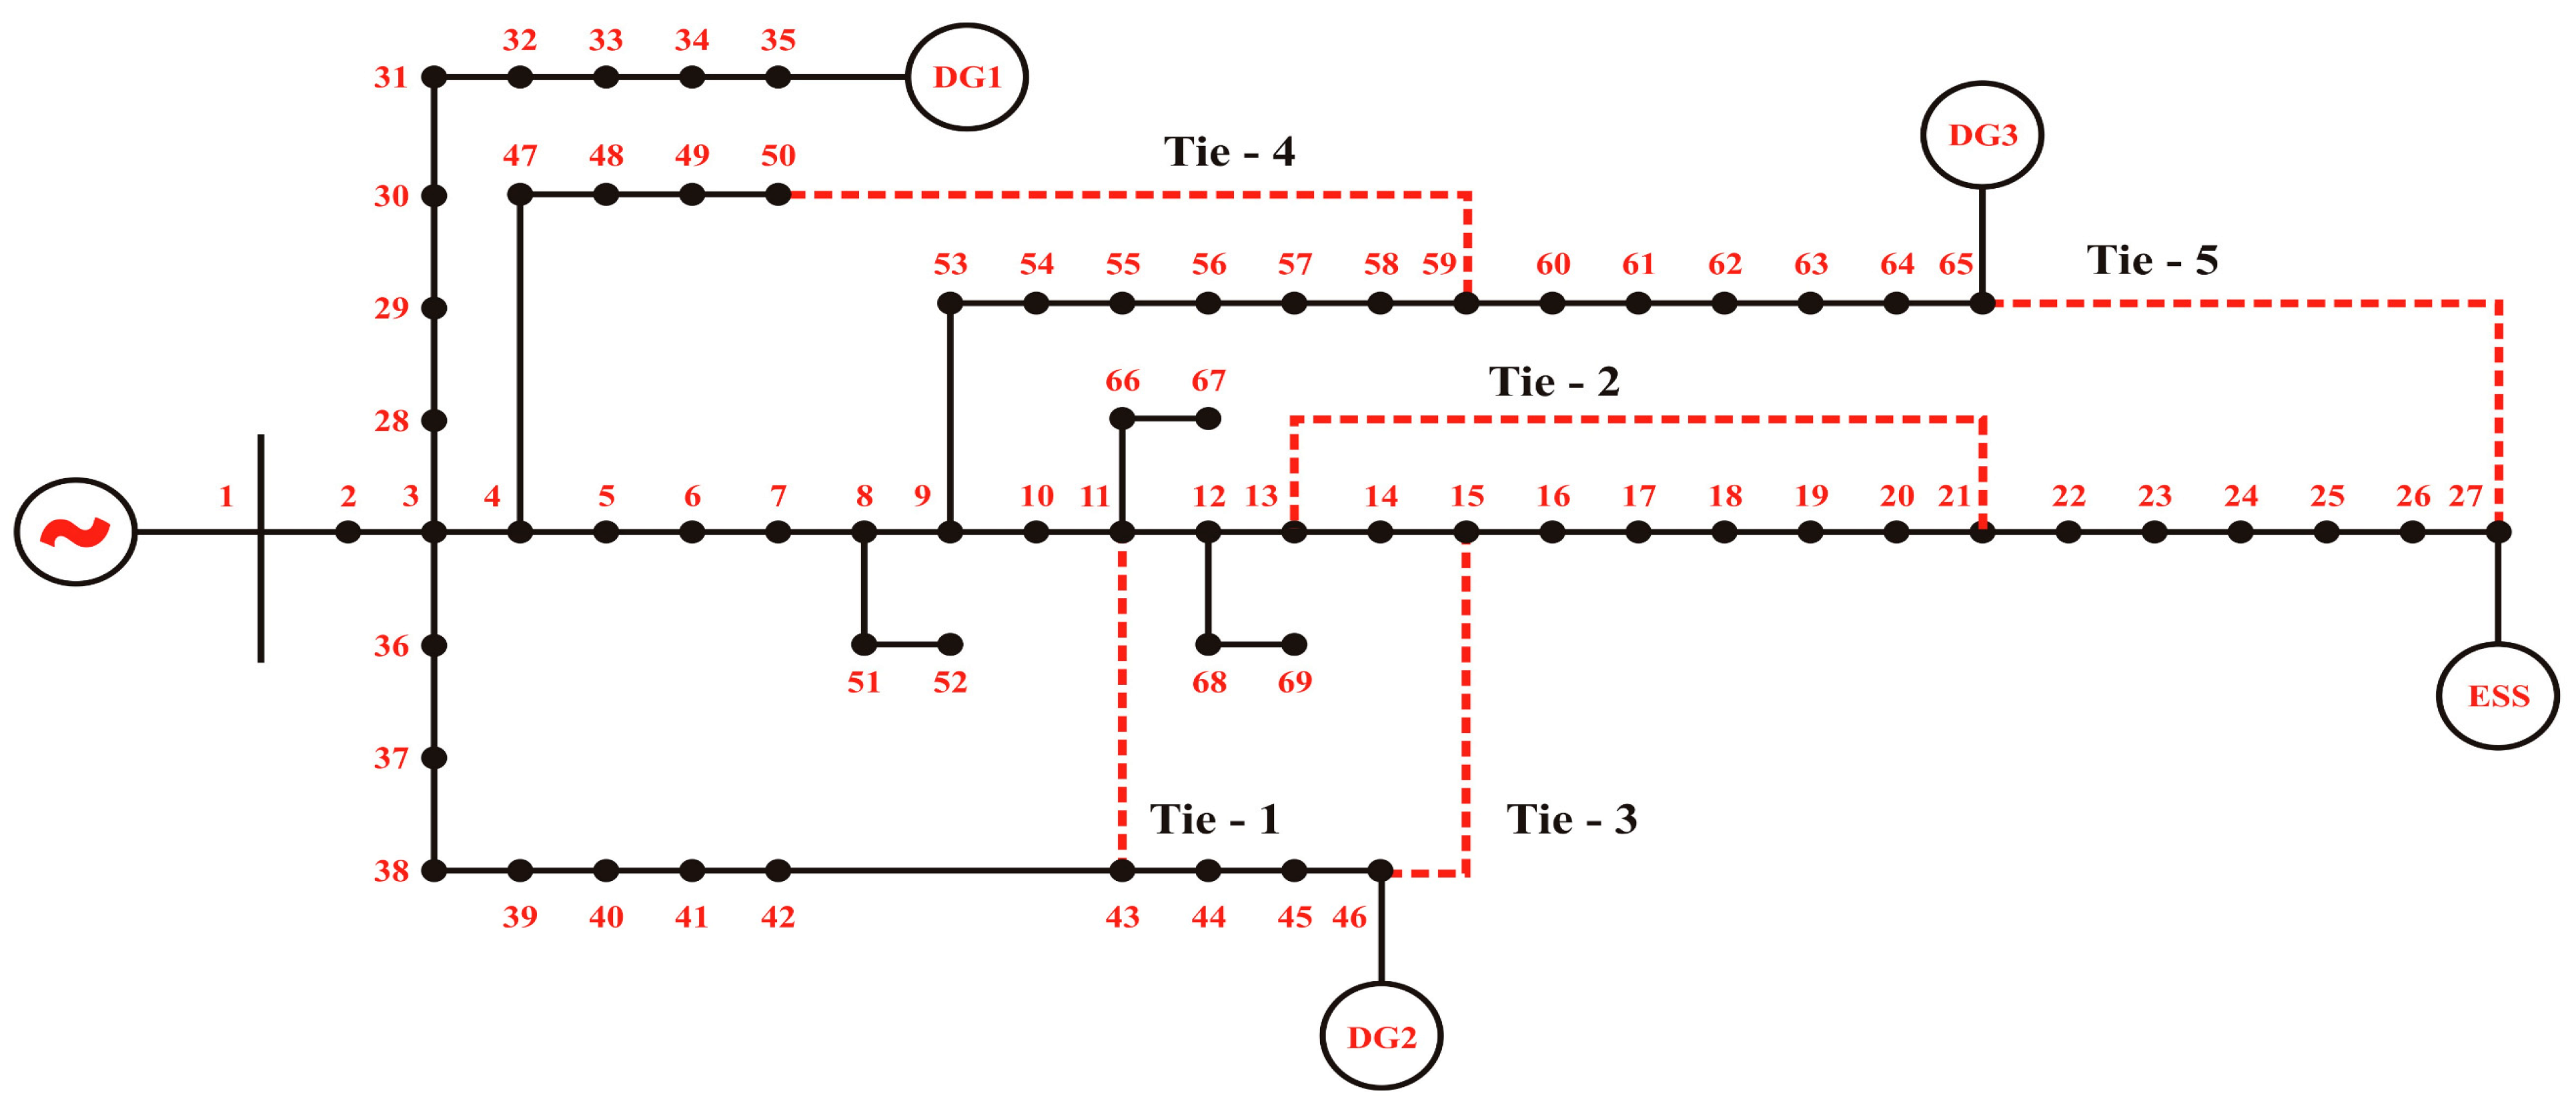
5.1. Validation Studies on IEEE Systems

The suggested technique’s performance was tested with the IEEE 33-bus system, as shown in Figure 4 for three test cases. The dotted routes represent the tie switches that are to be connected or disconnected for the dynamic allocation of feeders. The average actual active power loss was 284.2052 kW. Initially, the power loss was computed and minimized with the power network optimal reconfigurations. Further, the proposed technique was evaluated to determine the optimal feeder connections.
The optimal tie-switch connections were obtained, as shown in Table 5, for all prevailing techniques and the proposed technique. Table 5 lists the average performance, best performance, worst performance, and standard deviation of the power losses for the IEEE 33-bus system for all validated techniques as well for the proposed technique. In addition, Figure 5 depicts a reduction in power losses for different outage conditions, for the validated techniques and the proposed technique. The system’s maximum power loss savings were found to be 10.23% with line-outage conditions. Similarly, the BF and the LBF condition meant that the system power loss savings were 0.9% and 10.62%, respectively. Using the suggested technique, there was a significant reduction in power loss, compared to those of the other techniques.
The proposed technique was tested via the IEEE 69-bus system, as configured in Figure 6. The three test cases were executed. The system’s average actual power loss was 225.5454 kW. The bus system’s power loss was reduced significantly, due to the proposed technique. Initially, identifying and minimizing power losses were based on an optimal reconfiguring of the power network. The suggested technique was validated, with various techniques for verification and demonstrations of the improvements.
The suggested method demonstrated an important convergence speed in all cases, including all bus systems, compared to those of other validated techniques, such as the GA, the PSO, the ABC, the GSA, the FPA, the CFPA, the GSFA, and the CGFA. Using the IEEE 69-bus system as an example, Figure 7a compares the convergence speed of the proposed method to that of other methods for all test cases. The proposed method is shown in yellow; without question, it can converge faster than all the other techniques. With total iterations of 1000, all other algorithms delayed their convergence, while the CGFA settled quickly to the global optimal zone. The local trapping of the solution was diminished by avoiding pre-mature convergence. The tolerance error was less maintained at 0.0005. The magnified view of scenario 5 visualizes all curves of the algorithms for the reader’s clarity. The minimized view of the CGFA represents its own efficacy, as shown in Figure 7b.
Figure 8 depicts the reduction in power losses in the IEEE 69-bus system for different outage conditions, using the validated techniques and the proposed technique. Here, the system’s maximum power-loss savings was 0.43% with line outage conditions. Similarly, in the BF and the LBF conditions, the system’s power-loss savings were 0.44% and 0.43%, respectively.
The suggested technique’s performance was tested using the IEEE 119-bus system, as shown in Figure 9, for three test cases. The three real-powered DGs and one ESS were placed at buses 28, 78, 114, and 55, respectively. The dotted routes represent the tie switches that were to be connected or disconnected for the dynamic allocation of feeders. The system’s total reactive and actual power loads were 17.04 MVAr and 22.7097 MW, respectively. The optimal tie-switch connections for this system were obtained as shown in Table 6. Initially, the PLs were identified and minimized with the power network optimal reconfigurations. Further, the proposed technique was utilized to determine optimal feeder connections.
The percentage of power-loss savings in the bus system denoted for IEEE 119 is illustrated in Figure 10. The highest power-loss savings of this system was 15.89% with line outage conditions. Similarly, the BF and the LBF condition showed power loss savings as 4.84% and 17.22%, respectively. The computation time of all algorithms were compared, as plotted in Figure 11. The reduced computation complexity was one of the advantageous features of the CGFA.

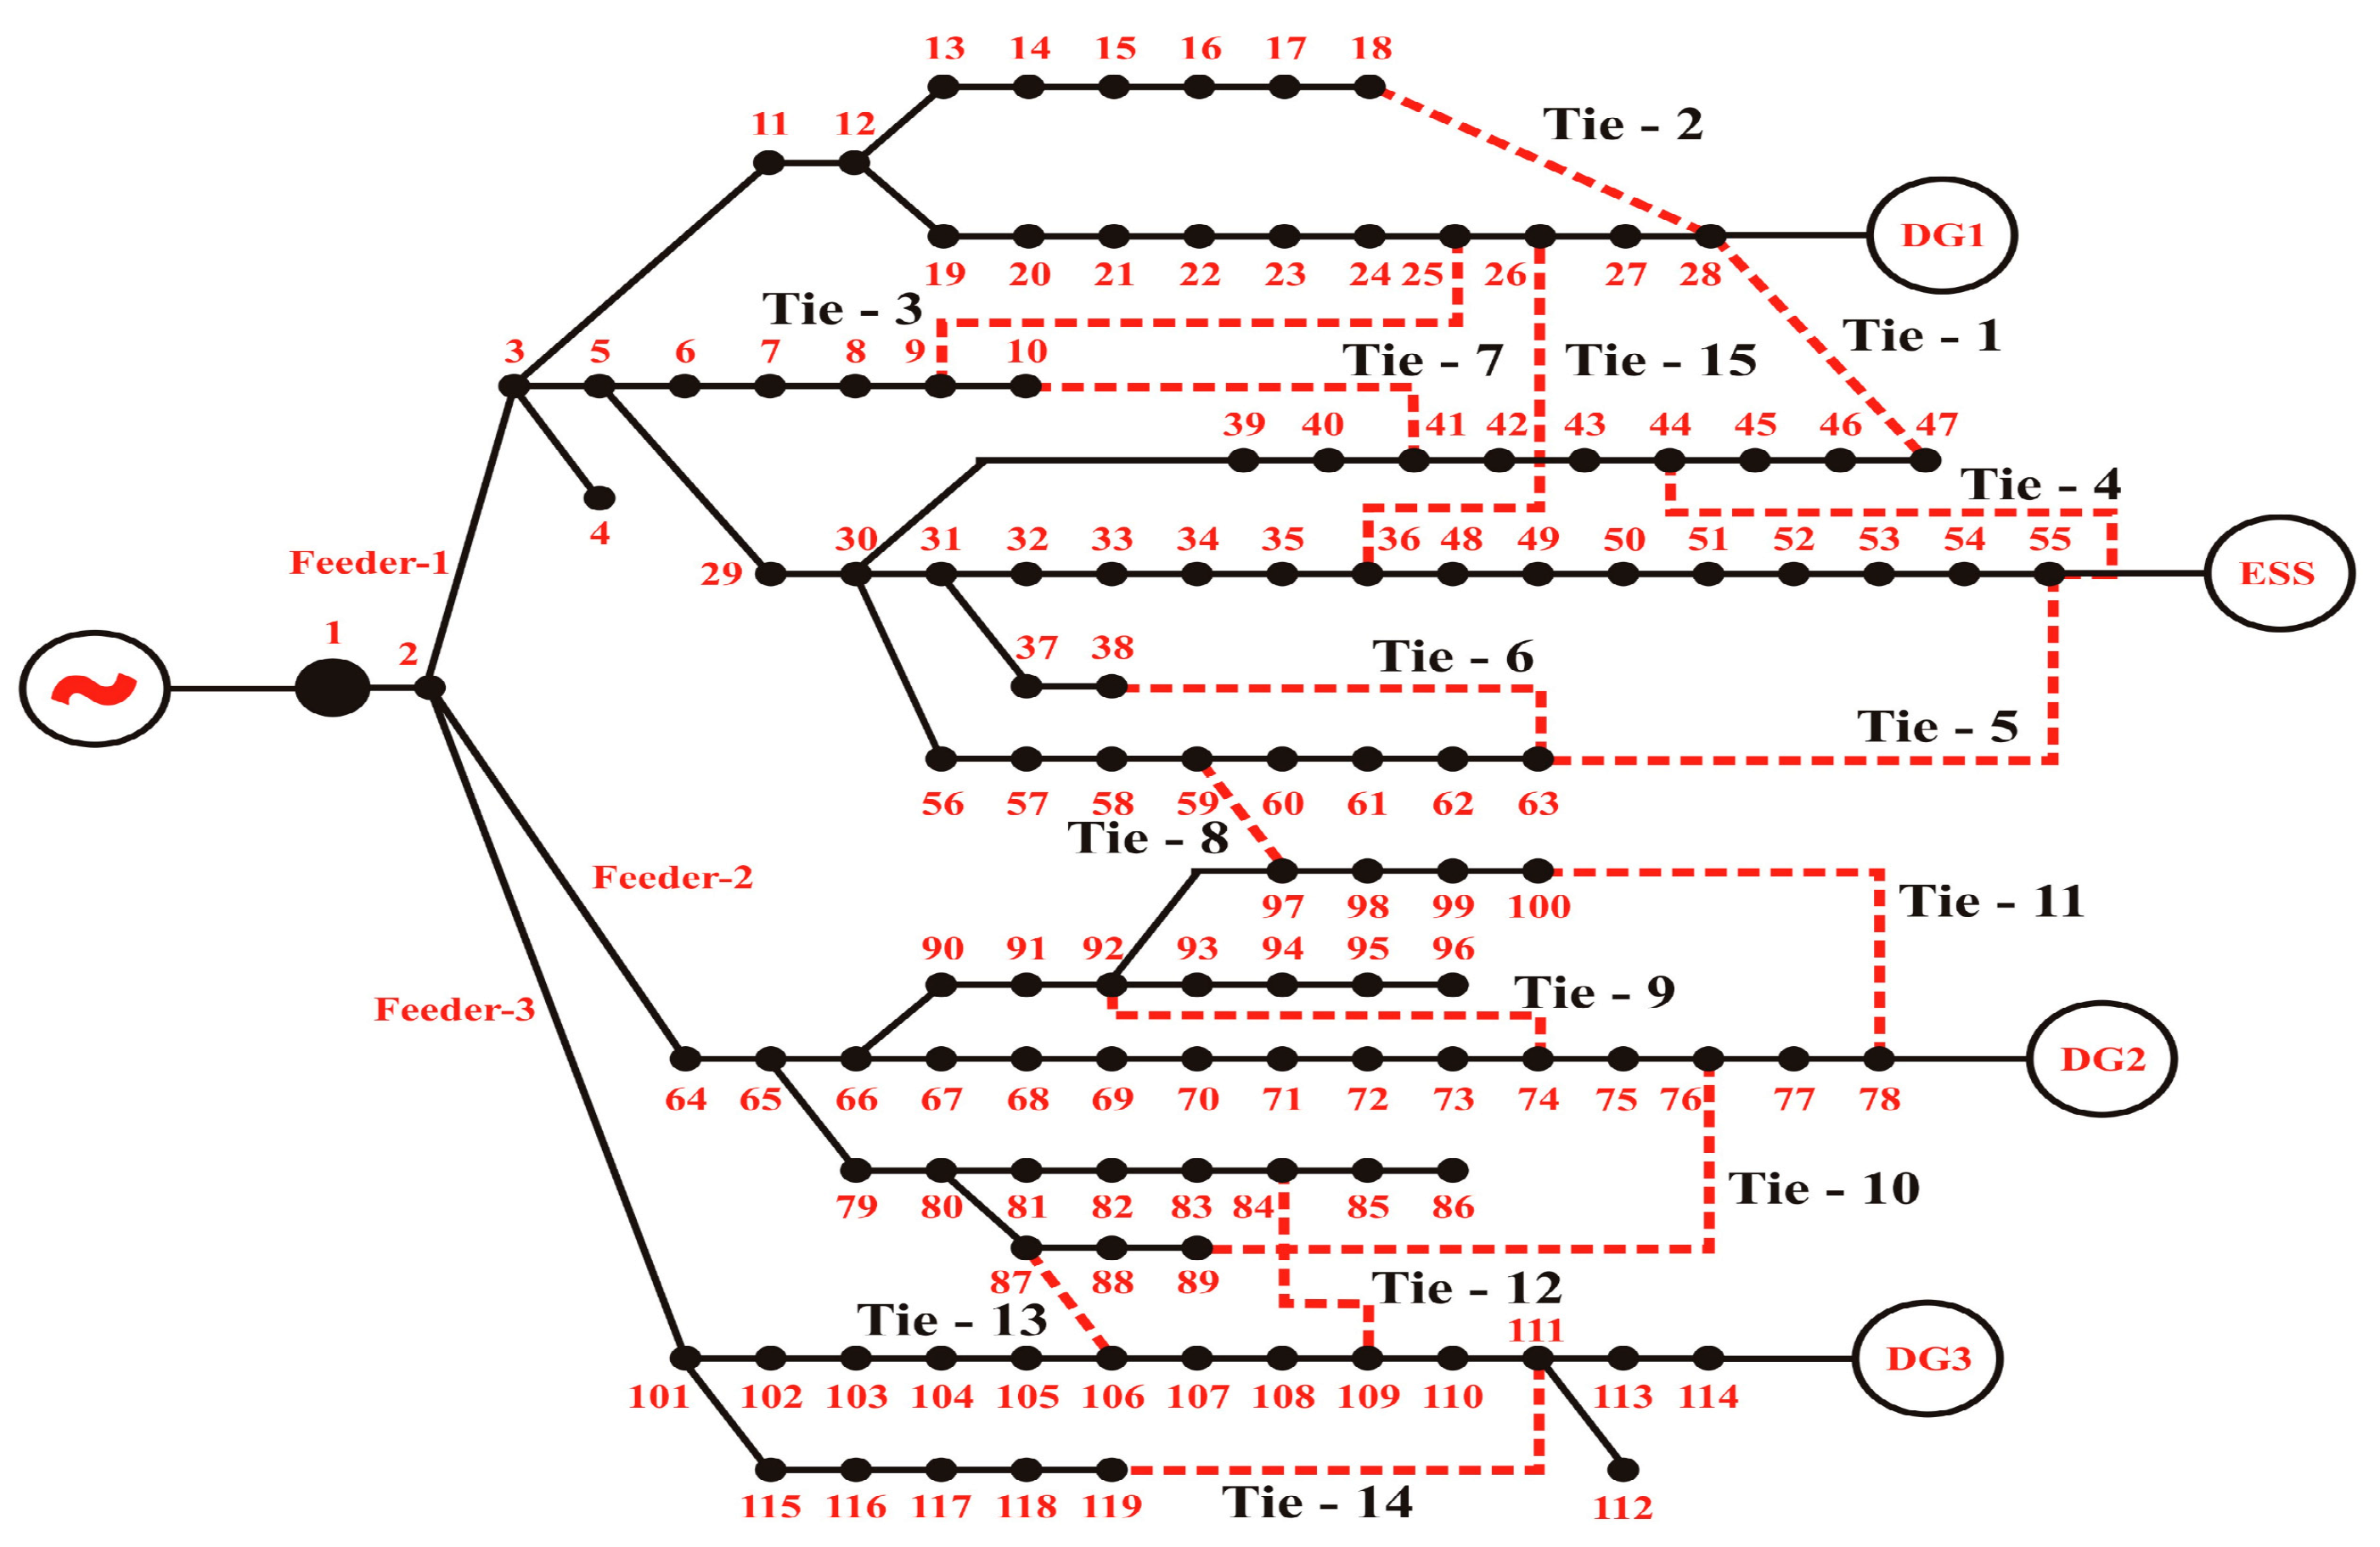
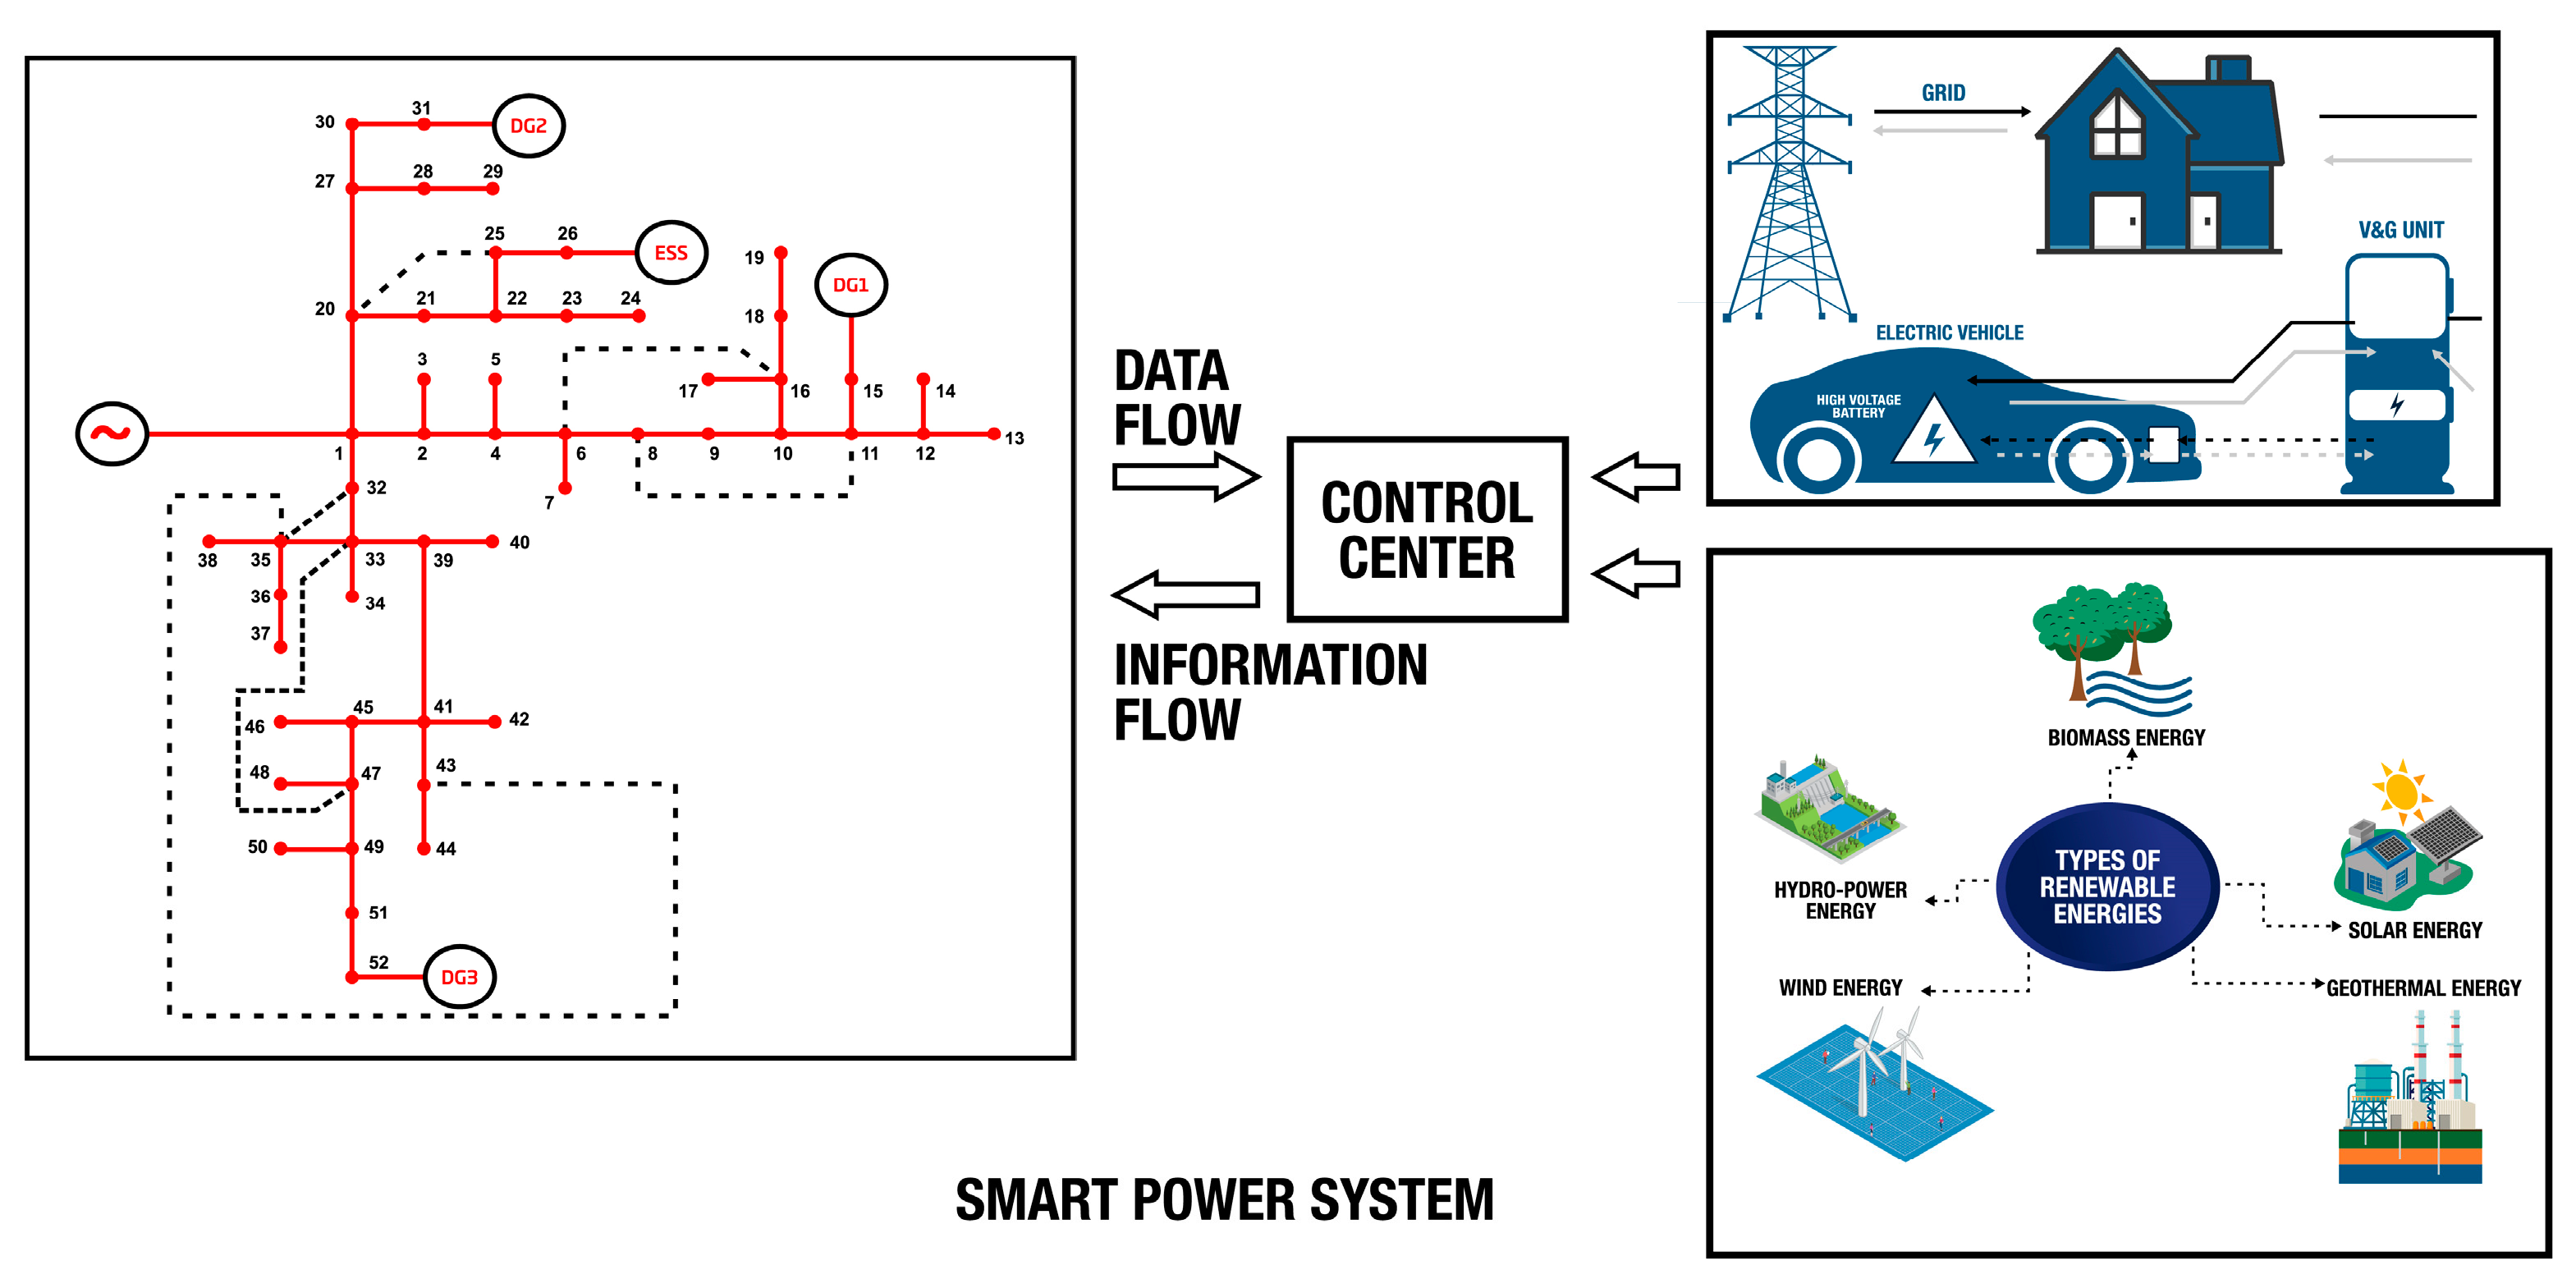
5.2. Validation Studies on Practical Indian Smart City Network

The performance of the proposed technique was tested with a smart city network. The process is well illustrated in Figure 12 for the three cases that were tested. The test system had 52 buses, 51 branches to feed the total network load, and three feeders. The dotted routes in Figure 12 represent the tie switches that are to be connected or disconnected for the dynamic allocation of feeders. The optimal tie-switch connections were obtained, as shown in Table 7, for all equipped techniques and the new proposed technique. Table 7 also provides the average performance, best performance, worst performance, and standard deviation in the smart city network bus system’s power losses for all validated techniques and for the proposed technique. The test system’s power factor was 0.9, which was lagging.
The system could be plugged in to the smart city developing zone. Renewable source-based DG and ESS were embedded with the network to make the system smarter and to provide uninterruptible power. When fault occurred, the power could be served by the DG and the ESS. Since the evolution of smart cities, a step has been taken to integrate Indian 52-bus practical distribution network as a small portion of the system. It has many sources, fed from both conventional and non-conventional energy; therefore, it may incorporate in smart cities in addition to the existing substation, as shown in Figure 12.
The practical distribution network of smart power system is shown in Figure 13. In a smart city network, data are generated from sensor devices installed in different devices. Those data were transferred to a main centre, where the data were processed and useful information or a control signal was transmitted back to the devices working in the physical process. This whole scenario made the network smarter and more intelligent. Hence, it increasingly demonstrated the credibility and efficiency of the system.
Additionally, the base MVA and the kV for the preferred test system were 1 and 11, respectively. The highest and lowest limits of the bus voltage magnitude were 0.9 p.u. and 1.05 p.u., respectively. For 52-bus practical distribution systems with the DG, the active power losses totalled 434.7279 kW. Initially, the system power loss was identified and minimized with the optimal reconfiguration of the power network. Further, the proposed technique could find optimal tie-switch connections.
Figure 14 charts the reduction in power losses of the smart city network at different outage conditions. The maximum power loss savings of the system was 2.43% with line-outage conditions. Similarly, the BF and LBF conditions meant that the system’s power loss savings were 1.70% and 2.57%, respectively. With the proposed algorithm’s help, the power loss was minimized, compared with the original system’s power loss. Notably, the selection of optimal allocation of specific feeder connections helped in reducing the power loss in the power systems. In this study, the proposed technique achieved excellent optimal outcomes for reducing power losses.
To verify the correctness of the proposed system and investigate its performance parameters, it was compared with other systems with the same network configurations regarding load demands and power generation. The proposed technique was mostly equated with the existing systems’ power losses, for all four test systems. The Indian 52-bus system of the smart city was used as an example to show, as in Figure 15, the clear power losses in the test cases. Hence, the individual line losses could be viewed clearly.
The simulation studies were run 100 times to validate the performance. Through quantitative analysis, best performance, worst performance, mean performance, and standard deviation values were computed for all three cases. From the comparative studies on all four test systems, we concluded that the proposed technique achieved excellent outcomes for reducing power losses during LBF. The computation rate was also found to have good characteristics.

6. Conclusions

This article addressed the optimal reconfiguration issue with an objective focus on absolute power-loss minimization. A new technique, based on the CGFA, was developed to compute the optimal reconfiguration settings in the RDS to achieve the objective function. The performance of the proposed technique was tested with IEEE 33, IEEE 69, and IEEE 119 systems and exhibited low standard deviation ranging from 0.0012 to 0.0101, and the smart city practical Indian 52-bus system had the standard deviations from 0.012 to 0.0432. The different conditions were checked in each network, such as the LF, BF, and LBF conditions. The proposed technique was validated by analysing the system’s power loss via performance and comparison analysis and also based on the convergence speed. By comparing the results of the proposed technique and other validated techniques, we found that the proposed method was fastest in convergence and superior in reducing power losses.
To sum up, the proposed technique (the CGFA) was quickly converged to achieve power loss minimization in the RDS. Through this method, adaptive tie-switch combinations were obtained, resulting in reduced maintenance costs that are due to ageing effects. In future studies, it is proposed that optimal DG and parking lot allocation be integrated with reconfiguration studies, and cost-consideration analysis could be carried out.

Author Contributions

Conceptualization, D.S., A.R. and L.F.G.-N.; methodology, O.D.M. and L.F.G.-N.; software, S.A.; validation, A.R.; formal analysis and investigation, D.S.; resources, A.R.; data curation, O.D.M. and L.F.G.-N.; writing—original draft preparation, D.S.; writing—review and editing, A.R., O.D.M. and L.F.G.-N.; supervision, A.R.; funding acquisition, O.D.M. and L.F.G.-N. All authors have read and agreed to the published version of the manuscript.

Funding

This research received no external funding.

Data Availability Statement

Not applicable.

Acknowledgments

The authors thank the authorities of Vellore Institute of Technology, Chennai, for providing all facilities.

Conflicts of Interest

The authors declare no conflict of interest.

Nomenclature

ABCArtificial bee colony
ACOAnt colony optimization
BFBus fault
CFPAChaos-enhanced flower pollination algorithm
CGFAChaotic golden flower algorithm
CGSAChaotic golden search algorithm
CSACuckoo search algorithm
DADragonfly algorithm
DGDistributed generation
D-FACTSDistributed-flexible AC transmission
DNDistribution network
DNRDistribution network reconfiguration
ESSEnergy Storage System
FPAFlower pollination algorithm
GAGenetic algorithm
GSFAGolden-search-based flower algorithm
GSGravitational search
GSAGolden search algorithm
HSAHarmony search algorithm
ICTInformation and communication technology
IHSAImproved harmony search algorithm
LBFLine and bus fault
LFLine fault
MFAModified fireworks algorithm
MOMetaheuristic optimization
NCNormally closed
NONormally open
PLPower loss
PSPower system
PSOParticle swarm optimization
PVPhotovoltaic
RDSRadial distribution system
SCSmart city
TLBOTeaching Learning-based optimization

References

  1. Taleski, R.; Rajicic, D. Distribution Network Reconfiguration for Energy Loss Reduction. IEEE Power Eng. Rev. 1997, 17, 68–69. [Google Scholar] [CrossRef]
  2. Dekhandji, F.Z.; Baali, H.; Recioui, A. Optimal Placement of DGs in the Distribution Networks Using an Analytical Approach. In Proceedings of the 2022 13th International Renewable Energy Congress (IREC), Hammamet, Tunisia, 13–15 December 2022; pp. 1–6. [Google Scholar]
  3. Muthukumar, K.; Jayalalitha, S.; Sureshkumar, K.; Sakthivel, A.; Balamurugan, K.; Ramasamy, M. Application of Hybrid Heuristic Technique for Optimal Shunt Capacitors Planning Problem in Radial Distribution Network. Soft Comput. 2019, 23, 11227–11245. [Google Scholar] [CrossRef]
  4. Nazari, M.H.; Khodadadi, A.; Lorestani, A.; Hosseinian, S.H.; Gharehpetian, G.B. Optimal Multi-Objective D-STATCOM Placement Using MOGA for THD Mitigation and Cost Minimization. J. Intell. Fuzzy Syst. 2018, 35, 2339–2348. [Google Scholar] [CrossRef]
  5. Sabouhi, H.; Doroudi, A.; Fotuhi-Firuzabad, M.; Bashiri, M. Electricity Distribution Grids Resilience Enhancement by Network Reconfiguration. Int. Trans. Electr. Energy Syst. 2021, 31, e13047. [Google Scholar] [CrossRef]
  6. Chenniappan, M.; Gnanavel, D.; Gunasekaran, K.P.; Rajalakshmi, R.R.; Ramya, A.S.; Stonier, A.A.; Peter, G.; Ganji, V. Prediction of Fault Occurrences in Smart City Water Distribution System Using Time-Series Forecasting Algorithm. Math Probl. Eng. 2022, 2022, 9678769. [Google Scholar] [CrossRef]
  7. Wang, H.; Wang, S.; Yu, L.; Hu, P. A Novel Planning-attack-reconfiguration Method for Enhancing Resilience of Distribution Systems Considering the Whole Process of Resiliency. Int. Trans. Electr. Energy Syst. 2020, 30, e12199. [Google Scholar] [CrossRef]
  8. Aydin, I.; Karakose, M.; Karakose, E. A Navigation and Reservation Based Smart Parking Platform Using Genetic Optimization for Smart Cities. In Proceedings of the ICSG 2017 5th International Istanbul Smart Grids and Cities Congress and Fair, Istanbul, Turkey, 19–21 April 2017; pp. 120–124. [Google Scholar] [CrossRef]
  9. Choi, B.Y.; Moon, S.J.; Pyeon, M.W.; Koo, J.H. Implementation of Smart Green City in Response to Climate Change-With Focus on the Reference Case of the Ministry of Land, Transport Amp; Maritime Affairs of Korea. In Proceedings of the 2012 14th International Conference on Advanced Communication Technology (ICACT), PyeongChang, Republic of Korea, 19–22 February 2012; pp. 331–335. [Google Scholar]
  10. Yilmaz, M.; Krein, P.T. Review of Battery Charger Topologies, Charging Power Levels, and Infrastructure for Plug-in Electric and Hybrid Vehicles. IEEE Trans. Power Electron. 2013, 28, 2151–2169. [Google Scholar] [CrossRef]
  11. Kanchev, H.; Lu, D.; Colas, F.; Lazarov, V.; Francois, B. Energy Management and Operational Planning of a Microgrid with a PV-Based Active Generator for Smart Grid Applications. IEEE Trans. Ind. Electron. 2011, 58, 4583–4592. [Google Scholar] [CrossRef] [Green Version]
  12. Chen, Z.; Guerrero, J.M.; Blaabjerg, F. A Review of the State of the Art of Power Electronics for Wind Turbines. IEEE Trans. Power Electron. 2009, 24, 1859–1875. [Google Scholar] [CrossRef]
  13. Rajagopalan, A.; Swaminathan, D.; Alharbi, M.; Sengan, S.; Montoya, O.D.; El-Shafai, W.; Fouda, M.M.; Aly, M.H. Modernized Planning of Smart Grid Based on Distributed Power Generations and Energy Storage Systems Using Soft Computing Methods. Energies 2022, 15, 8889. [Google Scholar] [CrossRef]
  14. Subramanian, G.G.; Alexander Stonier, A.; Peter, G.; Ganji, V. Application of Flower Pollination Algorithm for Solving Complex Large-Scale Power System Restoration Problem Using PDFF Controllers. Complexity 2022, 2022, 7157524. [Google Scholar] [CrossRef]
  15. Bagheri, A.; Bagheri, M.; Lorestani, A. Optimal Reconfiguration and DG Integration in Distribution Networks Considering Switching Actions Costs Using Tabu Search Algorithm. J Ambient Intell Hum. Comput 2021, 12, 7837–7856. [Google Scholar] [CrossRef]
  16. Dhivya, S.; Arul, R.; Ramesh, S.; Kasinathan, P. An Efficient Energy Utilization Analysis Using Novel Chess Optimization Algorithm. Ann. Rom. Soc. Cell Biol. 2020, 24, 19–34. [Google Scholar]
  17. Abdelaziz, M. Distribution Network Reconfiguration Using a Genetic Algorithm with Varying Population Size. Electr. Power Syst. Res. 2017, 142, 9–11. [Google Scholar] [CrossRef]
  18. Essallah, S.; Khedher, A. Optimization of Distribution System Operation by Network Reconfiguration and DG Integration Using MPSO Algorithm. Renew. Energy Focus 2020, 34, 37–46. [Google Scholar] [CrossRef]
  19. Su, C.T.; Chang, C.F.; Chiou, J.P. Distribution Network Reconfiguration for Loss Reduction by Ant Colony Search Algorithm. Electr. Power Syst. Res. 2005, 75, 190–199. [Google Scholar] [CrossRef]
  20. Thunuguntla, V.K.; Injeti, S.K. Ɛ-Constraint Multiobjective Approach for Optimal Network Reconfiguration and Optimal Allocation of DGs in Radial Distribution Systems Using the Butterfly Optimizer. Int. Trans. Electr. Energy Syst. 2020, 30, e12613. [Google Scholar] [CrossRef]
  21. Narimani, M.R.; Vahed, A.A.; Azizipanah-Abarghooee, R.; Javidsharifi, M. Enhanced Gravitational Search Algorithm for Multi-Objective Distribution Feeder Reconfiguration Considering Reliability, Loss and Operational Cost. IET Gener. Transm. Distrib. 2014, 8, 55–69. [Google Scholar] [CrossRef]
  22. Nguyen, T.; Truong, V.; Tuấn, P. A Novel Method Based on Adaptive Cuckoo Search for Optimal Network Reconfiguration and Distributed Generation Allocation in Distribution Network. Int. J. Electr. Power Energy Syst. 2016, 78, 801–815. [Google Scholar] [CrossRef]
  23. Kumar, D.H.; Babu, P.S.; Lalitha, M.P. Distribution System Network Reconfiguration by Using Artificial Bee Colony Algorithm. IOSR J. Electr. Electron. Eng. 2014, 9, 48–52. [Google Scholar] [CrossRef]
  24. Lotfipour, A.; Afrakhte, H. A Discrete Teaching-Learning-Based Optimization Algorithm to Solve Distribution System Reconfiguration in Presence of Distributed Generation. Int. J. Electr. Power Energy Syst. 2016, 82, 264–273. [Google Scholar] [CrossRef]
  25. Swaminathan, D.; Rajagopalan, A. Multi-Objective Golden Flower Optimization Algorithm for Sustainable Reconfiguration of Power Distribution Network with Decentralized Generation. Axioms 2023, 12, 70. [Google Scholar] [CrossRef]
  26. Lorestani, A.; Ardehali, M.M. Optimal Integration of Renewable Energy Sources for Autonomous Tri-Generation Combined Cooling, Heating and Power System Based on Evolutionary Particle Swarm Optimization Algorithm. Energy 2018, 145, 839–855. [Google Scholar] [CrossRef]
  27. Flaih, F.M.F.; Lin, X.; Dawoud, S.M.; Mohammed, M.A. Distribution System Reconfiguration for Power Loss Minimization and Voltage Profile Improvement Using Modified Particle Swarm Optimization. In Proceedings of the 2016 IEEE PES Asia-Pacific Power and Energy Engineering Conference (APPEEC), Xi’an, China, 25–28 October 2016; pp. 120–124. [Google Scholar] [CrossRef]
  28. Duan, D.L.; Ling, X.D.; Wu, X.Y.; Zhong, B. Reconfiguration of Distribution Network for Loss Reduction and Reliability Improvement Based on an Enhanced Genetic Algorithm. Int. J. Electr. Power Energy Syst. 2015, 64, 88–95. [Google Scholar] [CrossRef]
  29. Khetrapal, P. Distribution Network Reconfiguration of Radial Distribution Systems for Power Loss Minimization Using Improved Harmony Search Algorithm. Int. J. Electr. Eng. Inform. 2020, 12, 341–358. [Google Scholar] [CrossRef]
  30. Rahiminejad, A.; Hosseinian, S.H.; Vahidi, B.; Shahrooyan, S. Simultaneous Distributed Generation Placement, Capacitor Placement, and Reconfiguration Using a Modified Teaching-Learning-Based Optimization Algorithm. Electr. Power Compon. Syst. 2016, 44, 1631–1644. [Google Scholar] [CrossRef]
  31. Namachivayam, G.; Sankaralingam, C.; Perumal, S.K.; Devanathan, S.T. Reconfiguration and Capacitor Placement of Radial Distribution Systems by Modified Flower Pollination Algorithm. Electr. Power Compon. Syst. 2016, 44, 1492–1502. [Google Scholar] [CrossRef]
  32. Mohammadian, M.; Lorestani, A.; Ardehali, M.M. Optimization of Single and Multi-Areas Economic Dispatch Problems Based on Evolutionary Particle Swarm Optimization Algorithm. Energy 2018, 161, 710–724. [Google Scholar] [CrossRef]
  33. Quadri, I.A.; Bhowmick, S. A Hybrid Technique for Simultaneous Network Reconfiguration and Optimal Placement of Distributed Generation Resources. Soft Comput. 2020, 24, 11315–11336. [Google Scholar] [CrossRef]
  34. Heidari, M.A. Optimal Network Reconfiguration in Distribution System for Loss Reduction and Voltage-Profile Improvement Using Hybrid Algorithm of PSO and ACO. CIRED Open Access Proc. J. 2017, 2017, 2458–2461. [Google Scholar] [CrossRef] [Green Version]
  35. Kahouli, O.; Alsaif, H.; Bouteraa, Y.; Ben Ali, N.; Chaabene, M. Power System Reconfiguration in Distribution Network for Improving Reliability Using Genetic Algorithm and Particle Swarm Optimization. Appl. Sci. 2021, 11, 3092. [Google Scholar] [CrossRef]
  36. Amini, S.; Ghasemi, S.; Moshtagh, J. Distribution Feeder Reconfiguration Using PSOGSA Algrotim in Presence of Distribution Generation Based on a Fuzzy Approach. Comput. Intell. Electr. Eng. 2021, 12, 73–86. [Google Scholar]
  37. Pandya, K.S.; Joshi, S.K. CHAOS Enhanced Flower Pollination Algorithm for Optimal Scheduling of Distributed Energy Resources in Smart Grid. In Proceedings of the 2018 IEEE Innovative Smart Grid Technologies-Asia (ISGT Asia), Singapore, 22–25 May 2018; pp. 705–709. [Google Scholar]
  38. Swaminathan, D.; Rajagopalan, A. Optimized Network Reconfiguration with Integrated Generation Using Tangent Golden Flower Algorithm. Energies 2022, 15, 8158. [Google Scholar] [CrossRef]
  39. Dharageshwari, K. Distributed Generations in IEEE 33 Bus Radial System Using Simulated Annealing. In Proceedings of the 2015 International Conference on Circuits, Power and Computing Technologies [ICCPCT-2015], Nagercoil, India, 19–20 March 2015. [Google Scholar]
  40. Prakash, D.B.; Lakshminarayana, C. Multiple DG Placements in Distribution System for Power Loss Reduction Using PSO Algorithm. Procedia Technol. 2016, 25, 785–792. [Google Scholar] [CrossRef] [Green Version]
  41. Devabalaji, K.R.; Ravi, K. Optimal Size and Siting of Multiple DG and DSTATCOM in Radial Distribution System Using Bacterial Foraging Optimization Algorithm. Ain Shams Eng. J. 2016, 7, 959–971. [Google Scholar] [CrossRef] [Green Version]
  42. Sabarinath, G.; Gowri, T. Manohar Optimal Sitting and Sizing of Distributed Generation Units in an Indian Practical Distribution System Using Bird Swarm Algorithm. Int. J. Intell. Syst. Appl. 2019, 10, 54–64. [Google Scholar]
  43. Rezaee Jordehi, A. Particle Swarm Optimisation with Opposition Learning-Based Strategy: An Efficient Optimisation Algorithm for Day-Ahead Scheduling and Reconfiguration in Active Distribution Systems. Soft Comput. 2020, 24, 18573–18590. [Google Scholar] [CrossRef]
  44. Nguyen, T.T. A Novel Metaheuristic Method Based on Artificial Ecosystem-Based Optimization for Optimization of Network Reconfiguration to Reduce Power Loss. Soft Comput. 2021, 25, 14729–14740. [Google Scholar] [CrossRef]
  45. Routray, A.; Mistry, K.D.; Arya, S.R. Power Loss Minimization in Radial Distribution Systems with Obstructed Solar Astronomical Model and Temperature Effect Using Grey Wolf Optimization Technique. Energy Sources Part A Recovery Util. Environ. Eff. 2020, 1–20. [Google Scholar] [CrossRef]
  46. Yang, X.-S. Flower Pollination Algorithm for Global Optimization. In Unconventional Computation and Natural Computation; Springer: Berlin/Heidelberg, Germany, 2012; pp. 240–249. [Google Scholar]
  47. Chen, Y.; Pi, D. An Innovative Flower Pollination Algorithm for Continuous Optimization Problem. Appl. Math Model 2020, 83, 237–265. [Google Scholar] [CrossRef]
  48. Mahendran, G.; Govindaraju, C. Flower Pollination Algorithm for Distribution System Phase Balancing Considering Variable Demand. Microprocess Microsyst. 2020, 74, 103008. [Google Scholar] [CrossRef]
  49. Koupaei, J.A.; Hosseini, S.M.M.; Ghaini, F.M.M. A New Optimization Algorithm Based on Chaotic Maps and Golden Section Search Method. Eng. Appl. Artif Intell. 2016, 50, 201–214. [Google Scholar] [CrossRef]
  50. Kalra, M.; Katyal, S.; Singh, R. A Tent Map and Logistic Map Based Approach for Chaos-Based Image Encryption and Decryption. In Innovations in Computer Science and Engineering; Springer: Berlin/Heidelberg, Germany, 2019; pp. 159–165. [Google Scholar]
Figure 1. Smart city architecture based on IoT.
Energies 16 02454 g001
Figure 2. Operational features of smart grid in smart cities.
Energies 16 02454 g002
Figure 3. Flow chart of the CGFA.
Energies 16 02454 g003
Figure 4. IEEE 33-bus system.
Energies 16 02454 g004
Figure 5. Percentage loss savings of different algorithms in an IEEE 33-bus system.
Energies 16 02454 g005
Figure 6. IEEE 69-bus system.
Energies 16 02454 g006
Figure 7. (a) Comparison of the convergence speeds of all methods and the proposed technique for IEEE 69 bus system; (b) magnified and minimized views for scenario 3.
Energies 16 02454 g007
Figure 8. Percentage loss savings of different algorithms in an IEEE 69-bus system.
Energies 16 02454 g008
Figure 9. IEEE 119-bus system.
Energies 16 02454 g009
Figure 10. Percentage loss savings of different algorithms in an IEEE 119-bus system.
Energies 16 02454 g010
Figure 11. Normalized computation time for IEEE 119-bus system for all scenarios.
Energies 16 02454 g011
Figure 12. Smart power system in smart cities.
Energies 16 02454 g012
Figure 13. Practical Indian 52-bus system of smart city.
Energies 16 02454 g013
Figure 14. Percentage loss savings of different algorithms in Indian 52-bus system.
Energies 16 02454 g014
Figure 15. Individual power losses on all lines of an Indian 52-bus system.
Energies 16 02454 g015
Table 1. Comparative studies on the merits and demerits of algorithms, as found in literature.
AlgorithmsObjectivesMeritsDemerits
Evolutionary PSO [26,32]Cost minimizationSegregation of different DN scenarios has been validated in a proper manner.Computational burden seems to be greater.
Modified PSO [27]Loss minimizationSimplified modelling of constraints is considered.Power balance limits are missing.
Enhanced GA [28]Loss minimizationDNR cope with meshed conditions.Short-circuit consequences might be present.
Improved HSA [29]Loss minimizationLarger systems could be managed with this method.The iterative method looks to be complex.
Modified TLBO [30]Benefit maximizationBus injection to branch current matrix formulation has been formulated clearly.However, the computation method requires more memory space.
Fuzzy FPA [31]Loss minimizationSwitching probability is made to be adaptive.Local trapping of solution might occur.
Table 2. Description of scenarios 1, 2, and 3 for all test systems.
Scenario 1Scenario 2Scenario 3
IEEE 33Bus 29Line 19Bus 29 and Line 19
IEEE 69Bus 60Line 33Bus 60 and Line 33
IEEE 119Bus 50Line 23Bus 50 and Line 23
Indian 52Bus 27Line 16Bus 27 and Line 16
Table 3. Implementation parameters of the proposed algorithm.
S. NoDescriptionNotationValue
1Maximum number of iterationsNiter1000
2Golden ratioC0.618
3Probability switchP0.8
4PopulationNs60
Table 4. Specifications of the test systems.
Bus
System
Base kVBase MVATie SwitchesBus Locations for DGBus
Location for ESS
DG Power
(kW)
ESS Power (kW)Base Case
Power Loss(kW)
IEEE 33 12.66100522, 25, 331810, 20, 3030284.2052
IEEE 69 12.66100535, 46, 652710, 20, 3030225.5454
IEEE 119 111001528, 78, 1145510, 20, 30301661.4
Indian 52 111615, 31, 522610, 20, 3030434.7279
Table 5. Optimal tie-switch connections and power losses through the DNR in the IEEE 33-bus system.
DescriptionPerformanceScenario 1Scenario 2Scenario 3
Optimal switch connections6–28, 17–26,
20–14, 18–23,
27–2
6–21, 10–27,
16–26, 11–5,
17–12
11–12, 22–14,
16–15, 13–9,
21–17
FPA Best PL (kW)251.9702282.9817251.8790
CFPA 251.9781281.9715251.8650
GSFA251.9755282.8092251.8836
CGFA251.8613281.5402251.7712
FPAWorst252.3170283.0750252.2258
CFPA 252.3001283.0500252.1845
GSFA252.2170282.9750252.1258
CGFA252.0752282.7756252.0756
FPA Mean252.1384282.9957252.0472
CFPA 252.1234282.8912252.0231
GSFA252.0773282.8424251.9857
CGFA252.0631282.7452251.7812
FPA Standard
deviation
0.08690.03420.0869
CFPA 0.07210.03320.0732
GSFA0.01050.06800.0105
CGFA0.00120.00540.0101
Table 6. Optimal tie-switch connections through reconfiguration in an IEEE 119-bus system.
TieScenario 1Scenario 2Scenario 3
149–58107–2220–39
262–11824–10529–62
398–5343–5622–91
430–40110–8965–106
5114–1426–521–68
656–6047–6651–119
791–1047–45110–92
811–668–4147–27
92–7364–8778–93
1067–1668–7077–44
1127–693–94115–19
1244–8875–6789–90
13106–11329–498–117
1461–8272–11779–113
1538–8960–1373–105
Table 7. Optimal tie-switch connections and power loss with the DNR in an SC network.
DescriptionPerformanceScenario 1Scenario 2Scenario 3
Optimal switch connections45–40, 5–41,
36–16, 47–34,
10–31, 33–6
49–34, 15–42,
39–33, 5–23,
25–48, 6–40
33–52, 14–40,
5–3, 47–24,
45–10, 15–37
FPABest PL (kW)403.3059427.9742401.6888
CFPA403.2012427.8812401.5564
GSFA402.8933427.8438401.2764
CGFA402.7712426.2341401.0012
FPAWorst403.8846428.6163402.2675
CFPA403.8512428.4321402.2512
GSFA402.8933427.8438401.2764
CGFA402.7765427.5432401.1234
FPAMean403.4506428.2615401.8335
CFPA403.3432428.1245401.77654
GSFA403.3023428.0792401.6854
CGFA402.1123427.1343401.5462
FPAStandard
deviation
0.25710.27240.2571
CFPA0.29120.32420.1232
GSFA0.38520.32910.3850
CGFA0.012340.03210.04321
Disclaimer/Publisher’s Note: The statements, opinions and data contained in all publications are solely those of the individual author(s) and contributor(s) and not of MDPI and/or the editor(s). MDPI and/or the editor(s) disclaim responsibility for any injury to people or property resulting from any ideas, methods, instructions or products referred to in the content.

