
Thermal Interface Materials with Hexagonal Boron Nitride and Graphene Fillers in PDMS Matrix: Thermal and Mechanical Properties


1
School of Engineering, Faculty of Technology, University of Sunderland, Sunderland SR6 0DD, UK
2
Versarien, Unit 1, Longhope Business Park, Longhope, Gloucestershire GL17 0QZ, UK
*
Author to whom correspondence should be addressed.
Energies 2023, 16(6), 2522; https://doi.org/10.3390/en16062522
Submission received: 14 February 2023
/
Revised: 27 February 2023
/
Accepted: 2 March 2023
/
Published: 7 March 2023
(This article belongs to the Special Issue Advances in Thermal Interface Materials (TIMs) with 2D Fillers)
Abstract
:This work studies the effects of graphene nanoplatelets (GNPs) and hexagonal boron nitride (hBN) on the thermal and mechanical properties of polydimethylsiloxane (PDMS) matrix for use as thermal interface materials (TIMs). Solution mixing of 10 wt% GNPs and 40 wt% hBN with PDMS produced TIMs with through-plane thermal conductivity (TC) of 1.24 W m−1 K−1 showing a 519% increase relative to the neat matrix. A synergistic effect between GNPs and hBN was particularly demonstrated when in samples with 48 wt% total filler content, 8 wt% hBN was replaced by GNPs, and the TC was increased by 33%. The elongation at break of the hBN (40 wt%)/GNP (8 wt%) samples reached 151%, representing a 160% increase when compared to samples with only 40 wt% hBN. Moreover, the shore hardness of samples containing 40 wt% hBN was 68 A, and the introduction of 8 wt% GNPs caused a decrease to 38 A. DSC measurements on samples filled with hBN and GNPs showed a reduction up to 65% in Ultimate Heat of Curing, which was attributed to the presence of graphene flakes interfering with the curing of the matrix. Graphene was found to be an efficient filler in tuning the thermal and mechanical properties of TIMs.
1. Introduction
The current demand for miniaturised electrical devices, the ever-increasing computing speeds and the broader use of energy-consuming electronics render adequate heat dissipation and thermally efficient packaging of electronic devices a necessity [1,2]. For example, if the operating temperature of a central processing unit (CPU) increases by 10–15 °C, its life can be reduced to half [3]. Improved thermal interface materials (TIMs) can play a key role in overcoming such issues and advancing the applications of high-power electronic and optoelectronic devices [4]. TIMs provide the medium to dissipate heat from high-power-density devices such as LEDs, electric vehicle batteries (>1000 W/cm2 [5]) and other electronics to heat sinks and the environment [3].
Figure 1 shows an exaggerated example of the contact interface between two mating solid surfaces, which is characterised by surface roughness (peaks and valleys), regardless of the surface finish. For moderately compacted interfaces, the actual contact area can be as low as 1–2% of the total area in contact [6], while voids are filled with air which has a low thermal conductivity (TC) of 0.023 W m−1 K−1 [7]. As a result, the efficiency of the heat spreader is highly diminished because only a fraction of its actual surface area is employed to convey heat. The ability of TIMs to conform to the substrate allows the filling of voids between such inconsistently mating surfaces, which provides more efficient heat transfer.
TIM formulation is based on constructing thermally conductive pathways of filler within the polymer matrix [8,9,10]. The matrix is selected according to the intended application and can be, among others, an epoxy resin [11,12,13,14], polyethylene [15,16,17], poly(methyl methacrylate) (PMMA) [18,19,20,21] or silicone such as polydimethylsiloxane (PDMS) [22,23,24,25,26]. For TIMs applications, a low modulus matrix will theoretically exhibit better compliance to uneven surfaces and to materials with different coefficients of thermal expansion that undergo heat cycling. Fillers with exceptionally high TC, such as graphene (~2000 W m−1 K−1) [27] and related 2D materials, are strong candidates in the development of a new generation of TIMs. For the formation of the thermally conductive networks, usually large (up to 84 wt% [28]) amounts of filler are used to achieve the desired properties of the composite; these amounts depend on the type of approach for TIM formulation. In electronics applications, TIMs need to be electrically insulating to prevent short circuits and hardware damage [29].
Hexagonal boron nitride (hBN) is often used as the filler of choice due to its high TC of ~ 220–420 W m−1 K−1 [30,31,32] and exceptional electrical insulation with 5.2 eV band gap and 35 V/μm breakdown strength [33]. Shen et al. [34] used ice templating to orient the filler particles into scaffold-like pathways resulting in a TC of 1.4 W m−1 K−1 at 20 wt% hBN loading in PDMS. Bashir et al. [35] functionalised the hBN micro-filler with different amine (R-NH2) isomers to improve dispersibility and interaction with a thermoplastic polyurethane (TPU) matrix. The highest TC of 2.06 W m−1 K−1 was achieved using the ortho-isomer at 45 wt% hBN loading. Li et al. [36] demonstrated the superiority of boron nitride nanosheets (BNNSs) against spherical, micro-sized boron nitride and obtained PDMS-based TIMs with TC of 1.16 W m−1 K−1 at 35 wt% filler loading. Zhang et al. [26] compared three different sizes (3–5 nm × 1–3 μm, 10–300 nm × 2–3 μm, 300–500 nm × 3–5 μm) of BNNSs dispersed in PDMS and found that the smaller flake sizes produced TIMs with the highest TC of 0.72 W m−1 K−1 at 23.1 wt% loading. The enhanced TC obtained by using the smaller fillers was attributed to the fillers’ higher aspect ratio and larger specific surface area. Self-healing TIMs were produced by Shang et al. [37], who added BNNSs in PDMS via in situ polymerisation. Similarly to the work reported in Ref. [35], amine isomers were used in the functionalisation of the hBN surface to improve its dispersibility in the matrix. The TC of the nanocomposite with 30 wt% filler loading was 1.34 W m−1 K−1; this result could also be attributed to the hot-pressing method by which the samples were cured.
Different approaches have been selected to achieve high TC, such as taking advantage of the synergistic effect (Figure 2) that a combination of fillers of different sizes and shapes can exhibit [38,39,40] or introducing 3D filler structures, such as aerogels [41,42,43,44,45] within the matrix. Other tactics include filler alignment via different methods, such as freezing [46,47]; the use of electric [48,49,50] or magnetic field [51,52,53]; and mechanical means [54], such as extrusion [55,56,57] or spatial confinement forced network assembly (SCFNA) [58,59,60].
Kargar et al. synthesised few-layer-graphene-filled epoxy TIMs with electromagnetic shielding capabilities (shielding efficiency ~46 dB at 1 mm) and TC of 8 W m−1 K−1 for 55 wt% filler loading [61]. They showed that the slightly thicker flakes (~0.35–12 nm) contributed more to the TC when compared to the thinner flakes (~0.35–3 nm). Both flake types had 8–10 μm lateral dimensions. Barani et al. [62] surpassed that TC value by achieving 11.2 W m−1 K−1, using graphene with an even higher aspect ratio and lateral dimensions of 15–25 μm.
For the high concentrations of fillers that are required to achieve TIMs, the effect of the fillers on the composite can be multifaceted, influencing not only the thermal but also the rheological and mechanical properties. The mechanical properties of TIMs are of high importance, as these properties influence the resistance to pump-out for bulk thermal paste, while for thermal pads and battery or electronics encapsulants, these properties are crucial for the structural integrity of the TIMs during manufacturing and application. Mechanical characterisation of graphene was reported by Poot and Zant [63] and by Lee et al. [64] in 2008. The former research measured few-layer graphene flakes, while in the latter, monolayer graphene was suspended over circular holes of 1.5 μm and 1 μm diameter. Lee et al. found graphene to have Young’s modulus (E) of ~1 TPa and intrinsic strength of ~130 GPa. These characteristics mean that graphene is a promising reinforcing agent.
Huang et al. added various quantities of graphene oxide nanoribbons in PDMS and found that for filler loadings of up to 0.5 wt%, the TS and E of the nanocomposites increased steadily to 1.93 MPa and 0.902 MPa, respectively, and started to decrease for larger amounts of filler [65]. This behaviour was attributed to poorly dispersed filler and the resulting clusters formed. Song et al. achieved a 153% increase in TS with a concentration of 8 wt% graphene nanoplatelets (GNPs) in a Methyl–Vinyl–Silicone matrix [66].
Zhang et al. prepared a polybutadiene elastomer with 2 wt% octadecylamine modified graphene oxide (OMGO), which exhibited an increase in toughness and elongation at the break by 332% and 191%, respectively [67], with a slight decrease in E. These changes were attributed to the wrinkled morphology of the OMGO flakes, which can have a low bending modulus. It was also argued that the filler might inhibit the cross-linking of the polymer, thus contributing to the softening of the nanocomposite.
Sheshkar et al. performed tensile and compression tests on TIMs based on PDMS filled with 20 μm graphite. They showed a TC of 0.437 W m−1 K−1 at 20 wt% filler loading and a steady increase in the mechanical properties for filler content up to 15% with a compressive stress of 42.55 MPa and 37.8% increase compared to the neat PDMS matrix. When the filler content was increased to 20%, the compressive stress dropped to 34.74 MPa [68]. Ketikis et al. [69] synthesised nanocomposites with a PDMS matrix filled with GNPs and reported a 73% increase in TS with no change in E for filler content of 3 phr. TIMs based on graphene nano paper impregnated with PDMS (with through-plane TC 3.1 W m−1 K−1 at 31.4 wt% filler loading) were produced by Battegazzore and Fina [70]. Part of the fabrication process was to compress some of the TIMs down to almost 25% of their original thickness during the cross-linking stage. The samples that had undergone compression exhibited very high E at 148 MPa, which is higher than what was achieved by the uncompressed samples (52 MPa), while the TS (1.34 MPa) also almost tripled in comparison to uncompressed samples (0.45 MPa).
In TIMs specifically, the contribution of graphene to the overall properties of the system can be considered two-fold, as graphene can influence both the thermal and mechanical properties of the matrix. It is evident from the aforementioned literature data that graphene and other carbon-based 2D materials can be used in small amounts to benefit the host matrix, especially in the cases of epoxy-based nanocomposites. However, and to the best of our knowledge, little research exists on the mechanical properties of TIMs made with a combination of fillers within a PDMS matrix.
In this paper, the synergistic effect and superiority of graphene are demonstrated by a series of TC measurements, while selected TIM formulations are tested to investigate the effect of graphene on the mechanical properties of the nanocomposites and to show that graphene can be used to produce soft TIMs with high filler content. A comparison of the thermal and mechanical properties between different PDMS-based TIMs discussed in the literature and in the present work is included in Table S1.
2. Materials and Methods
2.1. Materials
Sylgard 184 silicone elastomer was obtained from Dow. This is a two-part PDMS prepolymer system, consisting of mainly a base vinyl-terminated PDMS prepolymer or oligomer, containing a platinum catalyst (Part A) (CAS No. 68083-19-2) and a cross-linking agent, a methylhydrosiloxane-co-dimethylsiloxane trimethylsiloxy terminated oligomer (Part B) (CAS No. 68988-89-6). According to the manufacturer, the two parts are mixed in a ratio of 10:1 wt/wt. This mixture has a viscosity of 3.5 Pa.s (Brookfield LVF, spindle #4 at 60 rpm).
The cured material has a density of 1.03 g/cm3 with TC ~0.27 W m−1 K−1 and volume resistivity 2.9 × 10¹⁴ Ω cm. The TS and shore hardness of the cured matrix (100 °C) are 6.7 MPa and 43A. hBN platelets supplied by Versarien Plc, Cheltenham, UK were used as micro-filler. The hBN mean particle size is 45 μm with a distribution of D10/D90—20/80 μm and a specific surface area of 0.6 m2/g. GNPs (Nanene-002 grade, Versarien PLC, UK) with lateral size D50(x)/D50(y)~2.16/1.78 μm and thickness D50~14.5 layers were used as nano-filler. The characteristics of the fillers are presented in Table 1. Poly(vinyl acetate) (PVA) used as releasing agent was purchased from East Coast Fiberglass, South Shields, UK.
2.2. Preparation of hBN/PDMS Composites, GNP/PDMS Nanocomposites and hBN/GNP/PDMS Nanocomposites
PDMS part A and part B were weighed in two separate containers in a ratio of 10:1. The different fillers were weighed on a precision balance (Mettler Toledo) and stored in nylon containers. Samples containing single fillers (hBN or GNPs) were named “SF”, and those containing binary fillers (hBN and GNPs) were named “BF”.
For the preparation of SF nanocomposites, hBN or GNPs were first added into a wide borosilicate glass beaker with ethanol. The resulting slurry was sonicated for 20 min at 37 Hz at room temperature (RT) using an Elmasonic P ultrasonicator (Elma Schmidbauer GmbH, Singen, Germany) to break any agglomerates. For the preparation of BF nanocomposites, hBN was added to the SF slurry, and the mixture was sonicated under the same conditions for a further 5 min. Following this, the PDMS prepolymer (part A) was added, and the mixture was manually stirred again under sonication for 5 min. The beaker was placed in an oven at 100 °C for 3 h with 5 min manual stirring intervals every 20 min to remove the solvent completely [71]. When constant weight was achieved, the beaker was removed from the oven and allowed to reach RT (~20 °C). The curing agent was then added, and the mixture was stirred for 15 min at 50 rpm to ensure uniform dispersion and to minimise the introduction of air. The dispersions were degassed for 90 min at vacuum and were then cast onto different moulds, which were treated with a thin coating of PVA release agent [72]. The samples were cured at 150 °C for 1 h, and after demoulding, they were washed with deionised (DI) water to remove any PVA residue and then left to dry at RT.
Large sample batches (>200 gr) were produced to ensure that all tests were run on samples with the same compositions in order to maintain consistency across experiments. The samples were labelled according to their filler type and content as “hBN(α)” or “GNP(β)” for SF samples and “hBN(α)/GNP(β)” for BF samples, where α and β represent the wt% content of hBN and GNPs, respectively.
2.3. Thermal Characterisation of hBN/GNP Nanocomposites
2.3.1. Thermal Conductivity Measurements
The disc-shaped samples intended for TC measurements were produced by casting the uncured slurry on 60 mm diameter circular moulds, which were coated with a PVA release agent. TC measurements were performed according to ASTM C518 [73] by using a FOX50 heat flow meter (TA Instruments, New Castle, DE, USA) over a range of temperatures, as listed in Table 2.
2.3.2. Curing Study by Differential Scanning Calorimetry (DSC)
The DSC curing study of the uncured neat and filled PDMS was carried out using a DSC Q10 from ΤA Instruments. Samples of 10–15 mg were weighed and hermetically sealed into aluminium DSC pans. The sample pans were then put in the DSC cell, previously maintained at RT. All DSC runs were carried out under an N2 atmosphere. The scans were run at a heating rate of 10 °C from RT up to 200 °C.
2.3.3. Thermal Stability Study by Thermogravimetry (TGA)
TGA tests of neat PDMS and nanocomposites were run on a TA Discovery 55 TGA (TA, New Castle, DE, USA) in an N2 atmosphere. Cured samples (1 h at 150 °C) of ~10 mg were placed on a high-temperature pan and heated to 850 °C at a rate of 10 °C/min.
2.4. Mechanical Characterisation of Neat PDMS, hBN/PDMS, GNP/PDMS and hBN/GNP/PDMS Nanocomposites
2.4.1. Tensile Testing
Samples were prepared and tested according to ASTM D412-C [74]. An aluminium [75] tray was devised to contain the nanocomposite in its uncured state and coated with a thin layer of PVA release agent. A stainless-steel die, actuated by a lever-piston arrangement, was used according to the ASTM standard to cut the samples into dumbbell-shaped specimens with a single stroke (Figure 3). The specimens were left to relax for 30 min before being tested.
A ZwickRoell Z010 tensile test machine (ZwickRoell GmbH, Ulm, Germany) was used for the tensile tests, which were run at RT and at 500 mm/min retraction speed. The machine was fitted with grips able to tighten automatically and exert uniform pressure across the sample surfaces. This arrangement allows for the pressure to increase as the tension increases to prevent slippage and failure on the paddle section of the samples [74].
2.4.2. Shore Hardness
The shore hardness of the cured nanocomposites was measured at least 24 h after curing and according to ASTM D2240 [76]. Measurements were taken using a ZwickRoell hand-held recorder at RT and averaged between 5 locations to ensure uniform and representative results. The device used instantly registers the hardness value to avoid distorted results, which could be caused due to relaxation of the location under test.
2.4.3. Rheology
A characteristic that can influence the processability and application of different TIM formulations is viscosity, which can be empirically observed to increase with the addition of large (>10 wt%) amounts of filler to the PDMS matrix. The effects of filler type and wt% content on the viscosity of PDMS-based formulations were studied on a TA HR10 rheometer. Tests were performed on uncured samples containing different quantities of hBN, and GNPs ran at 25 °C and 1 s−1 shear rate using a ø40 mm parallel plate geometry.
2.5. Scanning Electron Microscopy (SEM)
For the preparation of samples for SEM, each specimen was submerged in liquid nitrogen for approximately 10 s and subsequently fractured to obtain freshly exposed surfaces. Shards were sputter coated (~8 nm) using a gold/palladium cathode on an Agar Scientific AGB7340 manual sputter coater (Agar Scientific Ltd., Essex, UK) and viewed in a Hitachi S3000-N (Hitachi, Tookyo, Japan) scanning electron microscope.
3. Results and Discussion
3.1. Thermal Measurements
3.1.1. Thermal Conductivity Tests
Figure 4 shows the measured TC values of neat PDMS and of samples containing hBN or hBN/GNP fillers in PDMS. The neat PDMS showed a TC of 0.2 W m−1 K−1. The addition of 40 wt% hBN to the PDMS matrix resulted in a TC of 0.76 W m−1 K−1. From that point onwards, a further increase in TC was observed for both types of samples (SF and BF). By the addition of only 0.5 wt% hBN, the SF nanocomposites showed an abrupt increase in TC, which jumped to 0.82 W m−1 K−1. In the case of the BF nanocomposites, the addition of 0.5 wt% GNPs to the 40 wt% hBN system caused the TC to drop slightly to 0.75 W m−1 K−1. The drop in TC was probably due to the insufficient amount of GNP flakes interrupting the thermally conductive network of hBN by producing multiple locations with high interfacial resistance. When the total amount of filler reached 48 wt%, the TC of the hBN/PDMS composite decreased to 0.84 W m−1 K−1, while the TC of the hBN (40%)/GNP (8%) nanocomposite increased to 1.12 W m−1 K−1.
On the other hand, the hBN/GNP samples exhibited an increase in TC even at higher loadings, reaching 1.23 W m−1 K−1 at hBN (40%)/GNP (10%) loading. However, when the total filler content was increased to 52 wt%, the TC of BF samples began to decrease at 1.17 W m−1 K−1. The drop of the BF sample’s TC at the 52 wt% filler content can be attributed to the high viscosity (>500 Pa·s) of the uncured nanocomposite, as discussed in the rheology section. This resulted in poor processability, leading to inadequate degassing and agglomerations [35].
The above results demonstrate that the presence of GNPs in the BF nanocomposites facilitates the fabrication of TIMs, which are superior to their SF counterparts. This is because, for the same filler content, better-performing TIMs were produced when GNPs replaced some amount of hBN; moreover, the maximum loading that was achieved in SF TIMs was surpassed in BF TIMs.
3.1.2. DSC Tests
The effect of GNPs and hBN on the curing of PDMS was investigated by performing DSC scans on neat PDMS, SF nanocomposites containing 8 or 15 wt% GNPs or 40 wt% hBN, as well as BF nanocomposites containing 40 wt% hBN and 8 wt% GNPs. The scans were run at a heating rate of 10 °C/min from RT to 200 °C (Figure 5). Typically, a linear PDMS prepolymer containing two vinyl end groups reacts with a cross-linking agent, leading to a three-dimensional cross-linked network. It is well known that for this system, the most probable reaction is the β-addition of silicon hydrogen of cross-linker to the vinyl bond of the PDMS prepolymer. The mechanism of this hydrosilylation reaction is known and reported in the literature [77,78,79].
R-Si-H + CH2 = CH-Si-R1 ---> R-Si-CH2-CH2-Si-R1
The DSC curves shown in Figure 5 are expressed per 1 g PDMS and demonstrate that the introduction of GNPs in PDMS and samples containing hBN creates a tendency of the curing onset (Ti), peak cure (Tp) and final cure (Tf) temperatures to shift to higher values. More specifically, while Tp for neat PDMS is observed at 100 °C, for GNP (8%) and hBN (40%)/GNP (8%) samples, Tp was observed at 133 °C and 117 °C, respectively. As the nano-size and high surface area GNP flakes interrupt cross-linking, a higher curing temperature compensates by increasing the polymer chain mobility and therefore facilitates curing. On the other hand, samples filled only with 40 wt% hBN showed a similar Tp to that of neat PDMS at 101 °C. hBN, due to its large size and low surface area, disrupts the polymer cross-linked network to a smaller extent.
As shown in Table 3, the addition of 8 wt% GNPs caused the Ultimate Heat of Curing (ΔHult) to drop from 28.29 J/g for neat PDMS to 22.37 J/g, representing a 20.92% decrease. Samples containing only 40 wt% hBN exhibited a smaller reduction (9.68%) in ΔHult, which is reported at 25.55 J/g. When the aforementioned amounts of GNPs and hBN were combined, the TIMs showed up to a 64.86% decrease in ΔHult when compared to neat PDMS. A trend can therefore be observed that when GNPs are added to PDMS, and as the GNP/PDMS ratio increases, ΔHult values decrease. On the other hand, hBN has a smaller effect on the curing behaviour of the samples, and this is in accordance with Ref. [80], who reported minimal change in DSC curves apart from a small shift to a lower Tp and concluded that BN content does not affect silicone curing.
3.1.3. TGA Tests
Thermal cycling of a TIM can cause degradation of the material and result in a change in its mechanical and thermal properties [81,82]. The effect of the addition of different fillers to PDMS on the thermal stability of nanocomposites was investigated by testing neat polymer, hBN/PDMS, GNP/PDMS and hBN/GNP/PDMS samples (Figure 6). As can be seen in Figure 6, PDMS-based TIMs containing 40 wt% hBN show increased thermal stability compared to neat PDMS samples, with 5 wt% loss occurring at 414.1 °C for hBN containing composites against 388.3 °C for neat PDMS. The uniform dispersion of particles can inhibit the movement of molecular chain segments, and this can delay the decomposition of the TIM [22]. Moreover, hBN as a ceramic has very high thermal stability (we measured zero weight loss up to 850 °C). Hence the addition of hBN to the matrix results in composites with improved thermal stability, compared to the neat matrix. The high (78.7 wt%) residue at 800 °C of the SF composites is due to the large ceramic filler content that is unable to decompose at this temperature. The addition of 5 wt% GNPs in PDMS does not affect the 5 wt% loss property, which occurs at 388.7 °C. However, when the amount of graphene is increased to 8 wt%, a small reduction in thermal stability can be observed, with 5 wt% loss occurring at 368.8 °C. In BF nanocomposites containing both hBN and GNPs, the thermal stability can be considered to be the same as neat PDMS, with 5 wt% loss occurring at 395.1 °C and 387.9 °C for hBN (40%)/GNP (5%) and hBN (40%)/GNP (8%) samples, respectively. The addition of the nano-filler causes the residue at 800 °C to drop, as can be seen in both Figure 6 and Table 4. More precisely, while neat PDMS decomposes with 54 wt% residues, the addition of 5 wt% and 8 wt% GNPs makes this value drop to 29.2 wt% and 31 wt%, respectively. In BF samples containing both hBN and GNPs, the residue at 800 °C is 55.8 wt% and 56.2 wt% for hBN (40%)/GNP (5%) and hBN (40%)/GNP (8%) samples, respectively, and it closely matches that of neat PDMS.
3.2. Mechanical Measurements
When TIMs are rigid, during their application, there will still be air gaps between the TIM and substrate surfaces, which cause high interface thermal resistance. This, in turn, inhibits efficient heat transport. It is, therefore, important that the TIM surface can deform under small pressure in order to be able to comply with the substrate [34]. In addition, for multifunctional TIMs used for vibration damping, the ability to tailor the TIM’s mechanical properties can be beneficial.
3.2.1. Tensile Tests
In Figure 7a,b, it can be seen that samples made from neat PDMS experienced maximum stress (σm) values of 7.73 MPa at 111.9% maximum strain (εm). The addition of hBN in PDMS caused σm and εm to drop progressively with increasing amounts of filler (Figure 7a), and composites containing 40 wt% hBN exhibited σm = 1.84 Mpa at εm = 58.11%. These values represent a 76.19% and a 48.06% decrease in σm and εm, respectively, when compared to neat PDMS samples. E at 10% strain (ε) of the samples filled with hBN showed an opposite behaviour (Figure 7d), with E gradually increasing from 2.78 MPa for neat PDMS to reach 8.07 MPa for samples filled with 40 wt% hBN. As the amount of hBN increased, the composites became stiffer due to the close packing of the filler. The introduction of GNPs to PDMS (Figure 7b) also caused the σm values to drop increasingly down to 0.93 MPa for samples containing 8 wt% GNPs. However, the GNPs have reverse effects on the stretchability of the nanocomposites, with GNP (8%) samples reaching εm = 243.16%, which represents a 117.3% increase in stretchability compared with neat PDMS samples. In addition, the samples containing 8 wt% GNPs exhibited very low E at 0.37 MPa (Figure 7e). This softening effect of GNPs on PDMS was exploited to alleviate the stiffening caused by the high hBN content and produce softer TIMs. More specifically, different amounts of GNPs were added to slurries containing 40 wt% hBN, and the resulting cured nanocomposites exhibited low σm and increasing values of εm for increasing amounts of graphene (Figure 7c). The hBN (40%)/GNP (8%) samples reached σm = 0.75 MPa at εm = 151.45%, which represents 35.34% and 160.63% increase in εm when compared to neat PDMS and samples filled with 40 wt% hBN, respectively. As expected, E for samples containing 40 wt% hBN and 8 wt% GNPs also remained low at 2.57 MPa (Figure 7f).
3.2.2. Shore Hardness
The averaged SH measurements demonstrated a trend in which the introduction of hBN in the PDMS matrix caused the SH value to increase from 57 A for the neat PDMS to 65 A for samples containing 20 wt% hBN (Figure 8a). Thereinafter, there was a relatively minor increase in SH, namely 66 A and 68 A, for respective samples containing 30 wt% and 40 wt% hBN. The addition of graphene in PDMS (Figure 8b) had a reverse effect, where GNP (0.5%), GNP (5%) and GNP (8%) samples showed SH values of 51 A, 41 A and 15 A, respectively. When graphene was included in samples already containing 40 wt% hBN (Figure 8c), the nanocomposites became softer, as was expected. The addition of only 0.5 wt% GNPs caused SH to drop from 68 A to 65 A. Further increase in nanofiller content caused a gradual drop in SH, with hBN (40%)/GNP (8%) samples exhibiting an average SH of 38 A.
3.2.3. Rheology of Uncured PDMS/hBN, PDMS/GNP and PDMS/hBN/GNP Samples
The addition of low amounts of hBN or GNPs produced composites with viscosity ranging from 3.2 Pa·s and 3.3 Pa·s for 5 wt% samples filled with hBN or GNPs, respectively, to 3.5 Pa·s for samples filled with 8 wt% hBN and 3.9 Pa·s for samples filled with 8 wt% GNPs (Figure 9). At higher filler content, samples filled with 20 wt% hBN were measured at 7.1 Pa·s viscosity, while the composites containing GNPs exhibited a viscosity of 21.9 Pa·s. The 102% difference can be attributed to the high surface area GNP flakes interacting with PDMS. When hBN was replaced with GNPs, the produced samples surpassed in viscosity the samples filled with only hBN, with hBN (48%) and hBN (40%)/GNP (8%) samples measured at 338.2 Pa·s and 361.6 Pa·s, respectively. During sample preparation, it was observed that samples with a viscosity higher than ~300 Pa·s became increasingly difficult to process, and the hBN (40%)/GNP (8%) samples had the highest filler concentration where degassing was achievable. The measured viscosity values are reported in Table 5.
3.3. SEM
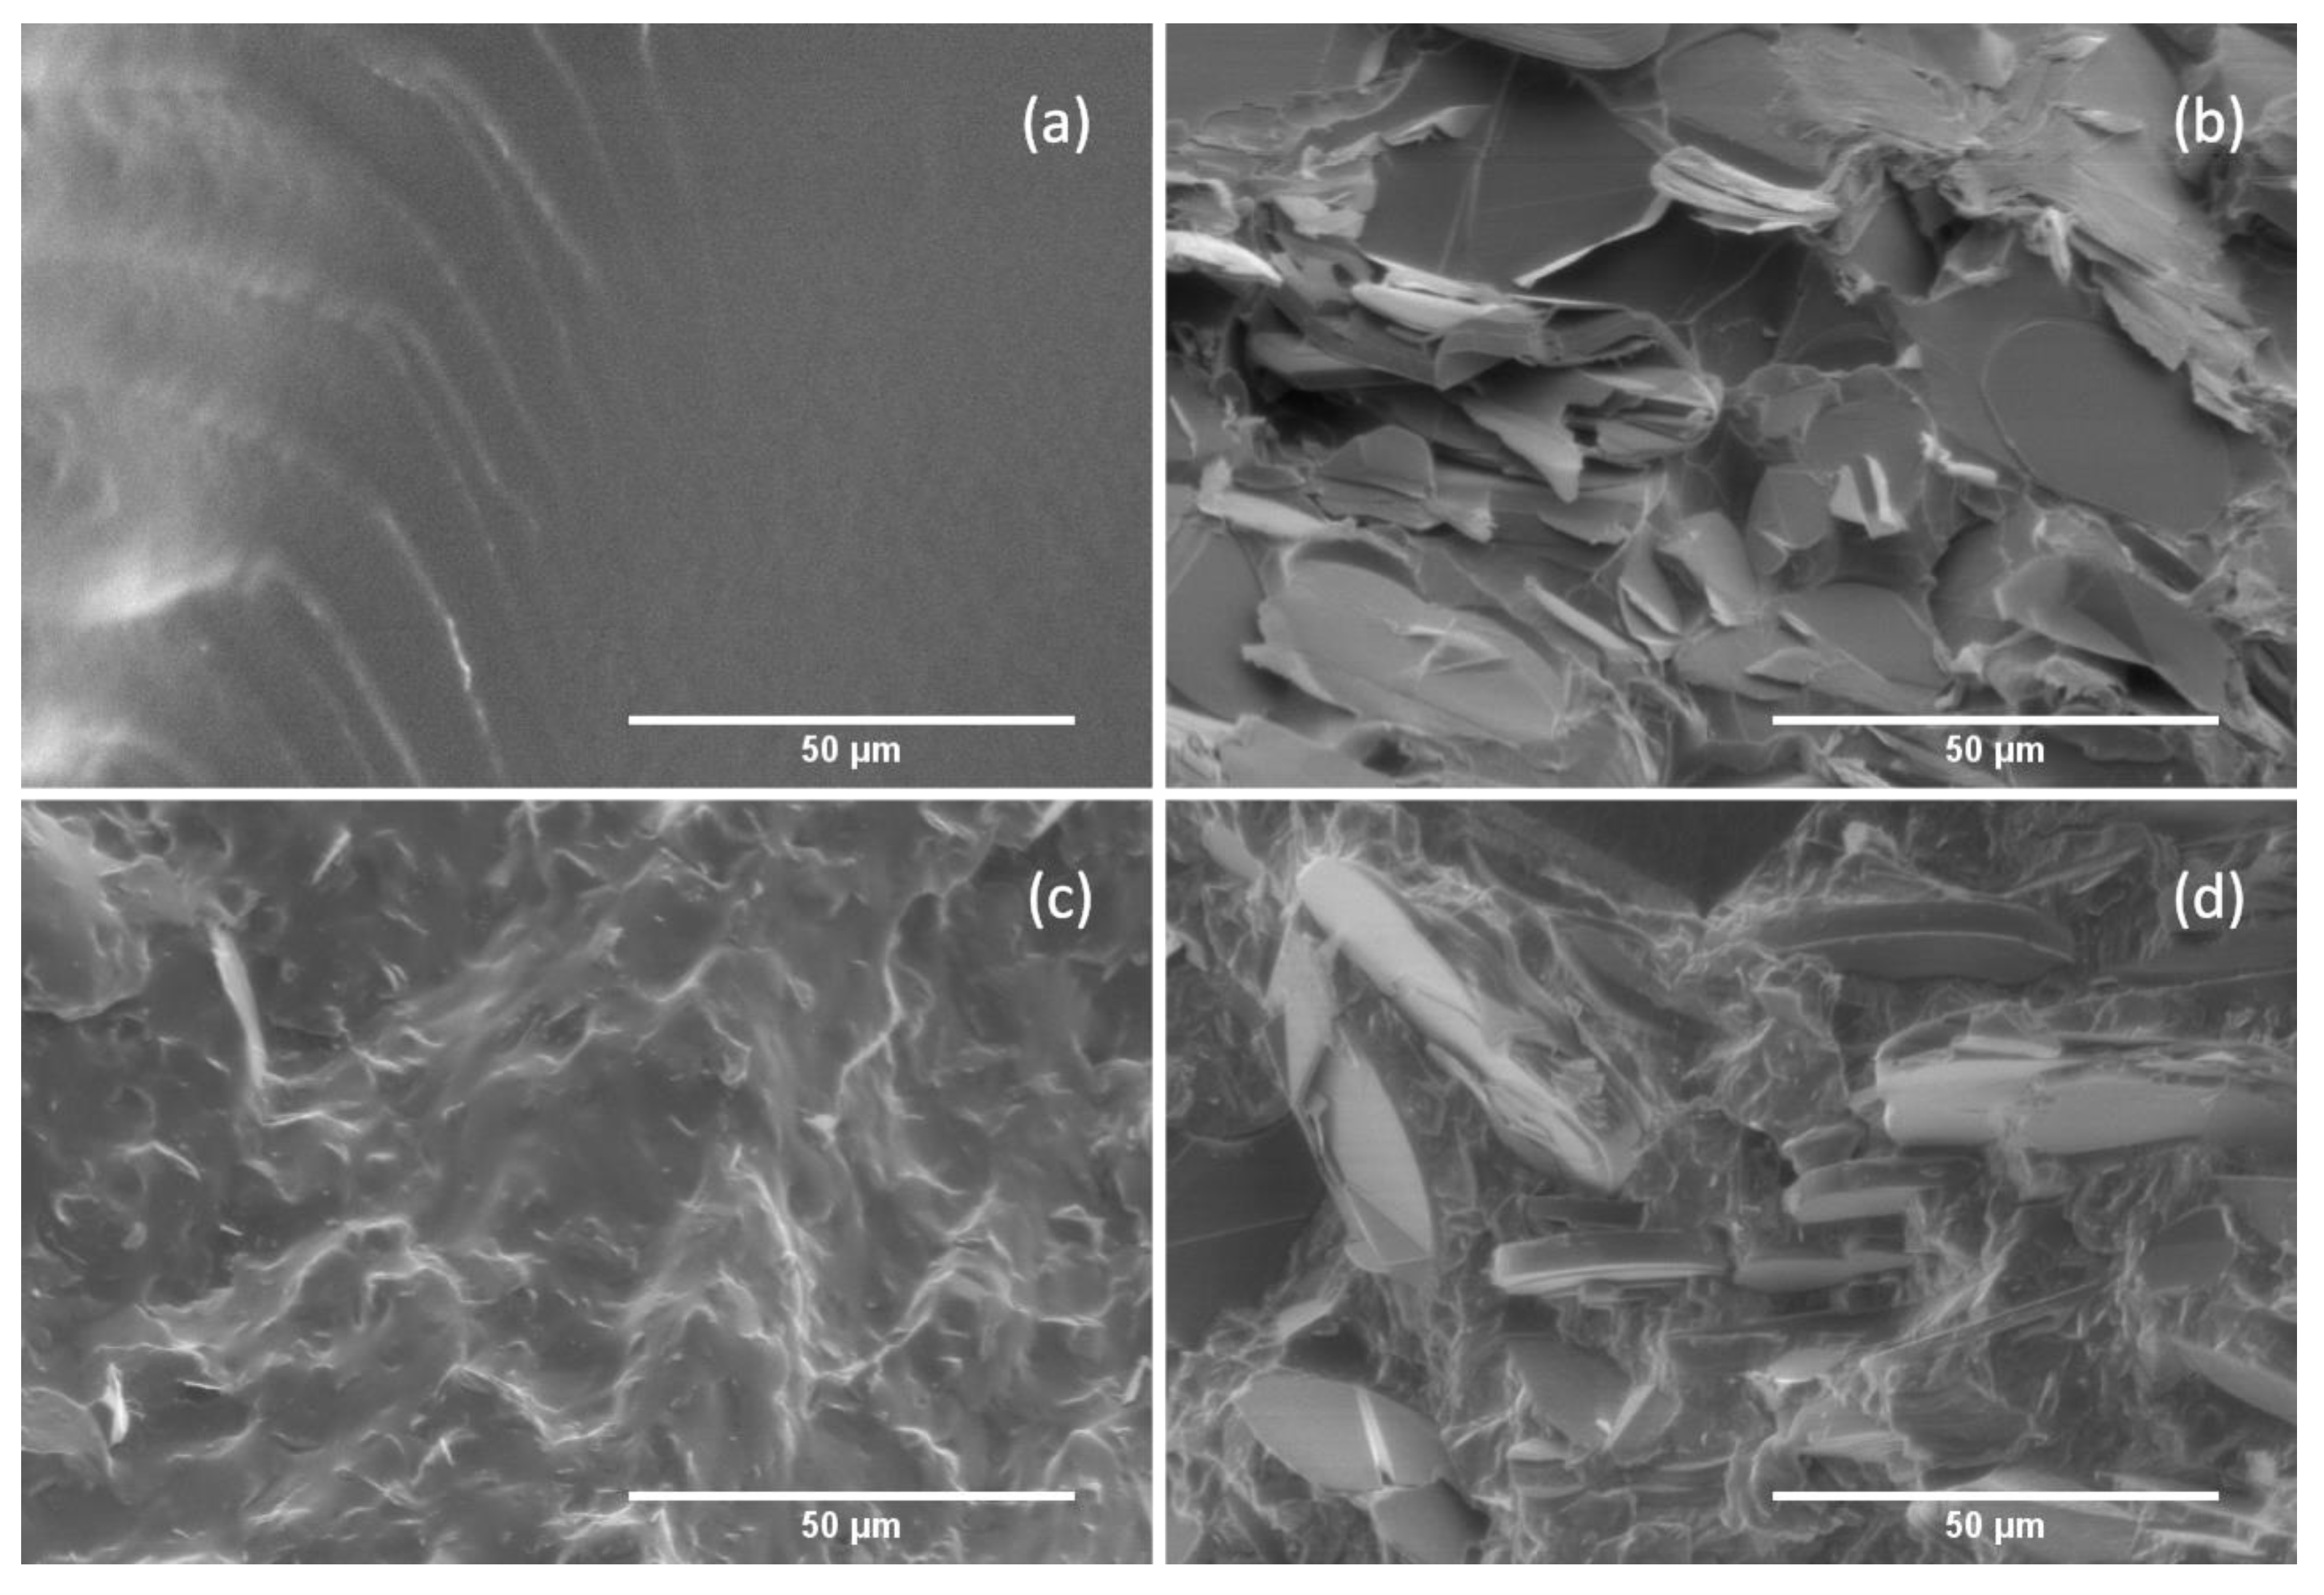
The development of different formulations was visualised through SEM. In Figure 10a) the neat PDMS matrix can be viewed as a smooth continuum with some wrinkle topology. Figure 10b represents 50 wt% loading of randomly dispersed hBN, and this is followed by Figure 10c, showing a sample containing 8 wt% GNPs where the even distribution of the flakes can be confirmed. Figure 10d depicts a sample with 40 wt% hBN and 8 wt% GNPs, where the hBN flakes are randomly distributed within the GNP/PDMS matrix. GNP flakes show good adhesion to PDMS, with the fractured surface only developing smooth bumps created by GNP flakes coated by a layer of PDMS (Figure 10c). In contrast, Figure 10b,d demonstrate the poor interaction of hBN with PDMS, as pristine hBN flakes are exposed after fracture, with cavities and gaps at their interface with the host matrix.
4. Conclusions
It has been shown that the addition of 5 wt% graphene in PDMS filled with 40 wt% hBN develops a synergistic effect between the fillers, achieving higher TC at 0.99 W m−1 K−1 when compared to the TC of samples containing only hBN (0.92 W m−1 K−1) at the same total filler content. Moreover, adding a further 5 wt% of graphene allowed for the production of nanocomposites with easier processability at increased filler content, up to 50 wt%, with a TC of 1.23 W m−1 K−1. It has also been shown that the introduction of graphene in PDMS matrix inhibits curing with hBN (40%)/GNP (8%) nanocomposites showing an 81% decrease in ΔHult, and thus produces soft (38 A) nanocomposites with a low elastic modulus at 2.75 MPa and high elongation of 151%. Another effect of GNPs on the thermal properties of PDMS and PDMS-based TIMs containing hBN is that while hBN increases the thermal stability by 25.8 °C, the addition of 5 wt% GNPs reduces the thermal stability of the nanocomposites to closely match that of neat PDMS. In general, it has been demonstrated that deteriorations in mechanical properties, such as stiffness caused by the high ceramic filler loading required to achieve TIMs, can be counteracted by adding relatively small quantities of graphene, which also increases the TC. Graphene and related layered materials are promising nanofillers for the development of efficient TIMs, and the results presented in this paper can be utilised in tailoring the mechanical and thermal characteristics of TIMs according to the needs of the intended application.
Supplementary Materials
The following supporting information can be downloaded at: https://www.mdpi.com/article/10.3390/en16062522/s1, Table S1: Comparison of the filler type & content, TC, and mechanical properties of the PDMS-based composites described in literature and present work.
Author Contributions
Methodology, S.F.; investigation, S.F.; writing—original draft preparation, S.F.; resources, S.A.H. and P.G.K.; writing—review and editing, P.G.K.; supervision, P.G.K. All authors have read and agreed to the published version of the manuscript.
Funding
This research received no external funding.
Data Availability Statement
The raw/processed data required to reproduce these findings cannot be shared at this time as the data are part of an ongoing study.
Conflicts of Interest
The authors declare no conflict of interest.
References
- Prasher, R.; Chiu, C.-P. Thermal Interface Materials. In Materials for Advanced Packaging; Lu, D., Wong, C.P., Eds.; Springer International Publishing: Cham, Switzerland, 2017; pp. 511–535. [Google Scholar] [CrossRef]
- Xiong, J.; Chen, S.; Choi, Y.; Matsugi, K. Development of polyvinyl alcohol-based carbon nano fiber sheet for thermal interface material. Sci. Rep. 2021, 11, 17183. [Google Scholar] [CrossRef] [PubMed]
- Moore, A.L.; Shi, L. Emerging challenges and materials for thermal management of electronics. Mater. Today 2014, 17, 163–174. [Google Scholar] [CrossRef]
- Chandran, M. Chapter Six-Synthesis, Characterization, and Applications of Diamond Films. In Carbon-Based Nanofillers and Their Rubber Nanocomposites; Yaragalla, S., Mishra, R., Thomas, S., Kalarikkal, N., Maria, H.J., Eds.; Elsevier: Amsterdam, The Netherlands, 2019; pp. 183–224. [Google Scholar] [CrossRef]
- Manno, M.; Yang, B.; Khanna, S.; McCluskey, P.; Bar-Cohen, A. Microcontact-Enhanced Thermoelectric Cooling of Ultrahigh Heat Flux Hotspots. IEEE Trans. Compon. Packag. Manuf. Technol. 2015, 5, 1775–1783. [Google Scholar] [CrossRef]
- Yuan, G.; Li, H.; Shan, B.; Liu, J. Thermal Interface Materials Based on Vertically Aligned Carbon Nanotube Arrays: A Review. Micro Nanosyst. 2019, 11, 3–10. [Google Scholar] [CrossRef]
- Si, Y.; Wang, X.; Dou, L.; Yu, J.; Ding, B. Ultralight and fire-resistant ceramic nanofibrous aerogels with temperature-invariant superelasticity. Sci. Adv. 2018, 4, 8925. [Google Scholar] [CrossRef] [Green Version]
- An, D.; Cheng, S.; Zhang, Z.; Jiang, C.; Fang, H.; Li, J.; Liu, Y.; Wong, C.-P. A polymer-based thermal management material with enhanced thermal conductivity by introducing three-dimensional networks and covalent bond connections. Carbon 2019, 155, 258–267. [Google Scholar] [CrossRef]
- Si, W.; Sun, J.; He, X.; Huang, Y.; Zhuang, J.; Zhang, J.; Murugadoss, V.; Fan, J.; Wu, D.; Guo, Z. Enhancing thermal conductivity via conductive network conversion from high to low thermal dissipation in polydimethylsiloxane composites. J. Mater. Chem. C 2020, 8, 3463–3475. [Google Scholar] [CrossRef]
- Ouyang, Y.; Ding, F.; Bai, L.; Li, X.; Hou, G.; Fan, J.; Yuan, F. Design of network Al2O3 spheres for significantly enhanced thermal conductivity of polymer composites. Compos. Part A Appl. Sci Manuf. 2020, 128, 105673. [Google Scholar] [CrossRef]
- Yue, C.; Guan, L.; Zhang, X.; Wang, Y.; Weng, L. Thermally conductive epoxy/boron nitride composites with high glass transition temperatures for thermal interface materials. Mater. Des. 2021, 212, 110190. [Google Scholar] [CrossRef]
- Shimamura, A.; Hotta, Y.; Hyuga, H.; Hotta, M.; Hirao, K. Improving the thermal conductivity of epoxy composites using a combustion-synthesized aggregated β-Si3N4 filler with randomly oriented grains. Sci. Rep. 2020, 10, 14926. [Google Scholar] [CrossRef]
- Barani, Z.; Mohammadzadeh, A.; Geremew, A.; Huang, C.Y.T.; Coleman, D.; Mangolini, L.; Kargar, F.; Balandin, A. Thermal Properties of the Binary-Filler Hybrid Composites with Graphene and Copper Nanoparticles. Adv. Funct. Mater. 2019, 30, 1904008. [Google Scholar] [CrossRef]
- Li, J.; Zhang, P.; He, H.; Zhai, S.; Xian, Y.; Ma, W.; Wang, L. Enhanced Thermal Transport Properties of Epoxy Resin Thermal Interface Materials. ES Energy Environ. 2019, 4, 41–47. [Google Scholar] [CrossRef]
- Shang, Y.; Yang, G.; Su, F.; Feng, Y.; Ji, Y.; Liu, D.; Yin, R.; Liu, C.; Shen, C. Multilayer polyethylene/ hexagonal boron nitride composites showing high neutron shielding efficiency and thermal conductivity. Compos. Commun. 2020, 19, 147–153. [Google Scholar] [CrossRef]
- Guo, Y.; Cao, C.; Cheng, H.; Chen, Q.; Huang, B.; Luo, F.; Qian, Q. Thermal Performances of UHMWPE/BN Composites Obtained from Different Blending Methods. Adv. Polym. Technol. 2019, 2019, 1–11. [Google Scholar] [CrossRef] [Green Version]
- Jing, J.; Chen, Y.; Shi, S.; Yang, L.; Lambin, P. Facile and scalable fabrication of highly thermal conductive polyethylene/graphene nanocomposites by combining solid-state shear milling and FDM 3D-printing aligning methods. Chem. Eng. J. 2020, 402, 126218. [Google Scholar] [CrossRef]
- Morishita, T.; Okamoto, H. Facile Exfoliation and Noncovalent Superacid Functionalization of Boron Nitride Nanosheets and Their Use for Highly Thermally Conductive and Electrically Insulating Polymer Nanocomposites. ACS Appl. Mater. Interfaces 2016, 8, 27064–27073. [Google Scholar] [CrossRef]
- Vallés, C.; Papageorgiou, D.; Lin, F.; Li, Z.; Spencer, B.F.; Young, R.J.; Kinloch, I.A. PMMA-grafted graphene nanoplatelets to reinforce the mechanical and thermal properties of PMMA composites. Carbon 2020, 157, 750–760. [Google Scholar] [CrossRef] [Green Version]
- Semerci, E.; Bedri, T.E.; Kizilcan, N. Preparation of thermal conductive Poly(methyl methacrylate)/Silicon nitride nanocomposites via click chemistry. Polymer 2021, 212, 123285. [Google Scholar] [CrossRef]
- Oh, H.; Kim, J. Fabrication of polymethyl methacrylate composites with silanized boron nitride by in-situ polymerization for high thermal conductivity. Compos. Sci. Technol. 2019, 172, 153–162. [Google Scholar] [CrossRef]
- Ouyang, Y.; Li, X.; Tian, H.; Bai, L.; Yuan, F. A Novel Branched Al2O3/Silicon Rubber Composite with Improved Thermal Conductivity and Excellent Electrical Insulation Performance. Nanomaterials 2021, 11, 2654. [Google Scholar] [CrossRef]
- Ren, L.; Zeng, X.; Sun, R.; Xu, J.-B.; Wong, C.P. Spray-assisted assembled spherical boron nitride as fillers for polymers with enhanced thermally conductivity. Chem. Eng. J. 2019, 370, 166–175. [Google Scholar] [CrossRef]
- Shen, C.; Wang, H.; Zhang, T.; Zeng, Y. Silica coating onto graphene for improving thermal conductivity and electrical insulation of graphene/polydimethylsiloxane nanocomposites. J. Mater. Sci. Technol. 2019, 35, 36–43. [Google Scholar] [CrossRef]
- Wei, J.; Liao, M.; Ma, A.; Chen, Y.; Duan, Z.; Hou, X.; Li, M.; Jiang, N.; Yu, J. Enhanced thermal conductivity of polydimethylsiloxane composites with carbon fiber. Compos. Commun. 2020, 17, 141–146. [Google Scholar] [CrossRef]
- Zhang, H.; Huang, X.; Jiang, P. Enhanced Thermal Conductivity of Dielectric Polydimethylsiloxane Composites by Size-Controllable Boron Nitride Nanosheets. In Proceedings of the IEEE International Conference on High Voltage Engineering and Application (ICHVE), Beijing, China, 6–10 September 2020. [Google Scholar] [CrossRef]
- Balandin, A. In-plane and cross-plane thermal conductivity of graphene: Applications in thermal interface materials. In Proceedings of the SPIE vol. 8101, Carbon Nanotubes, Graphene, and Associated Devices IV, 810107, San Diego, California, CA, USA, 19 September 2011. [Google Scholar] [CrossRef]
- Witpathomwong, S.; Okhawilai, M.; Jubsilp, C.; Karagiannidis, P.; Rimdusit, S. Highly filled graphite/graphene/carbon nanotube in polybenzoxazine composites for bipolar plate in PEMFC. Int. J. Hyd. Energy 2020, 45, 30898–30910. [Google Scholar] [CrossRef]
- Chen, J.; Huang, X.; Sun, B.; Jiang, P. Highly Thermally Conductive Yet Electrically Insulating Polymer/Boron Nitride Nanosheets Nanocomposite Films for Improved Thermal Management Capability. ACS Nano 2019, 13, 337–345. [Google Scholar] [CrossRef] [PubMed]
- Simpson, A.; Stuckes, A.D. The thermal conductivity of highly oriented pyrolytic boron nitride. J. Phys. C Solid State Phys. 1971, 4, 1710–1718. [Google Scholar] [CrossRef]
- Sichel, E.K.; Miller, R.E.; Abrahams, M.S.; Buiocchi, C.J. Heat capacity and thermal conductivity of hexagonal pyrolytic boron nitride. Phys. Rev. B 1976, 13, 4607–4611. [Google Scholar] [CrossRef]
- Jiang, P.; Qian, X.; Yang, R.; Lindsay, L. Anisotropic thermal transport in bulk hexagonal boron nitride. Phys. Rev. Mater. 2018, 2, 064005. [Google Scholar] [CrossRef]
- Kim, K.K.; Hsu, A.; Jia, X.; Kim, S.M.; Shi, Y.; Dresselhaus, M.; Palacios, T.; Kong, J. Synthesis and Characterization of Hexagonal Boron Nitride Film as a Dielectric Layer for Graphene Devices. ACS Nano 2012, 6, 8583–8590. [Google Scholar] [CrossRef]
- Shen, H.; Cai, C.; Guo, J.; Qian, Z.; Zhao, N.; Xu, J. Fabrication of oriented hBN scaffolds for thermal interface materials. RSC Adv. 2016, 6, 16489–16494. [Google Scholar] [CrossRef]
- Bashir, A.; Maqbool, M.; Lv, R.; Usman, A.; Guo, H.; Aftab, W.; Niu, H.; Liu, M.; Bai, S.-L. Surface modified boron nitride towards enhanced thermal and mechanical performance of thermoplastic polyurethane composite. Compos. B. Eng. 2021, 218, 108871. [Google Scholar] [CrossRef]
- Li, M.; Wang, M.; Hou, X.; Zhan, Z.; Wang, H.; Fu, H.; Lin, C.-T.; Fu, L.; Jiang, N.; Yu, J. Highly thermal conductive and electrical insulating polymer composites with boron nitride. Compos. B. Eng. 2020, 184, 107746. [Google Scholar] [CrossRef]
- Shang, Z.; Ding, D.; Wang, X.; Liu, B.; Chen, Y.; Gong, L.; Liu, Z.; Zhang, Q. High thermal conductivity of self-healing polydimethylsiloxane elastomer composites by the orientation of boron nitride nano sheets. Polym. Adv. Technol. 2021, 32, 4745–4754. [Google Scholar] [CrossRef]
- Zhao, L.; Yan, L.; Wei, C.; Li, Q.; Huang, X.; Wang, Z.; Fu, M.; Ren, J. Synergistic Enhanced Thermal Conductivity of Epoxy Composites with Boron Nitride Nanosheets and Microspheres. J. Phys. Chem. C 2020, 124, 12723–12733. [Google Scholar] [CrossRef]
- Mai, V.-D.; Lee, D.-I.; Park, J.-H.; Lee, D.-S. Rheological Properties and Thermal Conductivity of Epoxy Resins Filled with a Mixture of Alumina and Boron Nitride. Polymers 2019, 11, 597. [Google Scholar] [CrossRef] [PubMed] [Green Version]
- Shao, L.; Shi, L.; Li, X.; Song, N.; Ding, P. Synergistic effect of BN and graphene nanosheets in 3D framework on the enhancement of thermal conductive properties of polymeric composites. Compos. Sci. Technol. 2016, 135, 83–91. [Google Scholar] [CrossRef]
- Guo, F.; Shen, X.; Zhou, J.; Liu, D.; Zheng, Q.; Yang, J.; Jia, B.; Lau, A.K.T.; Kim, J.-K. Highly Thermally Conductive Dielectric Nanocomposites with Synergistic Alignments of Graphene and Boron Nitride Nanosheets. Adv. Funct. Mater. 2020, 30, 1910826. [Google Scholar] [CrossRef]
- Lin, Y.; Chen, J.; Dong, S.; Wu, G.; Jiang, P.; Huang, X. Wet-resilient graphene aerogel for thermal conductivity enhancement in polymer nanocomposites. J. Mater. Sci. Technol. 2021, 83, 219–227. [Google Scholar] [CrossRef]
- Song, P.; Liu, B.; Liang, C.; Ruan, K.; Qiu, H.; Ma, Z.; Guo, Y.; Gu, J. Flexible Cellulose-Derived Carbon Aerogel@Reduced Graphene Oxide/PDMS Composites with Outstanding EMI Shielding Performances and Excellent Thermal Conductivities. Nano-Micro Lett. 2021, 13, 91. [Google Scholar] [CrossRef]
- Zhang, C.; Huang, R.; Wang, P.; Wang, Y.; Zhou, Z.; Zhang, H.; Wu, Z.; Li, L. Highly Compressible, Thermally Conductive, yet Electrically Insulating Fluorinated Graphene Aerogel. ACS Appl. Mater. Interfaces 2020, 12, 58170–58178. [Google Scholar] [CrossRef]
- Zhang, W.; Kong, Q.-Q.; Tao, Z.; Wei, J.; Xie, L.; Cui, X.; Chen, C.-M. 3D Thermally Cross-Linked Graphene Aerogel–Enhanced Silicone Rubber Elastomer as Thermal Interface Material. Adv. Mater. Interfaces 2019, 6, 1900147. [Google Scholar] [CrossRef]
- Hou, X.; Chen, Y.; Lv, L.; Dai, W.; Zhao, S.; Wang, Z.; Fu, L.; Lin, C.-T.; Jiang, N.; Yu, J. High-Thermal-Transport-Channel Construction within Flexible Composites via the Welding of Boron Nitride Nanosheets. ACS Appl. Nano Mater. 2019, 2, 360–368. [Google Scholar] [CrossRef]
- Han, J.; Du, G.; Gao, W.; Bai, H. An Anisotropically High Thermal Conductive Boron Nitride/Epoxy Composite Based on Nacre-Mimetic 3D Network. Adv. Funct. Mater. 2019, 29, 1900412. [Google Scholar] [CrossRef]
- Cho, H.-B.; Nakayama, T.; Suematsu, H.; Suzuki, T.; Jiang, W.; Niihara, K.; Song, E.; Eom, N.S.A.; Kim, S.; Choa, Y.-H. Insulating polymer nanocomposites with high-thermal-conduction routes via linear densely packed boron nitride nanosheets. Compos. Sci. Technol. 2016, 129, 205–213. [Google Scholar] [CrossRef]
- Goto, T.; Ito, T.; Mayumi, K.; Maeda, R.; Shimizu, Y.; Hatakeyama, K.; Ito, K.; Hakuta, Y.; Terashima, K. Movable cross-linked elastomer with aligned carbon nanotube/nanofiber as high thermally conductive tough flexible composite. Compos. Sci. Technol. 2020, 190, 108009. [Google Scholar] [CrossRef]
- Kim, K.; Ju, H.; Kim, J. Filler orientation of boron nitride composite via external electric field for thermal conductivity enhancement. Ceram. Int. 2016, 42, 8657–8663. [Google Scholar] [CrossRef]
- Kim, K.; Ju, H.; Kim, J. Vertical particle alignment of boron nitride and silicon carbide binary filler system for thermal conductivity enhancement. Compos. Sci. Technol. 2016, 123, 99–105. [Google Scholar] [CrossRef]
- Gurijala, A.; Zando, R.B.; Faust, J.L.; Barber, J.R.; Zhang, L.; Erb, R.M. Castable and Printable Dielectric Composites Exhibiting High Thermal Conductivity via Percolation-Enabled Phonon Transport. Matter 2020, 2, 1015–1024. [Google Scholar] [CrossRef]
- Yuan, C.; Duan, B.; Li, L.; Xie, B.; Huang, M.; Luo, X. Thermal Conductivity of Polymer-Based Composites with Magnetic Aligned Hexagonal Boron Nitride Platelets. ACS Appl. Mater. Interfaces 2015, 7, 13000–13006. [Google Scholar] [CrossRef]
- Hu, Q.; Bai, X.; Zhang, C.; Zeng, X.; Huang, Z.; Li, J.; Zhang, Y. Oriented BN/Silicone rubber composite thermal interface materials with high out-of-plane thermal conductivity and flexibility. Compos. Part A Appl. Sci. Manuf. 2022, 152, 106681. [Google Scholar] [CrossRef]
- Liu, M.; Chiang, S.-W.; Chu, X.; Li, J.; Gan, L.; He, Y.; Li, B.; Kang, F.; Du, H. Polymer composites with enhanced thermal conductivity via oriented boron nitride and alumina hybrid fillers assisted by 3-D printing. Ceram. Int. 2020, 46, 20810–20818. [Google Scholar] [CrossRef]
- Zhang, X.; Zhang, J.; Xia, L.; Li, C.; Wang, J.; Xu, F.; Zhang, X.; Wu, H.; Guo, S. Simple and Consecutive Melt Extrusion Method to Fabricate Thermally Conductive Composites with Highly Oriented Boron Nitrides. ACS Appl. Mater. Interfaces 2017, 9, 22977–22984. [Google Scholar] [CrossRef] [PubMed]
- Zhang, X.; Zhang, J.; Zhang, X.; Li, C.; Wang, J.; Li, H.; Xia, L.; Wu, H.; Guo, S. Toward high efficiency thermally conductive and electrically insulating pathways through uniformly dispersed and highly oriented graphites close-packed with SiC. Compos. Sci. Technol. 2017, 150, 217–226. [Google Scholar] [CrossRef]
- He, X.; Huang, Y.; Wan, C.; Zheng, X.; Kormakov, S.; Gao, X.; Sun, J.; Zheng, X.; Wu, D. Enhancing thermal conductivity of polydimethylsiloxane composites through spatially confined network of hybrid fillers. Compos. Sci. Technol. 2019, 172, 163–171. [Google Scholar] [CrossRef]
- He, X.; Huang, Y.; Liu, Y.; Zheng, X.; Kormakov, S.; Sun, J.; Zhuang, J.; Gao, X.; Wu, D. Improved thermal conductivity of polydimethylsiloxane/short carbon fiber composites prepared by spatial confining forced network assembly. J Mater Sci 2018, 53, 14299–14310. [Google Scholar] [CrossRef]
- Wu, D.; Gao, X.; Sun, J.; Wu, D.; Liu, Y.; Kormakov, S.; Zheng, X.; Wu, L.; Huang, Y.; Guo, Z. Spatial Confining Forced Network Assembly for preparation of high-performance conductive polymeric composites. Compos. Part A Appl. Sci. Manuf. 2017, 102, 88–95. [Google Scholar] [CrossRef]
- Kargar, F.; Barani, Z.; Balinskiy, M.G.; Magana, A.S.; Lewis, J.S.; Balandin, A.A. Graphene Composites with Dual Functionality: Electromagnetic Shielding and Thermal Management, Aug. 2018. Available online: https://www.researchgate.net/publication/326988625_Graphene_Composites_with_Dual_Functionality_Electromagnetic_Shielding_and_Thermal_Management (accessed on 8 January 2022).
- Barani, Z.; Kargar, F.; Mohammadzadeh, A.; Naghibi, S.; Lo, C.; Rivera, B.; Balandin, A.A. Multifunctional Graphene Composites for Electromagnetic Shielding and Thermal Management at Elevated Temperatures. Adv. Electron. Mater. 2020, 6, 2000520. [Google Scholar] [CrossRef]
- Poot, M.; van der Zant, H.S.J. Nanomechanical properties of few-layer graphene membranes. Appl. Phys. Lett. 2008, 92, 063111. [Google Scholar] [CrossRef]
- Lee, C.; Wei, X.; Kysar, J.W.; Hone, J. Measurement of the Elastic Properties and Intrinsic Strength of Monolayer Graphene. Science 2008, 321, 385–388. [Google Scholar] [CrossRef]
- Huang, N.-J.; Zang, J.; Zhang, G.-D.; Guan, L.-Z.; Li, S.-N.; Zhao, L.; Tang, L.-C. Efficient interfacial interaction for improving mechanical properties of polydimethylsiloxane nanocomposites filled with low content of graphene oxide nanoribbons. RSC Adv. 2017, 7, 22045–22053. [Google Scholar] [CrossRef] [Green Version]
- Song, Y.; Yu, J.; Yu, L.; Alam, F.E.; Dai, W.; Li, C.; Jiang, N. Enhancing the thermal, electrical, and mechanical properties of silicone rubber by addition of graphene nanoplatelets. Mater. Des. 2015, 88, 950–957. [Google Scholar] [CrossRef]
- Zhang, Y.; Mark, J.E.; Zhu, Y.; Ruoff, R.S.; Schaefer, D.W. Mechanical properties of polybutadiene reinforced with octadecylamine modified graphene oxide. Polymer 2014, 55, 5389–5395. [Google Scholar] [CrossRef]
- Sheshkar, N.; Verma, G.; Pandey, C.; Sharma, A.K.; Gupta, A. Enhanced thermal and mechanical properties of hydrophobic graphite-embedded polydimethylsiloxane composite. J. Polym Res. 2021, 28, 403. [Google Scholar] [CrossRef]
- Ketikis, P.; Damopoulos, E.; Pilatos, G.; Klonos, P.; Kyritsis, A.; Tarantili, P.A. Preparation by solution mixing and characterization of condensation type poly(dimethyl siloxane)/graphene nanoplatelets composites. J. Compos. Mater. 2022, 56, 251–266. [Google Scholar] [CrossRef]
- Battegazzore, D.; Fadda, E.; Fina, A. Flexible and high thermal conductivity composites based on graphite nanoplates paper impregnated with polydimethylsiloxane. J. Compos. Sci. 2021, 5, 309. [Google Scholar] [CrossRef]
- Kuang, H.; Li, Y.; Huang, S.; Shi, L.; Zhou, Z.; Gao, C.; Zeng, X.; Pandey, R.; Wang, X.; Dong, S.; et al. Piezoelectric boron nitride nanosheets for high performance energy harvesting devices. Nano Energy 2021, 80, 105561. [Google Scholar] [CrossRef]
- Karlsson, J.M.; Haraldsson, T.; Carlborg, C.F.; Hansson, J.; Russom, A.; van der Wijngaart, W. Fabrication and transfer of fragile 3D PDMS microstructures. J. Micromech. Microeng. 2012, 22, 085009. [Google Scholar] [CrossRef]
- Standard Test Method for Steady-State Thermal Transmission Properties by Means of the Heat Flow Meter Apparatus. Available online: https://www.astm.org/c0518-04.html (accessed on 9 January 2022).
- Standard Test Methods for Vulcanized Rubber and Thermoplastic Elastomers—Tension. Available online: https://www.astm.org/d0412-16r21.html (accessed on 2 December 2021).
- Yousuff, C.M.; Danish, M.; Ho, E.T.W.; Basha, I.H.K.; Hamid, N.H.B. Study on the Optimum Cutting Parameters of an Aluminum Mold for Effective Bonding Strength of a PDMS Microfluidic Device. Micromachines 2017, 8, 8. [Google Scholar] [CrossRef] [Green Version]
- Standard Test Method for Rubber Property—Durometer Hardness. Available online: https://www.astm.org/d2240-00.html (accessed on 4 January 2022).
- Bardelli, T.; Marano, C.; Vangosta, F.B. Polydimethylsiloxane crosslinking kinetics: A systematic study on Sylgard184 comparing rheological and thermal approaches. J. Appl. Polym. Sci. 2021, 138, 51013. [Google Scholar] [CrossRef]
- Esteves, A.C.C.; Brokken-Zijp, J.; Laven, J.; Huinink, H.P.; Reuvers, N.J.W.; Van, M.P.; de With, G. Influence of cross-linker concentration on the cross-linking of PDMS and the network structures formed. Polymer 2009, 50, 3955–3966. [Google Scholar] [CrossRef]
- Sheats, J.E.; Carraher, C.E.; Pittman, C.U.; Zeldin, M.; Culbertson, B.M. Inorganic and Organometallic Polymers—An Overview. In Metal-Containing Polymeric Materials; Pittman, C.U., Carraher, C.E., Zeldin, M., Sheats, J.E., Culbertson, B.M., Eds.; Springer: Boston, MA, USA, 1990; pp. 3–37. [Google Scholar] [CrossRef]
- Zhou, W.-Y.; Qi, S.-H.; Zhao, H.-Z.; Liu, N.-L. Thermally conductive silicone rubber reinforced with boron nitride particle. Polym. Compos. 2007, 28, 23–28. [Google Scholar] [CrossRef]
- Khuu, V.; Osterman, M.; Bar-Cohen, A.; Pecht, M. Effects of Temperature Cycling and Elevated Temperature/Humidity on the Thermal Performance of Thermal Interface Materials. IEE Trans. Device Mater. Reliab. 2009, 9, 379–391. [Google Scholar] [CrossRef]
- Lewis, J.S.; Perrier, T.; Mohammadzadeh, A.; Kargar, F.; Balandin, A.A. Power Cycling and Reliability Testing of Epoxy-Based Graphene Thermal Interface Materials. C 2020, 6, 2. [Google Scholar] [CrossRef]
Figure 1.
Working principle of a TIM: (a) the heat source/heat sink interface without TIM; (b) the same interface with a TIM filling the voids within the bond line thickness (BLT) region; (c) TIM application in a CPU.
Figure 1.
Working principle of a TIM: (a) the heat source/heat sink interface without TIM; (b) the same interface with a TIM filling the voids within the bond line thickness (BLT) region; (c) TIM application in a CPU.
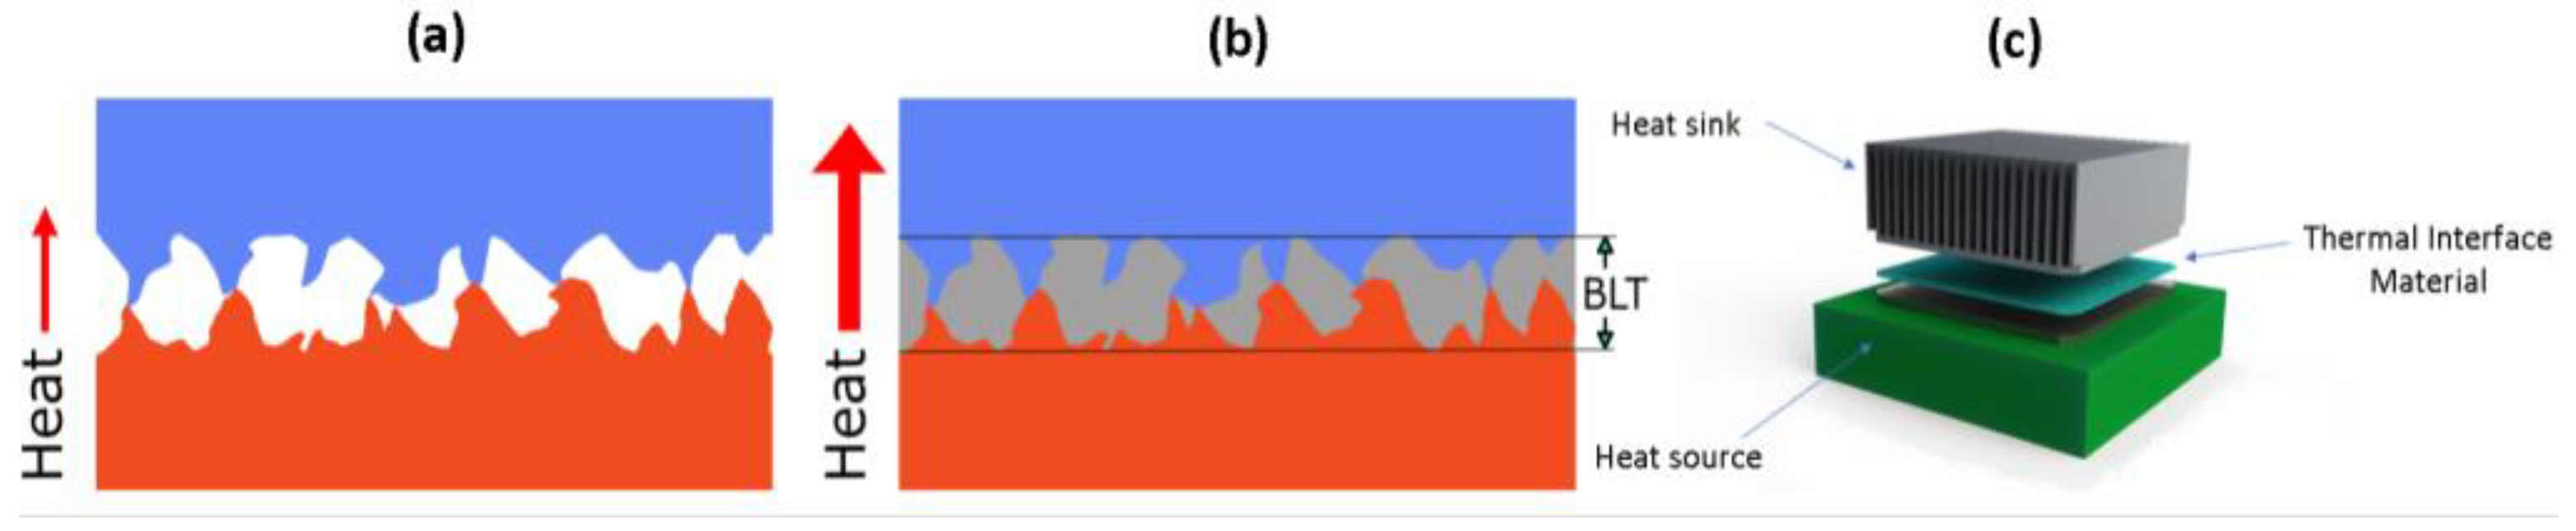
Figure 2.
Thermally conductive pathway formation due to filler alignment and synergistic effect between platelet (red) and spherical (green) shaped particles. The TC increases from (a) to (d): (a) Single filler (spherical or platelet-shape) system with relatively low TC, (b) Synergistic effect of a combination of platelet and spherical-shape fillers with higher TC, (c) Aligned, platelet-shape fillers with higher TC, (d) Combination of synergistic effect of the different shape fillers and alignment of platelets in a system with very high TC.
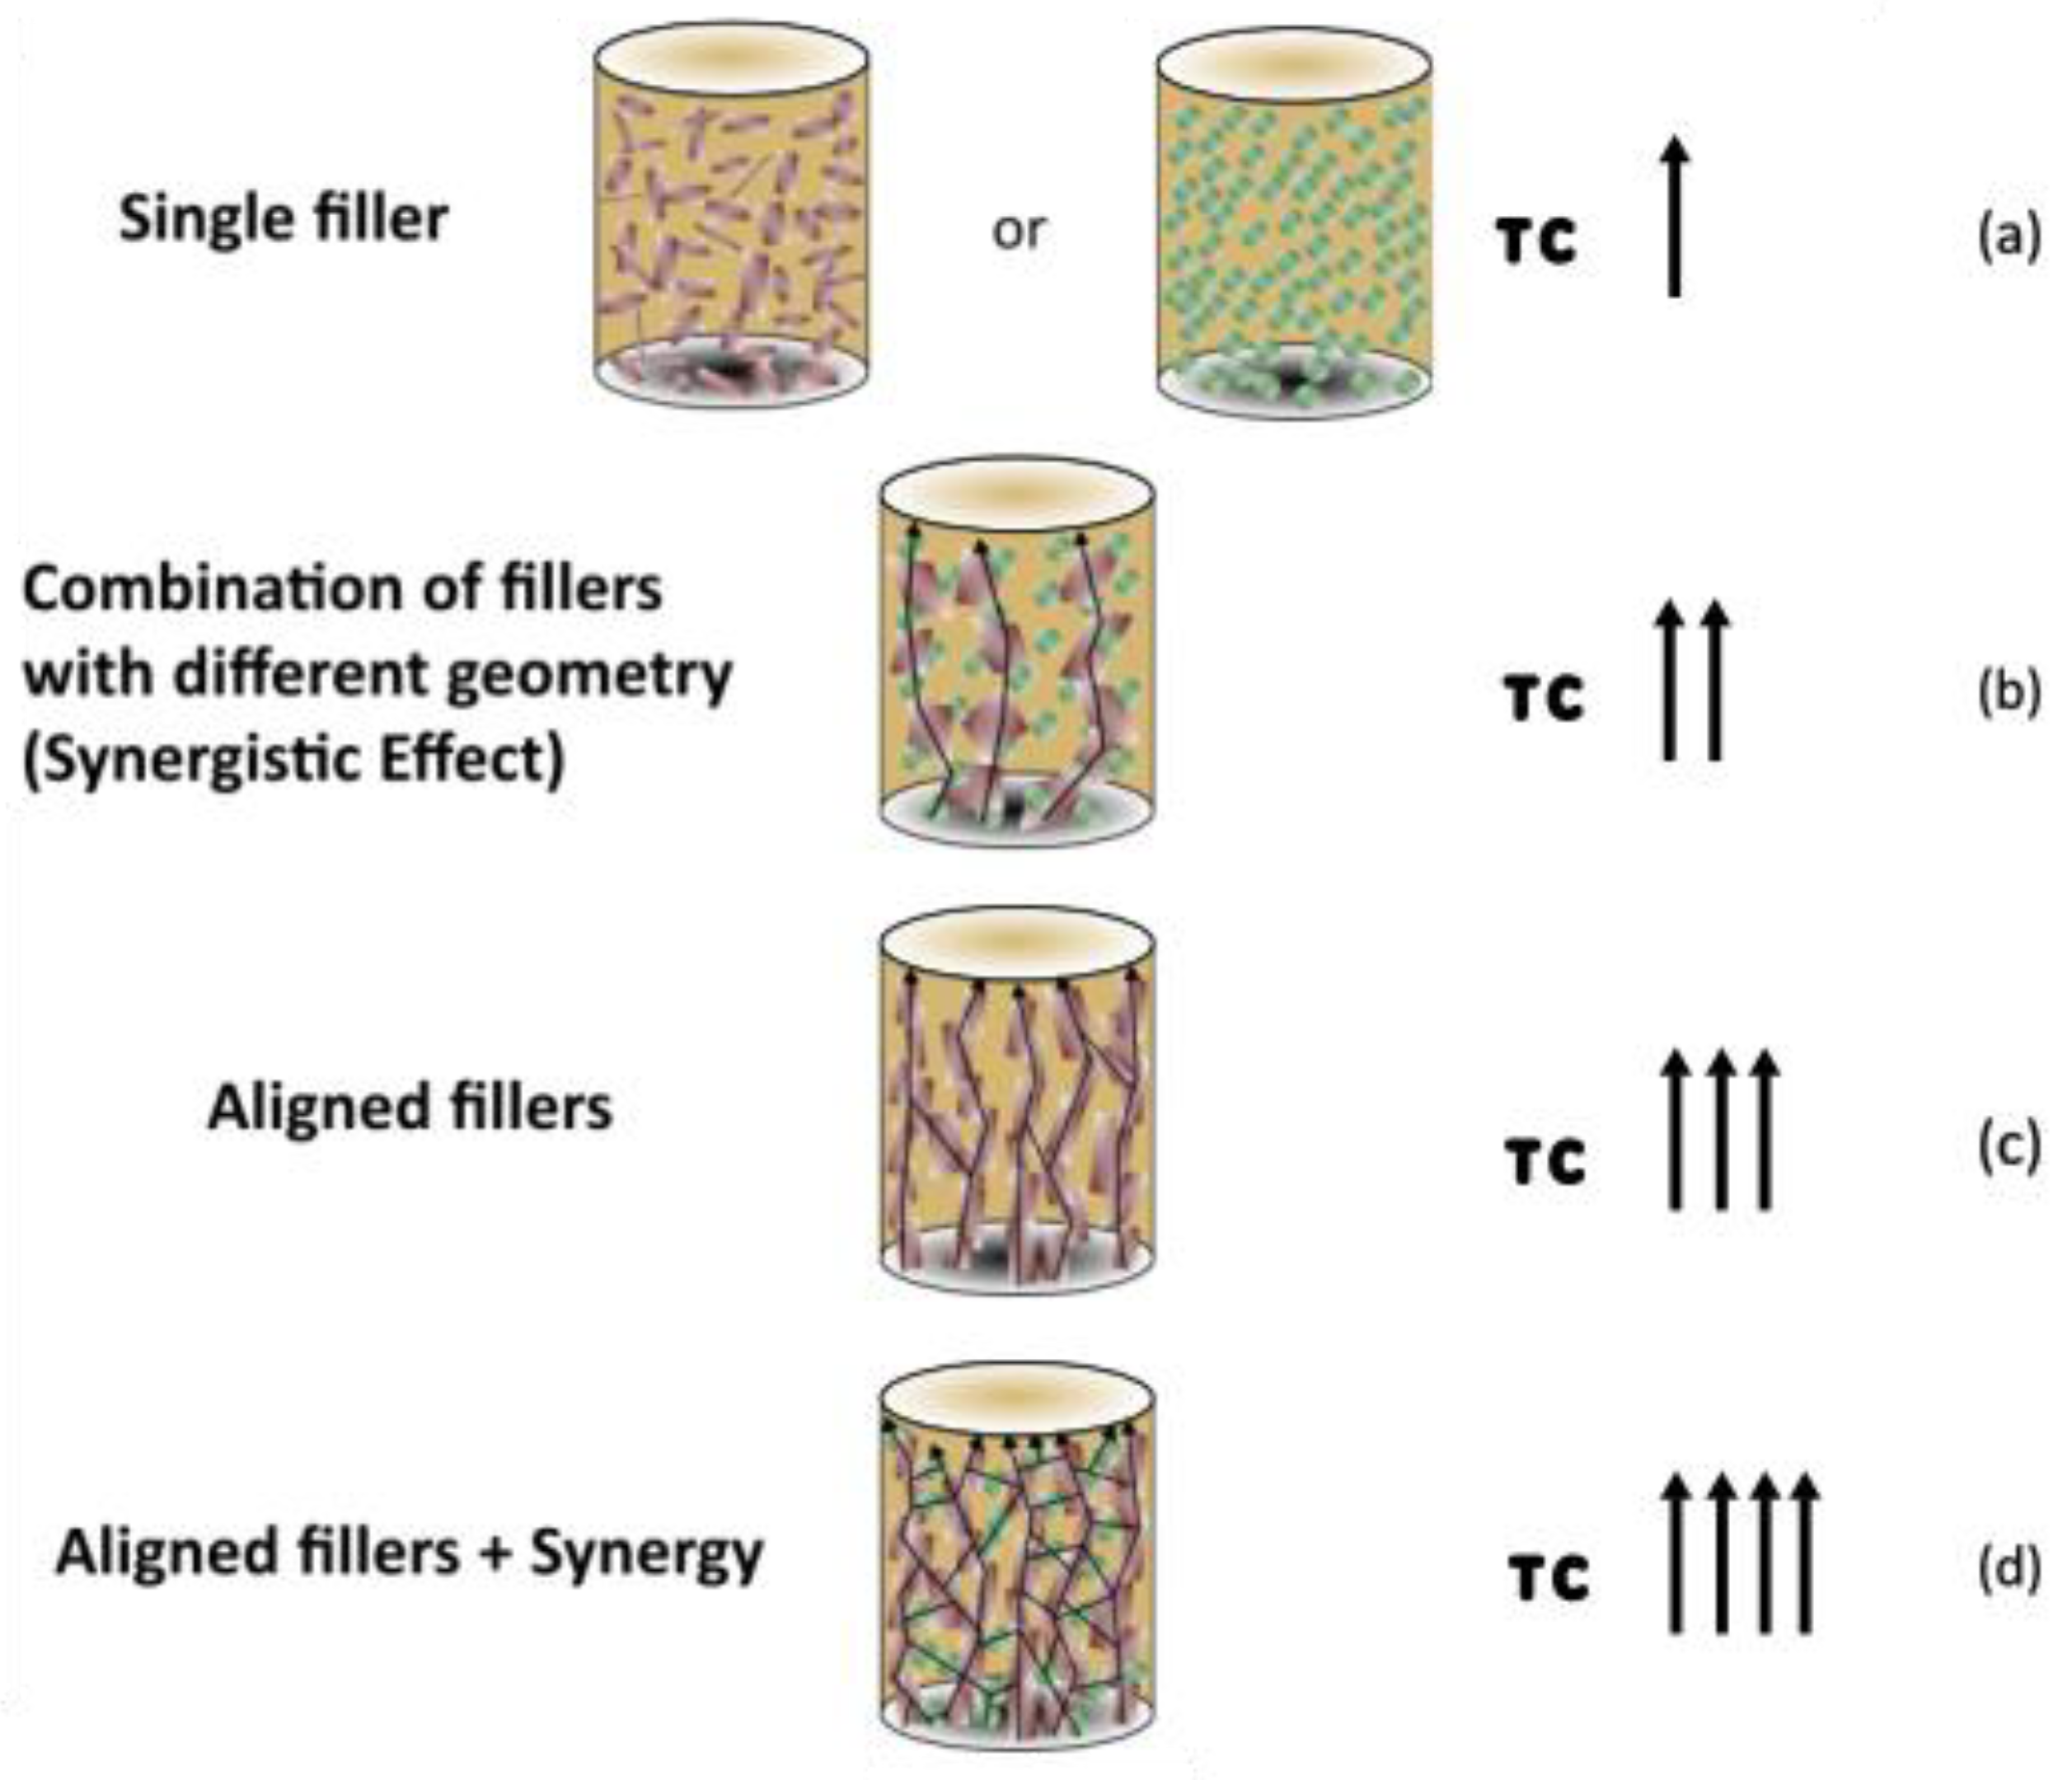
Figure 3.
Post-test dumbbell samples: (a) neat PDMS; (b) hBN (40%)/PDMS; (c) GNP (8%)/PDMS; (d) hBN (40%)/GNP (10%)/PDMS.
Figure 3.
Post-test dumbbell samples: (a) neat PDMS; (b) hBN (40%)/PDMS; (c) GNP (8%)/PDMS; (d) hBN (40%)/GNP (10%)/PDMS.
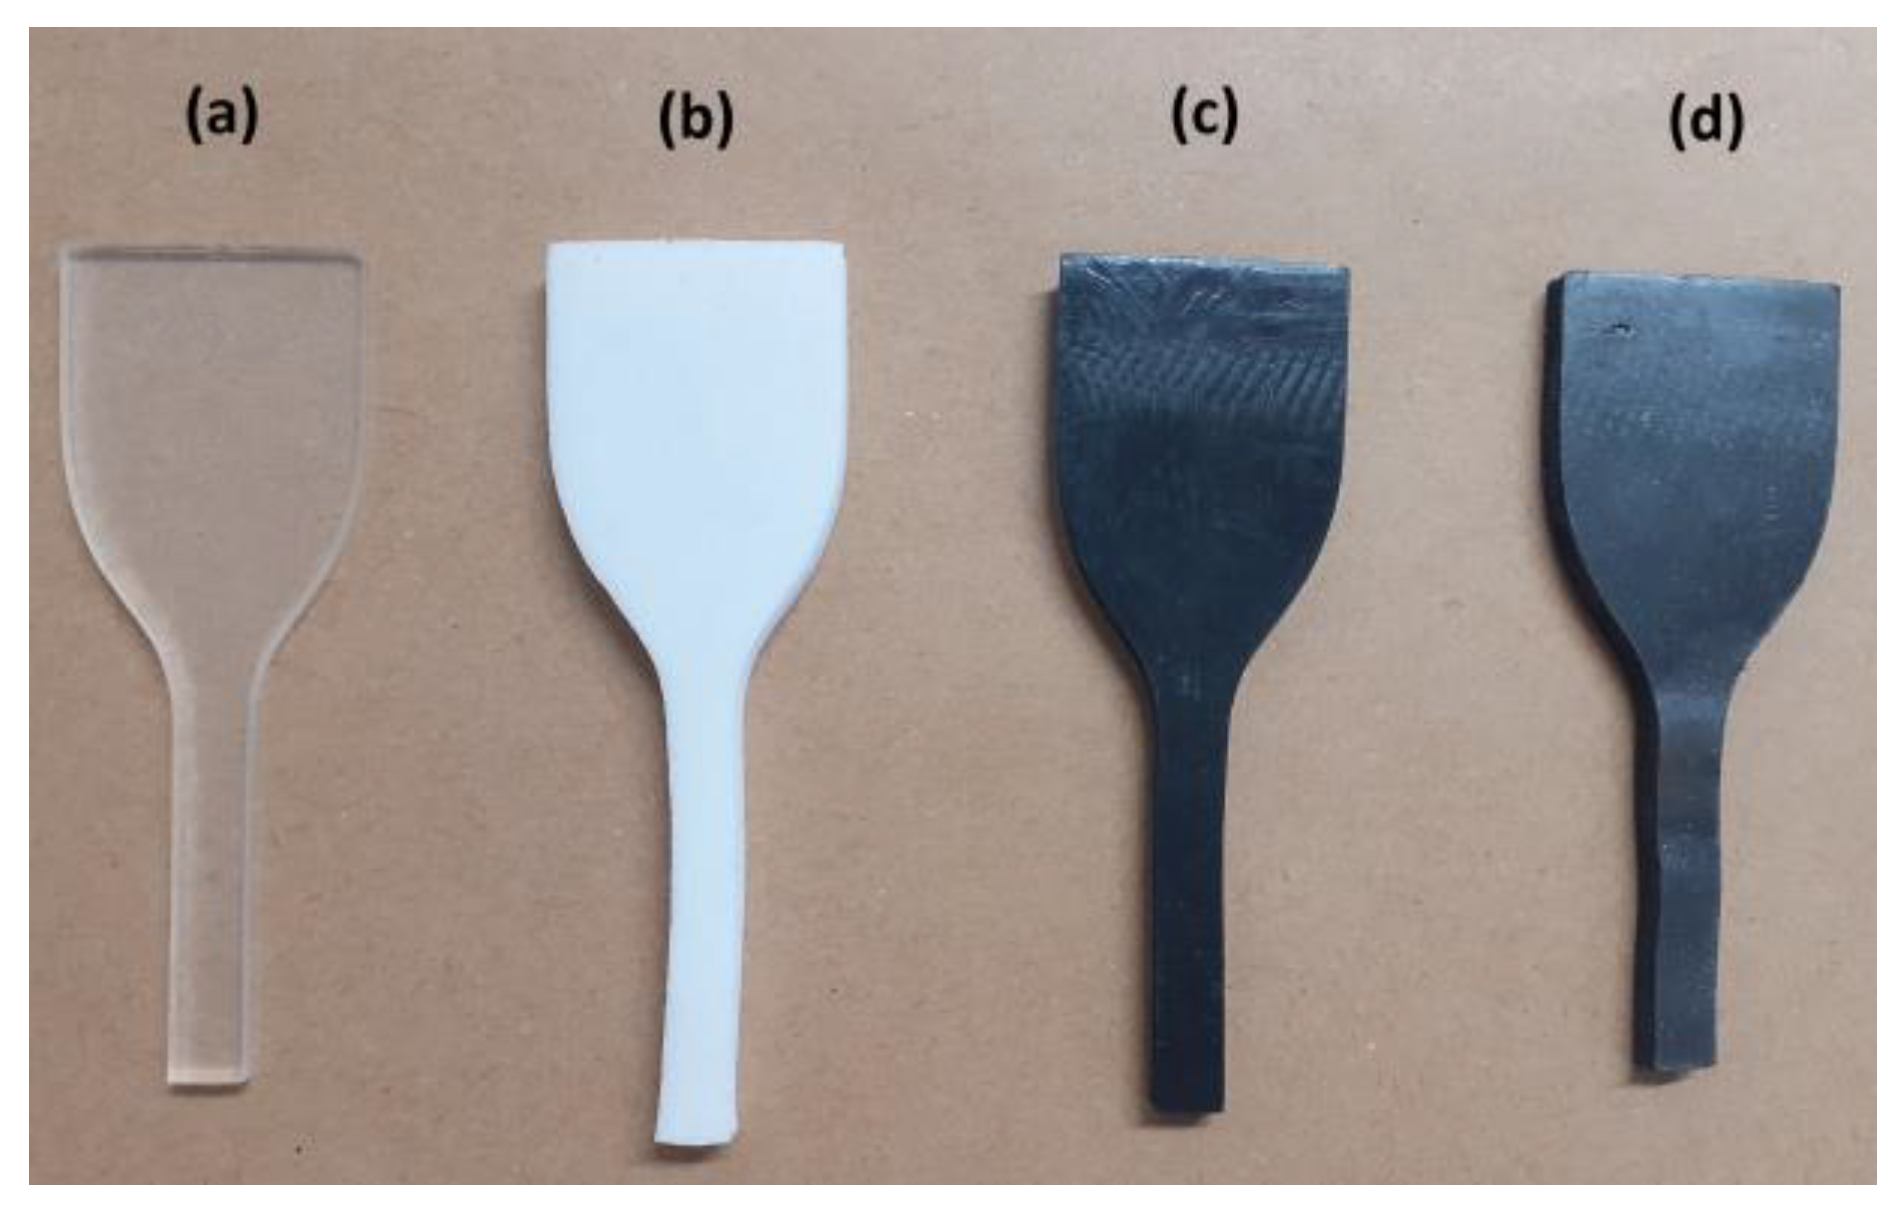
Figure 4.
Effect of the amount of filler (hBN or hBN/GNP) contained in PDMS matrix on their TC values.
Figure 4.
Effect of the amount of filler (hBN or hBN/GNP) contained in PDMS matrix on their TC values.
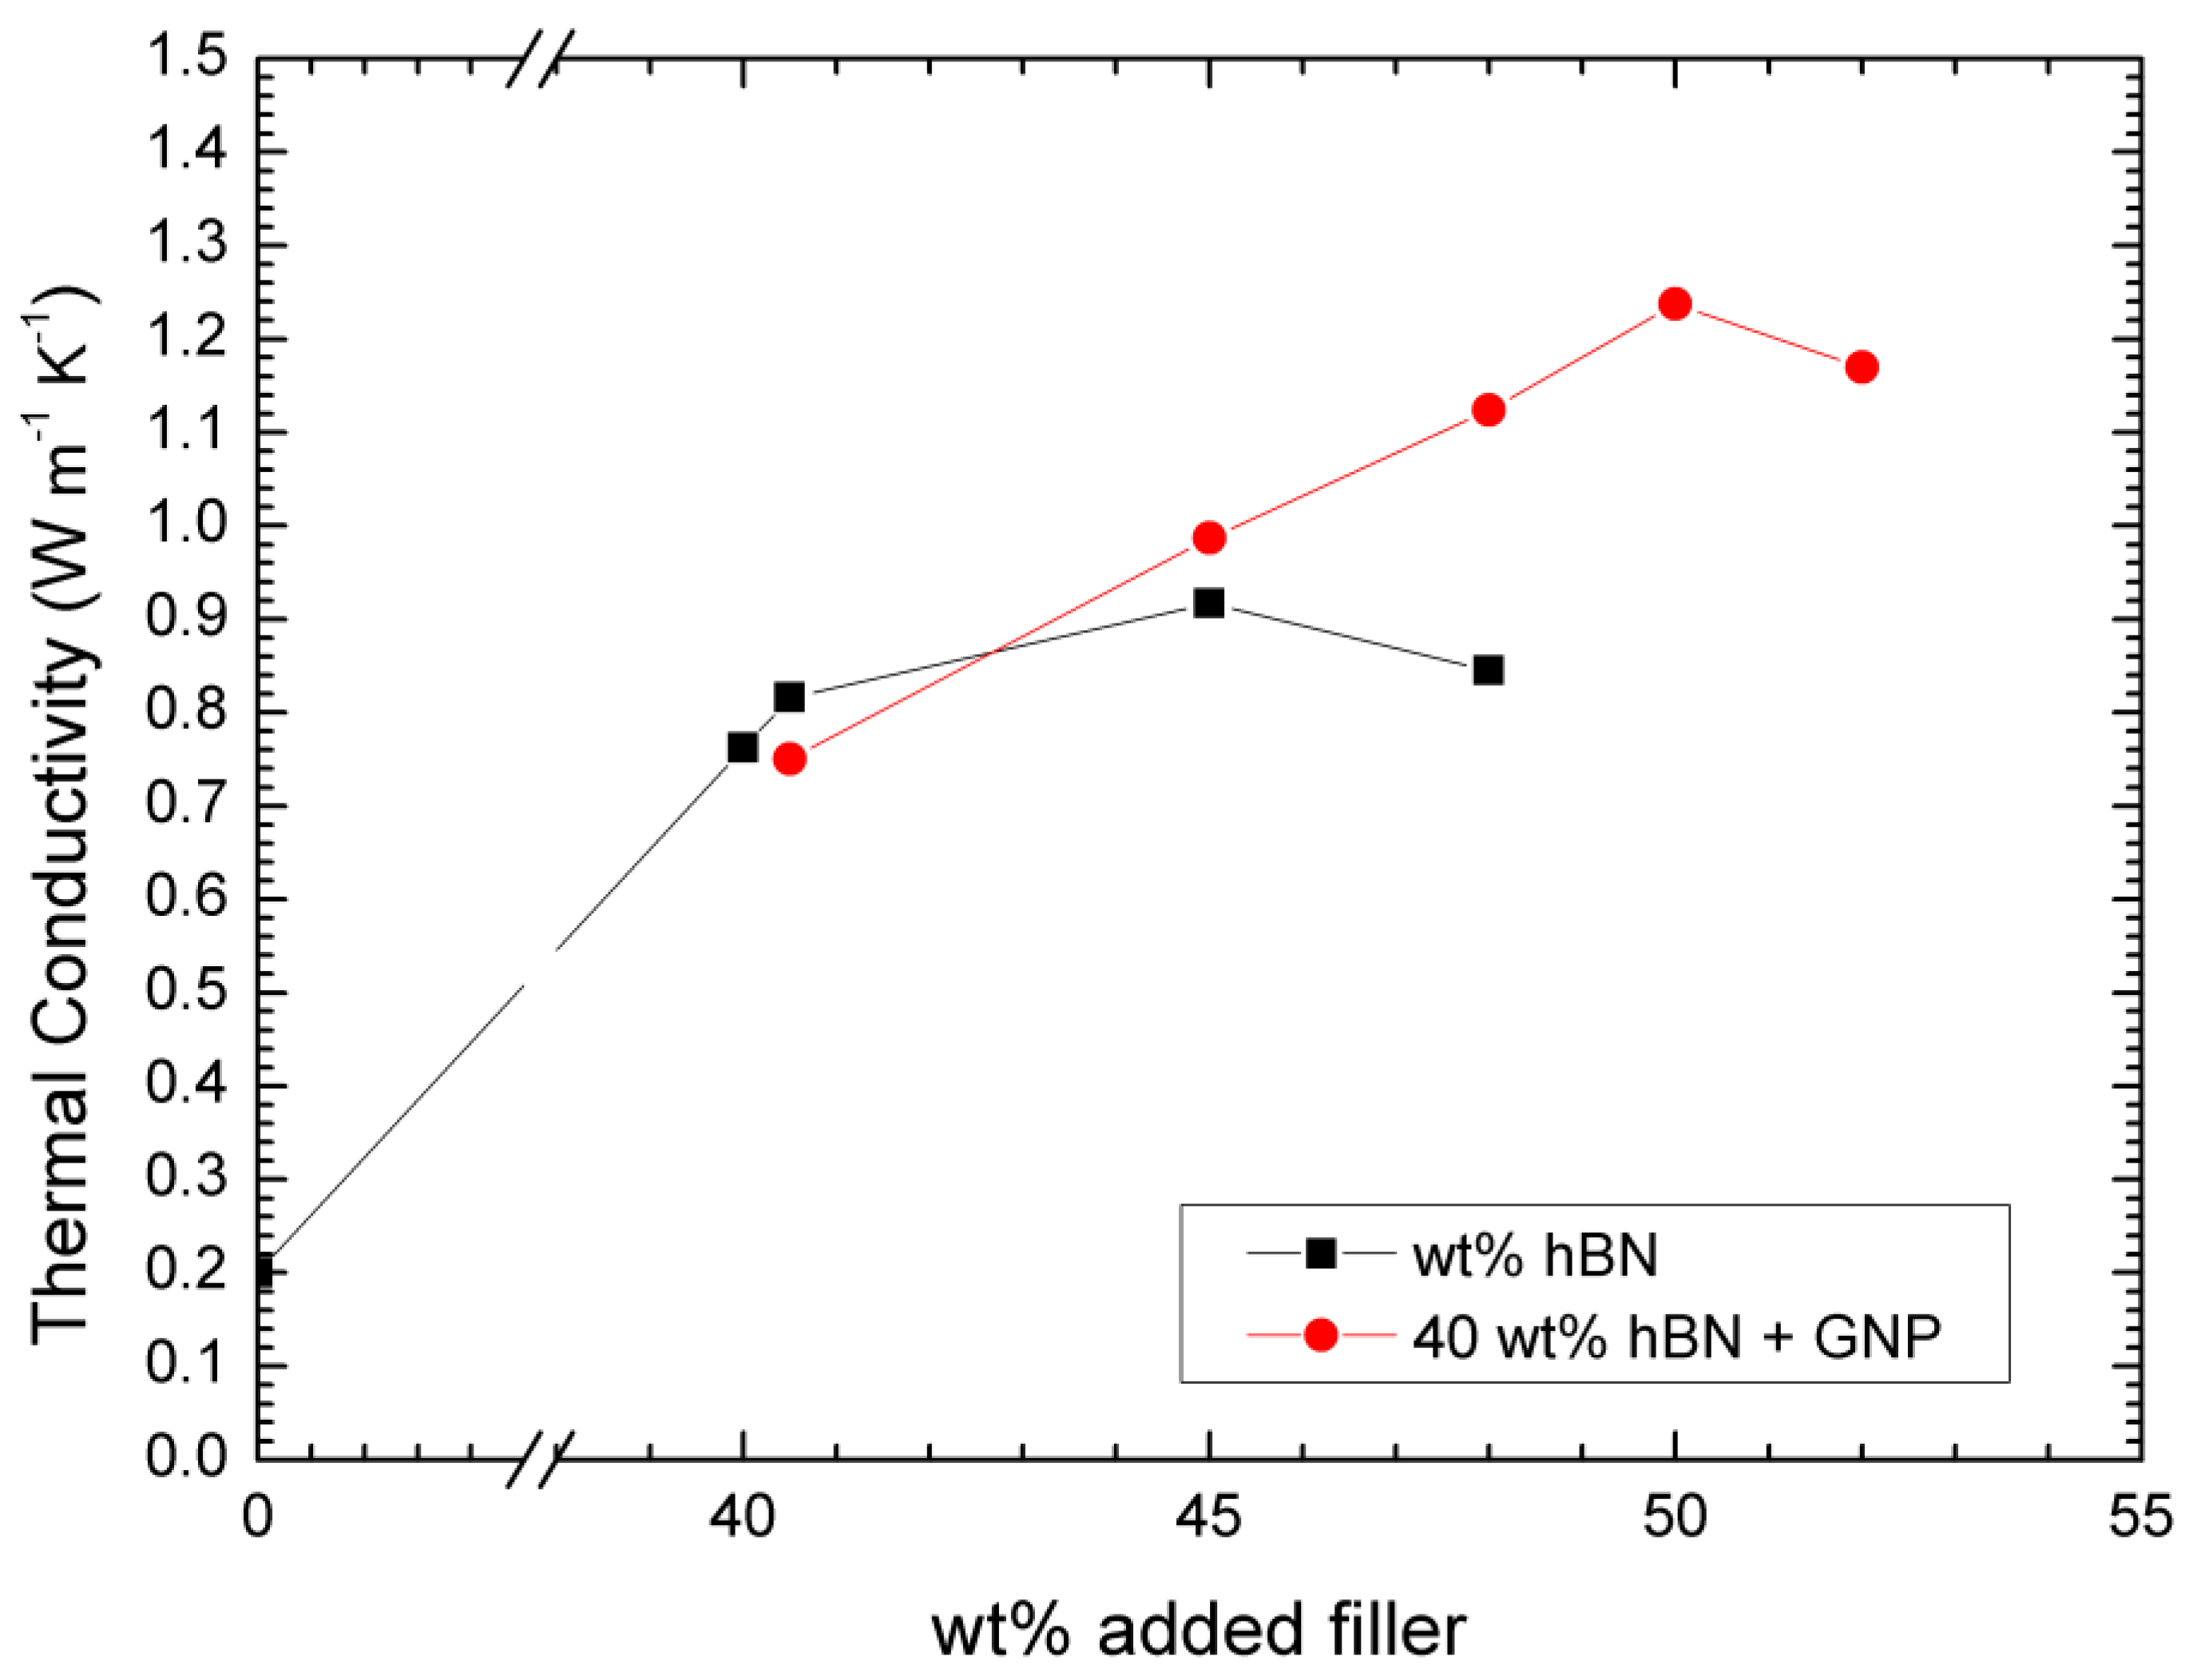
Figure 5.
DSC scans with 10 °C/min heating rate for neat PDMS and nanocomposites containing different fillers and amounts of GNPs or/and hBN.
Figure 5.
DSC scans with 10 °C/min heating rate for neat PDMS and nanocomposites containing different fillers and amounts of GNPs or/and hBN.
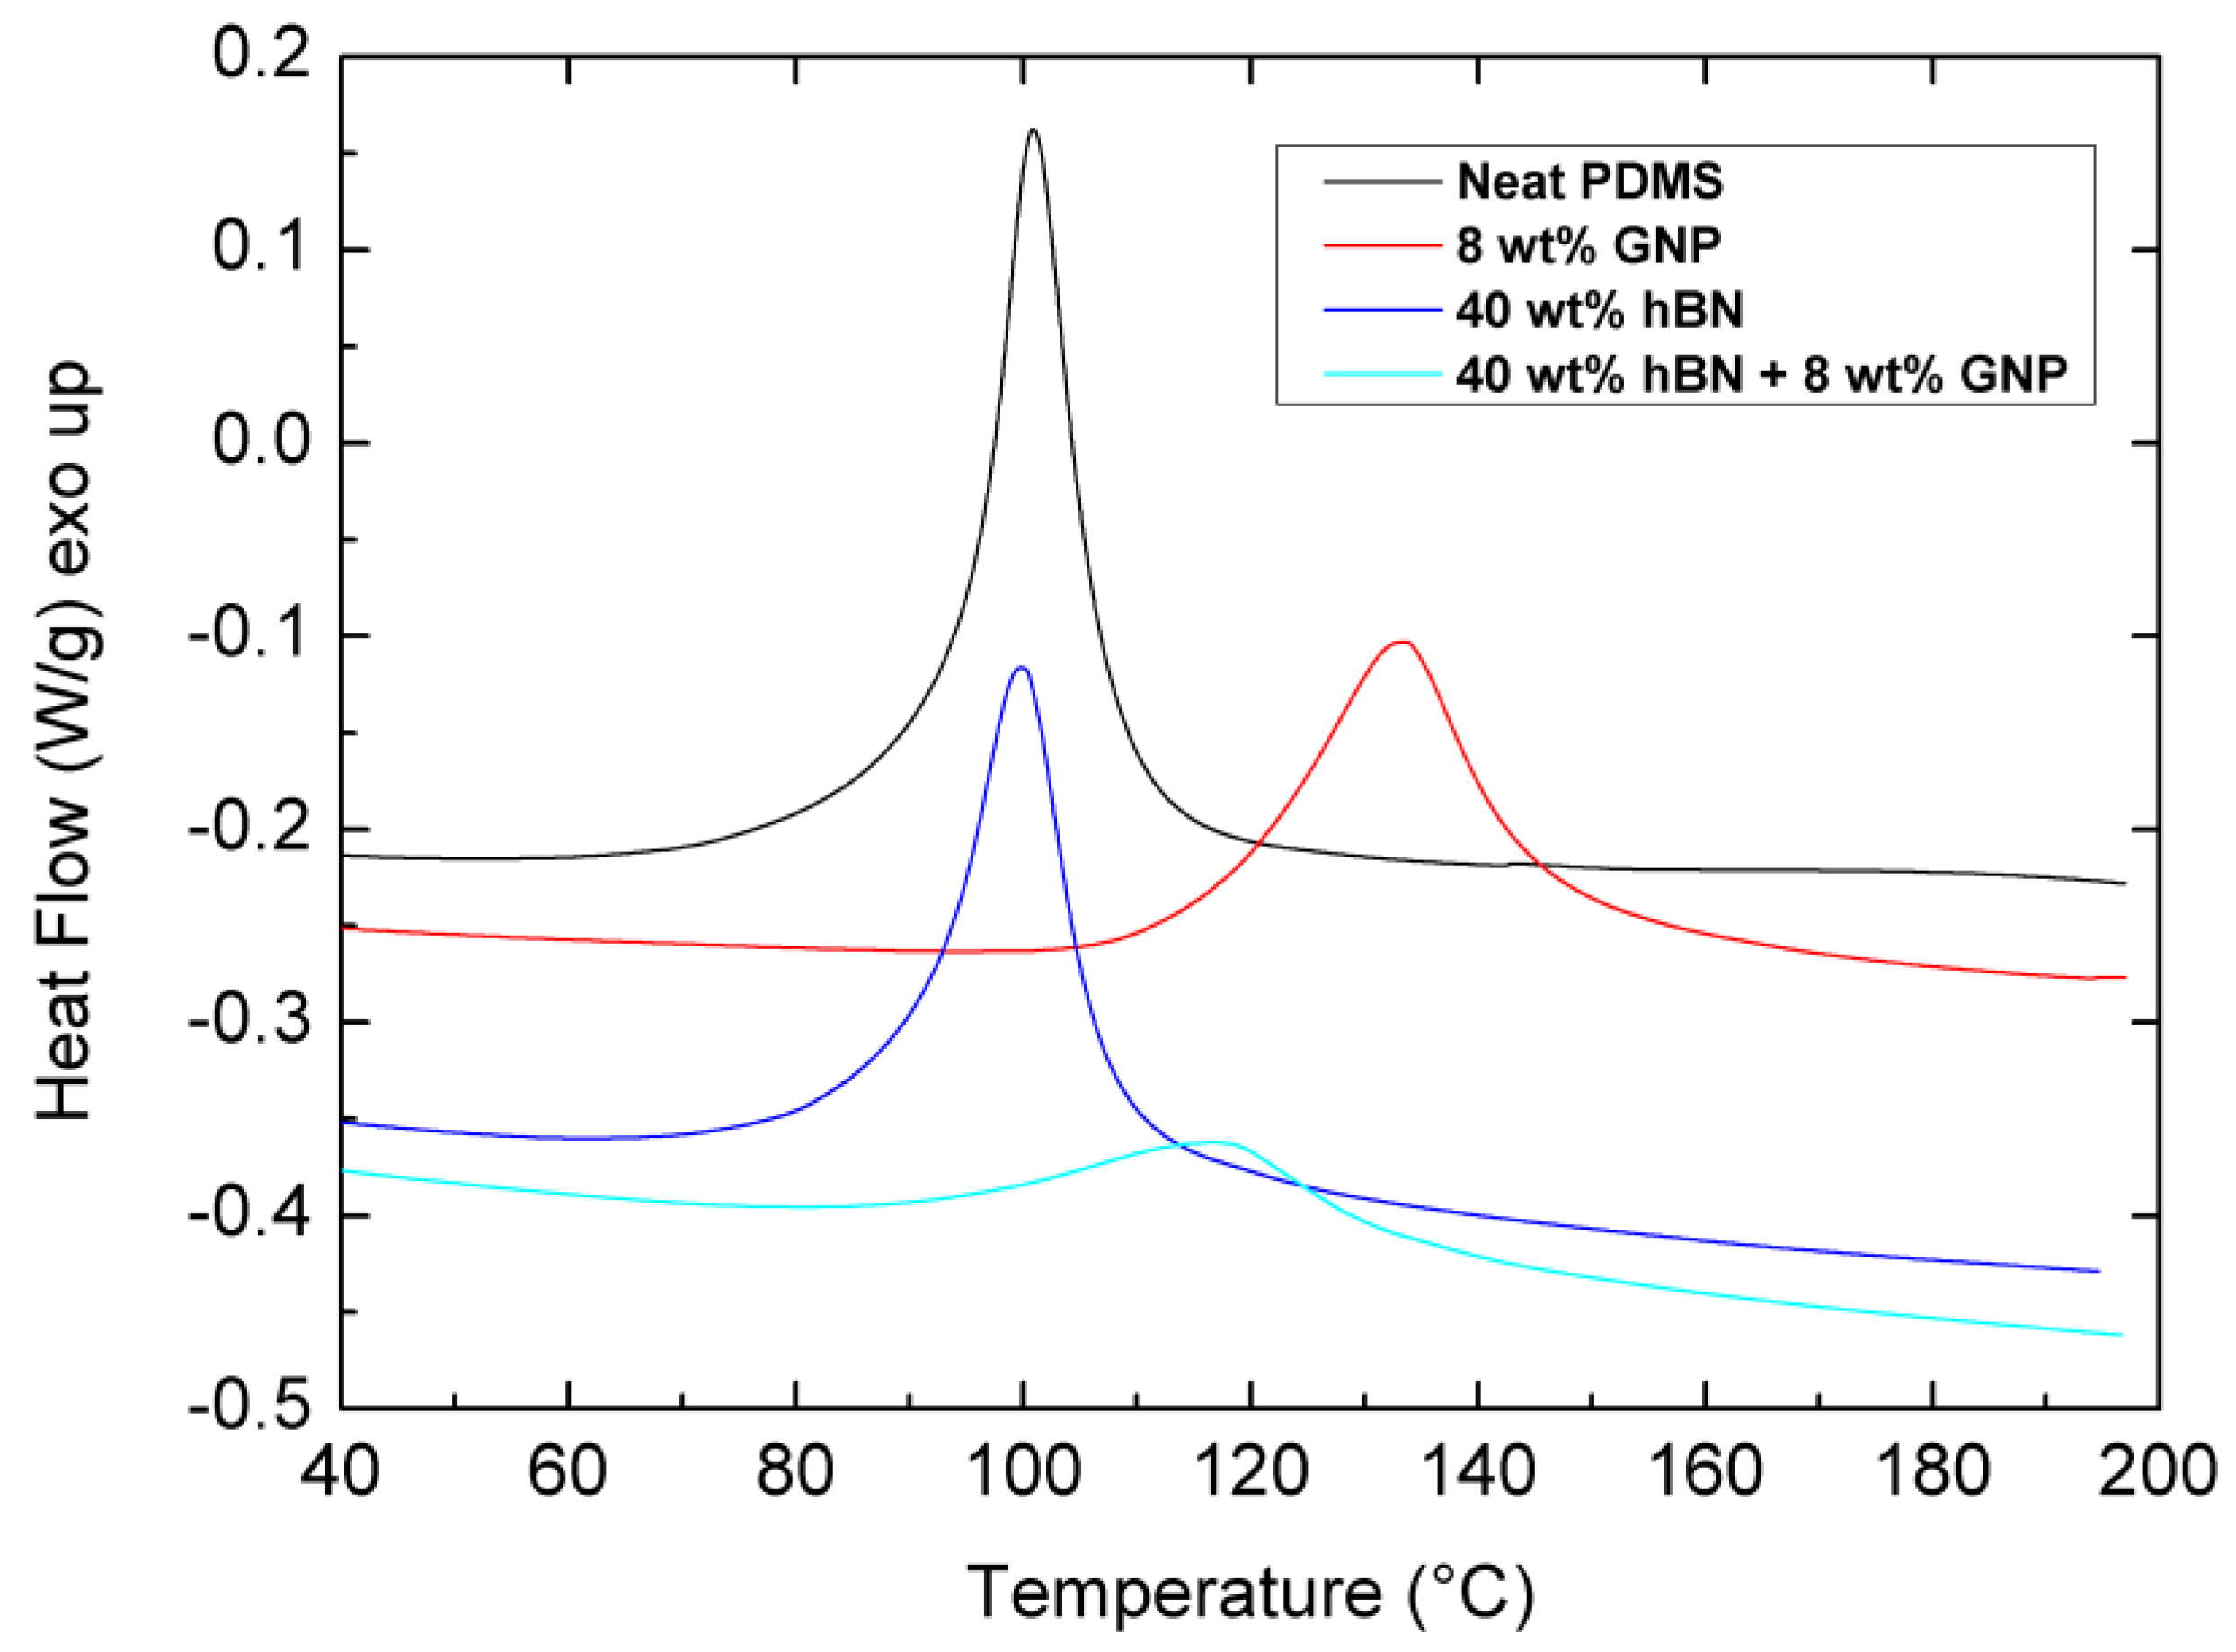
Figure 6.
TGA curves for samples heated at 10 °C/min to 850 °C.
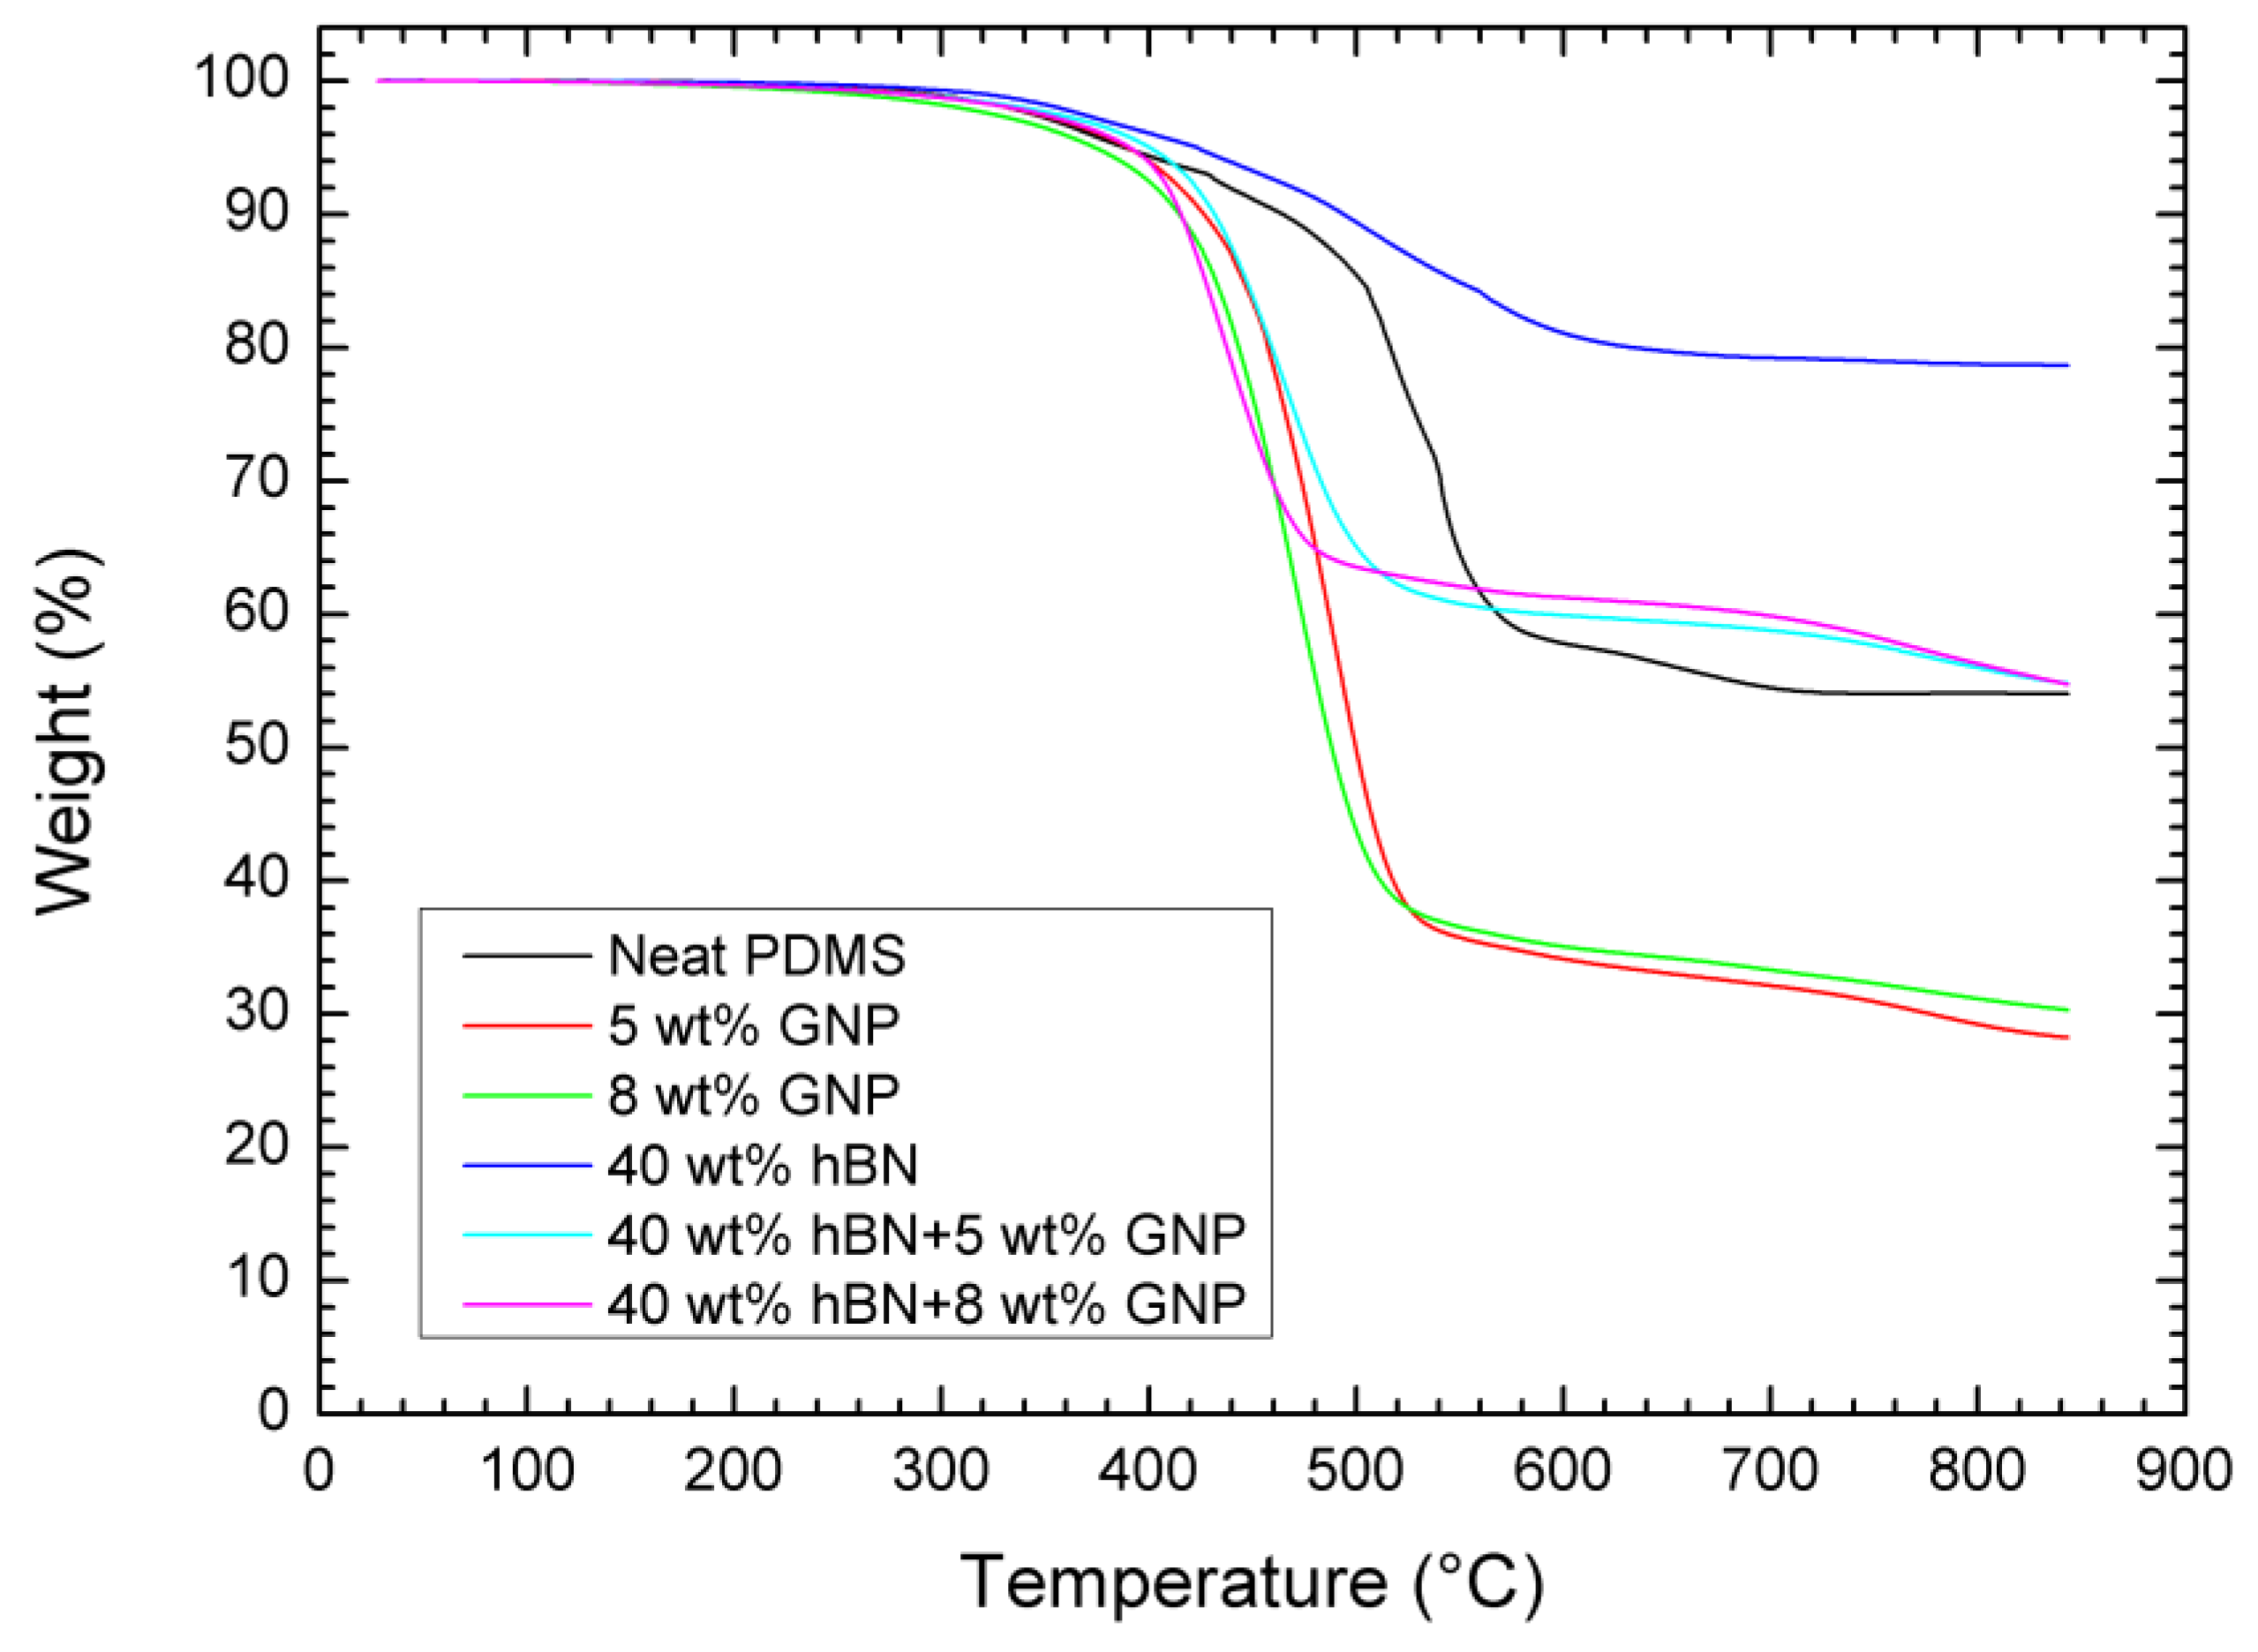
Figure 7.
Stress–strain curves of (a) hBN/PDMS, (b) GNP/PDMS composites and (c) hBN/GNP nanocomposites. Plots of the elastic modulus at 10% strain of PDMS-based nanocomposites containing (d) hBN, (e) GNPs, (f) hBN and GNPs.
Figure 7.
Stress–strain curves of (a) hBN/PDMS, (b) GNP/PDMS composites and (c) hBN/GNP nanocomposites. Plots of the elastic modulus at 10% strain of PDMS-based nanocomposites containing (d) hBN, (e) GNPs, (f) hBN and GNPs.
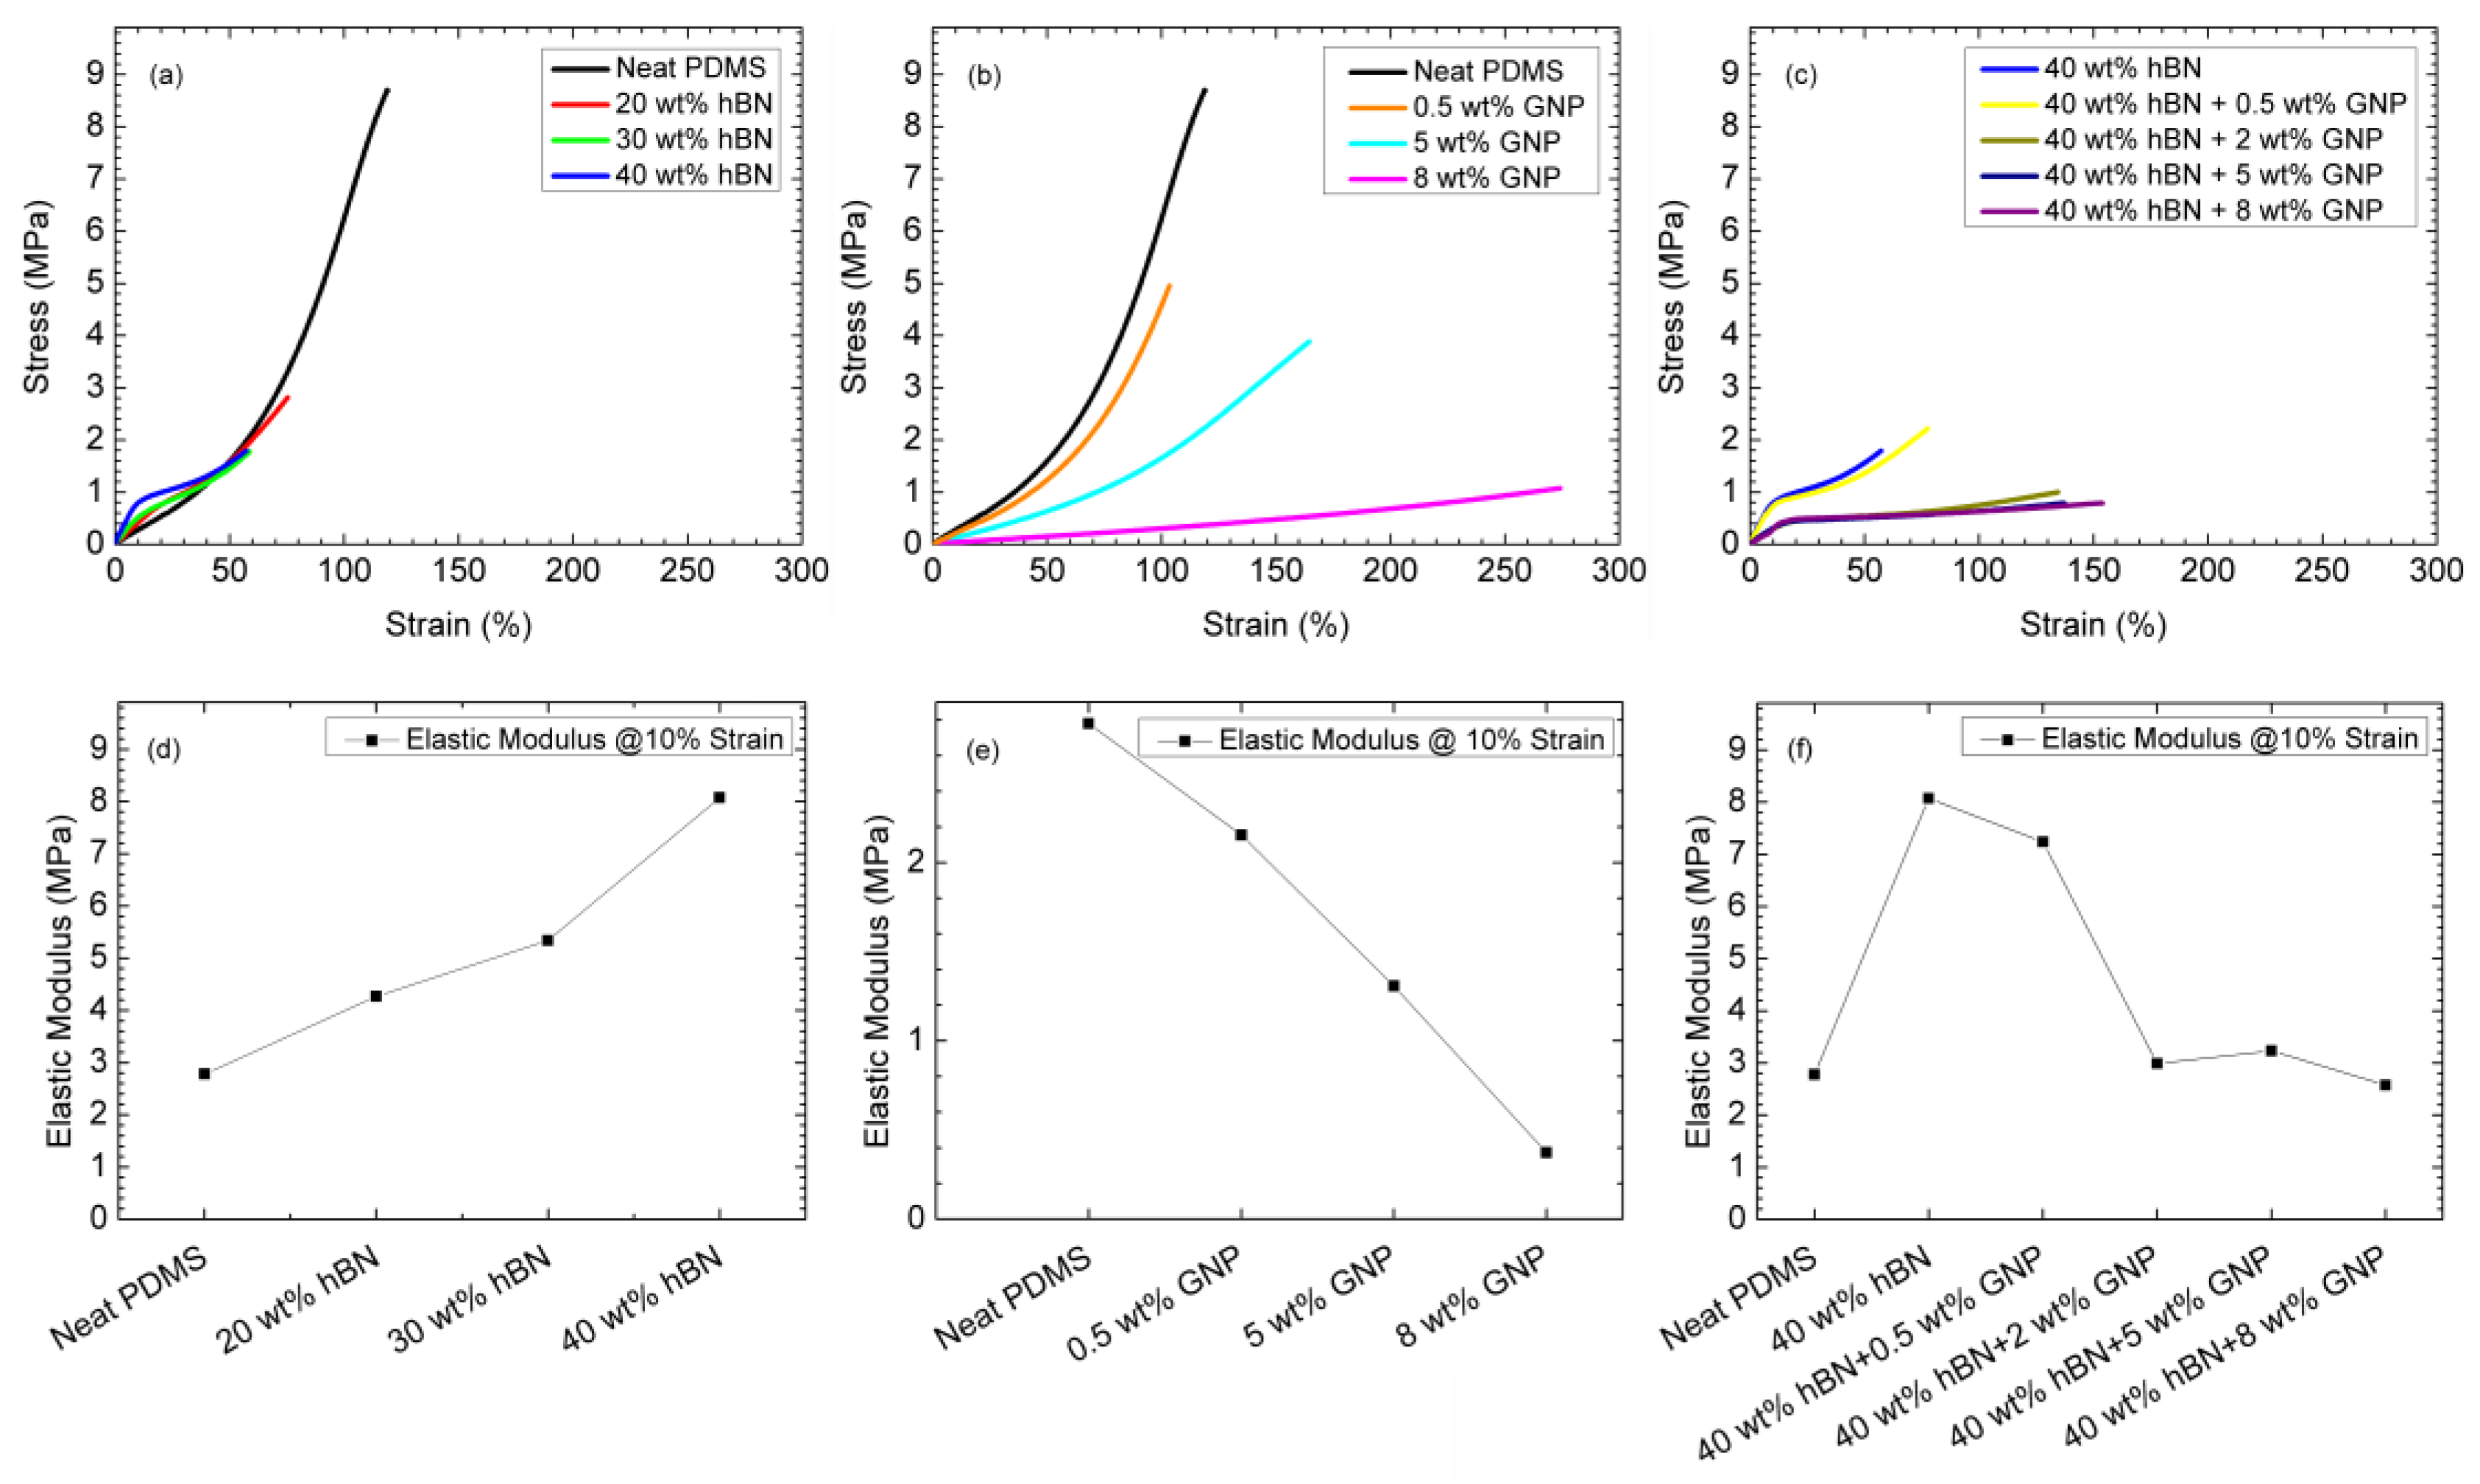
Figure 8.
Results of Shore A hardness measurements for PDMS-based composites containing: (a) hBN; (b) GNPs; (c) 40 wt% hBN and different amounts of GNPs.
Figure 8.
Results of Shore A hardness measurements for PDMS-based composites containing: (a) hBN; (b) GNPs; (c) 40 wt% hBN and different amounts of GNPs.
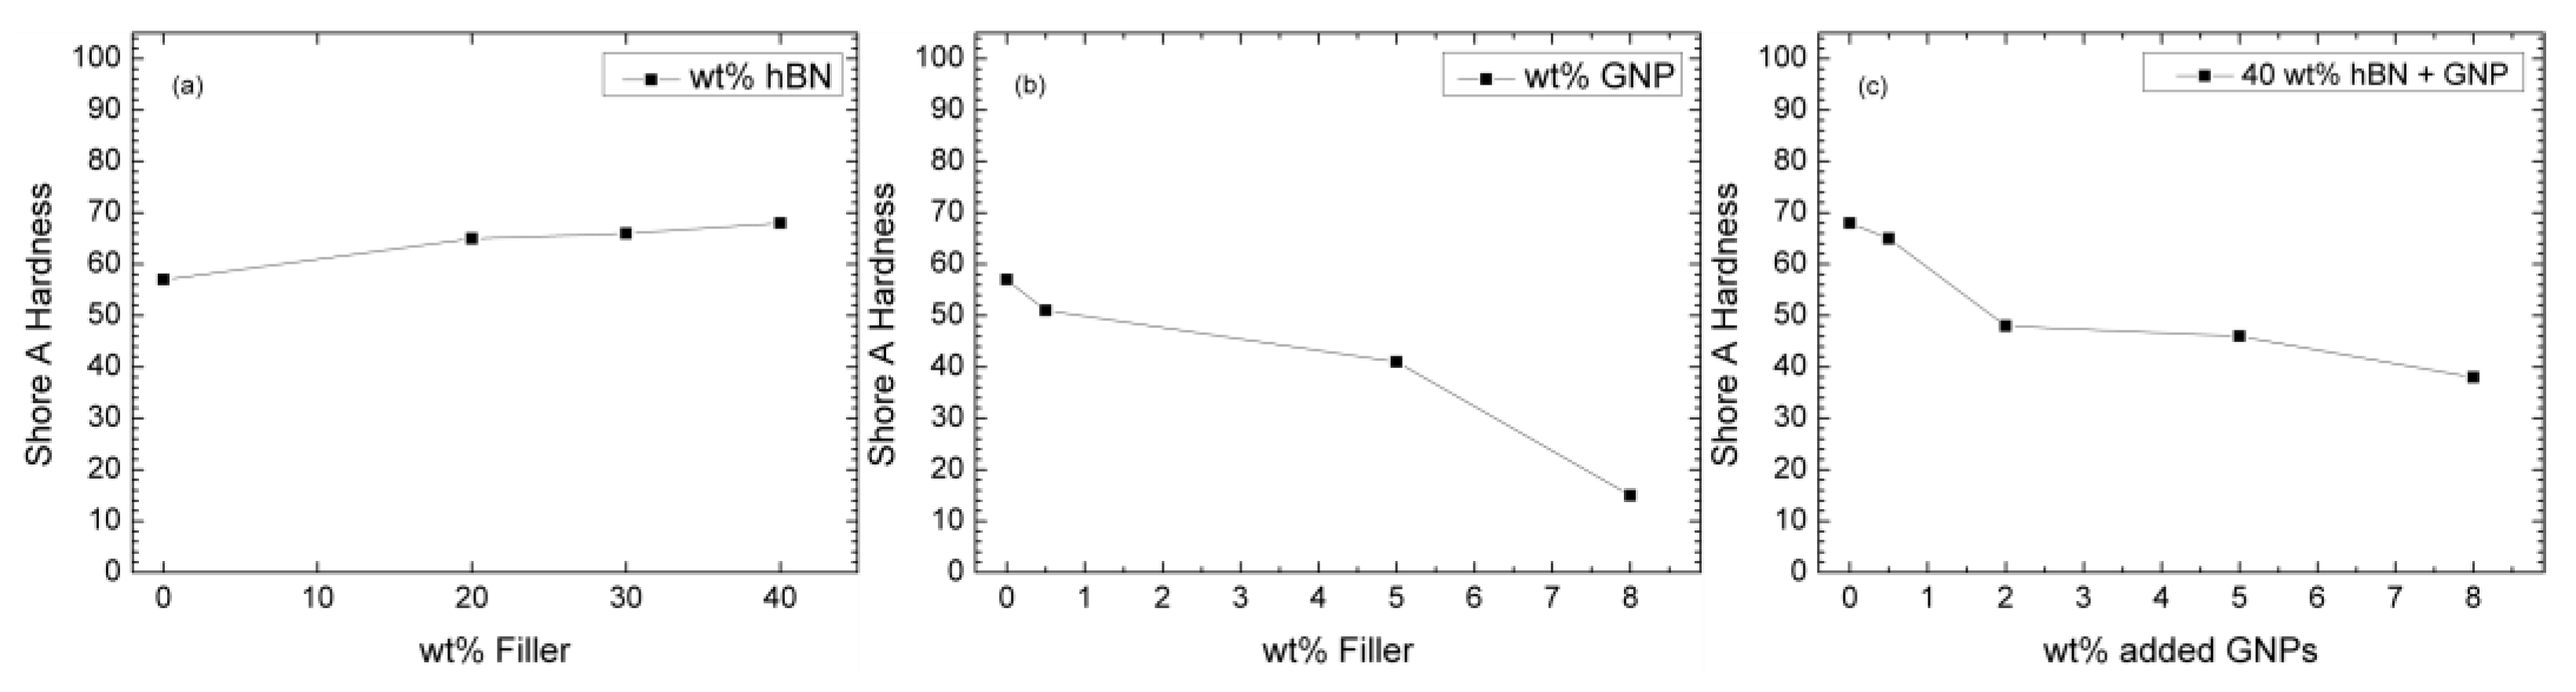
Figure 9.
Viscosity values for different PDMS-based samples with hBN and GNP fillers measured at RT and at 1 s−1.
Figure 9.
Viscosity values for different PDMS-based samples with hBN and GNP fillers measured at RT and at 1 s−1.
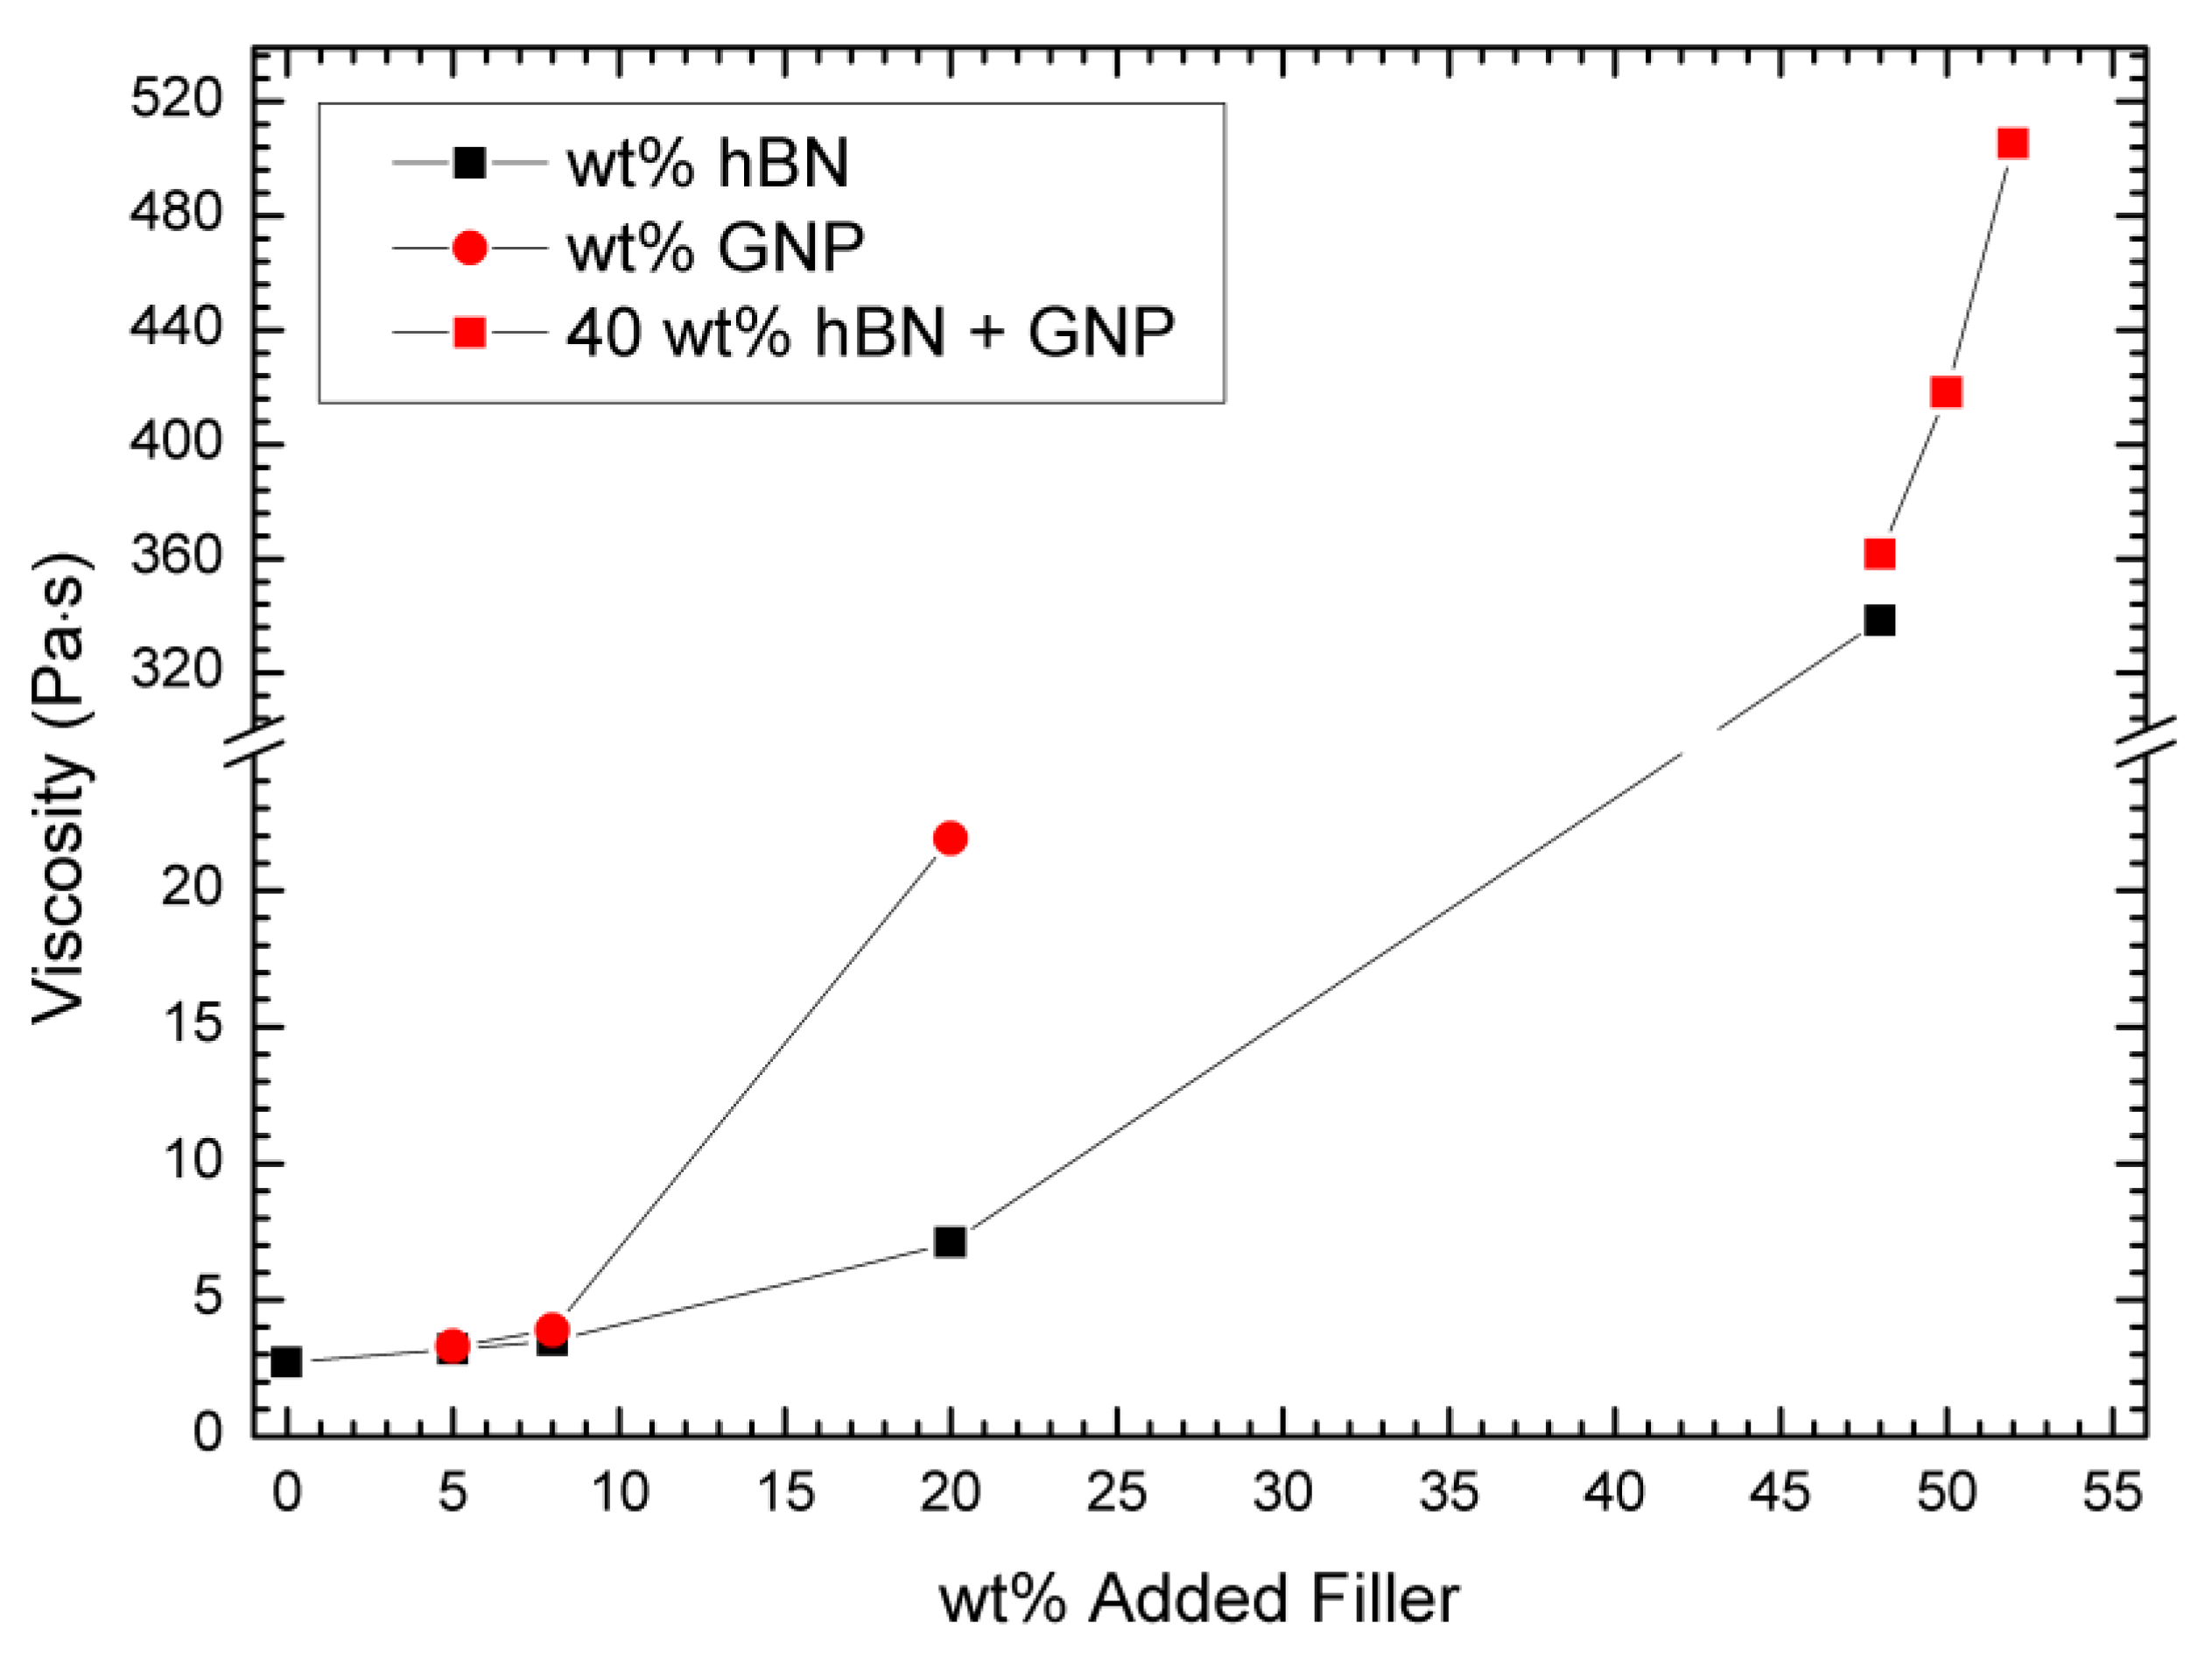
Figure 10.
SEM images: (a) neat PDMS; (b) hBN (50%); (c) GNP (8%); and (d) hBN (40%)/GNP (10%) samples.
Figure 10.
SEM images: (a) neat PDMS; (b) hBN (50%); (c) GNP (8%); and (d) hBN (40%)/GNP (10%) samples.

Table 1.
Lateral size, thickness, specific surface area (SSA), and apparent density of the fillers used.
Table 1.
Lateral size, thickness, specific surface area (SSA), and apparent density of the fillers used.
| Material | Flake Lateral Size (μm) | Thickness (nm)/ Number of Layers | SSA (m2/g) | Density (Untapped) (g/cm3) | Thermal Conductivity (W m−1 K−1) |
|---|---|---|---|---|---|
| hBN | 45 μm, D10/D90 = 20/80 | NA | 0.6 | 0.7 | ~300 |
| GNPs (Nanene-002) | D10(x) ~0.97 D50(x) ~2.16 D90(x) ~4.01 / D10(y) ~0.89 D50(y) ~1.78 D90(y) ~3.06 | D10 ~1.3 D50 ~4.9 D90 ~20 / D10 ~4 D50 ~14.5 D90 ~60 | 25 | <0.25 | ~2000 |
Table 2.
The temperature range for thermal conductivity characterisation.
| Setpoint | Top Plate Temperature (°C) | Bottom Plate Temperature (°C) | Mean Temperature (°C) |
|---|---|---|---|
| 1 | 60 | 50 | 55 |
| 2 | 70 | 60 | 65 |
| 3 | 80 | 70 | 75 |
Table 3.
DSC scan results for neat PDMS and PDMS-based nanocomposites containing different amounts of GNPs and hBN at 10 °C/min heating rate.
Table 3.
DSC scan results for neat PDMS and PDMS-based nanocomposites containing different amounts of GNPs and hBN at 10 °C/min heating rate.
| Filler Type and Content (wt%) | Ti (°C) | Tp (°C) | Tf (°C) | ΔHult (J/g) * |
|---|---|---|---|---|
| Neat PDMS | 58 | 100 | 135 | 28.29 |
| GNP (8) | 94 | 133 | 193 | 22.37 |
| hBN (40) | 68 | 101 | 130 | 25.55 |
| hBN (40) + GNP (8) | 82 | 117 | 140 | 9.94 |
* ΔHult (J/g) refers to 1 gr PDMS.
Table 4.
Results of TGA tests run at 10 °C/min heating rate on neat PDMS samples and PDMS-based samples containing different amounts of hBN and GNPs.
Table 4.
Results of TGA tests run at 10 °C/min heating rate on neat PDMS samples and PDMS-based samples containing different amounts of hBN and GNPs.
| Filler Type and Content (wt%) | 5 wt% Loss (°C) | 50 wt% Loss (°C) | End of Degradation (°C) | Max. Rate of Decomposition (°C) | Residue at 800 °C (wt%) |
|---|---|---|---|---|---|
| Neat PDMS | 388.3 | NA | 586 | 543 | 54 |
| GNP (5) | 388.7 | 498 | 537 | 489 | 29.2 |
| GNP (8) | 368.8 | 483 | 541 | 467 | 31 |
| hBN (40) | 414.1 | NA | 648 | 495 | 78.7 |
| hBN (40) + GNP (5) | 395.1 | NA | 530 | 460 | 55.8 |
| hBN (40) + GNP (8) | 387.9 | NA | 489 | 435 | 56.2 |
Table 5.
Viscosity values for PDMS-based samples with different GNP and hBN content, measured at 1 s−1 shear rate.
Table 5.
Viscosity values for PDMS-based samples with different GNP and hBN content, measured at 1 s−1 shear rate.
| Filler Type and Content (wt%) | Viscosity (Pa·s) |
|---|---|
| Neat PDMS | 2.7 |
| hBN (5) | 3.2 |
| hBN (8) | 3.5 |
| hBN 20 | 7.1 |
| GNP (5) | 3.3 |
| GNP (8) | 3.9 |
| GNP (20) | 21.9 |
| hBN (48) | 338.2 |
| hBN (40) + GNP (8) | 361.6 |
| hBN (40) + GNP (10) | 418.1 |
| hBN (40) + GNP (12) | 505.3 |
Disclaimer/Publisher’s Note: The statements, opinions and data contained in all publications are solely those of the individual author(s) and contributor(s) and not of MDPI and/or the editor(s). MDPI and/or the editor(s) disclaim responsibility for any injury to people or property resulting from any ideas, methods, instructions or products referred to in the content. |
© 2023 by the authors. Licensee MDPI, Basel, Switzerland. This article is an open access article distributed under the terms and conditions of the Creative Commons Attribution (CC BY) license (https://creativecommons.org/licenses/by/4.0/).
Share and Cite
MDPI and ACS Style
Fakiridis, S.; Hodge, S.A.; Karagiannidis, P.G. Thermal Interface Materials with Hexagonal Boron Nitride and Graphene Fillers in PDMS Matrix: Thermal and Mechanical Properties. Energies 2023, 16, 2522. https://doi.org/10.3390/en16062522
AMA Style
Fakiridis S, Hodge SA, Karagiannidis PG. Thermal Interface Materials with Hexagonal Boron Nitride and Graphene Fillers in PDMS Matrix: Thermal and Mechanical Properties. Energies. 2023; 16(6):2522. https://doi.org/10.3390/en16062522
Chicago/Turabian StyleFakiridis, Spyridon, Stephen A. Hodge, and Panagiotis G. Karagiannidis. 2023. "Thermal Interface Materials with Hexagonal Boron Nitride and Graphene Fillers in PDMS Matrix: Thermal and Mechanical Properties" Energies 16, no. 6: 2522. https://doi.org/10.3390/en16062522
Note that from the first issue of 2016, this journal uses article numbers instead of page numbers. See further details here.