
Reinforcement-Learning-Based Multi-Objective Differential Evolution Algorithm for Large-Scale Combined Heat and Power Economic Emission Dispatch

School of Electrical and Information Engineering, Jiangsu University, Zhenjiang 212013, China
*
Author to whom correspondence should be addressed.
Energies 2023, 16(9), 3753; https://doi.org/10.3390/en16093753
Submission received: 16 February 2023
/
Revised: 23 April 2023
/
Accepted: 25 April 2023
/
Published: 27 April 2023
(This article belongs to the Special Issue Advanced Modeling and Optimization Technologies for Building Energy Efficiency)
Abstract
:As social and environmental issues become increasingly serious, both fuel costs and environmental impacts should be considered in the cogeneration process. In recent years, combined heat and power economic emission dispatch (CHPEED) has become a crucial optimization problem in power system management. In this paper, a novel reinforcement-learning-based multi-objective differential evolution (RLMODE) algorithm is suggested to deal with the CHPEED problem considering large-scale systems. In RLMODE, a Q-learning-based technique is adopted to automatically adjust the control parameters of the multi-objective algorithm. Specifically, the Pareto domination relationship between the offspring solution and the parent solution is used to determine the action reward, and the most-suitable algorithm parameter values for the environment model are adjusted through the Q-learning process. The proposed RLMODE was applied to solve four CHPEED problems: 5, 7, 100, and 140 generating units. The simulation results showed that, compared with four well-established multi-objective algorithms, the RLMODE algorithm achieved the smallest cost and smallest emission values for all four CHPEED problems. In addition, the RLMODE algorithm acquired better Pareto-optimal frontiers in terms of convergence and diversity. The superiority of RLMODE was particularly significant for two large-scale CHPEED problems.
1. Introduction
Traditional thermal power plants cannot efficiently convert thermal energy into electrical energy, and a large amount of thermal energy is wasted as heat [1]. Today, heat supply is an indispensable part of our lives, and therefore, utilizing waste heat has become a new production trend. Combined heat and power (CHP) generation technology collects and utilizes the waste heat for heat supply in the power generation process. Compared with the pure power generation plants, the energy utilization efficiency of CHP plants is more than 90% and can save 10% to 40% of the power generation costs. In addition, CHP plants can reduce the pollutant gas emissions by nearly 13∼18% [2]. In order to realize the sustainable development of the power industry, the application of CHP in the power system has become a global development trend [3].
Combined heat and power economic dispatch (CHPED) is an effective way to achieve optimal production in the CHP production system. CHPED refers to the optimization of electrical and heat production for three types of generating units, i.e., power-only (PO) units, CHP units, and heat-only (HO) units, with the goal of minimizing fuel costs. CHPED is a quite complex optimization task, which should be solved by efficient optimization methods.
1.1. Literature Review
Early methods for the CHPED problem included dual-quadratic programming (DQP) [4], Lagrange relaxation programming (LRP) [5], and the branch-and-bound method (BABM) [6]. However, these methods have the limitations of high initial sensitivity and low solution accuracy for non-convex problems.
Swarm and evolutionary optimization algorithms (SEOAs) are global optimizers that do not require the optimization problem to be convex or differentiable. Therefore, many SEOAs have been devised to solve the CHPED problem during the past ten years, such as the improved genetic algorithm [7], multi-player-based harmony search [2], Kho–Kho optimizer [8], niching differential evolution [9], migrating-variables-based differential evolution [10], collective information particle swarm optimization [11], the amalgamated heap and jellyfish optimizer [12], the hybrid chameleon swarm algorithm [13], hybrid grasshopper optimization [14], hybrid crow search [15], and adaptive cuckoo search [16]. However, all the above works only considered the economic production objective while ignoring the environmental pollution objective, and CHPED was solved using a single objective optimization framework.
With the increasingly serious social and environmental problems, both fuel costs and environmental impacts should be considered in the production process. As a result, combined heat and power economic emission dispatch (CHPEED) [17] is established with two conflicting goals, i.e., minimizing the fuel costs and reducing pollutant gas emissions. CHPEED is a non-linear, non-convex, and multi-objective optimization problem with multiple constraints. Recently, the research on CHPEED has become a hot topic in academia and industry.
Elaiw et al. [18] presented a hybrid DE-SQP method to solve the dynamic CHPEED problem. In the hybrid algorithm, DE acts as a global optimizer for the base-level search and SQP is used for fine-tuning of the final solution. Ahmadi et al. [19] used the normal boundary intersection (NBI) method to handle the CHPEED problem. The NBI was applied to find the Pareto-optimal solutions, and the TOPSIS decision-making approach was adopted to obtain the tradeoff solution Anand et al. [20] put forward a civilized swarm optimization (CSO) algorithm to solve the CHPEED problem. CSO is a synthetic technique based on particle swarm optimization and the society civilization algorithm. Sadeghian et al. [21] solved the CHPEED problem based on double-Benders decomposition (DBD). The DBD method consists of the external BD and the internal BD. For the external BD, the on/off state of generation units is determined by the master problem, and for the internal BD, the economic dispatch is solved through the sub-problem. Alomoush [22] applied stochastic fractal search (SFS) to solve the CHPEED problem. By using a compromise programming method, the fuel cost and gas emission were coupled into an aggregate objective function, and the approximate global optimal solution was obtained by the SFS algorithm. Jdoun et al. [23] proposed a dynamic control whale optimization (DCWOA) algorithm to solve the CHPEED problem. DCWOA adds the dynamically controlled constriction function into the traditional WOA. Note that most of these works transform the multi-objective CHPEED problem into a single-objective optimization problem, solve the problem by executing the single-objective optimization algorithm many times, and obtain the Pareto-optimal solutions.
Pareto-based multi-objective optimization algorithms have also been proposed for the CHPEED problem, which can obtain the Pareto-optimal solutions in one run. Niknam et al. [24] solved the reserve constrained dynamic CHPEED problem based on a multi-objective-enhanced firefly algorithm. Basu [25] recommended the nondominated sorting genetic algorithm-II (NSGA-II) to solve the CHPEED problem. NSGA-II employs fast nondominated sorting (FNS) and crowding distance (CD) comparison to select better individuals. Shi et al. [26] developed a multi-objective line-up competition algorithm (MLCA) to deal with the CHPEED problem with power transmission loss. An efficient diversity preservation mechanism was employed in the MLCA to produce the uniformly distributed Pareto-optimal solutions. Shaabani et al. [27] introduced a time-varying accelerated multi-objective particle swarm optimization (TV-MOPSO) algorithm to optimize the CHPEED solution. In TV-MOPSO, the acceleration coefficients are dynamically changed during the optimization process. Li et al. [17] proposed a two-stage approach to solve the CHPEED problem, which combines the multi-objective optimization algorithm -DEA and an integrated decision-making strategy. Sun et al. [28] put forward an indicator- and crowding-distance-based evolutionary algorithm (IDBEA) for the CHPEED problem. Sundaram [29] proposed a hybrid multi-objective algorithm based on NSGA-II and MOPSO (NSGAII-MOPSO) for the CHPEED problem. Sundaram [30] implemented a multi-objective multi-verse optimization (MOMVO) algorithm for the solution of the CHPEED problem. In MOMVO, a chaotic opposition strategy is used for the initial population generation, and it explores the search space extensively. Xiong et al. [31] proposed an improved bare bones MOPSO (IMOBBPSO) algorithm to solve three CHPEED problems. In IBBMOPSO, the adaptive particle update strategy is added to automatically adjust the weight of the personal and global best position, and an external archiving strategy is established to improve the swarm diversity.
1.2. Contributions of This Work
Despite the above research works, there are still two limitations in the existing CHPEED research. Firstly, the existing CHPEED methods do not introduce advanced machine learning technology, and integrating machine learning techniques into multi-objective optimization algorithms may improve their efficiency at solving the CHPEED problem. Secondly, most of the existing works only considered the small-scale CHPEED problem with less than 10 units, and the large-scale CHPEED problem with more than 100 units has not been considered. Based on these considerations, this paper devised a reinforcement-learning-based multi-objective differential evolution (RLMODE) algorithm to deal with the CHPEED problem considering a large-scale system.
Multi-objective differential evolution (MODE) is a multi-objective evolutionary optimization technique. Due to its advantages of simple implementation, good stability, and robustness [32,33], MODE has been applied to solve the many real-world multi-objective problems including power dispatch problems [34,35]. On the other hand, reinforcement learning (RL) is an important machine learning technique. RL studies how an agent learns through interaction with the external environment. RL does not need any prior data, but only needs to accumulate rewards based on the information of the agent learned from the external environment and finally obtains the maximum reward [36].
In this paper, using the RL technique, a novel reinforcement-learning-based multi-objective differential evolution (RLMODE) algorithm is proposed to solve the CHPEED problem.
The main contributions of this paper are listed as follows:
- A novel reinforcement-learning-based multi-objective differential evolution (RLMODE) algorithm is developed.
- The RLMODE algorithm uses RL to automatically adjust the control parameters, which enhances the search ability and stability.
- The RLMODE algorithm was utilized to solve four CHPEED problems including two large-scale CHPEED problems with more than 100 generating units.
- The superiority of the RLMODE algorithm was verified by comparing with well-established multi-objective optimization algorithms.
The rest of the article is structured as follows. Section 2 introduces the mathematical model of CHPEED. Section 3 describes the proposed RLMODE algorithm in detail. Section 4 states the implementation of RLMODE for solving CHPEED. In Section 5, RLMODE is applied to solve four CHPEED problems and compared with other algorithms. Section 6 draws the conclusions.
2. Mathematical Formulation of CHPEED Problem
2.1. Objective Function
2.1.1. Fuel Cost
The total fuel cost is composed of the fuel cost of the PO, CHP, and HO units [25]. The fuel cost objective function is described as follows:
where , , and represent the fuel cost of the PO unit, CHP unit, and HO unit, respectively; , , , and are the power and heat output of three types of units; , , and represent the three types of units.
2.1.2. Gas Emissions
The pollutant gases generated during power generation include , , and . The gas emission objective function is composed of the gas emission of the PO, CHP, and HO units [22], which is described as follows:
where , , and represent the gas emission of the PO unit, CHP unit, and HO unit, respectively.
The gas emission functions of the PO, CHP, and HO units are formulated as follows:
where , , and represent the emission coefficients of the PO, CHP, and HO units.
2.2. Constraints
2.2.1. Power Balance Constraint
The total power generated by all PO and CHP units should be equal to the total power demand plus the transmission loss :
Transmission loss can be calculated by Kron’s loss formula:
where are the coefficients of the B-matrix.
2.2.2. Heat Balance Constraint
The total heat generated by all CHP and HO units should be equal to the total heat demand :
2.2.3. Capacity Constraint of the PO Units
The capacity constraint of the PO units is:
where and are the lower and upper limits of the PO unit, respectively.
2.2.4. Capacity Constraint of the CHP Units
The power and heat produced by the CHP units are coupled to each other and confined to a polygonal region called feasible operation regions, as illustrated in Figure 2. Therefore, the upper and lower power of the jth CHP unit are determined by its heat , and the upper and lower heat of the jth CHP unit are determined by its power :
where and are the functions of the lower and upper power limits in the CHP unit. Similarly, and are the functions of the lower and upper heat limits in the CHP unit, which is shown in Figure 2.
2.2.5. Capacity Constraint of the HO Units
The capacity constraint of the HO units is:
where and are the lower and upper limits of the HO unit, respectively.
3. Proposed RLMODE Algorithm
3.1. MODE Algorithm
3.1.1. Initialization
At the beginning, MODE randomly initializes N candidate solutions as follows:
where and are the lower and upper bounds, respectively; are random real values; D is the number of optimization variables.
3.1.2. Mutation
The differential mutation is the key production operator, which is used to generate the mutant solutions. The classic mutation strategy DE/rand/1 is described as follows:
where is the mutant solution; G is the generation number; are three random numbers and ; is the scale factor for the individual, which is used for scaling the difference vector.
3.1.3. Crossover
The crossover operator aims at increasing the population diversity of the algorithm. The binary crossover operator is described as follows:
where is the offspring solution; is a random real number; is a random integer; is the crossover rate within [0, 1].
3.1.4. Selection
After the crossover operator, the offspring solutions and parent solutions are merged into one large group. Then, the fast nondominated sorting (FNS) and crowding distance (CD) operators are used to select better solutions in the next generation [25]. The FNS approach is shown in Figure 3a. The FNS approach divides the merged population into several frontiers according to the dominance relationship, where the solutions in the frontier S1 are the best level, the solutions in the frontier S2 are the second-best level, and so on. To estimate the density of the individuals in the same frontier, the CD operator is used, as shown in Figure 3b. For the boundary solutions, the CD value was set to infinite ∞; for the other solutions, the CD value of the ith solution is the mean side length of the rectangle consisting of the th and th solutions.
3.2. RLMODE Algorithm
3.2.1. Reinforcement Learning Technique
RL is an important machine learning technique mainly including five elements, namely the environment, agent, state, action, and reward [36]. After the agent executes an action, the environment will turn into a new state. For the impact (positive or negative) caused by the new environmental state, a reward (positive or negative) will be sent to the agent. Then, the agent performs a new action based on the reward and the new state from the environmental feedback, as shown in Figure 4.
The Q-learning technique is a representative value-based RL model [38]. Q-learning is simple in structure and does not require any prior knowledge. It can be learned in the process of performing tasks. The Q-learning framework is shown in Algorithm 1.
The formula for updating the Q value is:
where is the Q value for state and action , is the reward of the current generation, and is the maximum Q value of the action in the next state .
| Algorithm 1 Pseudocode for Q-learning. |
|
3.2.2. Q-Learning Parameter Adjustment
In the proposed RLMODE algorithm, Q-learning is employed to adjust the control parameter (i.e., scale factor ). The Q table is used to record the values of pairs (state, action). As shown in Figure 5, for each individual, the agent has three types of states and three types of actions for each state. The probability of the agent to select different actions in different states is determined according to the values in the Q table.
Three states are defined in RLMODE, i.e.:
- State : the offspring solution dominates its own parent solution, indicating that the mutation operator achieves success, and a positive reward value is assigned ;
- State : the offspring solution does not dominate its own parent solution, but dominates one of the other parent solutions, indicating that the mutation operator is relatively successful, and a middle reward value is assigned ;
- State : the offspring solution does not dominate its own parent solution or the other parent solutions, which indicates that the mutation operator fails, and no reward value is assigned .
Three actions used to adjust the scale factor are: (1) ; (2) ; and (3) .
The probability of each agent selects action in state is determined by the softMax strategy:
where is the selection probability for the agent.
After selecting the action, the agent adjusts its scale factor as follows:
In the RLMODE, each individual has an independent Q table, and therefore, there are in total N Q tables. Each individual updates its Q table independently during the iterative process.
3.2.3. Elite-Guided Mutation
In order to enhance the convergence speed, an elite-guided mutation operator is employed in the RLMODE algorithm. The elite guided mutation operator is shown as follows:
where is one of the top 10% of individuals in the population after the fast nondominated sorting and crowding distance operators.
3.2.4. Pseudocode of RLMODE Algorithm
By using the reinforcement learning technique, the detailed pseudocode of RLMODE is shown in Algorithm 2.
| Algorithm 2 Pseudocode of the RLMODE algorithm. |
|
4. Implementation of RLMODE for Solving CHPEED
The individual is composed of the power and heat output of the PO, CHP, and HO units:
The constraint repair techniques are as follows:
(1) For the power balance constraint, the power output vector is composed of the PO and CHP units, i.e., . The difference value between power production and power demand is defined as:
If ( is a very small positive value), then randomly select a dimension variable from , and is repaired as follows:
After repairing , re-calculate the value of . If , then select another dimension variable from that was not previously selected and continue to repair using Equation (24). The above repair process is repeated until .
(2) For the heat balance constraint, the heat output vector is composed of CHP and HO units, i.e., . The difference value between heat production and heat demand is defined as:
if , then randomly select a dimension variable from , and is repaired as follows:
After repairing , re-calculate the value of . If , then select another dimension variable from that was not previously selected, and continue to repair using Equation (26). The above repair process is repeated until .
(3) The power output of the PO units is repaired as:
(4) The output of the CHP units is repaired as:
(5) The heat output of the HO units is repaired as:
In total, the constraint repair process is shown in Figure 6.
Not all constraints were strictly satisfied after using the constraint repair technique. Therefore, the total constraint violation degree of each individual is calculated as follows:
where and are the violation degree of the power balance and heat balance constraints, respectively; , , and are the violation degree for the PO, CHP, and HO capacity constraints, respectively.
Now, both the objective function and constraint violation degree are obtained. When applying the RLMODE algorithm to handle the CHPEED problem, the constraint domination principle (CDP) [39] is also adopted.
The flowchart of RLMODE for handling CHPEED is shown in Figure 7.
5. Simulation Results
The RLMODE algorithm was utilized to solve four CHPEED problems: 5, 7, 100, and 140 generating units. The effectiveness of the RLMODE algorithm was verified by comparing with four representative multi-objective optimization algorithms, namely TV-MOPSO [27], GDE3 [40], NSGA-II-DE [41], and MODE-RMO [42]. The parameter settings of these multi-objective algorithms are given in Table 1. All the multi-objective algorithms were implemented 30 times independently.
5.1. Case 1: Five-Unit CHPEED Problem
The first case was a five-unit CHPEED problem chosen from [25]. It consists of 1 PO unit, 3 CHP units, and 1 HO unit. The power requirement and heat requirement were 300 MW and 150 MWth, respectively. The computational resource, i.e., maximum functional evaluations was used.
Table 2 presents the results of economic dispatch (EcD), emission dispatch (EmD), and economic emission dispatch (EED) for Case 1. From Table 2, it can be seen that:
- In the case of EcD, the costs of TV-MOPSO, GDE3, NSGA-II-DE, MODE-RMO, and RLMDOE were USD 13,686.49, 13,712.33, 13,700.49, 13,675.28, and 13,674.70, respectively. Therefore, RLMDOE achieved the smallest cost among the five algorithms.
- In case of EmD, the emissions of TV-MOPSO, GDE3, NSGA-II-DE, MODE-RMO, and RLMDOE were 1.21 kg, 1.24 kg, 1.23 kg, 1.23 kg, and 1.21 kg, respectively. Therefore, RLMDOE and TV-MOPSO achieved the smallest emission.
- In the case of EED, the results of the best compromise solutions of the five algorithms were given. The cost and emission of RLMDOE were USD 14,856.36 and 6.09 kg, which were smaller than those of TV-MOPSO, GDE3, NSGA-II-DE, and MODE-RMO. Therefore, RLMODE achieved the best compromise solution. Due to the complexity of the RLMODE algorithm, its simulation time and computational memory were not dominant.
The Pareto-optimal frontier (POF) obtained by TV-MOPSO, GDE3, NSGA-II-DE, MODE-RMO, and RLMODE is plotted in Figure 8.
To quantifiably compare the POF obtained by these algorithms, three performance metrics, i.e., diversity metric (DM) [43], hypervolume (HV) [44], and inverted generational distance (IGD) [45], were further employed to compare the POF obtained by these algorithms. DM measures the diversity of the POF, and a larger DM value means better diversity of the algorithm. HV measures both the convergence and diversity of the POF. A larger HV value indicates the better performance of the algorithm. IGD also measures both convergence and diversity. A smaller IGD value indicates the better performance of the algorithm.
Table 3 presents the statistical results of the DM, HV, and IGD metrics including the minimum, mean, maximum values, and standard deviation (Std) based on 30 independent runs. Meanwhile, the Wilcoxon rank sum test was performed, where “+” and “=” mean RLMODE is significantly better than or similar to the comparison algorithm, respectively. As can be seen from Table 3:
- Concerning DM, the minimum, mean, and maximum values and standard deviation of RLMODE were better than TV-MOPSO, GDE3, NSGA-II-DE, and MODE-RMO.
- Regarding HV, the minimum, mean, and maximum values of RLMODE were better than TV-MOPSO, GDE3, NSGA-II-DE, and MODE-RMO. The standard deviation of RLMODE was the second-best after TV-MOPSO.
- Considering IGD, the mean and maximum values and standard deviation of RLMODE were better than TV-MOPSO, GDE3, NSGA-II-DE, and MODE-RMO. The minimum IGD of RLMODE was the second-best after TV-MOPSO.
- Based on the Wilcoxon test, RLMODE was notably better than GDE3, NSGA-II-DE, and MODE-RMO in terms of DM, HV, and IGD. RLMODE was notably better than TV-MOPSO in terms of HV and similar to TV-MOPSO in terms of DM and IGD.
From the above analysis, the RLMODE algorithm achieved the overall best performance among in the aspects of convergence and diversity for Case 1.
5.2. Case 2: Seven-Unit CHPEED Problem
The second case was the seven-unit CHPEED problem selected from [25]. It consisted of 4 PO units, 2 CHP units, and 1 HO unit. The power requirement and heat requirement were 600 MW and 150 MWth, respectively. The maximum computational resource was used.
Table 4 presents the results of the EcD, EmD, and EED for Case 2. From Table 4, it can be seen that:
- In the case of EcD, the costs of TV-MOPSO, GDE3, NSGA-II-DE, MODE-RMO, and RLMDOE were USD 10,261.88, 10,298.40, 10,222.16, 10,249.37, and 10,212.26. Therefore, RLMDOE achieved the smallest cost among the five algorithms.
- In the case of EmD, the emissions of TV-MOPSO, GDE3, NSGA-II-DE, MODE-RMO, and RLMDOE were 7.75 kg, 7.88 kg, 7.74 kg, 7.59 kg, and 7.54 kg, respectively. Therefore, RLMDOE achieved the smallest emission among the five algorithms.
- In the case of EED, the cost and emission of RLMDOE were USD 12,000.28 and 18.42 kg, which were smaller than those of TV-MOPSO, GDE3, NSGA-II-DE, and MODE-RMO. Therefore, RLMODE achieved the best compromise solution.
The Pareto-optimal frontier (POF) obtained by TV-MOPSO, GDE3, NSGA-II-DE, MODE-RMO, and RLMODE is plotted in Figure 9.
Table 5 presents the statistical results of the performance metrics based on 30 independent runs. As can be seen from Table 5:
- Concerning DM, the minimum, mean, and maximum values of RLMODE were better than TV-MOPSO, GDE3, NSGA-II-DE, and MODE-RMO.
- Regarding HV, the minimum, mean, and maximum values and standard deviation of RLMODE were better than TV-MOPSO, GDE3, NSGA-II-DE, and MODE-RMO.
- Considering IGD, the minimum and mean values and standard deviation of RLMODE were better than TV-MOPSO, GDE3, NSGA-II-DE, and MODE-RMO. The maximum IGD of RLMODE was the second-best after NSGA-II-DE.
- Based on the Wilcoxon test, RLMODE was notably better than TV-MOPSO, GDE3, NSGA-II-DE, and MODE-RMO in terms of DM, HV, and IGD.
From the above analysis, the RLMODE algorithm achieved the overall best performance in the aspects of convergence and diversity for Case 2.
5.3. Case 3: 100-Unit CHPEED Problem
The third case was a 100-unit CHPEED problem, which was established by duplicating Case 1 20 times. It consisted of 20 PO units, 60 CHP units, and 20 HO units. The power requirement and heat requirement were 6000 MW and 3000 MWth, respectively. The maximum computational resource 20,000 was used.
Table 6 presents the cost and emission results of the EcD, EmD, and EED for Case 3. Due to the large size of 100 units, the detailed dispatch results of the PO, HO, and CHP units by the other algorithms are given in Tables S1–S3 in the Supplementary File. From Table 6, it can be seen that:
- In the case of EcD, the costs of TV-MOPSO, GDE3, NSGA-II-DE, MODE-RMO, and RLMDOE were USD 284,998.66, 280,781.47, 278,648.30, 278,670.12, and 278,102.84, respectively. Therefore, RLMDOE achieved the smallest cost.
- In the case of EmD, the emissions of TV-MOPSO, GDE3, NSGA-II-DE, MODE-RMO, and RLMDOE were 45.49 kg, 33.93 kg, 26.39 kg, 30.99 kg, and 25.56 kg, respectively. Therefore, RLMDOE achieved the smallest emission.
- In the case of EED, the cost and emission of RLMDOE were USD 292,647.89 and 153.57 kg, which were smaller than those of TV-MOPSO, GDE3, NSGA-II-DE, and MODE-RMO. Therefore, RLMODE achieved the best compromise solution.
The Pareto-optimal frontier (POF) obtained by TV-MOPSO, GDE3, NSGA-II-DE, MODE-RMO, and RLMODE is plotted in Figure 10.
Table 7 presents the statistical results of the performance metrics based on 30 independent runs. As can be seen from Table 7:
- Concerning DM, the minimum and mean values and standard deviation of RLMODE were better than TV-MOPSO, GDE3, NSGA-II-DE, and MODE-RMO. The maximum DM of RLMODE was the second-best after NSGA-II-DE.
- Regarding HV, the minimum, mean, and maximum values and standard deviation of RLMODE were better than TV-MOPSO, GDE3, NSGA-II-DE, and MODE-RMO.
- Considering IGD, the minimum, mean, and maximum values and standard deviation of RLMODE were better than TV-MOPSO, GDE3, NSGA-II-DE, and MODE-RMO.
- Based on the Wilcoxon test, RLMODE was notably better than TV-MOPSO, GDE3, NSGA-II-DE, and MODE-RMO in terms of DM, HV, and IGD.
Therefore, the RLMODE algorithm achieved the overall best performance among the five algorithms in the aspects of convergence and diversity for the large-scale Case 3.
5.4. Case 4: 140-Unit CHPEED Problem
The third case was a 140-unit CHPEED problem, which was established by duplicating 7-unit Case 2 20 times. It consisted of 80 PO units, 40 CHP units, and 20 HO units. The power requirement and heat requirement were 12,000 MW and 3000 MWth, respectively. The maximum computational resource 30,000 was used.
Table 8 presents the cost and emission results of the EcD, EmD, and EED for Case 4. Due to the large size of the 140 units, the detailed dispatch results of the PO, HO, and CHP units by the other algorithms are given in Tables S4–S6 in the Supplementary File. From Table 8, it can be seen that:
- In the case of EcD, the costs of TV-MOPSO, GDE3, NSGA-II-DE, MODE-RMO, and RLMDOE were USD 237,703.69, 224,936.75, 239,690.11, 225,670.28, and 216,483.24, respectively. Therefore, RLMDOE achieved the smallest cost.
- In the case of EmD, the emissions of TV-MOPSO, GDE3, NSGA-II-DE, MODE-RMO, and RLMDOE were 194.38 kg, 201.67 kg, 180.39 kg, 191.32 kg, and 172.18 kg, respectively. Therefore, RLMDOE achieved the smallest emission.
- In the case of EED, the cost and emission of RLMDOE were USD 239,690.11 and 391.68kg, which were smaller than those of TV-MOPSO, GDE3, NSGA-II-DE, and MODE-RMO. Therefore, RLMODE achieved the best compromise solution.
The Pareto-optimal frontier (POF) obtained by TV-MOPSO, GDE3, NSGA-II-DE, MODE-RMO, and RLMODE is plotted in Figure 11.
Table 9 presents the statistical results of the performance metrics based on 30 independent runs. As can be seen from Table 9:
- Concerning DM, the minimum, mean, and maximum values of RLMODE were better than those of TV-MOPSO, GDE3, NSGA-II-DE, and MODE-RMO. The standard deviation of RLMODE was the second-best after NSGA-II-DE.
- Regarding HV, the minimum, mean, and maximum values and standard deviation of RLMODE were better than those of TV-MOPSO, GDE3, NSGA-II-DE, and MODE-RMO. The standard deviation of RLMODE was the second-best after NSGA-II-DE.
- Considering IGD, the minimum and mean values of RLMODE were better than those of TV-MOPSO, GDE3, NSGA-II-DE, and MODE-RMO. The maximum IGD and standard deviation of RLMODE were the second-best after NSGA-II-DE.
- Based on the Wilcoxon test, RLMODE was notably better than TV-MOPSO, GDE3, NSGA-II-DE, and MODE-RMO in terms of DM, HV, and IGD.
Therefore, the RLMODE algorithm achieved the overall best performance in the aspects of convergence and diversity for the large-scale Case 4.
6. Conclusions
In this paper, a reinforcement-learning-based multi-objective differential evolution (RLMODE) algorithm was devised to deal with the CHPEED problem considering large-scale systems with more than 100 units. In RLMODE, a reinforcement learning technique called Q-learning was employed to adjust the scale factor parameters. The constraint repair technique and constraint domination principle were employed to deal with complex operating constraints in CHPEED. The suggested RLMODE was applied to solve four CHPEED problems with 5, 7, 100, and 140 units and compared with well-established multi-objective algorithms. The main findings are summarized below:
- For two small-scale CHPEED problems with 5 and 7 units, the proposed RLMODE achieved better results in the case of economic dispatch (EcD), emission dispatch (EmD), and economic emission dispatch (EED). The costs and emissions of RLMODE were less than the four compared algorithms, TV-MOPSO, GDE3, NSGA-II-DE, and MODE-RMO.
- For two large-scale CHPEED problems with 100 and 140 units, the proposed RLMODE also achieved the best results in the case of EcD, EmD, and EED. The costs and emissions of RLMODE were the smallest among the compared algorithms.
- Considering the performance metrics of the Pareto-optimal Front (i.e., DM, HV, and IGD), the suggested RLMODE obtained better results than the compared algorithms, and the Wilcoxon rank sum test indicated that the superiority was significant.
The proposed RLMODE showed its effectiveness for the CHPEED problem. The good performance of RLMODE benefited from the reinforcement-learning-based parameter adjustment technique. There are some promising research for future work. Firstly, the multi-region power system is very important, and it is a promising work to improve the RLMODE algorithm to solve the multi-region CHPEED problem. In addition, CHP unit commitment is seldomly studied in the existing research, and the development of efficient optimization method for the CHP unit commitment problem is also worth investigation.
Supplementary Materials
The following Supporting Information can be downloaded at https://www.mdpi.com/article/10.3390/en16093753/s1. Table S1: Detailed results of economic dispatch for 100-unit CHPEED problem; Table S2: Detailed results of emission dispatch for 100-unit CHPEED problem; Table S3: Detailed results of economic emission dispatch for 100-unit CHPEED problem; Table S4: Detailed results of economic dispatch for 140-unit CHPEED problem; Table S5: Detailed results of emission dispatch for 140-unit CHPEED problem; Table S6: Detailed results of economic emission dispatch for 140-unit CHPEED problem; Table S7: All variables in the article.
Author Contributions
Conceptualization, X.C. and S.F.; methodology, X.C. and K.L.; software, S.F.; validation, X.C., S.F. and K.L.; formal analysis, X.C.; investigation, S.F.; resources, X.C.; data curation, S.F.; writing—original draft preparation, S.F.; writing—review and editing, X.C.; visualization, S.F.; supervision, X.C.; project administration, X.C. and K.L.; funding acquisition, K.L. All authors have read and agreed to the published version of the manuscript.
Funding
This research was supported by the National Natural Science Foundation of China (61873114) and the Youth Program of the Faculty of Agricultural Equipment in Jiangsu University (NZXB20210211).
Data Availability Statement
The data that support the findings of this study are available from the corresponding author upon reasonable request.
Conflicts of Interest
The authors declare no conflict of interest.
References
- Yang, W.; Peng, Z.; Yang, Z.; Guo, Y.; Chen, X. An enhanced exploratory whale optimization algorithm for dynamic economic dispatch. J. Abbr. 2021, 7, 7015–7029. [Google Scholar] [CrossRef]
- Nazari-Heris, M.; Mohammadi, I.B.; Asadi, S.; Geem, Z. Large-scale combined heat and power economic dispatch using a novel multi-player harmony search method. Appl. Therm. Eng. 2019, 154, 493–504. [Google Scholar] [CrossRef]
- Chen, X.; Shen, A. Self-adaptive differential evolution with Gaussian–Cauchy mutation for large-scale CHP economic dispatch problem. Neural Comput. Appl. 2022, 34, 11769–11787. [Google Scholar] [CrossRef]
- Rooijers, F.J.; van Amerongen, A.R.A. Static economic dispatch for co-generation systems. IEEE Trans. Power Syst. 1994, 9, 1392–1398. [Google Scholar] [CrossRef]
- Wong, K.P.; Algie, C. Evolutionary programming approach for combined heat and power dispatch. IEEE Trans. Power Syst. 2002, 61, 227–232. [Google Scholar] [CrossRef]
- Rong, A.; Lahdelma, R. An efficient envelope-based Branch and Bound algorithm for non-convex combined heat and power production planning. Eur. J. Oper. Res. 2007, 183, 412–431. [Google Scholar] [CrossRef]
- Zou, D.; Li, S.; Kong, X.; Ouyang, H.; Li, Z. Solving the combined heat and power economic dispatch problems by an improved genetic algorithm and a new constraint handling strategy. Appl. Energy 2019, 237, 646–670. [Google Scholar] [CrossRef]
- Srivastava, A.; Das, D.K. A new Kho-Kho optimization Algorithm: An application to solve combined emission economic dispatch and combined heat and power economic dispatch problem. Eng. Appl. Artif. Intell. 2020, 94, 103763. [Google Scholar] [CrossRef]
- Liu, D.; Hu, Z.; Su, Q.; Liu, M. A niching differential evolution algorithm for the large-scale combined heat and power economic dispatch problem. Appl. Soft Comput. 2021, 113, 108017. [Google Scholar] [CrossRef]
- Zou, D.; Gong, D. Differential evolution based on migrating variables for the combined heat and power dynamic economic dispatch. Energy 2022, 238, 121664. [Google Scholar] [CrossRef]
- Chen, X.; Li, K. Collective information-based particle swarm optimization for multi-fuel CHP economic dispatch problem. Knowl.-Based Syst. 2022, 248, 108902. [Google Scholar] [CrossRef]
- Shaheen, A.M.; El-Sehiemy, R.A.; Elattar, E.; Ginidi, A.R. An Amalgamated Heap and Jellyfish Optimizer for economic dispatch in Combined heat and power systems including N-1 Unit outages. Energy 2022, 246, 123351. [Google Scholar] [CrossRef]
- Rizk-Allah, R.M.; Hassanien, A.E.; Snášel, V. A hybrid chameleon swarm algorithm with superiority of feasible solutions for optimal combined heat and power economic dispatch problem. Energy 2022, 254, 124340. [Google Scholar] [CrossRef]
- Ramachandran, M.; Mirjalili, S.; Nazari-Heris, M.; Parvathysankar, D.S.; Sundaram, A.; Gnanakkan, C.A.R.C. A hybrid grasshopper optimization algorithm and Harris hawks optimizer for combined heat and power economic dispatch problem. Eng. Appl. Artif. Intell. 2022, 111, 104753. [Google Scholar] [CrossRef]
- Ramachandran, M.; Mirjalili, S.; Ramalingam, M.M.; Gnanakkan, C.A.R.C.; Parvathysankar, D.S.; Sundaram, A. A ranking-based fuzzy adaptive hybrid crow search algorithm for combined heat and power economic dispatch. Expert Syst. Appl. 2022, 197, 116625. [Google Scholar] [CrossRef]
- Yang, Q.; Liu, P.; Zhang, J.; Dong, N. Combined heat and power economic dispatch using an adaptive cuckoo search with differential evolution mutation. Appl. Energy 2022, 307, 118057. [Google Scholar] [CrossRef]
- Li, Y.; Wang, J.; Zhao, D.; Li, G.; Chen, C. A two-stage approach for combined heat and power economic emission dispatch: Combining multi-objective optimization with integrated decision making. Energy 2018, 162, 237–254. [Google Scholar] [CrossRef]
- Elaiw, A.; Xia, X.; Shehata, A. Combined heat and power dynamic economic dispatch with emission limitations using hybrid DE-SQP method. Abstr. Appl. Anal. Hindawi 2013, 2013, 1–10. [Google Scholar] [CrossRef]
- Ahmadi, A.; Moghimi, H.; Nezhad, A.E.; Agelidis, V.G.; Sharaf, A.M. Multi-objective economic emission dispatch considering combined heat and power by normal boundary intersection method. Electr. Power Syst. Res. 2015, 129, 32–43. [Google Scholar] [CrossRef]
- Anand, H.; Narang, N. Civilized swarm optimization for combined heat and power economic emission dispatch. In Proceedings of the 2016 7th India International Conference on Power Electronics (IICPE), Patiala, India, 17–19 November 2016; pp. 1–6. [Google Scholar]
- Sadeghian, H.; Ardehali, M. A novel approach for optimal economic dispatch scheduling of integrated combined heat and power systems for maximum economic profit and minimum environmental emissions based on Benders decomposition. Energy 2016, 102, 10–23. [Google Scholar] [CrossRef]
- Alomoush, M.I. Application of the stochastic fractal search algorithm and compromise programming to combined heat and power economic–emission dispatch. Eng. Optim. 2020, 52, 1992–2010. [Google Scholar] [CrossRef]
- Jadoun, V.K.; Prashanth, G.R.; Joshi, S.S.; Narayanan, K.; Malik, H.; Márquez, F.P.G.A. Optimal fuzzy based economic emission dispatch of combined heat and power units using dynamically controlled Whale Optimization Algorithm. Appl. Energy 2022, 315, 119033. [Google Scholar] [CrossRef]
- Niknam, T.; Azizipanah-Abarghooee, R.; Roosta, A.; Amiri, B. A new multi-objective reserve constrained combined heat and power dynamic economic emission dispatch. Energy 2012, 42, 530–545. [Google Scholar] [CrossRef]
- Basu, M. Combined heat and power economic emission dispatch using nondominated sorting genetic algorithm-II. Int. J. Electr. Power Energy Syst. 2013, 53, 135–141. [Google Scholar] [CrossRef]
- Shi, B.; Yan, L.; Wu, W. Multi-objective optimization for combined heat and power economic dispatch with power transmission loss and emission reduction. Energy 2013, 56, 135–143. [Google Scholar] [CrossRef]
- ali Shaabani, Y.; Seifi, A.R.; Kouhanjani, M.J. Stochastic multi-objective optimization of combined heat and power economic/emission dispatch. Energy 2017, 141, 1892–1904. [Google Scholar] [CrossRef]
- Sun, J.; Deng, J.; Li, Y. Indicator & crowding distance-based evolutionary algorithm for combined heat and power economic emission dispatch. Appl. Soft Comput. 2020, 90, 106158. [Google Scholar]
- Sundaram, A. Combined heat and power economic emission dispatch using hybrid NSGA II-MOPSO algorithm incorporating an effective constraint handling mechanism. IEEE Access 2020, 8, 13748–13768. [Google Scholar] [CrossRef]
- Sundaram, A. Multiobjective multi-verse optimization algorithm to solve combined economic, heat and power emission dispatch problems. Appl. Soft Comput. 2020, 91, 106195. [Google Scholar] [CrossRef]
- Xiong, G.; Shuai, M.; Hu, X. Combined heat and power economic emission dispatch using improved bare-bone multi-objective particle swarm optimization. Energy 2022, 244, 123108. [Google Scholar] [CrossRef]
- Storn, R.; Price, K. Differential evolution–a simple and efficient heuristic for global optimization over continuous spaces. J. Glob. Optim. 1997, 11, 341–359. [Google Scholar] [CrossRef]
- Wang, X.; Dong, Z.; Tang, L. Multiobjective differential evolution with personal archive and biased self-adaptive mutation selection. IEEE Trans. Syst. Man, Cybern. Syst. 2018, 50, 5338–5350. [Google Scholar] [CrossRef]
- Basu, M. Economic environmental dispatch using multi-objective differential evolution. Appl. Soft Comput. 2011, 11, 2845–2853. [Google Scholar] [CrossRef]
- Qiao, B.; Liu, J.; Hao, X. A multi-objective differential evolution algorithm and a constraint handling mechanism based on variables proportion for dynamic economic emission dispatch problems. Appl. Soft Comput. 2021, 108, 107419. [Google Scholar] [CrossRef]
- Hu, Z.; Gong, W.; Li, S. Reinforcement learning-based differential evolution for parameters extraction of photovoltaic models. Energy Rep. 2021, 7, 916–928. [Google Scholar] [CrossRef]
- Chen, X.; Tang, G. Solving static and dynamic multi-area economic dispatch problems using an improved competitive swarm optimization algorithm. Energy 2022, 238, 122035. [Google Scholar] [CrossRef]
- Watkins, C.J.; Dayan, P. Q-learning. Mach. Learn. 1992, 8, 279–292. [Google Scholar] [CrossRef]
- Deb, K.; Pratap, A.; Agarwal, S.; Meyarivan, T. A fast and elitist multiobjective genetic algorithm: NSGA-II. IEEE Trans. Evol. Comput. 2002, 6, 182–197. [Google Scholar] [CrossRef]
- Marek, M.; Kadlec, P. Another evolution of generalized differential evolution: Variable number of dimensions. Eng. Optim. 2022, 7, 61–80. [Google Scholar] [CrossRef]
- Li, H.; Zhang, Q. Multiobjective optimization problems with complicated Pareto sets, MOEA/D and NSGA-II. IEEE Trans. Evol. Comput. 2008, 13, 284–302. [Google Scholar] [CrossRef]
- Chen, X.; Du, W.; Qian, F. Multi-objective differential evolution with ranking-based mutation operator and its application in chemical process optimization. Chemom. Intell. Lab. Syst. 2014, 136, 85–96. [Google Scholar] [CrossRef]
- Deb, K.; Jain, S. Running performance metrics for evolutionary multi-objective optimization. In Proceedings of the Fourth Asia-Pacific Conference on Simulated Evolution and Learning (SEAL02), Singapore, 18–22 November 2002; pp. 13–20. [Google Scholar]
- Zitzler, E.; Thiele, L. Multiobjective evolutionary algorithms: A comparative case study and the strength Pareto approach. IEEE Trans. Evol. Comput. 1999, 3, 257–271. [Google Scholar] [CrossRef]
- Coello, C.A.C.; Cortés, N.C. Solving multiobjective optimization problems using an artificial immune system. Genet. Program. Evolvable Mach. 2005, 6, 163–190. [Google Scholar] [CrossRef]
Figure 1.
Cost curve with valve point effect.

Figure 2.
Capacity constraint of two typical CHP units.
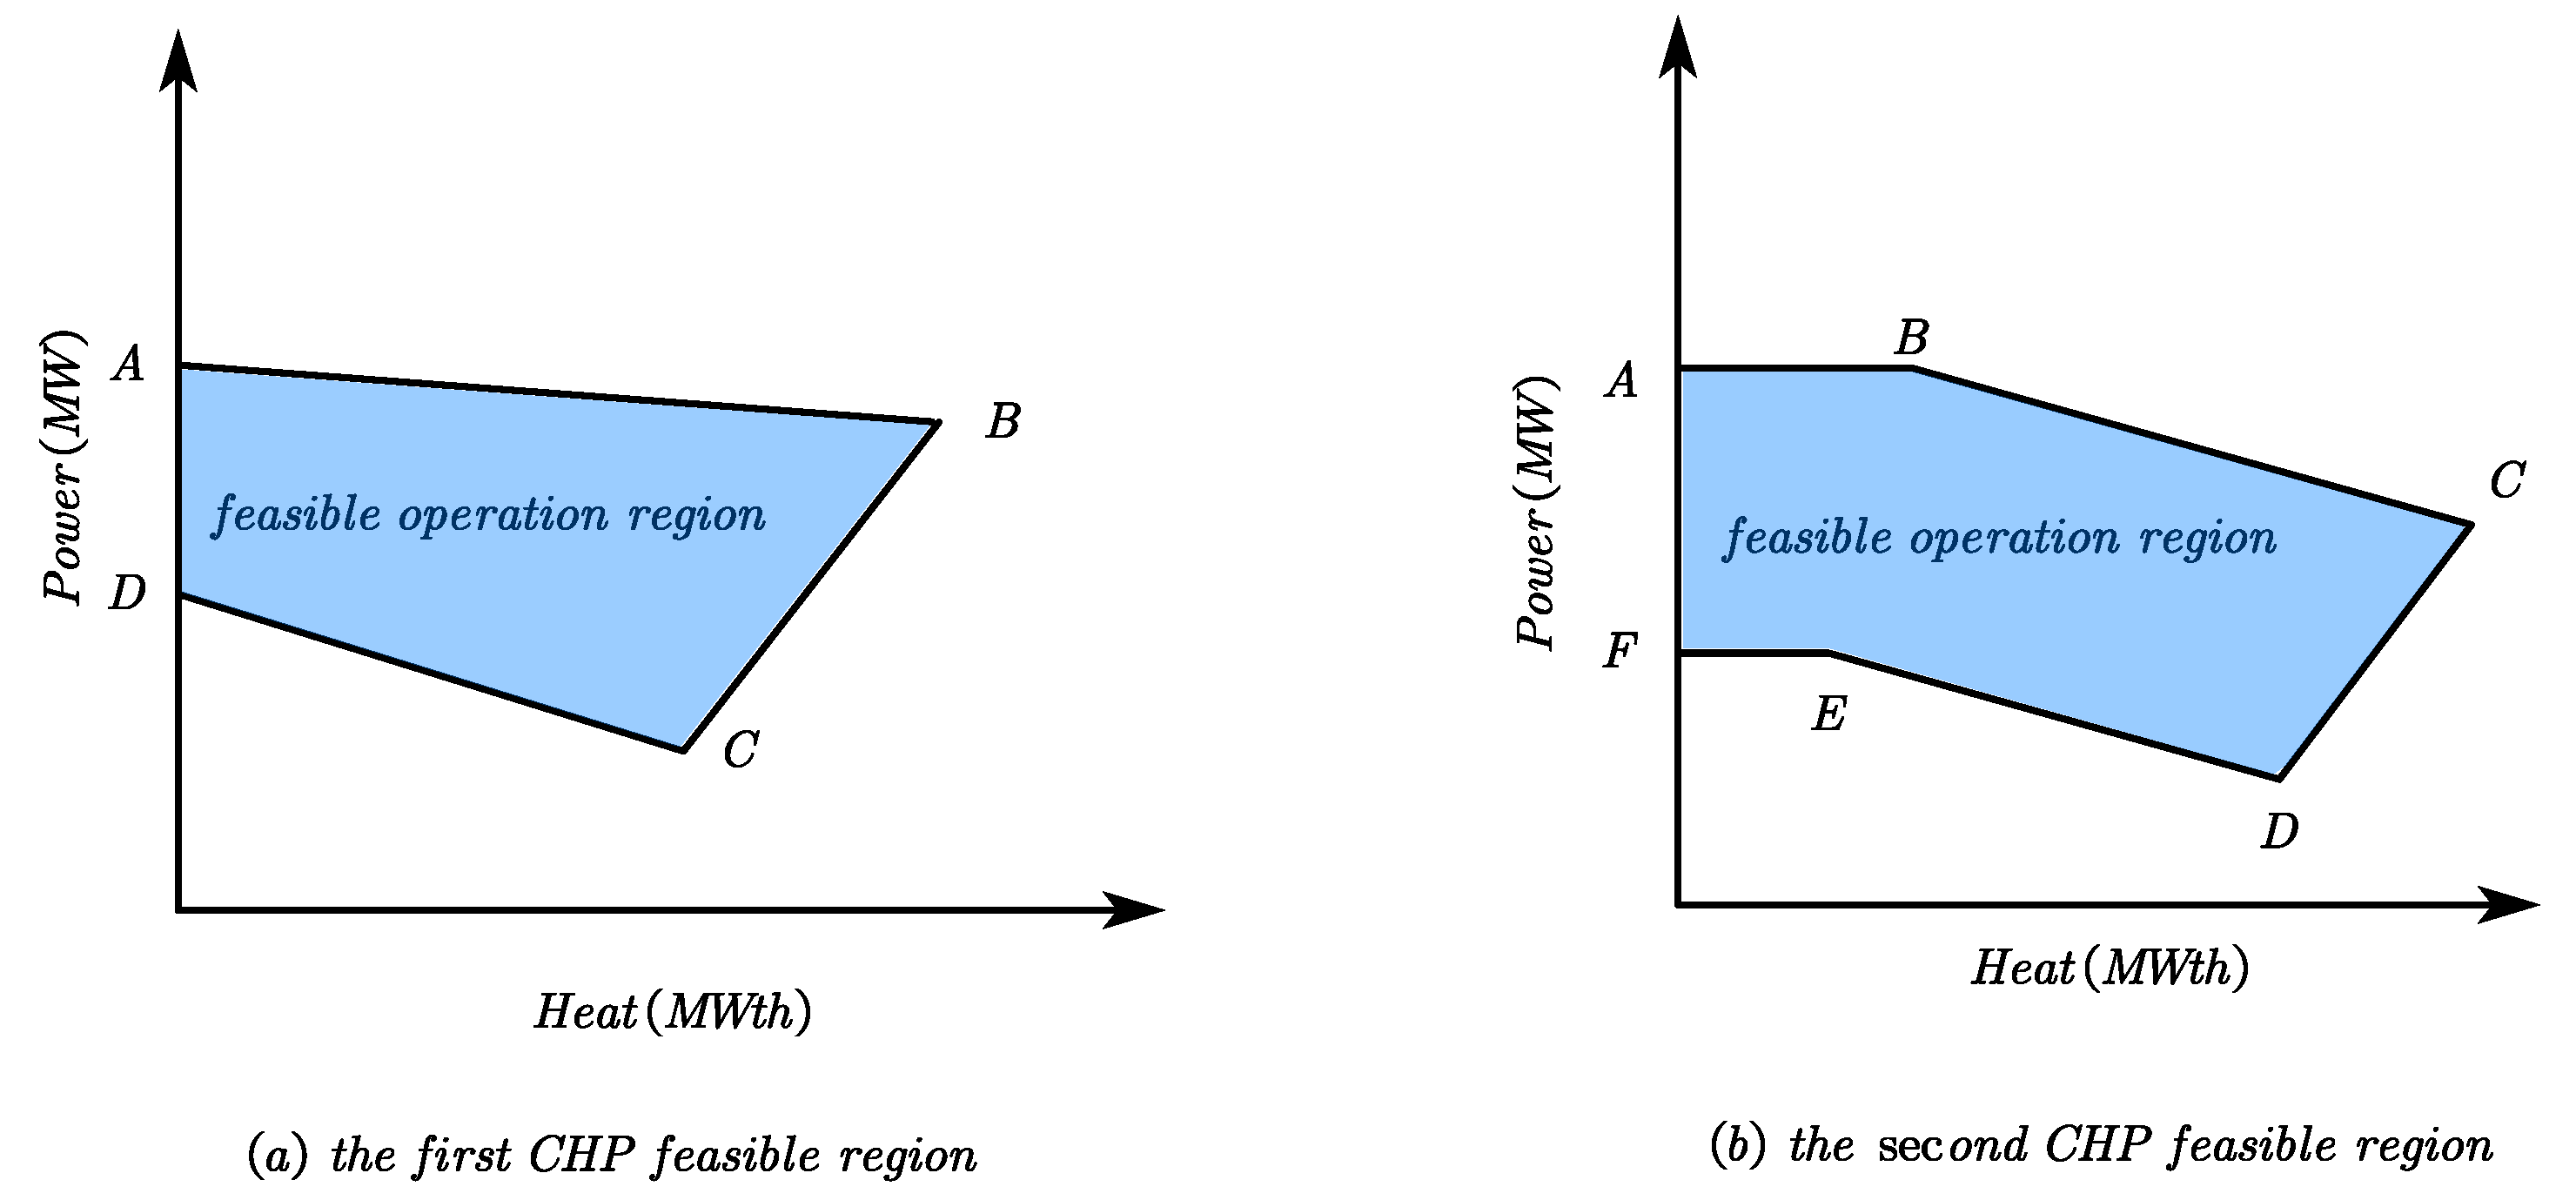
Figure 3.
Fast nondominated sorting and crowding distance.

Figure 4.
Agent–environment interaction of learning.

Figure 5.
Q table for one agent.

Figure 6.
Constraint repair process for individual .

Figure 7.
Flowchart of RLMODE for solving CHPEED.
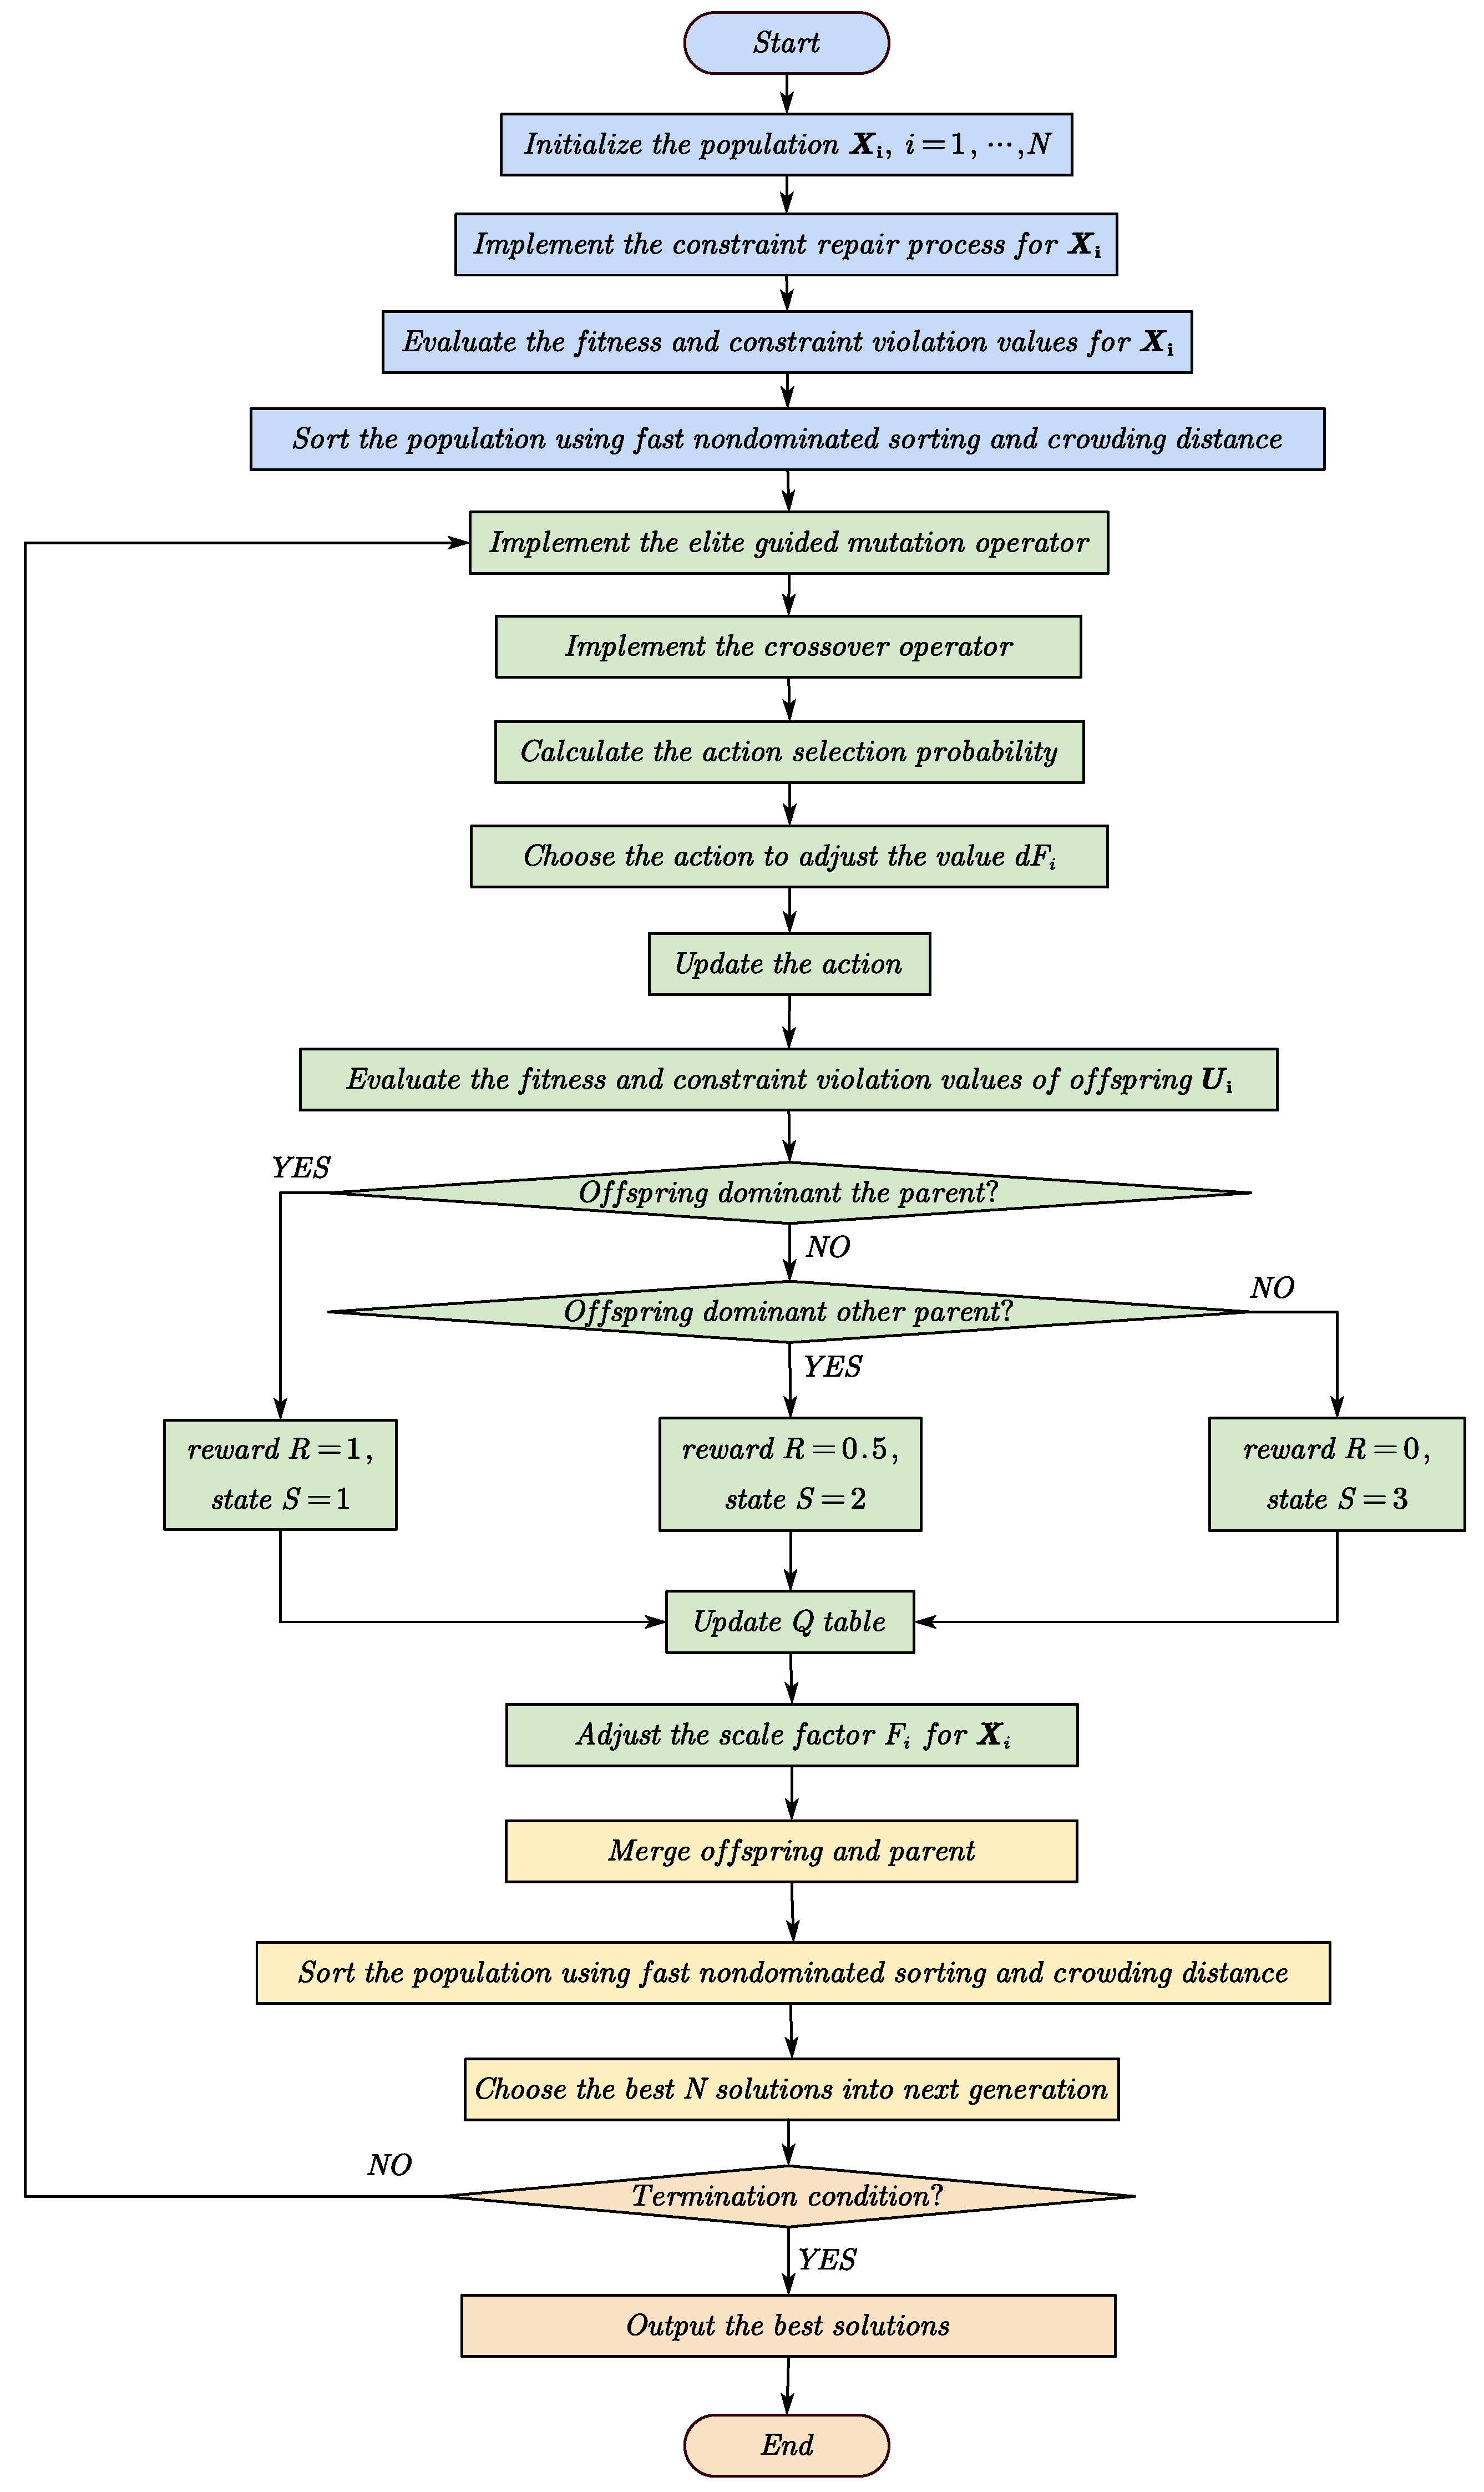
Figure 8.
Comparison of Pareto-optimal frontier for the 5-unit CHPEED problem.
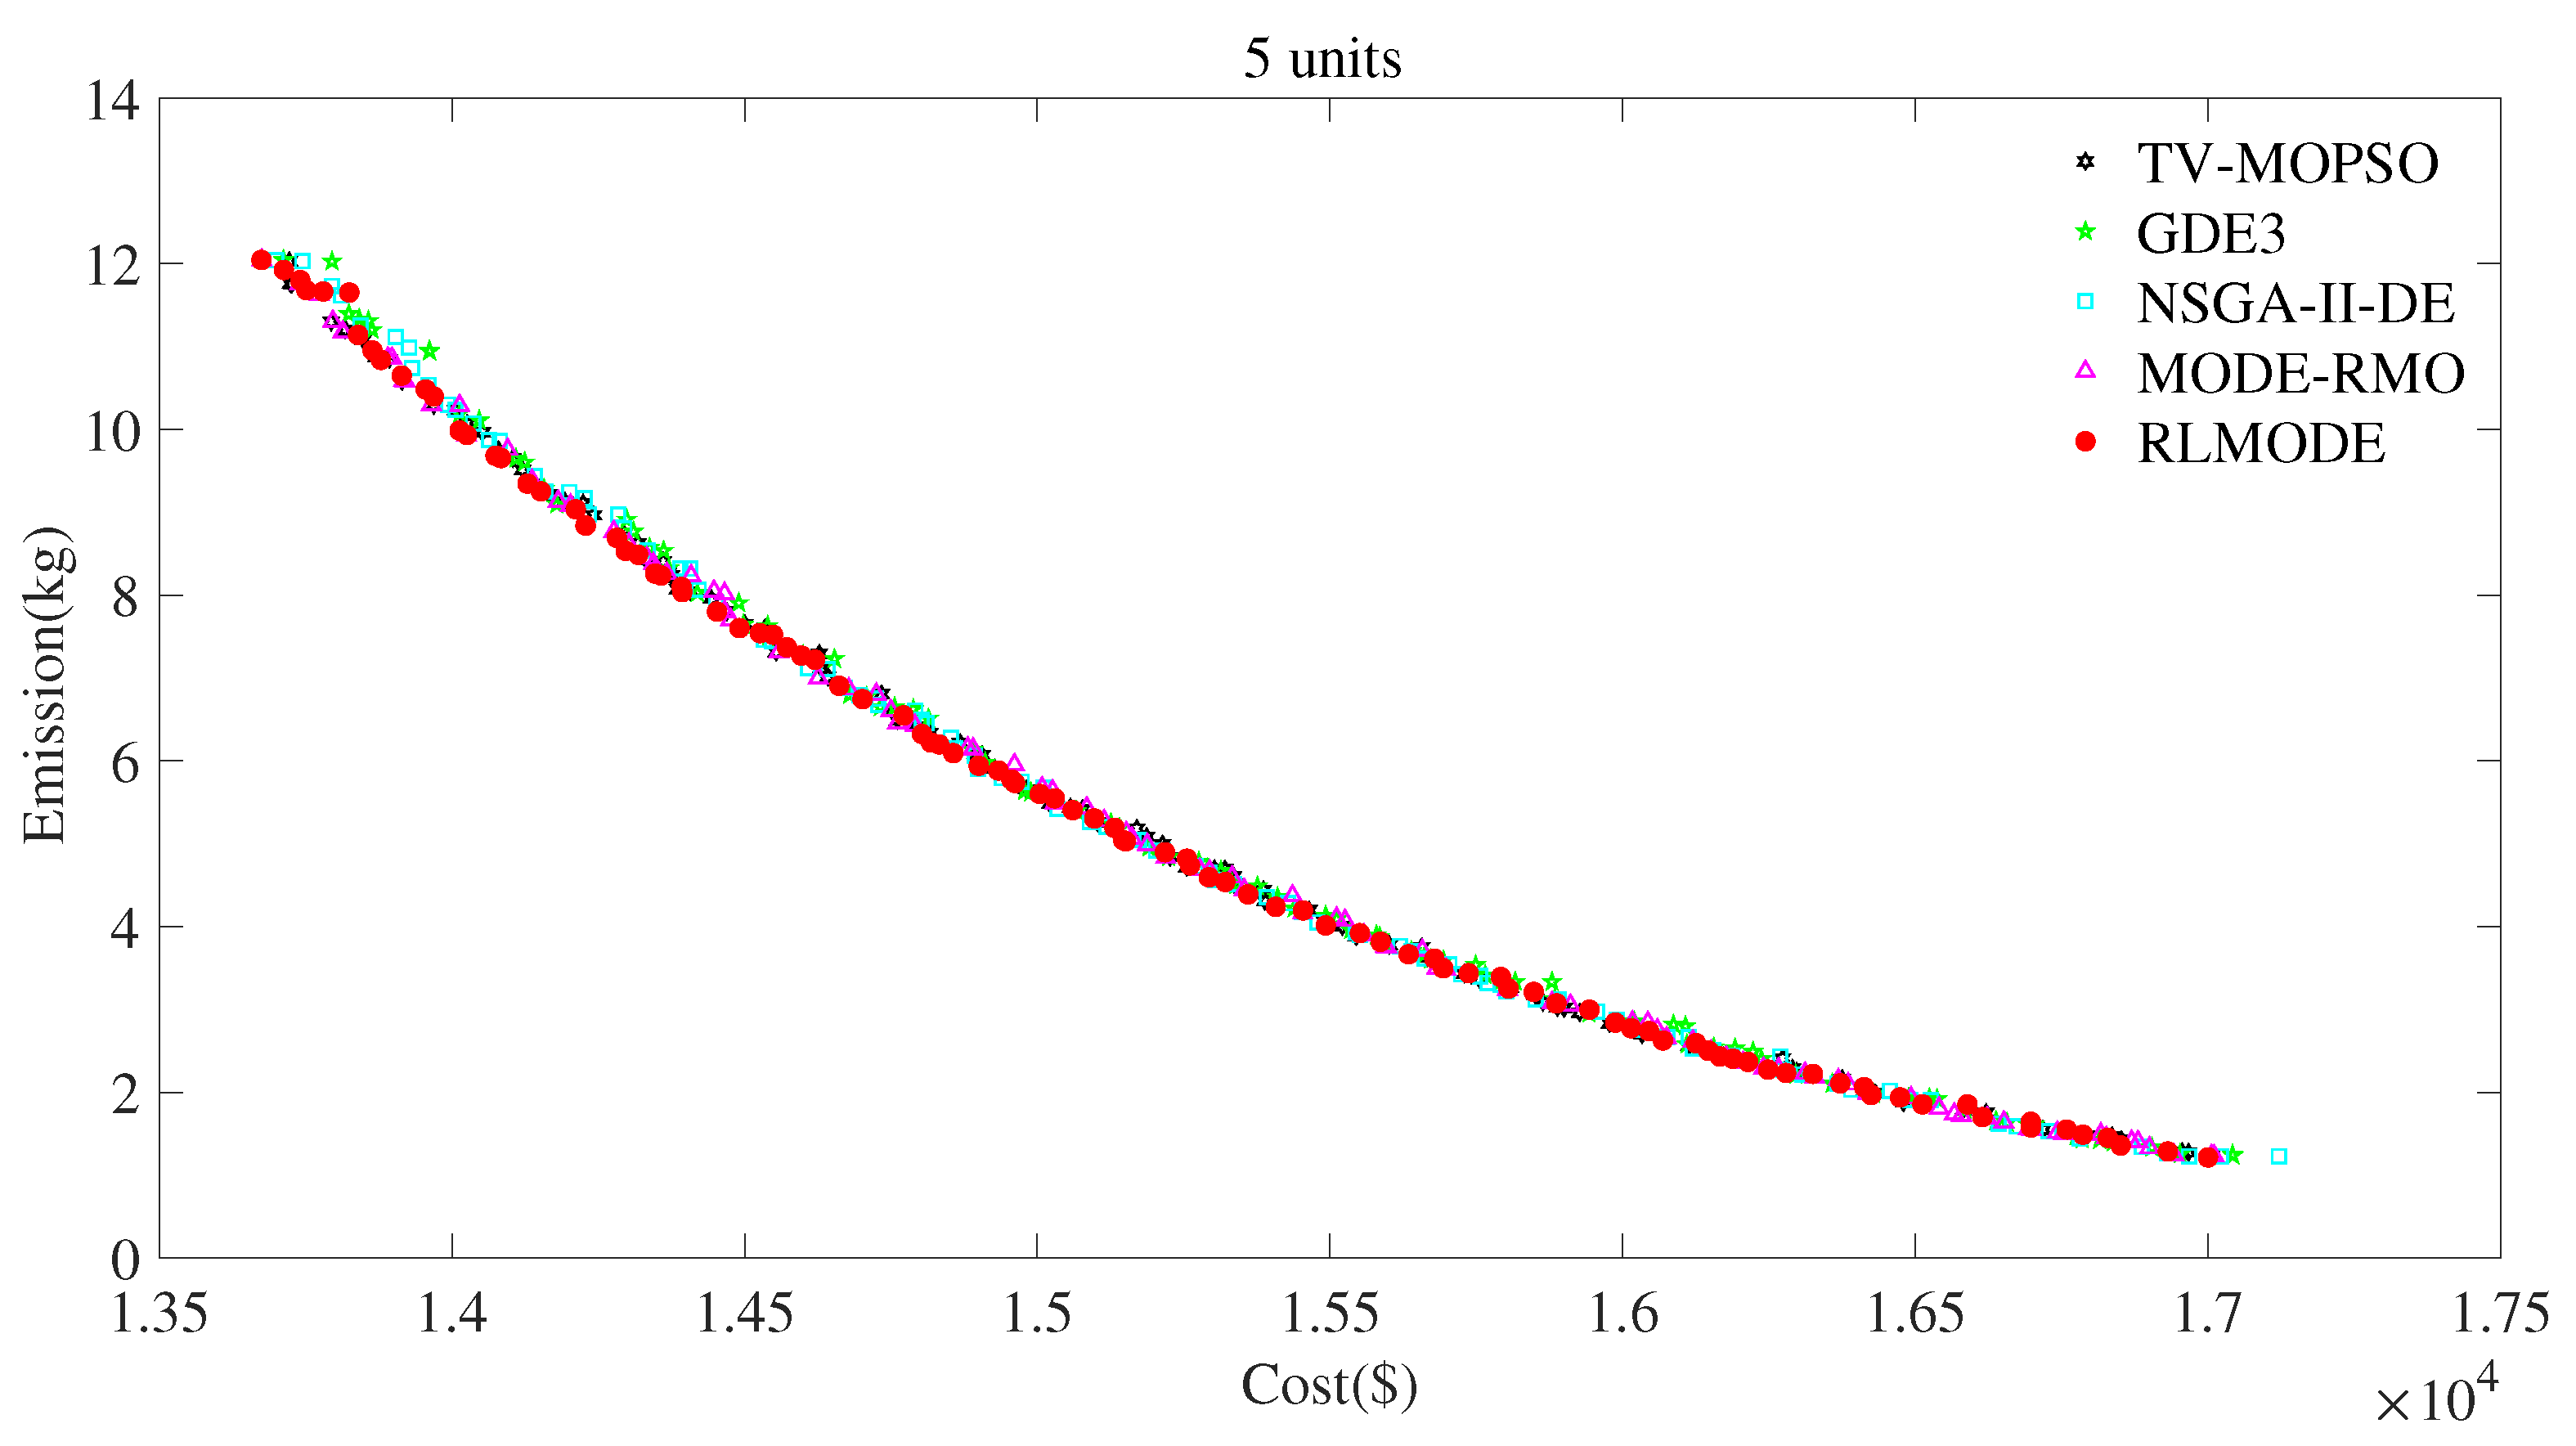
Figure 9.
Comparison of Pareto-optimal frontier for the 7-unit CHPEED problem.
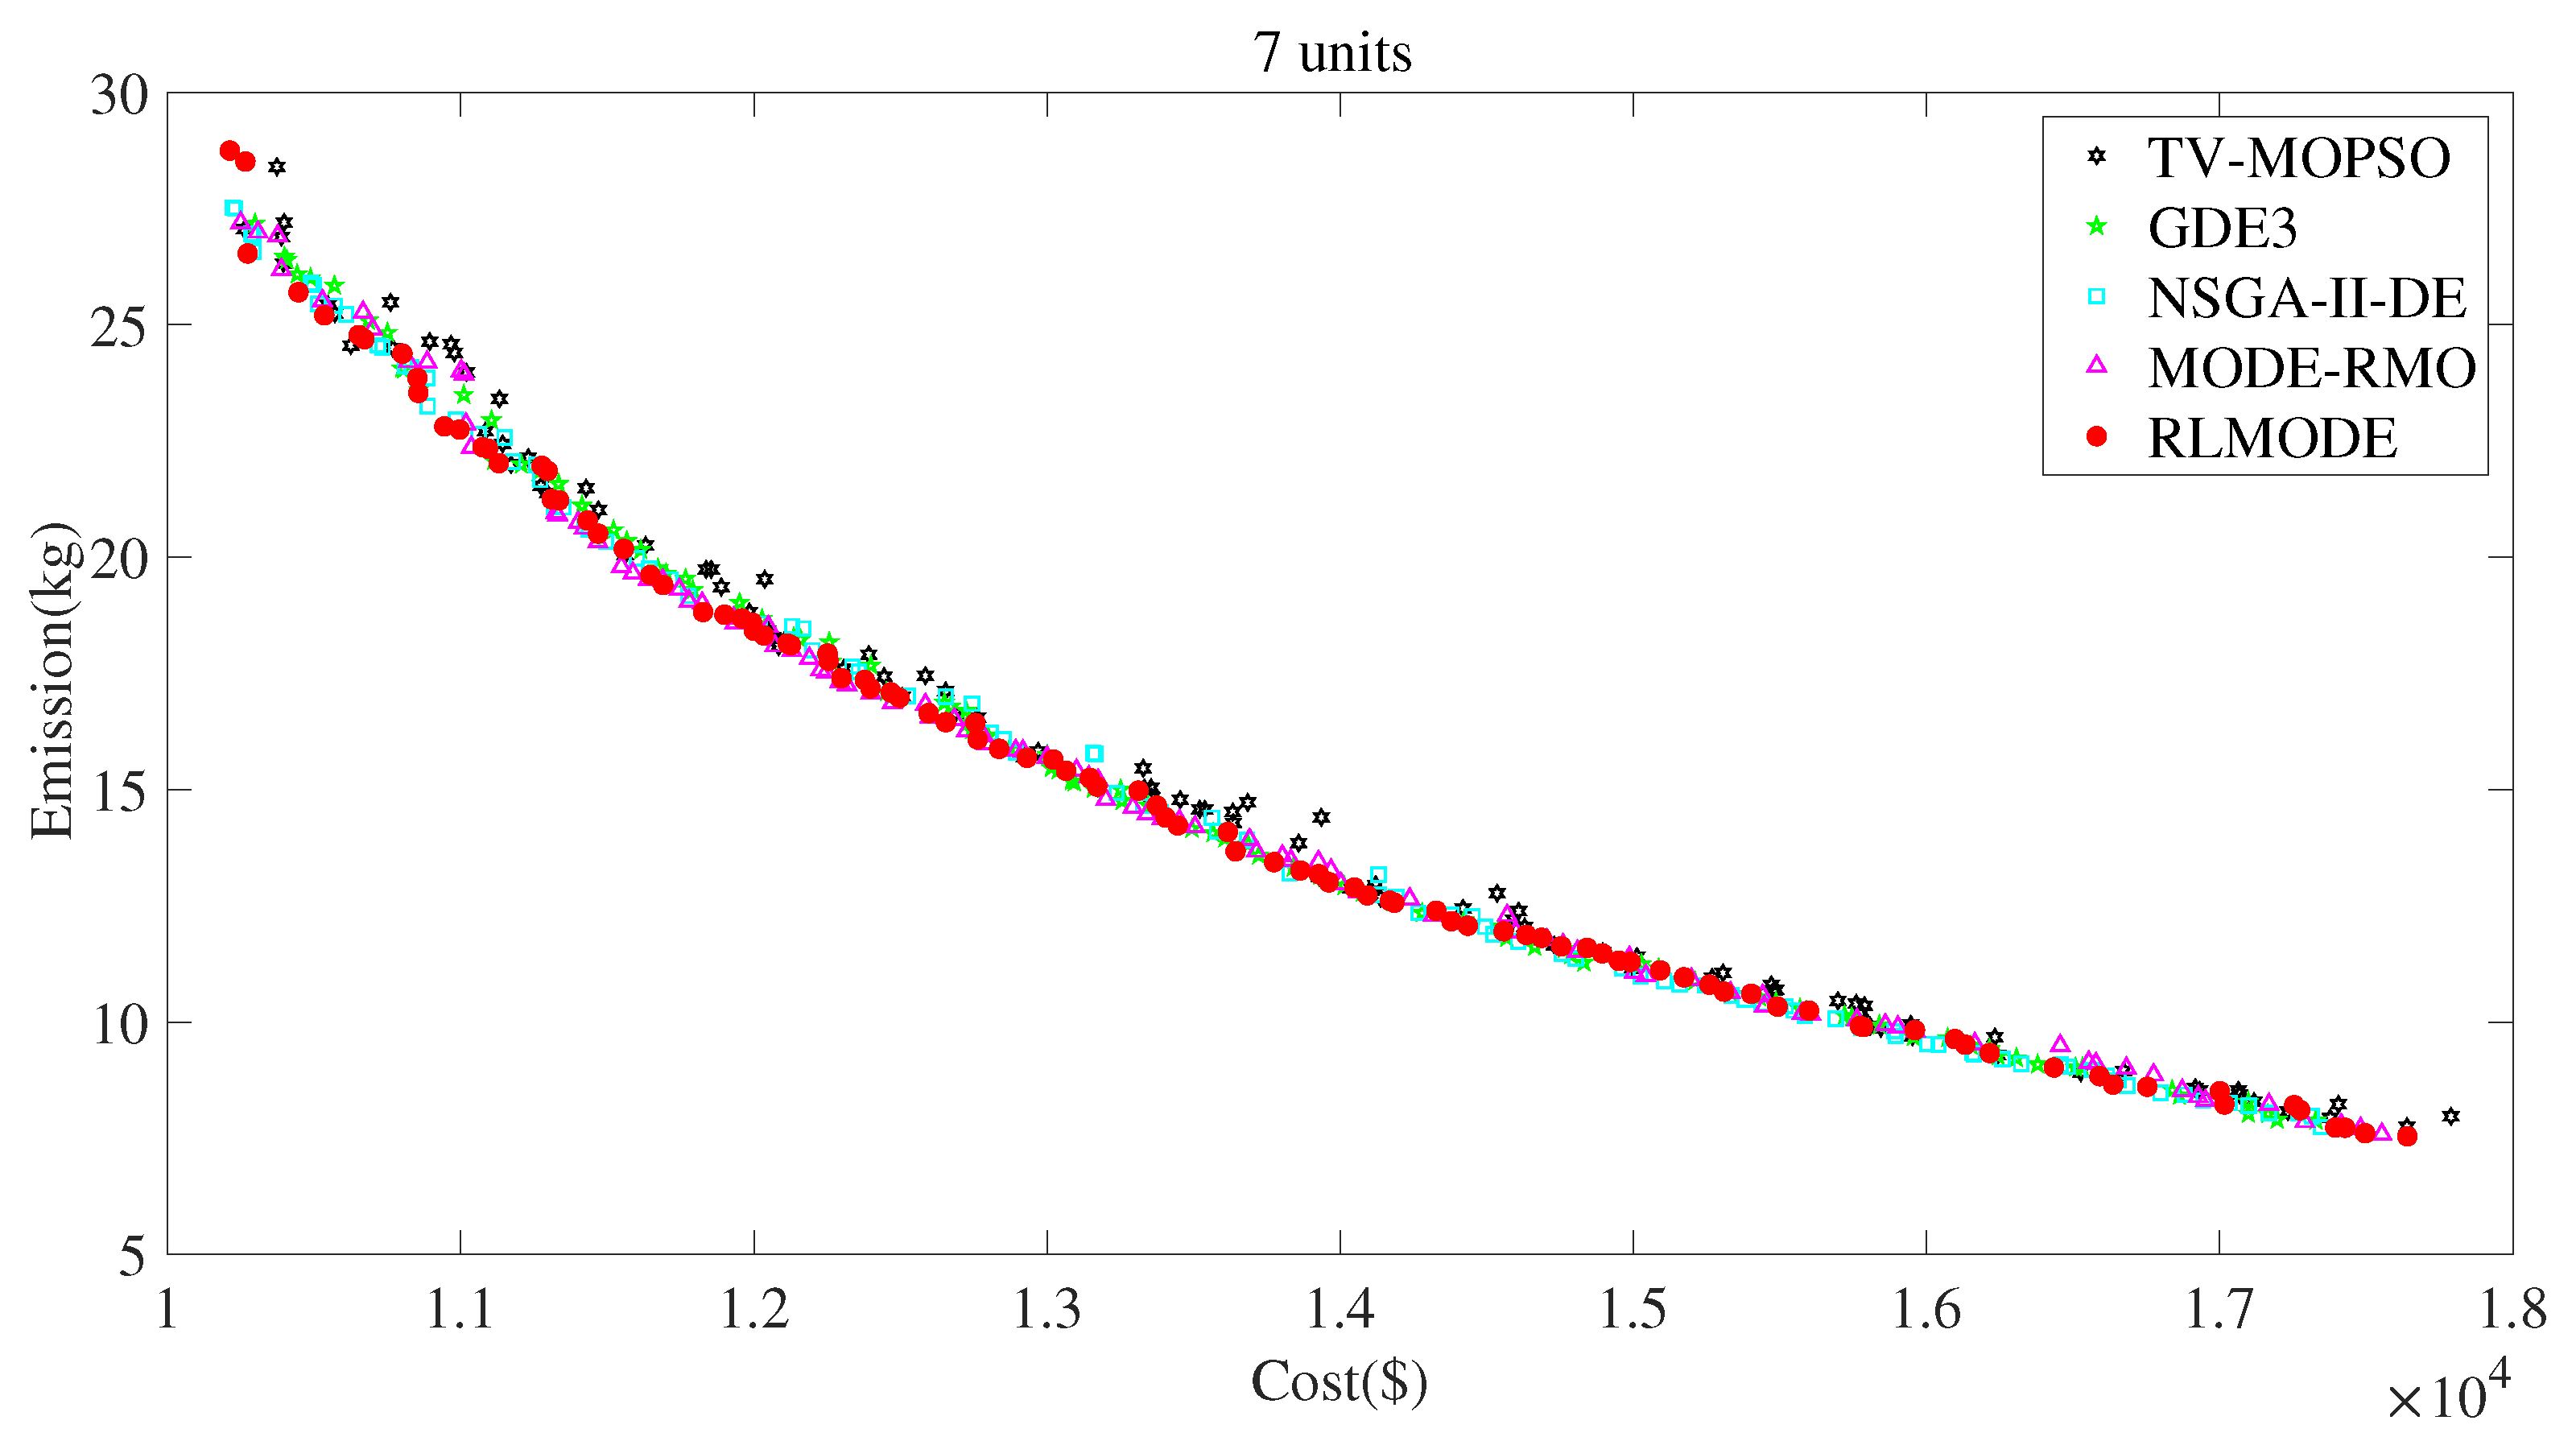
Figure 10.
Comparison of Pareto-optimal frontier for the 100-unit CHPEED problem.
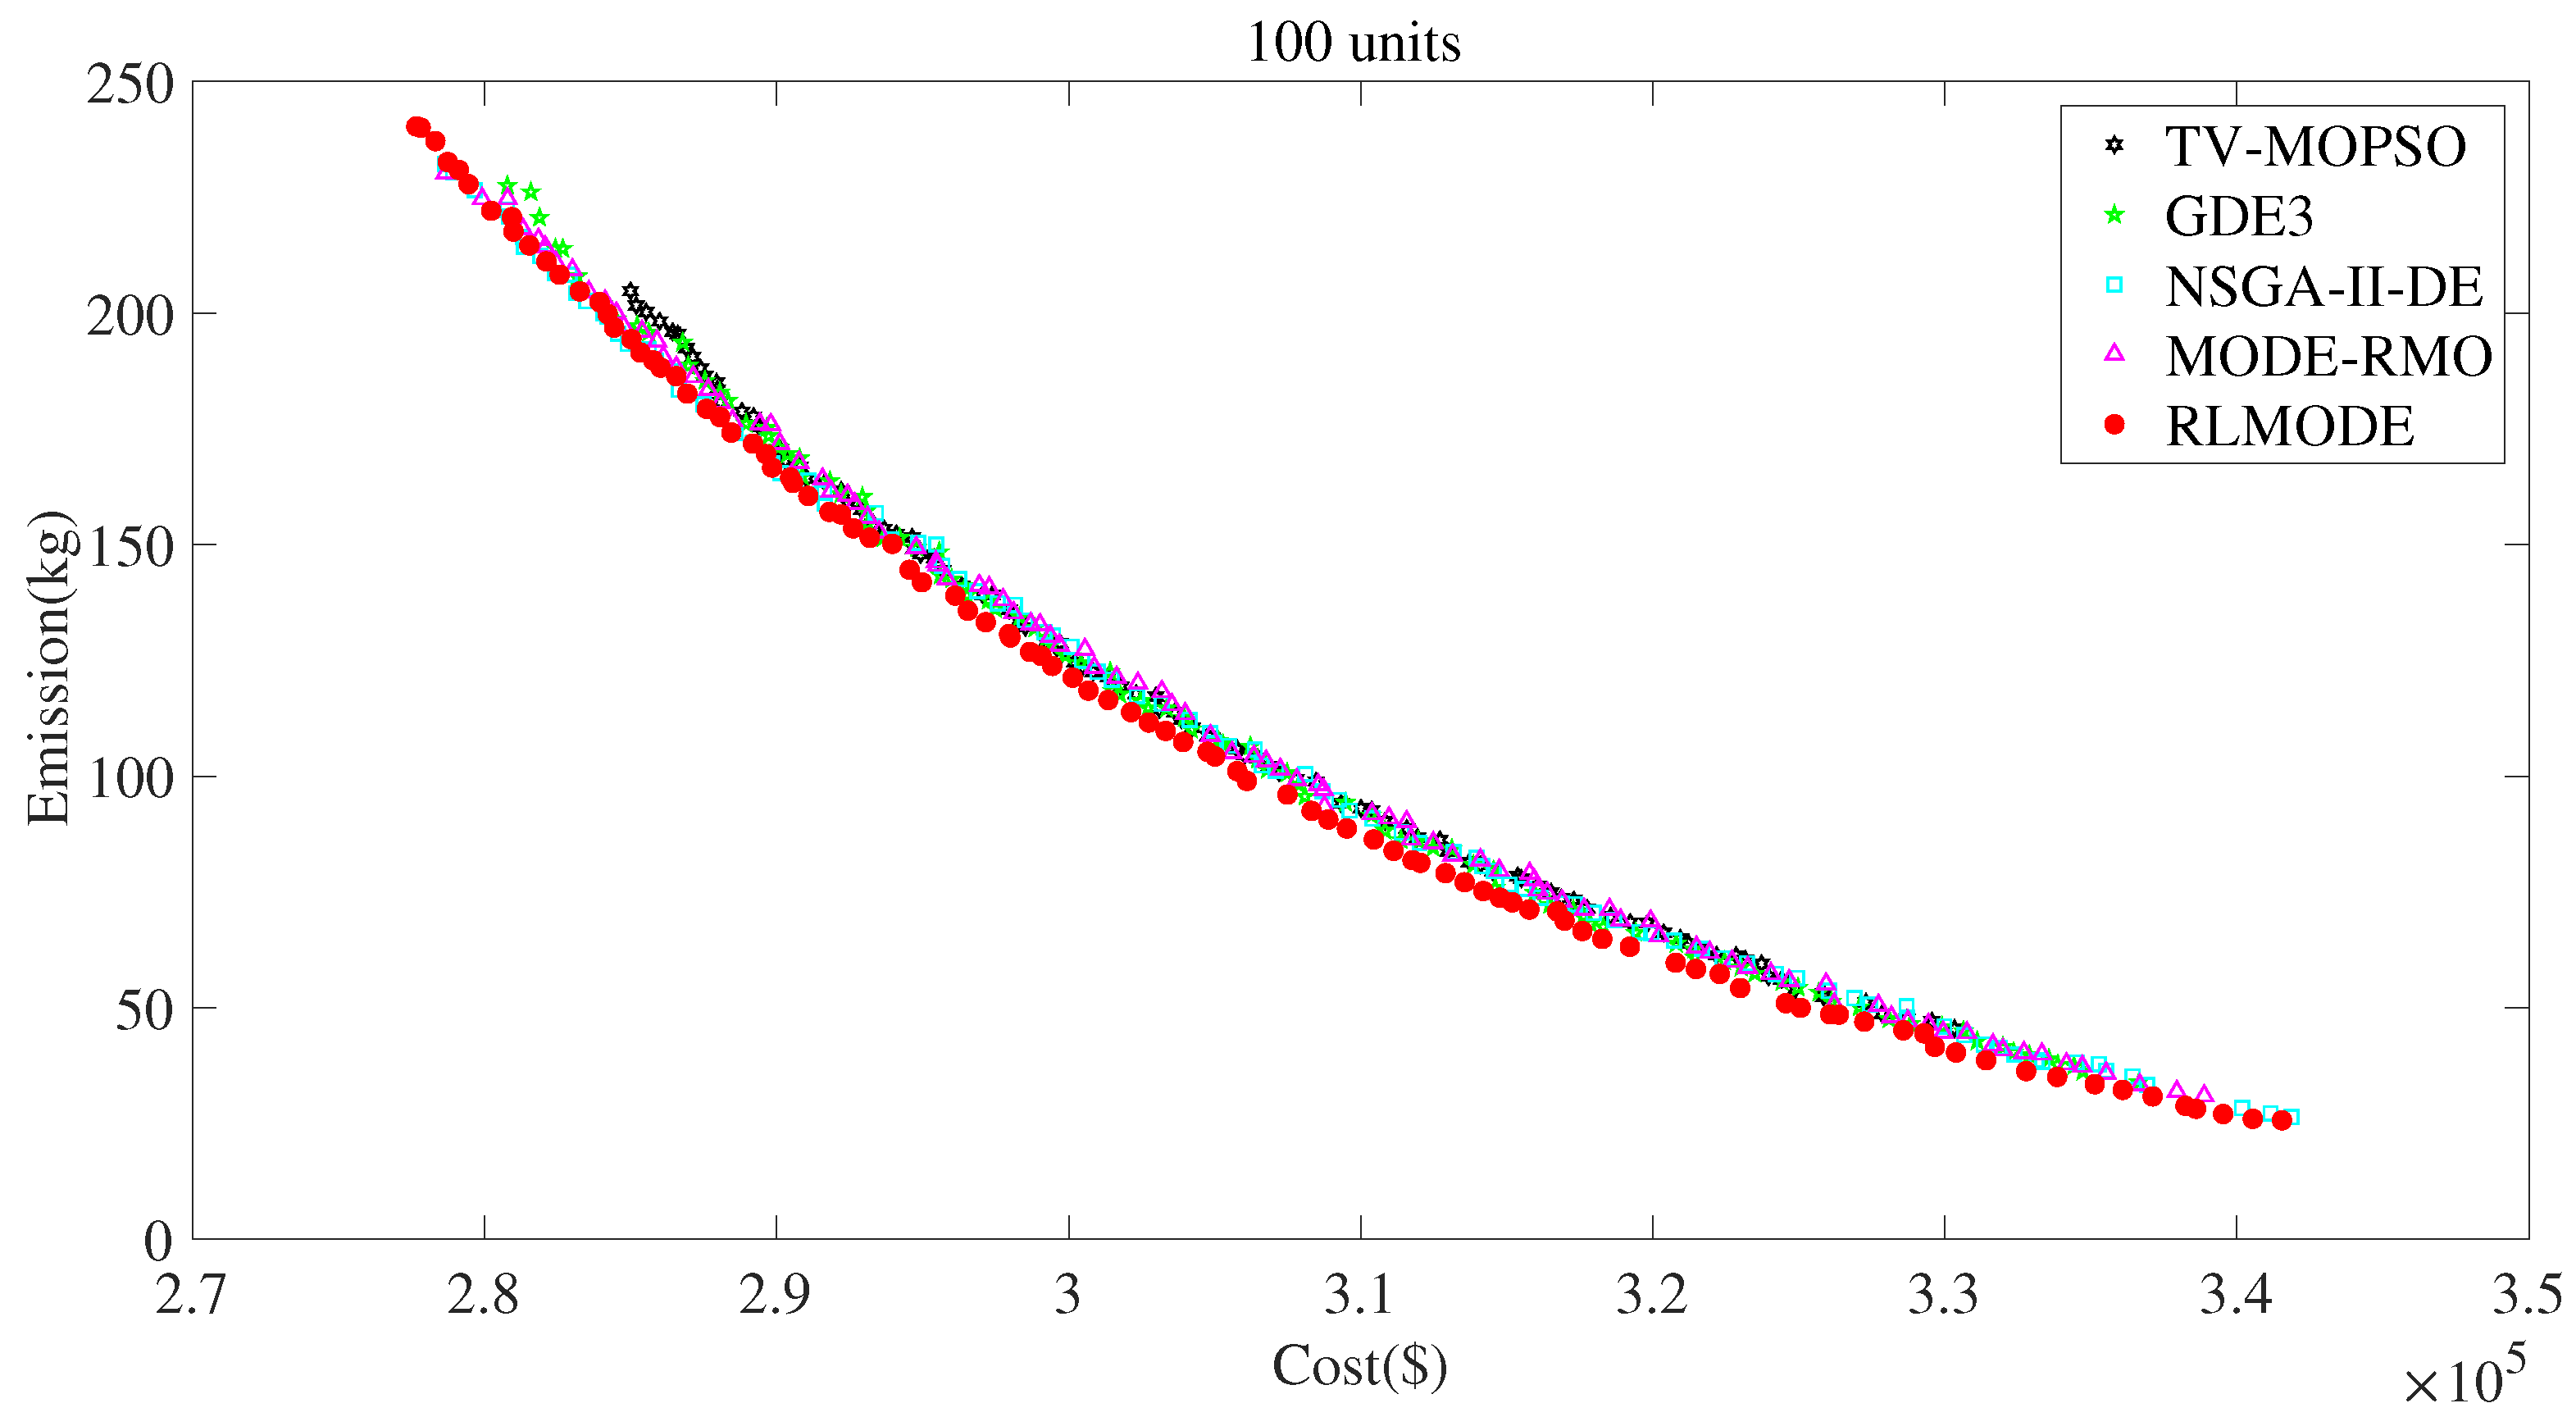
Figure 11.
Comparison of Pareto-optimal frontier for the 140-unit CHPEED problem.


Table 1.
Parameter settings for the multi-objective algorithms.
| Algorithm | Parameters |
|---|---|
| TV-MOPSO [27] | Population size N = 100, weight coefficient , |
| acceleration coefficient | |
| GDE3 [40] | N = 100, scale factor , crossover rate |
| NSGA-II-DE [41] | , polynomial mutation rate , , |
| MODE-RMO [42] | , , |
| RLMODE |
Table 2.
Results of EcD, EmD, and EED for the 5-unit CHPEED problem.
| Output | TV-MOPSO | GDE3 | NSGA-II-DE | MODE-RMO | RLMODE | |
|---|---|---|---|---|---|---|
| (MW) | 135 | 135 | 135 | 135 | 135 | |
| (MW) | 44.92 | 48.15 | 51.53 | 40.48 | 41.58 | |
| (MW) | 16.52 | 16.30 | 10.30 | 19.52 | 18.43 | |
| (MW) | 103.56 | 100.55 | 103.17 | 105 | 105 | |
| EcD | (MWth) | 68.72 | 69.87 | 74.44 | 75.41 | 76.36 |
| (MWth) | 42.79 | 41.03 | 39.29 | 41.63 | 40.08 | |
| (MWth) | 2.39 | 6.71 | 2.73 | 0 | 0 | |
| (MWth) | 36.10 | 32.39 | 33.54 | 32.96 | 33.56 | |
| Cost (USD) | 13,686.49 | 13,712.33 | 13,700.49 | 13,675.28 | 13,674.70 | |
| Emission (kg) | 12.05 | 12.04 | 12.04 | 12.04 | 12.04 | |
| (MW) | 35 | 35 | 35 | 35 | 35 | |
| (MW) | 116.87 | 118.76 | 115.75 | 118.71 | 114.19 | |
| (MW) | 48.57 | 48.51 | 55.14 | 45.47 | 46.57 | |
| (MW) | 99.56 | 97.73 | 94.11 | 100.83 | 104.24 | |
| EmD | (MWth) | 91.45 | 78.98 | 98.89 | 79.33 | 102.35 |
| (MWth) | 41.92 | 40.98 | 12.57 | 36.08 | 28.83 | |
| (MWth) | 4.22 | 0 | 17.44 | 6.95 | 0 | |
| (MWth) | 12.41 | 30.05 | 21.11 | 27.63 | 18.82 | |
| Cost (USD) | 12.41 | 30.05 | 21.11 | 27.63 | 18.82 | |
| Emission (kg) | 1.21 | 1.24 | 1.23 | 1.23 | 1.21 | |
| (MW) | 94.19 | 94.38 | 95.04 | 94.84 | 94.36 | |
| (MW) | 73.89 | 67.14 | 70.56 | 62.71 | 72.60 | |
| (MW) | 26.92 | 34.55 | 30.82 | 41.62 | 28.78 | |
| (MW) | 105 | 103.93 | 103.58 | 100.83 | 104.26 | |
| EED | (MWth) | 72.64 | 92.75 | 75 | 79.76 | 71.84 |
| (MWth) | 25.71 | 0 | 48.92 | 35.25 | 39.95 | |
| (MWth) | 0 | 0 | 1.20 | 0 | 0 | |
| (MWth) | 51.66 | 57.25 | 24.88 | 34.99 | 38.21 | |
| Cost (USD) | 14,860.23 | 14,889.75 | 14,859.34 | 14,881.14 | 14,856.36 | |
| Emission (kg) | 6.09 | 6.13 | 6.15 | 6.15 | 6.09 | |
| CPU time (s) | 3.0 | 2.3 | 2.4 | 2.2 | 2.5 |
Table 3.
Statistical results of the performance metrics for the 5-unit CHPEED problem.
| Metric | Algorithm | Min | Mean | Max | Std | Sig. |
|---|---|---|---|---|---|---|
| DM | TV-MOPSO | 0.7424 | 0.8003 | 0.8457 | 0.0260 | = |
| GDE3 | 0.7183 | 0.7594 | 0.8050 | 0.0273 | + | |
| NSGA-II-DE | 0.6759 | 0.7731 | 0.8096 | 0.0283 | + | |
| MODE-RMO | 0.7060 | 0.7711 | 0.8181 | 0.0224 | + | |
| RLMODE | 0.7863 | 0.8131 | 0.8884 | 0.0229 | ||
| 2HV | TV-MOPSO | 0.1926 | 0.1931 | 0.1934 | 0.0002 | + |
| GDE3 | 0.1914 | 0.1921 | 0.1929 | 0.0004 | + | |
| NSGA-II-DE | 0.1906 | 0.1918 | 0.1926 | 0.0005 | + | |
| MODE-RMO | 0.1914 | 0.1923 | 0.1929 | 0.0004 | + | |
| RLMODE | 0.1927 | 0.1932 | 0.1937 | 0.0003 | ||
| IGD | TV-MOPSO | 9.8452 | 11.6058 | 13.1767 | 0.7173 | = |
| GDE3 | 12.5343 | 14.2121 | 16.4390 | 1.0600 | + | |
| NSGA-II-DE | 11.8049 | 13.8877 | 17.4370 | 1.4504 | + | |
| MODE-RMO | 11.9793 | 13.5678 | 16.6436 | 1.0189 | + | |
| RLMODE | 10.0634 | 11.3487 | 12.6692 | 0.6079 |
Table 4.
Results of EcD, EmD, and EED for the 7-unit CHPEED problem.
| Output | TV-MOPSO | GDE3 | NSGA-II-DE | MODE-RMO | RLMODE | |
|---|---|---|---|---|---|---|
| (MW) | 65.99 | 65.79 | 61.36 | 63.41 | 52.75 | |
| (MW) | 91.23 | 99.49 | 99.91 | 90.82 | 92.99 | |
| (MW) | 109.65 | 100.13 | 102.37 | 109.88 | 112.84 | |
| (MW) | 201.91 | 203.08 | 206.46 | 204.62 | 217.86 | |
| EcD | (MW) | 98.71 | 98.80 | 97.56 | 98.80 | 91.24 |
| (MW) | 40.11 | 40.36 | 40 | 40.07 | 40 | |
| (MWth) | 0.51 | 0 | 7.29 | 0 | 44.54 | |
| (MWth) | 73.41 | 69.63 | 75 | 74.02 | 75 | |
| (MWth) | 76.08 | 80.37 | 67.71 | 75.98 | 30.46 | |
| Cost (USD) | 10,261.88 | 10,298.40 | 10,222.16 | 10,249.37 | 10,212.26 | |
| Emission (kg) | 27.05 | 27.18 | 27.52 | 27.19 | 28.75 | |
| (MW) | 42.55 | 36.59 | 33.85 | 36.48 | 46.41 | |
| (MW) | 31.66 | 38.32 | 53.65 | 44.45 | 52.59 | |
| (MW) | 80.83 | 68.96 | 59.37 | 73.65 | 64.99 | |
| (MW) | 83.10 | 99.71 | 96.54 | 85.49 | 76.57 | |
| EmD | (MW) | 247 | 246.97 | 246.99 | 247 | 245.49 |
| (MW) | 122.60 | 117.15 | 117.36 | 120.68 | 121.79 | |
| (MWth) | 0 | 0 | 0 | 0 | 2.68 | |
| (MWth) | 53.56 | 69.63 | 88.24 | 66.27 | 53.20 | |
| (MWth) | 96.44 | 80.37 | 61.76 | 83.73 | 94.11 | |
| Cost (USD) | 17,638.83 | 17,329.12 | 17,345.52 | 17,553.38 | 17,640.14 | |
| Emission (kg) | 7.75 | 7.88 | 7.74 | 7.59 | 7.54 | |
| (MW) | 61.41 | 73.43 | 75 | 65.39 | 75 | |
| (MW) | 89.41 | 93.62 | 78.87 | 76.39 | 80.07 | |
| (MW) | 102.93 | 114.29 | 99.22 | 121.91 | 105.95 | |
| (MW) | 136.29 | 107.57 | 139.33 | 125.01 | 129.74 | |
| EED | (MW) | 176.91 | 176.97 | 174.48 | 178.74 | 176.19 |
| (MW) | 40.55 | 41.63 | 40.59 | 40 | 40.54 | |
| (MWth) | 0.16 | 0.93 | 24.05 | 0 | 6.87 | |
| (MWth) | 75.47 | 76.41 | 75 | 75 | 75 | |
| (MWth) | 74.36 | 72.66 | 50.95 | 75 | 68.13 | |
| Cost (USD) | 12,047.79 | 12,027.75 | 12,131.14 | 12,049.32 | 12,000.28 | |
| Emission (kg) | 18.42 | 18.67 | 18.52 | 18.51 | 18.42 | |
| CPU time (s) | 5.5 | 4.5 | 4.9 | 4.6 | 5.0 |
Table 5.
Statistical results of the performance metrics for the 7-unit CHPEED problem.
| Metric | Algorithm | Min | Mean | Max | Std | Sig. |
|---|---|---|---|---|---|---|
| DM | TV-MOPSO | 0.6859 | 0.7325 | 0.7765 | 0.0225 | + |
| GDE3 | 0.7326 | 0.7657 | 0.8033 | 0.0194 | + | |
| NSGA-II-DE | 0.7032 | 0.7849 | 0.8396 | 0.0339 | + | |
| MODE-RMO | 0.6949 | 0.7624 | 0.8148 | 0.0227 | + | |
| RLMODE | 0.7632 | 0.8048 | 0.8516 | 0.0251 | ||
| HV | TV-MOPSO | 0.2767 | 0.2781 | 0.2796 | 0.0007 | + |
| GDE3 | 0.2785 | 0.2804 | 0.2818 | 0.0009 | + | |
| NSGA-II-DE | 0.2776 | 0.2808 | 0.2827 | 0.0012 | + | |
| MODE-RMO | 0.2779 | 0.2806 | 0.2826 | 0.0010 | + | |
| RLMODE | 0.2805 | 0.2821 | 0.2827 | 0.0005 | ||
| IGD | TV-MOPSO | 31.8580 | 36.3950 | 43.7990 | 2.9514 | + |
| GDE3 | 30.1660 | 37.6670 | 49.0670 | 4.9670 | + | |
| NSGA-II-DE | 25.2580 | 33.6990 | 42.3560 | 4.3386 | + | |
| MODE-RMO | 29.7410 | 36.8890 | 56.5780 | 5.5591 | + | |
| RLMODE | 25.0030 | 29.6970 | 42.9080 | 4.0536 |
Table 6.
Results of EcD, EmD, and EED for the 100-unit CHPEED problem.
| Output | TV-MOPSO | GDE3 | NSGA-II-DE | MODE-RMO | RLMODE | |
|---|---|---|---|---|---|---|
| EcD | Cost (USD) | 284,998.66 | 280,781.47 | 278,648.30 | 278,670.12 | 278,102.84 |
| Emission (kg) | 204.75 | 227.54 | 232.20 | 230.31 | 238.49 | |
| EmD | Cost (USD) | 330,327.51 | 336,643.25 | 341,869.59 | 338,879.12 | 342,104.18 |
| Emission (kg) | 45.49 | 33.93 | 26.39 | 30.99 | 25.56 | |
| EED | Cost (USD) | 292,904.09 | 292,934.82 | 293,398.89 | 293,113.78 | 292,647.89 |
| Emission (kg) | 157.50 | 160.30 | 156.81 | 155.89 | 153.57 | |
| CPU time (s) | 47.4 | 48.0 | 48.0 | 47.9 | 54.9 |
Table 7.
Statistical results of the performance metrics for the 100-unit CHPEED problem.
| Metric | Algorithm | Min | Mean | Max | Std | Sig. |
|---|---|---|---|---|---|---|
| DM | TV-MOPSO | 0.6320 | 0.6918 | 0.7543 | 0.0274 | + |
| GDE3 | 0.6956 | 0.7747 | 0.8456 | 0.0371 | + | |
| NSGA-II-DE | 0.7633 | 0.8098 | 0.8764 | 0.0235 | + | |
| MODE-RMO | 0.7633 | 0.8073 | 0.8474 | 0.0206 | + | |
| RLMODE | 0.8168 | 0.8414 | 0.8758 | 0.0144 | ||
| HV | TV-MOPSO | 0.1698 | 0.1733 | 0.1767 | 0.0017 | + |
| GDE3 | 0.1769 | 0.1814 | 0.1836 | 0.0015 | + | |
| NSGA-II-DE | 0.1801 | 0.1836 | 0.1852 | 0.0010 | + | |
| MODE-RMO | 0.1804 | 0.1828 | 0.1845 | 0.0009 | + | |
| RLMODE | 0.1861 | 0.1869 | 0.1879 | 0.0004 | ||
| IGD | TV-MOPSO | 909.1800 | 1234 | 1788.3000 | 206.8600 | + |
| GDE3 | 270.9400 | 487.7000 | 1047.2000 | 166.0400 | + | |
| NSGA-II-DE | 210.3000 | 279.2600 | 442.5800 | 52.9940 | + | |
| MODE-RMO | 252.5700 | 331.1600 | 449.7500 | 55.0550 | + | |
| RLMODE | 169.3400 | 200.3200 | 224.1500 | 11.8440 |
Table 8.
Results of EcD, EmD, and EED for the 140-unit CHPEED problem.
| Output | TV-MOPSO | GDE3 | NSGA-II-DE | MODE-RMO | RLMODE | |
|---|---|---|---|---|---|---|
| EcD | Cost (USD) | 237,703.69 | 224,936.75 | 239,690.11 | 225,670.28 | 216,483.24 |
| Emission (kg) | 466.50 | 526.37 | 391.68 | 554.75 | 544.62 | |
| EmD | Cost (USD) | 330,651.70 | 337,670.10 | 347,284.96 | 340,838.48 | 347,112.22 |
| Emission (kg) | 194.38 | 201.67 | 180.39 | 191.32 | 172.18 | |
| EED | Cost (USD) | 242,778.96 | 243,338.27 | 242,231.62 | 243,210.60 | 239,690.11 |
| Emission (kg) | 423.76 | 428.76 | 418.54 | 425.72 | 391.68 | |
| CPU time (s) | 77.6 | 75.6 | 75.2 | 76.4 | 84.6 |
Table 9.
Statistical results of the performance metrics for the 140-unit CHPEED problem.
| Metric | Algorithm | Min | Mean | Max | Std | Sig. |
|---|---|---|---|---|---|---|
| 2DM | TV-MOPSO | 0.6343 | 0.6923 | 0.7416 | 0.0259 | + |
| GDE3 | 0.6008 | 0.6918 | 0.7473 | 0.0343 | + | |
| NSGA-II-DE | 0.7542 | 0.7980 | 0.8465 | 0.0215 | + | |
| MODE-RMO | 0.6396 | 0.7175 | 0.7635 | 0.0360 | + | |
| RLMODE | 0.7660 | 0.8144 | 0.8541 | 0.0228 | ||
| HV | TV-MOPSO | 0.2251 | 0.2278 | 0.2316 | 0.0017 | + |
| GDE3 | 0.2225 | 0.2263 | 0.2297 | 0.0018 | + | |
| NSGA-II-DE | 0.2335 | 0.2361 | 0.2391 | 0.0013 | + | |
| MODE-RMO | 0.2257 | 0.2284 | 0.2318 | 0.0015 | + | |
| RLMODE | 0.2488 | 0.2518 | 0.2553 | 0.0015 | ||
| IGD | TV-MOPSO | 2110.5000 | 3065.3000 | 3751.2000 | 387.1000 | + |
| GDE3 | 795.6700 | 1180.7000 | 1913.3000 | 257.3000 | + | |
| NSGA-II-DE | 445.6000 | 555.7200 | 738.6900 | 62.6100 | + | |
| MODE-RMO | 680.3500 | 1001 | 1611.9000 | 243.1500 | + | |
| RLMODE | 376.3600 | 482.7200 | 783.0600 | 92.9610 |
Disclaimer/Publisher’s Note: The statements, opinions and data contained in all publications are solely those of the individual author(s) and contributor(s) and not of MDPI and/or the editor(s). MDPI and/or the editor(s) disclaim responsibility for any injury to people or property resulting from any ideas, methods, instructions or products referred to in the content. |
© 2023 by the authors. Licensee MDPI, Basel, Switzerland. This article is an open access article distributed under the terms and conditions of the Creative Commons Attribution (CC BY) license (https://creativecommons.org/licenses/by/4.0/).
Share and Cite
MDPI and ACS Style
Chen, X.; Fang, S.; Li, K. Reinforcement-Learning-Based Multi-Objective Differential Evolution Algorithm for Large-Scale Combined Heat and Power Economic Emission Dispatch. Energies 2023, 16, 3753. https://doi.org/10.3390/en16093753
AMA Style
Chen X, Fang S, Li K. Reinforcement-Learning-Based Multi-Objective Differential Evolution Algorithm for Large-Scale Combined Heat and Power Economic Emission Dispatch. Energies. 2023; 16(9):3753. https://doi.org/10.3390/en16093753
Chicago/Turabian StyleChen, Xu, Shuai Fang, and Kangji Li. 2023. "Reinforcement-Learning-Based Multi-Objective Differential Evolution Algorithm for Large-Scale Combined Heat and Power Economic Emission Dispatch" Energies 16, no. 9: 3753. https://doi.org/10.3390/en16093753
Note that from the first issue of 2016, this journal uses article numbers instead of page numbers. See further details here.