
Microcontroller-Based Embedded System for the Diagnosis of Stator Winding Faults and Unbalanced Supply Voltage of the Induction Motors

Department of Electrical Machines, Drives and Measurements, Wroclaw University of Science and Technology, Wybrzeze Wyspianskiego 27, 50-370 Wroclaw, Poland
*
Author to whom correspondence should be addressed.
Energies 2024, 17(2), 387; https://doi.org/10.3390/en17020387
Submission received: 14 December 2023
/
Revised: 10 January 2024
/
Accepted: 11 January 2024
/
Published: 12 January 2024
(This article belongs to the Special Issue Modeling, Control and Diagnosis of Electrical Machines and Devices)
Abstract
:Induction motors (IMs) are one of the most widely used motor types in the industry due to their low cost, high reliability, and efficiency. Nevertheless, like other types of AC motors, they are prone to various faults. In this article, a low-cost embedded system based on a microcontroller with the ARM Cortex-M4 core is proposed for the extraction of stator winding faults (interturn short circuits) and an unbalanced supply voltage of the induction motor drive. The voltage induced in the measurement coil by the axial flux was used as a source of diagnostic information. The process of signal measurement, acquisition, and processing using a cost-optimized embedded system (NUCLEO-L476RG), with the potential for industrial deployment, is described in detail. In addition, the analysis of the possibility of distinguishing between interturn short circuits and unbalanced supply voltage was carried out. The effect of motor operating conditions and fault severity on the symptom extraction process was also studied. The results of the experimental research conducted on a 1.5 kW IM confirmed the effectiveness of the developed embedded system in the extraction of these types of faults.
1. Introduction
Induction motors (IMs) are widely used in drive systems due to their low production costs, high reliability, and optimal efficiency. In today’s industrial landscape, three-phase IMs dominate and account for over 85% of all electric motor utilization [1]. However, despite the high reliability and durability of IMs, they are prone to various types of faults [2]. The most common faults of IMs include bearings, rotor cages, and stator winding faults. Stator winding faults are highly destructive and account for 36% of the total machine failures for low-voltage machines and 66% for high-voltage machines [3].
Stator winding faults are mainly short circuits caused by damage to the winding insulation due to excessive mechanical, thermal, or electrical stresses. There are different types of short circuits: interturn short circuits (ITSCs), short circuits between the coils in one phase, phase-to-phase short circuits, and phase-to-ground short circuits. Most often, a stator winding fault begins with ITSCs and successively spreads from a single turn to subsequent turns and coils in a very short time, leading to a phase-to-phase or phase-to-ground fault. The rapid propagation of ITSC is caused by the very high current flowing in the shorted circuit. For this reason, early and effective detection of this type of fault is crucial and is still a very important research problem [4].
The efficiency and service life of IMs can also be significantly reduced when operating under unbalanced supply voltage conditions, which is quite common in the industrial field [1]. Such conditions can result from a variety of factors, such as unevenly distributed single-phase loads, malfunctioning power factor correction equipment in the same power system, and open circuits in the primary distribution system. An unbalanced supply voltage causes the increased heating of the stator winding, higher losses, vibration, and reduced torque output. Most of these negative effects contribute to the shortened lifespan of IMs [5]. Moreover, supply voltage asymmetry can complicate the process of diagnosing stator winding faults, since even a small supply voltage unbalance results in a large current asymmetry, which also occurs due to short circuits [6]. Therefore, detecting and distinguishing between stator winding faults and an unbalanced supply voltage is extremely important to prevent serious failures and increase the reliability and safety of drive systems. It will also contribute to avoiding motor operation with reduced efficiency, which is crucial to reduce energy consumption and care for the environment.
The requirements for the safety and reliability of modern drive systems are increasing every year. This is due in part to the increasing electrification in many industries and the drive to maximize the lifetime of the equipment. Early detection of a fault can also make it possible to plan motor overhauls accordingly, which will translate into lower repair costs, shorter delays, and reduced potential production losses. For this reason, new diagnostic methods are sought that can be used to diagnose faults at a very early stage of their propagation.
Over the years, several methods for diagnosing IM stator failure have been developed [7,8,9,10,11]. These methods are based on various types of diagnostic signals, such as input voltage [12], stator phase current [13], temperature [14], active and reactive power [15], vibration [16], and axial flux [17]. To extract the fault symptoms from these signals, signal processing methods can be used. Among the most popular and highly effective is the spectral analysis of the signal using the Fast Fourier Transform (FFT). Methods that perform the time-frequency analysis, such as the Short-Time Fourier Transform (STFT) or Continuous Wavelet Transform (CWT) [18], are also attractive in the AC motors stator winding fault diagnosis field. Automation of the AC motors stator winding fault detection and classification process in recent years has most often been implemented using a variety of artificial intelligence techniques [19], such as machine learning algorithms [20,21] and deep learning (DL) [22]. When it comes to computerized diagnostic systems, the fastest growing area in recent years is the application of DL, especially convolutional neural networks (CNN). They are not only applied for fault detection and classification [23] but also for predictive maintenance and remaining useful time estimation [24].
Detection of an unbalanced supply voltage is dominated by methods based on voltage and current signals. The combination of the wavelet transform and principal component analysis of the mains current signal for the detection of unbalanced supply voltage, automated with a support vector machine model, is presented in [25]. The diagnosis and discrimination of the ITSC and unbalanced supply voltage fault method, based on the analysis of the ratio of the third harmonic to the fundamental FFT magnitude component of the three-phase stator line current and voltage, is presented in [26]. An effective approach for the detection of the supply voltage unbalance condition in IM drives, based on a data mining process using the amplitude of the second harmonic of the stator current zero crossing instants as a supply voltage unbalance indicator, is presented in [27]. The online detection method of the unbalanced supply voltage condition, by monitoring a pertinent indicator calculated using the voltage symmetrical components, is shown in [28].
Nevertheless, most of the methods proposed in the literature for stator winding and unbalanced supply voltage diagnosis have been described based on the results obtained using high-end data acquisition (DAQ) equipment and software, such as LabVIEW or MATLAB & SIMULINK [12,27,28], the price of which often exceeds the cost of the machine being monitored. For this reason, the real potential of their industrial deployment is diminishing, as there is no detailed description of the possibilities of low-cost hardware implementation. In this article, special attention is paid to analyzing the possibilities and describing how to apply an embedded system based on a low-budget microcontroller with an ARM Cortex-M core to extract the symptoms of the SI stator winding faults and unbalanced supply voltage.
Embedded systems are used in most modern electronic devices and are a key component of them. An embedded system is a type of system that is designed to perform specific functions, usually in real-time. In recent years, embedded systems that utilize microcontrollers have been the most common. This allows the achievement of a high degree of compactness, responding to increasing demands for the greatest possible miniaturization of devices. The range of applications of embedded systems is very wide, from special-purpose on-board systems, and inverters powering electric motors, to household appliances, HVAC, and many other technical objects [29].
Microcontrollers are small single-chip microcomputers. They are equipped with a variety of peripherals, which include analog-to-digital converters (ADCs), digital-to-analog converters (DACs), comparators, counters, communication interfaces, as well as RAM and Flash memory. In recent years, microcontrollers with the ARM Cortex-M core have been particularly popular. ARM Cortex-M processors are currently one of the best choices for a wide range of applications. In the fourth quarter of 2020, ARM reported a record 4.4 billion chips shipped with Cortex-M processors, confirming their very high popularity [30]. The Cortex M family is a subset of the Cortex family cores, which in turn is a subset of the ARM architecture. Semiconductor manufacturers implement selected versions of the cores, equipping them with peripherals and memory to produce a ready-to-use microcontroller. ARM Cortex-M-based microcontrollers are characterized by high reliability, high performance, and affordability [31]
Currently, there is a noticeable lack of research in the literature that deals with embedded, low-cost implementation of AC motor fault diagnosis methods. In [32], the Arduino board-based system is developed to monitor parameters such as speed, temperature, current, and voltage of the one-phase IM. Authors believe that using these parameters, faults such as over-voltage, over-current, overload, and excessive heating can be detected. In [33], the 8-bit PIC16F877A microcontroller-based system is developed and programmed in C++ language for the detection of under-voltage, over-voltage, over-current, and line-to-ground faults of one-phase IMs. The STM32F4V11VET microcontroller-based fault diagnosis system is proposed in [34] for the detection of the faults of three-phase IMs. This method is based on the stator phase current signals measured using MCR1101-20-5 (ACEINNA, Phoenix, USA) current sensors. It is a promising AI-driven method but requires the current measurement in each of the three phases and it is not strictly defined; the kind of faults the system can detect (broken bearings and misalignment) are mentioned. There are also commercial condition monitoring solutions available on the market that are characterized by a relatively low cost, such as the VB300 G-Force datalogger by EXTECH Instruments, which records a 3-axis shock and vibration and allows the detection of mechanical damage to IMs based on the vibration signal. Nevertheless, it also requires additional PC software. No work has been found that describes a low-cost embedded implementation of an IM stator winding fault and unbalanced supply voltage diagnosis method based on the measurement of the voltage induced by the axial flux.
In this paper, the feasibility of using a low-cost ARM Cortex-M4 core microcontroller (STM32L476RG) to extract the symptoms of ITSCs in IM stator winding and supply voltage unbalance, based on the voltage signal induced in the measuring coil by the axial flux, is discussed. A NUCLEO-L476RG module with a 32-bit STM32L476RG microcontroller (STMicroelectronics, Plan-les-Ouates, Geneva, Switzerland) is used to measure and acquire the diagnostic signal. The method of measuring the diagnostic signal, its acquisitions, the components of the prepared system, and the necessary configuration are presented in detail. Experimental tests were carried out, the results of which confirmed the feasibility of using an embedded system based on a microcontroller with an ARM Cortex-M4 core to extract symptoms of SI stator winding faults and supply voltage unbalance.
The main theoretical and practical contributions of this research are as follows:
- (1)
- An analysis of the possibility of using and the proposal of the concept of an embedded fault diagnosis system based on a low-cost ARM Cortex-M4 core microcontroller to extract the symptoms of IM stator winding faults and unbalanced supply voltage, including the comparison of the results with a high-end solution;
- (2)
- A detailed description of the process of setting up diagnostic signal measurement and acquisition using low-cost microcontrollers, which may serve as a guide for various embedded system applications;
- (3)
- A detailed analysis of the effect of an ITSC in the stator winding and an unbalanced supply voltage of the IM drive on the waveform of the voltage induced in the measuring coil by the axial flux;
- (4)
- A detailed analysis of the effect of an ITSC in the stator winding and an unbalanced supply voltage of the IM drive on the FFT spectrum of the voltage induced in the measuring coil by the axial flux;
- (5)
- An analysis of the possibility of distinguishing between ITSC in the stator winding and an unbalanced supply voltage of the IM drive based on symptoms characteristic of these abnormal conditions;
- (6)
- A proposal for future research and plans to improve and develop the embedded diagnostic system, including reference to current trends related to the Industry 4.0 paradigm.
The rest of the article is organized as follows: Section 2 describes the key parameters of the NUCLEO-L476RG evaluation board, STM32L476RG microcontroller, and motor test bench; Section 3 presents the configuration of the data acquisition system; Then, the results of the ITSC and unbalanced supply voltage symptom extraction based on the voltage inducted by axial flux are presented and discussed. This section also outlines key discoveries and plans for future research; and finally, Section 5 concludes the paper.
2. Experimental Setup
2.1. Characteristics of the Development Board and Microcontroller Used
The development board used in the scope of this research was the NUCLEO-L476RG evaluation board (Figure 1a). It is one of the most popular evaluation boards by STMicroelectronics. The STM32 NUCLEO-L476RG (STMicroelectronics, Plan-les-Ouates, Geneva, Switzerland) is a low-cost and easy-to-use development platform used in flexible prototyping to quickly develop projects based on STM32 microcontrollers. The NUCLEO-L476RG is designed around the 32-bit STM32L476RG microcontroller in a 64-pin LQFP package.
The STM32L476RG microcontroller is based on the ARM Cortex-M4 core that operates at a frequency of up to 80 MHz. This microcontroller embeds 1 MB of Flash memory and 128 kB of SRAM memory. The ARM Cortex-M4 core features a single precision Floating Point Unit (FPU) and a Memory Protection Unit (MPU). Its design also features 3 ADC modules and 2 DAC modules with 12-bit resolution. The key parameters of this microcontroller are grouped in Table 1.
The NUCLEO-L476RG evaluation board is equipped with ST-Link/V2, which allows flash programming and microcontroller debugging. The power supply of the module is flexible, being possible both via USB and from an external voltage source (3.3 V, 5 V, and 7–12 V). There are also three built-in LEDs on the PCB, which indicate USB communication (LD1), can be programmed by the user (LD2), and indicate the module’s power supply (LD3). The ST morpho extension pin headers and ARDUINO connectors are also available on the board for full access to all STM32 inputs and outputs. The simplified hardware block diagram of the board is presented in Figure 1b. A detailed specification of the NUCLEO-L476RG is available on the manufacturer’s website [35].
2.2. Motor Test Bench
Experimental tests were carried out on a specially prepared test bench consisting of an IM with a rated power of 1.5 kW (by Indukta) and a DC motor that provided the load torque. The real view of the motor test bench is presented in Figure 2a. The rated parameters of the IM under test are grouped in Table 2. The IM was powered directly from the three-phase grid. The stator winding of the IM under test was wound in such a way that its design allowed for the physical modeling of ITSCs with a certain number of turns. Each phase of the IM under analysis consisted of a coil with 312 turns. During the tests, a maximum of 8 turns were short-circuited, representing 2.6% of all turns in one phase. The schematic diagram of the phase terminals led out to the board of this winding is shown in Figure 2b. The numbers above each piece of winding, visible in Figure 2, are the number of turns that correspond to the taps derived from the winding. The ITSCs were carried out without additional current limiting resistance in the shorted circuit.
The diagnostic signal, the induced voltage in the measurement coil, was measured not only by the NUCLEO-L476RG module described in the previous section but also in parallel for comparison purposes by a high-end DAQ card by National Instruments (DAQ NI PXIe-4492). The DAQ card was placed in an NI PXI 1082 industrial computer. The price of the PXIe-4492 DAQ card was, at the time of article publication, more than 300 times higher (≈USD 8240) compared to the price of the NUCLEO-L476RG board (≈USD 25). Moreover, the PXIe-4492 has an ADC module with a significantly higher resolution (24-bit) compared to the NUCLEO’s 12-bit ADC.
As presented in Figure 2a, the measurement coil was mounted coaxially with the shaft. Proper mounting of the measurement coil is necessary to apply the proposed method in practice. The design of the used coil and its location coaxially with the shaft does not allow the installation of the cooling fan. Nevertheless, if a fan is necessary, the measurement coil can also be placed on the top or the side of the motor housing. In this experiment, a measurement coil with 300 turns and a DNE copper winding wire cross-section equal to 0.35 mm2 was used.
2.3. Details of the Developed Microcontroller-Based Fault Diagnosis System
Since preliminary tests have shown that the value of the voltage induced in the coil by the axial flux as a result of the ITSC in the IM stator winding is in the order of mV, to obtain the best possible resolution of the measurement, the signal of this voltage was amplified using an ultra-precise INA241A2 amplifier from Texas Instruments (Dallas, TX, USA). This amplifier has a gain of 20 V/V, a maximum gain error of ±0.01%, a maximum voltage offset error of ±10 μV, and a CMRR (Common Mode Rejection Ratio) of 166 dB (typically). The amplifier was powered directly from the NUCLEO-L476RG module with a voltage of 3.3 V.
The input and output pins of the INA241A2 amplifier, a diagram of its internal connections, and the manufacturer’s (Texas Instruments) recommended configuration, as well as a simplified schematic diagram and a photo of the whole prepared system, are shown in Figure 3.
The INA241A amplifier, as shown in Figure 3, is located between the STM32L476RG microcontroller and the measurement coil. The IN− and IN+ inputs to which the measurement coil is connected are characterized by a differential mode operation. The REF1 and REF2 pins are reference pins connected to the amplifier supply voltage and GND. The OUT pin is the output voltage, which is connected to the PC3 pin of the microcontroller, which is programmed to operate in ADC mode; it recognizes the conversion of the analog voltage signal induced in the measuring coil into a digital signal. In future research, it is planned to design a customized PCB, which will contain both the microcontroller and the amplifier on a single board. The laptop shown in the lower right corner was needed only for data visualization purposes. In the final system implementation, all functions could be performed by an embedded system that would indicate the information about the stator winding and supply voltage symmetry condition.
The application responsible for the data acquisition and processing was written using the C programming language. Programming and debugging were performed in the STM32CubeIDE environment. Visualization of the values of variables from the microcontroller’s memory during real-time operation was carried out using STMStudio (v3.6.0) software.
3. Configuration and Verification of the Data Acquisition Process
3.1. Configuration of the Measurement and Data Acquisition Process
To enable the effective extraction of the IM stator winding fault symptoms from the diagnostic signal, it is necessary to properly configure the measurement and signal acquisition process that is performed by the microcontroller. The microcontroller’s pin configuration was done using the Integrated Development Environment (IDE) developed by STMicroelectronics (STM32CubeIDE). STM32CubeIDE is an advanced programming platform for C/C++ languages with the ability to recognize peripheral configuration, code generation, compilation, and debugging for STM32 microcontrollers.
The key task at the stage of preparing the measurement and acquisition of the diagnostic signal is to correctly configure the microcontroller pin that will be associated with the ADC module, which converts the analog voltage signal induced in the measurement coil into a digital signal. Pin two of port C (PC2) was configured as the input of the ADC1 module (channel 3), operated in a single-ended operation mode.
To set the sampling frequency, fp, when using the microcontroller-based embedded system, it is necessary to configure the timer accordingly so that it generates a cyclic interrupt every specified time, during which the voltage measurement (sampling) will be performed. Cyclic interruptions are used to trigger actions that need to be called at the appropriate frequency. To determine at what frequency the interrupt-generating timer will count, it is necessary to check the microcontroller’s specification to verify which bus provides the clocking to the timer and the clocking frequency. In this project, a 16-bit TIM6 timer was used. It was located on the APB1 bus and clocked at 80 MHz. Obtaining this information allows the TIM6 to be appropriately configured for measurement and signal acquisition.
The TIM6 counts from 0 to the value defined in the AutoReload Register (ARR), then generates an interrupt, and resets the counter register to 0 (after the defined time). The frequency of the interrupt triggering (that is the sampling frequency) fp can be calculated according to the following equation:
where fCLK_CNT is the clock frequency of the bus on which the timer is located, and TIM_ARR is the value written in the ARR register.
The fCLK_CNT equals 80 MHz, while 4000 Hz was taken as the desired value of the interrupt trigger frequency (corresponding to the sampling frequency). Hence, the value written in the ARR register is as follows:
3.2. Verification of the Measurement and Data Acquisition Process
After configuring the peripherals required for the project, it is necessary to verify the correctness of the measurement and signal acquisition before proceeding with the tests. In the first step, it was verified if the TIM6 settings were configured correctly. In the timer interrupt handler function (HAL_TIM_PeriodElapsedCallback()), an additional function was added to negate the state of one of the test pins, which was configured as a general-purpose output (GPIO Output). Figure 4 shows the voltage waveform at the output of the test pin recorded using a GW INSTEK MDO-2102A (Montclair, CA, USA) digital oscilloscope. As can be seen, the state change at the output of this pin (state 0 corresponded to ground level, while state 1 corresponded to 3.3 V) occurred every 250 μs. This confirms the correct configuration of TIM6 and corresponds to a frequency of 4 kHz. The interrupt service function will be called to measure (sample) the value measured by the ADC module.
The INA241A2 amplifier (Dallas, TX, USA), which is used in the measurement circuit, not only amplifies the input voltage 20 times but also adds an offset (offset) equal to half the value of its supply voltage. In the case of the supply voltage Vs = 3.3 V, this offset equals 1.65 V. This offset allows the ADC module to measure negative voltages. The output voltage of the INA241A2 amplifier in the absence of input voltage and supply voltage Vs = 3.3 V is shown in Figure 5.
As expected, the value at the output of the amplifier, when there was no input signal connected, was close to 1.65 V. In the next step, the results of signal acquisition recognized by the internal ADC module of the STM32L476RG microcontroller were verified. The waveform of the read-out digital signal after converting the analog voltage signal at the amplifier output by the ADC module (variable ui16RawADCResult) is shown in Figure 6a. To convert the raw ADC value to voltage, it is necessary to perform the following calculations [36]:
where VADC is the actual voltage measured by the ADC module, VREF+ is the reference voltage value of the ADC module equal to 3.3 V, ADC_DATA is the digital value converted by the ADC module, and FULL_SCALE is the maximum digital value of the ADC output equal to FULL_SCALE12-bit = (212 − 1) = 4095 for an ADC with 12-bit resolution.
Figure 6b shows the waveform of the fAmplifierOut variable carrying the information about the voltage after converting the raw ADC value according to Equation (3). This value coincides with the waveform recorded using a digital oscilloscope (Figure 5). After taking into account the offset compensation and gain introduced by the amplifier, the waveform of the actual voltage at the output of the amplifier (variable fActualVoltage) is shown in Figure 6c. The value was close to 0, confirming that the measurement and acquisition configuration were correct in the absence of input voltage.
The final step in verifying the correct configuration of the ADC module was to measure a sinusoidal voltage signal with an amplitude of 50 mV and a frequency of 50 Hz, generated using the NI myDAQ card and the NI ELVISmx Function Generator environment. The waveform of this signal, recorded using a digital oscilloscope, is shown in Figure 7a, while the measurement at the output of the amplifier by the ADC module of the STM32L476RG microcontroller, after offset and gain compensation (×20), is shown in Figure 7b. The FFT amplitude spectrum is shown in Figure 8. The frequency range of the spectrum includes frequencies from 0 to 2000 Hz, which is due to the adopted sampling frequency of 4000 Hz.
Based on the analysis of the results of the conducted verification of the reliability of the measurement and signal acquisition, it was concluded that the configuration was carried out correctly and the noise level was at a satisfactorily low level of about −125 dB.
4. ITSC and Unbalanced Supply Voltage Symptom Extraction Based on the Voltage Inducted by Axial Flux
Due to the limited accuracy of the technological processing of machine components, IMs are characterized by the presence of certain asymmetries in electrical or magnetic circuits. The effect of these imperfections is the occurrence of leakage fluxes, the value of which will depend on the level of asymmetry of the motor. Since the axial flux finds its source in the currents flowing through the motor windings, faults to the electrical circuits will also be reflected in this signal. In the case of an undamaged motor, the axial flux will have a very low value, close to zero [37]. In the following subsections, the effect of the stator winding faults and unbalanced supply voltage on the waveform of the voltage inducted by the axial flux, as well as on its FFT spectrum, will be analyzed. This will allow the assessment of the possibility of extracting the symptoms of these abnormal motor conditions using a low-cost system.
4.1. Stator Winding Faults (ITSCs)
To verify the validity of the measurement performed with the NUCLEO-L476RG evaluation board, the initial results were compared with those obtained with a high-end NI data acquisition board (DAQ), which has a built-in ADC module with a resolution as high as 24 bits. Figure 9a shows a comparison of the waveform of the induced voltage in the measurement coil by axial flux, umc, for an unloaded IM with undamaged stator winding (Nsh = 0, Nsh—number of shorted turns), measured using the NUCLEO-L476RG module and the DAQ NI PXI-4492 card. As expected, based on the analysis of these waveforms, the value of the induced voltage in the absence of a stator winding fault was very low; the signal amplitude was about 4 mV. The results obtained for the DAQ NI PXI-4492 measurement card and the STM32L476RG microcontroller were similar. Figure 9b shows a comparison of the umc waveform for the same drive system operating conditions but with 8 shorted turns (Nsh = 8) in the IM stator winding. As a result of the damage to the stator winding, the value of the amplitude of the voltage induced by the axial flux increased by about 10 times. Again, both the measurement and data acquisition methods yielded similar results, confirming the correctness of the measurement and signal acquisition performed by the developed low-lost system.
The effect of the stator winding fault can also be seen in the FFT spectrum of the induced voltage signal as an increase of the selected characteristic frequency components. These harmonics are described by the following equation [37]:
where:
- fs—fundamental frequency of the supply voltage;
- fr—rotational frequency;
- pp—number of pole pairs;
- s—slip;
- n—1, 3, 5, …, 2pp − 1;
- k—consecutive positive integers (1, 2, 3 …).
Figure 10 shows the FFT spectra of the umc measured using the NUCLEO-L476RG module and the DAQ NI PXI-4492 measurement card for an unloaded motor and Nsh = 0 (Figure 10a) and Nsh = 8 (Figure 10b). Based on the analysis of these figures, it was concluded that the amplitudes of the harmonics seen in these spectra were similar for both methods of measurement and signal acquisition. The spectrum when the signal was measured with the DAQ NI PXI-4492 card had a lower noise level (by about 30 dB). The higher noise level for the NUCLEO-L476RG did not adversely affect the analysis of the harmonic values. The spectra also show selected stator winding fault-specific frequency components, calculated according to Equation (4). By comparing the spectra shown in Figure 10a,b, it is possible to find the largest increase in the harmonic corresponding to the frequency of the supply voltage (fs = 50 Hz) as a result of the damage. The results confirmed the correctness of the measurement carried out using the NUCLEO-L476RG. Therefore, further detailed analysis will be performed only for the proposed solution based on the embedded system.
Figure 11a shows the waveform of the umc for the measurement using the NUCLEO-L476RG module, the motor loaded with the rated torque (TL = TN, TL—load torque.), and different severities of the stator winding fault (Nsh = 0, Nsh = 2, Nsh = 4, and Nsh = 8). Based on the analysis of these waveforms, it can be seen that there was a clear trend of increasing umc amplitude values as the fault deepened. The FFT spectrum for the same operating conditions and degrees of stator winding fault is shown in Figure 11b. Based on the analysis of the amplitudes of characteristic frequencies, it can be concluded that the largest increase in amplitude due to ITSCs was seen for the fs component. An increase in other harmonics calculated according to Equation (4) can also be observed, especially the fs − fr, fs + fr, fs + 5fs, and 3fs components.
The effect of Nsh in the IM stator winding and the TL level on the increase in the amplitudes of the characteristic fault frequencies (fITSC), fs − fr, fs + fr, fs + 5fs, and 3fs, in the FFT spectrum of the um, is shown in Figure 12. The increase in the value of the Adiff (fITSC) amplitudes is calculated as the difference between the amplitude value for the undamaged winding and a given number of shorted turns. Based on the analysis of the results shown in Figure 12, it can be concluded that the value of the amplitude of the fs component increased significantly already with 1 shorted turn in the stator winding. In addition, only a very small effect of the load torque was visible. A similar trend was seen for the fs + fr (Figure 12c) and 3fs (Figure 12e) components. Nevertheless, the increases in the amplitudes of these components due to ITSCs were lower compared to the amplitudes of fs. For the fs − fr, and fs + 5fs frequency components, the increase in amplitudes due to the ITSC did not occur for the entire range of analyzed stator winding conditions and TL levels. Thus, it can be concluded that monitoring the amplitude of the fs and optionally fs + fr components can allow the detection of the IM stator winding fault at an early stage of its propagation (Nsh = 1).
4.2. Unbalanced Supply Voltage
To introduce a condition of power supply voltage unbalance, each of the phases of the IM under study was supplied by a single-phase autotransformer allowing stepless voltage regulation. The supply voltage value in one of the phases (phase A) was reduced from 230 V to 210 V. The analyzed levels of the supply voltage unbalance are grouped in Table 3. The supply voltage unbalance coefficient, αu2, was calculated as the ratio of the negative sequence supply voltage component to the positive sequence supply voltage component.
The waveforms of the voltage induced in the measuring coil by the axial flux for different levels of power supply unbalance are shown in Figure 13. Based on the analysis of these waveforms it can be concluded that the effect of the power supply unbalance on the amplitude of the umc was significantly less visible compared to the effect of ITSCs. For the analyzed range of supply voltage unbalance levels, the umc amplitude was close to 5 mV.
The FFT spectrum of the umc measured using the NUCLEO-L476RG module for an unloaded motor (Figure 14a), a motor loaded with the rated load torque (Figure 14b), and different power supply unbalance levels is presented in Figure 14. Based on the analysis of these spectra, it can be concluded that there was an increase in the amplitude of the fs + 2fr and 3fs − 2fr frequency components as a result of the supply voltage unbalance.
One of the most important observations is that the frequency components that increased as a result of the ITSC did not change their value due to the unbalanced supply voltage, and the other frequency components (fs + 2fr and 3fs − 2fr) appeared. This may allow the distinguishing between these two abnormal conditions (stator winding fault and unbalanced supply voltage). Nevertheless, a more detailed analysis is needed.
The effect of the supply voltage unbalance level and TL on the increase in the amplitudes of the frequency components that increased the most significantly in the case of the ITSC (fs and fs + fr), and the characteristics for supply voltage unbalance (according to Figure 14) (fs + 2fr, and 3fs − 2fr) are presented in Figure 15. Based on the analysis of these results, it can be concluded that the values of the amplitude of the fs and fs + fr did not increase as a result of the unbalanced supply voltage. The amplitude increase of the fs + 2fr component was visible already with an αu2 value of 1.39% (the phase voltage RMS value reduced to 220 V). In the case of the 3fs − 2fr frequency component, the increase as a result of the unbalanced supply voltage was more irregular for different levels of load torque but still visible. Thus, it can be concluded that monitoring the amplitude of the fs + 2fr, and optionally 3fs − 2fr components can allow the detection of the unbalanced supply voltage of the IM drive.
4.3. Influence of the Power Supply Method on the Amplitude Increase of the Selected Harmonics
In the present work, special attention was paid to the IM powered directly from the grid. Nevertheless, the effectiveness of the ITSC symptom extraction was also verified for the IM powered by a Danfoss VLT AutomationDrive FC-302 inverter. The FFT spectra of the umc measured using the NUCLEO-L476RG module for a motor loaded with rated torque, the different severity of the stator winding fault, and the IM supplied by a Danfoss VLT AutomationDrive FC-302 inverter, for three different values of fs, are shown in Figure 16. Based on the analysis of the results, it can be concluded that both in the case of the IM powered directly from the grid and a voltage source inverter, there was an increase in the amplitude value of the fs component as a result of the ITSCs. It confirms the versatility of the proposed solution in terms of the power supply method.
4.4. Discussion of the Key Results and Plans for Future Research and Development
Experimental tests made it possible to evaluate the performance of the developed embedded system, analyze the effect of the IM stator winding fault and an unbalanced supply voltage on the voltage induced in the measurement coil by the axial flux, and extract the symptoms that appear in the FFT spectrum of this voltage as a result of these abnormal conditions. The key discoveries are as follows:
- The results of the measurement and signal acquisition process performed using the developed embedded system based on the STM32L476RG microcontroller did not differ from the results obtained using the high-end PXIe-4492 DAQ measurement card by NI;
- The ITSC in the IM stator winding resulted in a significant increase in the amplitude of the umc regardless of the level of the load torque. The greater the severity of the fault, the greater the increase in amplitude;
- The unbalanced supply voltage of the IM drive did not lead to an increase in the amplitude of the umc;
- The value of the amplitude of the fs component in the umc FFT spectrum increased the most as a result of the ITSC already with one shorted turn in the stator winding. The amplitudes of the fs + fr and 3fs components also increased, but the increase was smaller compared to fs;
- The value of the amplitudes of the fs + 2fr and 3fs − 2fr (particularly) components in the umc FFT spectrum increased the most due to the unbalanced supply voltage;
- The distinguishing between the two abnormal conditions analyzed (stator winding fault and unbalanced supply voltage) were recognized based on the monitoring of the amplitudes of the fs (characteristic for stator winding fault) and the 3fs − 2fr (characteristic for unbalanced supply voltage) components;
- The developed method of monitoring the condition of the IM stator winding proved to be effective not only in the case of an IM supplied from the grid but also by the inverter.
Even though the developed system, despite its low cost, already at this stage allows monitoring of the condition of the IM stator winding and the symmetry of the supply voltage, it will be developed in the future and improved with important functions to meet the requirements for modern drive systems that are associated with the Industry 4.0 paradigm. There are many specific areas for future research and development (R&D), including:
- The improvement of the proposed system with the addition of a module that, based on the input vector consisting of statistical information about the voltage signal induced in the measuring coil by the axial flux and the values of harmonic amplitudes, will automatically indicate the state of the stator winding and the symmetry of the supply voltage;
- The integration of the amplifier and microcontroller on a single, specially designed compact PCB that can be mounted at the installer’s convenience;
- An extension of the functionality of the developed system to measure other diagnostic signals, such as stator phase currents, and the ability to detect other types of faults, such as broken rotor cage bars, bearing faults, and others;
- An extension of the functionality of the developed system with other mathematical apparatuses that can be used for diagnostic signal processing to extract the symptoms of ITSC and unbalanced supply voltage, such as STFT;
- Adding the function of predicting the possibility of a given failure of the analyzed machine; an extension with the functionality called predictive maintenance;
- The analysis of application possibilities and industry areas where the developed system could be also applied.
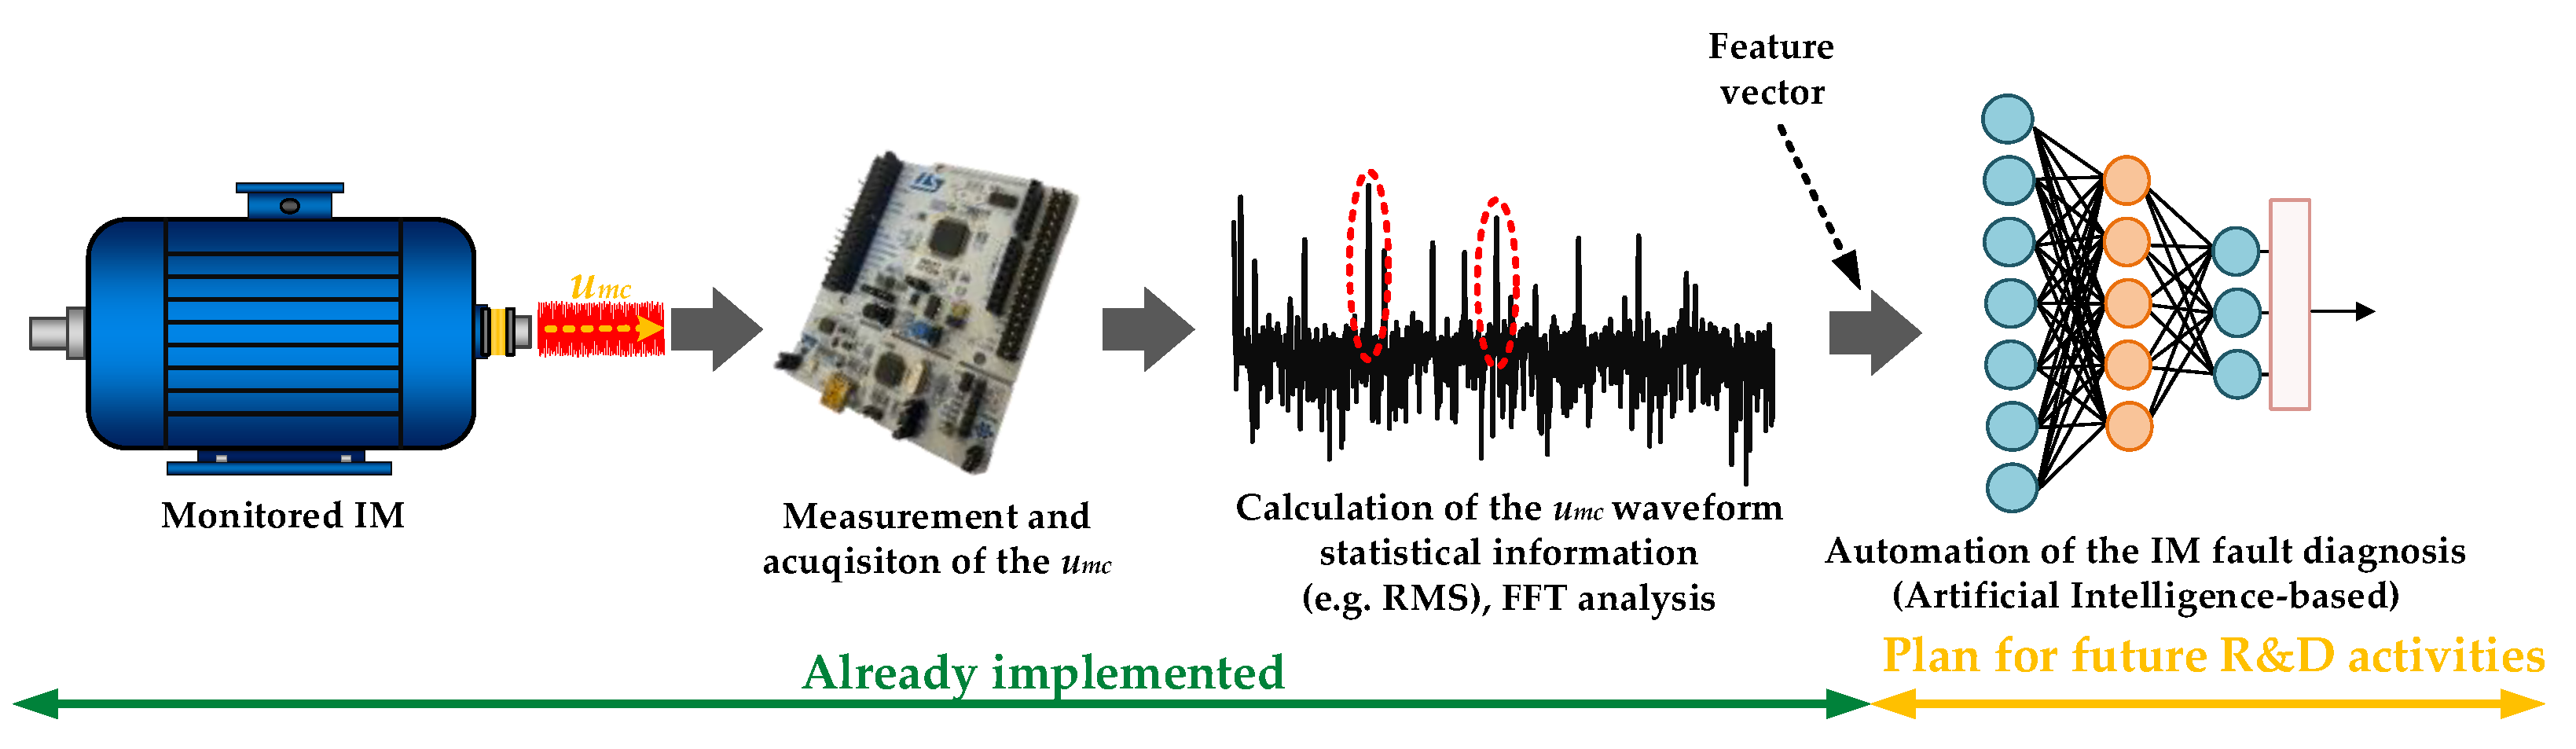
From the above points, the first step will be to fully automate the process of monitoring IM stator winding conditions and supply voltage symmetry using AI (machine learning and deep learning) techniques. A simplified block diagram of the flow of diagnostic information processing from the measurement of the signal on the monitored object to the automation of the process of inferring its condition (including the parts that have already been implemented and future R&D plans) is shown in Figure 17.
5. Conclusions
The experimental results presented in this paper confirmed the feasibility of using a module based on a low-cost ARM Cortex-M4 core microcontroller to monitor the condition of the IM stator winding based on the voltage induced in the measuring coil by the axial flux. The experimental results also proved that FFT analysis of this signal made it possible to extract symptoms of an incipient ITSC, even with a single shorted turn in the stator winding of IM. The results also showed that it was possible to detect and distinguish from a short circuit an asymmetrical IM supply voltage based on analysis of the amplitudes of selected harmonics in the induced voltage spectrum. This study was carried out over a wide range of operating conditions of the drive system, including the verification of the effect of the power supply method on the increase of individual amplitudes in the analyzed spectrum of the voltage inducted by the axial flux.
The use of the proposed hardware implementation poses several challenges, including those related to the correct configuration of the measurement and acquisition of the diagnostic signal, which is explained in detail and can be helpful in the process of preparing an embedded system for diagnostic purposes for various types of applications. Since the evaluation board used in this work (NUCLEO-L476RG with low-cost STM32L476RG microcontroller) is much cheaper compared to the high-end data acquisition boards used, such as DAQ NI PXI-4492, it has great potential for industrial applications.
Future research will focus on the development and hardware implementation (on a low-cost microcontroller) of an algorithm that will fully automate the process of detecting and classifying an ITSC in the stator winding of an IM, which will use the statistical information of the induced voltage waveform or the amplitude of selected harmonics in the FFT spectrum of this signal. For this purpose, it is planned to use machine learning algorithms whose computational complexity will allow implementation in an embedded system.
Author Contributions
All of the authors contributed equally to the concept of the paper, and proposed the methodology; investigation and formal analyses, P.P. (Przemyslaw Pietrzak), P.P. (Piotr Pietrzak) and M.W.; software and data curation, P.P. (Przemyslaw Pietrzak) and P.P. (Piotr Pietrzak); measurements, P.P. (Przemyslaw Pietrzak), P.P. (Piotr Pietrzak) and M.W.; proposed the paper organization, P.P. (Przemyslaw Pietrzak) and M.W.; validated the obtained results, M.W. All authors have read and agreed to the published version of the manuscript.
Funding
This research received no external funding.
Data Availability Statement
Data are contained within the article.
Conflicts of Interest
The authors declare no conflict of interest.
References
- Laadjal, K.; Amaral, A.M.R.; Sahraoui, M.; Cardoso, A.J.M. Machine Learning Based Method for Impedance Estimation and Unbalance Supply Voltage Detection in Induction Motors. Sensors 2023, 23, 7989. [Google Scholar] [CrossRef] [PubMed]
- Aguayo-Tapia, S.; Avalos-Almazan, G.; Rangel-Magdaleno, J.D.J.; Ramirez-Cortes, J.M. Physical Variable Measurement Techniques for Fault Detection in Electric Motors. Energies 2023, 16, 4780. [Google Scholar] [CrossRef]
- He, J.; Somogyi, C.; Strandt, A.; Demerdash, N.A.O. Diagnosis of Stator Winding Short-Circuit Faults in an Interior Permanent Magnet Synchronous Machine. In Proceedings of the 2014 IEEE Energy Conversion Congress and Exposition (ECCE), Pittsburg, PA, USA, 15–18 September 2014; pp. 3125–3130. [Google Scholar]
- Baruti, K.H.; Li, C.; Erturk, F.; Akin, B. Online Stator Inter-Turn Short Circuit Estimation and Fault Management in Permanent Magnet Motors. IEEE Trans. Energy Convers. 2023, 38, 1016–1027. [Google Scholar] [CrossRef]
- Gonzalez-Cordoba, J.L.; Osornio-Rios, R.A.; Granados-Lieberman, D.; Romero-Troncoso, R.D.J.; Valtierra-Rodriguez, M. Thermal-Impact-Based Protection of Induction Motors Under Voltage Unbalance Conditions. IEEE Trans. Energy Convers. 2018, 33, 1748–1756. [Google Scholar] [CrossRef]
- Lashkari, N.; Poshtan, J.; Azgomi, H.F. Simulative and Experimental Investigation on Stator Winding Turn and Unbalanced Supply Voltage Fault Diagnosis in Induction Motors Using Artificial Neural Networks. ISA Trans. 2015, 59, 334–342. [Google Scholar] [CrossRef] [PubMed]
- Siddique, A.; Yadava, G.S.; Singh, B. A Review of Stator Fault Monitoring Techniques of Induction Motors. IEEE Trans. Energy Convers. 2005, 20, 106–114. [Google Scholar] [CrossRef]
- Niu, G.; Dong, X.; Chen, Y. Motor Fault Diagnostics Based on Current Signatures: A Review. IEEE Trans. Instrum. Meas. 2023, 72, 1–19. [Google Scholar] [CrossRef]
- Riera-Guasp, M.; Antonino-Daviu, J.A.; Capolino, G.-A. Advances in Electrical Machine, Power Electronic, and Drive Condition Monitoring and Fault Detection: State of the Art. IEEE Trans. Ind. Electron. 2015, 62, 1746–1759. [Google Scholar] [CrossRef]
- Garcia-Calva, T.; Morinigo-Sotelo, D.; Fernandez-Cavero, V.; Romero-Troncoso, R. Early Detection of Faults in Induction Motors—A Review. Energies 2022, 15, 7855. [Google Scholar] [CrossRef]
- Gultekin, M.A.; Bazzi, A. Review of Fault Detection and Diagnosis Techniques for AC Motor Drives. Energies 2023, 16, 5602. [Google Scholar] [CrossRef]
- Alloui, A.; Laadjal, K.; Sahraoui, M.; Marques Cardoso, A.J. Online Interturn Short-Circuit Fault Diagnosis in Induction Motors Operating under Unbalanced Supply Voltage and Load Variations, Using the STLSP Technique. IEEE Trans. Ind. Electron. 2023, 70, 3080–3089. [Google Scholar] [CrossRef]
- Cruz, S.M.A.; Cardoso, A.J.M. Stator Winding Fault Diagnosis in Three-Phase Synchronous and Asynchronous Motors, by the Extended Park’s Vector Approach. IEEE Trans. Ind. Appl. 2001, 37, 1227–1233. [Google Scholar] [CrossRef]
- Piechocki, M.; Pajchrowski, T.; Kraft, M.; Wolkiewicz, M.; Ewert, P. Unraveling Induction Motor State through Thermal Imaging and Edge Processing: A Step towards Explainable Fault Diagnosis. Eksploat. Niezawodn. Maint. Reliab. 2023, 25. [Google Scholar] [CrossRef]
- Drif, M.; Cardoso, A.J.M. Stator Fault Diagnostics in Squirrel Cage Three-Phase Induction Motor Drives Using the Instantaneous Active and Reactive Power Signature Analyses. IEEE Trans. Ind. Inf. 2014, 10, 1348–1360. [Google Scholar] [CrossRef]
- Kumar, T.C.A.; Singh, G.; Naikan, V.N.A. Sensitivity of Rotor Slot Harmonics Due to Inter-Turn Fault in Induction Motors through Vibration Analysis. In Proceedings of the 2018 International Conference on Power, Instrumentation, Control and Computing (PICC), Thrissur, India, 18–20 January 2018; pp. 1–3. [Google Scholar]
- Skowron, M.; Wolkiewicz, M.; Orlowska-Kowalska, T.; Kowalski, C.T. Effectiveness of Selected Neural Network Structures Based on Axial Flux Analysis in Stator and Rotor Winding Incipient Fault Detection of Inverter-Fed Induction Motors. Energies 2019, 12, 2392. [Google Scholar] [CrossRef]
- Pietrzak, P.; Wolkiewicz, M. Fault Diagnosis of PMSM Stator Winding Based on Continuous Wavelet Transform Analysis of Stator Phase Current Signal and Selected Artificial Intelligence Techniques. Electronics 2023, 12, 1543. [Google Scholar] [CrossRef]
- Orlowska-Kowalska, T.; Wolkiewicz, M.; Pietrzak, P.; Skowron, M.; Ewert, P.; Tarchala, G.; Krzysztofiak, M.; Kowalski, C.T. Fault Diagnosis and Fault-Tolerant Control of PMSM Drives–State of the Art and Future Challenges. IEEE Access 2022, 10, 59979–60024. [Google Scholar] [CrossRef]
- Al-Andoli, M.N.; Tan, S.C.; Sim, K.S.; Seera, M.; Lim, C.P. A Parallel Ensemble Learning Model for Fault Detection and Diagnosis of Industrial Machinery. IEEE Access 2023, 11, 39866–39878. [Google Scholar] [CrossRef]
- Ma, J.; Liu, X.; Hu, J.; Fei, J.; Zhao, G.; Zhu, Z. Stator ITSC Fault Diagnosis of EMU Asynchronous Traction Motor Based on ApFFT Time-Shift Phase Difference Spectrum Correction and SVM. Energies 2023, 16, 5612. [Google Scholar] [CrossRef]
- Das, A.K.; Das, S.; Pradhan, A.K.; Chatterjee, B.; Dalai, S. RPCNNet: A Deep Learning Approach to Sense Minor Stator Winding Interturn Fault Severity in Induction Motor under Variable Load Condition. IEEE Sens. J. 2023, 23, 3965–3972. [Google Scholar] [CrossRef]
- Zhou, Y.; Shang, Q.; Guan, C. Three-Phase Asynchronous Motor Fault Diagnosis Using Attention Mechanism and Hybrid CNN-MLP By Multi-Sensor Information. IEEE Access 2023, 11, 98402–98414. [Google Scholar] [CrossRef]
- Guo, J.; Wan, J.-L.; Yang, Y.; Dai, L.; Tang, A.; Huang, B.; Zhang, F.; Li, H. A Deep Feature Learning Method for Remaining Useful Life Prediction of Drilling Pumps. Energy 2023, 282, 128442. [Google Scholar] [CrossRef]
- Sawitri, D.R.; Asfani, D.A.; Purnomo, M.H.; Purnama, I.K.E.; Ashari, M. Early Detection of Unbalance Voltage in Three Phase Induction Motor Based on SVM. In Proceedings of the 2013 9th IEEE International Symposium on Diagnostics for Electric Machines, Power Electronics and Drives (SDEMPED), Valencia, Spain, 27–30 August 2013; pp. 573–578. [Google Scholar]
- Refaat, S.S.; Abu-Rub, H.; Saad, M.S.; Aboul-Zahab, E.M.; Iqbal, A. Detection, Diagnoses and Discrimination of Stator Turn to Turn Fault and Unbalanced Supply Voltage Fault for Three Phase Induction Motors. In Proceedings of the 2012 IEEE International Conference on Power and Energy (PECon), Kota Kinabalu, Malaysia, 2–5 December 2012; pp. 910–915. [Google Scholar]
- Çakır, A.; Çalış, H.; Küçüksille, E.U. Data Mining Approach for Supply Unbalance Detection in Induction Motor. Expert Syst. Appl. 2009, 36, 11808–11813. [Google Scholar] [CrossRef]
- Laadjal, K.; Sahraoui, M.; Alloui, A.; Cardoso, A.J.M. Three-Phase Induction Motors Online Protection against Unbalanced Supply Voltages. Machines 2021, 9, 203. [Google Scholar] [CrossRef]
- Vassiliev, A.E.; Ivanova, T.Y.; Cabezas Tapia, D.F.; Luong, Q.T. Microcontroller-Based Embedded System Equipment Development for Research and Educational Support. In Proceedings of the 2016 International Conference on Information Management and Technology (ICIMTech), Bandung, Malaysia, 16–18 November 2016; pp. 219–223. [Google Scholar]
- Zachary Lasiuk, P.V.J.A. The Insider’s Guide to Arm Cortex-M Development. Leverage Embedded Software Development Tools and Examples to Become an Efficient Cortex-M Developer; Packt Publishing: Burmingham, UK, 2022. [Google Scholar]
- Saha, S.; Tyagi, T.; Gadre, D.V. ARM(R) Microcontroller Based Automatic Power Factor Monitoring and Control System. In Proceedings of the 2013 Texas Instruments India Educators’ Conference, Bangalore, India, 4–6 April 2013; pp. 165–170. [Google Scholar]
- Waswani, R.; Pawar, A.; Deore, M.; Patel, R. Induction Motor Fault Detection, Protection and Speed Control Using Arduino. In Proceedings of the 2017 International Conference on Innovations in Information, Embedded and Communication Systems (ICIIECS), Coimbatore, India, 17–18 March 2017; pp. 1–5. [Google Scholar]
- Sutar, P.P.; Panchade, V.M. Induction Motor Faults Mitigation Using Microcontroller. In Proceedings of the 2017 International Conference on Energy, Communication, Data Analytics and Soft Computing (ICECDS), Chennai, India, 1–2 August 2017; pp. 489–493. [Google Scholar]
- Gargiulo, F.; Liccardo, A.; Schiano Lo Moriello, R. A Non-Invasive Method Based on AI and Current Measurements for the Detection of Faults in Three-Phase Motors. Energies 2022, 15, 4407. [Google Scholar] [CrossRef]
- STM32 Nucleo-64 Development Board with STM32L476RG MCU Product Overview. Available online: https://www.st.com/en/evaluation-tools/nucleo-l476rg.html (accessed on 10 December 2023).
- Reference Manual RM0351: STM32L47xxx, STM32L48xxx, STM32L49xxx and STM32L4Axxx Advanced Arm®-Based 32-Bit MCUs. Available online: https://www.st.com/resource/en/reference_manual/rm0351-stm32l47xxx-stm32l48xxx-stm32l49xxx-and-stm32l4axxx-advanced-armbased-32bit-mcus-stmicroelectronics.pdf (accessed on 10 December 2023).
- Skowron, M. Application of Deep Learning Neural Networks for the Diagnosis of Electrical Damage to the Induction Motor Using the Axial Flux. Bull. Pol. Acad. Sci. Tech. Sci. 2020, 68, 1031–1038. [Google Scholar] [CrossRef]
Figure 1.
(a) Real view and (b) simplified hardware block diagram of the NUCLEO-L476RG evaluation board.
Figure 1.
(a) Real view and (b) simplified hardware block diagram of the NUCLEO-L476RG evaluation board.
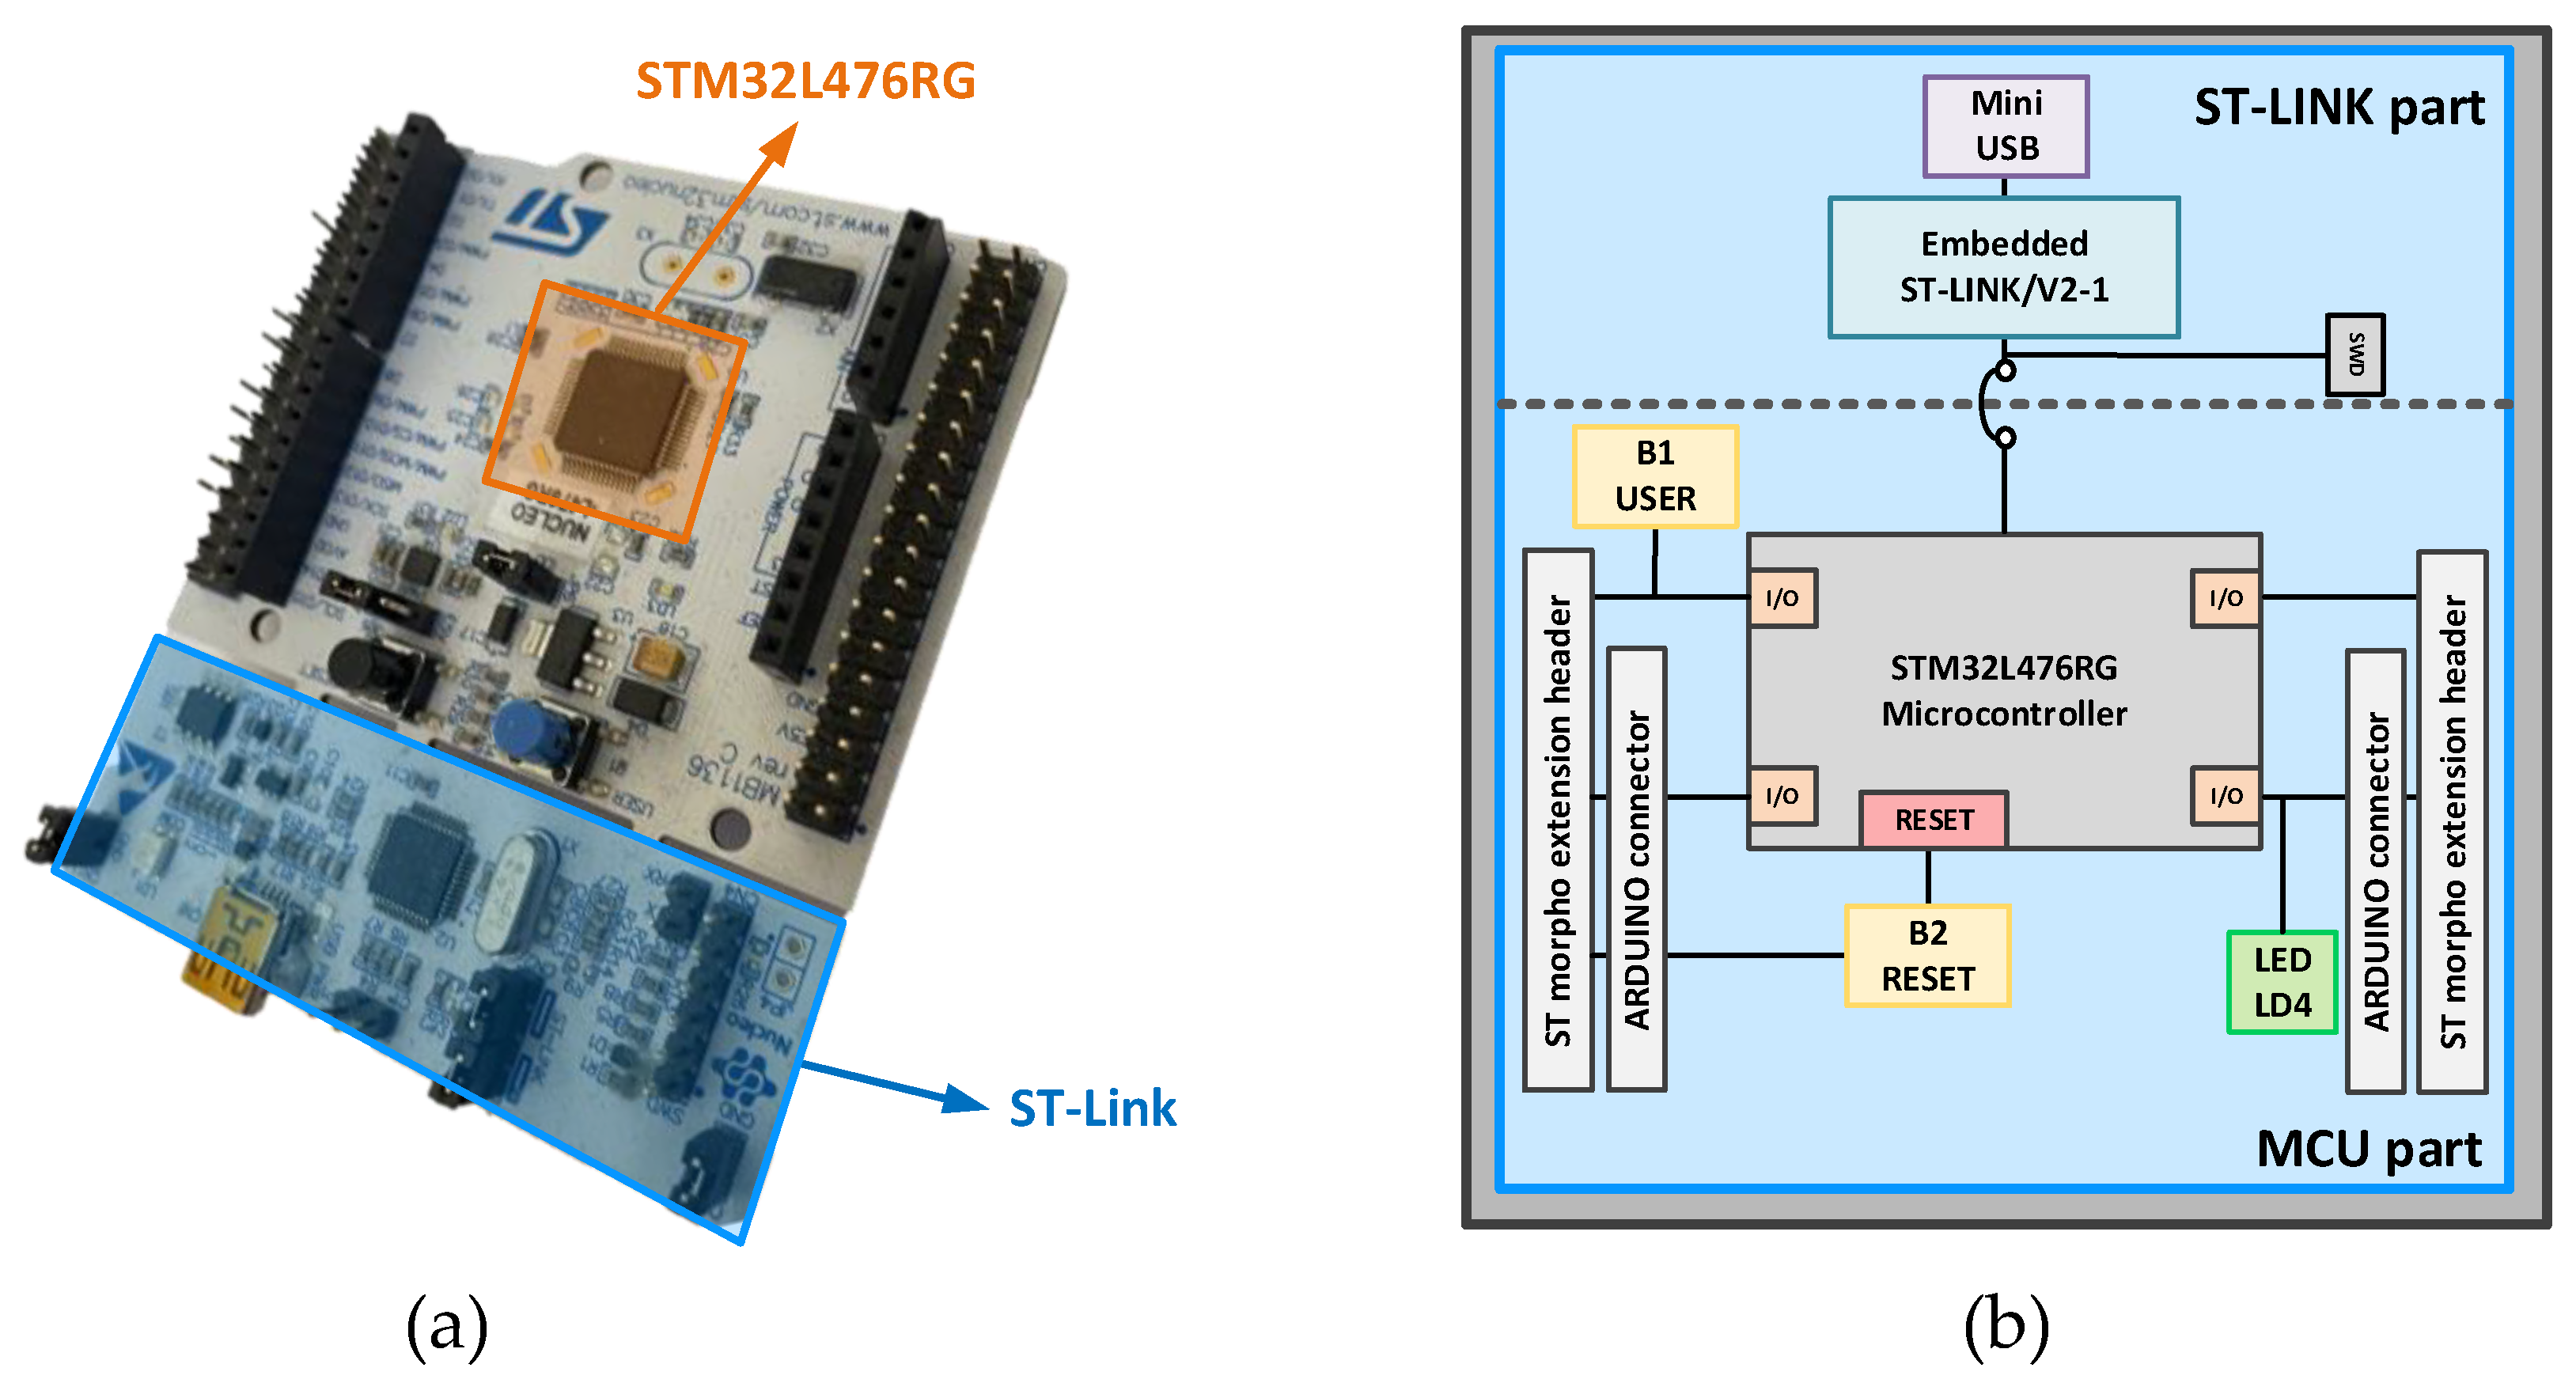
Figure 2.
(a) Real view of the motor test bench: A—SI under test, B—DC motor (load), C—measurement coil, and D—terminal board; and (b) diagram of the derived stator winding terminals.
Figure 2.
(a) Real view of the motor test bench: A—SI under test, B—DC motor (load), C—measurement coil, and D—terminal board; and (b) diagram of the derived stator winding terminals.

Figure 3.
(a) Input and output pins of the INA241A2 amplifier, (b) a diagram of its internal connections and the manufacturer’s recommended configuration, (c) a simplified schematic, and (d) a photo of the whole system.
Figure 3.
(a) Input and output pins of the INA241A2 amplifier, (b) a diagram of its internal connections and the manufacturer’s recommended configuration, (c) a simplified schematic, and (d) a photo of the whole system.

Figure 4.
The voltage waveform at the output of the test pin was recorded using a GW INSTEK MDO-2102A digital oscilloscope.
Figure 4.
The voltage waveform at the output of the test pin was recorded using a GW INSTEK MDO-2102A digital oscilloscope.

Figure 5.
The output voltage of the INA241A2 amplifier in the absence of input voltage (amplifier supply voltage Vs = 3.3 V).
Figure 5.
The output voltage of the INA241A2 amplifier in the absence of input voltage (amplifier supply voltage Vs = 3.3 V).
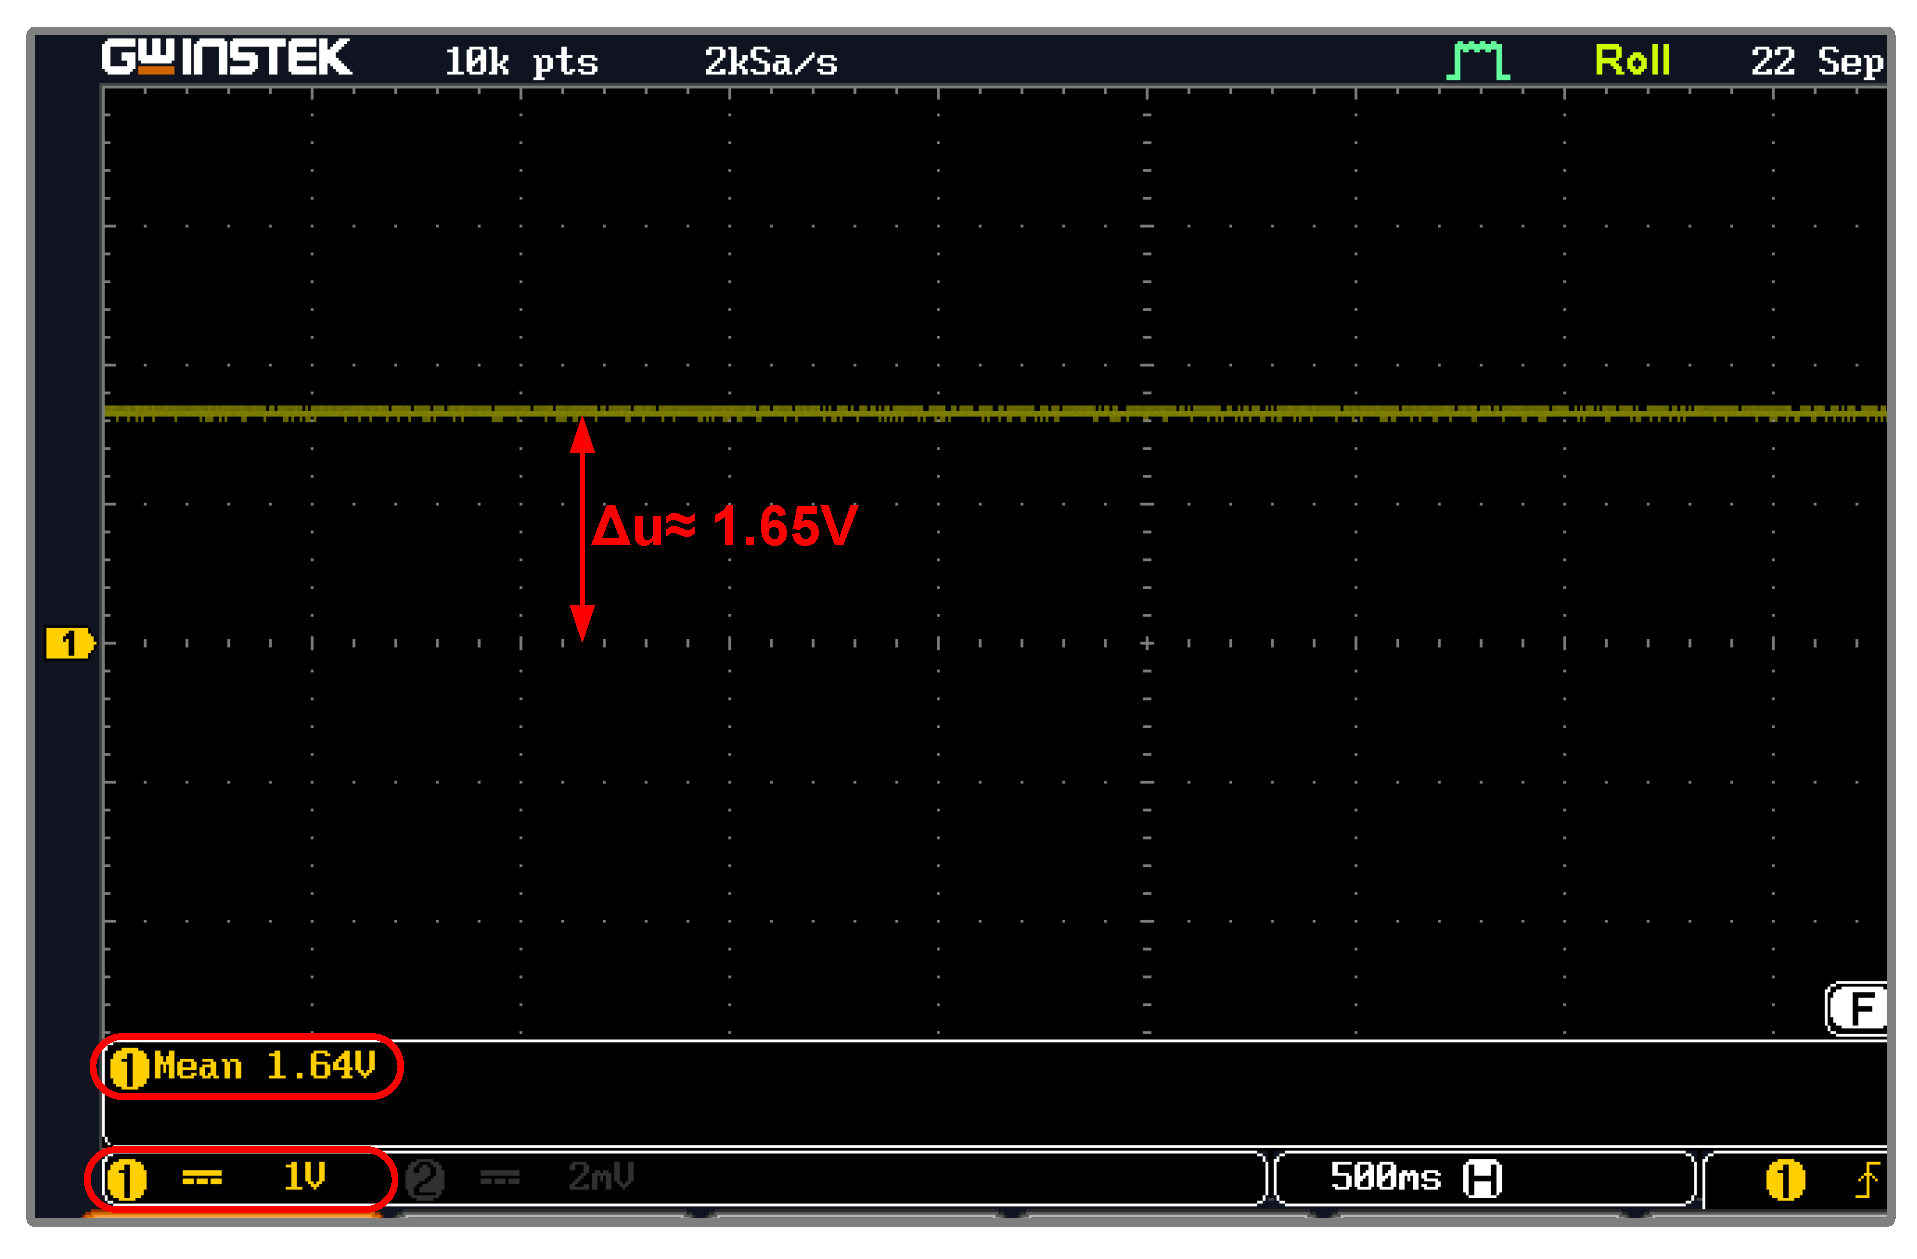
Figure 6.
The waveform of (a) the measured digital signal after converting the analog voltage signal at the amplifier output by the ADC module (ui16RawADCResult), (b) the voltage after converting the raw ADC value (fAmplifierOutput), and (c) the actual amplifier output voltage after offset and gain compensation (fActualVoltage).
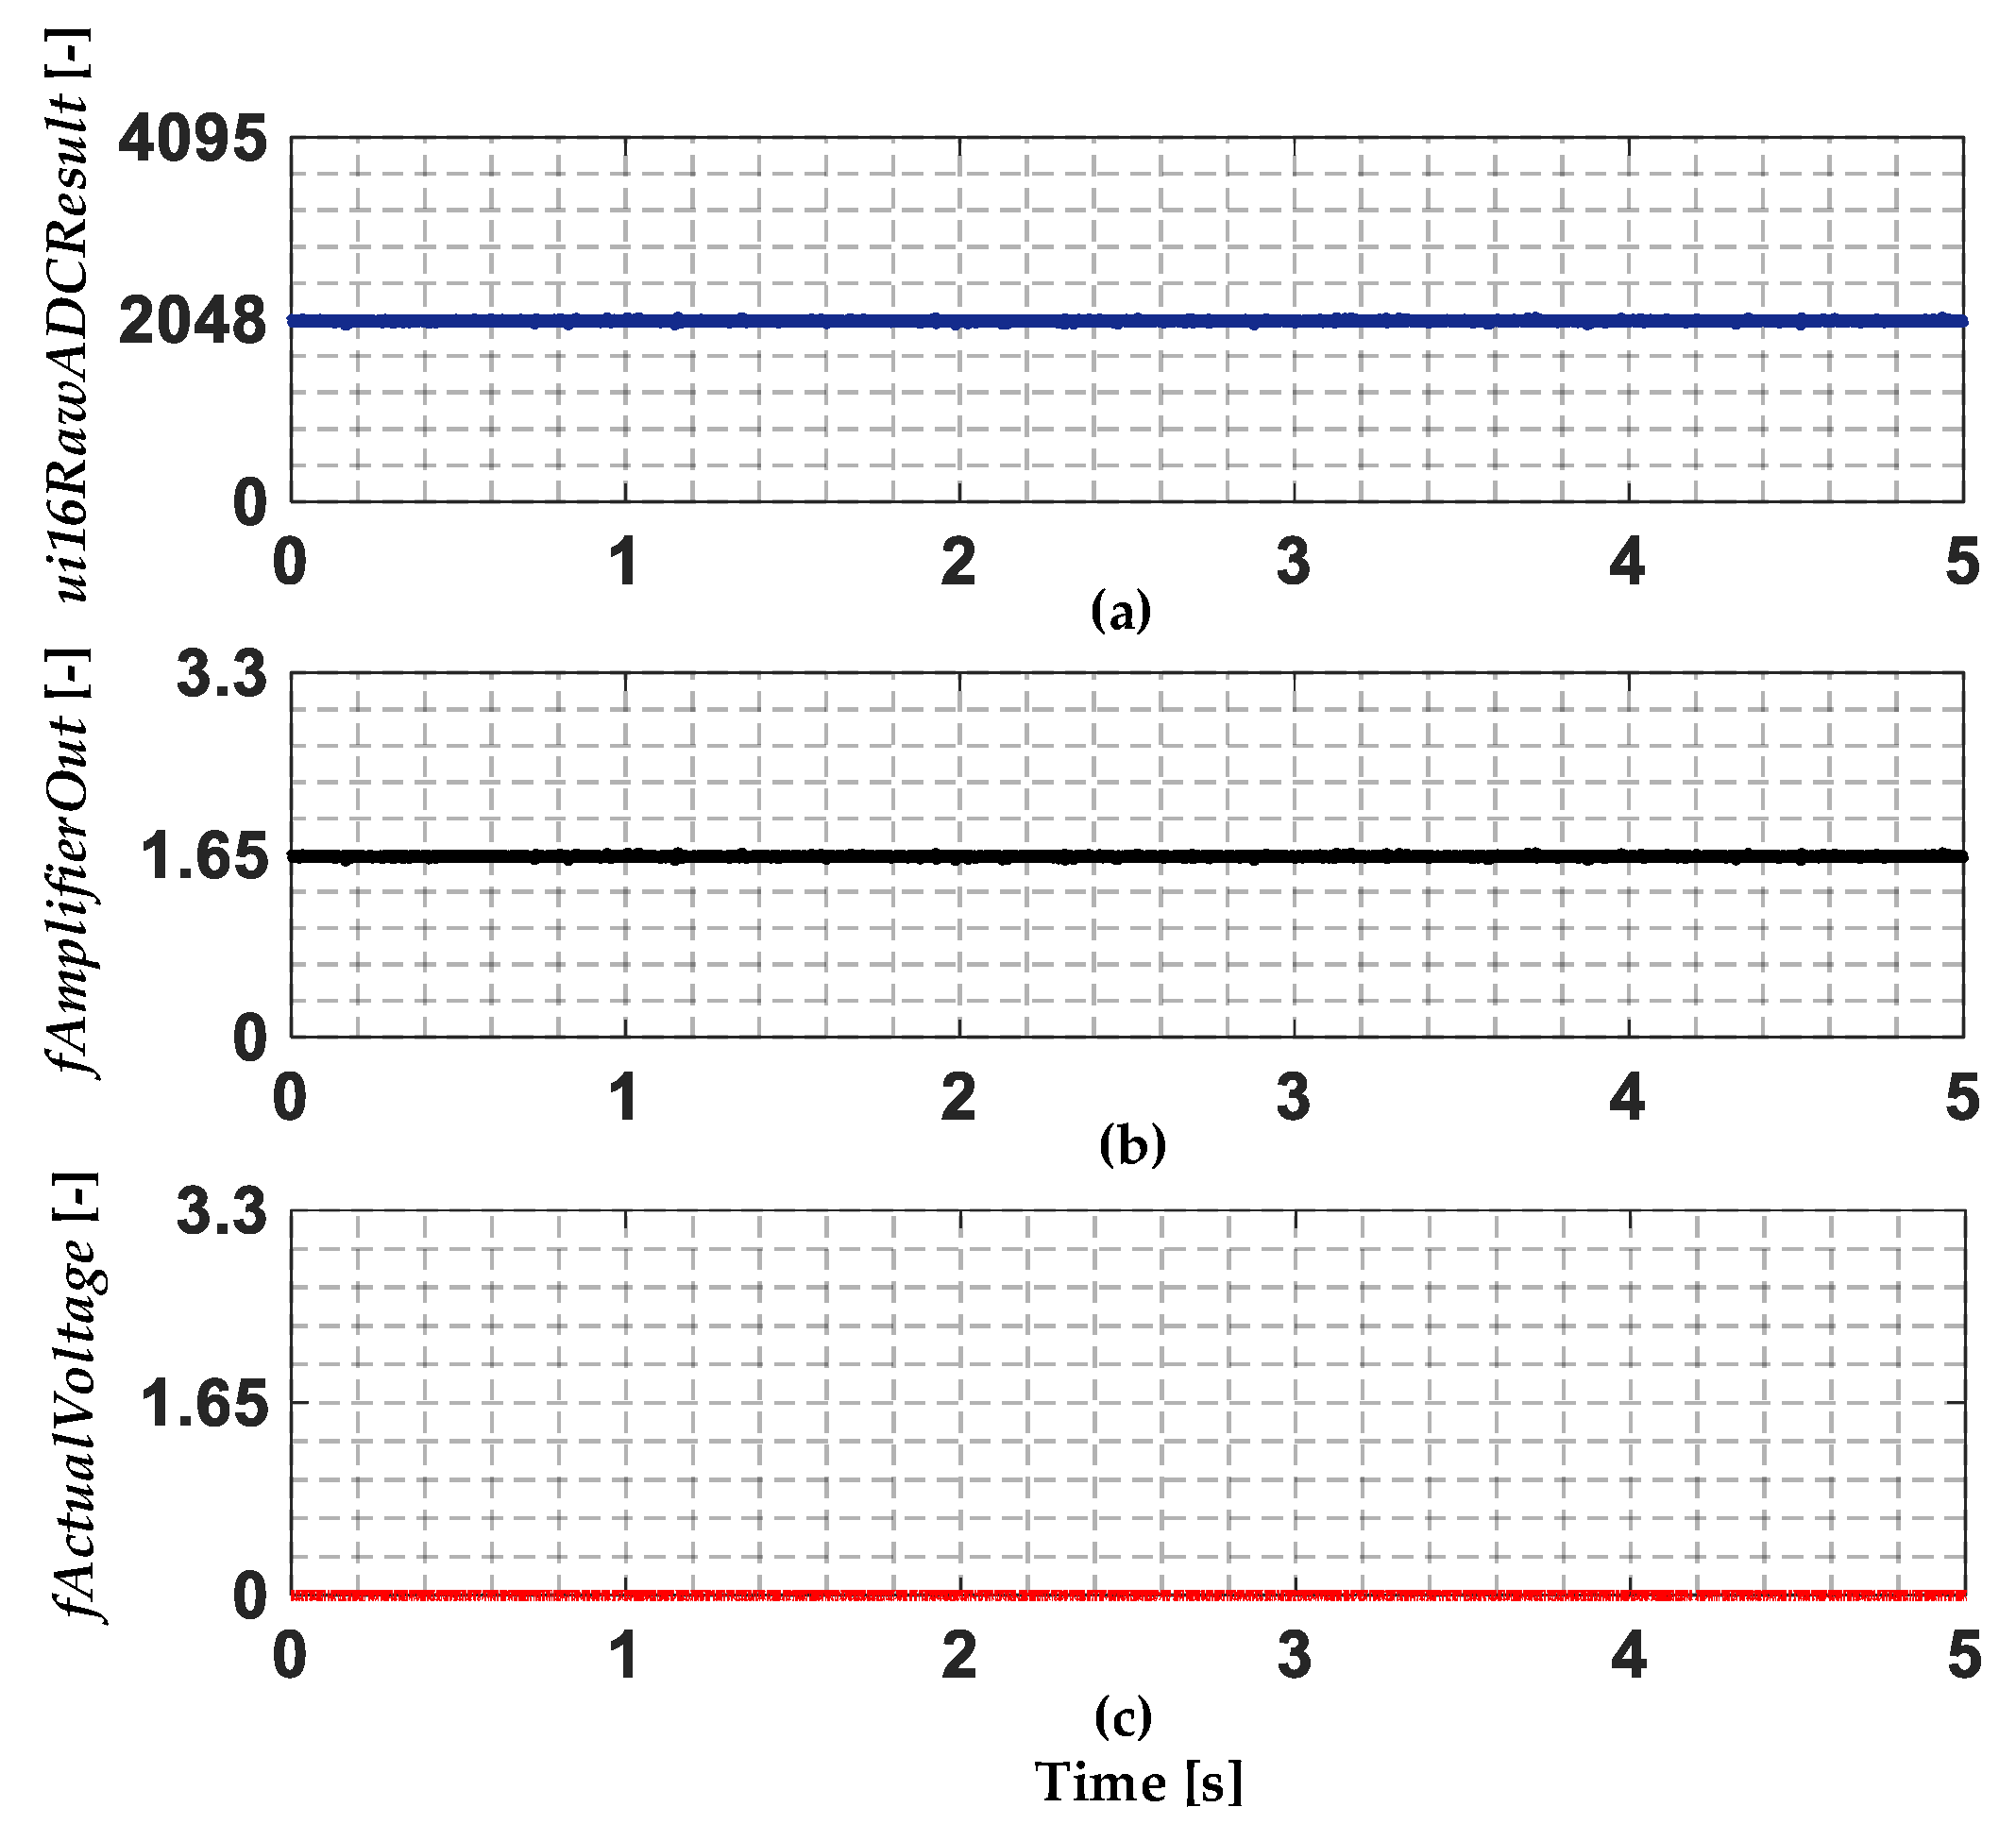
Figure 7.
(a) The waveform of a sinusoidal voltage signal with an amplitude of 50 mV and a frequency of 50 Hz generated using the NI myDAQ card and the NI ELVISmx Function Generator environment (recorded using a digital oscilloscope), and (b) the waveform of the generated signal after conversion and offset compensation measured by the ADC module of the STM32L476RG microcontroller.
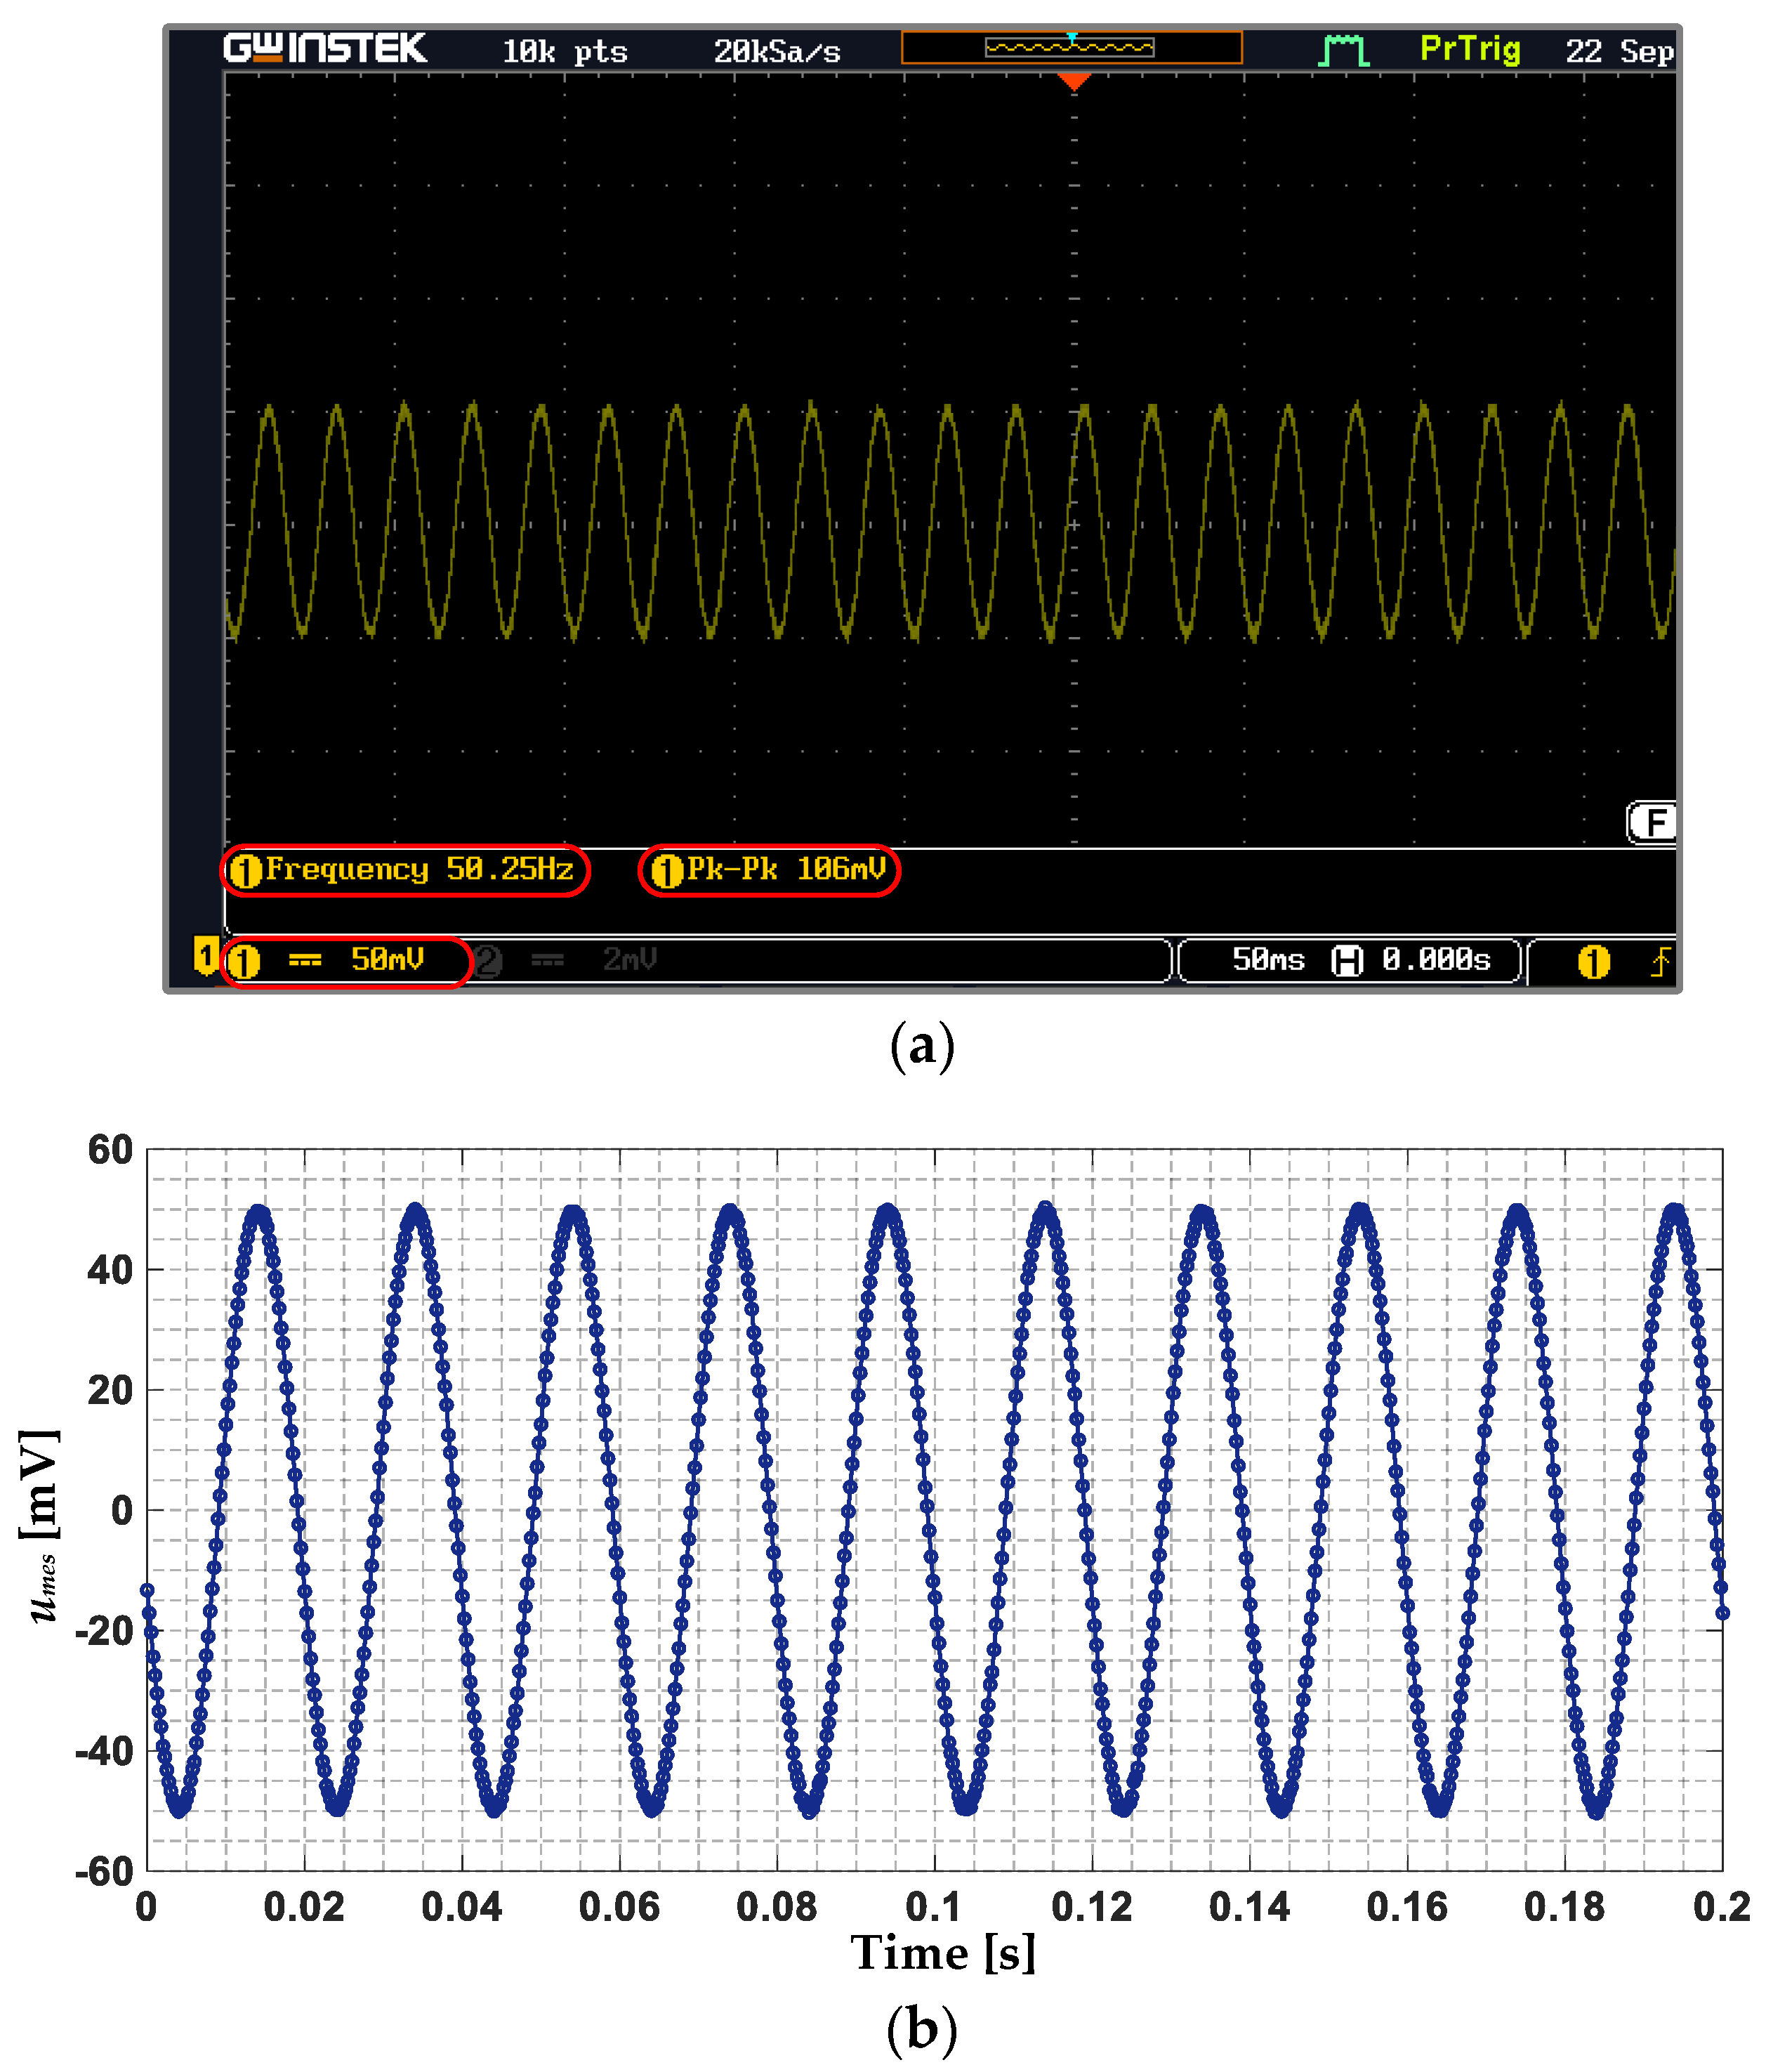
Figure 8.
The FFT spectrum of a sinusoidal voltage signal with an amplitude of 50 mV and a frequency of 50 Hz measured by the ADC module of the STM32L476RG microcontroller.
Figure 8.
The FFT spectrum of a sinusoidal voltage signal with an amplitude of 50 mV and a frequency of 50 Hz measured by the ADC module of the STM32L476RG microcontroller.

Figure 9.
The waveform of the umc measured using the NUCLEO-L476RG module and DAQ NI PXI-4492 measurement card for an unloaded motor and (a) Nsh = 0, (b) Nsh = 8.
Figure 9.
The waveform of the umc measured using the NUCLEO-L476RG module and DAQ NI PXI-4492 measurement card for an unloaded motor and (a) Nsh = 0, (b) Nsh = 8.

Figure 10.
The FFT spectrum of the umc measured using the NUCLEO-L476RG module and DAQ NI PXI-4492 card for an unloaded motor and (a) Nsh = 0, (b) Nsh = 8 (fs = fsN = 50 Hz, fr = 24.9 Hz).
Figure 10.
The FFT spectrum of the umc measured using the NUCLEO-L476RG module and DAQ NI PXI-4492 card for an unloaded motor and (a) Nsh = 0, (b) Nsh = 8 (fs = fsN = 50 Hz, fr = 24.9 Hz).
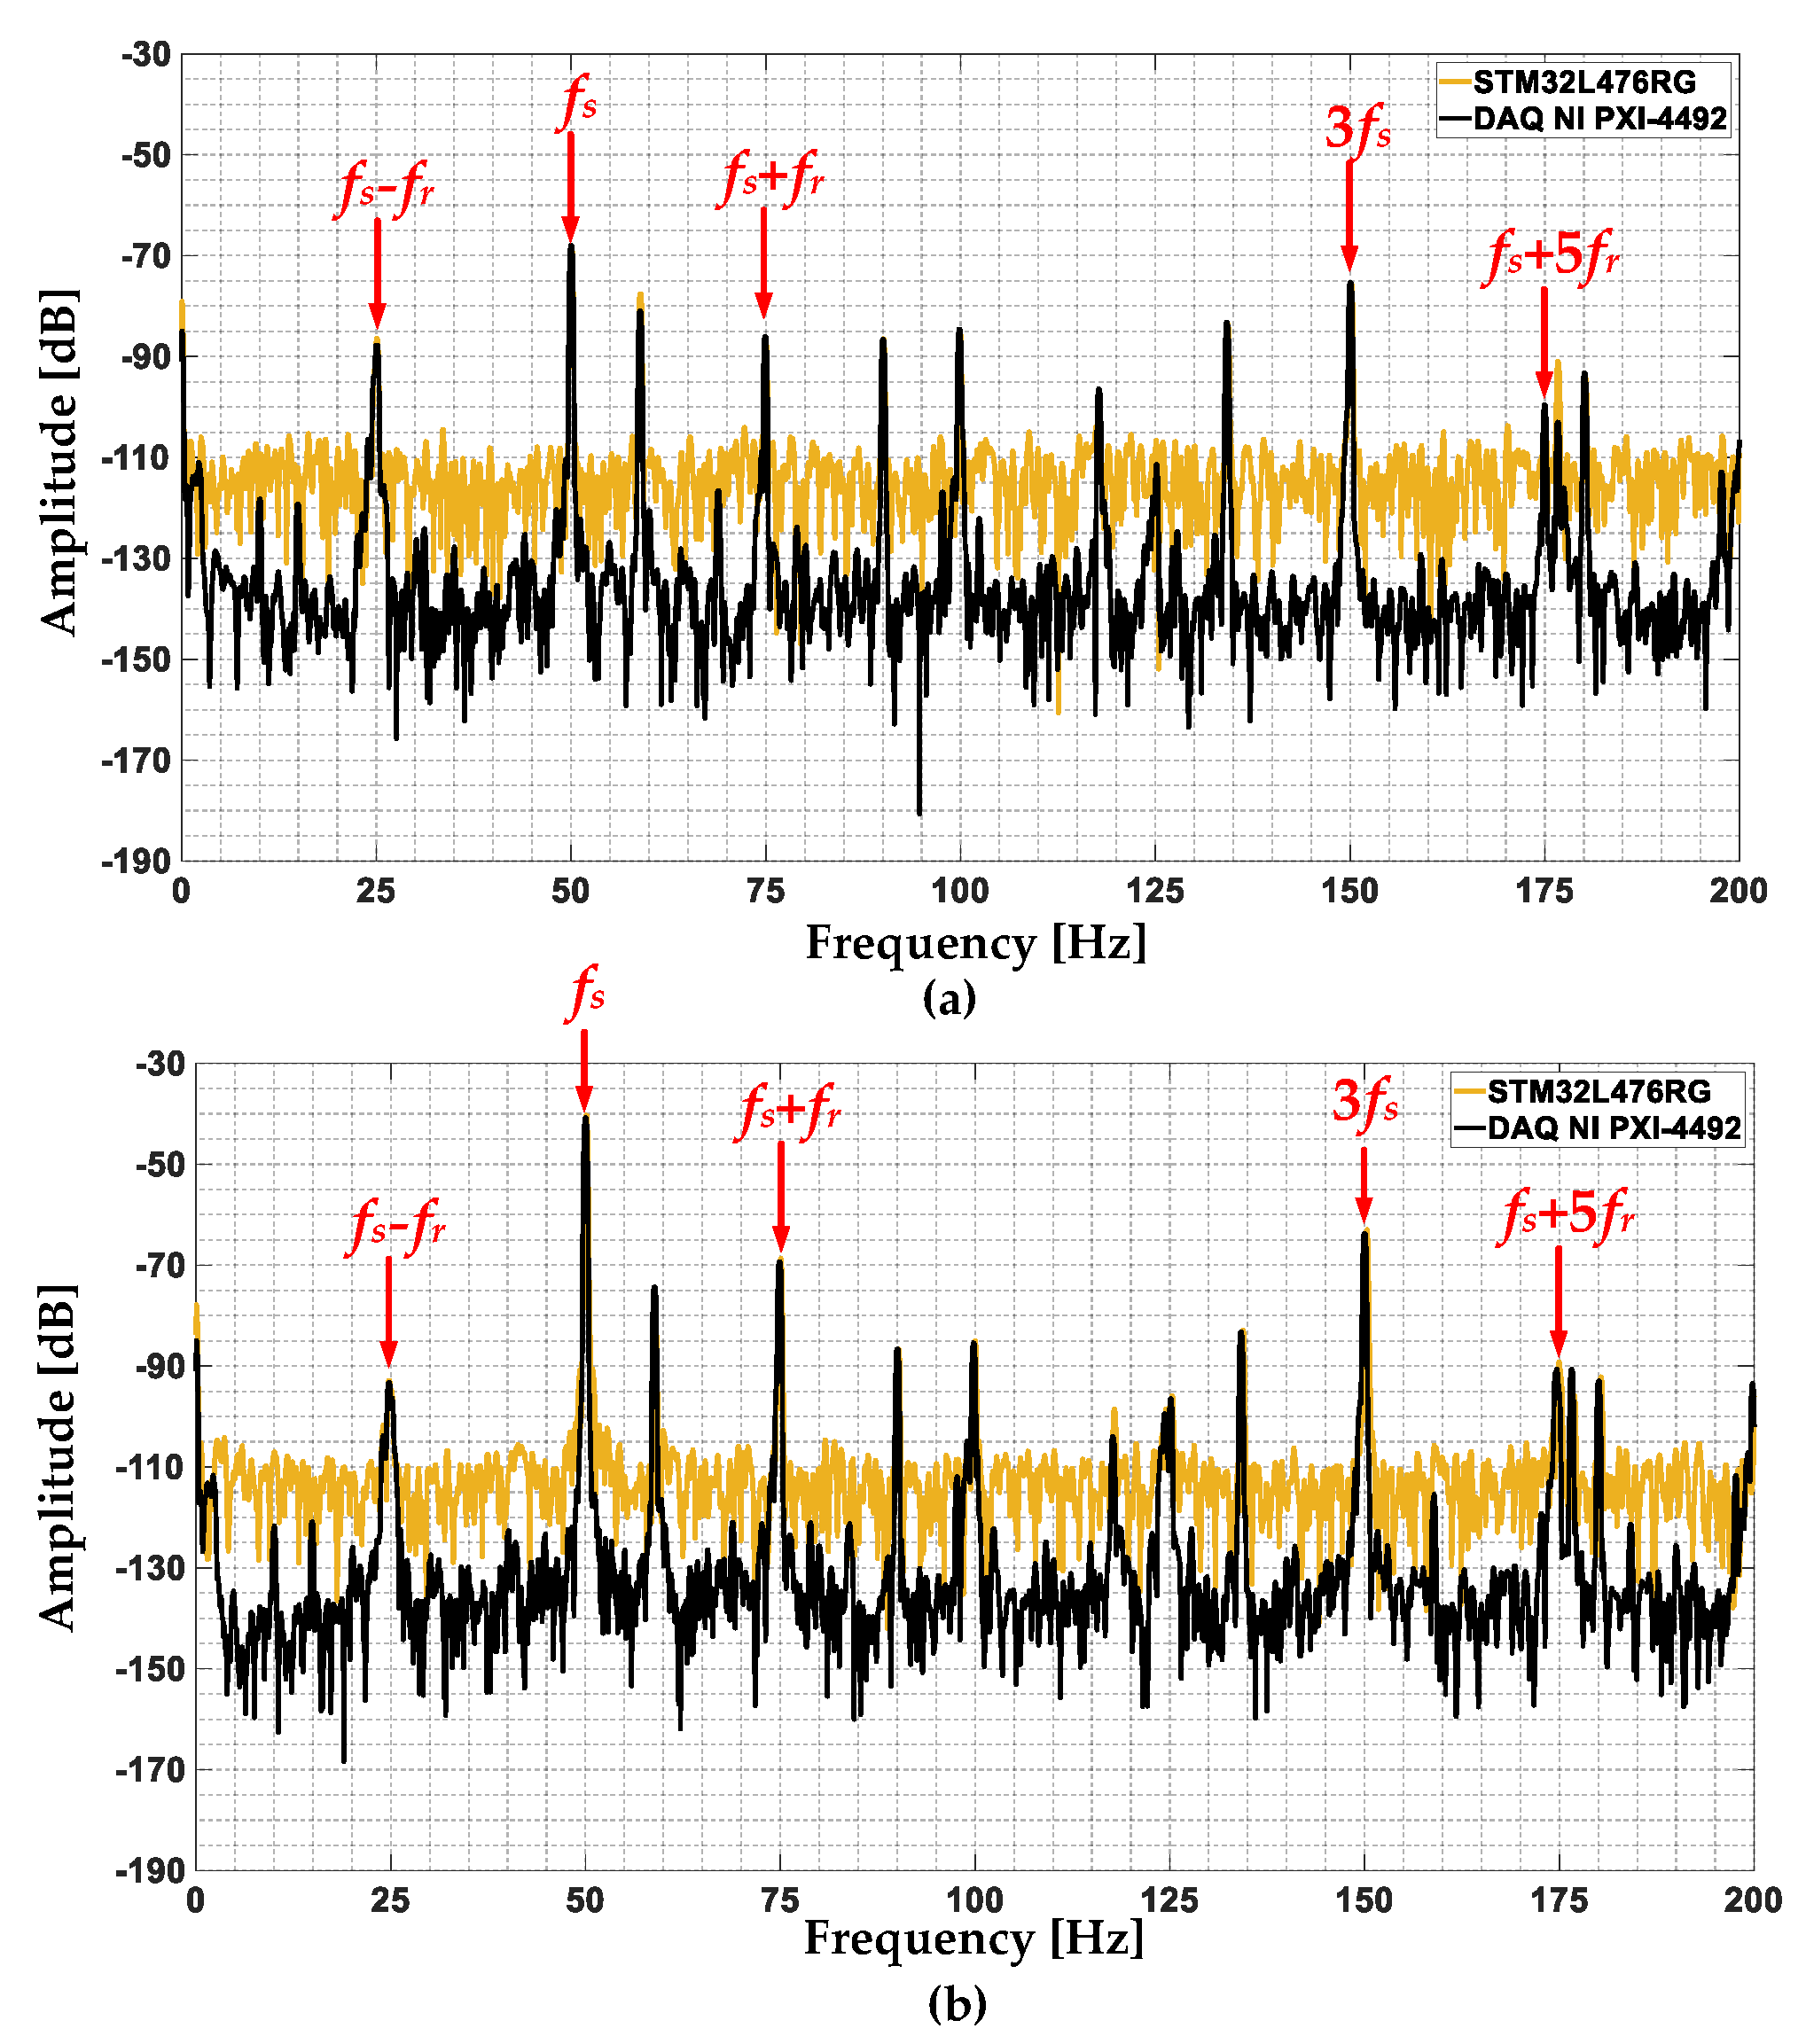
Figure 11.
(a) The waveform and (b) the FFT spectrum of the umc measured using the NUCLEO-L476RG module, for a motor loaded with rated torque and different severities of the stator winding fault.
Figure 11.
(a) The waveform and (b) the FFT spectrum of the umc measured using the NUCLEO-L476RG module, for a motor loaded with rated torque and different severities of the stator winding fault.
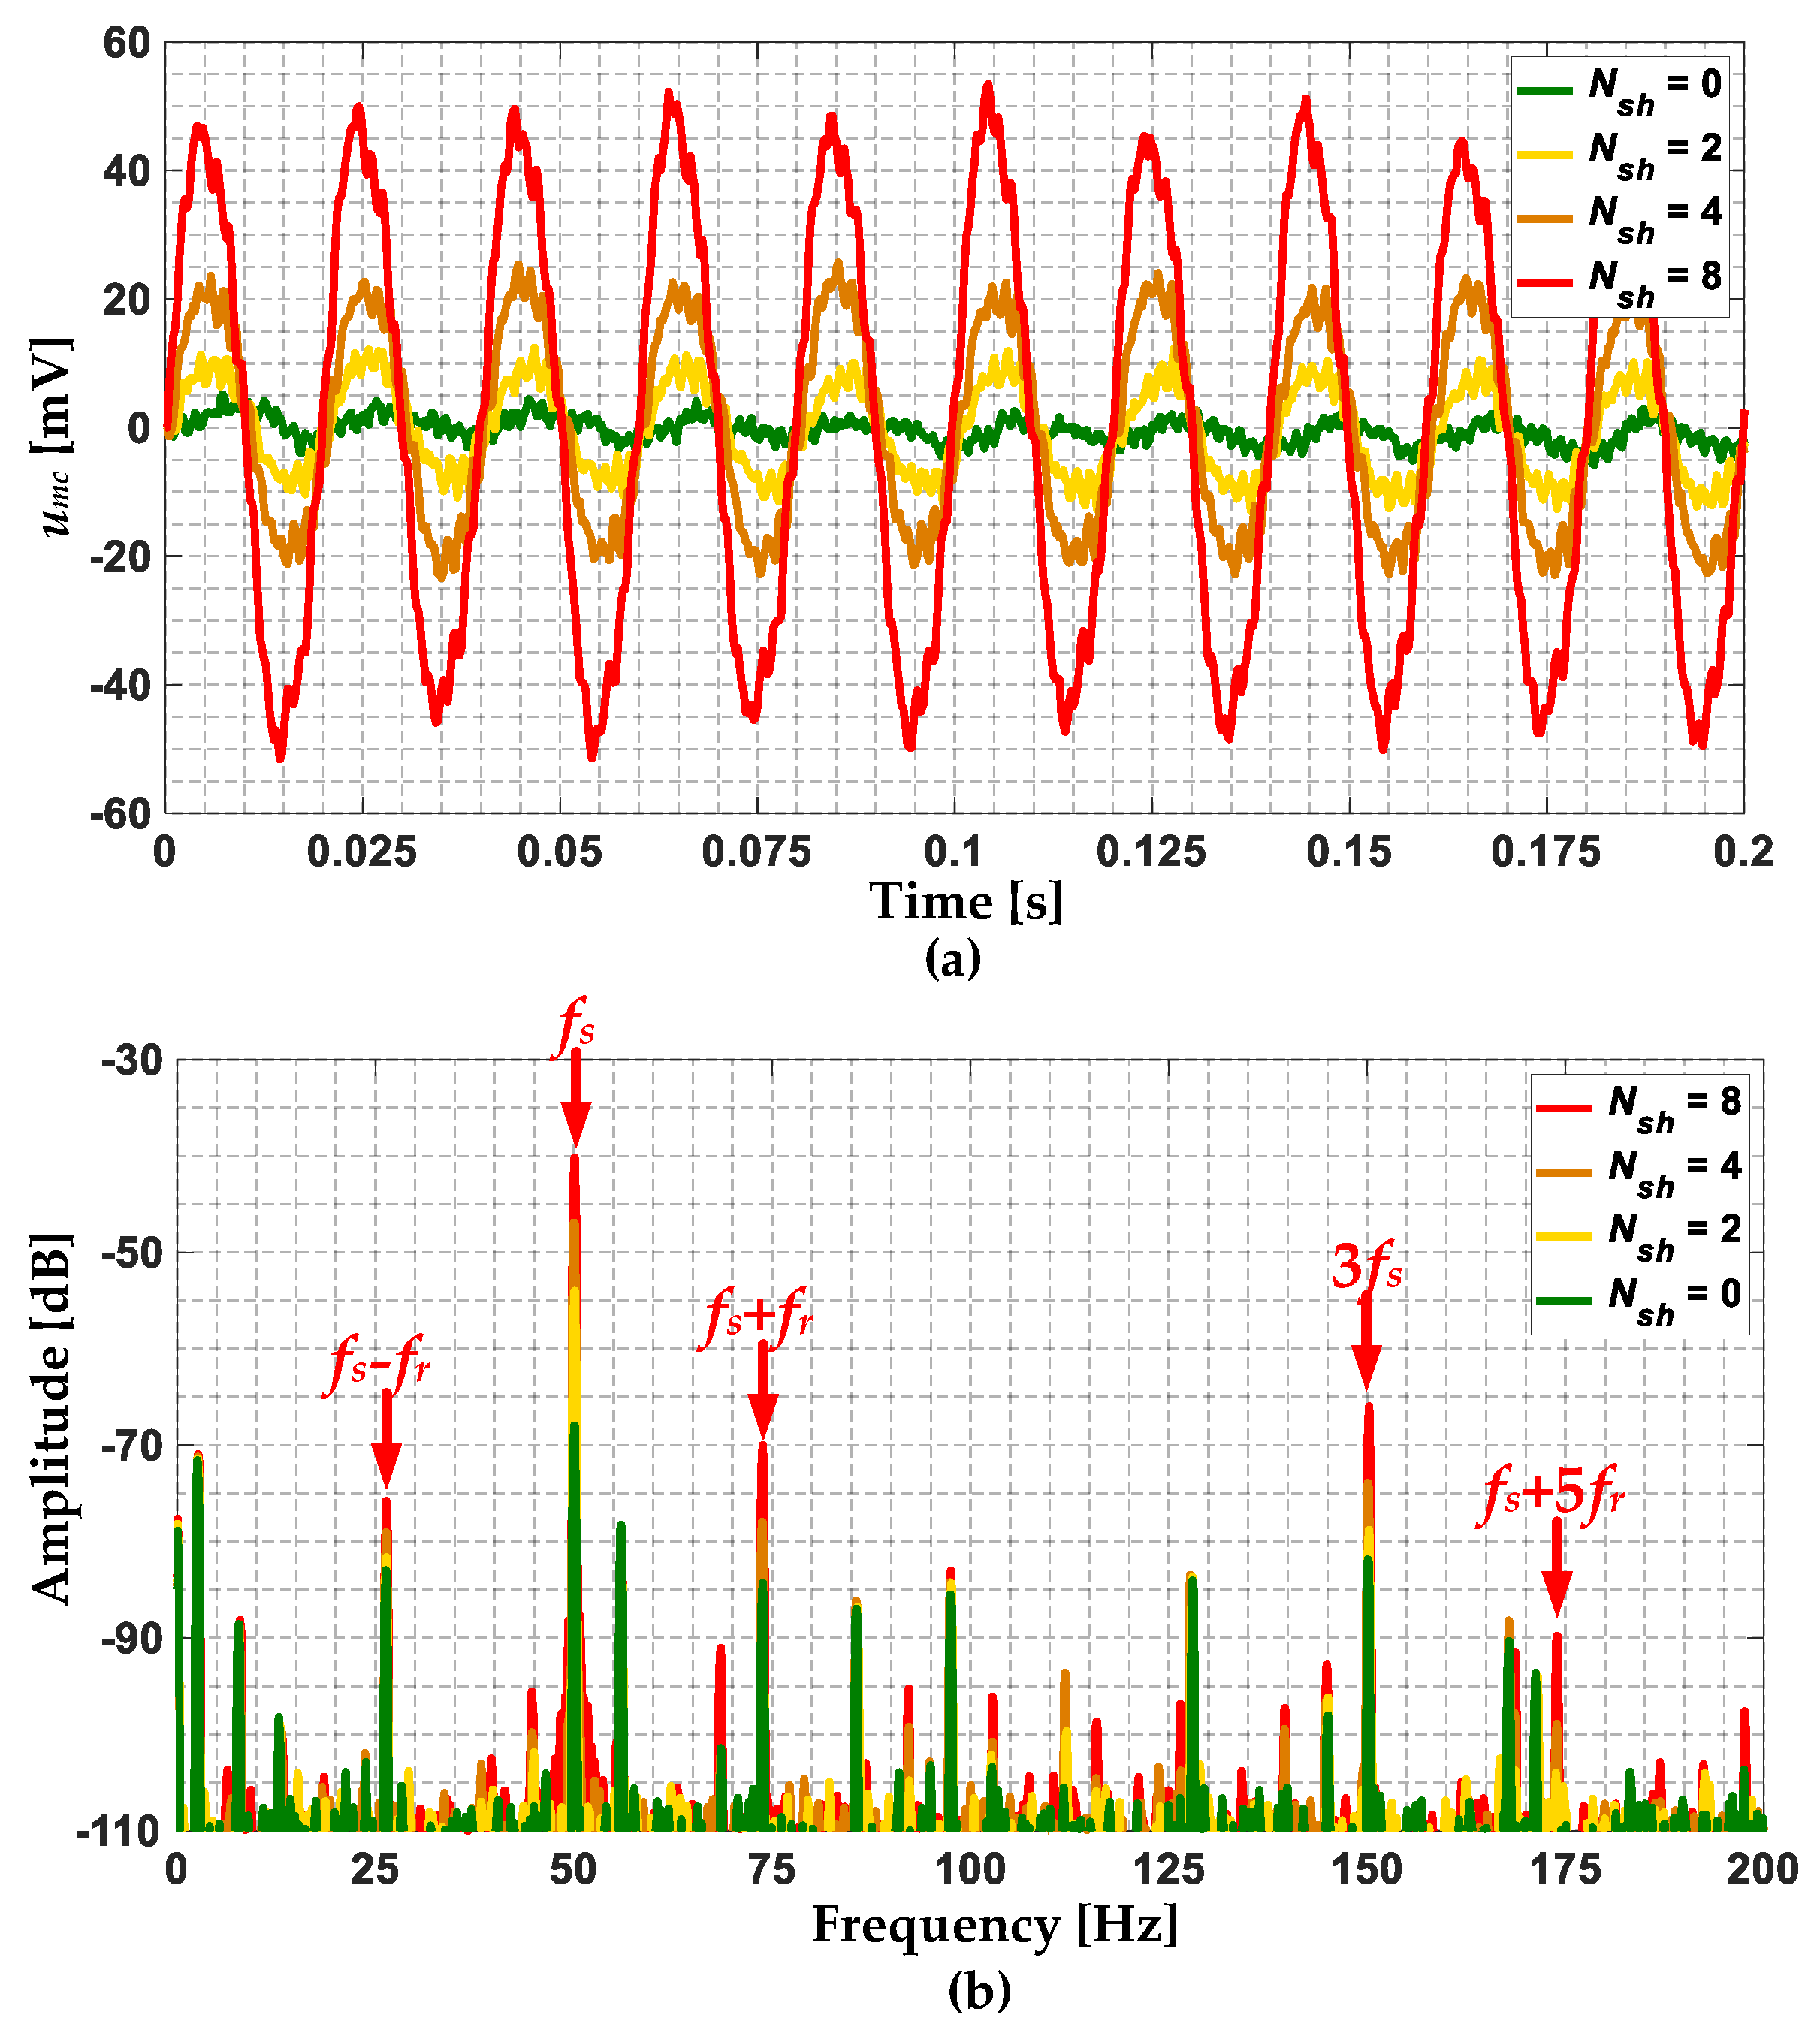
Figure 12.
The effect of Nsh in the IM stator winding and TL level on the increase in the amplitude of the selected frequency components: (a) fs, (b) fs − fr, (c) fs + fr, (d) fs + 5fr and (e) 3fs in the FFT spectrum of the umc.
Figure 12.
The effect of Nsh in the IM stator winding and TL level on the increase in the amplitude of the selected frequency components: (a) fs, (b) fs − fr, (c) fs + fr, (d) fs + 5fr and (e) 3fs in the FFT spectrum of the umc.
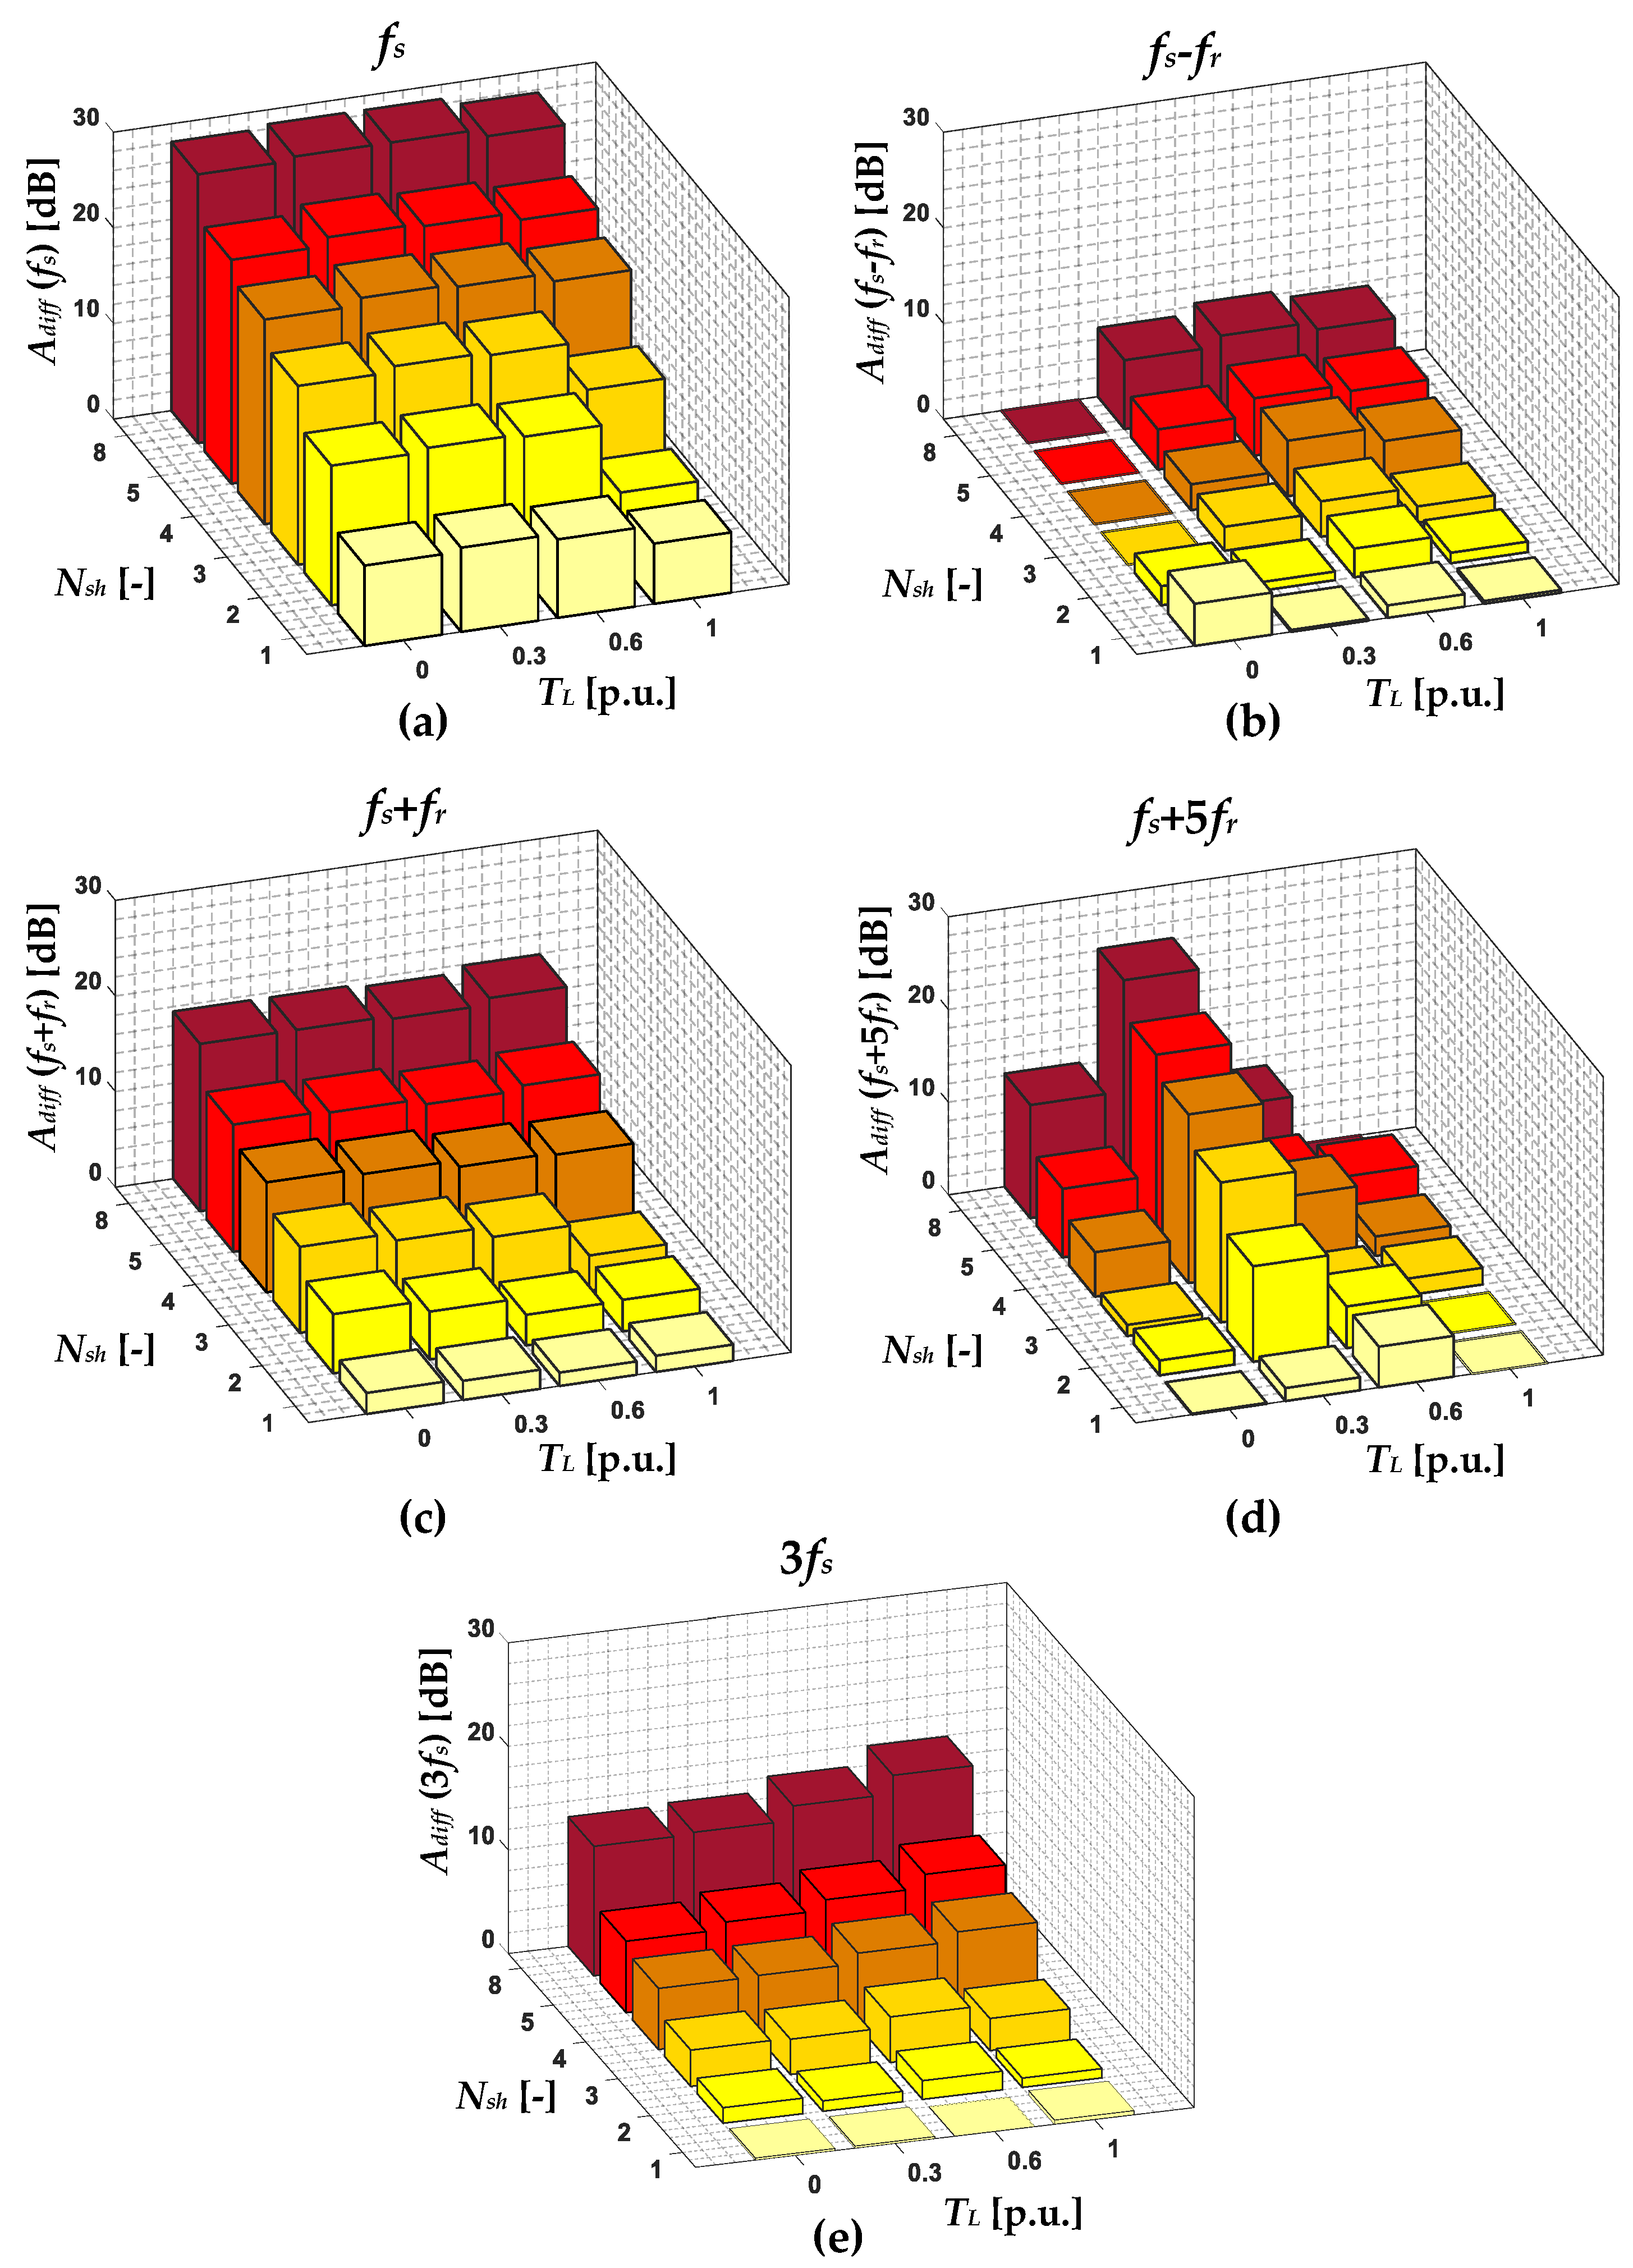
Figure 13.
The waveforms of the voltage induced in the measuring coil by the axial flux for different levels of power supply unbalance.
Figure 13.
The waveforms of the voltage induced in the measuring coil by the axial flux for different levels of power supply unbalance.
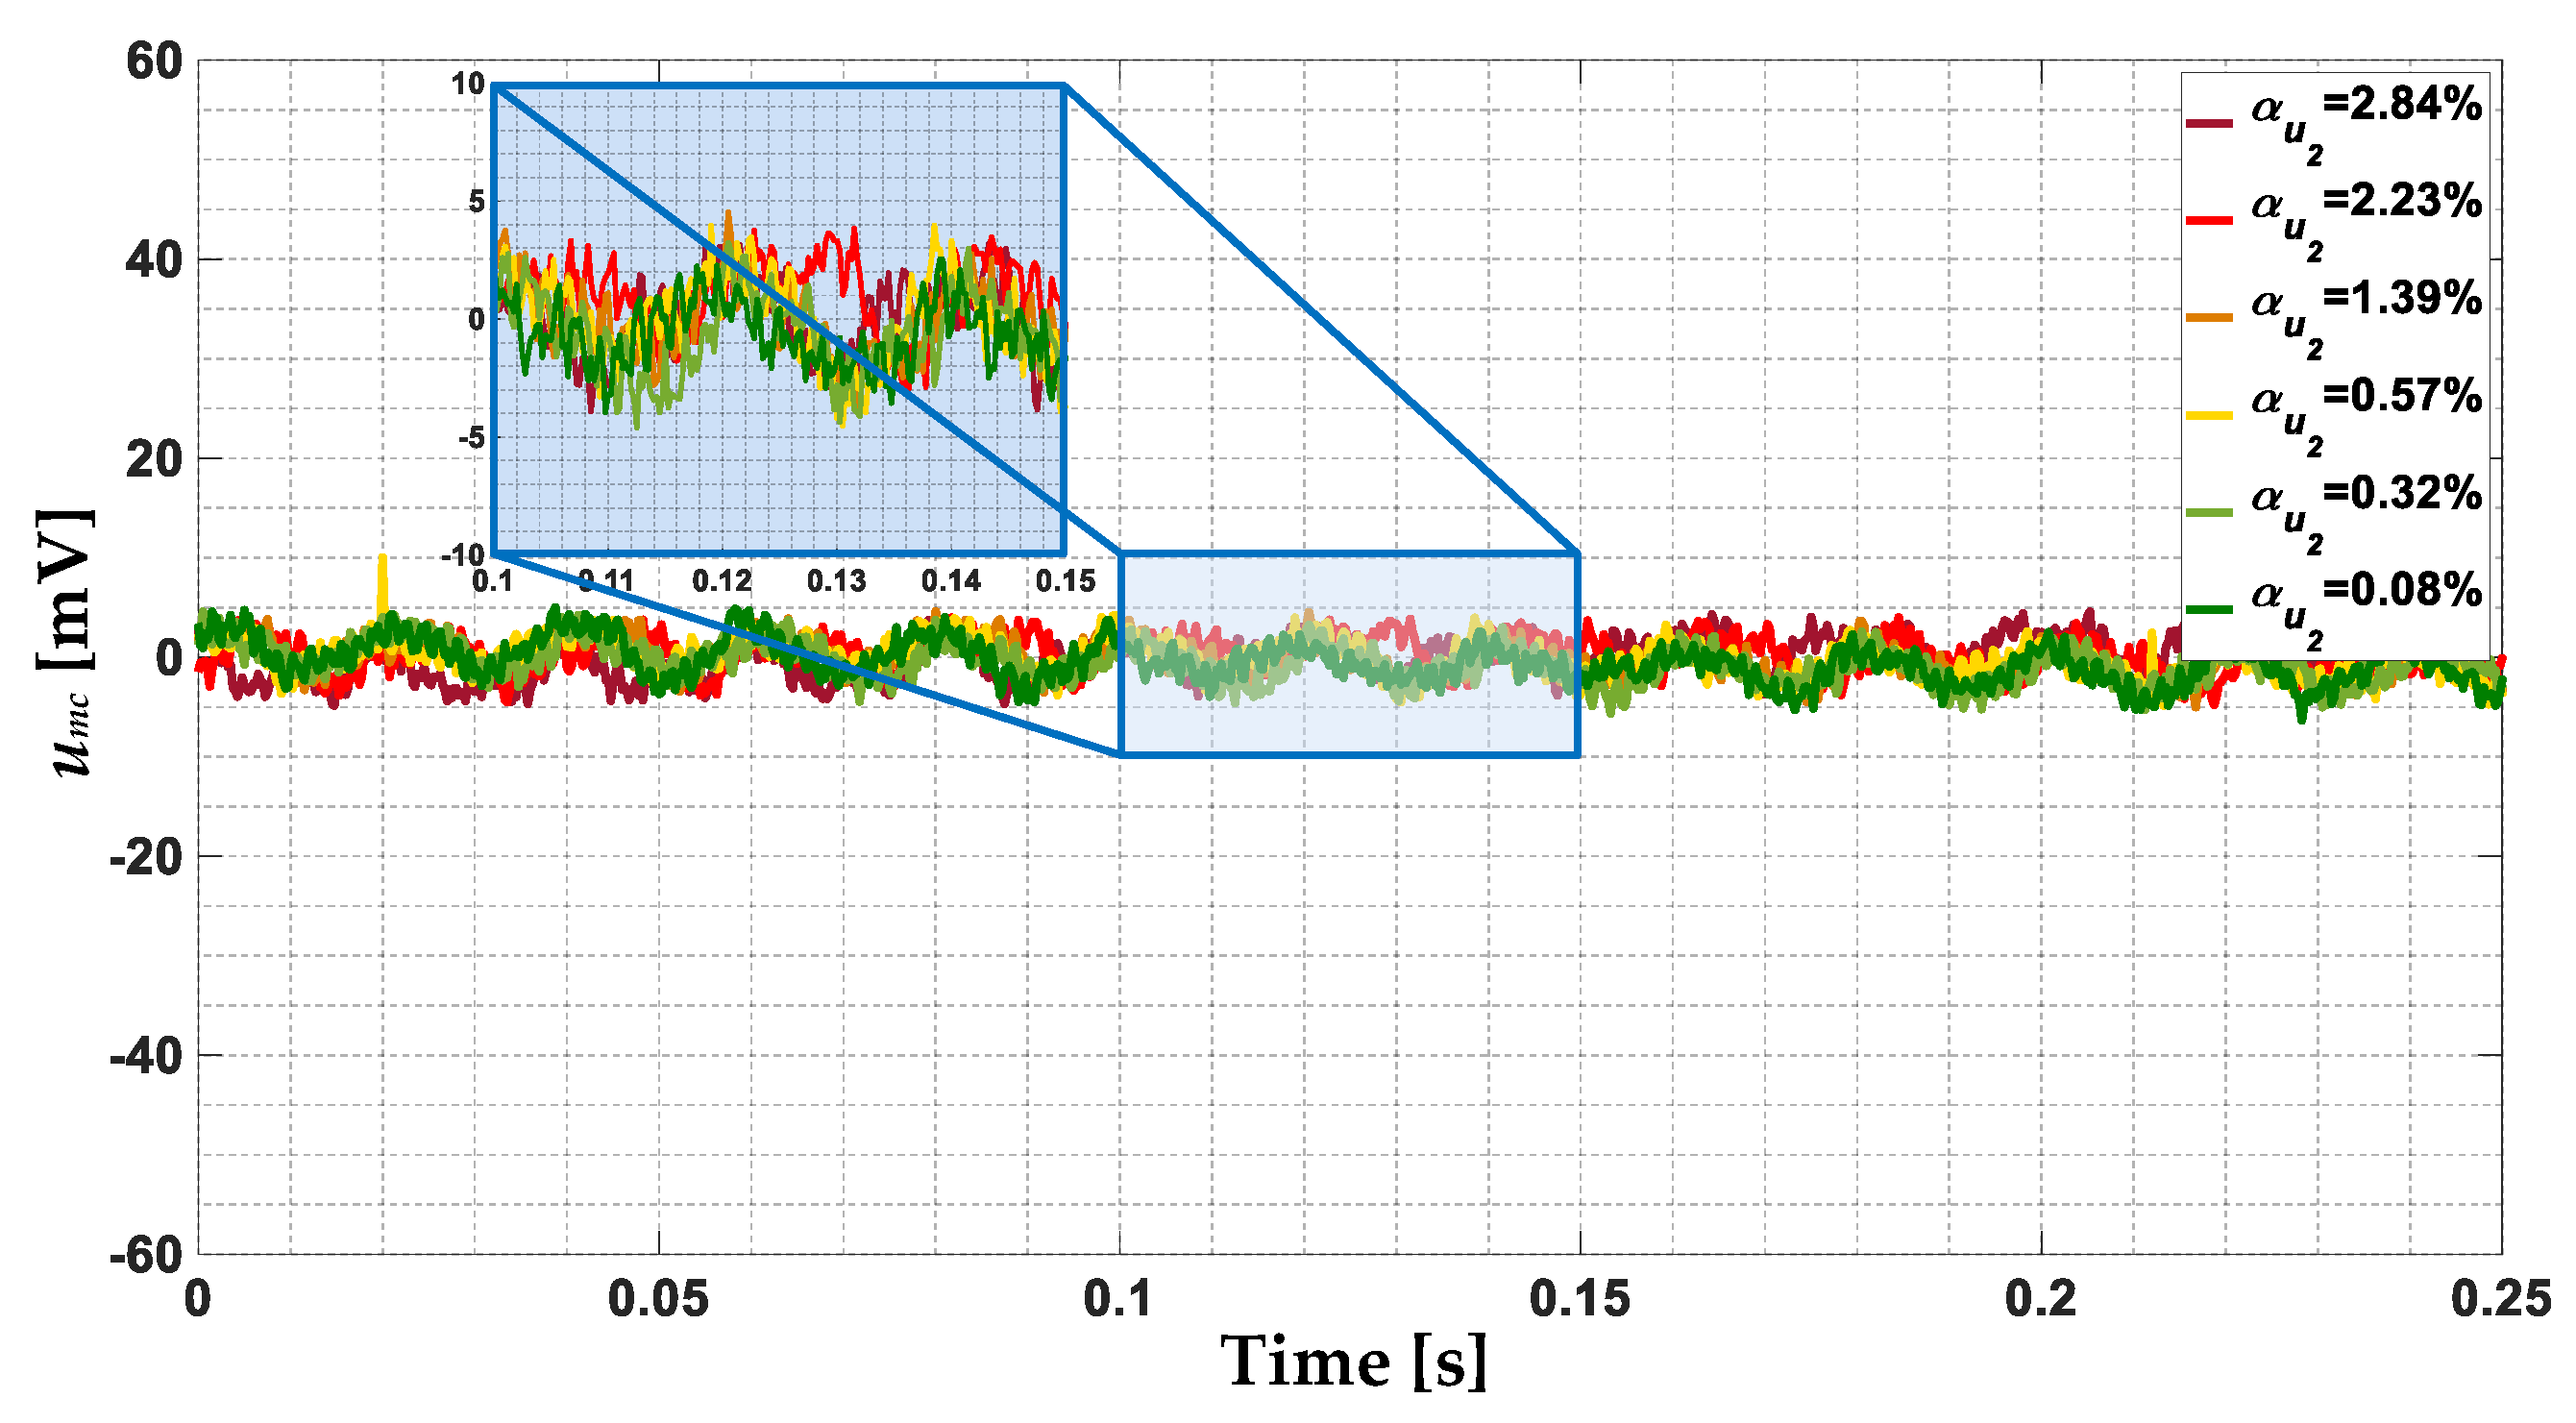
Figure 14.
The FFT spectrum of the umc measured using the NUCLEO-L476RG module, for (a) an unloaded motor, and (b) a motor loaded with rated load torque, and different power supply unbalance levels.
Figure 14.
The FFT spectrum of the umc measured using the NUCLEO-L476RG module, for (a) an unloaded motor, and (b) a motor loaded with rated load torque, and different power supply unbalance levels.
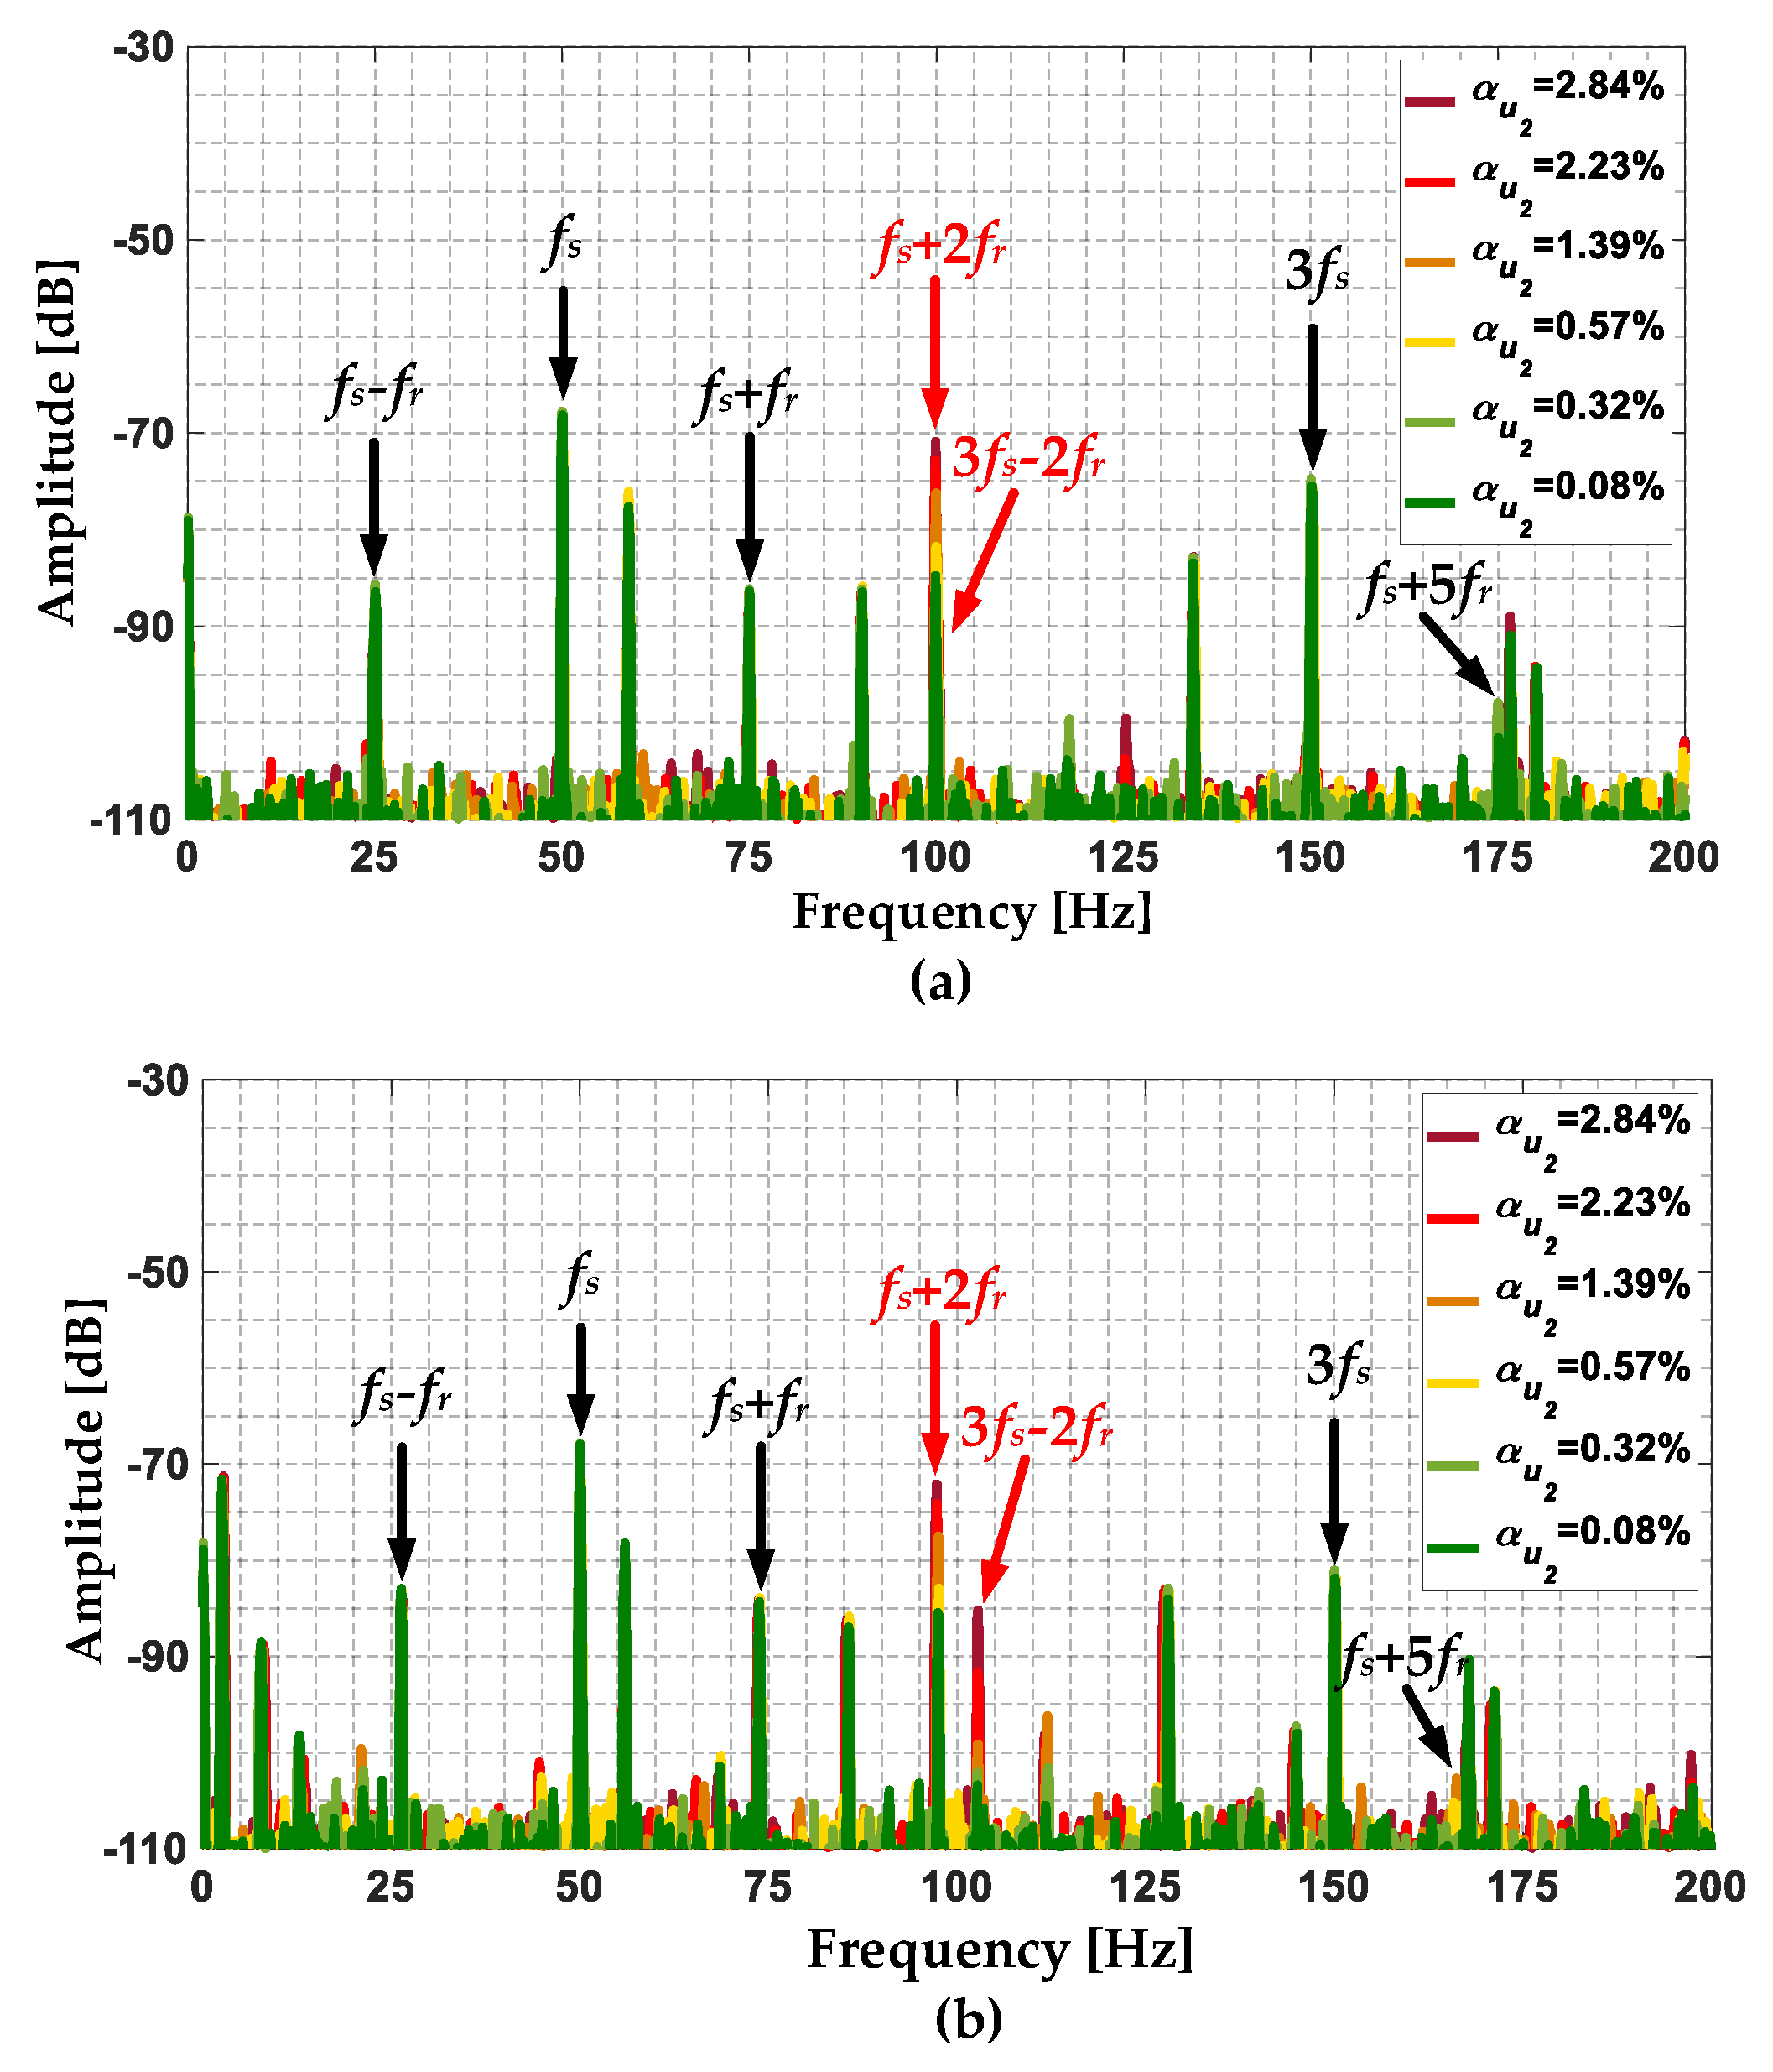
Figure 15.
The effect of unbalanced supply voltage level and TL on the increase in the amplitude of the selected frequency components: (a) fs, (b) fs + fr, (c) fs + 2fr, and (d) 3fs − 2fr in the FFT spectrum of the umc.
Figure 15.
The effect of unbalanced supply voltage level and TL on the increase in the amplitude of the selected frequency components: (a) fs, (b) fs + fr, (c) fs + 2fr, and (d) 3fs − 2fr in the FFT spectrum of the umc.

Figure 16.
The FFT spectra of the umc measured using the NUCLEO-L476RG module for a motor loaded with rated torque, different degrees of stator winding fault, and power supply from voltage source inverter, (a) fs = 50 Hz, (b) fs = 40 Hz, and (c) fs = 30 Hz.
Figure 16.
The FFT spectra of the umc measured using the NUCLEO-L476RG module for a motor loaded with rated torque, different degrees of stator winding fault, and power supply from voltage source inverter, (a) fs = 50 Hz, (b) fs = 40 Hz, and (c) fs = 30 Hz.
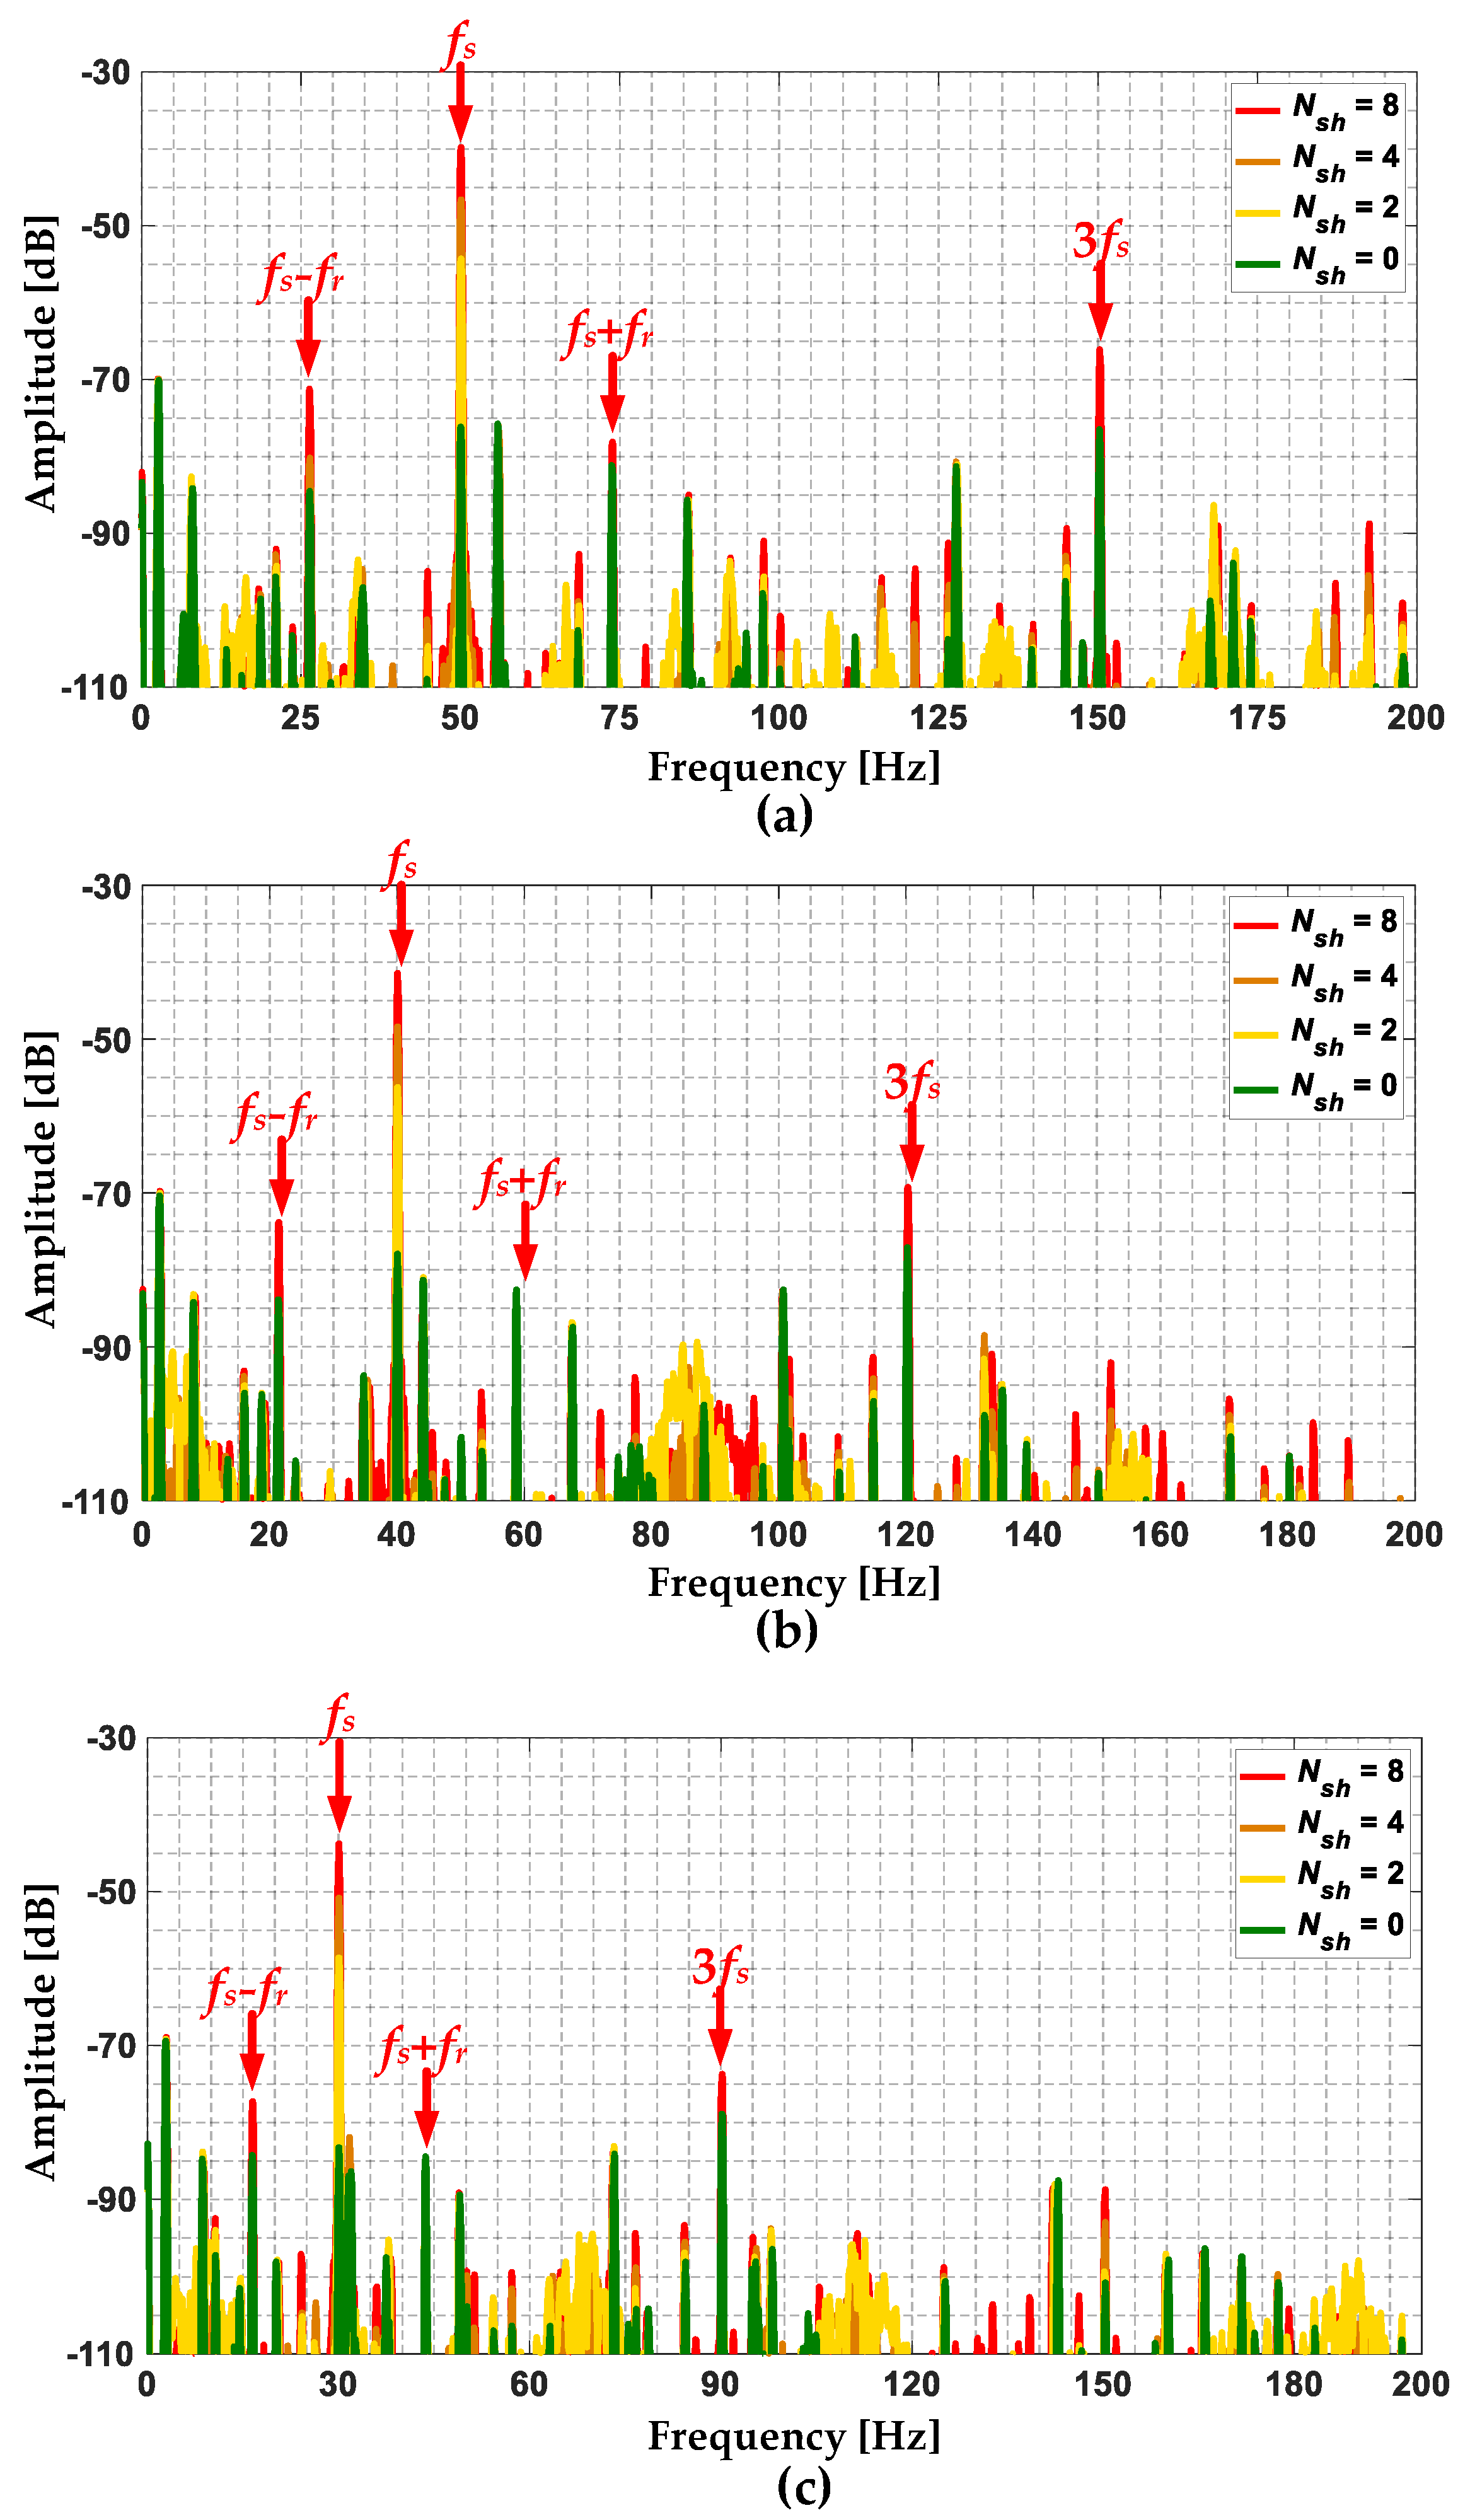
Figure 17.
Simplified block diagram of the flow of diagnostic information including the parts that have already been implemented and future R&D plans.
Figure 17.
Simplified block diagram of the flow of diagnostic information including the parts that have already been implemented and future R&D plans.

Table 1.
Key parameters of the STM32L476RG microcontroller.
| Parameter | Value |
|---|---|
| Core | ARM Cortex-M4 (32-bit) |
| Operating clock frequency | Up to 80 MHz |
| Flash memory | 1 MB |
| SRAM memory | 128 kB |
| DMA | 14-channel |
| Key communication interfaces | USB OTG, 3× I2C, 5× USART, 3× SPI, CAN |
| ADC | 3 × 12-bit |
| DAC | 2 × 12-bit |
| Comparators | 2× ultra-low power |
Table 2.
Rated parameters of the tested IM.
| Name of the Parameter | Symbol | Units | |
|---|---|---|---|
| Power | PN | 1500 | [W] |
| Torque | TN | 10.16 | [Nm] |
| Speed | nN | 1410 | [rpm] |
| Stator phase voltage | UsN | 230 | V |
| Stator current | IsN | 3.5 | [A] |
| Frequency | fsN | 50 | [Hz] |
| Pole pairs number | pp | 2 | [-] |
| Number of stator turns | Nst | 312 | [-] |
Table 3.
Analyzed levels of the supply voltage unbalance.
| The RMS Value of the Supply Voltage of the Phase C | Supply Voltage Unbalance Coefficient αu2 |
|---|---|
| 230 V | 0.08% |
| 228 V | 0.32% |
| 225 V | 0.57% |
| 220 V | 1.39% |
| 215 V | 2.23% |
| 210 V | 2.84% |
Disclaimer/Publisher’s Note: The statements, opinions and data contained in all publications are solely those of the individual author(s) and contributor(s) and not of MDPI and/or the editor(s). MDPI and/or the editor(s) disclaim responsibility for any injury to people or property resulting from any ideas, methods, instructions or products referred to in the content. |
© 2024 by the authors. Licensee MDPI, Basel, Switzerland. This article is an open access article distributed under the terms and conditions of the Creative Commons Attribution (CC BY) license (https://creativecommons.org/licenses/by/4.0/).
Share and Cite
MDPI and ACS Style
Pietrzak, P.; Pietrzak, P.; Wolkiewicz, M. Microcontroller-Based Embedded System for the Diagnosis of Stator Winding Faults and Unbalanced Supply Voltage of the Induction Motors. Energies 2024, 17, 387. https://doi.org/10.3390/en17020387
AMA Style
Pietrzak P, Pietrzak P, Wolkiewicz M. Microcontroller-Based Embedded System for the Diagnosis of Stator Winding Faults and Unbalanced Supply Voltage of the Induction Motors. Energies. 2024; 17(2):387. https://doi.org/10.3390/en17020387
Chicago/Turabian StylePietrzak, Przemyslaw, Piotr Pietrzak, and Marcin Wolkiewicz. 2024. "Microcontroller-Based Embedded System for the Diagnosis of Stator Winding Faults and Unbalanced Supply Voltage of the Induction Motors" Energies 17, no. 2: 387. https://doi.org/10.3390/en17020387
Note that from the first issue of 2016, this journal uses article numbers instead of page numbers. See further details here.