

Towards a Bioeconomy: Supplying Forest Residues for the Australian Market

1
Forest Research Institute, University of the Sunshine Coast, Sippy Downs 4556, Australia
2
Decarbonisation and Sustainability of Energy Sources Unit, DG Energy, European Commission, 1000 Brussels, Belgium
*
Author to whom correspondence should be addressed.
†
The information and views set out in this article are those of the author and do not necessarily reflect the official opinion of the Institution.
Energies 2024, 17(2), 397; https://doi.org/10.3390/en17020397
Submission received: 12 December 2023
/
Revised: 28 December 2023
/
Accepted: 8 January 2024
/
Published: 12 January 2024
(This article belongs to the Special Issue Bioenergy and Waste-to-Energy Technologies to Reach Climate Neutrality)
Abstract
:Australia has abundant volumes of forest residues that are a potential feedstock for supplying biomass as a renewable carbon carrier to the market. However, there remains an underutilization of this resource, even in mature bioeconomy markets. Several existing or perceived barriers can be attributed to the underdeveloped, forest-based bioeconomy in Australia. One of these is the limited understanding of feedstock supply costs. In this study, two ranking approaches were applied to identify the optimal biomass feedstock supply chain from field to conversion plant gate. A panel of experts embedded in the Australian bioeconomy were employed to first assign ranks to biomass supply chain items by cost intensity. Then, a layer of analytic hierarchical process (AHP) was used to weigh and rank various biomass supply pathways by efficiency. The results reveal that biomass extraction ranks the highest and biomass feedstock storage ranks the lowest, relative to other supply chain costs. Extracting and chipping material in the field attracted the most support from the experts in terms of efficiency, followed by transporting and chipping at the roadside and, finally, transporting and chipping at the conversion plant. This study provides insights for designers of the forest-based bioeconomy in Australia into relative cost drivers that may be applied to investment and industry decisions. It also provides a framework to support further investigations into forest biomass development and the management of biomass as a renewable carbon carrier at a time when Australia is transitioning from an energy policy focused on fossil fuels to a renewable energy strategy.
1. Introduction
Australia, a country rich in fossil fuel resources and a net energy exporter [1], has based its national energy policy as well as the overall economy on these sources [2]. In 2020–2021, fossil fuels accounted for 92% of Australia’s total energy consumption and 73% of its electricity generation [1]. Fossil fuels are also high export earners, generating AUD 81 billion in 2020–2021 [3], mostly from black coal, liquid natural gas (LNG), and crude oil, with 90%, 73%, and 83% of production exported, respectively [1]. Fossil fuels, however, emit carbon dioxide and other greenhouse gases into the atmosphere when burned and are the leading cause of human-induced climate change [4]. In recent years, national and state Australian governments have recognized the risks of climate change inaction and the opportunities for investing in renewable energy [2]. After decades of climate and emissions policy uncertainty [5] and politicized debate at the national level [6,7], the current Federal Australian Government legislated an emissions reduction target of 43% below 2005 levels by 2030 in 2022 [8]. State governments have set their own emission reduction targets and made commitments to renewable energy, including 50% renewable energy targets by 2030 in Queensland [9] and Victoria [10] and 150% renewable electricity generation by 2030 in Tasmania [11].
Biomass is a renewable carbon source [12,13] that could replace fossil fuel-based carbon throughout the economy in the production of food, fibre, chemicals, and fuels while creating carbon storage in materials and soils [14,15]. For fossil fuel-dependent economies, biomass presents a local opportunity to sustainably contribute to global and national climate-related targets [16,17] and transition to a decarbonized, more sustainable bioeconomy [18]. While innovative bio-based solutions are emerging [13,19], biomass use for energy presents a mature market segment of bioeconomy. Reducing traditional, inefficient uses of biomass for energy (e.g., fuelwood in open fireplaces or inefficient wood stoves) by encouraging energy-efficient technologies that deliver solid, gaseous, and liquid biofuels remains the main challenge in the bioenergy segment [20,21] as traditional biomass makes up 44% of total biomass use globally [22]. Demand and supply for modern bioenergy are expected to grow over the coming decades [17,22]. The Intergovernmental Panel on Climate Change (IPCC) Special Report estimates that bioenergy as a share of the global energy supply will increase to a more than 27% share by 2050 in the greenhouse gas (GHG) emission mitigation pathways compatible with limiting global warming to 1.5 °C [23]. In the European Union (EU), where bioenergy is a key component of energy transition and GHG emissions mitigation strategies, demand for forest biomass feedstock is expected to outstrip its supply capacity [17,24] under current biomass supply losses and energy conversion efficiencies. While bioenergy currently provides about 4% of Australia’s total energy consumption, modelling in the recently released ‘Australia’s Bioenergy Roadmap’ by the Australian Renewable Energy Agency [25] suggests it could potentially rise to 20% by the 2050s [25]. As a share of renewable energy, solid biomass is a major contributor in Australia, making up 37% in 2020–2021, with woody biomass accounting for about half of this biomass, or 18% of total final energy consumption from renewables [1].
Forest-based or woody biomass is a versatile renewable energy fuel that could be used in numerous energy conversion pathways [18,26], but it remains a primary source of renewable heat. For instance, in Canada, a dominant renewable electricity source is hydropower, whereas biomass is used for thermal energy purposes, accounting for 11.8% of overall fuel and heat consumption in 2019 [27]. In the EU, total primary solid biofuels are the first source of gross renewable energy that counts towards the EU’s binding target for its share of renewable energy, just ahead of wind and hydropower [28]. The bioeconomy is defined by the European Commission as meaning ‘using renewable biological sources from land and sea, like crops, forests, fish, animals and micro-organisms to produce food, materials and energy’ [29]. Forests play a central role in the transition to a sustainable bioeconomy, in the fight against climate change, and as an alternative to fossil fuels through bioenergy production [30,31]. As well as displacing fossil fuels, forest bioenergy provides other co-benefits including waste management [32,33,34], additional revenue streams [32,34], employment opportunities [35], sustainable innovation [36], and regional and rural development [30,31]. Forest-based bioenergy can be generated from all fractions of the tree, although, in developed markets, feedstock is generally restricted by market forces to unmerchantable materials such as thinned trees, low-grade or non-conforming sawlogs, and forest-based harvest (e.g., large branches) and mill residues [34,37]. The sustainable sourcing of forest biomass, both for materials and for energy, is important for maintaining the long-term sustainability of the source and avoiding negative effects on the environment, such as soil impacts [37,38,39,40,41,42].
There is an established forestry industry in Australia, with almost 1.7 million hectares of commercial plantations [43,44] generating large volumes of residues each year. Forest residues are inconsistently captured and reported across the industry; however, it is estimated that there are 6.5 million green tonnes of residues available annually, about half of which come from softwood plantations [45]. While these residues have several existing or potential pathways, including woodchips for export, pulp, and wood-based panels, they are also potential sources of bioenergy feedstock, with greenhouse gas mitigation benefits [34,45,46]. Mill residues are another feedstock source for bioenergy, with an estimated annual production of 4 million tonnes in Australia [45], some of which is already being utilized for bioenergy [34].
Understanding costs in the supply chain is critical to the planning and development of a sustainable, forest-based bioenergy market [47] and its context. The forest residue supply chain has several steps that can broadly be categorized as collecting, chipping, transporting, and storing. In the EU, logistics and associated costs have been investigated over many years, particularly following the development of the Tool for Sustainability Impact Assessment (ToSIA) [48]. In a review, Santos et al. [49] found that most assessment and optimization studies were concentrated in Europe and North America and were focused on biomass-to-bioenergy supply chains. There has been a call for research beyond the Northern Hemisphere [49]. Developing markets, such as Australia, are likely to become important in the international trade of forest products. The current study, therefore, adds to the existing literature on forest biomass supply chain sustainability.
Australia’s forest bioeconomy is emerging, but costs along the supply chain are not well-known, similar to the situation in Italy a decade ago [50]. Estimating forest biomass supply costs can be challenging due to variables including scale and location of plantations, residue type and quality, quantities, competition from alternative uses [47,51], and fluctuations in fuel costs [52] and, therefore, assumptions are made about these costs. This study provides a preliminary assessment of the most efficient pathways for supplying forest residues for bioenergy as Australia looks to increase the share of renewables in its energy mix.
This research builds on past Australian studies that investigated the sustainability benefits of forest residues for bioenergy, including greenhouse gas mitigation [46] and economic benefits through reduced site preparation costs [33]. Other studies in Australia have quantified the availability of forest biomass feedstocks for energy [53,54,55] and identified tactical or optimal locations of bioenergy conversion plants, considering factors like forest biomass availability and transportation distance [56,57], and multi-biomass feedstocks [58,59]. While the availability, demand, and opportunities for forest biomass feedstocks are well researched, there remain uncertainties associated with the economic feasibility and optimization of supply [51]. Luo et al. [60] compared forest supply chain planning methods and found that forest management vertically integrated with downstream wood processors could increase the economic returns for forest companies. The current study will extend the knowledge presented by Luo et al. [60] and other supply chain optimization studies that have focused on transport [61], machine systems [62], and a multi-feedstock case study in southern Australia [63].
The current study focuses on efficiencies in the forest biomass supply chain to better understand the cost drivers and potential barriers to the development of forest-based bioenergy in Australia. In identifying drivers of, and barriers to, the procurement of forest biomass for energy, it addresses an important knowledge gap, critical to the conversation about energy transition and the development of a sustainable, forest-based bioeconomy in Australia. It will contribute knowledge of strategies for implementing forest biomass supply chains. Further, the approach adopted here can serve as a framework for future studies investigating renewable energy pathways and potential barriers in other parts of the world with underdeveloped markets.
This study used weighted pairwise comparisons, a layer of the analytical hierarchical process (AHP) methodology, to evaluate alternatives for efficiently supplying woody biomass to the industry in Australia, based on the aggregated expert judgement [64]. The processes in the supply chain to which costs can be attributed are well-known in the literature and industry and were pre-selected in this study. Local (Australian) forest biomass experts were also asked to rank the costs of different processes (e.g., extracting, handling, processing, transporting, and storing) in the supply of forest biomass.
AHP is a robust, multi-criteria decision analysis (MCDA) technique [65,66] used in complex problem solving, with multiple conflicting criteria and decision makers with different preferences [67]. It surpasses the shortcomings of ranking alternatives by ordinal voting procedures and is a predecessor to a more detailed and sophisticated multi-attribute utility theory [64]. The application of AHP has been rather broad, including ranking, evaluation, allocation, cost-benefit analysis, forecasting, and strategic decision settings [64,67,68]. It is among the most widely used MCDA techniques in general [64,69,70,71,72,73] as well as for natural resource and energy management problems [73,74,75] and in energy transition studies investigating barriers to development, such as biorefinery transition in the European pulp and paper industry [76], renewable energy adoption in Pakistan [77], barriers to hydrogen fuel cell energy production in South Korea [78], and forest biomass for heating in Quebec [79]. Other studies have used AHP, often combined with other analytic techniques, to assess investment or policy decisions on alternative energies in Saudi Arabia [80] and renewable energy in transport policies in Europe [81,82]. It has also been used to investigate innovations in forest operations [83].
This paper begins with a description of the research framework including the design of the questionnaire to collect individual expert judgements, define and select the ‘expert’ participants, and select the forest biomass supply chain alternatives to the ranked. Then, ranking and weighted pairwise comparisons, as a layer of the AHP technique, were used to quantify weights and ranks and pathway efficiencies. The results, discussion, and conclusion of the study are then presented.
2. Materials and Methods
The research was conducted according to the following interconnected stages:
- Designing and developing an expert panel and questionnaire to collect and aggregate individual judgements. An online platform, Alchemer [84], was used.
- Ranking of costs of processes in the biomass-for-energy supply chain to identify the overall cost drivers. A Likert scale of 1 to 5 (most to least important) was employed to rank costs.
- Undertaking an AHP layer to identify the most efficient biomass supply pathway. Pairwise comparisons were employed to assign weights to factors and then rank these according to importance, measuring the distances between ranks. Factors to be ranked were chosen based on the authors’ perceptions of key factors (see Figure 1).
2.1. Data Collection
The data were collected through an online questionnaire completed by a panel of experts. The expert panel consisted of selected experts, with sufficient subject matter knowledge to aggregate their individual judgements into a strategic decision setting related to a renewable carbon supply—in the form of forest residues—for the emerging Australian market. The group of experts had the same goal of finding value for forest residues, each having specific knowledge, interest, or a role in the long-term supply and demand of forest biomass in Australia, allowing for a synergistic, aggregated, individual judgement procedure in the pairwise comparisons [64]. The literature suggests that the context of research defines the number of participants in an AHP. The general consensus is that AHP aims more towards quality than the number of participants [64,68], suggesting that 2–5 panellists are a small group and above 5 panellists are a large group [64]. Here, to ensure 2–5 consistent answers and respecting social choice axioms for group decision making [64,66,85], a group of ten experts was invited. The panellists were asked to rank processes in the supply chain according to their cost significance, as well as to rank what would be the most cost-efficient way of supplying low-value wood to the market. ‘Renewable carbon carrier’ syntax was purposely omitted, given the limited knowledge of the broader bioeconomy context in the Australian market. Instead, the end use of the wood was kept as not predetermined for supply to be at a level playing field for the bioeconomy market, including bioenergy, which is not subsidized in Australia. Two different approaches for ranking were applied: weighted ranking for supply chain processes and weighted pairwise comparison for biomass supplying options.
2.2. Ranking Cost Drivers
Biomass supply processes (extracting, handling, processing, transporting, storing) represent a chain of consecutive operations from the place of biomass origin to the storage facility at the market gate; this required a ranking method to focus on cost reductions along the supply chain (Figure 2). The experts were asked to rank these five processes according to overall cost significance on a 5-point Likert scale, with 1 being the highest cost and 5 being the lowest cost. Figure 2 defines these processes, which were also applied to the pairwise comparisons described in Section 2.3 below.
Overall ranks and rank distributions were generated using MS Excel and the Alchemer [84] platform. A weighted average was calculated:
where score is the product of the frequency by the weight of each ranking:
and n is the number of experts on the panel.
= (freq. R1 × 1) + (freq. R2 × 2) + (freq. R3 × 3) + (freq. R4 × 4) + (freq. R5 × 5)
The processes were then ranked according to the calculated weighted average values, with the lowest value bearing the highest costs.
2.3. Weighted Pairwise Comparisons
Here, the experts were challenged with conflicting alternatives of supplying biomass to the market where the most efficient one would overcome those less efficient. The alternatives were deliberately not built around cost items but around overall efficiency by framing the question, ‘If you were a biomass supplier, which would be the most efficient way to supply woody biomass to the industry?’ Efficiency would assume cost efficiency but embedded with other factors too such as logistics, speed of delivery, procurement length, tendering costs, risk factors, etc. (Table 1). Consistent with practices in Australia, ‘extracting’ was synonymous with collecting and handling, ‘chipping’ was synonymous with processing, ‘extracting and transporting to roadside’ was synonymous with tractor, and ‘transporting to conversion facility gate’ was synonymous with truck transportation.
The selected method for ranking was weighted pairwise comparison, as a layer of AHP, where a set of criteria were the relative costs of processes involved in harnessing forest residue material and the goal, or problem to be solved, was the ranking of the most cost-efficient pathway for getting forest residues to a bioenergy (bioeconomy) plant gate. The alternatives were the factors embedded in the biomass supply pathway. AHP [86] has been praised for its transparency and simplicity, based on the weighted ranking of conflicting alternatives organized in a hierarchy [70,74]. The applied weighted pairwise comparison uses only one layer of hierarchy by obtaining the weights for each criterion in accordance with Saaty’s scale of importance and obtaining an overall score for each alternative to eliminate illogical, thus inconsistent, comparisons.
In the first step, respondents made comparisons in a two-stage process in the online questionnaire. First, the experts paired one biomass supply pathway against the other according to their relative efficiency. Second, the respondents evaluated the relative efficiency of their chosen option against the alternative on a five-point sliding bar with the following numerical quantities supported by linguistic descriptions: in the middle of the bar (value ‘1’ or ‘equally efficient’), at both ends of the bar (value ‘5’ or ‘far more efficient’), and between 1 and 5 (value ‘3’ or ‘moderately more efficient’). As has been adopted in previous studies [68], an adaptation to Saaty’s original scale (1–9) was made here by keeping the odd values only (Table 2), and the results were normalized to the original scale. This approach has been found to be easier for panellist responders to interpret [68,81,87]. Following the expert weighted pairwise comparison, the weights for each criterion were adjusted in accordance with Saaty’s scale of importance (Table 2) in the second step of the data analysis. Overall scores for each alternative, under consistency ratios (CR) of 20%, 30%, and 40%, were obtained following the original CR suggested by Saaty [65], but also the less stringent consistency criteria as used in Ho et al. [88], Mahmoud and Hine [89], and Kulišić et al. [81], and as reported by Schmidt [68].
A judgmental matrix, the pairwise comparison matrix (A), was constructed, in which the elements aij inside the matrix could be interpreted as the degree of the precedence of the ith criterion over the jth criterion, or one supply chain pathway over the other.
When constructing the pairwise comparison matrix, the following rules needed to be verified:
If aij = ∝, then aij = 1 × ∝−1. If criteria i is judged to be of equally relative importance as criteria j, then aij = aij = 1 and aij = 1 for all i. If all the comparisons are perfectly consistent, then the relation aik = aij = aik ∀ i,j,k.
To recover the vector w = [w1, w2, …, wn] from A, which indicates the weight that each criterion is given in the pairwise comparison matrix, the following two-step procedure was used:
- For each of the A’s columns, divide each entry in column i of A by the sum of the entries in column i. This yields a new matrix, called Anorm (for normalized), in which the sum of the entries in each column is 1.
- Estimate Wi as the average of the entries in row i of Anorm.
To ensure that the priority of decision criteria was consistent, a consistency ratio (CR) for each matrix was verified with the ratio of consistency index (CI) and random index (RI):
CR = CI/RI
CI was obtained through the largest eigenvector of the matrix A or λmax:
where λmax is calculated as
and w stands for the eigenvector of the matrix A, computed using the following equation:
where n is the number of criteria being compared in this matrix. The largest eigenvalue λmax of A can be estimated by
CI = (λmax − n)/(n − 1)
Aw = λmax∙w
Random index (RI) represents the average consistency index of a randomly generated pairwise comparison matrix of a similar size (Table 3).
Classical AHP allows for inconsistencies in giving the priorities of the pairwise comparisons up to the point where the decision maker’s comparisons are consistent enough to give useful estimates of the weights for their objective. For a perfectly consistent decision maker, the ith entry of AWT = n (ith entry of WT). This implies that the perfectly consistent decision maker has CR = 0. While Saaty and Vargas [66] set CR < 10% as a threshold for inconsistency in answers, Ho et al. [88] and Mahmoud and Hine [89] applied CR < 20% to AHP surveys that cover a wider population allowing for non-expert responses.
3. Results
3.1. Expert Profile
The 10 experts were distributed across a range of geographical regions (states), roles, and fields of expertise (Appendix A Figure A1). The expert panel was 40% from academia, with the remainder in non-academic roles and equally distributed between industry (30%) and government or government-backed enterprises (30%). The panel worked across four Australian states: Queensland, Tasmania, New South Wales, and Western Australia. Victoria was the only state or territory with an established forestry industry not represented by the expert panel. The selected experts self-identified as having a high level of expertise, with 50% working more than fifteen years in their field and 80% for seven years or more.
The panel also displayed expertise in multiple fields (experts could select across multiple fields) involved in the Australian bioeconomy ecosystem (Appendix A Figure A2), further enhancing the multi-disciplinary approach of this study. Within these fields, the experts identified as being able to contribute knowledge on the mobilization of forest biomass for energy, the logistics of forest biomass for energy, bioenergy sustainability, biomass conversion technologies and products (e.g., biogas, combined heat and power, liquid biofuels), carbon balances of biomass and bioenergy, and governance and policy frameworks.
3.2. Results of the Process Cost Rankings
The weighted average values of the supply chain processes had a distance of 2.0 and ranged from 2.0 (minimum) to 4.0 (maximum). Extraction had the highest cost ranking and was estimated to be twice as high as the lowest-cost supply chain item: storing (Figure 3).
3.3. Results of the Weighted Pairwise Comparisons
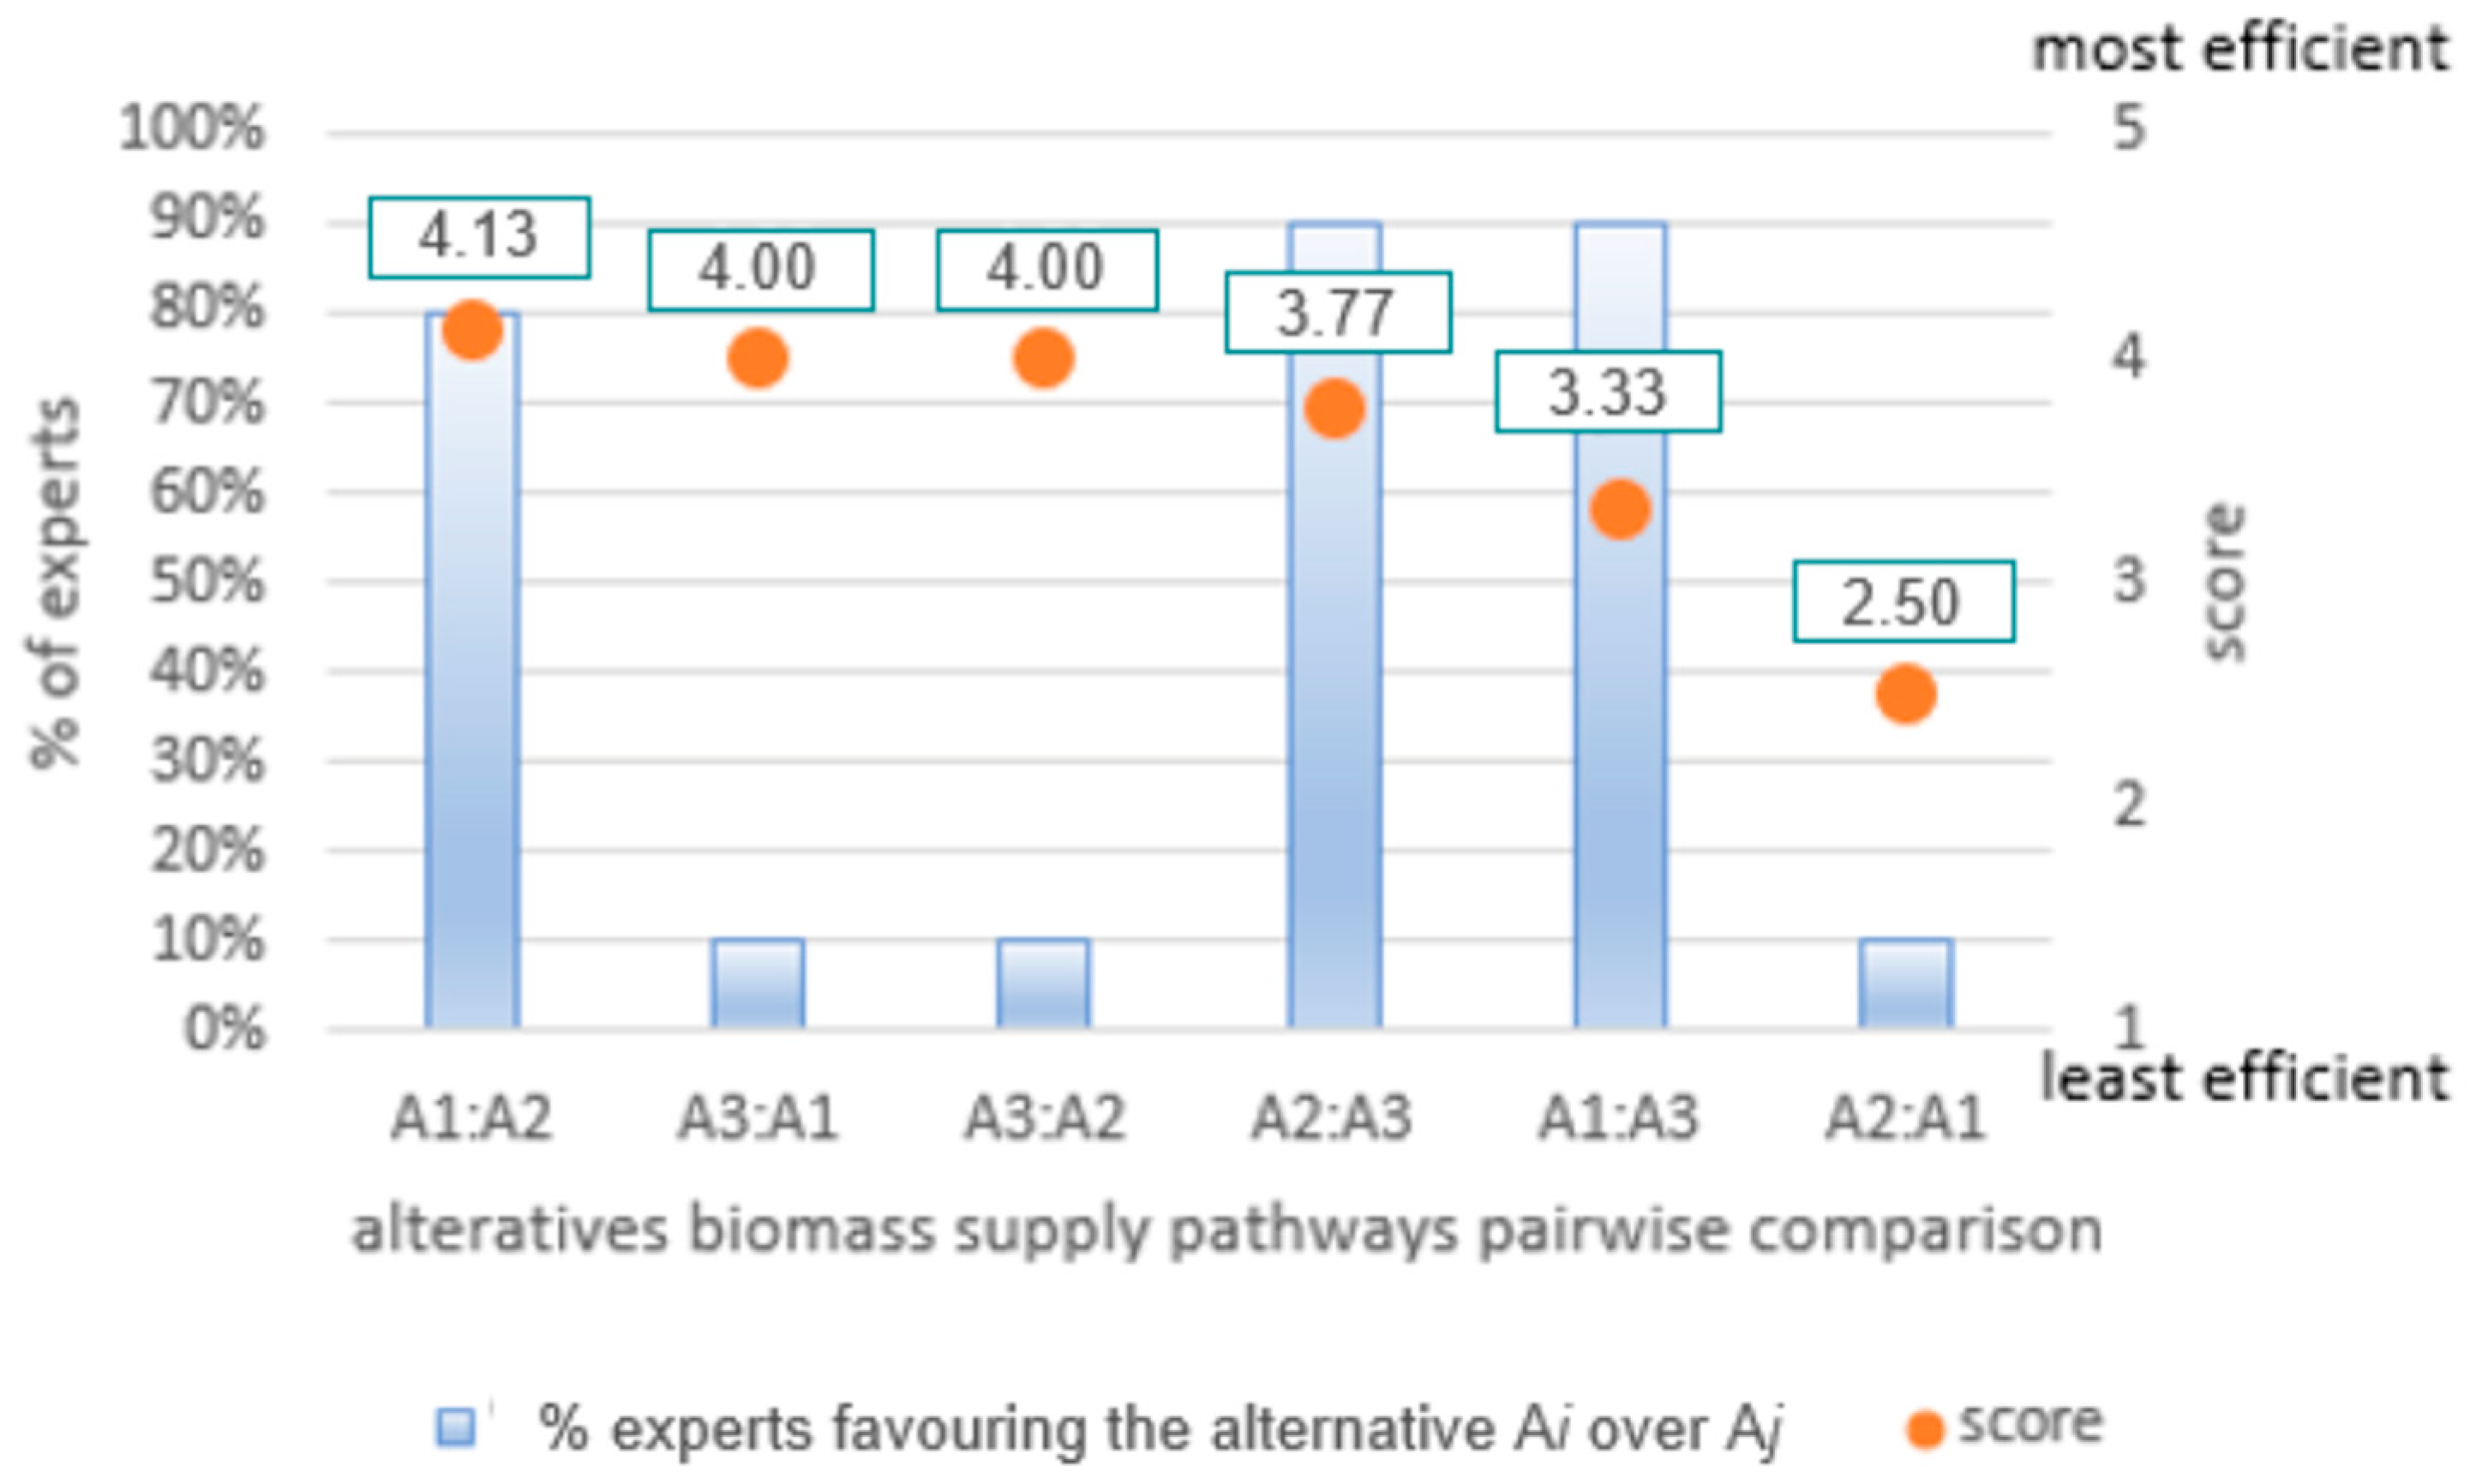
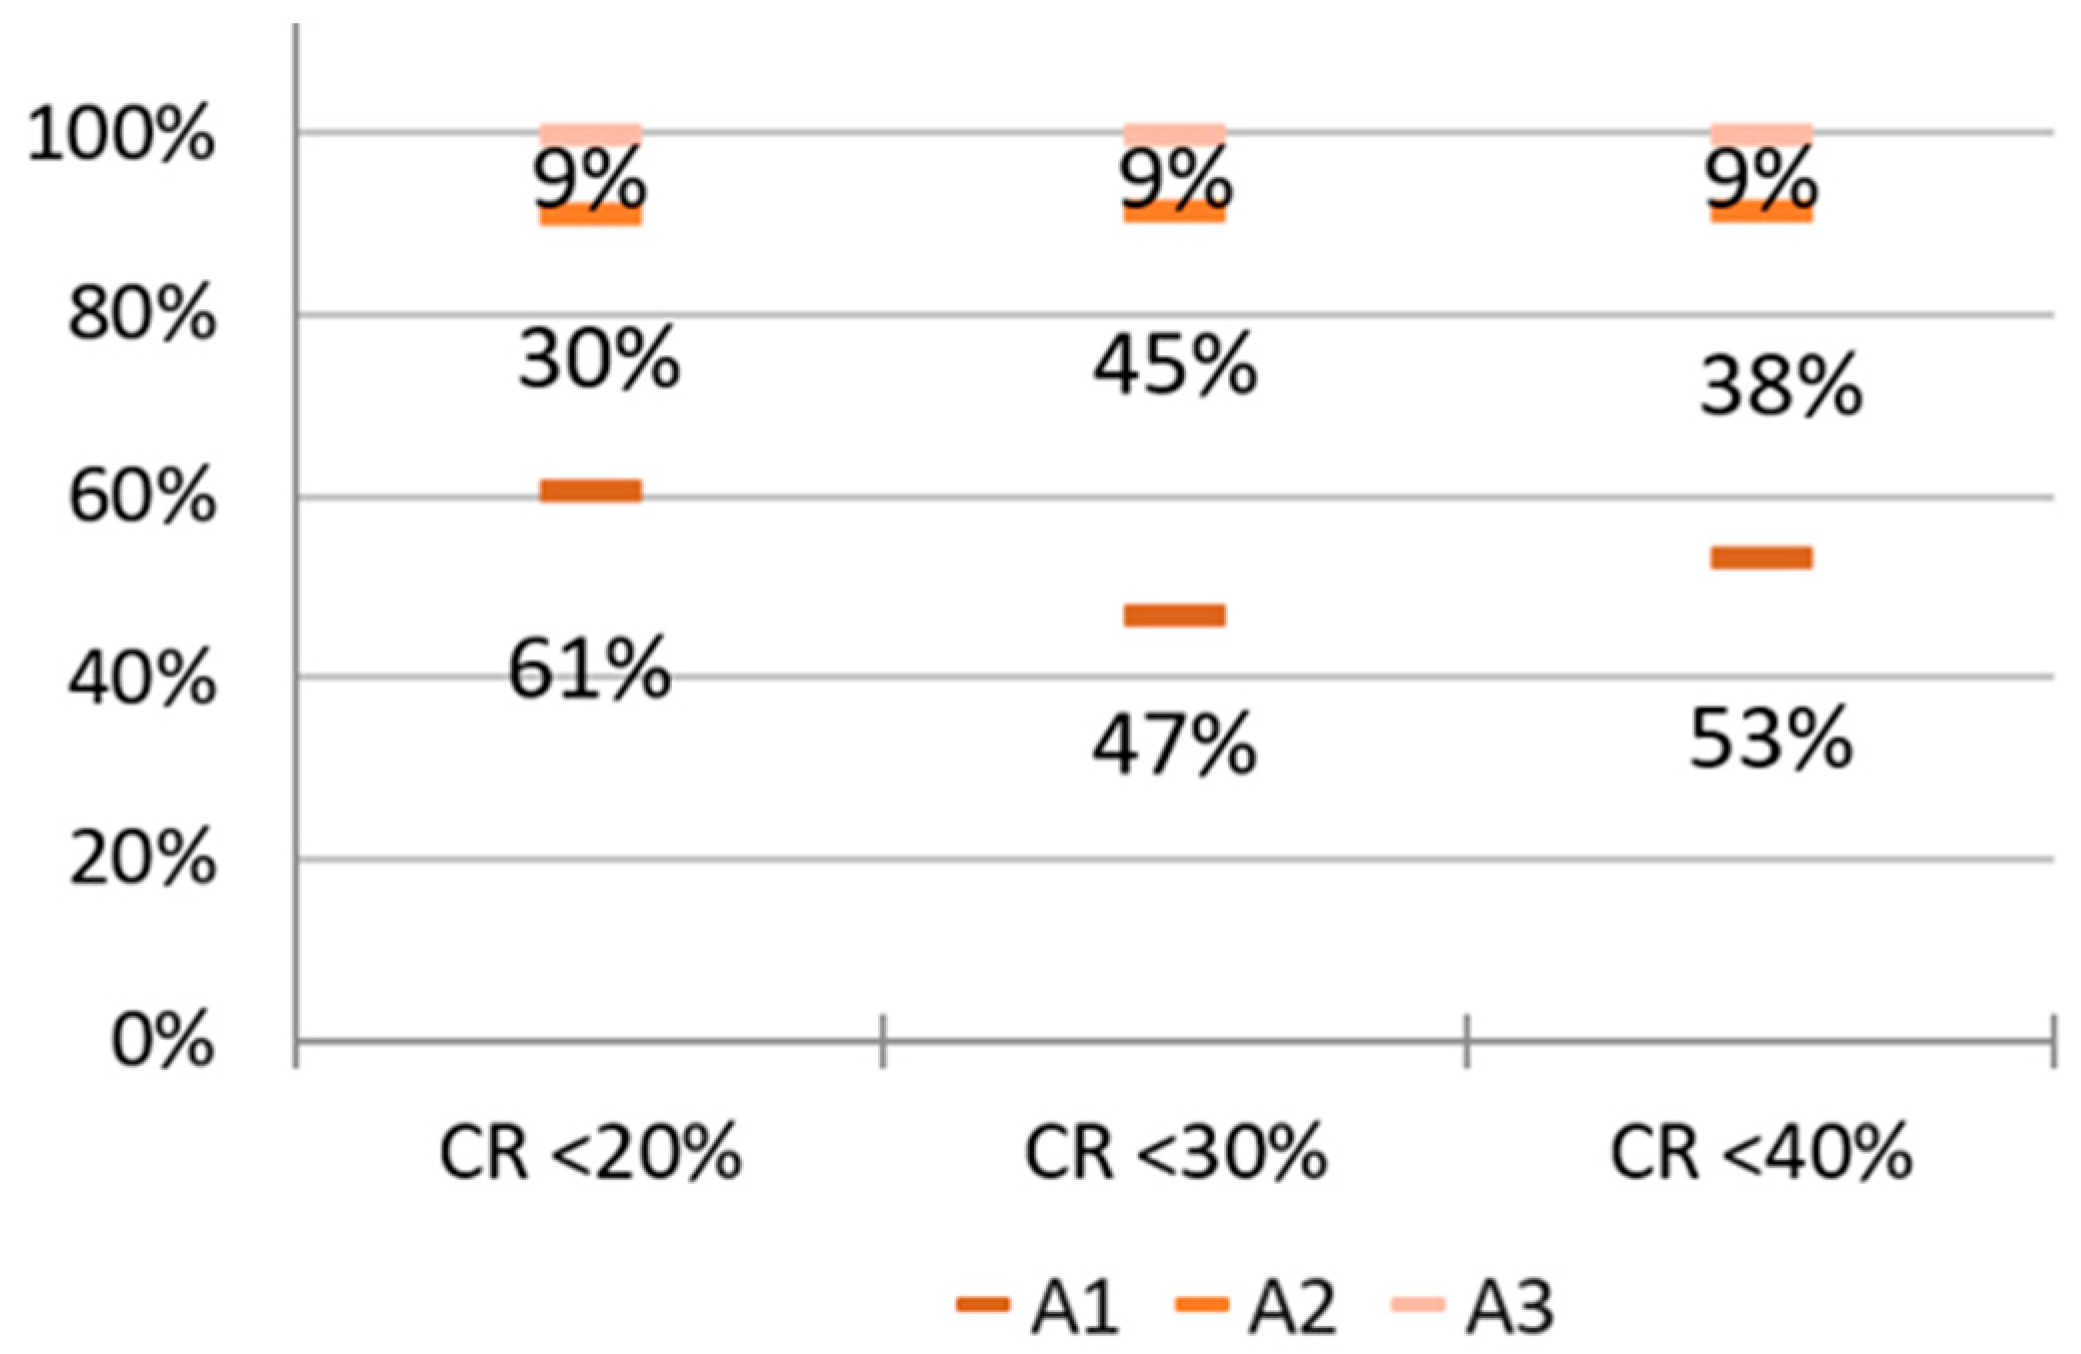
The pairwise matrix was solved to obtain the weights and rankings of alternatives. None of the pairwise comparisons had a 10% CR, whereas 1, 2, and 3 responses had 20%, 30%, and 40% CRs, respectively. The results are quite similar (Figure 4) across different CR values, with a strong preference for low-value biomass supplied by extracting and chipping in the field (A1 pathway), which was weighted to be about twice that of the second alternative—extracting and transporting to roadside, chipping at roadside (A2)—and about 5–6 times that of the lowest-ranked biomass supply pathway—extracting and transporting to roadside, then transporting to conversion facility gate, chipping at conversion plant (A3).
Given the low consistency in pairwise comparison among the group of experts, the results were verified by excluding the consistency ratio, and a pairwise comparison was made with manual matrices (Appendix A Figure A3).
‘Extracting and chipping in the field’ (A1 pathway) was selected by 80% of the experts to be a more efficient pathway to supply biomass to the gate than ‘Extracting and transporting to roadside, chipping at roadside’ (A2). Ninety per cent of experts ranked A2 over ‘Extracting and transporting to roadside, then transporting to conversion facility gate, chipping at conversion plant’ (A3), which supports the above results that include consistency ratios and a smaller representation of the group opinion.
4. Discussion
The main objectives of this research were to quantify the relative importance of biomass supply processes and identify the most cost-efficient pathway for harnessing forest residues for bioenergy in Australia. This study elicited the views of leading Australian-based forest biomass experts to explore process costs and pathway efficiencies. To minimize bias in the expert opinion, the experts were carefully selected based on their characteristics (Appendix A Figure A1) and their opinions were processed through two types of analysis. The goal of the ranking and weighted pairwise analyses was to identify the cost drivers in the biomass supply chain and the most economically efficient system of delivering residue to a bioeconomy player, be it a bioenergy conversion plant or advanced bio-based product replacing the fossil carbon in materials, chemicals, and fibres. The approach of combining expert perspectives on biomass supply chain cost structure and supply pathways has been widely used in similar contexts in other regions, but it is believed that this is the first application to a strategic, decision-setting analysis of forest biomass for a wood-based bioeconomy, or energy transition, in Australia.
The results suggest that, in terms of costs, truck transport ranks behind extracting and is close to chipping material. Transport and chipping material are supply chain segments with the highest fuel consumption for powering engines. This contrasts with past findings and commonly held assumptions that transportation is the key driver of biomass supply chain costs in Australia [51,56,61,63]. It also contrasts with findings in other parts of the world, such as Europe, where transportation (field and road) was considered the largest fraction of biomass procurement costs [90]. The transportation of woody residues was ranked highest among six limiting factors in a US study, above processing and storage and handling [91]. Travel distances could provide an explanation for the lower relative cost of transportation found in this study. Transportation costs vary according to distance and mode [92], and it is important to note that while truck transportation costs per tonne-kilometre decrease as distances increase, overall transportation costs rise with distance [63]. A study in Finland found that when distances exceeded 135 km, truck transportation was no longer cost-competitive compared with train transportation [93].
In Australia, biomass transportation is conducted solely by truck, and biomass processing plants, such as conversion plants, tend to be co-located at the plantation and/or mill site. As the industry is still developing, forest bioenergy is predominantly used for onsite heat and energy by industry operators working within the forestry value chain [34]. Where the primary purpose is the production of on-demand, dispatchable energy production as in wood pellets (to support non-dispatchable sources in the energy mix), mill residues are the primary feedstock, as occurs at Altus Renewables [34,94] in Queensland. Indeed, forest bioenergy generation in Australia has traditionally been generated from mill residues, with forest-based residues a new and underutilized resource [45].
Modern bioenergy can play a vital role in covering shortages and gaps caused by the variability of other renewable, non-dispatchable sources like solar and wind [95,96,97]. For Australia, where solar and wind are established, cost-effective providers of renewable domestic heat and electricity, forest-based biomass for energy can complement these technologies. Forest biomass can provide dispatchable, renewable electricity for grid stability [25,34] or provide bioenergy and carbon sinks with technologies such as pyrolysis [98]. Modelling for Australia’s Bioenergy Roadmap [25] identified bioenergy as a suitable alternative to hard-to-abate fuel products like liquid fuels for aviation and process heat for industry [25]. Forest residues are also a potential feedstock for second-generation or advanced biofuels for the transport sector [98,99,100]. In 2021, the transport sector produced 19.4% of Australia’s net emissions [101]. While helping to reduce emissions and combat climate change [99], combining advanced biofuels replacing diesel for long-haul truck transportation with biochar production could lessen Australia’s dependency on imported refined fuels [25]. Biochar has been recognized for its potential in land-based carbon removal [102,103], which could contribute to Australia’s emission reduction strategy. As conversion plants tend to be co-located in Australia, biomass transport distances and, therefore, costs may be constrained in this developing market. However, the greater utilization of forest residues for dispatchable energy—regardless of whether they feed into the electricity grid, are exported to international markets, or are used as a liquid drop-in fuel—is likely to lead to a more decentralized approach. In this case, transportation costs may become more critical to the overall efficiency and thus the viability of residues for a broader bioeconomy.
The transportation cost profile can be interpreted alongside the experts’ analysis of pathway efficiencies. The experts supported the view that the costs of supplying residue increased the further the unprocessed (not chipped) material was transported along the supply pathways. This is consistent with other research reporting the impact of biomass quality (moisture content) and quantity (biomass volume) and distance on transportation costs [61,104,105]. Truck payloads are dependent on both volume and weight. Unprocessed material (with higher moisture content) reduces a truck’s load volume, limiting the ability to reach full load capacity; hence, transportation becomes less efficient and costs rise [51,104]. Transporting unprocessed material also increases loading (handling) time and costs [63], which was found in the current study to be the least important cost. Studies in Europe report that leaving residues to dry at the roadside [105,106] had a positive effect on costs and that above a distance threshold, it is inefficient to transport unprocessed material [93]. Designers of forest residue supply chains in Australia, therefore, should prioritize field processing (chipping) to manage delivery costs and optimize profits.
Biomass processing and moisture content also affect storage [107]. Storage can occur at different points and locations in the supply chain including field, roadside, and conversion plant. Material that is unprocessed and has a higher moisture content requires a larger physical storage space and has a higher cost. Storage, which ranked the lowest cost in this study, may not be as critical in the supply chain in Australia as in other parts of the world such as Europe and North America, where forest bioenergy is a supplier of heat, and fluctuations in energy demand affect storage demands [93,104].
In contrast, the extraction and processing of residues were found in this study to be the highest and second-highest relative costs, respectively. Extracting biomass has challenges due to its bulky and non-uniform composition [92] and dispersion within the field. In Australia, forest biomass extraction and processing are time- and labour-intensive, and costs may be influenced by machinery systems [62]. Automation or more advanced mechanization, operational efficiencies, and economies of scale may make extraction and chipping more efficient in the future. Location-specific factors and the learning curve are likely to affect efficiencies over time for all process costs in the supply chain [107].
Based on the results of this study, forest management strategies and bioeconomy generation pathways that are designed to prioritize chipping in situ in the forest had the most support from the study experts. Management strategies that prioritize this pathway are likely to be the most economically viable supply option. This is important as managing costs will be critical to attracting investment and government support and for the forest-based bioeconomy to be competitive with other renewable and non-renewable (energy) sources.
While this study did not distinguish between softwood and hardwood stands, plantations, or native forests, it is likely that the findings apply to all forest types, given that the assessments were relative comparisons rather than absolute values. Softwood plantations present perhaps the best opportunity from which to develop a forest-based bioenergy industry in Australia, although other forest resources exist in large volumes also.
The generalizations made here are an important first step in developing knowledge; however, there are some limitations. This study did not disaggregate costs according to residue types such as thinning versus logging residues, moisture content, storage locations (field or conversion plant), plantation location, or scale of operations. Also, this study relied on known, pre-selected, expert participants, but other perspectives may exist.
Evaluating costs and efficiencies in the supply of available forest biomass is critical to decision making and the development of the forest-based bioeconomy in Australia; however, the research findings must be considered in the context of the broader national and global economy. Australia’s economy is structured around the resources industry, particularly carbon-based fossil fuel sources like coal, gas, and petroleum [2,6]. These sources provide most of Australia’s domestic energy needs, but the vast majority are exported to global markets, generating huge revenues for national and state governments [2,108]. Recently developed or updated renewable energy and emissions reduction targets in Australia, along with more stringent reporting of emissions along the value chain (scope 3 emissions) in the EU [109], are likely to promote, if not accelerate, the transition away from carbon-based energy. As markets for fossil fuels in developing countries such as China and India continue, there is also a growing international demand for clean energy including biomass for energy in advanced economies [22]. Demand is mostly met from within the EU, but if the biomass demand cannot be met, it may need to import wood pellets from other regions [17,24,95].
5. Conclusions
The growing interest in forest residues for bioenergy within a broader forest-based bioeconomy highlights the opportunities for this developing industry in Australia. Expert perceptions of the supply chain costs of harnessing biomass feedstock contribute valuable knowledge for forest management, energy policy, and investment decisions, and may increase the likelihood of its future success and contribution to a sustainable bioeconomy. The forest bioeconomy has inherent opportunities, co-benefits, and trade-offs, as well as uncertainties and potential negative impacts [18]. Building knowledge of the drivers of costs and benefits is key to ensuring that the sector development is sustainable and attracts the support of key stakeholders like government and investors.
In this study, experts ranked processes in the forest residue supply chain in Australia according to the relative costs of different processes. Given the logic behind the question, two different ranking methods were employed—weighted ranking and weighted pairwise comparison based on AHP—to interpret the opinion of experts in a specialized supply chain, where many variables add to the complexity and uncertainty of its cost profile [51,60,61,104]. Experts ranked extracting and chipping residue in the field as the most efficient pathway for forest residue supply. This was followed by transporting and chipping residue at the roadside, and transporting and chipping residue at the conversion plant was identified as the least efficient way of supplying material to conversion plants. After extracting and chipping, experts agreed that transportation costs were the most significant costs in the biomass supply pathway, followed by handling and storage costs.
This study is an important preliminary assessment of the efficiencies of supplying forest residues for the forest-based bioeconomy in Australia. It allows for a narrowing of the economic cost analysis to the most efficient biomass supply chain, either as a fuel or a renewable carbon carrier. The evaluation of supply chain efficiencies provided here will be valuable for designers of forest residue pathways as well as forestry managers interested in improving the profitability and sustainability of their value chains and industry. Further studies may extend this work by broadening the stakeholder involvement in the problem structuring stage to (1) identify and engage additional key stakeholders [110] and (2) settle on the criteria or alternatives for the problem [70], including looking deeper into alternatives within the most efficient supply chain. A range of forest types and management regimes, for instance, softwoods, hardwoods, and native and non-native plantations, could be included to determine if differences exist among them. Also, future research may combine a problem structuring method (PSM) such as strength, weakness, opportunity, threat (SWOT) with a broader AHP or another MCDA method to develop greater, independent insight into potential supply chain drivers and barriers. Combining PSM with MCDA can add depth to decision scenarios [110], and SWOT is commonly combined with AHP in forestry research [111,112]. In a review, Marttunen et al. [110] found that SWOT-AHP was the most common among PSM-MCDA combinations.
An important aspect to consider in future research is related to the principle of the cascading use of wood [113,114], particularly the utilization of residue material to extend the total renewable carbon from biomass availability within the bioeconomy [115]. Forest residues from sustainably managed plantations can be a feedstock for many co-products including energy (heat, electricity), panel boards, and biochar [103], as well as having potential applications in bioplastics [116], renewable diesel [34], green hydrogen [117], and BECCS [118]. A holistic assessment of different product pathways is required to promote maximum resource efficiency, thereby promoting the reuse and even co-production of multiple products from the residue material [119]. Linkages between potential markets, and market reactions and acceptance of new products [14], will likely impact the success of forest residue products in Australia.
An evaluation of policy-related barriers to the development of the Australian market is required. Given Australia’s history of fossil fuel dependency and inaction on renewable energy and climate-related targets [2,6,7], it is critical for market development that there is a clear understanding of both the policy settings that are favourable for investment as well as those that act as barriers in Australia. Comparisons with more developed markets in other parts of the world, particularly in the EU and North America, will provide insights into the Australian context. Australia can demonstrate value-adding opportunities for the forest industry and forest management strategies [60] that may also provide broader reputational and public perception benefits.
Author Contributions
Conceptualization, B.K.; methodology, B.K.; software, L.C.G.; validation, L.C.G. and B.K.; formal analysis, B.K.; investigation, L.C.G.; resources, L.C.G.; data curation, L.C.G.; writing—original draft preparation, L.C.G.; writing—review and editing, D.J.L. and B.K.; visualization, L.C.G. and B.K.; supervision, D.J.L. and B.K.; project administration, L.C.G. All authors have read and agreed to the published version of the manuscript.
Funding
This research received no external funding.
Data Availability Statement
Data are available upon request due to restrictions, e.g., privacy or ethics. The data presented in this study are available upon request from the corresponding author. The data are not publicly available for privacy and ethical reasons.
Acknowledgments
The authors would like to thank the 10 experts who contributed their knowledge, time, and expertise, with a particular acknowledgement to researchers from the UniSC Forest Research Institute: Mark Brown and Martin Strandgard; and Natural Resources Institute Finland (Luke): Mauricio Acuna.
Conflicts of Interest
The authors declare no conflicts of interest.
Appendix A
Figure A1.
Composition of the expert panel by geographical distribution (state), background (sector of work), and years of experience.
Figure A1.
Composition of the expert panel by geographical distribution (state), background (sector of work), and years of experience.
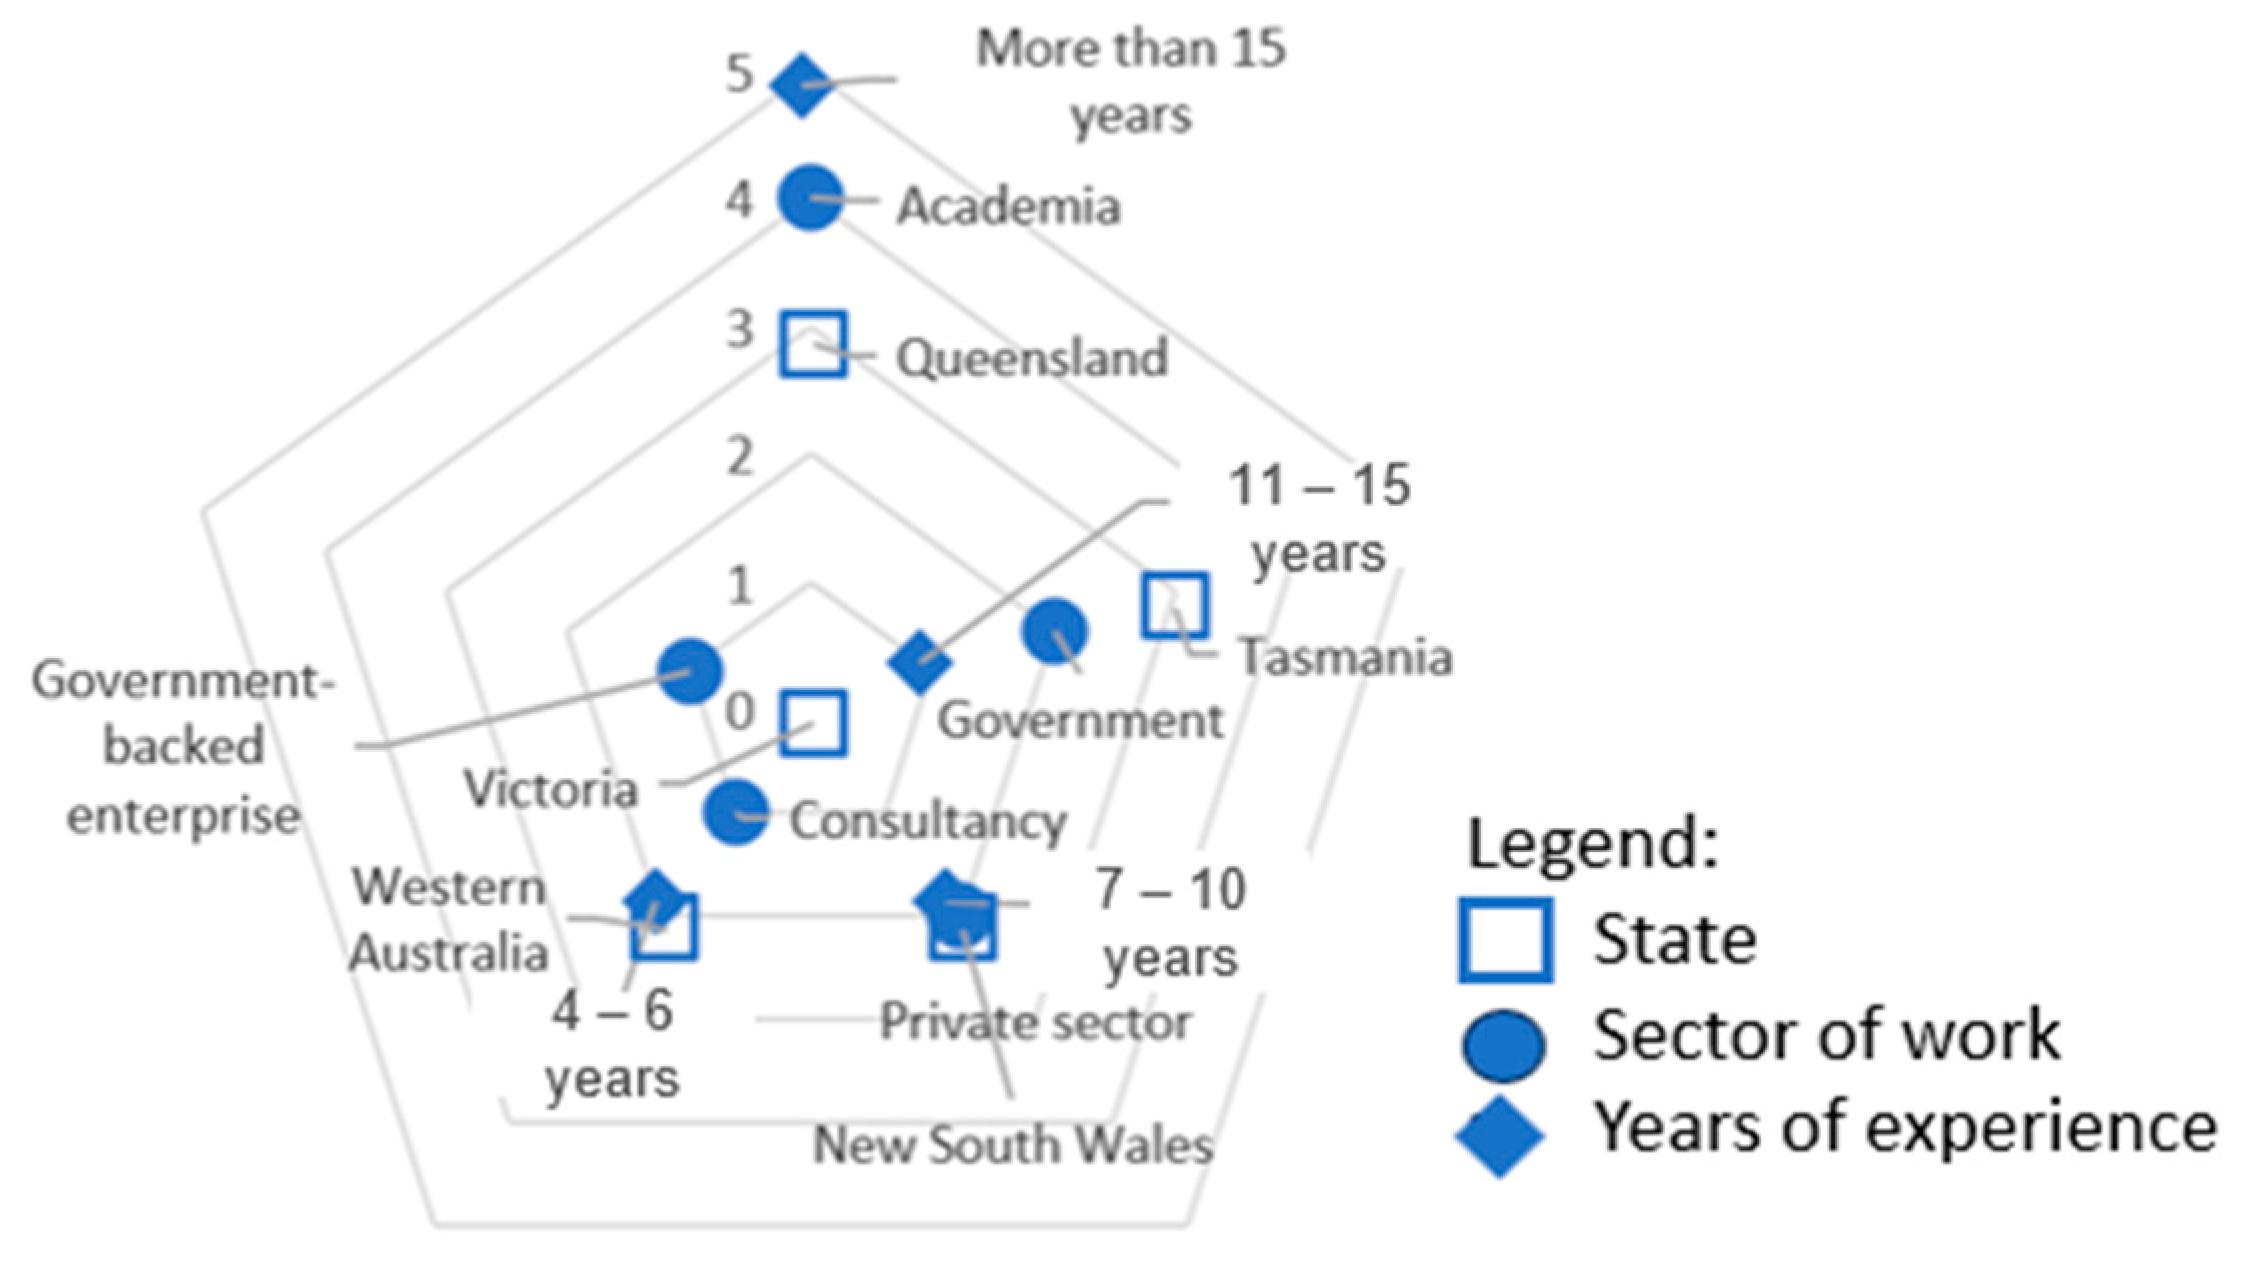
Figure A2.
Knowledge areas of the expert panel regarding the Australian bioeconomy.
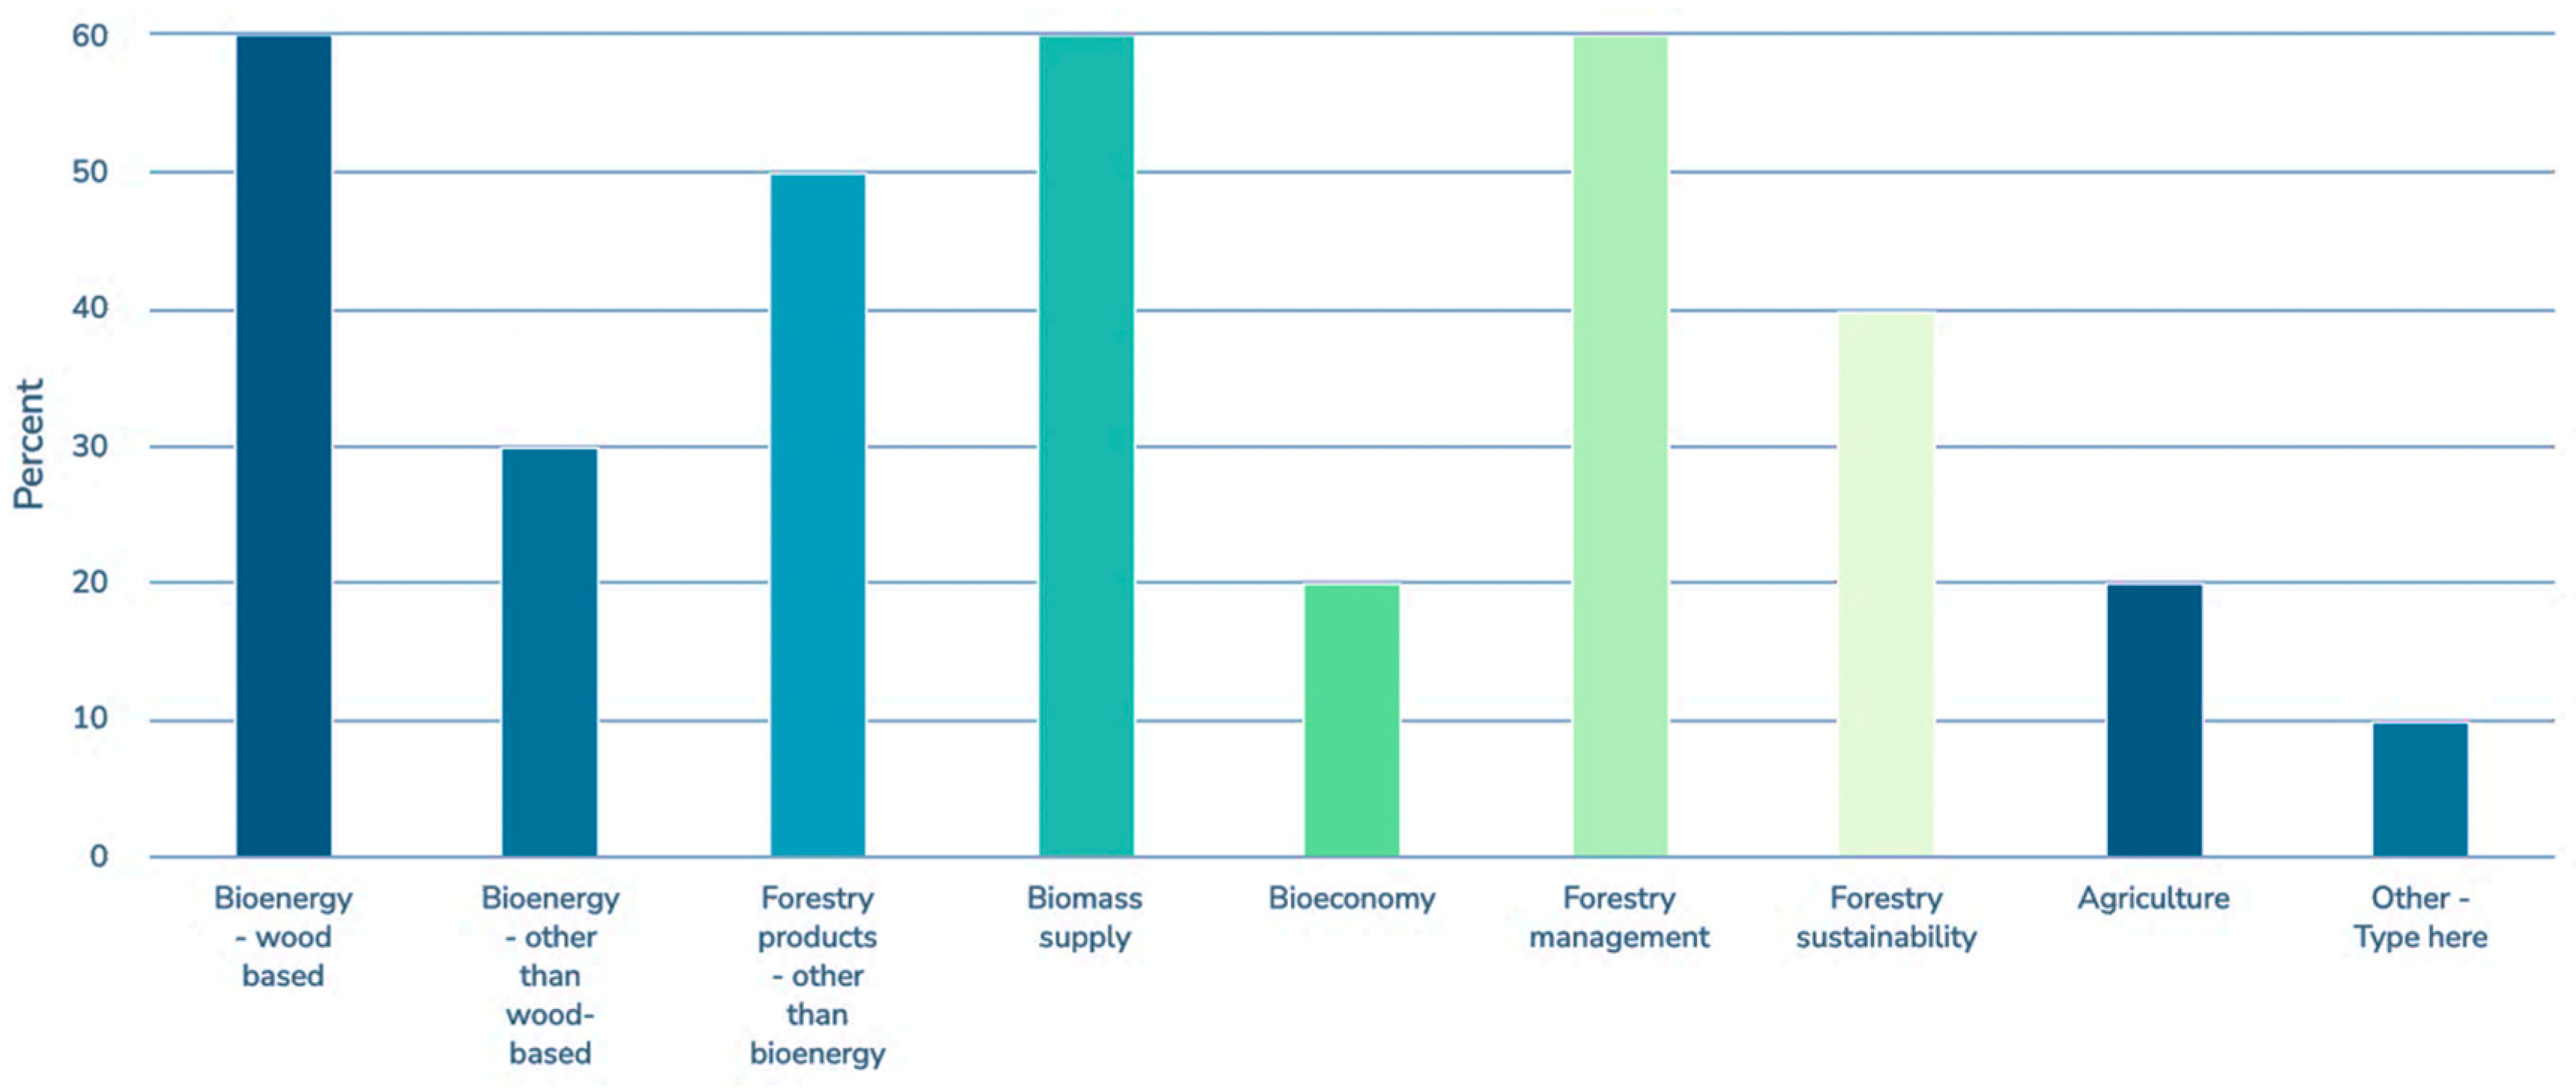
Figure A3.
Pairwise comparison of the three alternative biomass supply pathways.
References
- Department of Climate Change, Energy, the Environment and Water. Australian Energy Update 2022; Australian Government: Canberra, Australia, 2022. Available online: https://www.energy.gov.au/publications/australian-energy-update-2022 (accessed on 27 February 2023).
- Burke, P.J. On the way out: Government revenues from fossil fuels in Australia. Aust J. Agric. Res. Econ. 2023, 67, 1–17. [Google Scholar] [CrossRef]
- Department of Industry, Science and Resources. Resources and Energy Quarterly June 2022; Australian Government Office of the Chief Economist: Canberra, Australia, 2022. Available online: https://www.industry.gov.au/sites/default/files/minisite/static/b3caf4fd-b837-4cc5-b443-38782298963a/resources-and-energy-quarterly-june-2022/index.html#top (accessed on 17 May 2023).
- Intergovernmental Panel on Climate Change (IPCC). Climate Change 2021: The Physical Science Basis. Contribution of Working Group I to the Sixth Assessment Report of the Intergovernmental Panel on Climate Change; Masson-Delmotte, V., Zhai, P., Pirani, A., Connors, S.L., Péan, C., Berger, S., Caud, N., Chen, Y., Goldfarb, L., Gomis, M.I., Eds.; Cambridge University Press: Cambridge, UK; New York, NY, USA, 2021. [Google Scholar] [CrossRef]
- Prime Minister of Australia. Media Release 08 Sep 2022: Prime Minister, Minister for Climate Change and Energy. 2022. Available online: https://www.pm.gov.au/media/australia-legislates-emissions-reduction-targets#:~:text=The%20Albanese%20Government%27s%20landmark%20Climate,will%20be%20enshrined%20in%20legislation (accessed on 28 December 2022).
- Nelson, T.; Nolan, T.; Gilmore, J. What’s next for the Renewable Energy Target–resolving Australia’s integration of energy and climate change policy? Aust. J. Agric. Resour. Econ. 2022, 66, 136–163. [Google Scholar] [CrossRef]
- Brolan, C.E. Looking Back—Australia’s Sustainable Development and Climate Change Policy Agendas. Sustainability 2023, 15, 5688. [Google Scholar] [CrossRef]
- Climate Change Act 2022 No.37 (Cth). Available online: https://www.legislation.gov.au/Details/C2022A00037 (accessed on 21 May 2023).
- Department of Energy and Public Works. Queensland’s Renewable Energy Target; Queensland Government: Brisbane City, Australia, 2022. Available online: https://www.epw.qld.gov.au/about/initiatives/renewable-energy-targets (accessed on 29 December 2022).
- Renewable Energy (Jobs and Investment) Act 2017 (Vic). Available online: https://www.legislation.vic.gov.au/in-force/acts/renewable-energy-jobs-and-investment-act-2017/002 (accessed on 21 May 2023).
- Department of State Growth. Tasmanian Renewable Energy Action Plan. Tasmanian Government. 2020. Available online: https://www.stategrowth.tas.gov.au/__data/assets/pdf_file/0012/313041/Tasmanian_Renewable_Energy_Action_Plan_December_2020.pdf (accessed on 18 May 2023).
- He, M.; Sun, Y.; Han, B. Green carbon science: Scientific basis for integrating carbon resource processing, utilization, and recycling. Angew. Chem. Int. Ed. 2013, 52, 9620–9633. [Google Scholar] [CrossRef] [PubMed]
- Queneau, Y.; Han, B. Biomass: Renewable carbon resource for chemical and energy industry. Innovation 2022, 3, 100184. [Google Scholar] [CrossRef]
- Hurmekoski, E.; Jonsson, R.; Korhonen, J.; Jänis, J.; Mäkinen, M.; Leskinen, P.; Hetemäki, L. Diversification of the forest industries: Role of new wood-based products. Can. J. For. Res. 2018, 48, 1417–1432. [Google Scholar] [CrossRef]
- Schmid, B.; Mosley, F.; Hassegawa, M.; Leskinen, P.; Verkerk, P.J. Forest-Based Bioeconomy and Climate Change Mitigation; European Forest Institute: Joensuu, Finland, 2021; Available online: https://efi.int/sites/default/files/files/publication-bank/projects/Bio-economy%202.0_final_report.pdf (accessed on 17 May 2023).
- Daioglou, V.; Muratori, M.; Lamers, P.; Fujimori, S.; Kitous, A.; Köberle, A.C.; Bauer, N.; Junginger, M.; Kato, E.; Leblance, F.; et al. Implications of climate change mitigation strategies on international bioenergy trade. Clim. Chang. 2020, 163, 1639–1658. [Google Scholar] [CrossRef]
- Mandley, S.; Wicke, B.; Junginger, H.; van Vuuren, D.; Daioglou, V. Integrated assessment of the role of bioenergy within the EU energy transition targets to 2050. GCB Bioenergy 2022, 14, 157–172. [Google Scholar] [CrossRef]
- Zabaniotou, A. Redesigning a bioenergy sector in EU in the transition to circular waste-based Bioeconomy-A multidisciplinary review. J. Clean. Prod. 2018, 177, 197–206. [Google Scholar] [CrossRef]
- Venkatesh, G. Circular bio-economy-Paradigm for the future: Systematic review of scientific journal publications from 2015 to 2021. Circ. Econ. Sust. 2022, 2, 231–279. [Google Scholar] [CrossRef]
- Cutz, L.; Masera, O.; Santana, D.; Faaij, A.P.C. Switching to efficient technologies in traditional biomass intensive countries: The resultant change in emissions. Energy 2017, 126, 513–526. [Google Scholar] [CrossRef]
- Panepinto, D.; Viggiano, F.; Genon, G. Analysis of the environmental impact of a biomass plant for the production of bioenergy. Renew. Sustain. Energy Rev. 2015, 51, 634–647, 4586. [Google Scholar]
- International Energy Agency (IEA). World Energy Outlook 2022; IEA: Paris, France, 2022; Available online: https://www.iea.org/reports/world-energy-outlook-2022 (accessed on 16 June 2023).
- Rogelj, J.; Shindell, D.; Jiang, K.; Fifita, S.; Forster, P.; Ginzburg, V.; Handa, C.; Kheshgi, H.; Kobayashi, S.; Kriegler, E.; et al. Mitigation Pathways Compatible with 1.5 °C in the Context of Sustainable Development; Masson-Delmotte, V., Zhai, P., Pörtner, H.-O., Roberts, D., Skea, J., Shukla, P.R., Pirani, A., Moufouma-Okia, W., Péan, C., Pidcock, R., Eds.; Global warming of 1.5°C. An IPCC special report on the impacts of global warming of 1.5 °C above pre- industrial levels and related global greenhouse gas emission pathways, in the context of strengthening the global response to the threat of climate change, sustainable development, and efforts to eradicate poverty. Intergovernmental Panel on Climate Change; Cambridge University Press: Cambridge, UK; New York, NY, USA, 2018; pp. 93–174. [Google Scholar]
- Junginger, H.M.; Mai-Moulin, T.; Daioglou, V.; Fritsche, U.; Guisson, R.; Hennig, C.; Thrän, D.; Heinimö, J.; Hess, J.R.; Lamers, P.; et al. The future of biomass and bioenergy deployment and trade: A synthesis of 15 years IEA Bioenergy Task 40 on sustainable bioenergy trade. Biofuel Bioprod. Biorefin. 2019, 13, 247–266. [Google Scholar] [CrossRef]
- Enea and Deloitte. Australia’s Bioenergy Roadmap; ARENA: Canberra, Australia, 2021. Available online: https://arena.gov.au/assets/2021/11/australia-bioenergy-roadmap-report.pdf (accessed on 9 January 2023).
- International Energy Agency (IEA). Technology Roadmap: Delivering Sustainable Bioenergy; IEA: Paris, France, 2017; Available online: https://www.ieabioenergy.com/blog/publications/technology-roadmap-delivering-sustainable-bioenergy/ (accessed on 24 November 2019).
- IEA Bioenergy. Country Reports: Implementation of Bioenergy in Canada–2021 Update; Pelkmans, L., Ed.; IEA: Paris, France, 2021; Available online: https://www.ieabioenergy.com/wp-content/uploads/2021/11/CountryReport2021_Canada_final.pdf (accessed on 7 February 2023).
- Eurostat. Energy Balances. European Union. 2021. Available online: https://ec.europa.eu/eurostat/databrowser/view/enps_nrg_bal_c/default/table?lang=en (accessed on 28 January 2023).
- European Commission. Research and Innovation Bioeconomy. 2022. Available online: https://research-and-innovation.ec.europa.eu/research-area/environment/bioeconomy_en (accessed on 30 December 2022).
- Mateos, E.; Ormaetxea, L. Sustainable renewable energy by means of using residual forest biomass. Energies 2019, 12, 13. [Google Scholar] [CrossRef]
- Falcone, P.M.; Tani, A.; Tartiu, V.E.; Imbriani, C. Towards a sustainable forest-based bioeconomy in Italy: Findings from a SWOT analysis. For. Policy Econ. 2020, 110, 101910. [Google Scholar] [CrossRef]
- Spinelli, R.; Visser, R.; Björheden, R.; Roser, D. Recovery energy biomass in conventional forest operations: A review of integrated harvesting systems. Curr. For. Rep. 2019, 5, 90–100. [Google Scholar] [CrossRef]
- Strandgard, M.; Béland, M. Economics of forest biomass for bioenergy: Potential site preparation savings from coarse woody harvesting residue removal in a short-rotation Eucalyptus globulus (Labill.) plantation. Silva Balc. 2021, 22, 45–55. [Google Scholar] [CrossRef]
- Ximenes, F. Forestry, bioenergy and climate–a way forward in Australia. Aust. For. 2021, 84, 1–3. [Google Scholar] [CrossRef]
- Cambero, C.; Sowlati, T. Incorporating social benefits in multi-objective optimization of forest-based bioenergy and biofuel supply chains. Appl. Energy 2016, 178, 721–735. [Google Scholar] [CrossRef]
- Kline, K.L.; Dale, V.H.; Rose, E.; Tonn, B. Effects of Production of Woody Pellets in the Southeastern United States on the Sustainable Development Goals. Sustainability 2021, 13, 821. [Google Scholar] [CrossRef]
- Berndes, G.; Abt, B.; Asikainen, A.; Cowie, A.; Dale, V.; Egnell, V.; Lindner, G.; Marelli, M.; Paré, D.; Pingoud, K.; et al. Forest Biomass, Carbon Neutrality and Climate Change Mitigation; European Forest Institute: Joensuu, Finland, 2016. [Google Scholar] [CrossRef]
- Jones, H.S.; Beets, P.N.; Kimberley, M.O.; Garrett, L.G. Harvest residue management and fertilisation effects on soil carbon and nitrogen in a 15-year-old Pinus radiata plantation forest. For. Ecol. Manag. 2011, 262, 339–347. [Google Scholar] [CrossRef]
- Achat, D.L.; Deleuze, C.; Landmann, G.; Pousse, N.; Ranger, J.; Augusto, L. Quantifying consequences of removing harvesting residues on forest soils and tree growth–A meta-analysis. For. Ecol. Manag. 2015, 348, 124–141. [Google Scholar] [CrossRef]
- Vance, E.D.; Prisley, S.P.; Schilling, E.B.; Tatum, V.L.; Bently Wigley, T.; Lucier, A.A.; Van Deusen, P.C. Environmental implications of harvesting lower-value biomass in forests. For. Ecol. Manag. 2018, 407, 47–56. [Google Scholar] [CrossRef]
- Tutua, S.; Zhang, Y.; Xu, Z.; Blumfield, T. Residue retention mitigated short-term adverse effect of clear-cutting on soil carbon and nitrogen dynamics in subtropical Australia. J. Soils Sediments 2019, 19, 3786–3796. [Google Scholar] [CrossRef]
- Pergola, M.; Angelo, R.; Tortora, A.; Castellaneta, M.; Borghetti, M.; De Franchi, A.S.; Lapolla, A.; Moretti, N.; Pecora, G.; Pierangeli, D.; et al. Identification of suitable areas for biomass power plant construction through environmental impact assessment of forest harvesting residues transportation. Energies 2020, 13, 2699. [Google Scholar] [CrossRef]
- Montreal Process Implementation Group for Australia and National Forest Inventory Steering Committee. Australia’s State of the Forests Report 2018; ABARES: Canberra, Australia, 2018. Available online: https://www.agriculture.gov.au/abares/forestsaustralia/sofr/sofr-2018 (accessed on 8 July 2022).
- Legg, P.; Frakes, I.; Gavran, M. Australian Plantation Statistics and Log Availability Report 2021; Australian Bureau of Agricultural and Resource Economics and Sciences (ABARES): Canberra, Australia, 2021. [Google Scholar] [CrossRef]
- Lock, P.; Whittle, L. Future Opportunities for Using Forest and Sawmill Residues in Australia; Australian Bureau of Agricultural and Resource Economics and Sciences (ABARES): Canberra, Australia, 2018. Available online: https://www.agriculture.gov.au/abares/research-topics/forests/forest-economics/forest-economic-research/forest-sawmill-residues-report (accessed on 19 July 2022).
- Garvie, L.C.; Roxburgh, S.; Ximenes, F. Greenhouse gas emission offsets of forest residues for bioenergy in Queensland, Australia. Forests 2021, 12, 1570. [Google Scholar] [CrossRef]
- Cambero, C.; Sowlati, T. Assessment and optimization of forest biomass supply chains from economic, social and environmental perspectives–A review of literature. Renew. Sust. Energ. Rev. 2014, 36, 62–73. [Google Scholar] [CrossRef]
- European Forest Institute, n.d. ToSIA–Leading the Way to Sustainability. Available online: http://tosia.efi.int/ (accessed on 6 January 2023).
- Santos, A.; Carvalho, A.; Barbosa-Póvoa, A.P.; Marques, A.; Amorim, P. Assessment and optimization of sustainable forest wood supply chains–A systematic literature review. For. Policy Econ. 2019, 105, 112–135. [Google Scholar] [CrossRef]
- Panepinto, D.; Viggiano, F.; Genon, G. The potential of biomass supply for energetic utilization in a small Italian region: Basilicata. Clean Techn. Environ. Policy 2014, 16, 833–845. [Google Scholar] [CrossRef]
- Acuna, M.; Sessions, J.; Zamora, R.; Boston, K.; Brown, M.; Ghaffariyan, M.R. Methods to manage and optimize forest biomass supply chains: A review. Curr. For. Rep. 2019, 5, 124–141. [Google Scholar] [CrossRef]
- Australian Competition & Consumer Commission (ACCC). War in Ukraine and OPEC Production Limits Pushed February Petrol Prices to Eight-Year High. 2022. Available online: https://www.accc.gov.au/media-release/war-in-ukraine-and-opec-production-limits-pushed-february-petrol-prices-to-eight-year-high (accessed on 6 January 2023).
- Crawford, D.F.; O’Connor, M.H.; Jovanovic, T.; Herr, A.; Raison, R.J.; O’Connell, D.A.; Baynes, T. A spatial assessment of potential biomass for bioenergy in Australia in 2010, and possible expansion by 2030 and 2050. GCB Bioenergy 2016, 8, 707–772. [Google Scholar] [CrossRef]
- Ngugi, M.R.; Neldner, V.J.; Ryan, S.; Lewis, T.; Li, J.; Norman, P.; Mogilski, M. Estimating potential harvestable biomass for bioenergy from sustainably managed private native forests in Southeast Queensland, Australia. For. Ecosys. 2018, 5, 62–76. [Google Scholar] [CrossRef]
- Li, W.; Bi, H.; Watt, D.; Li, Y.; Ghaffariyan, M.R.; Ximenes, F. Estimation and spatial mapping of residue biomass following CTL harvesting in Pinus radiata plantations: An application of harvester data analytics. Forests 2022, 13, 428. [Google Scholar] [CrossRef]
- Van Holsbeeck, S.; Ezzati, S.; Röser, D.; Brown, M. A two-stage DSS to evaluate optimal locations for bioenergy facilities. Forests 2020, 11, 968. [Google Scholar] [CrossRef]
- Van Holsbeeck, S.; Srivastava, S.K. Feasibility of locating biomass-to-bioenergy conversion facilities using spatial information technologies: A case study on forest biomass in Queensland, Australia. Biomass Bioenergy 2020, 139, 105620. [Google Scholar] [CrossRef]
- Jayarathna, L.; Kent, G.; O’Hara, I.; Hobson, P. A Geographical Information System based framework to identify optimal location and size of biomass energy plants using single or multiple biomass types. Appl. Energy 2020, 275, 116398. [Google Scholar] [CrossRef]
- Middelhoff, E.; Madden, B.; Li, M.; Ximenes, F.; Lenzen, M.; Florin, N. Bioenergy siting for low-carbon electricity supply in Australia. Biomass Bioenergy 2022, 163, 106496. [Google Scholar] [CrossRef]
- Luo, L.; O’Hehir, J.; Regan, C.M.; Meng, L.; Connor, J.D.; Chow, C.W.K. An integrated strategic and tactical optimization model for forest supply chain planning. For. Policy Econ. 2021, 131, 102571. [Google Scholar] [CrossRef]
- Acuna, M. Timber and biomass transport optimization: A review of planning issues, solution techniques and decision support tools. Croat. J. For. Eng. 2017, 38, 279–290. [Google Scholar]
- Strandgard, M.; Mitchell, R. Comparison of the productivity, cost and stem breakage of two- and three- machine harvest systems clearfelling a mature Pinus radiata stand. Aust. For. 2020, 83, 91–98. [Google Scholar] [CrossRef]
- Rodriguez, L.C.; May, B.; Herr, A.; O’Connell, D. Biomass assessment and small scale biomass fired electricity generation in the Green Triangle, Australia. Biomass Bioenergy 2011, 35, 2589–2599. [Google Scholar] [CrossRef]
- Ossadnik, W.; Schinke, S.; Kaspar, R.H. Group Aggregation Techniques for Analytic Hierarchy Process and Analytic Network Process: A Comparative Analysis. Group Decis. Negot. 2016, 25, 421–457. [Google Scholar] [CrossRef]
- Saaty, T.L. The Analytic Hierarchy Process; McGraw-Hill: New York, NY, USA, 1980. [Google Scholar]
- Saaty, T.L.; Vargas, L.G. Models, Methods, Concepts & Applications of the Analytic Hierarchy Process; Kulwer Academic Publishers: Boston, MA, USA; London, UK, 2001. [Google Scholar]
- Tavana, M.; Soltanifar, M.; Santos-Arteaga, F.J. Analytic hierarchy process: Revolution and evolution. Ann. Oper. Res. 2021, 326, 879–907. [Google Scholar] [CrossRef]
- Schmidt, K.; Aumann, I.; Hollander, I.; Damm, K.; von der Schulenburg, J.-M.G. Applying the Analytic Hierarchy Process in healthcare research: A systematic literature review and evaluation of reporting. BMC Med. Inf. Decis. Mak. 2015, 15, 112. [Google Scholar] [CrossRef] [PubMed]
- Pohekar, S.D.; Ramachandran, M. Application of multi-criteria decision making to sustainable energy planning—A review. Renew. Sust. Energ. Rev. 2004, 8, 365–381. [Google Scholar] [CrossRef]
- Wolfslehner, B.; Vacik, H.; Lexer, M.J. Application of the analytic network process in multi-criteria analysis of sustainable forest management. For. Ecol. Manag. 2005, 207, 157–170. [Google Scholar] [CrossRef]
- Kumar, A.; Sah, B.; Singh, A.R.; Deng, Y.; He, X.; Kumar, P.; Bansal, R.C. A review of multi criteria decision making (MCDM) towards sustainable renewable energy development. Renew. Sust. Energ. Rev. 2017, 69, 596–609. [Google Scholar] [CrossRef]
- Chan, H.K.; Sun, X.; Chung, S.-H. When should fuzzy analytic hierarchy process be used instead of analytic hierarchy process? Decis. Support Syst. 2019, 125, 113114. [Google Scholar] [CrossRef]
- García-Alcaraz, J.L.; García-Alcaraz, P.; Aryanfar, Y.; Realyyásquez-Vargas, A.; Mohtaram, S.; Haj-Assad, M.E. Multicriteria decision making methods–A review and case study. In Handbook on Decision Making; Zapata-Cortes, J.A., Sánchez-Ramírez, C., Alor-Hernández, G., García-Alcaraz, J.L., Eds.; Intelligent Systems Reference Library, 226; Springer: Cham, Switzerland, 2023. [Google Scholar] [CrossRef]
- Buchholz, T.; Rametsteiner, E.; Volk, T.A.; Luzadis, V.A. Multi Criteria Analysis for bioenergy systems assessments. Energy Policy 2009, 37, 484–495. [Google Scholar] [CrossRef]
- Mardani, A.; Kazimieras Zavadskas, E.; Khalifah, Z.; Zakuan, N.; Jusoh, A.; Nor, K.M.; Khoshnoudi, M. A review of multi-criteria decision-making applications to solve energy management problems: Two decades from 1995 to 2015. Renew. Sust. Energ. Rev. 2017, 71, 216–256. [Google Scholar] [CrossRef]
- Brunnhofer, M.; Gabriella, N.; Schöggl, J.-P.; Stern, T.; Posch, A. The biorefinery transition in the European pulp and paper industry–A three-phase Delphi study including a SWOT-AHP analysis. For. Policy Econ. 2020, 110, 101882. [Google Scholar] [CrossRef]
- Shah, S.A.A.; Solangi, Y.A.; Ikram, M. Analysis of barriers to the adoption of cleaner energy technologies in Pakistan using modified Delphi and fuzzy analytical hierarchy process. J. Clean. Prod. 2019, 235, 1037–1050. [Google Scholar] [CrossRef]
- Lee, Y.; Lee, M.C.; Kim, Y.J. Barriers and strategies of hydrogen fuel cell power generation based on expert survey in South Korea. Int. J. Hydrog. Energy 2022, 47, 5709–5719. [Google Scholar] [CrossRef]
- Brandao, R.D.; Thiffault, E.; Levasseur, A. Development of a multi-criteria analysis decision-support tool for the sustainability of forest biomass heating projects in Quebec. Sustainability 2022, 14, 13200. [Google Scholar] [CrossRef]
- Taylan, O.; Alamoudi, R.; Kabli, M.; Aljifri, A.; Ramzi, F.; Herrera-Viedma, E. Assessment of energy systems using extended fuzzy AHP, fuzzy VIKOR, and TOPSIS approaches to manage non-cooperative opinions. Sustainability 2020, 12, 2745. [Google Scholar] [CrossRef]
- Kulišić, B.; Dimitrou, I.; Mola-Yudego, B. From preferences to concerted policy on mandated share for renewable energy in transport. Energy Policy 2021, 155, 112355. [Google Scholar] [CrossRef]
- Kulišić, B.; Dimitrou, I.; Mola-Yudego, B. Positioning the biofuel policy in the bioeconomy of the BioEast macro-region. Biofuels 2022, 13, 833–842. [Google Scholar] [CrossRef]
- Blagojevic, B.; Athanassiadis, D.; Spinelli, R.; Raitila, J.; Vos, J. Determining the relative importance of factors affecting the success of innovations in forest technology using AHP. J. Multi-Criteria Decis. Anal. 2020, 27, 129–140. [Google Scholar] [CrossRef]
- Alchemer, n.d. Available online: https://www.alchemer.com/ (accessed on 6 January 2023).
- Arrow, K.J. Social Choice and Individual Values; Yale University Press: New Haven, CT, USA, 1978. [Google Scholar]
- Saaty, T.L. Modeling unstructured decision problems—The theory of analytical hierarchies. Math. Comput. Simul. 1978, 20, 147–158. [Google Scholar] [CrossRef]
- Pecchia, L.; Martin, J.L.; Ragozzino, A.; Vanzanella, C.; Scognamiglio, A.; Mirarchi, L.; Morgan, S.P. User needs elicitation via analytic hierarchy process (AHP): A case study on a Computed Tomography (CT) scanner. BMC Med. Inform. Decis. Mak. 2013, 13, 2. [Google Scholar] [CrossRef]
- Ho, D.C.W.; Leung, H.F.; Wong, S.K.; Cheung, A.K.C.; Lau, S.S.Y.; Wong, W.S.; Lung, D.P.Y.; Chau, K.W. Assessing the health and hygiene performance of apartment buildings. Facilities 2004, 22, 58–69. [Google Scholar] [CrossRef]
- Mahmoud, M.; Hine, J. Using AHP to measure the perception gap between current and potential users of bus services. Transp. Plan. Technol. 2012, 36, 4–23. [Google Scholar] [CrossRef]
- European Biomass Industry Association. Recovery of Forest Residues. 2023. Available online: https://www.eubia.org/cms/wiki-biomass/biomass-resources/challenges-related-to-biomass/recovery-of-forest-residues/ (accessed on 9 January 2023).
- Pokharel, R.; Grala, R.K.; Grebner, D.L. Woody residue utilization for bioenergy by primary forest products manufacturers: An exploratory analysis. For. Policy Econ. 2017, 85, 161–171. [Google Scholar] [CrossRef]
- Tzelepi, V.; Zeneli, M.; Kourkoumpas, D.-S.; Karampinis, E.; Gypakis, A.; Nikolopoulos, N.; Grammelis, P. Biomass availability in Europe as an alternative fuel for full conversion of lignite power plants: A critical review. Energies 2020, 13, 3390. [Google Scholar] [CrossRef]
- Tahvanainen, T.; Anttila, P. Supply chain cost analysis of long-distance transportation of energy wood in Finland. Biomass Bioenergy 2011, 35, 3360–3375. [Google Scholar] [CrossRef]
- Altus Renewables. The Tuan Facility. 2021. Available online: https://www.altusrenewables.com/altus-renewables-projects-collection/the-tuan-facility (accessed on 10 January 2021).
- Hurmekoski, E.; Lovrić, M.; Lovrić, N.; Hetemäki, L.; Winkel, G. Frontiers of the forest-based bioeconomy–A European Delphi study. For. Policy Econ. 2019, 102, 86–99. [Google Scholar] [CrossRef]
- Li, M.; Lenzen, M.; Yousefzadeh, M.; Ximenes, F.A. The roles of biomass and CSP in a 100% renewable electricity supply in Australia. Biomass Bioenergy 2020, 143, 105802. [Google Scholar] [CrossRef]
- Cowie, A.L.; Berndes, G.; Bentsen, N.S.; Brandão, M.; Cherubini, F.; Egnell, G.; George, B.; Gustavsson, L.; Hanewinkel, M.; Harris, Z.M.; et al. Applying a science-based systems perspective to dispel misconceptions about climate effects of forest bioenergy. GCB Bioenergy 2021, 13, 1210–1231. [Google Scholar] [CrossRef]
- Lehmann, J.; Cowie, A.; Masiello, C.A.; Kammann, C.; Woolf, D.; Amonette, J.E.; Cayuela, M.L.; Camps-Arbestain, M.; Whitman, T. Biochar in climate change mitigation. Nat. Geosci. 2021, 14, 883–892. [Google Scholar] [CrossRef]
- Bryngemark, E. Second generation biofuels and the competition for forest raw materials: A partial equilibrium analysis of Sweden. For. Policy Econ. 2019, 109, 102022. [Google Scholar] [CrossRef]
- Soam, S.; Börjesson, P. Considerations on potentials, greenhouse gas, and energy performance of biofuels based on forest residues for heavy-duty road transport in Sweden. Energies 2020, 13, 6701. [Google Scholar] [CrossRef]
- Department of Climate Change, Energy, the Environment and Water. National Inventory Report 2021: The Australian Government Submission to the United Nations Framework Convention on Climate Change; Australian Government: Canberra, Australia, 2023. Available online: https://www.dcceew.gov.au/sites/default/files/documents/national-inventory-report-2021-volume-1.pdf (accessed on 19 May 2023).
- Tisserant, A.; Cherubini, F. Potential, limitations, co-benefits, and trade-offs of biochar applications to soils for climate change mitigation. Land 2019, 8, 179. [Google Scholar] [CrossRef]
- Bergman, R.; Sahoo, K.; Englund, K.; Mousavi-Avval, S.H. Lifecycle assessment and techno-economic analysis of biochar pellet production from forest residues and field application. Energies 2022, 15, 1559. [Google Scholar] [CrossRef]
- Windisch, J.; Väätäinen, K.; Anttila, P.; Nivala, M.; Laitila, J.; Asikainen, A.; Sikanen, L. Discrete-event simulation of an information-based raw material allocation process for increasing the efficiency of an energy wood supply chain. Appl. Energy 2015, 149, 315–325. [Google Scholar] [CrossRef]
- Sánchez-García, S.; Athanassiadis, D.; Martínez-Alonso, C.; Tolosana, E.; Majada, J.; Canga, E. A GIS methodology for optimal location of a wood-fired power plant: Quantification of available woodfuel, supply chain costs and GHG emissions. J. Clean. Prod. 2017, 157, 201–212. [Google Scholar] [CrossRef]
- Gendek, A.; Nurek, T.; Zychowicz, W.; Moskalik, T. Effects of intentional reduction in moisture content of forest wood chips during transport on truckload price. Bio. Res. 2018, 13, 4310–4322. [Google Scholar] [CrossRef]
- World Bioenergy Association. Biomass Supply Chains: Harvesting & Collection, Pre-Treatment and Upgrading, Storage, Transportation and Handling; WBA: Stockholm, Sweden, 2018; Available online: https://www.worldbioenergy.org/uploads/Factsheet%20-%20Biomass%20Supply%20Chains.pdf (accessed on 4 May 2023).
- Department of Foreign Affairs and Trade. Australia’s Trade in Goods and Services 2020–21; Australian Government: Canberra, Australia, 2022. Available online: https://www.dfat.gov.au/trade/trade-and-investment-data-information-and-publications/trade-statistics/trade-in-goods-and-services/australias-trade-goods-and-services-2020-21 (accessed on 9 January 2023).
- Council Directive 2021/0104 (COD) on Corporate Sustainability Reporting, 2022 (EU). Unpublished. Available online: https://data.consilium.europa.eu/doc/document/PE-35-2022-INIT/en/pdf (accessed on 4 May 2023).
- Marttunen, M.; Lienert, J.; Belton, V. Structuring problems for Multi-Criteria Decision Analysis in practice: A literature review of method combinations. Eur. J. Oper. Res. 2017, 263, 1–17. [Google Scholar] [CrossRef]
- Kajanus, M.; Leskinen, P.; Kurttila, M.; Kangas, J. Making use of MCDS methods in SWOT analysis—Lessons learnt in strategic natural resources management. For. Policy Econ. 2012, 20, 1–9. [Google Scholar] [CrossRef]
- Rauch, P.; Wolfsmayr, U.J.; Borz, S.A.; Triplat, M.; Krajnc, N.; Kolck, M.; Oberwimmer, R.; Ketikidis, C.; Vasiljevic, A.; Stauder, M.; et al. SWOT analysis and strategy development for forest fuel supply chains in South East Europe. For. Policy Econ. 2015, 61, 87–94. [Google Scholar] [CrossRef]
- European Commission. A Sustainable Bioeconomy for Europe: Strengthening the Connection between Economy, Society and the Environment: Updated Bioeconomy Strategy; Publications Office of the European Union: Luxembourg, 2018; Available online: https://op.europa.eu/en/publication-detail/-/publication/edace3e3-e189-11e8-b690-01aa75ed71a1/language-en (accessed on 16 June 2023).
- European Commission. Guidance on Cascading Use of Biomass with Selected Good Practice Examples on Woody Biomass; Publications Office of the European Union: Luxembourg, 2019; Available online: https://data.europa.eu/doi/10.2873/68553 (accessed on 20 April 2023).
- Mair, C.; Stern, T. Cascading Utilization of Wood: A Matter of Circular Economy? Curr. For. Rep. 2017, 3, 281–295. [Google Scholar] [CrossRef]
- Maximo, Y.I.; Hassegawa, M.; Verkerk, P.J.; Missio, A.L. Forest Bioeconomy in Brazil: Potential Innovative Products from the Forest Sector. Land 2022, 11, 1297. [Google Scholar] [CrossRef]
- Martins, A.H.; Rouboa, A.; Monteiro, E. On the green hydrogen production through gasification processes: A techno-economic approach. J. Clean. Prod. 2023, 383, 135476. [Google Scholar] [CrossRef]
- Kraxner, F.; Aoki, K.; Leduc, S.; Kindermann, G.; Fuss, S.; Yang, J.; Yamagata, Y.; Tak, K.-I.; Obersteiner, M. BECCS in South Korea—Analyzing the negative emissions potential of bioenergy as a mitigation tool. Renew. Energy 2014, 61, 102–108. [Google Scholar] [CrossRef]
- Jarre, M.; Petit-Boix, A.; Priefer, C.; Meyer, R.; Leipold, S. Transforming the bio-based sector towards a circular economy—What can we learn from wood cascading? For. Policy Econ. 2020, 110, 101872. [Google Scholar] [CrossRef]
Figure 1.
Overview of the research framework.

Figure 2.
Outline of biomass supply chain segments, with descriptions, used for ranking.
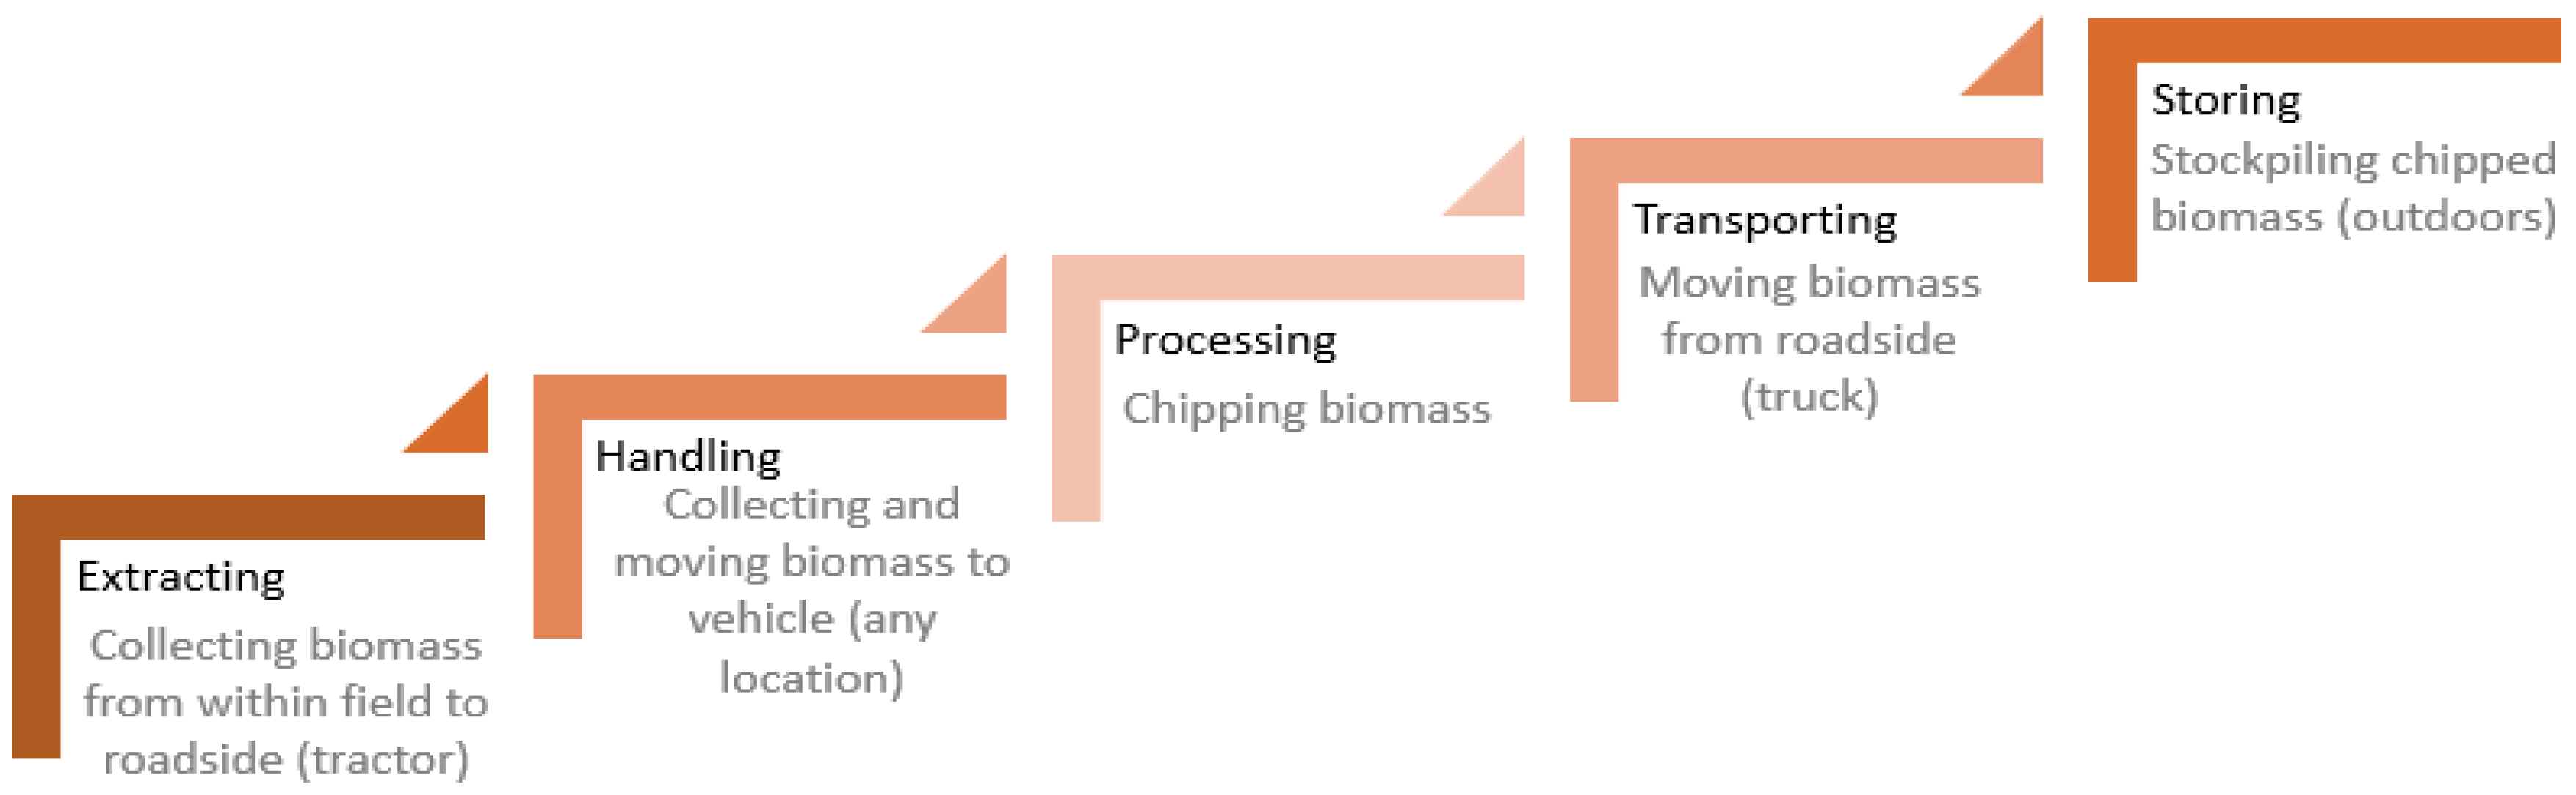
Figure 3.
The ranking order of biomass supply processes.
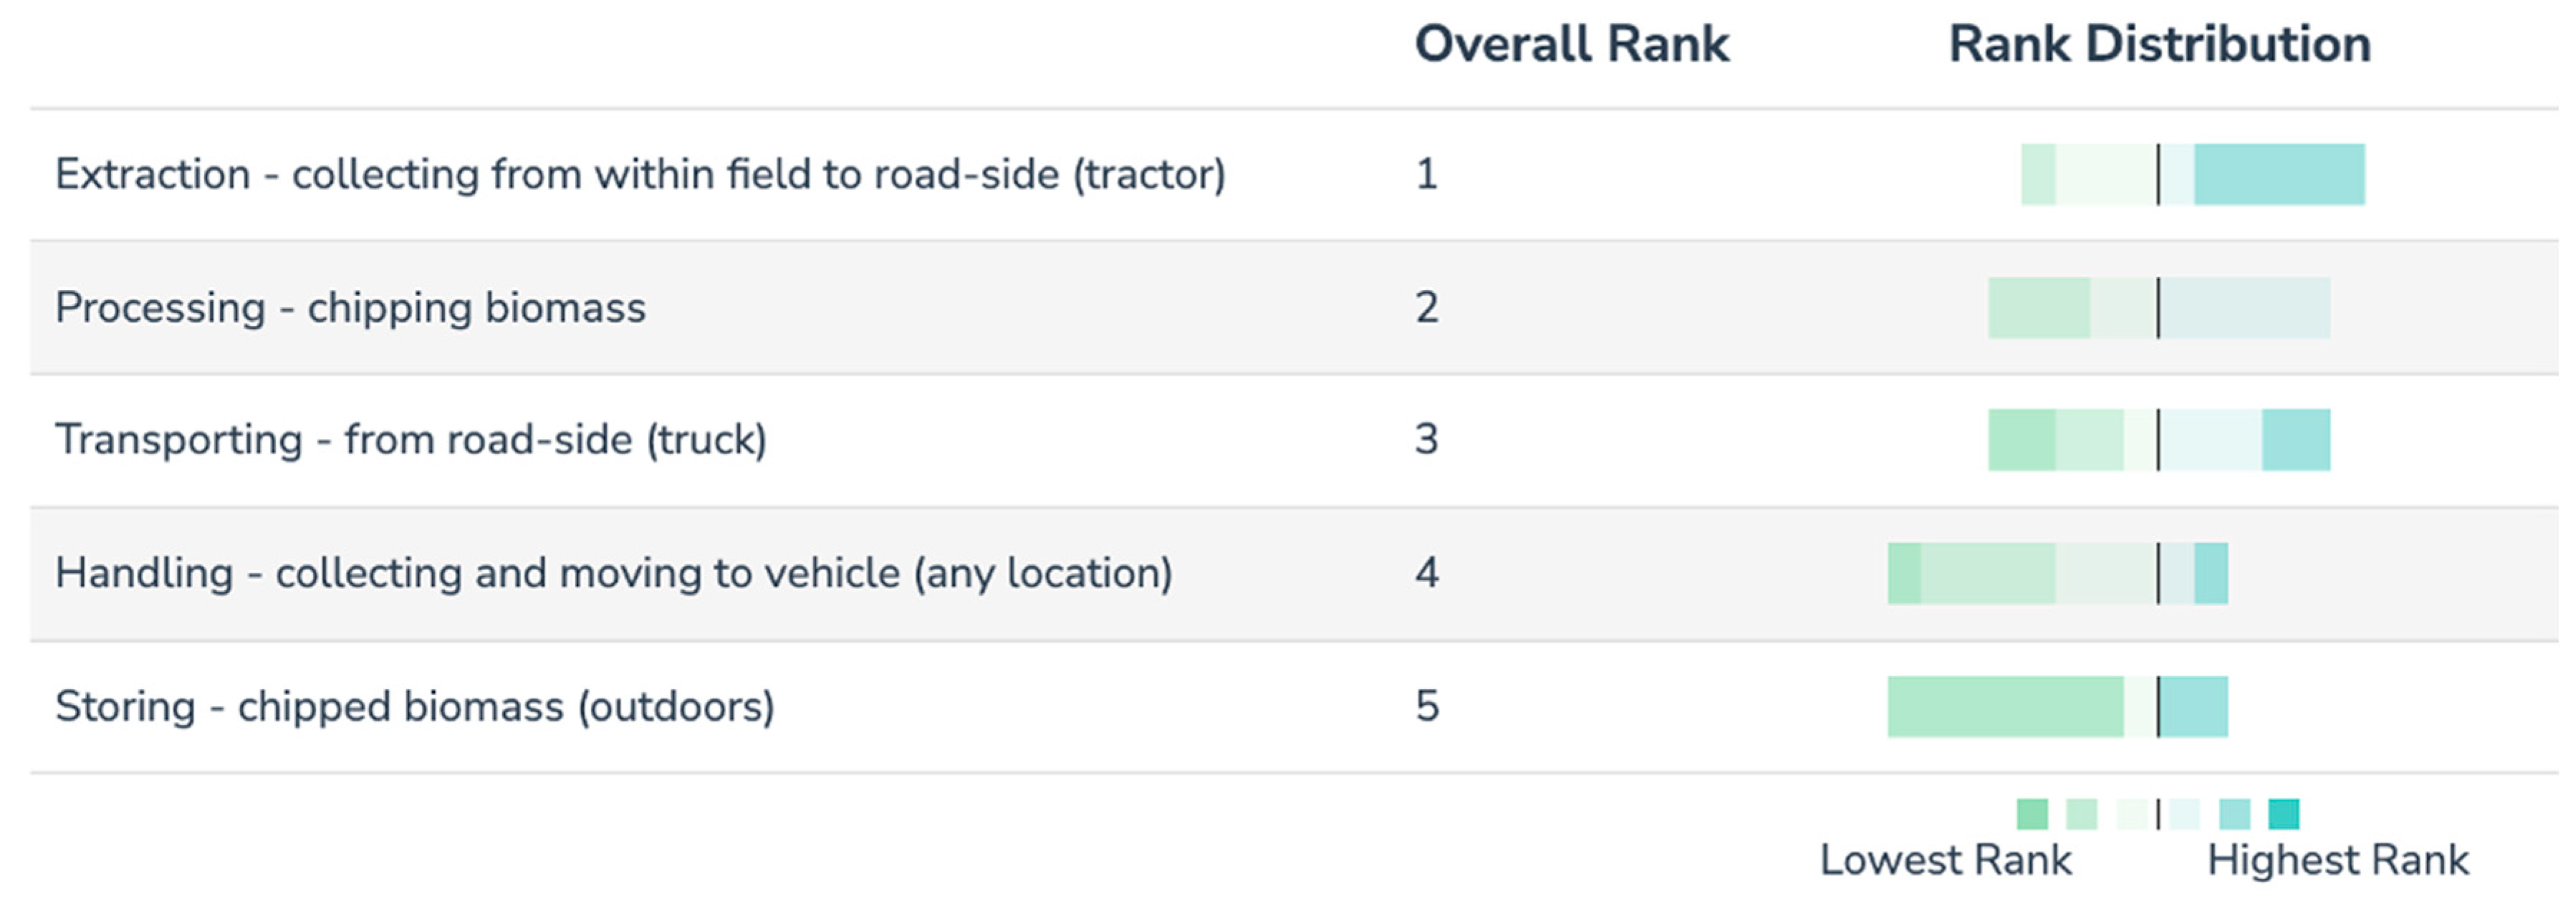
Figure 4.
Ranking of three alternative biomass supply pathways according to consistency ratios (CRs).
Figure 4.
Ranking of three alternative biomass supply pathways according to consistency ratios (CRs).

Table 1.
Biomass supply pathways as opposing alternatives.
| Alternative | Biomass Supply Pathways |
|---|---|
| A1 | Extracting and chipping in the field |
| A2 | Extracting and transporting to roadside, chipping at roadside |
| A3 | Extracting and transporting to roadside, then transporting to conversion facility gate, chipping at conversion plant. |
Table 2.
Comparison scale for ranking relative efficiencies of the biomass supply pathway factors.
| Verbal Expressions | Far more Important | Strongly More Important | Moderately More Important | Somewhat More Important | Equally Important | Somewhat More Important | Moderately More Important | Strongly More Important | Far more Important |
|---|---|---|---|---|---|---|---|---|---|
| Values used in survey | 5 | 3 | 1 | 3 | 5 | ||||
| Saaty’s values used in analysis | 9 | 7 | 5 | 3 | 1 | 1/3 | 1/5 | 1/7 | 1/9 |
| 2,4,6,8 | Intermediate values, for example, a value of 8 means that objective i is midway between strongly and far more important than objective j | ||||||||
Table 3.
Random index (RI) for values of n.
| n | 2 | 3 | 4 | 5 | 6 | 7 | 8 | 9 | 10 |
|---|---|---|---|---|---|---|---|---|---|
| RI | 0 | 0.58 | 0.90 | 1.12 | 1.24 | 1.32 | 1.41 | 1.45 | 1.49 |
Disclaimer/Publisher’s Note: The statements, opinions and data contained in all publications are solely those of the individual author(s) and contributor(s) and not of MDPI and/or the editor(s). MDPI and/or the editor(s) disclaim responsibility for any injury to people or property resulting from any ideas, methods, instructions or products referred to in the content. |
© 2024 by the authors. Licensee MDPI, Basel, Switzerland. This article is an open access article distributed under the terms and conditions of the Creative Commons Attribution (CC BY) license (https://creativecommons.org/licenses/by/4.0/).
Share and Cite
MDPI and ACS Style
Garvie, L.C.; Lee, D.J.; Kulišić, B. Towards a Bioeconomy: Supplying Forest Residues for the Australian Market. Energies 2024, 17, 397. https://doi.org/10.3390/en17020397
AMA Style
Garvie LC, Lee DJ, Kulišić B. Towards a Bioeconomy: Supplying Forest Residues for the Australian Market. Energies. 2024; 17(2):397. https://doi.org/10.3390/en17020397
Chicago/Turabian StyleGarvie, Leanda C., David J. Lee, and Biljana Kulišić. 2024. "Towards a Bioeconomy: Supplying Forest Residues for the Australian Market" Energies 17, no. 2: 397. https://doi.org/10.3390/en17020397
Note that from the first issue of 2016, this journal uses article numbers instead of page numbers. See further details here.