

Using Solar PV and Stationary Storage to Buffer the Impact of Electric Minibus Charging in Grid-Constrained Sub-Saharan Africa
 , and
, and
Abstract
:1. Introduction
- Proposes the integration of two elements at the minibus taxi stations:
- -
- Solar PV plants to utilise the abundant insolation in the region;
- -
- Stationary battery storage to both buffer the load on the grid and maximise solar utilisation,
- Determines the per-taxi sizes of stationary battery storage and solar PV plants that optimise solar utilisation and grid load reduction.
2. Literature Review
2.1. Grid Impact of EV Charging
- Renewable energy sources (RES): Reduce grid impact and increase sustainability [12].
2.2. External Battery Storage and Renewable Energy Integration
2.3. Existing Grid-Impact Simulators
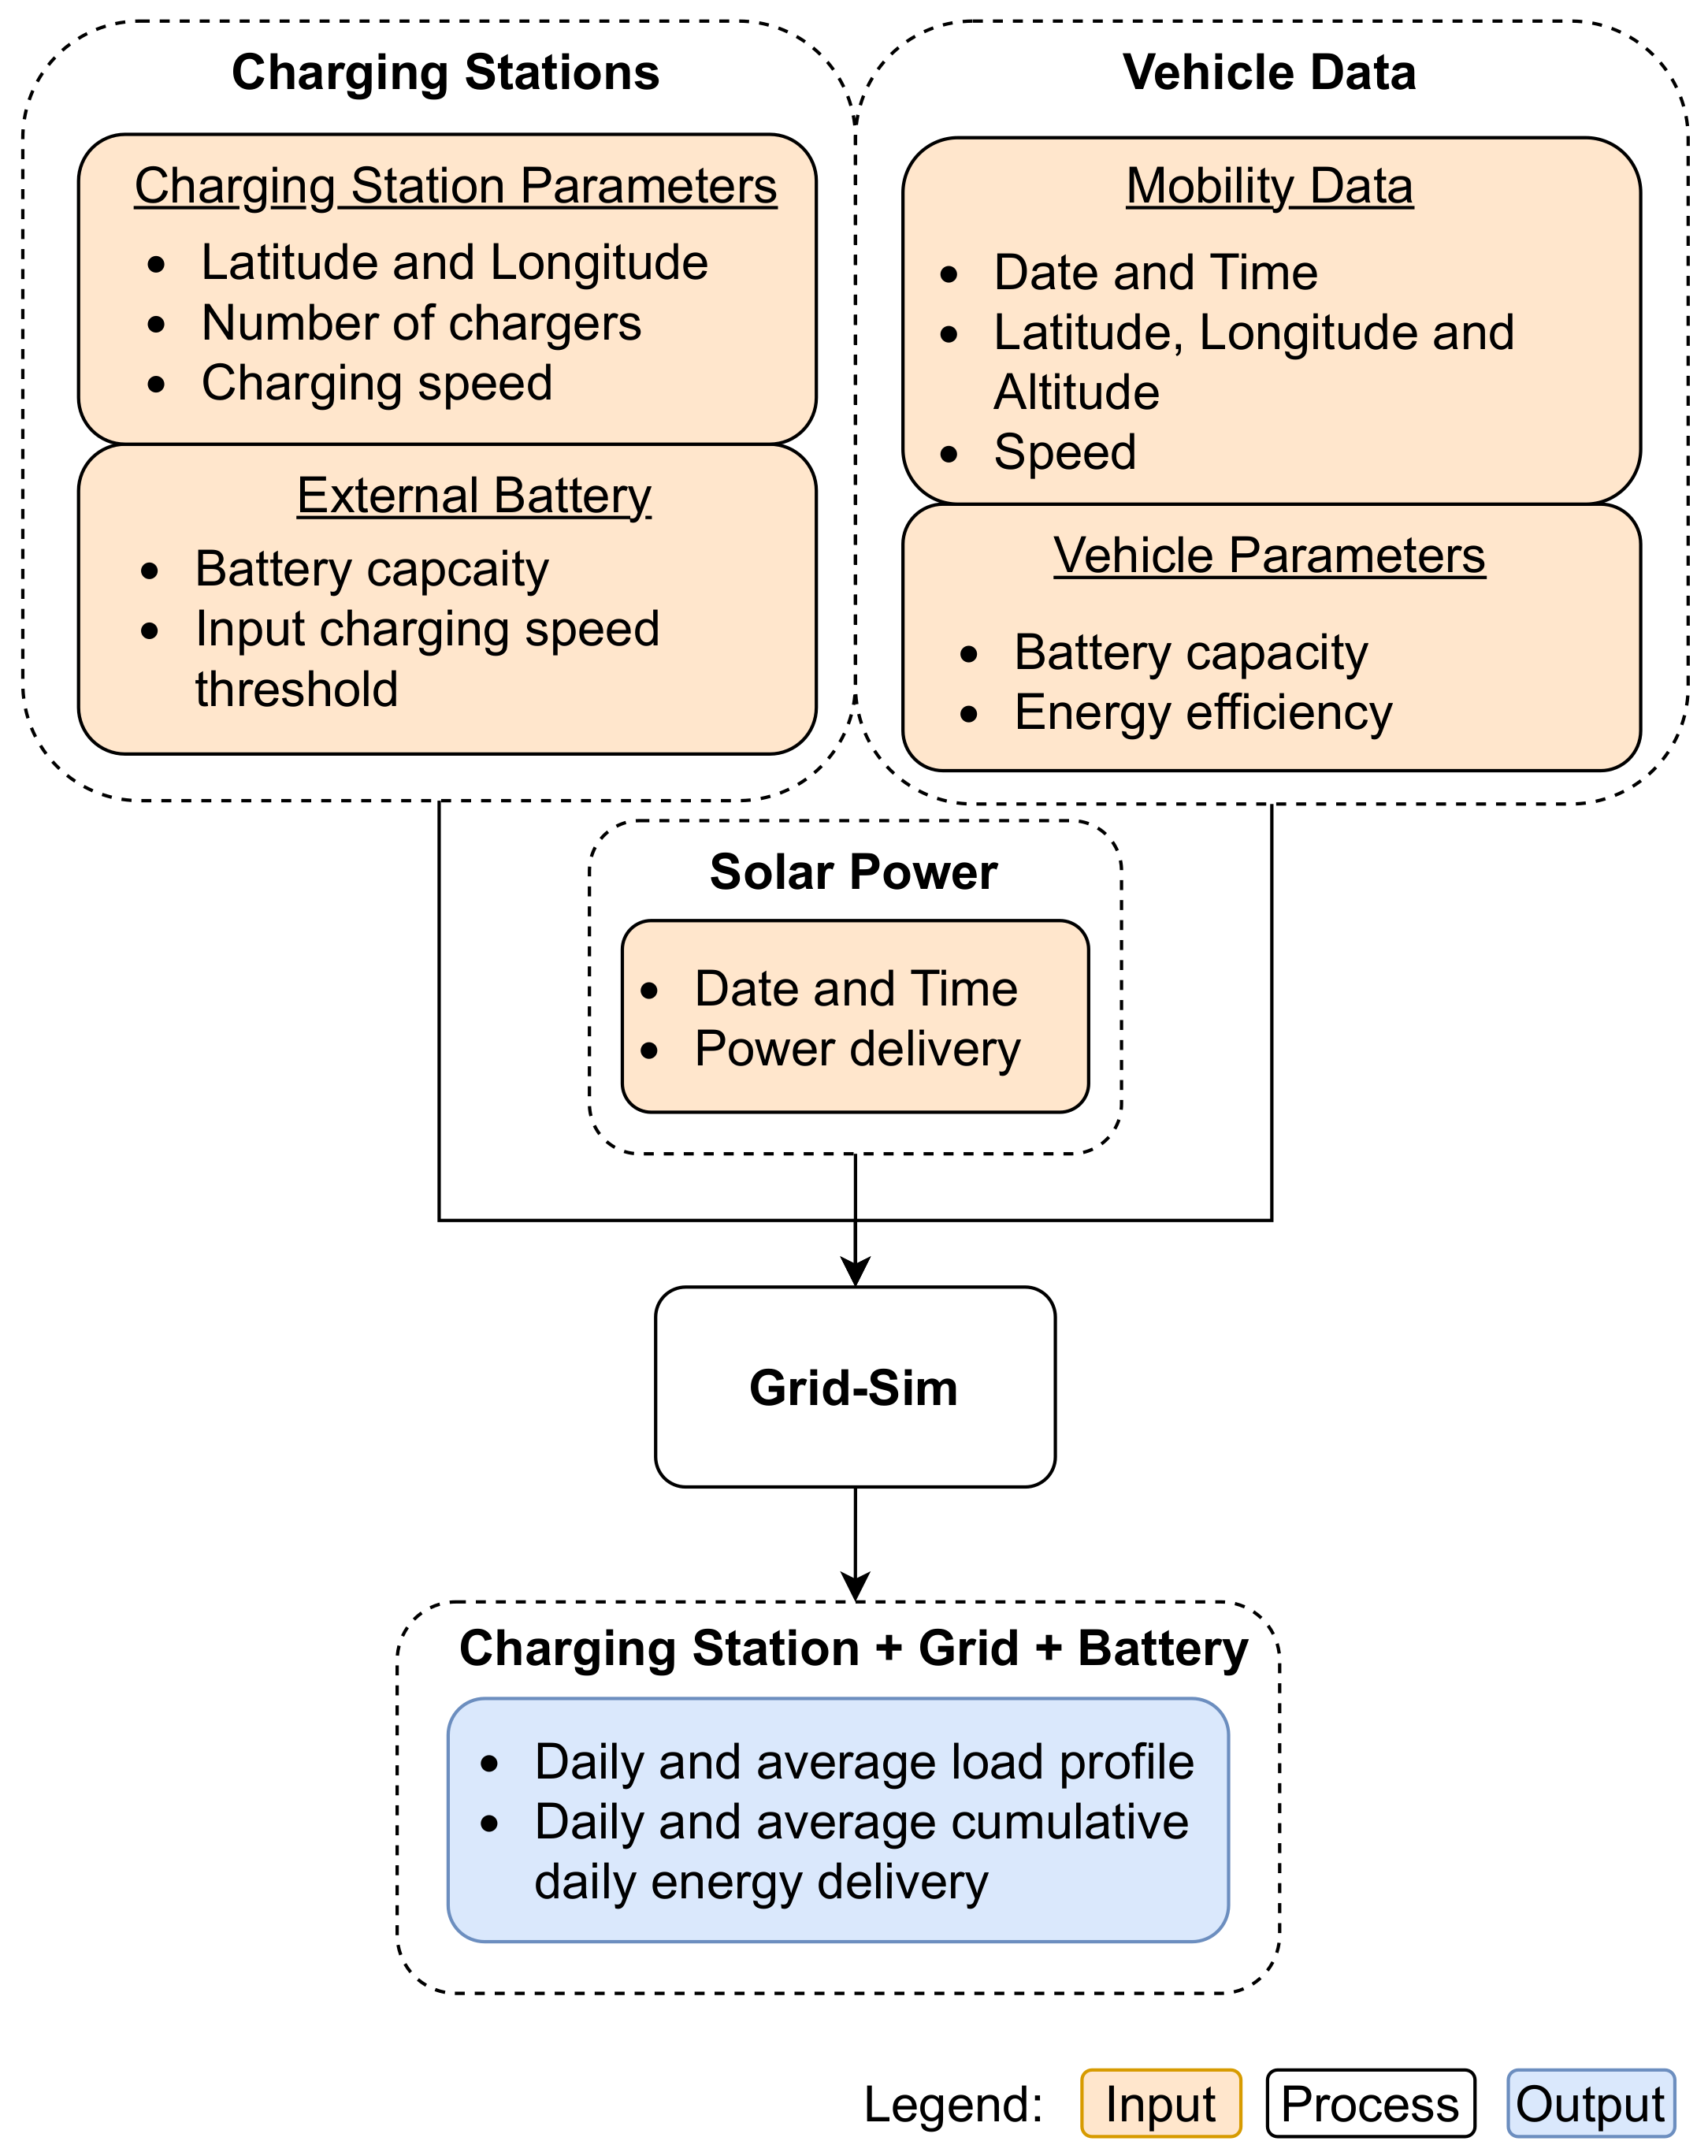
3. Methodology
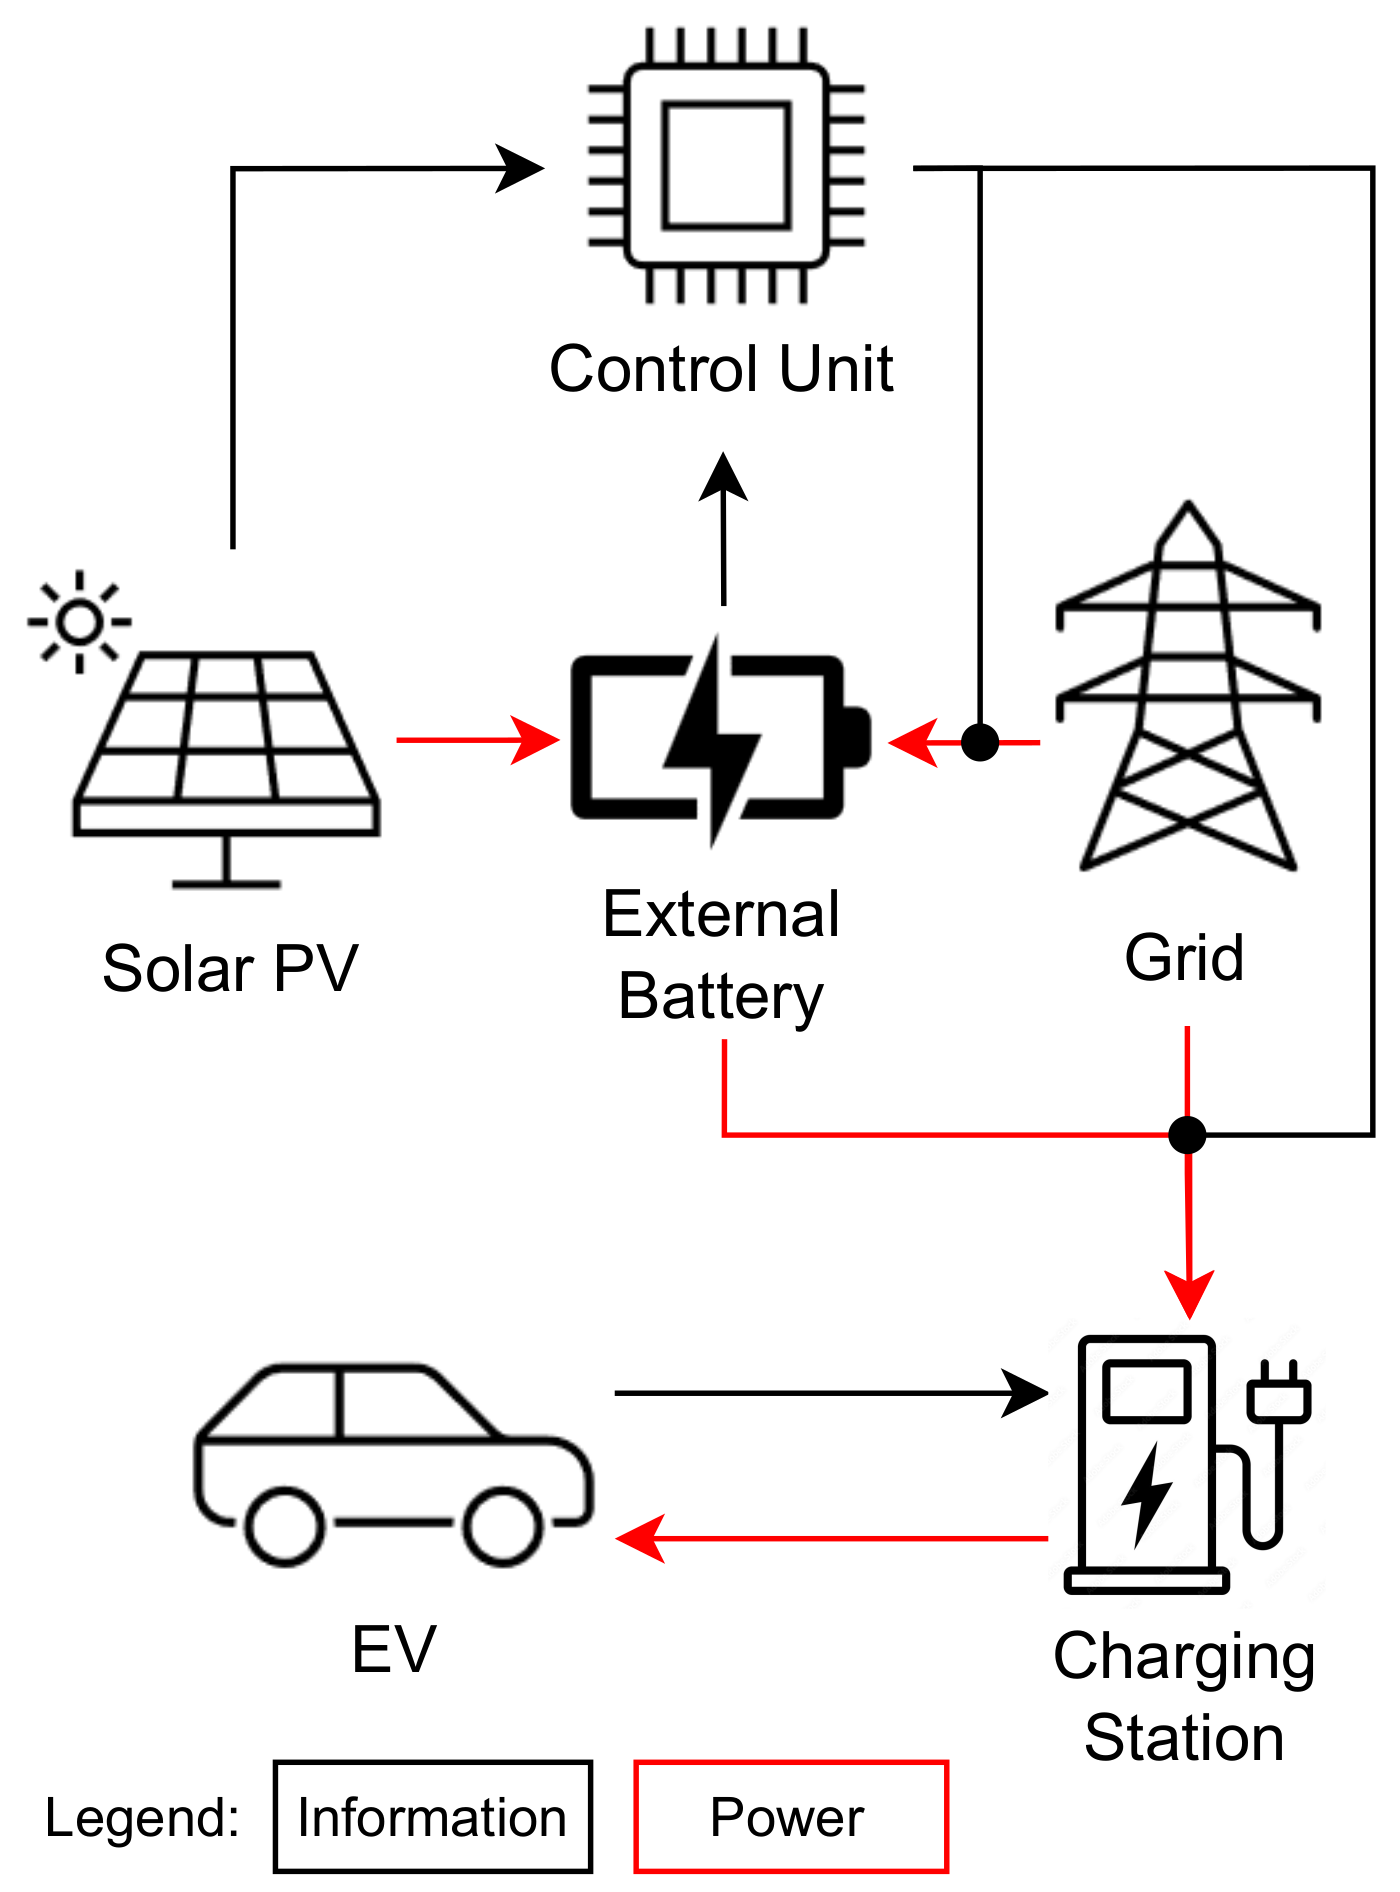
3.1. Grid-Sim
3.2. Input Data
- Start and end location of each journey
- Start and end time of each journey
- Distance travelled between locations
3.2.1. Vehicle Data
3.2.2. Charging Stations
3.2.3. Solar Power
4. Results
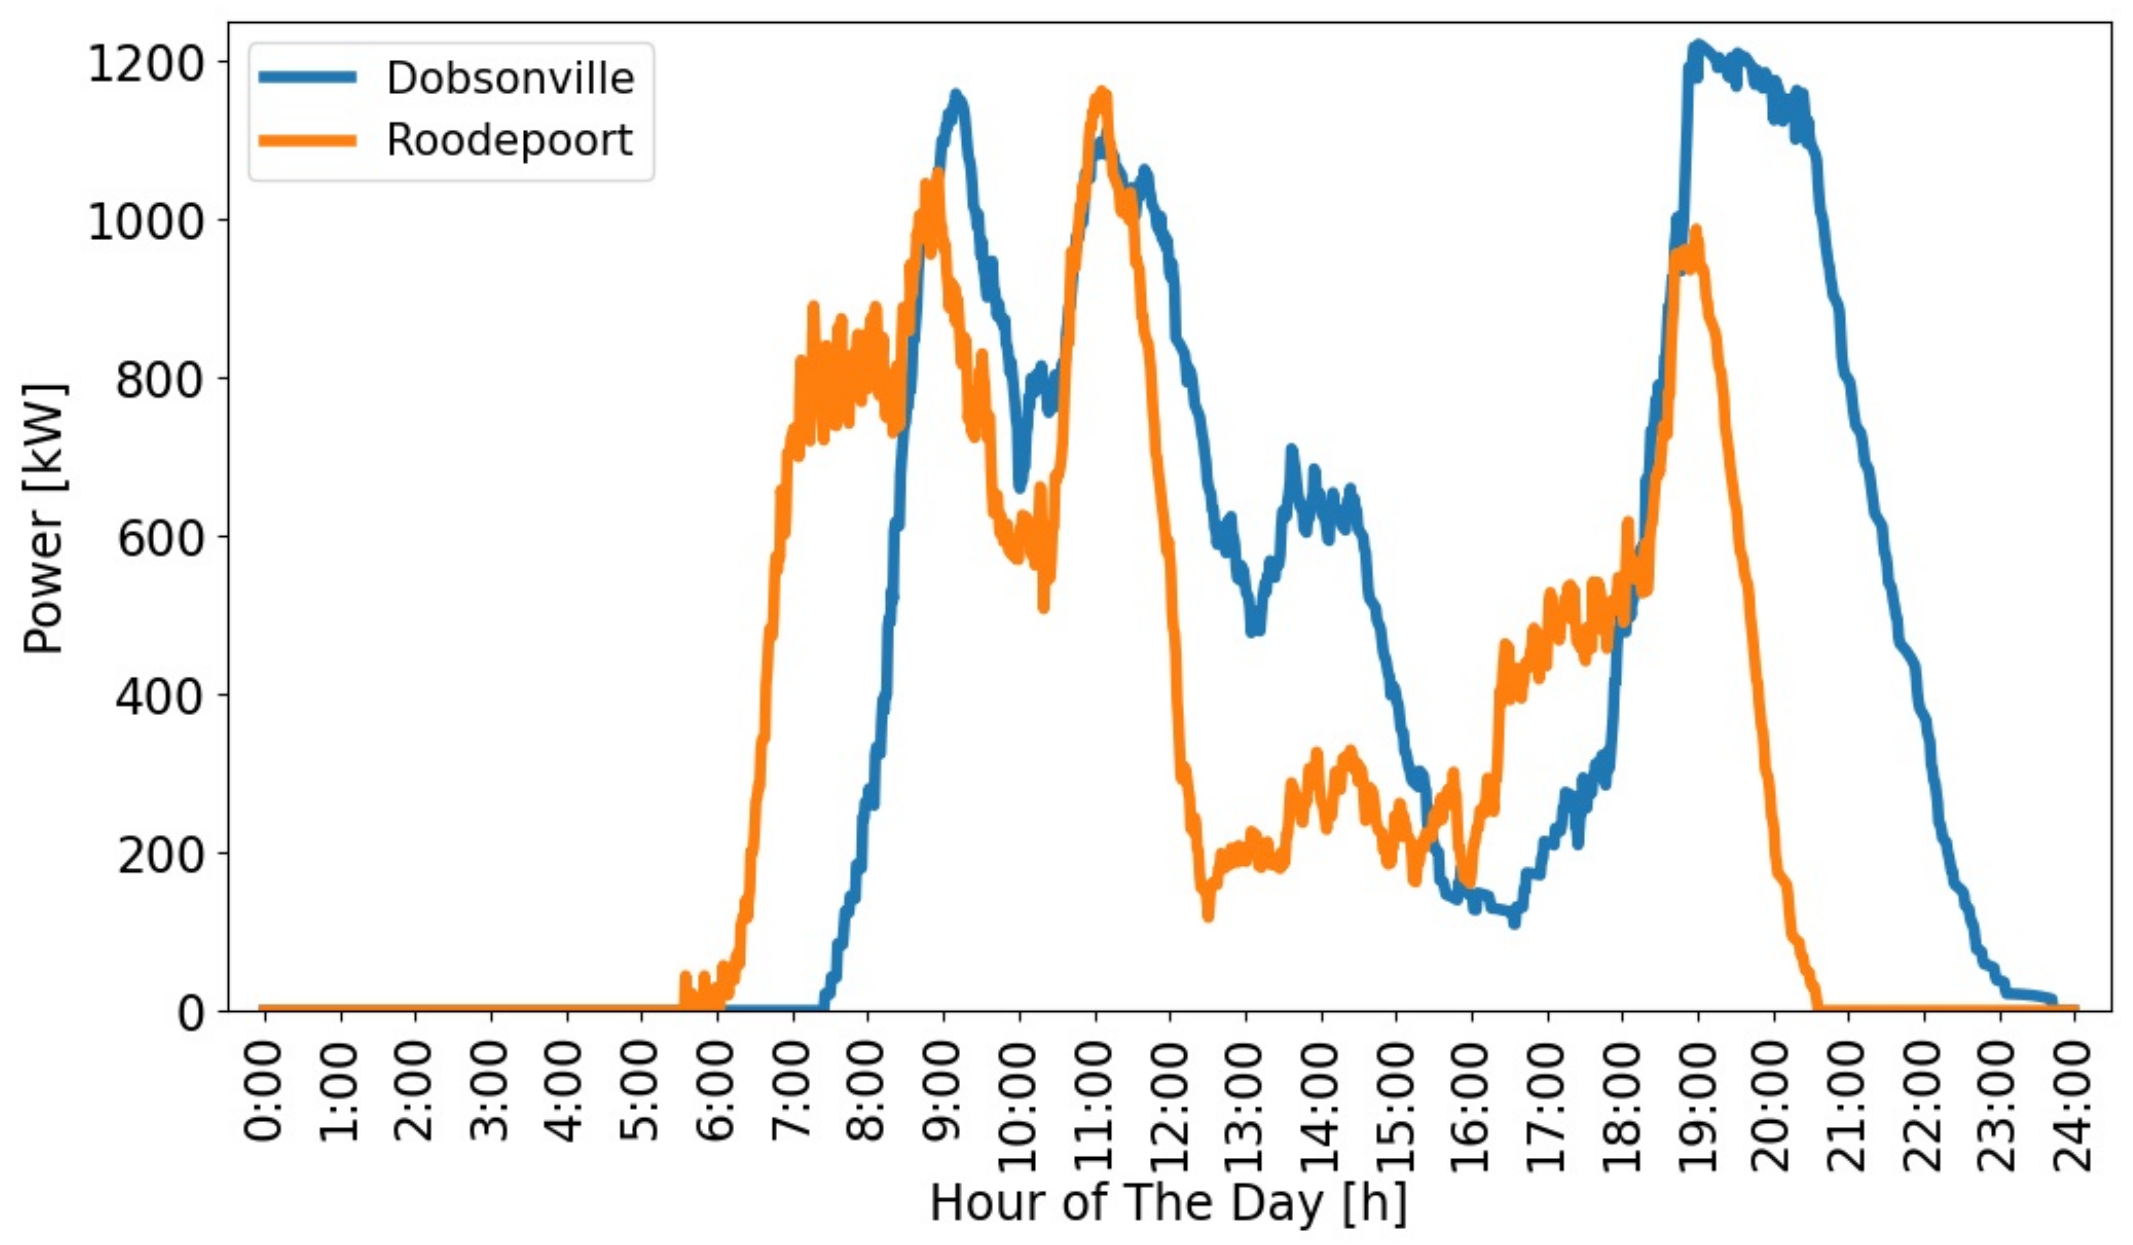
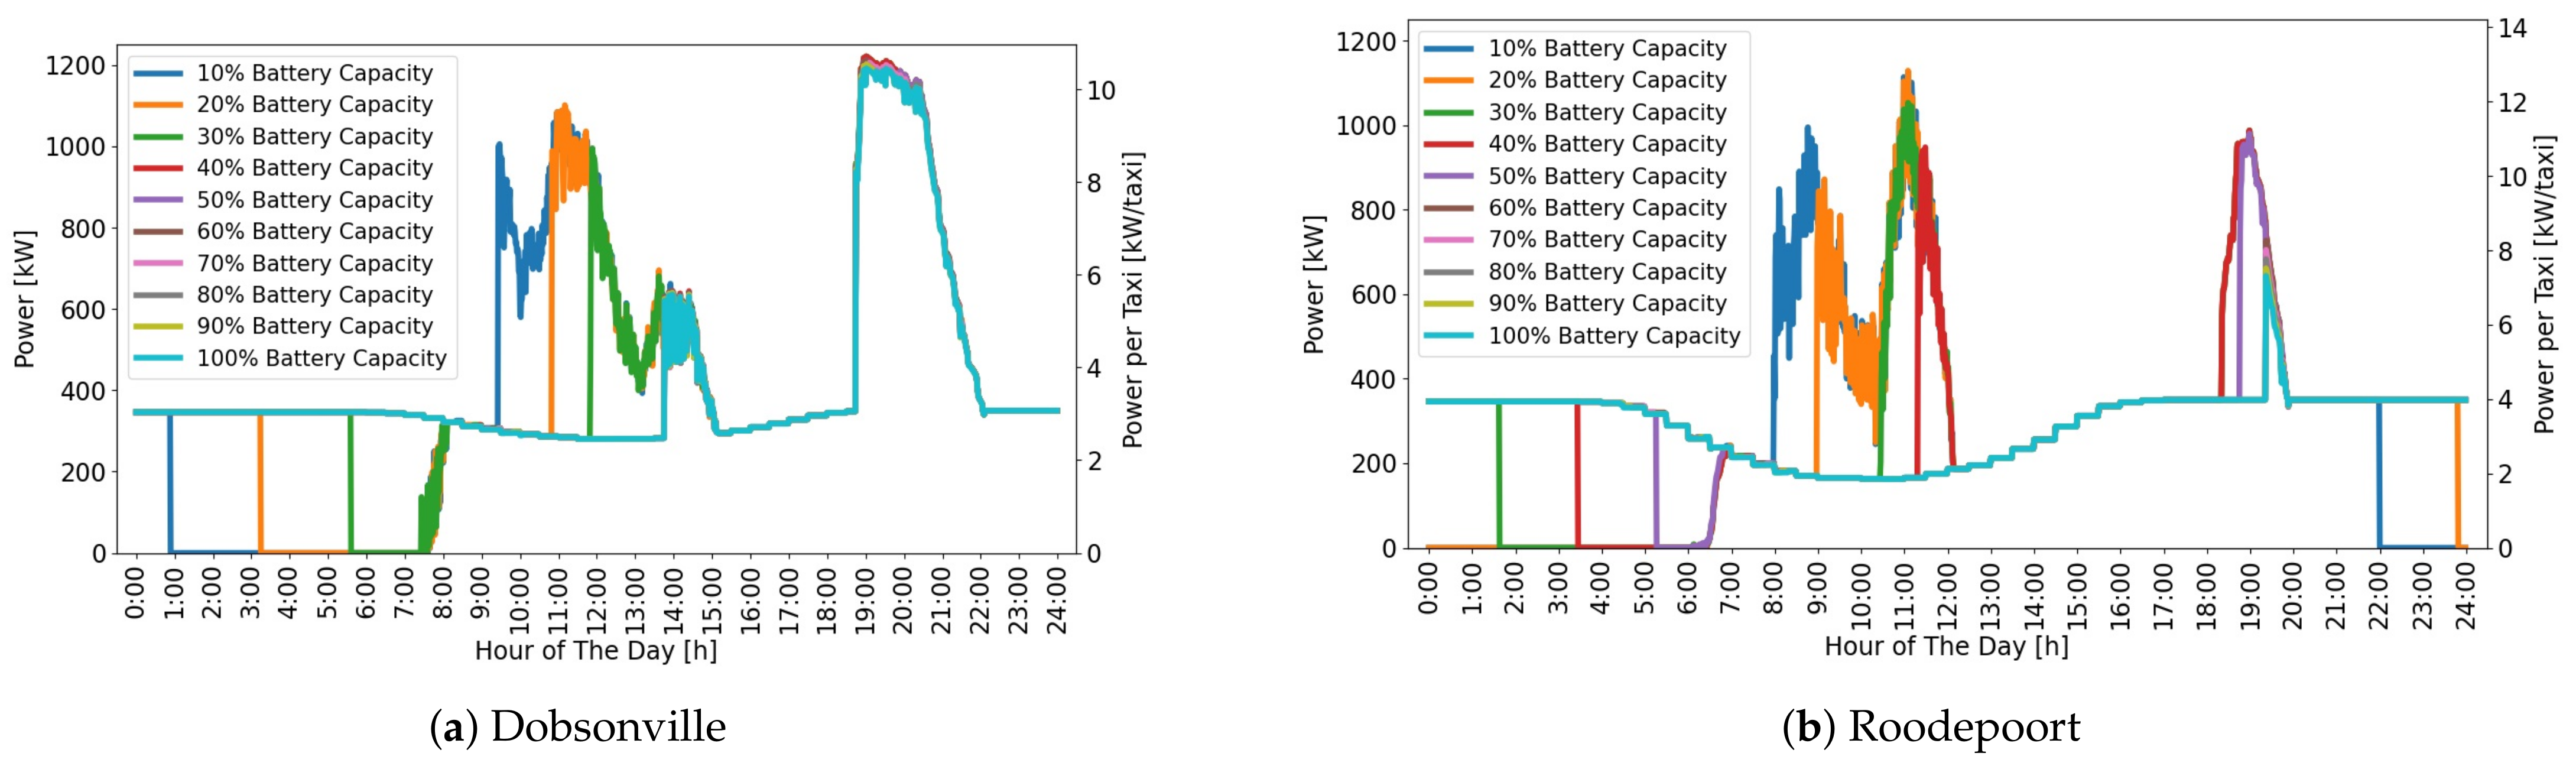
4.1. Roof-Area Solar for Different Battery Sizes
4.2. Total Area Solar
4.3. Sustainability Impact
4.4. Pollution
5. Conclusions
Author Contributions
Funding
Data Availability Statement
Acknowledgments
Conflicts of Interest
Abbreviations
| AC | Alternating Current |
| BESS | Stationary Battery Energy Storage System |
| CO | Carbon Dioxide |
| DC | Direct Current |
| EV | Electric Vehicle |
| FSC | Fast Charging Stations |
| GHG | Greenhouse Gas |
| GPS | Global Positioning System |
| ICE | Internal Combustion Engine |
| OEM | Original Equipment Manufacturer |
| RES | Renewable Energy Sources |
| SAM | System Advisor Model |
| SOC | State of Charge |
| V2G | Vehicle-to-Grid |
References
- Behrens, R.; McCormick, D.; Orero, R.; Ommeh, M.S. Improving paratransit service: Lessons from inter-city matatu cooperatives in Kenya. Transp. Policy 2017, 53, 79–88. [Google Scholar] [CrossRef]
- Askari, S.; Peiravian, F.; Tilahun, N.; Yousefi Baseri, M. Determinants of users’ perceived taxi service quality in the context of a developing country. Transp. Lett. 2021, 13, 125–137. [Google Scholar] [CrossRef]
- Horni, A.; Nagel, K.; Axhausen, K.W. The Multi-Agent Transport Simulation MATSim; Ubiquity Press: London, UK, 2016. [Google Scholar]
- Behrens, R.; McCormick, D.; Mfinanga, D.A. Paratransit in African Cities Operations, Regulation and Reform; Routledge: London, UK, 2015. [Google Scholar]
- SA Taxi. A Focused Partner to the Taxi Industry. 2023. Available online: https://sataxi.co.za/about-sa-taxi (accessed on 27 March 2023).
- Khalid, M.R.; Alam, M.S.; Sarwar, A.; Asghar, M.S.J. A Comprehensive review on electric vehicles charging infrastructures and their impacts on power-quality of the utility grid. eTransportation 2019, 1, 100006. [Google Scholar] [CrossRef]
- Neumann, A.; Joubert, J.W. The “Minibus” Contribution. In The Multi-Agent Transport Simulation MATSim; Horni, A., Nagel, K., Axhausen, K.W., Eds.; Ubiquity Press: London, UK, 2016. [Google Scholar] [CrossRef]
- Evans, J.; O’Brien, J.T.; Ng, B.C. Towards a geography of informal transport: Mobility, infrastructure and urban sustainability from the back of a motorbike. Trans. Inst. Br. Geogr. 2018, 43, 674–688. [Google Scholar] [CrossRef]
- Collett, K.A.; Hirmer, S. Data needed to decarbonize paratransit in Sub-Saharan Africa. Nat. Sustain. 2021, 4, 562–564. [Google Scholar] [CrossRef]
- Amegah, A.K.; Agyei-Mensah, S. Urban air pollution in Sub-Saharan Africa: Time for action. Environ. Pollut. 2017, 220 Pt A, 738–743. [Google Scholar] [CrossRef]
- Dalal, S.; Beunza, J.J.; Volmink, J.; Adebamowo, C.A.; Bajunirwe, F.; Njelekela, M.; Mozaffarian, D.; Fawzi, W.W.; Willett, W.C.; Adami, H.O.; et al. Non-communicable diseases in sub-Saharan Africa: What we know now. Int. J. Epidemiol. 2011, 40, 885–901. [Google Scholar] [CrossRef]
- Khalid, M.R.; Khan, I.A.; Hameed, S.; Asghar, M.S.J.; Ro, J. A Comprehensive Review on Structural Topologies, Power Levels, Energy Storage Systems, and Standards for Electric Vehicle Charging Stations and Their Impacts on Grid. IEEE Access 2021, 9, 128069–128094. [Google Scholar] [CrossRef]
- United States Environmental Protection Agency. Greenhouse Gas Emissions from a Typical Passenger Vehicle; United States Environmental Protection Agency: Washington, DC, USA, 2023.
- Winkler, S.; Anderson, J.; Garza, L.; Ruona, W.; Vogt, R.; Wallington, T. Vehicle criteria pollutant (PM, NOx, CO, HCs) emissions: How low should we go? NPJ Clim. Atmos. Sci. 2018, 1, 26. [Google Scholar] [CrossRef]
- Zinkernagel, R.; Evans, J.; Neij, L. Applying the SDGs to Cities: Business as Usual or a New Dawn? Sustainability 2018, 10, 3201. [Google Scholar] [CrossRef]
- Yu, H.; Niu, S.; Shang, Y.; Shao, Z.; Jia, Y.; Jian, L. Electric vehicles integration and vehicle-to-grid operation in active distribution grids: A comprehensive review on power architectures, grid connection standards and typical applications. Renew. Sustain. Energy Rev. 2022, 168, 112812. [Google Scholar] [CrossRef]
- Abraham, C.J.; Rix, A.J.; Ndibatya, I.; Booysen, M.J. Ray of hope for sub-Saharan Africa’s paratransit: Solar charging of urban electric minibus taxis in South Africa. Energy Sustain. Dev. 2021, 64, 118–127. [Google Scholar] [CrossRef]
- Ministry, F.E. EU Member States Pave Way for Zero-Emission Cars from 2035-BMUV; Federal MINISTRY for the Environment Nature Conservation Nuclear Safety and Consumer Protection: Bonn, Germany, 2023.
- Du, J.; Ouyang, M.; Chen, J. Prospects for Chinese electric vehicle technologies in 2016–2020: Ambition and rationality. Energy 2017, 120, 584–596. [Google Scholar] [CrossRef]
- Weiss, M.; Cloos, K.C.; Helmers, E. Energy efficiency trade-offs in small to large electric vehicles. Environ. Sci. Eur. 2020, 32, 1–17. [Google Scholar]
- Li, Y.; Davis, C.; Lukszo, Z.; Weijnen, M.P.C. Electric vehicle charging in China’s power system: Energy, economic and environmental trade-offs and policy implications. Appl. Energy 2016, 173, 535–554. [Google Scholar] [CrossRef]
- Tech, B. South Africa has seen a 40% increase in load shedding—and it’s set to get worse. BusinessTech, 7 June 2022. [Google Scholar]
- Yu, H.; Lei, X.; Niu, S.; Shao, Z.; Jian, L. Enhancing electric vehicle penetration and grid operation performance in old residential communities through hybrid AC/DC microgrid reconstruction. Appl. Energy 2023, 347, 121459. [Google Scholar] [CrossRef]
- Giliomee, J.H.; Booysen, M.J. Grid-Sim: Simulating Electric Fleet Charging with Renewable Generation and Battery Storage. World Electr. Veh. J. 2023, 14, 274. [Google Scholar] [CrossRef]
- Clean Technica. South Africa Now Has Over 10 GW of Wind & Solar Generation Capacity. 2023. Available online: https://cleantechnica.com/2023/08/03/south-africa-now-has-over-10-gw-of-wind-solar-generation-capacity/ (accessed on 4 January 2023).
- Baker, L.; Phillips, J. Tensions in the transition: The politics of electricity distribution in South Africa. Environ. Plan. C Polit. Space 2018, 37, 177–196. [Google Scholar] [CrossRef]
- Sundström, O.; Binding, C. Flexible Charging Optimization for Electric Vehicles Considering Distribution Grid Constraints. IEEE Trans. Smart Grid 2012, 3, 26–37. [Google Scholar] [CrossRef]
- Dang, Q. Electric Vehicle (EV) Charging Management and Relieve Impacts in Grids. In Proceedings of the 2018 9th IEEE International Symposium on Power Electronics for Distributed Generation Systems (PEDG), Charlotte, NC, USA, 25–28 June 2018; pp. 1–5. [Google Scholar]
- Liu, J. Electric vehicle charging infrastructure assignment and power grid impacts assessment in Beijing. Energy Policy 2012, 51, 544–557. [Google Scholar] [CrossRef]
- Giliomee, J.H.; Booysen, M.J. Decarbonising Africa’s long-distance paratransit: Battery swapping with solar-charged minibus trailers. SSRN Electron. J. 2023, 117, 103647. [Google Scholar] [CrossRef]
- Wang, L.; Qin, Z.; Slangen, T.; Bauer, P.; van Wijk, T. Grid Impact of Electric Vehicle Fast Charging Stations: Trends, Standards, Issues and Mitigation Measures—An Overview. IEEE Open J. Power Electron. 2021, 2, 56–74. [Google Scholar] [CrossRef]
- Meyer, D.; Wang, J. Integrating Ultra-Fast Charging Stations within the Power Grids of Smart Cities: A Review. Optim. Control. 2018, 1, 3–10. [Google Scholar] [CrossRef]
- Rajendran, G.; Vaithilingam, C.A.; Misron, N.B.; Naidu, K.; Ahmed, R. A comprehensive review on system architecture and international standards for electric vehicle charging stations. J. Energy Storage 2021, 42, 103099. [Google Scholar] [CrossRef]
- Yilmaz, M.; Krein, P.T. Review of Battery Charger Topologies, Charging Power Levels, and Infrastructure for Plug-In Electric and Hybrid Vehicles. IEEE Trans. Power Electron. 2013, 28, 2151–2169. [Google Scholar] [CrossRef]
- Mehta, R.; Verma, P.P.; Srinivasan, D.; Yang, J. Double-layered intelligent energy management for optimal integration of plug-in electric vehicles into distribution systems. Appl. Energy 2019, 233–234, 146–155. [Google Scholar] [CrossRef]
- Mehta, R.; Srinivasan, D.; Khambadkone, A.M.; Yang, J.; Trivedi, A. Smart Charging Strategies for Optimal Integration of Plug-In Electric Vehicles Within Existing Distribution System Infrastructure. IEEE Trans. Smart Grid 2018, 9, 299–312. [Google Scholar] [CrossRef]
- Kucevic, D.; Englberger, S.; Sharma, A.; Trivedi, A.; Tepe, B.; Schachler, B.; Hesse, H.C.; Srinivasan, D.; Jossen, A. Reducing grid peak load through the coordinated control of battery energy storage systems located at electric vehicle charging parks. Appl. Energy 2021, 295, 116936. [Google Scholar] [CrossRef]
- Pudjianto, D.; Djapic, P.; Aunedi, M.; Gan, C.K.; Strbac, G.; Huang, S.; Infield, D. Smart control for minimizing distribution network reinforcement cost due to electrification. Energy Policy 2013, 52, 76–84. [Google Scholar] [CrossRef]
- Diouf, B.; Pode, R. Potential of lithium-ion batteries in renewable energy. Renew. Energy 2015, 76, 375–380. [Google Scholar] [CrossRef]
- Booysen, M.J.; Abraham, C.J.; Rix, A.J.; Giliomee, J.H. Electrification of minibus taxis in the shadow of load shedding and energy scarcity. S. Afr. J. Sci. 2022, 118, 1–5. [Google Scholar] [CrossRef] [PubMed]
- Schücking, M.; Jochem, P.; Fichtner, W.; Wollersheim, O.; Stella, K. Charging strategies for economic operations of electric vehicles in commercial applications. Transp. Res. Part Transp. Environ. 2017, 51, 173–189. [Google Scholar] [CrossRef]
- Lopes, J.A.P.; Soares, F.J.; Almeida, P.M.R. Integration of Electric Vehicles in the Electric Power System. Proc. IEEE 2011, 99, 168–183. [Google Scholar] [CrossRef]
- Deb, S.; Tammi, K.; Kalita, K.; Mahanta, P. Impact of Electric Vehicle Charging Station Load on Distribution Network. Energies 2018, 11, 178. [Google Scholar] [CrossRef]
- Gamboa, G.; Hamilton, C.; Kerley, R.; Elmes, S.; Arias, A.; Shen, J.; Batarseh, I. Control strategy of a multi-port, grid connected, direct-DC PV charging station for plug-in electric vehicles. In Proceedings of the 2010 IEEE Energy Conversion Congress and Exposition, Atlanta, GA, USA, 12–16 September 2010; pp. 1173–1177. [Google Scholar]
- Shariff, S.M.; Alam, M.S.; Ahmad, F.; Rafat, Y.; Asghar, M.S.J.; Khan, S. System Design and Realization of a Solar-Powered Electric Vehicle Charging Station. IEEE Syst. J. 2020, 14, 2748–2758. [Google Scholar] [CrossRef]
- Fakour, H.; Imani, M.; Lo, S.L.; Yuan, M.; Chen, C.K.; Mobasser, S.; Muangthai, I. Evaluation of solar photovoltaic carport canopy with electric vehicle charging potential. Sci. Rep. 2023, 13, 2136. [Google Scholar] [CrossRef]
- Department of Energy. Renewable Energy Solar-Power. 2019. Available online: https://www.energy.gov.za/files/esources/renewables/r_solar.html (accessed on 27 March 2023).
- EnGoPlanet. UK and Solar Energy. 2021. Available online: https://www.engoplanet.com/single-post/uk-and-solar-energy (accessed on 27 March 2023).
- Solar Energy Local. Solar Energy Analysis for New York, NY. 2023. Available online: https://www.solarenergylocal.com/states/new-york/ (accessed on 27 March 2023).
- Funke, S.Á.; Jochem, P.; Ried, S.; Gnann, T. Fast charging stations with stationary batteries: A techno-economic comparison of fast charging along highways and in cities. Transp. Res. Procedia 2020, 48, 3832–3849. [Google Scholar] [CrossRef]
- Fernández, L.P.; Román, T.G.S.; Cossent, R.; Domingo, C.M.; Frías, P. Assessment of the Impact of Plug-in Electric Vehicles on Distribution Networks. IEEE Trans. Power Syst. 2011, 26, 206–213. [Google Scholar] [CrossRef]
- Verzijlbergh, R.A.; Grond, M.O.W.; Lukszo, Z.; Slootweg, J.G.; Ilić, M.D. Network Impacts and Cost Savings of Controlled EV Charging. IEEE Trans. Smart Grid 2012, 3, 1203–1212. [Google Scholar] [CrossRef]
- Bartolucci, L.; Cordiner, S.; Mulone, V.; Santarelli, M.; Ortenzi, F.; Pasquali, M. Pv Assisted Electric Vehicle Charging Station Considering the Integration of Stationary First- or Second-Life Battery Storage. SSRN Electron. J. 2022, 383, 135426. [Google Scholar] [CrossRef]
- Bracco, S.; Delfino, F.; Longo, M.; Siri, S. Electric Vehicles and Storage Systems Integrated within a Sustainable Urban District Fed by Solar Energy. J. Adv. Transp. 2019, 2019, 1–19. [Google Scholar] [CrossRef]
- Eid, A.; Mohammed, O.; El-kishky, H. Efficient operation of battery energy storage systems, electric-vehicle charging stations and renewable energy sources linked to distribution systems. J. Energy Storage 2022, 55, 105644. [Google Scholar] [CrossRef]
- Krim, Y.; Sechilariu, M.; Locment, F. PV Benefits Assessment for PV-Powered Charging Stations for Electric Vehicles. Appl. Sci. 2021, 11, 4127. [Google Scholar] [CrossRef]
- Girard, A.; Roberts, C.; Simon, F.; Ordoñez, J. Solar electricity production and taxi electrical vehicle conversion in Chile. J. Clean. Prod. 2019, 210, 1261–1269. [Google Scholar] [CrossRef]
- Park, E.; Kwon, S.J. Renewable electricity generation systems for electric-powered taxis: The case of Daejeon metropolitan city. Renew. Sustain. Energy Rev. 2016, 58, 1466–1474. [Google Scholar] [CrossRef]
- World Bank. Paratransit Decarbonization in South Africa; Technical Report; World Bank: Pretoria, South Arica, 2022. [Google Scholar]
- Miri, I.; Fotouhi, A.; Ewin, N. Electric vehicle energy consumption modelling and estimation—A case study. Int. J. Energy Res. 2020, 45, 501–520. [Google Scholar] [CrossRef]
- Collett, K.A.; Hirmer, S.A.; Dalkmann, H.; Crozier, C.; Mulugetta, Y.; McCulloch, M.D. Can electric vehicles be good for Sub-Saharan Africa? Energy Strateg. Rev. 2021, 38, 100722. [Google Scholar] [CrossRef]
- Tara Dongfeng. Dongfeng Electric 15 Seater Mini Van (RHD); Tara Dongfeng: Hertfordshire, UK, 2021. [Google Scholar]
- Higer. Higer H5C EV Specifications; Higer: Suzhou, China, 2022. [Google Scholar]
- Abraham, C.J.; Rix, A.; Booysen, M.J. Aligned Simulation Models for Simulating Africa’s Electric Minibus Taxis. World Electr. Veh. J. 2023, 14, 230. [Google Scholar] [CrossRef]
- Solar Reviews. JA Solar Technology JAM78S10-450/MR Solar Panel; Solar Reviews: Denver CO, USA, 2020. [Google Scholar]
- NREL. NSRDB: National Solar Radiation Database; NREL: Golden, CO, USA, 2019.
- National Renewable Energy Laboratory. System Advisor Model Version 2020.11.29; National Renewable Energy Laboratory: Golden, CO, USA, 2020.
- Pepkor. Operational Sustainability: Carbon Footprint Summary. 2022. Available online: https://www.pepkor.co.za/wp-content/uploads/2022/05/Carbon-footprint-summary-2021.pdf (accessed on 29 March 2023).


| Taxi Rank | Energy [kWh] |
|---|---|
| Dobsonville | 9959 |
| Roodepoort | 7680 |
| Battery Capacity | Energy [kWh] (per Taxi) | |
|---|---|---|
| Increment [%] | Dobsonville | Roodepoort |
| 0 [Reference] | 9959 (87.4) | 7680 (87.3) |
| 10 | 9767 (85.7) | 6722 (76.4) |
| 20 | 9876 (86.6) | 6796 (77.2) |
| 30 | 9973 (87.5) | 6868 (78.0) |
| 40 | 10,085 (88.5) | 6934 (78.8) |
| 50 | 10,075 (88.3) | 7013 (79.7) |
| 60 | 10,065 (88.3) | 7062 (80.3) |
| 70 | 10,055 (88.2) | 7055 (80.2) |
| 80 | 10,045 (88.1) | 7048 (80.1) |
| 90 | 10,036 (88.0) | 7041 (80.0) |
| 100 | 10,026 (87.9) | 7034 (79.9) |
| Battery Capacity | Energy [kWh] (per Taxi) | |
|---|---|---|
| Increment [%] | Dobsonville | Roodepoort |
| 0 [Reference] | 9959 (87.4) | 7680 (87.3) |
| 10 | 8286 (72.7) | 4043 (45.9) |
| 20 | 8369 (73.4) | 4058 (46.1) |
| 30 | 8448 (74.1) | 4101 (46.6) |
| 40 | 8523 (74.8) | 4134 (47.0) |
| 50 | 8513 (74.7) | 4142 (47.1) |
| 60 | 8503 (74.6) | 4138 (47.0) |
| 70 | 8493 (74.5) | 4135 (47.0) |
| 80 | 8483 (74.4) | 4133 (47.0) |
| 90 | 8474 (74.3) | 4130 (46.9) |
| 100 | 8464 (72.2) | 4128 (46.9) |
Disclaimer/Publisher’s Note: The statements, opinions and data contained in all publications are solely those of the individual author(s) and contributor(s) and not of MDPI and/or the editor(s). MDPI and/or the editor(s) disclaim responsibility for any injury to people or property resulting from any ideas, methods, instructions or products referred to in the content. |
© 2024 by the authors. Licensee MDPI, Basel, Switzerland. This article is an open access article distributed under the terms and conditions of the Creative Commons Attribution (CC BY) license (https://creativecommons.org/licenses/by/4.0/).
Share and Cite
Giliomee, J.H.; Pretorius, B.G.; Füßl, L.; Thomas, B.; Booysen, M.J. Using Solar PV and Stationary Storage to Buffer the Impact of Electric Minibus Charging in Grid-Constrained Sub-Saharan Africa. Energies 2024, 17, 457. https://doi.org/10.3390/en17020457
Giliomee JH, Pretorius BG, Füßl L, Thomas B, Booysen MJ. Using Solar PV and Stationary Storage to Buffer the Impact of Electric Minibus Charging in Grid-Constrained Sub-Saharan Africa. Energies. 2024; 17(2):457. https://doi.org/10.3390/en17020457
Chicago/Turabian StyleGiliomee, Johan H., Brendan G. Pretorius, Larissa Füßl, Bernd Thomas, and Marthinus J. Booysen. 2024. "Using Solar PV and Stationary Storage to Buffer the Impact of Electric Minibus Charging in Grid-Constrained Sub-Saharan Africa" Energies 17, no. 2: 457. https://doi.org/10.3390/en17020457