
DC Active Damper Control Strategy Based on Resonance Suppression Effectiveness Evaluation Method

1
New Smart City High-Quality Power Supply Joint Laboratory of China Southern Power Grid, Shenzhen Power Supply Co., Ltd., Shenzhen 518020, China
2
School of Electrical and Electronic Engineering, North China Electric Power University, Beijing 102206, China
*
Author to whom correspondence should be addressed.
Energies 2024, 17(2), 480; https://doi.org/10.3390/en17020480
Submission received: 12 December 2023
/
Revised: 14 January 2024
/
Accepted: 15 January 2024
/
Published: 18 January 2024
(This article belongs to the Special Issue Digital Twin Technology in Energy and Environmental Sector)
Abstract
:With the complication of the power system, features of the resonance interaction behave diversely and pose a threat to the effectiveness of the resonance suppression strategies. Existing resonance suppression strategies are usually designed for specific scenarios which are in close correlation with the impedance frequency-amplitude distribution, and their adaptability under different scenarios is hard to evaluate. In this paper, the resonance suppression domain of a DC distribution network is derived based on the node impedance variation before/after the resonance is suppressed. The derived criterion takes the admittance change of the resonance suppression strategies as variables, and the conservative/ideal suppression domain criteria are defined. On this basis, a method for evaluating the effectiveness of resonance suppression strategies is proposed, which simplifies the evaluation process and avoids a complicated matrix inverse process to each resonance suppression strategy during the system impedance calculation. Furthermore, a DC active damper control strategy based on the resonance suppression strategy evaluation is proposed, and the proposed strategy could suppress resonances under different scenarios by a targeted design of the reshaping admittance parameters. Time domain simulations with a 5-node distribution network are carried out to verify the proposed method.
1. Introduction
The new power system is a comprehensive coordinated control system with source, network, load and storage energy features for a high proportion of power electronic equipment and renewable energies with networks as ties [1,2]. As an important part of the new power system, the DC distribution network owns less AC/DC conversion equipment access, lower line losses, and has good adaptability for a high proportion of renewable energies [3,4]. With continuous technological development, including distributed power generation, energy storage and electric vehicles, the DC distribution network has become an organic structure containing massive power electronic devices and diverse topological structures [5,6,7]. However, the abundance of types of equipment and system structures brought adverse effects on system stability, and the resonance becomes more complicated [8,9]. When the resonance frequency approaches that of the harmonic injection, obvious harmonic amplification would be excited, posing risks to the safe operation of the system. Consequent problems such as power quality deterioration, protection device misoperation and even malfunction attract widespread attention [10,11,12].
The resonance problem in the above scenarios is no longer just about the energy exchange between inductors and capacitors. Complicated and diverse resonance interaction draws the interest to extensive exploration of resonance suppression strategies under different scenarios [13,14,15,16]. Coping with the resonance interaction of multi-inverter parallel grid-connected systems, and between permanent magnet synchronous generators and virtual synchronous machines [17,18,19], quantizes the influence of parameter variation on resonance frequency and impedance, and the resonance is suppressed through parameter optimization. Reference [20] explores the resonance interaction between multiple inverters in the AC microgrid, the influence of control parameters on high-frequency resonance is analyzed, and the robustness of the system is enhanced by optimizing the control parameters and adding an active damping control. In order to suppress the resonance between the LCL filter and the power grid, or between the LC filter and the energy storage equipment, a fourth-order filter is connected to the source side converter control loop, and a damping resistor is added to the LC filter in [21] and [22], respectively. For the scenario of LCL-type grid connected distributed power sources injected into weak current networks, reference [23] proposes an inverter current feedback control strategy to suppress the resonance, which could reduce the resonance frequency shift and grid inductance effect under a high-frequency bandwidth. In agreement with most of the existing research, the above resonance suppression strategies are designed on the basis of specific scenarios, and their effectiveness under different scenarios is hard to evaluate, which limits their application. In order to form a better correspondence between the resonance suppression strategy and the scenario, it is necessary to study the effectiveness evaluation method for resonance suppression strategies under different scenarios.
After the resonance suppression effectiveness evaluation, enhancing the universal adaptability of resonance suppression strategies under different scenarios is a further step to address the above issues. The active damper is connected in parallel to the resonance node, which has been widely applied to suppress resonance and enhance system stability by reshaping system impedance [24,25,26]. Refs. [24,27] reshape the system impedance by incorporating the active damper at the common coupling point (PCC) to reduce potential oscillation and harmonic risks. By adding a resonant controller on the traditional resistive active power filters(R-APFs), the connected active damper avoids the impact of other harmonic components in the system and minimizes the power loss. Reference [28] presents an adaptive active damper for single-phase AC systems whose virtual resistance values can be adjusted based on harmonic emission levels, reducing the impact of grid impedance changes on the system stability and achieving an effective response of the active damper over a wide frequency range. The above equipment is also applied to three-phase AC systems in [29,30], eliminating the influence of the virtual resistor coupling on stability. In [25,26], the active damper improved the negative damping characteristics of the system, whose responses to large disturbances were optimized. The mentioned studies equate active dampers to virtual resistors and suppress resonance or enhance system stability by increasing system damping, which is adaptive under different scenarios. However, the suppression effects of the above strategies are hard to standardize under scenarios since the existence of multi-dimension resonance features includes amplitude, frequency and phase information, and an unappropriated strategy may lead to unexpected suppression effects. In that case, it is necessary to design the resonance suppression strategies after considering the resonance distribution characteristics.
To solve such issues, this paper conducts resonance suppression by evaluating the effectiveness of resonance suppression and achieving a targeted control parameter design of the DC active damper according to the resonance distribution characteristic. The main contributions of this paper are as follows:
- (1)
- A resonance suppression criterion is derived by taking the admittance change as variables before and after resonance suppression strategies connected to the system, and a resonance suppression strategy evaluation method is proposed, offering guidance for choosing a more suitable resonance suppression strategy and parameters.
- (2)
- A DC active damper control strategy based on the resonance suppression domain is proposed, achieving targeted admittance reshaping parameter design under different resonance situations.
In Section 2, a resonance suppression strategy evaluation method is proposed based on deriving the resonance suppression criterion. Section 3 presents a DC active damper control strategy based on the resonance suppression domain. Case studies are presented in Section 4 to support the proposed methods and major findings of this study. Brief conclusions are drawn in Section 5.
2. Resonance Suppression Strategy Evaluation Method
2.1. Resonance Suppression Domain of Admittance
The resonance suppression effect can be reflected by the node impedance before and after the suppression. Let the node admittance and impedance matrices before and after resonance suppression be Y0, Z0 and Yδ, Zδ, respectively. When the resonance suppression strategy is applied on node p, δ is the self-admittance change on node p, and the self-impedance at frequency f is Zδ,f(p,p). When |Zδ,f(p,p)| − |Z0,f(p,p)| < 0, resonance is effectively suppressed, which is equivalent to
According to ∀det(Yδ,f)&det(Y0,f) ≠ 0 and the matrix inverse process, Formula (1) is equivalent to
where Y* is the adjoint matrix, det( ) represents the determinant of the matrix, and Z0,f(p,p) is the self-impedance at frequency f before resonance suppression.
Due to δ appearing only in the self-admittance of the admittance matrix, where Y*δ,f(p,p) = Y*0,f(p,p), the above Equation can be organized as
In other words, Equation (3) is a necessary and sufficient condition for resonance to be suppressed. Therefore, formula (2) is equivalent to
Then, the determinant of Yδ,f is decomposed as
Substituting Equation (5) into Equation (4) yields
According to ∀Y*δ,f(p,p) = Y*0,f(p,p) ≠ 0, which is
Since Z0,f(p,p) = Y*0,f(p,p)/det(Y0,f) and Z0,f(p,p) ≠ 0, the above Equation is simplified as
Let δ = δr + jδi, where δr and δi are the real and imaginary parts of δ, respectively. Substituting them into Equation (8) yields
From Equation (9), the boundary of the resonance suppression/amplification is a circle centered with the real and imaginary parts of −1/Z0,f(p,p) and the corresponding mode value as the radius. The outer region of the circle is the resonance suppression region, whose criterion is shown as Equation (9). The boundary of the resonance suppression domain always passes through the origin.
2.2. Resonance Suppression Strategy Evaluation
With Equation (9), the resonance suppression domain under any frequency can be obtained:
Taking the admittance change of the resonant suppression strategy as a variable, the criterion can be used to evaluate the effectiveness of the resonant suppression strategy. Moreover, since the impedance stays high around the resonance peak (not merely on the resonant frequency), analysis of the resonance suppression domain around the range of f should be carried out, and the range should be in conjunction with the resonance suppression requirements. Let the impedance limitation be β, which can be flexibly designed according to the application requirements, and the resonance suppression region for the node impedance bigger than β is analyzed. In this paper, β is 30% of the resonant peak impedance. Taking the 937.1 Hz resonance frequency of node 1 of the 5-node DC distribution network as an example, the structure, parameters, and resonance distribution of the 5-node DC distribution network are shown in Figure 1 and Table 1 and Table 2. The resonant frequency range corresponding to β is 929 Hz to 1010 Hz. The schematic diagram of the resonant suppression domain within the given frequency range is shown in Figure 2.
According to the previous derivation, the intersection of the resonant suppression domains within the frequency range is defined as the conservative suppression domain, i.e., the yellow area in Figure 2. The reshaped admittance is always located in the conservative suppression domain within the frequency range, which is a sufficient condition for the resonance to be suppressed.
Taking the tangent of the conservative suppression domain at the origin as the boundary, the convex set region in the conservative suppression domain is defined as the ideal suppression domain; that is, the green region in Figure 2. Any reshaped admittance located within this region can achieve a high resonance suppression efficiency since it could suppress the resonance while minimizing the admittance change.
By calculating the center and radius change trajectory of the resonance suppression domain boundary within a certain frequency range, the distribution of the conservative/ideal suppression domain is clarified and used to guide resonance suppression strategy’s design.
Although there are differences in the forms of resonance suppression strategies such as described in [17,20,22], the proposed resonance suppression effectiveness evaluation method determines the resonance suppression domain of all strategies from a numerical perspective. In that case, the proposed method can be applied to any scenario where the suppression strategy can be reflected by parallel equivalent impedance at the nodes. The proposed method can be used to evaluate the effectiveness of resonance suppression strategies and offer guidance for their optimization.
3. The DC Active Damper
3.1. Topology and Control Structure of the DC Active Damper
The DC active damper topology is similar to the bidirectional DC–DC converter, as shown in Figure 3.
In Figure 3, ig and ug are the injection current and voltage of the access node, Lgn is the filtering inductance, the duty cycles of switch Q1 and Q2 are d and 1 − d, respectively, and Cdc represents the load side capacitance. The mathematical model of the DC active damper is as follows:
The mathematical model under small disturbances is
In the equation, D and represent the steady-state and disturbance-state values of the duty cycle, Ig and represent the steady-state and disturbance-state values of the injection current, and Ig = 0. The superscript “^” represents the disturbance of a corresponding parameter.
On the basis of voltage and current dual-loop control and the active damper equivalent admittance, the control section adds an admittance reshaping section to enhance the admittance flexibility. Additionally, the active damper admittance except for the admittance reshaping section is minimized, which is controlled by adding a filter on the controller input side (GLPF1 and GLPF2), as shown in Figure 4. GLPF1 and GLPF2 are designed by considering the resonant distribution in the frequency range. The control strategy mainly responds to harmonic components outside the fundamental and low frequency, avoiding their impact on the system operation state. The admittance reshape section mainly responds to harmonics which have a higher frequency than that of the resonance to reduce its impact on the system’s operating state.
The mathematical model of the control in Figure 4 is
where Gcontrol1 and Gcontrol2 are the dual control loop transfer functions, respectively, and Grs is the reshape admittance transfer function. The output characteristics of the active damper can be simplified as
Among them, both Y1 and Y2 are the fixed admittance of the active damper, which needs to be designed based on the operating characteristics of the active damper. The admittance tuning range of Y1 and Y2 are limited, and their expression is as follows:
The active damper mainly achieves a resonance suppression by reshaping the node impedance. Equivalent admittance can be divided into the fixed admittance with a limited adjustment range and the reshaped admittance with a high flexibility; the latter is mainly achieved through the admittance reshape section in Figure 4. The reshaped admittance transfer function Grs has high flexibility and can be designed based on the distribution of the resonance suppression domain. By designing the reshaped admittance, the active damper reshapes the resonant impedance in the system in a more targeted manner, achieving better resonance suppression effects.
3.2. Reshape Admittance Design of DC Active Damper Based on a Resonance Suppression Strategy Effectiveness Evaluation Method
The resonance suppression domain of Grs can be derived from Section 3.1. To make sure the Grs resonance suppression domain boundary still always passes through the origin, let Y1 in Equation (14) serve as the self-admittance, which is located in the corresponding position of the node admittance matrix. Then, δr + jδi = Y2Grs in Equation (9). In that case, the center of the Grs resonance suppression domain boundary is
With a radius of 1/|Z0,f(p,p)|/|Y2|, or and oi are the real and imaginary parts of the center of Equation (9), and θ is the phase of fixed admittance Y2.
In order to minimize the influence of the admittance reshape section on the system operation state, GLPF2 in Figure 4 limits its influence frequency range. Through GLPF2, the admittance reshapes sections mainly in response to harmonics higher than the resonant frequency. Furthermore, Grs adopts the form of a second-order transfer function in series with a lead-lag link, and the transfer function is as follows:
where G0 is the gain coefficient, ωc is the characteristic frequency, ζ is the damping ratio, and T is the time constant.
The distribution characteristics of the second-order transfer function Bode diagram are shown in Figure 5a, which mainly adjusts the frequency–amplitude curve of Grs. As shown in Figure 5a, the reshaped admittance has a relatively small impact on the admittance outside the resonant frequency range, the characteristic frequency ωc is usually the resonant frequency to a single resonant peak, and the admittance amplitude distribution can be shaped by adjusting the gain G0 and damping coefficient ζ. The lead-lag link provides more phase flexibility for Grs, as shown in Figure 5b, whose amplitude variation of the Bode diagram in Figure 5b is small, and the phase changes within the range of 0–180°. Combined with the gain G0, Grs can reshape the admittance within the range of 0–360° by adjusting the time constant T based on the phase distribution characteristics of the resonance suppression domain.
After the above design, Grs could achieve the targeted control parameters design since it has high flexibility in the amplitude and phase based on the resonance suppression domain distribution. When the active damper is used to suppress multiple resonant peaks in the system, the required reshape admittance of each resonant should be considered comprehensively according to the resonant suppression requirements.
4. Simulation Verification
In order to verify the proposed evaluation method and the DC active damper control strategy based on the resonance suppression domain, a 5-node DC distribution network was built through EMTDC/PSCAD v4.6, as shown in Figure 1, where ILC is the interlinking converter, i5d,q is the AC-link current of ILC, i1–i4 are the currents of the DC side, L1–2, L2–3 and L2–4 are series inductors connected between the respective nodes, and C1, C3 and C4 are filter capacitors. The parameter settings are shown in Table 1.
By inverting the frequency domain node admittance matrix, the resonance distribution of every node impedance is obtained, as shown in Table 2.
According to Table 2, the model has two resonance frequencies: 551.3 Hz and 937.1 Hz, whose maximum amplitudes occur at the self-impedance of node 2 and node 1, respectively. The corresponding node impedance Bode diagram is shown in Figure 6.
4.1. Resonance Suppression Domain Analysis
To further illustrate the distribution characteristics of the resonance suppression domain, taking the 551.3 Hz resonance frequency of node 2 as an example, the real and imaginary parts of admittance change δ corresponding to the x and y axes, respectively, and the resonance suppression degree of the self-impedance at 551.3 Hz under different δ is shown in Figure 7. The white area in the figure is the resonance amplification area.
As shown in Figure 7, the resonance suppression region boundary appears as a circle that always passes through the origin. The resonance suppression degree is uniformly distributed around the circle and gradually increases with the distance from the circle center. The red curve is the derived resonance suppression domain criterion, which is consistent with the resonance suppression boundary of the node impedance and verifies the correctness of the derived results.
The obtained criterion can be used to analyze the effectiveness of the adopted resonance suppression strategy and optimize it. Taking a virtual resistor in the ILC, which is connected in parallel as an example, the admittance change of the virtual resistor control strategy acts as δ = y1 − y0 on the self-admittance of the corresponding node; y0 and y1 are the equivalent admittances before and after connecting the virtual resistance.
Except the resonance peak impedance, the effectiveness analysis of the resonance suppression strategies also needs to consider impedance changes in the surrounding frequency range. Unsuitable resonance suppression strategies may cause resonance frequency transfer and amplify the resonance peak at the new resonance frequency, which is easily reflected by the proposed resonance suppression strategy effectiveness evaluation method. Taking a virtual resistor and a passive damping like a resistor in series with a capacitor as examples, for the 551.3 Hz resonant frequency in this paper, the resonant frequency range corresponds to β is 505–578 Hz. Figure 8 shows the admittance change of the virtual resistance of 0.01–0.05 Ω and resistance of 0.01–0.05 Ω in series with capacitance 10–50 μF, and the admittance change under the two conditions is compared with the resonance suppression domain boundary under the frequency range. The yellow curve in the figure shows the resonance suppression domain boundary of the resonance peak, which is the same as Figure 7.
It can be seen that the admittance change of the virtual resistor always lies inside the resonance suppression region of the resonant peak with the resistance value increase from 0.01 Ω to 0.05 Ω, and it gradually increases with the distance between the virtual resistor and the resonance amplification region; that is, the larger the virtual resistor, the better the resonance suppression effect. However, the virtual resistor is also located within the resonance amplification region of some frequencies, causing impedance amplification in the corresponding frequency.
It can also be seen that the admittance change of passive damping is always within the resonance amplification region of some frequencies. When the capacitance is small, it is within the resonance amplification region of the resonance peak, which gradually leaves the resonance amplification region of the resonance peak as the capacitance increases. That is to say, the connection of passive damping will lead to resonance amplification of some frequencies within the resonance frequency range, and when the parameters are small, it may even lead to amplification of the resonance peak.
Taking a virtual resistance of 0.03 Ω and a passive damping with a resistance of 0.01 Ω and capacitance of 10 μF as examples, the node impedance before and after its connection was shown in Figure 9. It can be seen that the connection of passive damping leads to resonance frequency transfer and impedance amplification. The connection of virtual resistance effectively reduced most of the impedance in the frequency range but still played a resonance amplification role on some frequencies, which is consistent with the analysis results in Figure 8.
To verify the above phenomenon, a 1A disturbance current is injected into node 2 at 0.4 s through simulation, and a virtual resistance of 0.03 Ω and a passive damping with the resistance of 0.01 Ω and capacitance of 10 μF are connected at 0.8 s, respectively. The response of the node 2 harmonic voltage is shown in Figure 10.
Figure 10a shows the harmonic waveform of the node voltage at the original resonant frequency (i.e., 551.3 Hz). It can be seen that the harmonic voltage significantly decreases with the connection of virtual resistors while passive damping does not have the resonance suppression effect. The disturbance injection frequency of the virtual resistor in Figure 10b is 522.3 Hz, and the disturbance injection frequency of the passive damping is 547.3 Hz, corresponding to the resonance amplification frequency in Figure 9. It can be seen from the figure that the connection of passive damping significantly increases the impedance at 547.3 Hz, and the connection of the virtual resistor also causes a small impedance increase of 522.3 Hz. The simulation results are consistent with the analysis in Figure 8 and Figure 9. Therefore, both passive damping and virtual resistance resonance suppression strategies are not suitable for 551.3 Hz resonance suppression.
Passive damping and virtual resistance have been widely applied to suppress the resonance; however, both of them with the abovementioned parameters could not effectively suppress the resonance at 551.3 Hz. Therefore, it is necessary to evaluate the effectiveness of the resonance suppression strategies under different scenarios. The effectiveness analysis can be reflected in both Figure 8 and Figure 9, while the latter requires the mathematical model of the resonance suppression strategy to be substituted into the admittance matrix and obtain its inverse for each strategy and value, which requires a large amount of computation. The resonance suppression strategy effectiveness analysis in Figure 8 only starts from the perspective of admittance changes. The adaptability of the resonance suppression strategy can be directly judged and parameter tuning suggestions can be given by analyzing the distribution of admittance changes in the resonance suppression domain, which is more concise and efficient.
4.2. The DC Active Damper Resonance Suppression Effect Verification
Based on the distribution of the resonance suppression domain, this section makes efforts to suppress the resonance on the 551.3 Hz of node 2 and the 937.1 Hz of node 1, respectively, to verify the proposed DC active damper control strategy.
(1) Resonance suppression domain analysis of the fixed admittance: Taking 30% of the impedance amplitude as β, for resonance at 551.3 Hz and 937.1 Hz, the frequency ranges that need attention are 505–578 Hz for node 2 and 909–970 Hz for node 1. To suppress the resonances, a DC active damper is connected in parallel at nodes 2 and 1 with parameters shown in Table 3. The fixed admittance Bode diagram is shown in Figure 11.
It can be seen from Figure 11 that the fixed admittance values of the active damper are relatively small in the two resonant frequency ranges. For 505–578 Hz, the range for Y1 is [0.0053∠22.9°, 0.0067∠26.2°] and for Y2 is [0.0056∠−142°, 0.0057∠−140°]. For 909–970 Hz, the range for Y1 is [0.0153∠40.5°, 0.0173∠42.9°] and for Y2 is [0.00575∠−130°, 0.00574∠−128°]. The resonance suppression domain moving trajectory of the two resonances are shown in Figure 12.
In Figure 12, the blue line represents the center of the resonance suppression domain boundary within the frequency range. As the frequency increases, the centers of the circles within the two frequency ranges gradually shift from the first or second quadrants to the third quadrant. The grey curve in Figure 12 represents the boundary of the resonance suppression domain, and as mentioned earlier, the boundaries all pass through the original points.
The red mark in the figure shows the distribution of the fixed admittance Y1 of the active damper. It can be seen that the value variation of Y1 in the frequency range is not obvious enough, which overlaps with the resonance amplification area of some frequencies and may cause impedance amplification. It should be considered to be offset when reshaping the admittance.
(2) Reshape admittance design and application: According to the reshaped admittance design method in Section 3.2, the reshaped admittance parameters corresponding to the two resonant frequencies are shown in Table 4, and the Bode diagram is shown in Figure 13.
As shown in Figure 13, the maximum amplitude of the reshaped admittance transfer function lies within the frequency range where the resonant peak is located, and the response amplitude to other frequency ranges is relatively small. The reshaped admittance transfer function Grs and resonance suppression domain corresponding to Table 4 is shown in Figure 14.
In Figure 14, Grs,r and Grs,i correspond to the real and imaginary parts of Grs, respectively. The resonance suppression domain of Grs has changed compared with Figure 12, but the boundary still always passes through the origin. In order to minimize the impact of reshaping admittance on the system’s operating characteristics, the corresponding admittance change should be designed and located within the ideal suppression domain near the origin. In order to verify the resonance suppression effect of the active damper, node impedance Bode diagrams were drawn for the three stages: before connecting the active damper, connecting the active damper without the admittance reshape section, and connecting the complete active damper containing reshaped admittance, as shown in Figure 15a,b.
From Figure 15a,b, it can be seen that the node impedance undergoes a small amplitude impedance amplification in some frequencies after the active damper without the admittance reshape section is connected. The impedance within the frequency range is significantly reduced compared to the previous two situations, and the resonance is effectively suppressed, which is consistent with the analysis conclusions in Figure 13 and Figure 14.
Further verification is conducted on the PSCAD/EMTDC simulation. A 1A disturbance current corresponding to the resonant frequency is injected into node 2 and node 1 at 0.4 s, respectively, the active damper is connected to the corresponding nodes at 0.6 s, and then reshaping admittance sections are connected at 1.2 s. The harmonic voltage waveforms are shown in Figure 16a,b.
In Figure 16, both the fixed and reshaped admittances of the active damper suppress the harmonic voltage response at the resonant frequency. The connection of the reshaped admittance significantly reduces the harmonic voltage, with the suppression amplitude bigger than 50%, which is consistent with the analysis results of the Bode diagram and verifies the effectiveness of the resonant suppression of the DC active damper.
Although the examples above did not cover every resonance frequency range during application, the proposed resonance effectiveness evaluation method poses no limits on the resonance frequency range while the proposed active damper control strategy is mainly suitable for the frequency lower than half of the active damper switching frequency by following the sampling theory.
The impact of the active damper on other nodes should also draw attention. Figure 17 shows the response voltage of other nodes to the harmonic current disturbance in Figure 16 before and after the active damper is connected. The active dampers effectively suppress the resonance of the connected nodes while not introducing harmonic voltage amplification responses to other nodes.
5. Conclusions and Discussion
Resonance presents diversity on both the frequency and the amplitude, which is decided by the impedance distribution on the frequency range. In that case, it is not enough to design the resonance suppression strategy merely considering responses on the resonance frequency. New resonance risks have been introduced and should also be noticed. In that case, a resonance suppression effect evaluation method and a DC active damper control strategy is proposed. The main conclusion and discussion are as follows:
- (1)
- Based on the node impedance before and after the connection of resonance suppression strategies, the proposed resonance suppression effect evaluation method presents the resonance suppression/amplification boundaries directly, avoiding a complicated matrix inverse process. The proposed method is applicable to any type of resonance suppression strategy connected to the system in parallel.
- (2)
- The resonance suppression region boundary appears as a circle that always passes through the origin. The resonance suppression degree is uniformly distributed around the circle and gradually increases with the distance from the circle center. When the node admittance is located within the resonance amplification region, resonance amplification would unavoidably happen on the original or new resonance frequency.
- (3)
- After analyzing the resonance suppression domain distribution and forming corresponding resonance suppression strategy selection guidance, appropriate strategies might also be tough to find considering limits such as the system operation state, difficulty in parameter changes or component additions, etc. In that case, a DC active damper control strategy is proposed, which behaves with strong adaptability under different scenarios. The proposed strategy achieves the targeted design of the active damper control parameters based on the resonance suppression domain distribution, achieving good value in improving resonance suppression efficiency and effectiveness.
Author Contributions
H.Z.: Conceptualization, Methodology, Supervision; Y.W.: Validation, Formal analysis, Writing—original draft; X.Z.: Validation, Writing—original draft; Y.X.: Project administration, Supervision, Writing—review & editing; S.T.: Supervision, Writing—review & editing. All authors have read and agreed to the published version of the manuscript.
Funding
This work was supported in part by the Science and Technology Project of China Southern Power Grid (090000KK52220014/SZKJXM20220021).
Conflicts of Interest
Author Huaying Zhang was employed by the company Shenzhen Power Supply Co., Ltd. The remaining authors declare that the research was conducted in the absence of any commercial or financial relationships that could be construed as a potential conflict of interest.
References
- Ju, P.; Jiang, T.; Huang, H. Brief discussion on the “three-self” nature of the new power system. Proc. CSEE 2023, 43, 2598–2607. [Google Scholar] [CrossRef]
- Li, B.; Chen, M.; Zhong, H.; Ma, Z.; Liu, D. A review of long-term planning of new power systems with large share of renewable energy. Proc. CSEE 2023, 43, 555–581. [Google Scholar] [CrossRef]
- Jia, K.; Zhao, Q.; Zhu, Z.; Bi, T. Modeling of dc distribution system based on high frequency transient components. IEEE Trans. Smart Grid 2021, 12, 671–679. [Google Scholar] [CrossRef]
- Nuutinen, P.; Pinomaa, A.; Peltoniemi, P.; Kaipia, T.; Karppanen, J.; Silventoinen, P. Common-mode and rf emi in a low-voltage dc distribution network with a pwm grid-tie rectifying converter. IEEE Trans. Smart Grid 2017, 8, 400–408. [Google Scholar] [CrossRef]
- Zong, H.; Zhang, C.; Cai, X.; Molinas, M. Oscillation propagation analysis of hybrid ac/dc grids with high penetration renewables. IEEE Trans. Power Syst. 2022, 37, 4761–4772. [Google Scholar] [CrossRef]
- Mohamad, A.M.I.; Mohamed, Y.A.-R.I. Analysis and mitigation of interaction dynamics in active dc distribution systems with positive feedback islanding detection schemes. IEEE Trans. Power Electron. 2018, 33, 2751–2773. [Google Scholar] [CrossRef]
- Song, W.; Jiao, S.; Li, Y.W.; Wang, J.; Huang, J. High-frequency harmonic resonance suppression in high-speed railway through single-phase traction converter with lcl filter. IEEE Trans. Transp. Electrif. 2016, 2, 347–356. [Google Scholar] [CrossRef]
- Chen, Z.; Huang, X.; Luo, A.; Yang, J.; Yang, L. Wide-band harmonic resonance characteristics and coordinated damping method for distributed generation power plants. IEEE Trans. Ind. Electron. 2019, 66, 7753–7764. [Google Scholar] [CrossRef]
- Ye, Q.; Mo, R.; Li, H. Low-frequency resonance suppression of a dual-active-bridge dc/dc converter enabled dc microgrid. IEEE J. Emerg. Sel. Top. Power Electron. 2017, 5, 982–994. [Google Scholar] [CrossRef]
- Zhan, Y.; Xie, X.; Wang, Y. Impedance network model based modal observability and controllability analysis for renewable integrated power systems. IEEE Trans. Power Deliv. 2021, 36, 2025–2034. [Google Scholar] [CrossRef]
- Wang, C.; Li, W.; Wang, Y.; Meng, Z.; Yang, L. Dc bus voltage fluctuation classification and restraint methods review for dc microgrid. Proc. CSEE 2017, 37, 84–97. [Google Scholar] [CrossRef]
- Liu, F.; Liu, W.; Xu, Y.; Li, Y. Analysis on stability criterion and interaction law of grid-connected inverter control loop under weak grid condition. Proc. CSEE 2023, 43, 466–482. [Google Scholar] [CrossRef]
- Shen, H.; Liu, Z.; Liu, W.; Wang, C.; Sun, X.; Yang, F.; Zhang, M. High frequency resonance analysis and resonance suppression of a grid-connected inverter coupled with a long feeder. IEEE Trans. Power Deliv. 2023, 38, 926–936. [Google Scholar] [CrossRef]
- Pinares, G.; Bongiorno, M. Analysis and mitigation of instabilities originated from dc-side resonances in vsc-hvdc systems. IEEE Trans. Ind. Appl. 2016, 52, 2807–2815. [Google Scholar] [CrossRef]
- Lorzadeh, I.; Abyaneh, H.A.; Savaghebi, M.; Bakhshai, A.; Guerrero, J.M. Capacitor Current Feedback-Based Active Resonance Damping Strategies for Digitally-Controlled Inductive-Capacitive-Inductive-Filtered Grid-Connected Inverters. Energies 2016, 9, 642. [Google Scholar] [CrossRef]
- Wang, H.; Chen, Y.; Wu, W.; Liao, S.; Wang, Z.; Li, G.; Xie, Z.; Guo, J. Impedance Reshaping Control Strategy for Improving Resonance Suppression Performance of a Series-Compensated Grid-Connected System. Energies 2021, 14, 2844. [Google Scholar] [CrossRef]
- Hong, L.; Shu, W.; Wang, J.; Mian, R. Harmonic resonance investigation of a multi-inverter grid-connected system using resonance modal analysis. IEEE Trans. Power Deliv. 2019, 34, 63–72. [Google Scholar] [CrossRef]
- Li, Z.; Hu, H.; Tang, L.; Wang, Y.; Zang, T.; He, Z. Quantitative severity assessment and sensitivity analysis under uncertainty for harmonic resonance amplification in power systems. IEEE Trans. Power Deliv. 2020, 35, 809–818. [Google Scholar] [CrossRef]
- Ren, L.; Guo, H.; Dou, Z.; Wang, F.; Zhang, L. Modeling and Analysis of the Harmonic Interaction between Grid-Connected Inverter Clusters and the Utility Grid. Energies 2022, 15, 3490. [Google Scholar] [CrossRef]
- Guo, Y.; Chen, L.; Lu, X.; Wang, J.; Zheng, T.; Mei, S. Region-based stability analysis for active dampers in ac microgrids. IEEE Trans. Ind. Appl. 2019, 55, 7671–7682. [Google Scholar] [CrossRef]
- Matijevic, E.; Sharma, R.; Zare, F.; Kumar, D. A unified active damping for grid and converter current feedback in active front end converters. IEEE Access 2022, 10, 30913–30924. [Google Scholar] [CrossRef]
- Zhang, H.; Yang, J.; Zhi, N.; Li, N. Stability analysis of dc microgrid based on the passive damping method. High Volt. Eng. 2017, 43, 3100–3109. [Google Scholar] [CrossRef]
- Zhou, L.; Guerrero, J.M.; Zhou, X.; Chen, Y.; Lv, Z.; He, Z.; Wu, W.; Yang, L.; Yan, K.; Luo, A. Inverter-current-feedback resonance-suppression method for lcl-type dg system to reduce resonance-frequency offset and grid-inductance effect. IEEE Trans. Ind. Electron. 2018, 65, 7036–7048. [Google Scholar] [CrossRef]
- Wang, X.; Blaabjerg, F.; Liserre, M.; Chen, Z.; He, J.; Li, Y. An active damper for stabilizing power-electronics-based ac systems. IEEE Trans. Power Electron. 2014, 29, 3318–3329. [Google Scholar] [CrossRef]
- Kim, H.-J.; Kang, S.-W.; Seo, G.-S.; Jang, P.; Cho, B.-H. Large-signal stability analysis of dc power system with shunt active damper. IEEE Trans. Ind. Electron. 2016, 63, 6270–6280. [Google Scholar] [CrossRef]
- Machado, J.E.; Ortega, R.; Astolfi, A.; Arocas-Perez, J.; Pyrkin, A.; Bobtsov, A.A.; Grino, R. An adaptive observer-based controller design for active damping of a dc network with a constant power load. IEEE Trans. Control Syst. Technol. 2021, 29, 2312–2324. [Google Scholar] [CrossRef]
- Wang, X.; Blaabjerg, F.; Liserre, M. An active damper to suppress multiple resonances with unknown frequencies. In Proceedings of the 2014 IEEE Applied Power Electronics Conference and Exposition—APEC 2014, Fort Worth, TX, USA, 16–20 March 2014; pp. 2184–2191. [Google Scholar] [CrossRef]
- Jia, L.; Ruan, X.; Zhao, W.; Lin, Z.; Wang, X. An adaptive active damper for improving the stability of grid-connected inverters under weak grid. IEEE Trans. Power Electron. 2018, 33, 9561–9574. [Google Scholar] [CrossRef]
- Lin, Z.; Ruan, X.; Zhang, H.; Wu, L. A hybrid-frame control based impedance shaping method to extend the effective damping frequency range of the three-phase adaptive active damper. IEEE Trans. Ind. Electron. 2023, 70, 509–521. [Google Scholar] [CrossRef]
- Lin, Z.; Ruan, X. A three-phase adaptive active damper for improving the stability of grid-connected inverters under weak grid. In Proceedings of the 2019 IEEE Applied Power Electronics Conference and Exposition (APEC), Anaheim, CA, USA, 17–21 March 2019; pp. 1084–1089. [Google Scholar] [CrossRef]
Figure 1.
Structure diagram of a 5-node DC distribution network.
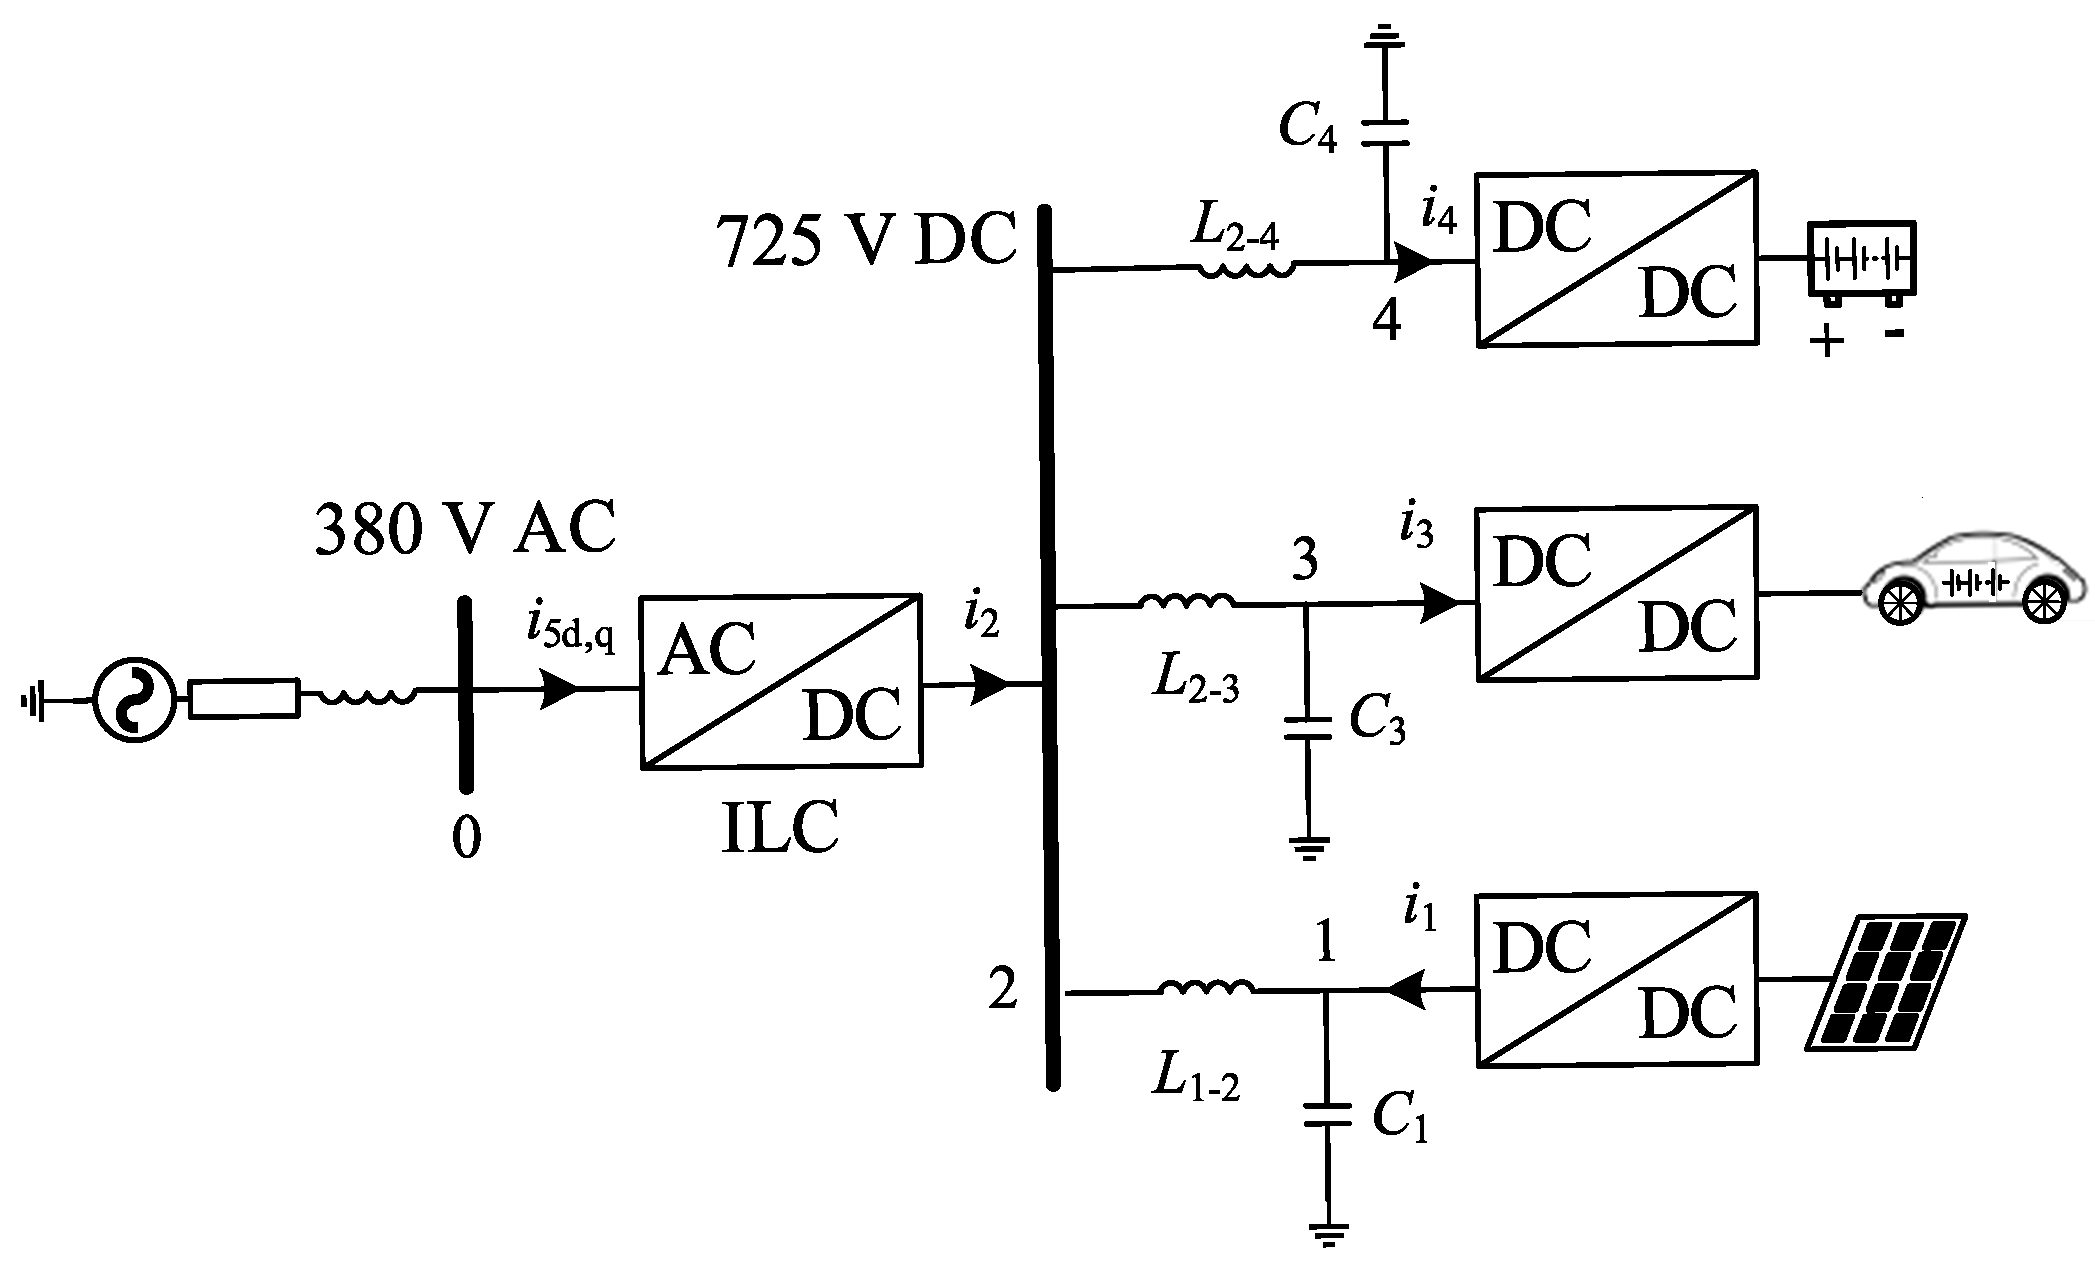
Figure 2.
Resonance suppression domain.
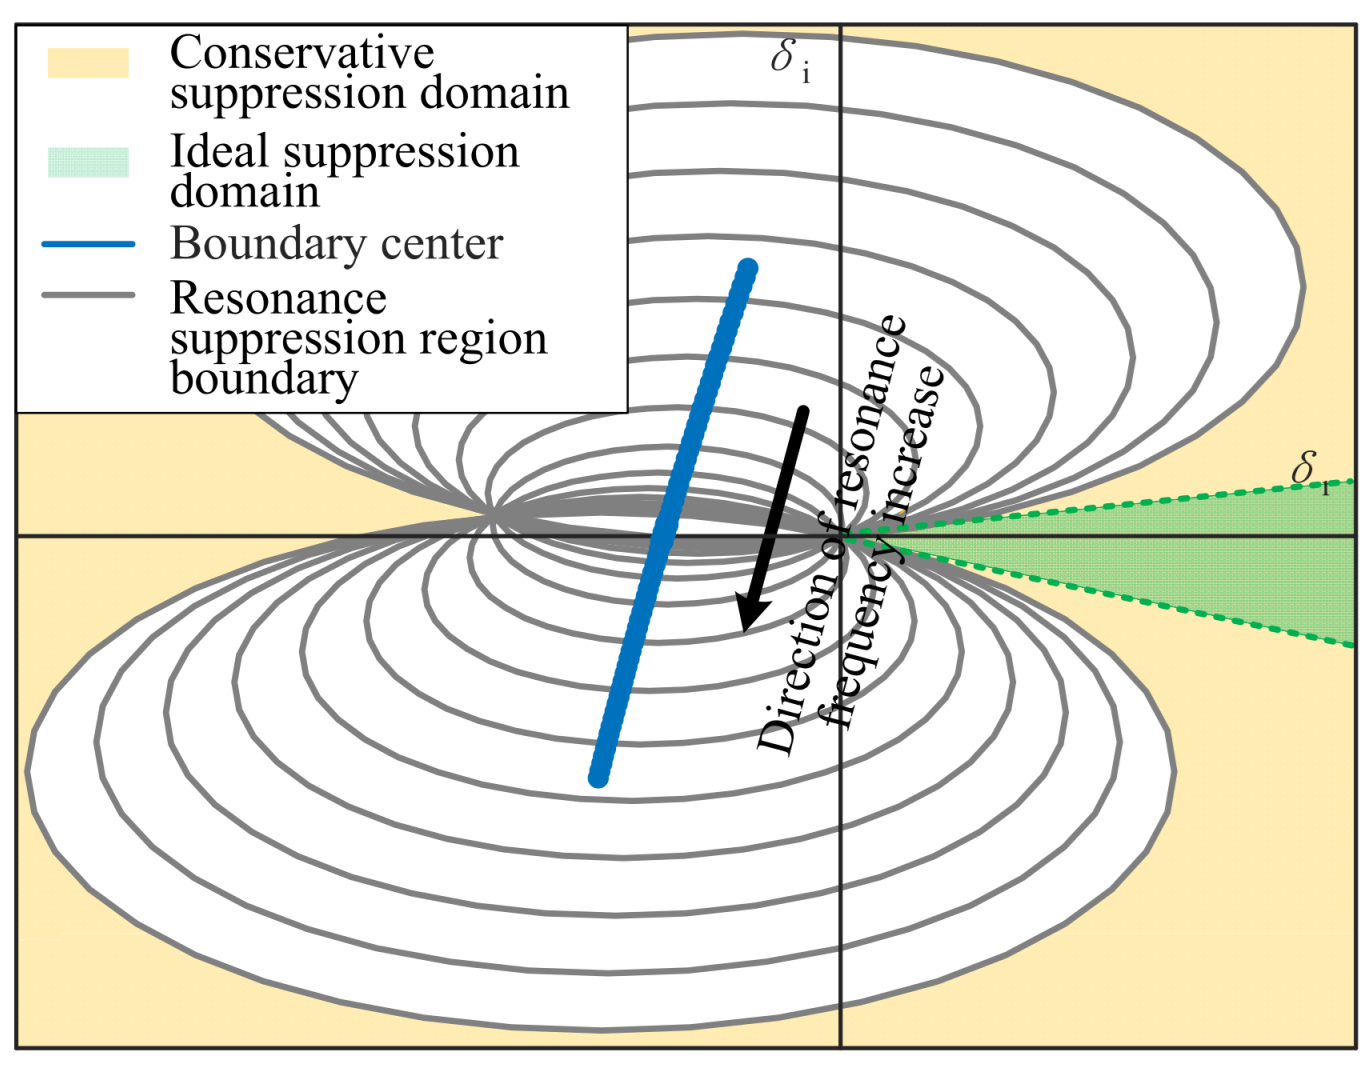
Figure 3.
Circuit structure of the DC active damper.

Figure 4.
Control structure of the DC active damper.

Figure 5.
Reshape admittance transfer function. (a) Second order transfer function. (b) Lead-lag transfer function.
Figure 5.
Reshape admittance transfer function. (a) Second order transfer function. (b) Lead-lag transfer function.
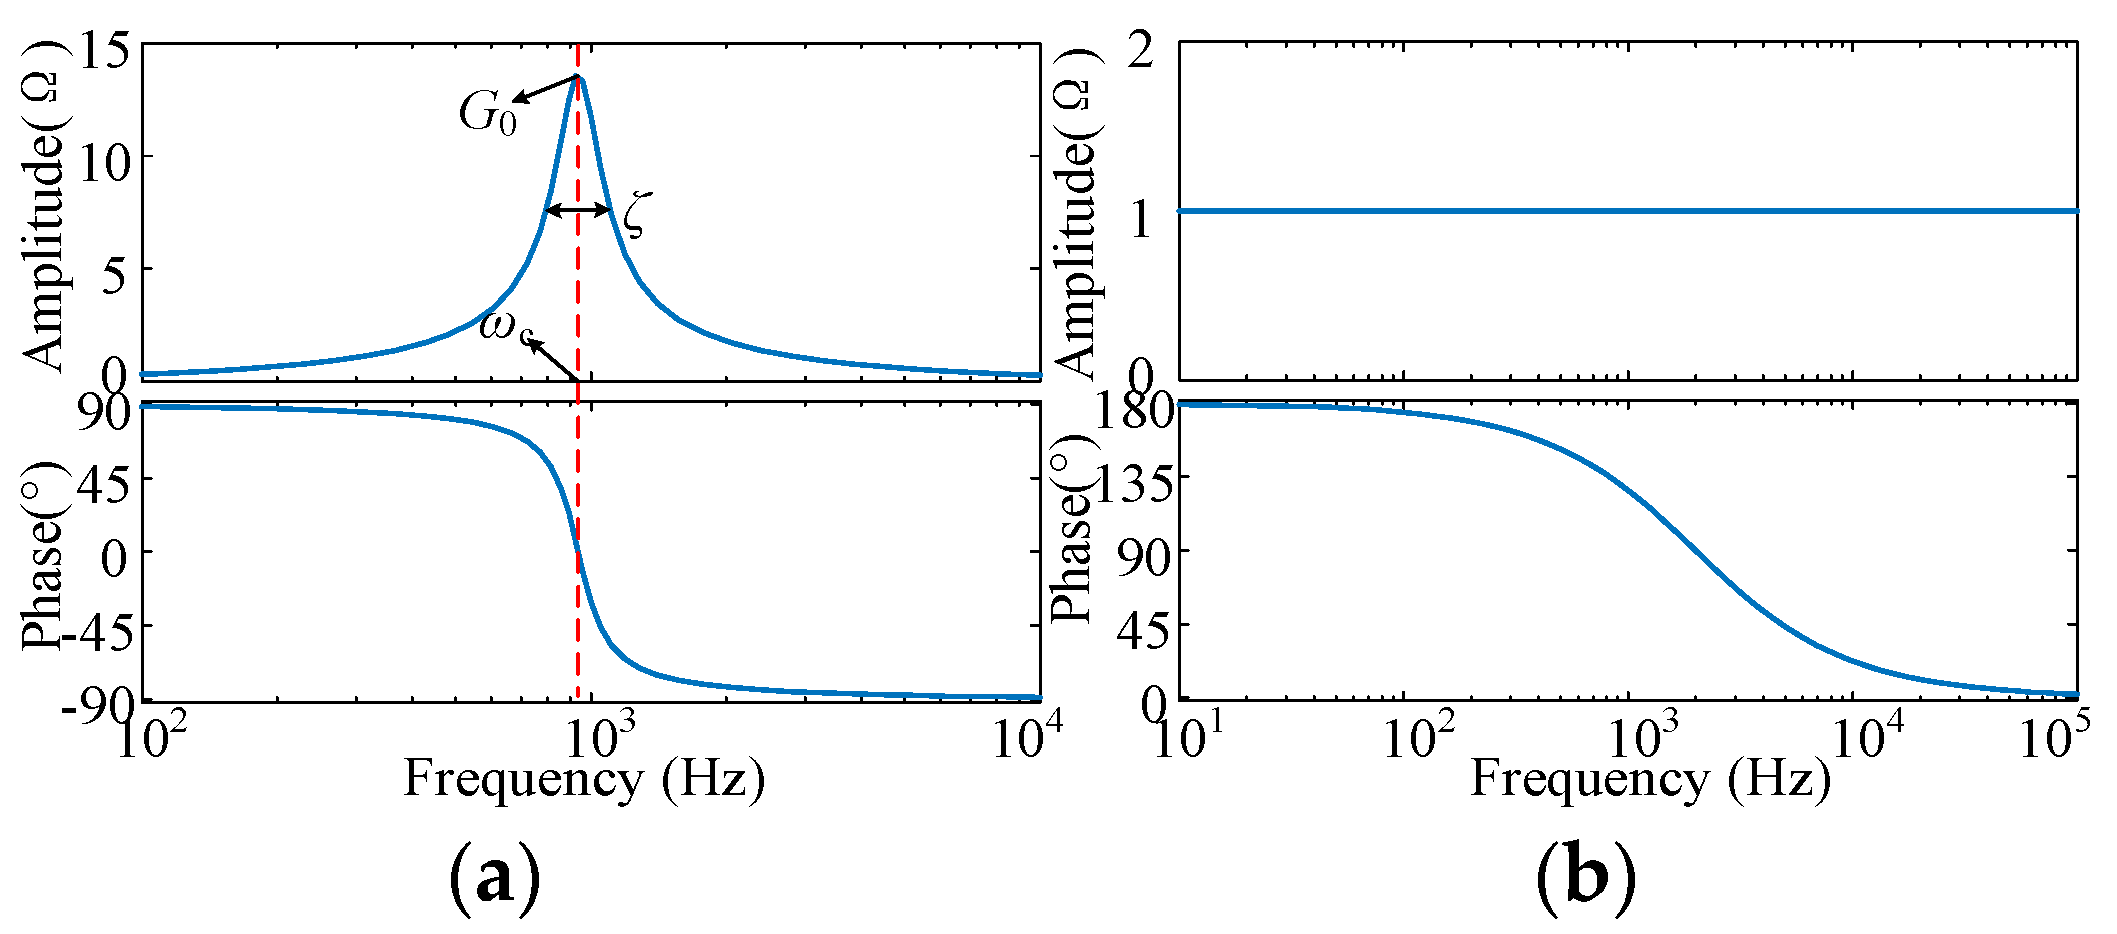
Figure 6.
The main resonance impedance distribution. (a) Z(2,2) and (b) Z(1,1).
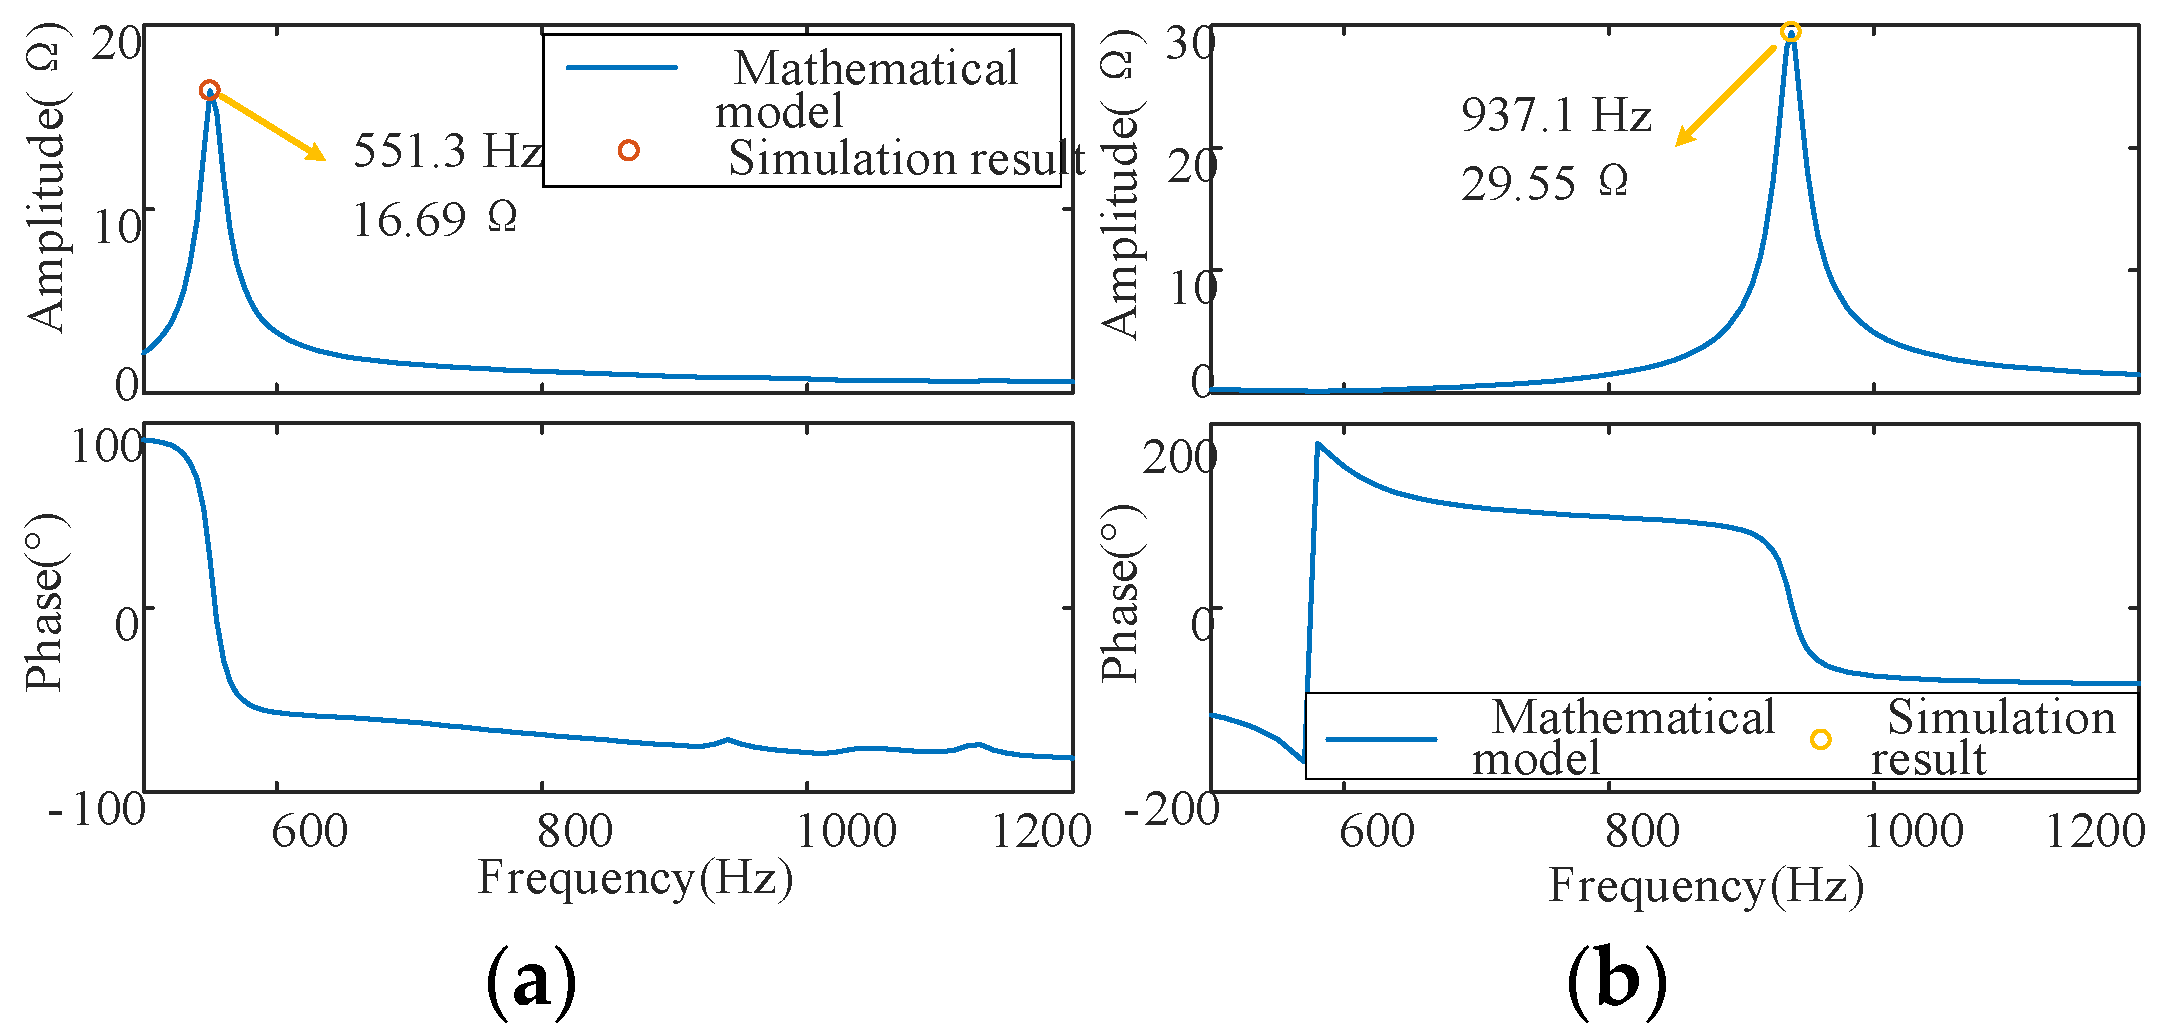
Figure 7.
Resonance suppression region boundary under a single frequency point.
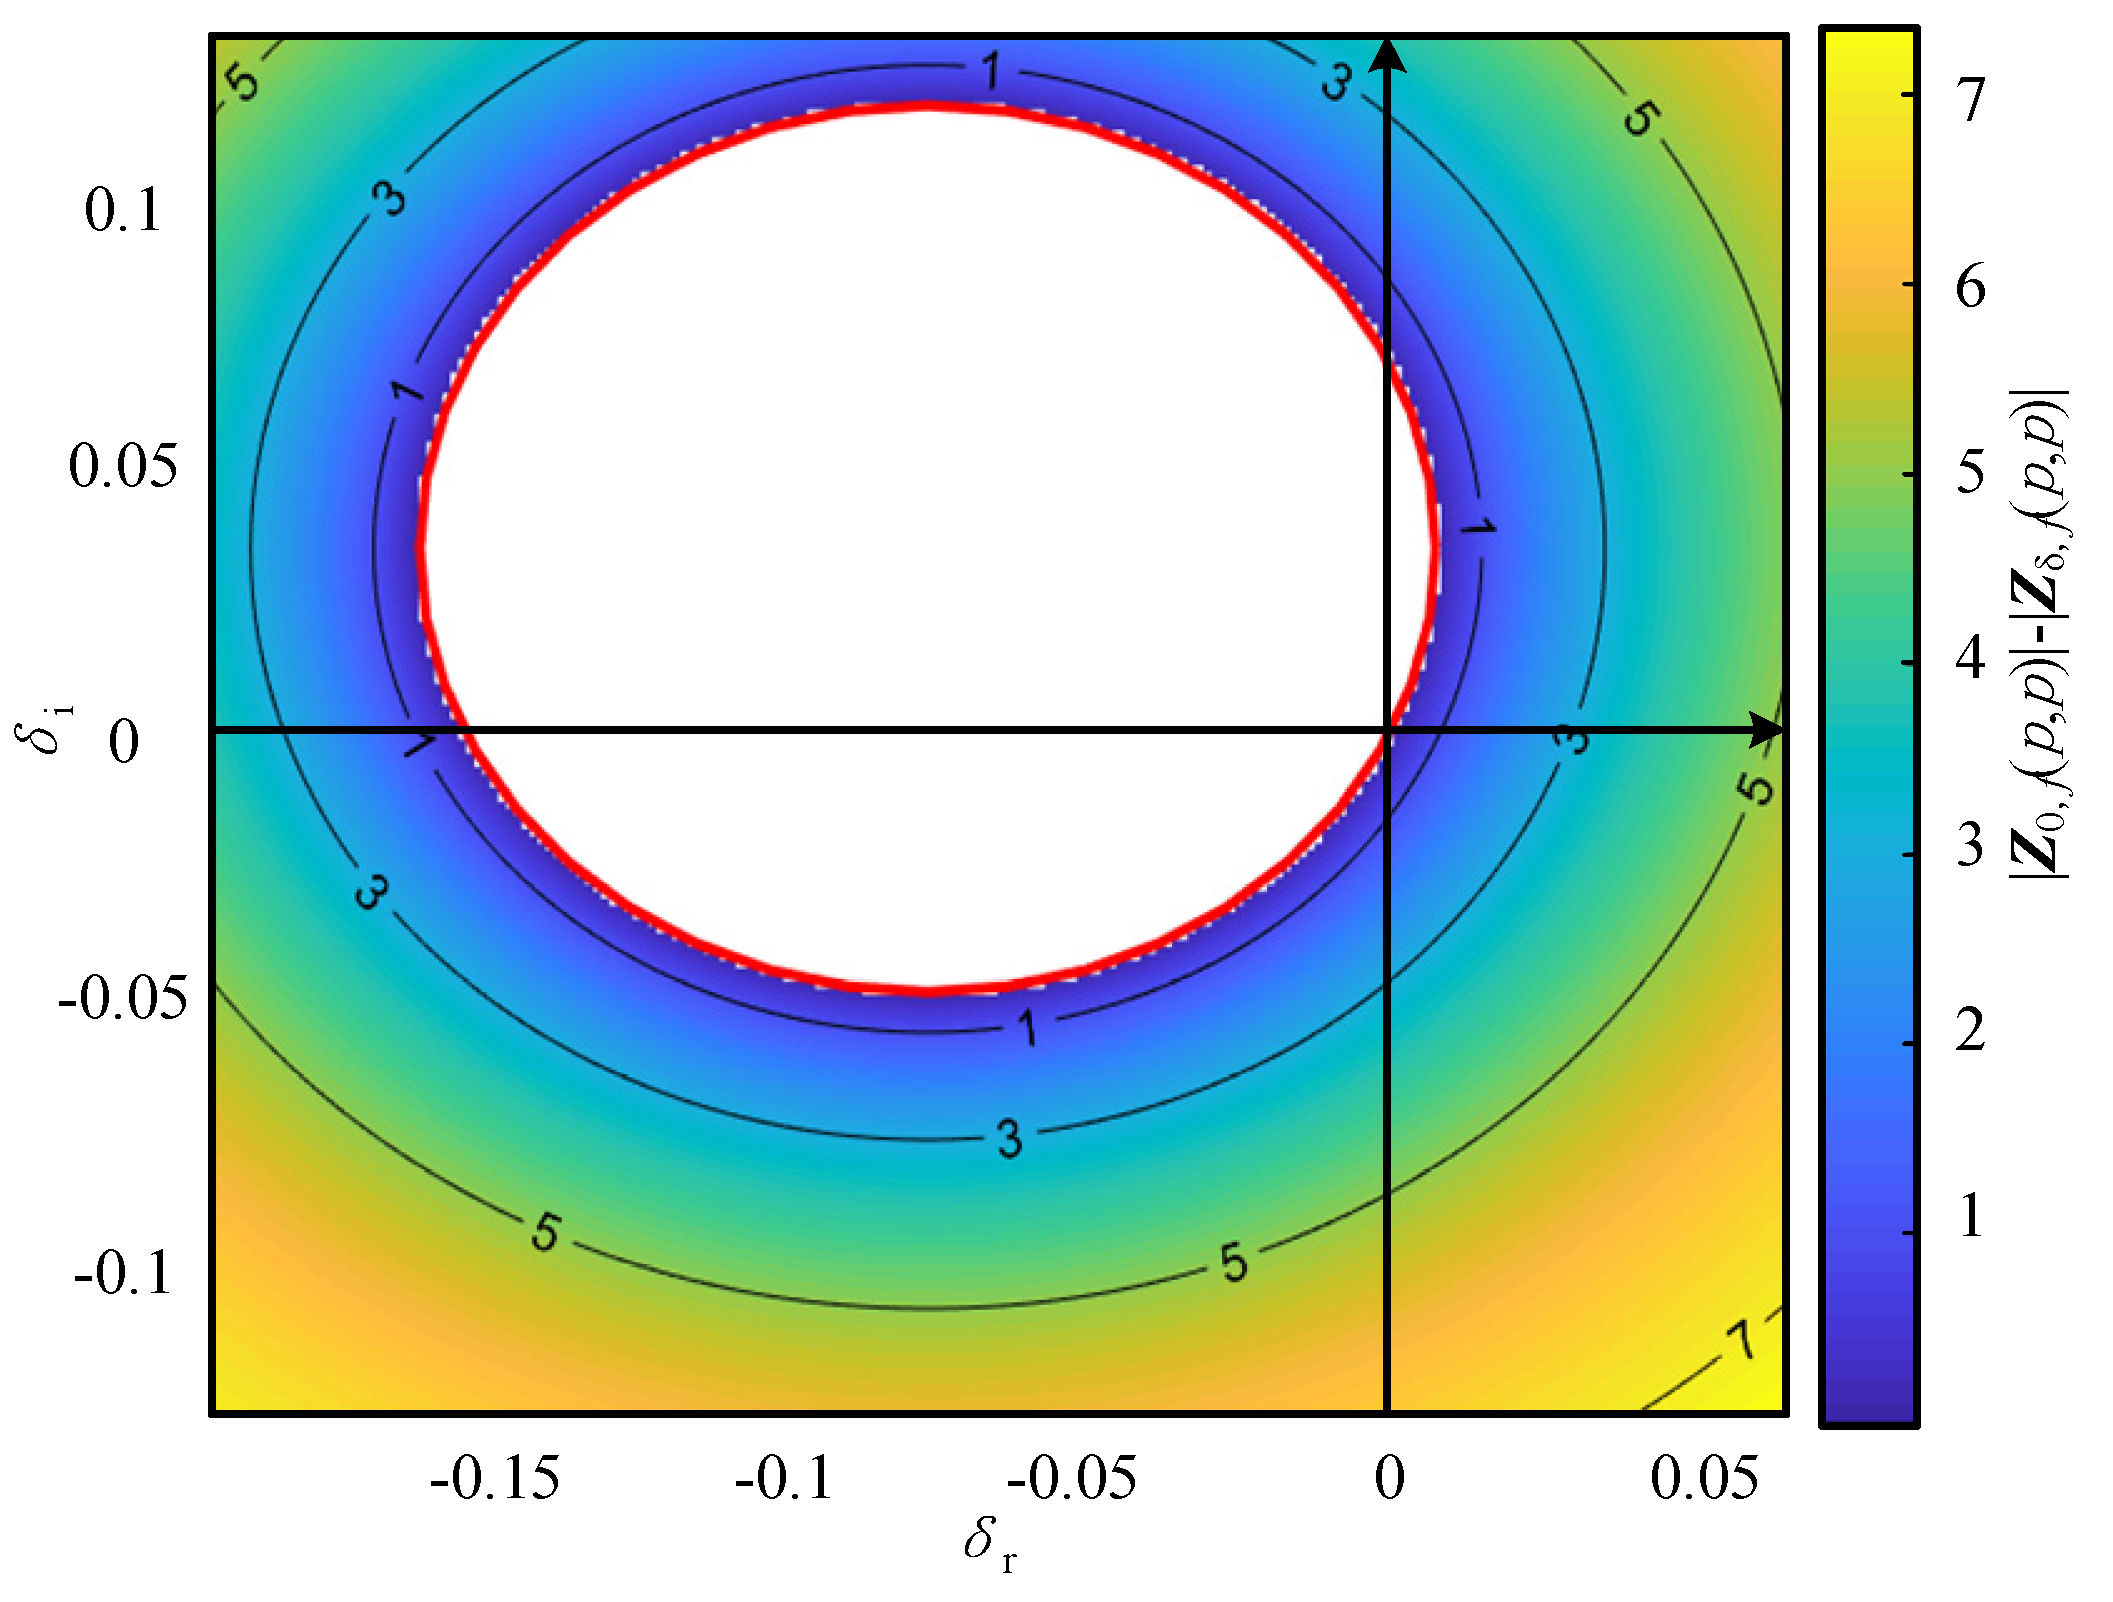
Figure 8.
Resonance suppression domain distribution of existing resonance suppression strategies.

Figure 9.
Node impedance before and after resonance suppression strategies connect.

Figure 10.
Simulation verification of resonance suppression effect. (a) Resonance suppression effect of original resonance frequency. (b) Resonance amplification phenomenon.
Figure 10.
Simulation verification of resonance suppression effect. (a) Resonance suppression effect of original resonance frequency. (b) Resonance amplification phenomenon.
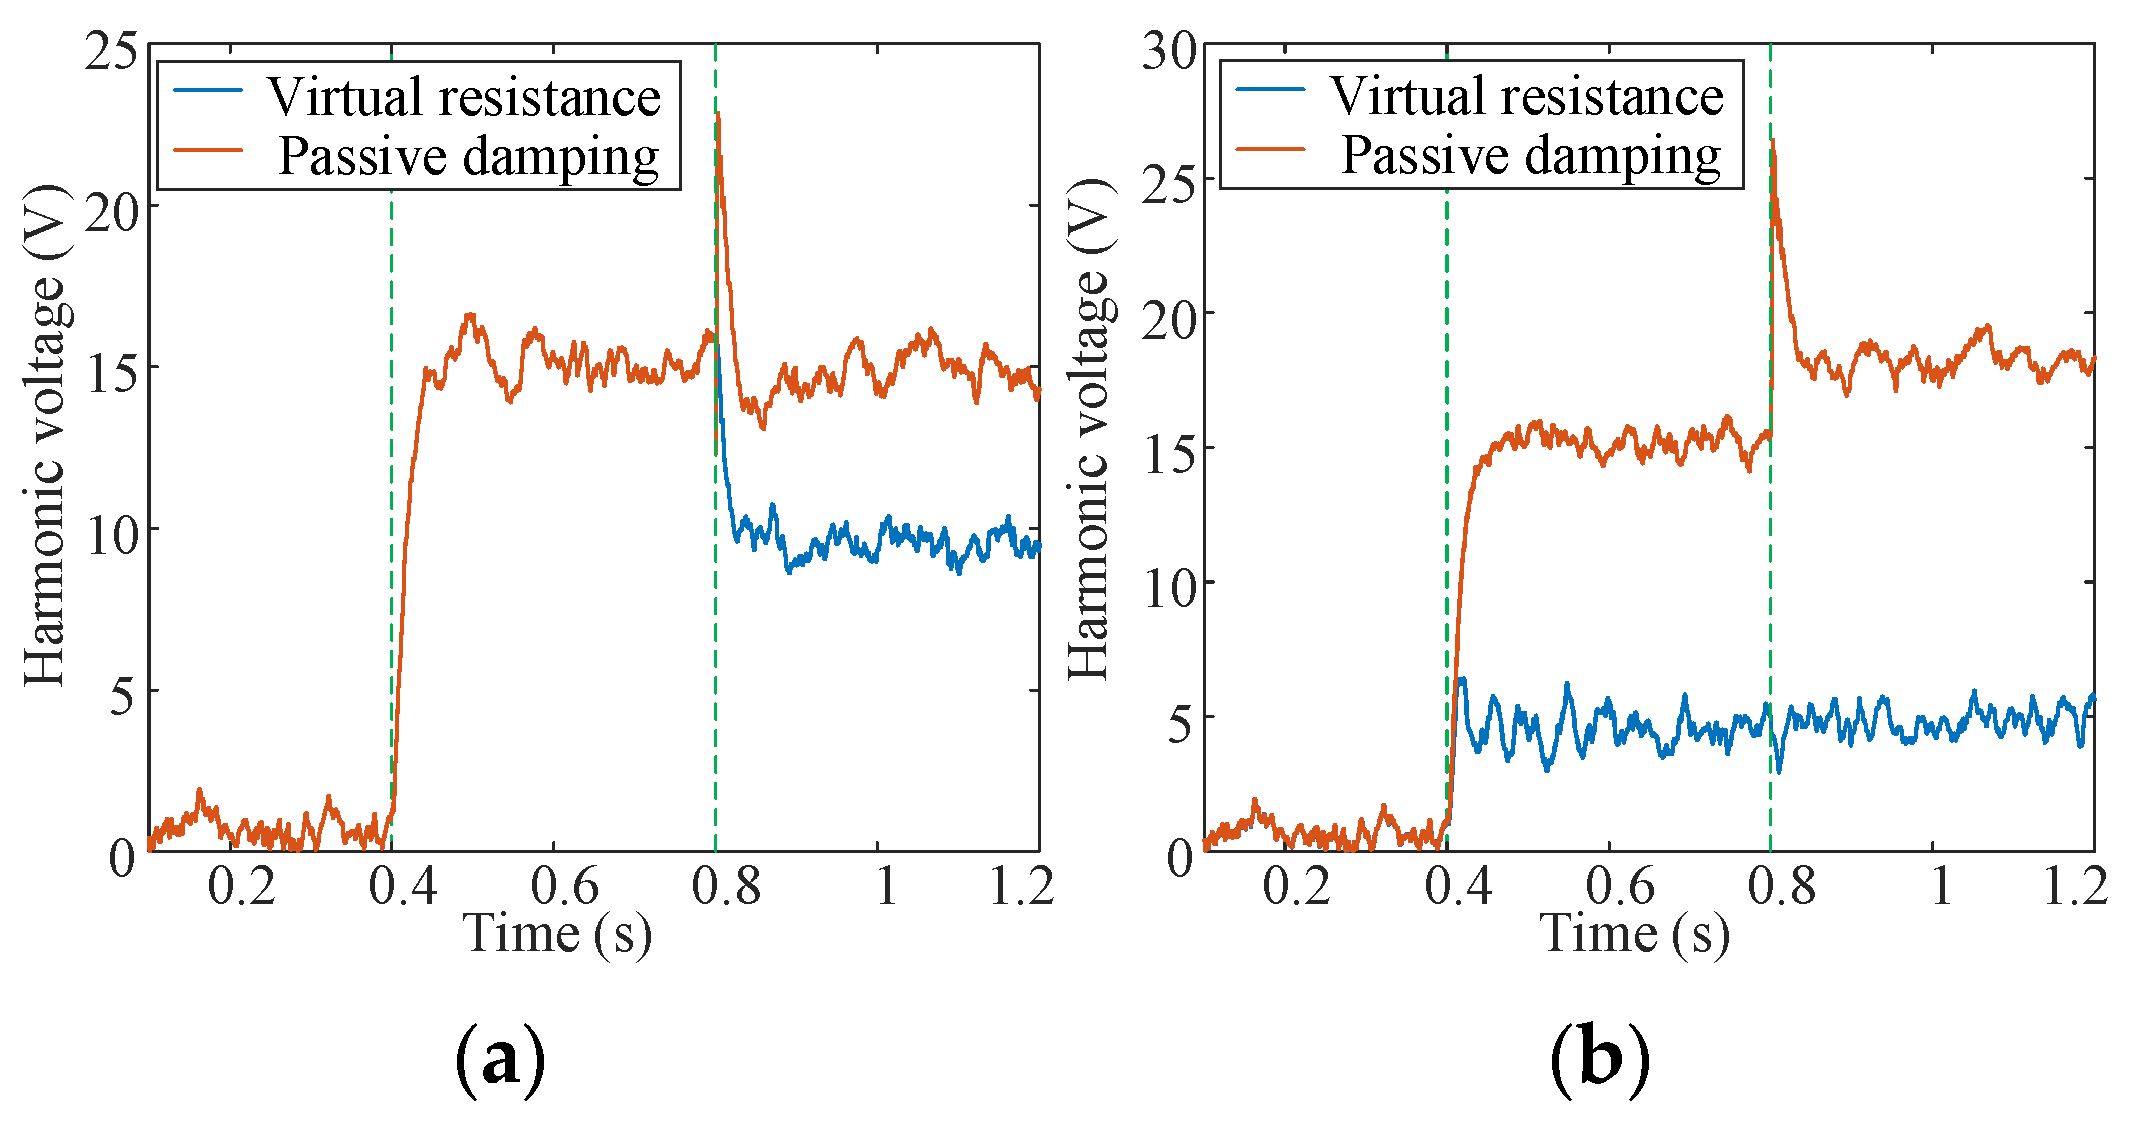
Figure 11.
Fixed admittance of the DC active damper.

Figure 12.
Trajectory of the resonance suppression region boundary for (a) 551.3 Hz and (b) 937.1 Hz.
Figure 12.
Trajectory of the resonance suppression region boundary for (a) 551.3 Hz and (b) 937.1 Hz.

Figure 13.
Reshaped admittance of the DC active damper.
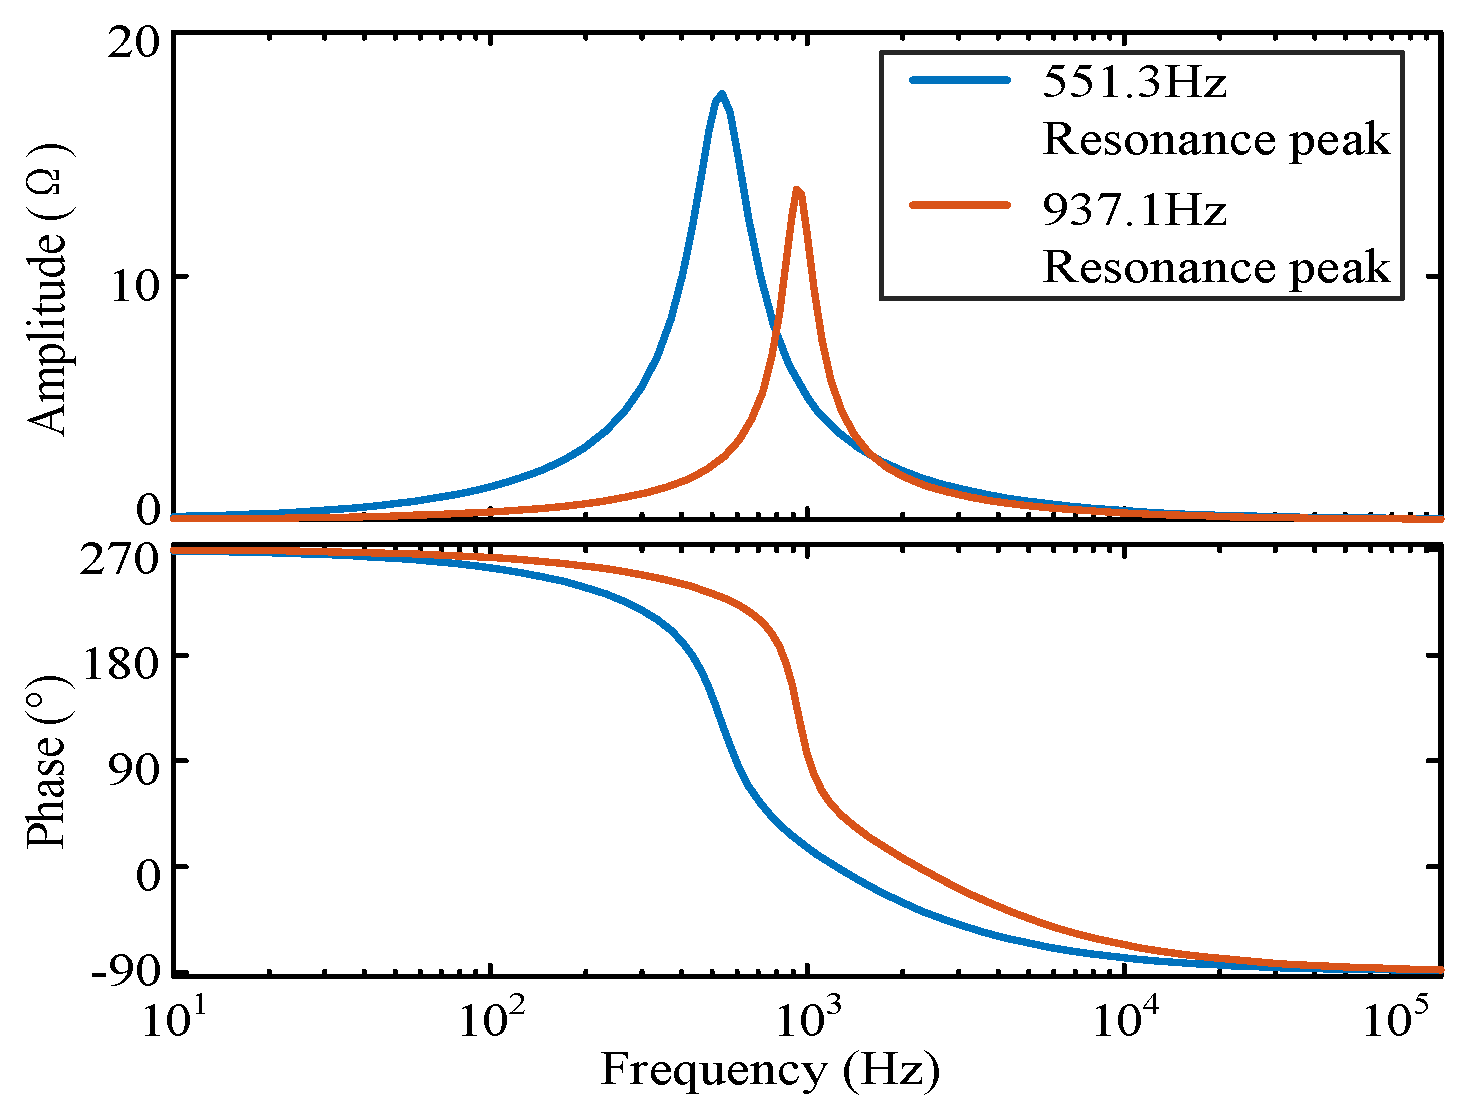
Figure 14.
Boundaries of the Grs resonance suppression region and reshaped admittance distribution for (a) 551.3 Hz and (b) 937.1 Hz.
Figure 14.
Boundaries of the Grs resonance suppression region and reshaped admittance distribution for (a) 551.3 Hz and (b) 937.1 Hz.
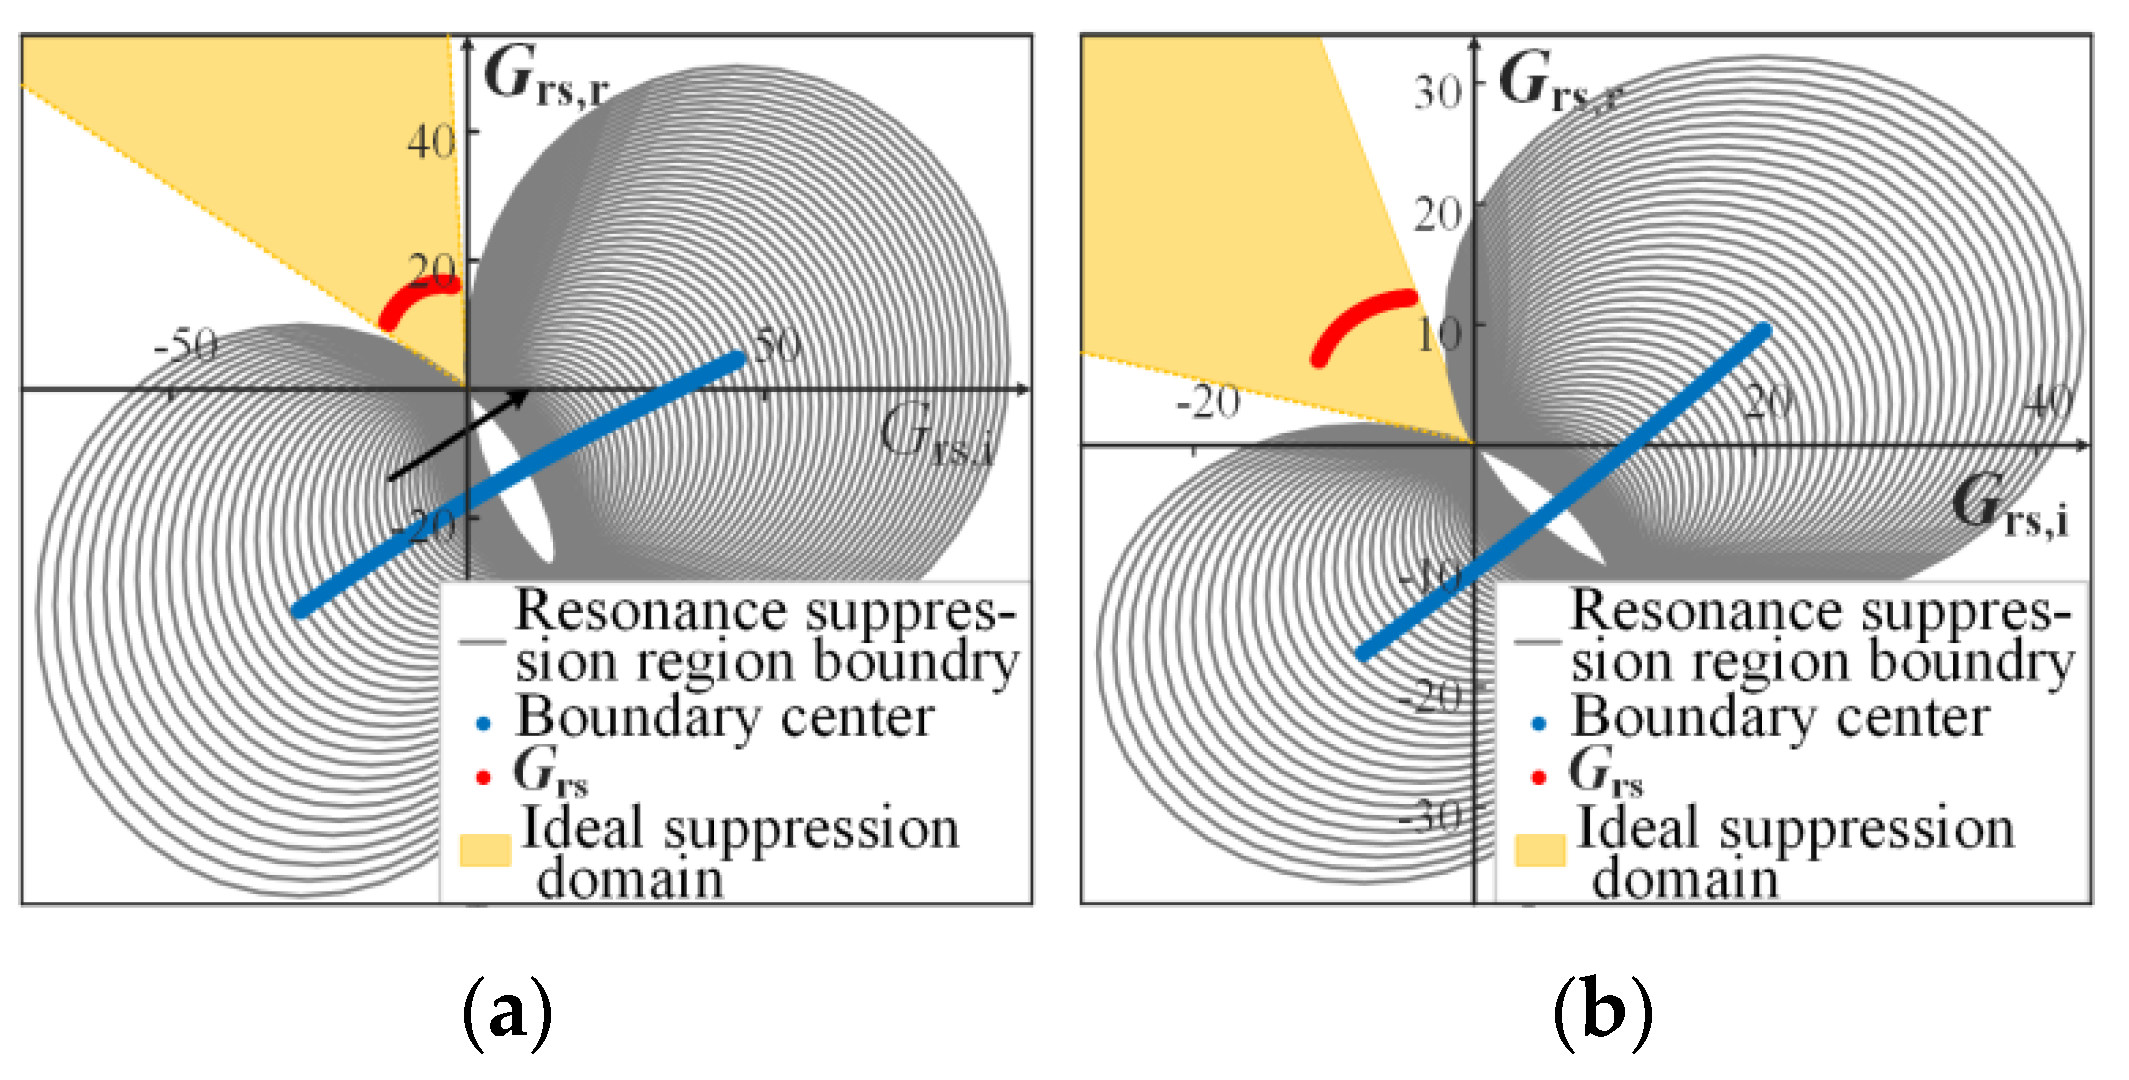
Figure 15.
Node impedance Bode diagram before and after resonance suppression for (a) 551.3 Hz and (b) 937.1 Hz.
Figure 15.
Node impedance Bode diagram before and after resonance suppression for (a) 551.3 Hz and (b) 937.1 Hz.

Figure 16.
Harmonic voltage waveform before and after resonance suppression for (a) 551.3 Hz and (b) 937.1 Hz.
Figure 16.
Harmonic voltage waveform before and after resonance suppression for (a) 551.3 Hz and (b) 937.1 Hz.
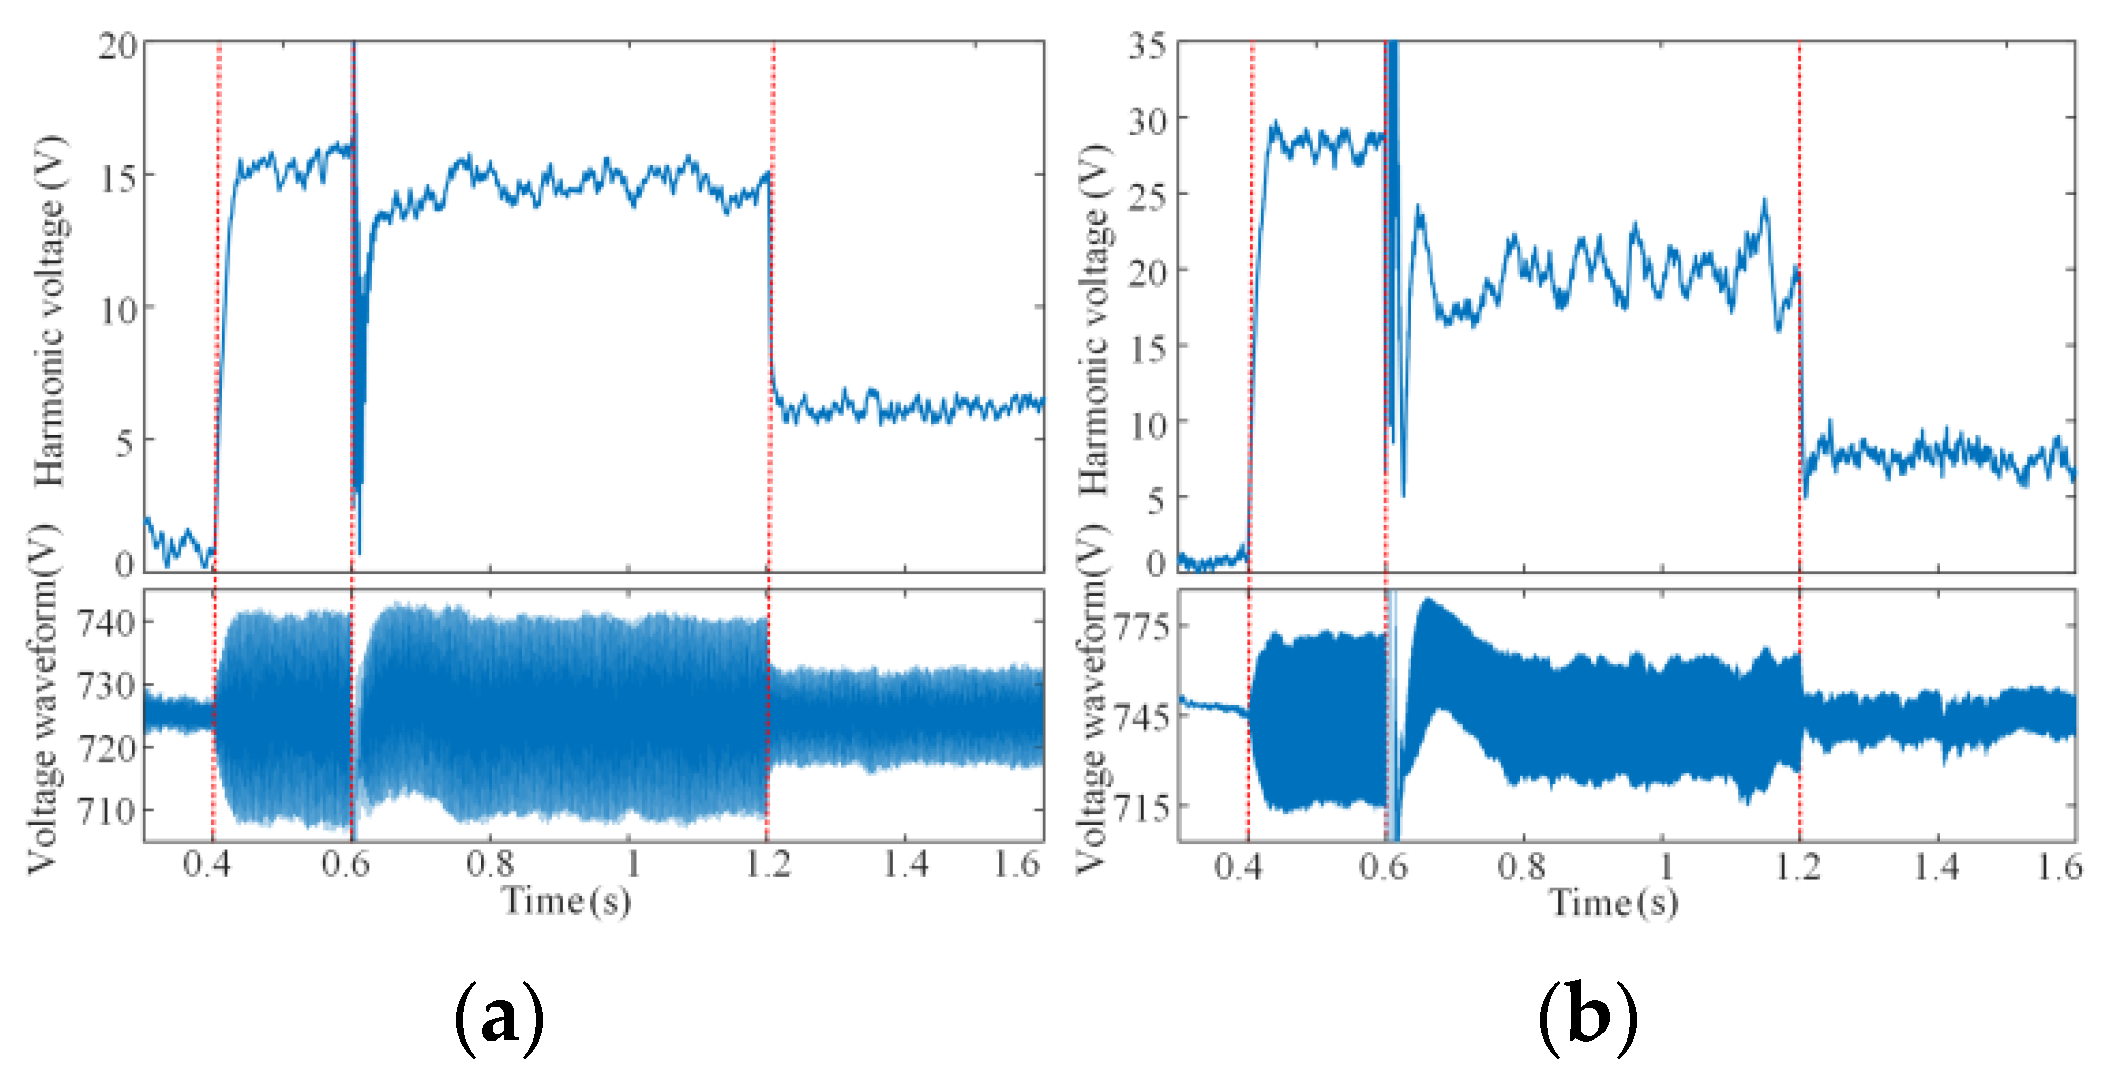
Figure 17.
Harmonic voltage waveform of other nodes before and after resonance suppression for (a) 551.3 Hz and (b) 937.1 Hz.
Figure 17.
Harmonic voltage waveform of other nodes before and after resonance suppression for (a) 551.3 Hz and (b) 937.1 Hz.


Table 1.
Parameter settings.
| Parameter | Value | Parameter | Value |
|---|---|---|---|
| L1-2 | 3 mH | P1 (Distributed power source in node 1) | 10 kW |
| C1 | 500 μF | P2 (Load converter in node 3) | 15 kW |
| L2-3 | 0.5 mH | P3 (Load converter in node 4) | 15 kW |
| C3 | 3000 μF | P6(ILC) | 20 kW |
| L2-4 | 0.6 mH | P7 (The injected power of node 0) | 18 kW |
| C4 | 400 μF | Uref,DC | 725 V |
| Base frequency | 50 Hz |
Table 2.
Resonance distribution of the node impedance matrix.
| Resonance Frequency | Zdc-dc | |
|---|---|---|
| Node | Maximum Value | |
| 551.3 Hz | Z(i,j) i, j = 1,4 | Z(2,2) 16.69 Ω |
| 937.1 Hz | Z(1,j), Z(i,1) i, j = 1,4 | Z(1,1) 29.51 Ω |
Table 3.
The DC active damper parameters.
| Parameter | Value | Parameter | Value |
|---|---|---|---|
| Cdc | 1500 μF | f0 | 50 Hz |
| Udc | 750 V | kp1 | 20 |
| P | 2 kW | ki1 | 333.33 |
| Cf | 50 μF | kp2 | 1.5 |
| Lf | 3 mH | ki2 | 0.05 |
| Switching frequency | 20 kHz |
Table 4.
Reshape admittance parameters of the DC active damper.
| G0 | ωc | ζ | T | |
|---|---|---|---|---|
| 551.3 Hz | 7 | 2π × 551.3 | 0.2 | 1.60 × 10⁻⁴ |
| 937.1 Hz | 3 | 2π × 937.1 | 0.11 | 8.00 × 10⁻⁵ |
Disclaimer/Publisher’s Note: The statements, opinions and data contained in all publications are solely those of the individual author(s) and contributor(s) and not of MDPI and/or the editor(s). MDPI and/or the editor(s) disclaim responsibility for any injury to people or property resulting from any ideas, methods, instructions or products referred to in the content. |
© 2024 by the authors. Licensee MDPI, Basel, Switzerland. This article is an open access article distributed under the terms and conditions of the Creative Commons Attribution (CC BY) license (https://creativecommons.org/licenses/by/4.0/).
Share and Cite
MDPI and ACS Style
Zhang, H.; Wang, Y.; Zhu, X.; Xu, Y.; Tao, S. DC Active Damper Control Strategy Based on Resonance Suppression Effectiveness Evaluation Method. Energies 2024, 17, 480. https://doi.org/10.3390/en17020480
AMA Style
Zhang H, Wang Y, Zhu X, Xu Y, Tao S. DC Active Damper Control Strategy Based on Resonance Suppression Effectiveness Evaluation Method. Energies. 2024; 17(2):480. https://doi.org/10.3390/en17020480
Chicago/Turabian StyleZhang, Huaying, Yingxin Wang, Xinyi Zhu, Yonghai Xu, and Shun Tao. 2024. "DC Active Damper Control Strategy Based on Resonance Suppression Effectiveness Evaluation Method" Energies 17, no. 2: 480. https://doi.org/10.3390/en17020480
Note that from the first issue of 2016, this journal uses article numbers instead of page numbers. See further details here.