
Blending Modification Technology of Insulation Materials for Deep Sea Optoelectronic Composite Cables
by
Shuhong Xie
1,*, 
Zhenzhen Chen
2,
Zhiyu Yan
2,
Xingyu Qiu
2,
Ming Hu
2,*,
Chunfei Gu
2,
Xindong Zhao
3 and
Kai Wang
3 1
Zhongtian Technology Group Co., Ltd., Nantong 226010, China
2
Zhongtian Technology Submarine Cable Co., Ltd., Nantong 226001, China
3
Key Laboratory of Engineering Dielectrics and Its Application, Harbin University of Science and Technology, Harbin 150080, China
*
Authors to whom correspondence should be addressed.
Energies 2024, 17(4), 820; https://doi.org/10.3390/en17040820
Submission received: 20 November 2023
/
Revised: 20 December 2023
/
Accepted: 22 December 2023
/
Published: 8 February 2024
(This article belongs to the Special Issue Recent Developments in Theories, Technologies and Applications of HVDC Insulation Systems)
Abstract
:The insulation layer of deep-sea optoelectronic composite cables in direct contact with high-pressure and highly corrosive seawater is required for excellent water resistance, environmental stress cracking resistance (ESCR), and the ability to withstand high DC voltage. Although high-density polyethylene (HDPE) displays remarkable water resistance, it lacks sufficient resistance to environmental stress cracking (ESCR). This article is based on a blend modification approach to mixing HDPE with different vinyl copolymer materials (cPE-A and cPE-B). The processing performance and mechanical properties of the materials are evaluated through rheological and mechanical testing. The materials’ durability in working environments is assessed through ESCR tests and water resistance experiments. Ultimately, the direct current electrical performance of the materials is evaluated through tests measuring space charge distribution, direct current resistivity, and direct current breakdown strength. The results indicate that, in the polyethylene blend system, the rheological properties and ESCR characteristics of HDPE/cPE-A composite materials did not show significant improvement. Further incorporation of high melt index linear low-density polyethylene (LLDPE) material not only meets the requirements of extrusion processing but also exhibits a notable enhancement in ESCR performance. Meanwhile, copolymerized polyethylene cPE-B, with a more complex structure, proves effective in toughening HDPE materials. The material’s hardness significantly decreases, and when incorporating cPE-B at a level exceeding 20 phr, the composite materials achieve excellent ESCR performance. In a simulated seawater environment at 50 MPa, the water permeability of all co-modified composite materials remained below 0.16% after 120 h. The spatial charge distribution and direct current resistivity characteristics of the HDPE, cPE-A, and LLDPE composite systems surpassed those of the HDPE/cPE-B materials. However, the HDPE/cPE-B composite system exhibited superior dielectric strength. The application of composite materials in deep-sea electro–optical composite cables is highly promising.
1. Introduction
In the context of marine economic development and the requirements of the underwater observation network, the development of lightweight submarine electro–optical composite cables holds significant importance for scientific research in coastal areas and connectivity among islands [1,2,3]. Submarine electro–optical composite cables not only exhibit advantages such as high transmission speed, good confidentiality, and high reliability but also facilitate the transfer of electric power for offshore monitoring devices and operational platforms [4,5,6]. The deployment of lightweight submarine optical cables (LW) at depths ranging from 1000 to 8000 m, operating in high-pressure and highly corrosive seawater environments, poses substantial challenges for the environmental durability of the sheath materials [7,8]. Simultaneously, to meet the long-distance power transmission requirements underwater, it is necessary to employ a high-voltage direct current transmission system. Therefore, the sheath of submarine electro–optical composite cables also serves as an insulating layer, demanding excellent direct current electrical performance and compliance with the specifications required for complex underwater conditions [9].
Considering the structural characteristics and operational conditions of lightweight submarine electro–optical composite cables, the cable’s insulation layer is in direct contact with seawater. Therefore, it is imperative to ensure that the material exhibits excellent direct current electrical performance and water resistance to maintain the reliability of insulation operation. Additionally, it should possess outstanding environmental stress crack resistance (ESCR) characteristics in highly corrosive seawater [10]. For submarine cables, conventional methods such as hot pressing and welding metallic sheaths are employed to achieve radial water resistance, ensuring water cannot penetrate the insulation layer structure [10]. Given the structural requirements and operating conditions of lightweight submarine electro–optical composite cables, the use of metallic sheaths as a water-resistant structure is not feasible. High-density polyethylene (HDPE) is widely utilized as an insulation and sheath material due to its excellent mechanical strength, toughness, and processability. Its high crystallinity and dense crystalline phase contribute to maintaining low water absorption over the cable’s economic lifespan, thereby ensuring stable insulation performance [11]. However, the inferior ESCR performance of HDPE, resulting from its chain structure and crystalline characteristics, makes it prone to cracking in highly corrosive seawater. The widely accepted theoretical model for studying the cracking characteristics of polymer materials is the Slow Crack Growth (SCG) model proposed by A. Lustiger and R. L. Marhan, which is based on the folded chain model. According to this model, the process of environmental stress cracking results from the fracture of crystalline layers, and ESCR is induced by microscopic cracks between crystallites [12]. To address this issue, a blending modification approach is proposed, aiming to enhance the molecular weight distribution of the polymer system and introduce branched structures, effectively suppressing ESCR occurrences [13,14,15]. Resins with broad molecular weights exhibit increased intermolecular connections between crystalline layers, making slippage more challenging, while the introduction of long side chains enhances entanglement between crystallites, increases the number of tie molecules between crystals, and improves ESCR performance [16].
To maintain the water resistance and enhance the ESCR performance of HDPE materials, a blend modification of HDPE with two copolymerized polyethylene materials (cPE-A and cPE-B) was employed. The extrusion and rheological properties of the materials were evaluated through single-screw extrusion performance testing and melt index determination. Mechanical and physical properties, including the material’s mechanical performance and flexibility, were characterized through mechanical testing. Subsequently, water resistance and ESCR performance were examined to investigate the environmental tolerance of the blend-modified materials. Finally, the direct current electrical properties of the materials were assessed through space charge testing, DC resistivity, and breakdown strength measurements.
2. Materials and Methods
2.1. Materials
HDPE and linear low-density polyethylene (LLDPE) resins were procured from Sinopec in China. The selected elastomers, cPE-A and cPE-B, exhibited significantly higher ethylene content in cPE-A than cPE-B, with melting temperatures of approximately 120 °C and 54 °C, respectively. Antioxidant 1010, produced by BASF in Germany, was utilized with an effective content exceeding 98%. The parallel twin-screw extruder was acquired from Harbin Hapu Electric Co., Ltd., with a length-to-diameter ratio of 40:1.
The blend materials were fed into the feeding port of the parallel twin-screw extruder, according to the ratios specified in Table 1, with a screw speed of 30 rpm. The temperature settings are illustrated in Figure 1. Subsequently, the extruded materials underwent water cooling and pelletization to produce the blend-modified HDPE composite materials. Further, the materials were placed in various molds according to the thickness requirements and molded at 140 °C by hot pressing with a stepwise pressure increase of 5 MPa, 10 MPa, and finally 15 MPa after initially completely melting the material under 0 MPa pressure. After thermal compression molding, the specimens were water-cooled to room temperature. The prepared samples were subjected to vacuum treatment at 80 °C in a vacuum oven for 48 h to eliminate internal stresses.
2.2. Mechanical and Physical Properties and Extrusion Performance Test
Tensile testing was conducted using the CMT6000 multifunctional electronic tensile machine produced by MTS Systems Corporation. The tests followed the stress–strain experiment protocol outlined in ISO 527-2:1993 [17], measuring the stress–strain curves of the specimens. The specimens used were dumbbell-shaped, conforming to the 5A type specified with a thickness of 1 ± 0.05 mm. The testing was performed at a tensile speed of 50 mm/min.
The Shore hardness testing involved specimens with a thickness of 4 mm, where a durometer needle was pressed into the sample for a duration of 15 s, and the hardness value was recorded.
The melt flow rate test (MI) was conducted in accordance with the ISO 1133:1997 standard for determining the melt flow rate of the polymer melt [18]. During the test, the materials were placed in a standard orifice at a temperature set to 190 °C with a load of 2.16 kg. The mass of materials extruded through the standard orifice within 10 min was measured.
The single-screw extruder, with a length-to-diameter ratio of 25:1, was manufactured by Harbin Hapu Electric Co., Ltd. (Harbin, China). The extrusion process utilized a 1 mm-diameter capillary die. The temperatures in the four zones of the single-screw extruder were set at 170 °C, 180 °C, 190 °C, and 200 °C, with a mold temperature of 200 °C. The test commenced by gradually increasing the screw speed at a rate of 1 rpm/5 min, reaching up to 10 rpm. Subsequently, the screw speed was increased at a rate of 5 rpm/5 min while observing the surface morphology of the extruded filament. The occurrence of melt fracture was noted, and the corresponding screw speed was defined as the maximum extrusion speed.
2.3. Environmental Stress Cracking Resistance Test and Crystalline Characteristics
The water resistance test procedure involves placing a 1 mm-thick flat specimen in a simulated seawater environment with a sodium chloride (NaCl) concentration of 3.5%. The test is conducted under a pressure of 50 MPa, with seawater exposure lasting for 120 h. The amount of seawater infiltration is determined by measuring the mass change in the specimen using a precision balance (accuracy: 0.1 mg). The seawater infiltration ratio is then calculated based on the measured values [19].
The environmental stress cracking resistance characteristics were evaluated according to the IEC 60811-4-1:2004 standard [20]. The test solution consisted of a 10% volume fraction of nonylphenol polyethylene glycol ether (TX-10) in water. Ten specimens for each formulation were placed in test tubes and positioned in a constant-temperature water bath at 50 °C. The time (F0) at which any specimen exhibited cracking was recorded as the environmental stress cracking time. The specimens had a thickness of 2 mm, and the scratch depth was maintained between 0.3 and 0.4 mm.
The differential scanning calorimeter used was a Mettler-Toledo DSC822e, Greifensee, Switzerland. Before the experiment, 5–10 mg of the sample to be tested was weighed using a high-precision electronic balance, loaded into a closed aluminum crucible, and placed in a designated area in the sample chamber of the measuring instrument. The entire melting and crystallization process is carried out under nitrogen protection, with a heating rate of 5 °C/min.
2.4. DC Performance Test
The space charge testing is based on the principle of the pulse electroacoustic (PEA) method, with a polarizing field strength of 40 kV/mm. The polarization duration is set at 1800 s, followed by the removal of the DC high voltage and short-circuiting the high voltage electrode to ground, and then the testing period is established at 1800 s. The specimen thickness is 200 μm. This procedure allows for the acquisition of information regarding the distribution of space charge and electric field within the specimen during the polarization and short-circuiting processes.
The direct current resistivity test utilized a three-electrode testing system with a specimen thickness of 200 μm and aluminum electrodes deposited by vapor deposition. The high-voltage electrode had a diameter of 76 mm, the measuring electrode had a diameter of 50 mm, and the guard electrode had inner and outer diameters of 74 mm and 54 mm, respectively. The three-electrode system was placed within a grounded shielding box. A polarization voltage of 10 kV/mm was applied to the specimen for 15 min, followed by the measurement of the current passing through the specimen.
The direct current breakdown strength was measured using a two-electrode system with a high-voltage electrode diameter of 26 mm and a ground electrode diameter of 70 mm. The larger cylindrical electrode allows for comprehensive exposure of defects in the specimen. The specimen thickness was 100 μm, and during the test, both the specimen and electrodes were immersed in dimethyl silicone oil to prevent surface discharge and breakdown occurrences.
3. Results
3.1. Mechanical and Extrusion Performance Test
Initially, the rheological characteristics of the three fundamental materials, HDPE, LLDPE, and cPE-A, were tested, and the results are depicted in Figure 2. From the graph, it can be observed that the viscosity of all three materials decreases with increasing shear rate, exhibiting evident pseudoplastic fluid behavior. Among the three base resins, cPE-A demonstrates the highest shear stress and is more prone to experiencing melt fracture phenomena. Within the tested shear rate range, both HDPE and LLDPE exhibit smooth melt surfaces without melt fracture. In contrast, cPE-A exhibits pronounced melt fracture at a shear rate of 3.6 × 10³ s−1, indicating inferior extrusion performance.
The mechanical and physical properties, as well as the extrusion characteristics of the materials, are presented in Table 2. The blend materials exhibit a slight increase in melt index (MI) relative to HDPE, with all seven materials having MI within an acceptable range (0.8–1.0 g/10 min). Among them, the 4H/3A/3LL material has the highest MI at 1.0 g/10 min, attributed to the lubricating effect of LLDPE, which has a higher MI, reducing material viscosity and significantly increasing the MI of the composite materials. In the HDPE/cPE-B blend system with the lower melting point of cPE-B, a marginal increase in MI is observed with an increase in cPE-B content, yet it remains below 1.0 g/10 min, indicating favorable melt viscosity.
In terms of the extrusion processing performance of the composite materials, in the HDPE/cPE-A blend system, the critical speed at which melt fracture occurs significantly decreases with the increasing content of cPE-A. The addition of LLDPE, with its lower melt viscosity, notably improves the extrusion performance of the composite material, increasing from 50 rpm for 4H/6A to 80 rpm for 4H/3A/3LL. In the cPE-B blend system, the 85H/15B, 80H/20B, and 75H/25B composite materials systems all exhibit excellent extrusion performance.
The tensile performance results for the materials in Table 2 indicate that among the three polyethylene resins, cPE-A exhibits the highest tensile strength, while LLDPE demonstrates excellent elongation at break. In the HDPE/cPE-A blend system, an increase in cPE-A content leads to a significant enhancement in tensile strength. The introduction of LLDPE further improves the elongation at the break of the blend system, albeit with a slight decrease in tensile strength. In the HDPE/cPE-B blend system, the addition of a smaller amount of cPE-B has a minimal impact on the tensile performance of the composite materials, maintaining a tensile strength similar to HDPE while slightly increasing the elongation at break.
Further analysis of the Shore hardness test results from Table 2 reveals that among the base resins, HDPE and cPE-A exhibit higher hardness values, measuring 58.3 HD and 59.1 HD, respectively, while LLDPE has a lower hardness of approximately 48.5 HD. The binary blend of HDPE and cPE-A, as well as the ternary blend of HDPE, cPE-A, and LLDPE, both fall within the range of 57–58 HD, showing a slight decrease compared to HDPE. In the HDPE/cPE-B blend, the thermoplastic elastomer cPE-B imparts better flexibility to the blends, leading to a significant reduction in hardness as the cPE-B content increases. The rheological and mechanical properties of these materials meet the requirements for the insulation layer of underwater fiber optic cables.
3.2. Environmental Stress Cracking Resistance Test
The three base polyethylene resins exhibit distinct environmental stress cracking resistance, closely related to factors such as molecular weight distribution, branching degree, and crystallinity. The results of the environmental stress cracking test are presented in Figure 3. HDPE, with relatively low branching, features shorter and sparser chain lengths, as well as weaker interchain entanglement, resulting in the shortest time to crack. Clear transverse cracks appear after a 21-day environmental stress cracking experiment. As the chain density and length increase gradually, both cPE-A and LLDPE show a significant increase in time to cracking, reaching 800 h, with no visible cracking observed after the environmental stress cracking test.
The ESCR times for the seven HDPE composite materials are depicted in Figure 4 and Figure 5. In Figure 4, it is evident that the ESCR times of the blend-modified materials are significantly higher compared to the HDPE materials, which exhibited cracking at 26 h. In Figure 4a, as the HDPE component decreases to 40%, the ESCR time of 4H/6A increases to 356 h. Introducing LLDPE with more branches without changing the proportion of HDPE further enhances the ESCR characteristics to over 500 h. In Figure 5a, adding a relatively small amount of cPE-B achieves a significant improvement, with ESCR times exceeding 600 h for 80H/20B and 75H/25B. According to the standard, the time for any specimen to exhibit cracking (F0) should exceed 21 days (504 h). Based on the test results, 4H/4A/2LL, 4H/3A/3LL, 80H/20B, and 75H/25B all meet the requirements.
The cracking conditions of the specimens are illustrated in Figure 4b and Figure 5b. From the graphs, it is evident that HDPE material exhibits severe and extensive cracking, with deep and long cracks. The blending modification of HDPE with cPE-A significantly improves the cracking phenomenon. In 5H/5A, cracking occurs at 312 h, but the cracks become finer and progress slowly. The growth in the depth direction slows down, and with a further increase in the cPE-A content, 4H/6A shows no visible cracking within the specified time. To enhance the extrusion performance of the composite materials while strengthening their ESCR performance, the introduction of LLDPE yields optimal ESCR characteristics in the ternary blend. In the cPE-B blend system, the addition of 15 phr cPE-B in 85H/15B noticeably suppresses cracking, with only subtle cracks appearing at 384 h. Further increasing the cPE-B content in 80H/20B and 75H/25B results in ESCR times exceeding 600 h without any visible cracking in any specimen.
For blend systems, the higher blend branching in cPE-A within the HDPE materials enhances entanglement between lamellae, increasing the interaction energy between crystalline regions. This results in the inhibition of lamellar slippage and disentanglement under polar solvent immersion, leading to a higher ESCR time compared to HDPE alone. Further introduction of highly branched LLDPE reinforces molecular chain entanglement between different components. The short branches of LLDPE enhance intermolecular chain entanglement, and LLDPE chains filling the interlamellar spaces further improve inter-lamellar interactions, imparting better toughness to the composite materials. In the case of HDPE modified with the lower melting temperature elastomer cPE-B, which has a high degree of branching, it not only increases toughness and reduces material modulus but also introduces numerous branch structures on the long molecular chains, reinforcing interlamellar interactions. This allows for achieving excellent ESCR characteristics with a relatively low content of cPE-B.
3.3. Water Blocking Performance Test
The water barrier properties of the three polyethylene resins are illustrated in Figure 6a. The graph reveals distinct water barrier performances based on the different chain structures of the polyethylene resins. HDPE and cPE-A exhibit lower water permeability, while the structure of LLDPE, characterized by numerous short branches, undergoes significant changes in its aggregated state. The material’s lower crystallinity compared to the other two resins makes it prone to water intrusion through the amorphous regions when subjected to a high-pressure NaCl solution, resulting in inferior water barrier performance.
The water barrier performance of the blend-modified HDPE composite materials is illustrated in Figure 6b,c. From the graphs, it can be observed that the water barrier performance of the blend-modified HDPE materials varies with the reduction in the proportion of HDPE. The water permeability of the HDPE/cPE-A blend components is shown in Figure 6b. Due to the good water barrier properties of HDPE and cPE-A, the binary blend components maintain relatively low water permeability. However, the introduction of LLDPE to improve processing performance further reduces the water barrier performance of the composite materials. The water permeability of 4H/4A/2LL and 4H/3A/3LL materials increases by 24.8% and 33.1%, respectively, compared to HDPE. Figure 6c depicts the water barrier characteristics curve of the elastomer cPE-B blend-modified HDPE materials. It is evident that the water permeability of the low-added HDPE/cPE-B composite material significantly increases compared to HDPE. Under a pressure of 120 h, the water content of the 75H/25B material increases to 0.159%. As an elastomer, cPE-B, dispersed in HDPE, inhibits the crystallization behavior of HDPE. The reduced crystallinity, combined with the void effect of cPE-B, increases the water absorption capacity, leading to a decrease in water barrier performance. However, considering the actual underwater conditions of deep-sea fiber-optic composite cable insulation layers, all composite materials meet the requirements for water resistance [21].
3.4. Crystallinity Test
The crystalline characteristics of HDPE and compatibilized modified HDPE materials are illustrated in Figure 7. It can be observed from the graph that the compatibilized modified material exhibits crystalline and melt peak temperatures similar to those of HDPE resin. To further quantitatively characterize the variations in material crystallinity, the following Equation (1) is employed [22]:
where ΔHm (J/g) represents the measured melt enthalpy of the sample, and ΔH100 (J/g) is the theoretical melt enthalpy at 100% crystallinity, with a standard value of 293 (J/g) [19].
The crystalline and melting characteristics, along with the crystallinity values for each material, are presented in Table 3. It is evident that the compatibilized modified material maintains the same crystalline and melting properties as HDPE. However, due to the introduction of highly branched resins through compatibilization, the crystallinity of the material experiences varying degrees of reduction. Among the polyethylene system blend components, the reduction in crystallinity is less pronounced, whereas POE-compatible modified HDPE exhibits a significant decrease in crystallinity.
3.5. Space Charge Test
Considering the application of insulation materials in DC submarine power cables, the distribution of space charges is a crucial parameter for the reliability of insulation layer materials. The accumulation of space charges can lead to a decrease in the dielectric performance of the insulation layer and even result in the generation of extreme electric fields, causing local discharge and breakdown. Therefore, it is essential to focus on the space charge distribution characteristics of the blended materials. Among the seven materials, only 4H/4A/2LL, 4H/3A/3LL, 80H/20B, and 75H/25B meet the criteria for ESCR performance and water resistance and exhibit ideal extrusion characteristics. Consequently, space charge tests were conducted only on these four materials, and the test results are presented in Figure 8.
From Figure 8, it is evident that the space charge characteristics of the PE blend system are significantly superior to the cPE-B blend system. In the PE blend system, the dominant charge injection is of the same polarity as the electrode, while in the cPE-B blend system, there is an accumulation of opposite-polarity charges near the electrode. During the polarization process, HDPE material exhibits a pronounced anodic injection of holes. In the initial pressurization period up to 1800 s, approximately 1.98 C/m3 of positive charges accumulate inside the specimen. With the introduction of cPE-A and LLDPE, the space charge distribution in the specimen tends to become more moderate. As the proportion of cPE-A decreases and LLDPE increases, the phenomenon of electron injection near the cathode is noticeably weakened. The introduction of LLDPE with higher branching reduces the crystallinity of the material, enhancing the conformation of molecular chain segments in the amorphous region. Since charge transport tends to occur within the amorphous region, 40H/40A/20LL exhibits the phenomenon of simultaneous cathodic and anodic injection. With an increase in the amount of added LLDPE, the crystallinity of the composite material further decreases, increasing the free volume of the system. This strengthens the anodic hole injection phenomenon, while positive space charges undergo recombination near the cathode, resulting in a lower accumulation of negative charges around 4H/3A/3LL. During the short-circuiting process, HDPE experiences a faster charge dissipation rate, whereas the slow dissipation rate in the ternary blend system, due to the introduction of LLDPE, is attributed to the reduction in crystallite size, increased surface area of crystalline and non-crystalline regions, and the enhanced polarization charge at the interface.
cPE-B material, compared to cPE-A, possesses longer side chains and higher toughness, playing a robust role in reducing material crystallinity and altering its collectivity. Additionally, based on existing co-polymerization processes for elastomeric materials, cPE-B resin contains more catalyst impurities, resulting in inferior electrical properties. As observed, the HDPE blended with cPE-B composite materials exhibits a noticeable accumulation of opposite polarity charges in the early stages of pressurization, gradually decreasing with prolonged pressurization time. This is primarily attributed to the dissociation of impurities and ion migration within the composite materials. In the later stages of pressurization, samples of 80H/20B and 75H/25B still accumulate approximately −3.15 C/m3 and −2.34 C/m3 of negative charges, respectively. The extent of the electrode peak shift indicates that the injection phenomenon intensifies with the increase in cPE-B content. The short-circuit process suggests that blending with cPE-B degrades the material’s space charge characteristics. The rise in cPE-B content exacerbates both electrode injection and space charge accumulation phenomena.
3.6. DC Breakdown and Volume Resistivity Test
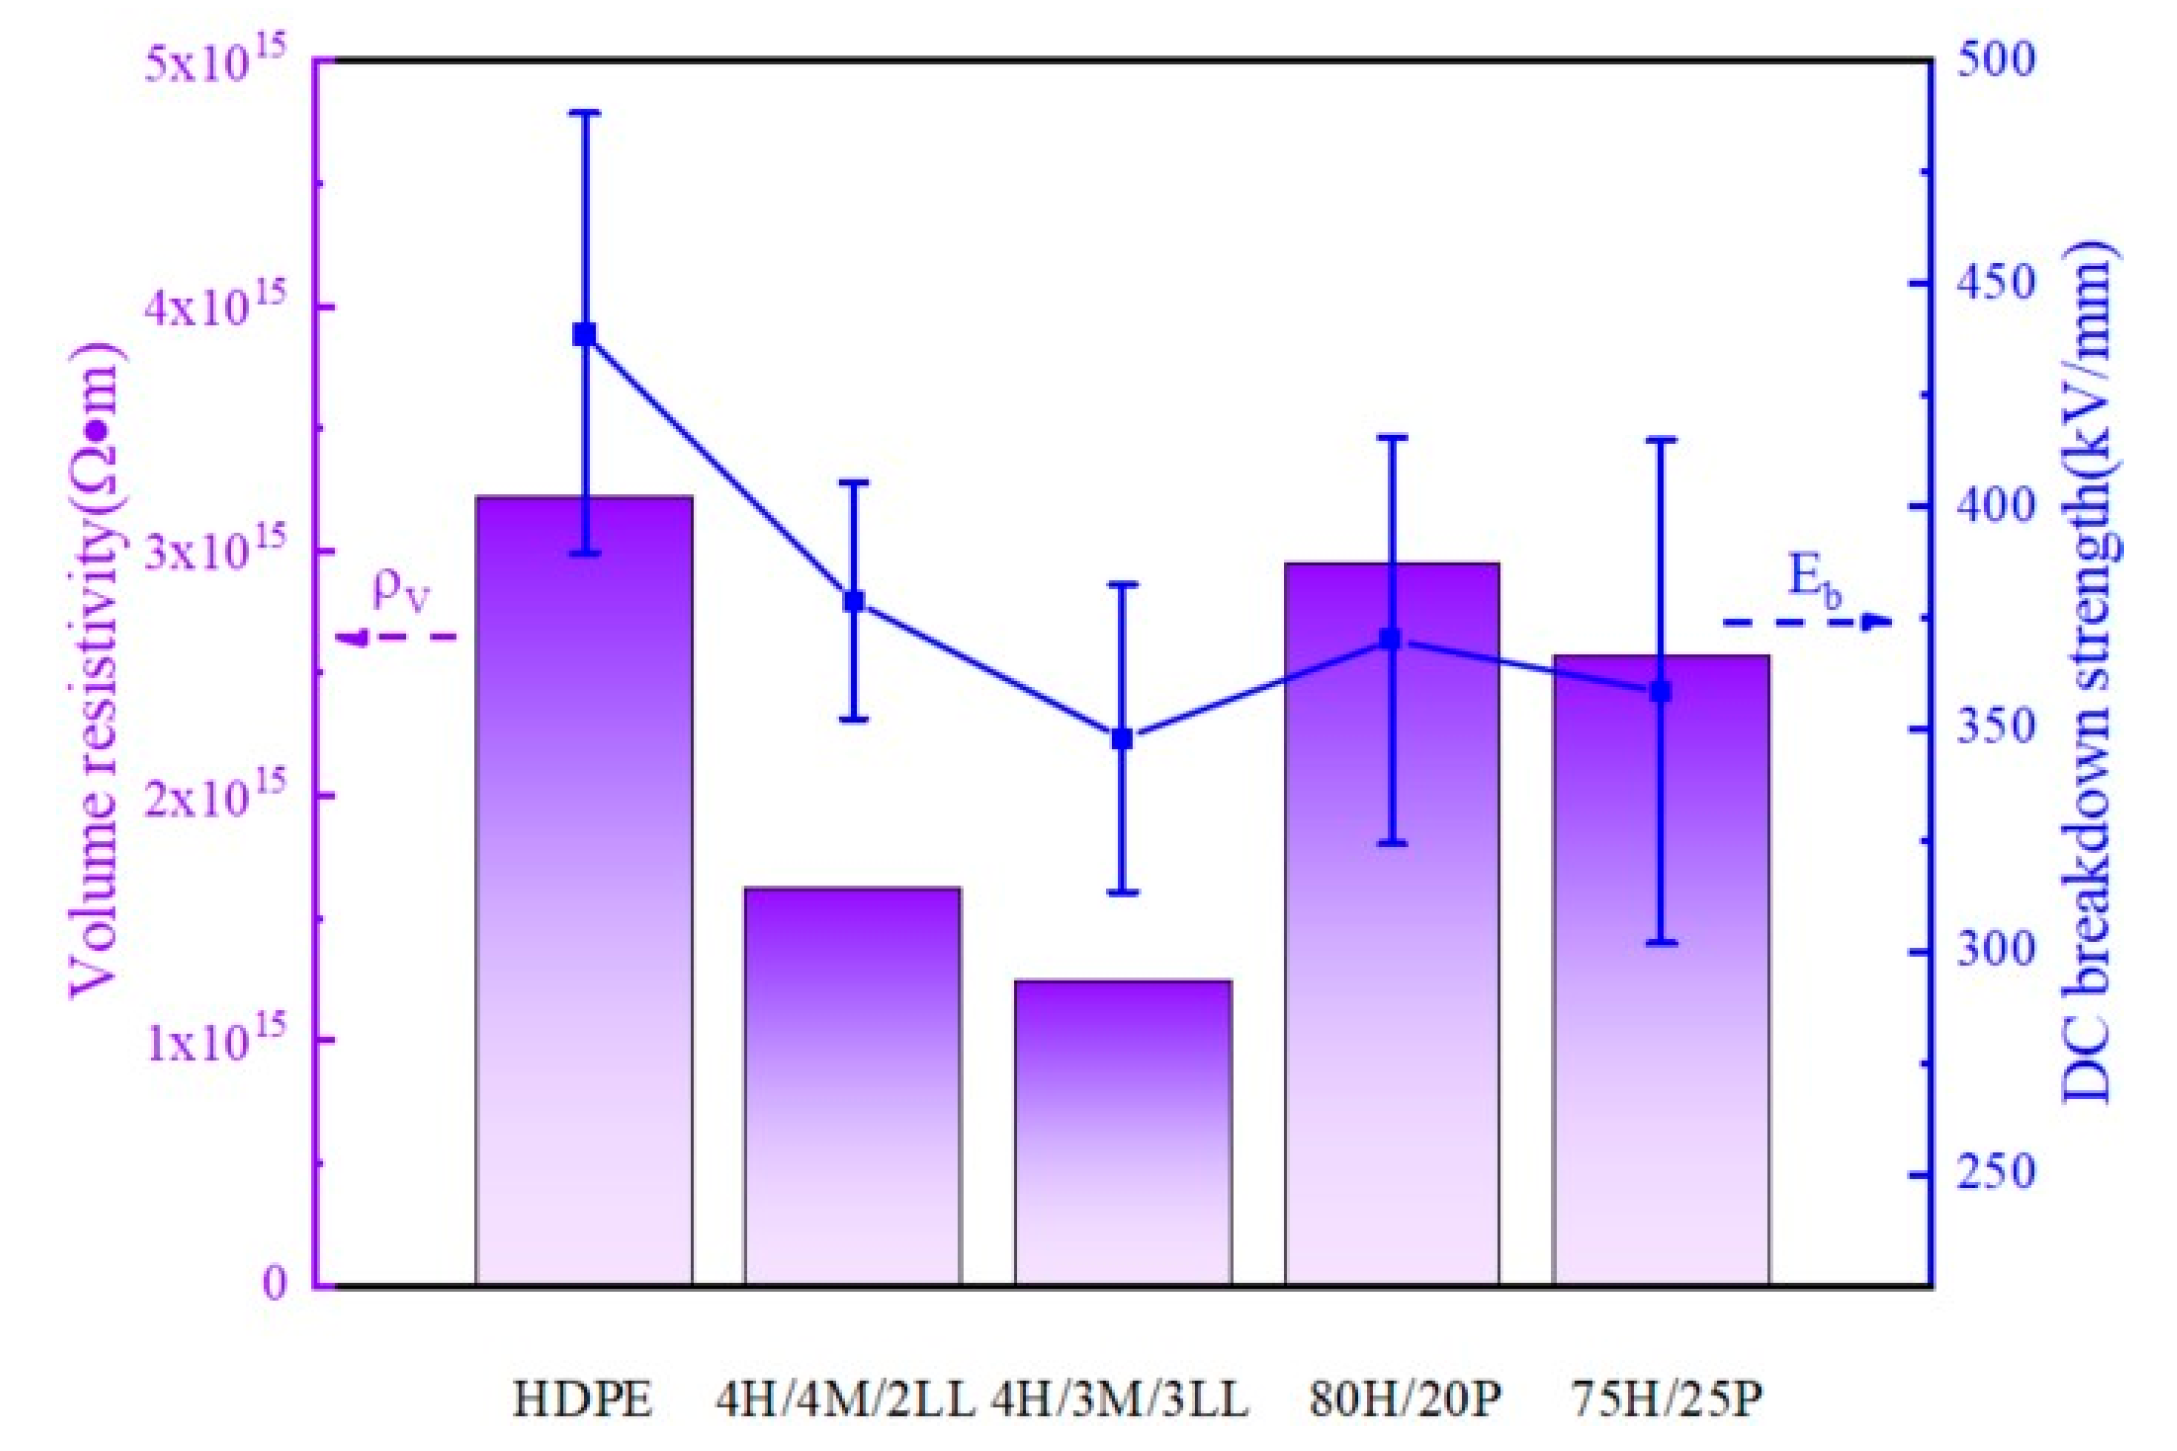
The results of DC breakdown strength and volume resistivity tests for HDPE and four composite materials are presented in Figure 9. The findings indicate a significant decrease in characteristic breakdown strength and volume resistivity for composite materials compared to HDPE. The variation in volume resistivity reveals that the HDPE/cPE-B composite system maintains a higher volume resistivity, while the HDPE/cPE-A/LLDPE ternary blend experiences a noticeable decrease, closely associated with changes in crystallinity and crystal size in the modified materials. The HDPE/cPE-B material, with poor compatibility due to the presence of a two-phase interface, generates structural defects that induce shallow traps, resulting in a higher direct current resistivity than the HDPE/cPE-A material. DC breakdown strength testing reveals a significant reduction in characteristic breakdown strength for the four composite materials modified from HDPE. Among them, 4H/4A/2LL and 4H/3A/3LL show a less pronounced decrease compared to the cPE-B blend, with a dispersion of breakdown strength superior to the cPE-B blend. Due to the better compatibility of HDPE/cPE-A compared to HDPE/cPE-B composite materials, the two-phase interface is more compact. However, the introduction of cPE-A material also reduces the crystallinity of the composite material. The increase in the proportion of the amorphous region expands the free volume of the blend, increases the average free path of electrons, leading to an increased probability of high-energy electrons, and results in a decrease in breakdown strength. However, the reduction is lower than that in the HDPE/cPE-B composite material. This is because the elastic cPE-B material has a more significant impact on the crystallinity of HDPE material, and cPE-B uses more catalysts in the synthesis process, thereby significantly degrading the dielectric strength of the material [23]. In summary, considering the insulation layer requirements for submarine composite optoelectronic cables, all four composite materials maintain high DC resistivity and withstand electrical strength, meeting the operational demands of the cable.
4. Discussion
In accordance with the deployment environment of lightweight submarine optical cables, the stress corrosion cracking process of the insulation layer in seawater was simulated by configuring a polar solution. The 50 MPa water permeability test effectively explores the water-resistant characteristics of composite materials. Considering the requirements of high-voltage direct current transmission, space charge tests, resistivity, and dielectric strength tests were conducted to evaluate the direct current electrical properties of materials. Finally, to meet the needs of actual cable extrusion processes, the extrusion process characteristics were tested. The results indicate that as the proportion of long-chain and highly branched blended materials (cPE-A and cPE-B) increases, the branching degree of the composite polymer increases. As shown in Figure 7, this results in a slight decrease in the material’s crystallinity. However, due to the effects of entanglement caused by the long chains, the intergranular forces increase, leading to a significant improvement in the material’s resistance to environmental stress cracking. The decrease in crystallinity, however, results in an increase in the amorphous region of the material, leading to a slight decrease in water resistance as water paths and water content further increase. To improve the extrusion performance of HDPE/cPE-A composite materials, a high-melt-index LLDPE material composite system can address the decrease in extrusion performance caused by the high proportion of cPE-A and ensure the material’s ESCR performance and water resistance. From Figure 8 and Figure 9, it can be observed that although HDPE/cPE-B composite materials have higher resistivity and dielectric strength, the cPE-A blend-modified HDPE material, with a lower branching degree, has a smaller impact on the material’s crystallinity. Relative to cPE-B modification, it can provide better distribution of space charges, and cPE-A, compared to cPE-B material, has a chain structure more similar to HDPE, making the compatibility of the composite material superior, effectively reducing interfacial charges and suppressing electric field distortion within the insulation layer. In the resin polymerization process, cPE-A material uses fewer metallocene catalysts, mitigating the accumulation of polarity charges manifested as impurity dissociation issues. In summary, to balance the extrusion performance required for production, the physicochemical properties required by cables, and the direct current electrical performance, blend modification can synergize the basic properties of various base resins, achieving a rational distribution of multiple properties and obtaining insulation materials with optimal performance.
5. Conclusions
In alignment with the operational and installation conditions of lightweight submarine composite optical cables, the objective is to enhance the environmental stress cracking resistance and maintain the water resistance of HDPE. Different composite-modified HDPE materials were prepared using cPE-A, LLDPE, and cPE-B. The materials underwent tests for mechanical and physical properties, extrusion performance, environmental durability, and DC electrical properties. The study reveals that, due to the poor extrusion processing characteristics of cPE-A, HDPE/cPE-A exhibits severe melt fracture. To address this issue without compromising the HDPE proportion, introducing LLDPE with a higher melt flow index improves the extrusion processing characteristics. The addition of highly branched cPE-A, LLDPE, and cPE-B significantly enhances the environmental stress cracking resistance of HDPE composite materials. Notably, the elastomeric cPE-B-modified HDPE outperforms HDPE/cPE-A and HDPE/cPE-A/LLDPE systems, providing a better improvement with a small amount of blending to achieve a substantial increase in environmental stress cracking resistance. While the water resistance of the composite materials experiences a slight decrease, it still meets the material’s operational requirements. The ternary blend of HDPE, cPE-A, and LLDPE demonstrates improved space charge characteristics compared to HDPE, showing inhibited space charge injection phenomena. However, the space charge characteristics of the HDPE/cPE-B blend significantly degrade, which correlates with the impurity content and crystallite size of the composite material. HDPE/cPE-B exhibits superior volume resistivity and DC breakdown strength compared to HDPE/cPE-A/LLDPE. The four composite materials—4H/4A/2LL, 4H/3A/3LL, 80H/20B, and 75H/25B—meet the requirements for the insulation layer/sheath of lightweight submarine composite optical cables, demonstrating significant practical value.
Author Contributions
Conceptualization, S.X. and M.H.; methodology, M.H.; validation, X.Q. and K.W.; formal analysis, X.Z.; investigation, Z.C.; resources, M.H. and X.Q.; data curation, S.X. and C.G.; writing—original draft preparation, Z.C., X.Q., C.G., X.Z., and K.W.; writing—review and editing, S.X., Z.Y., and M.H.; visualization, Z.Y. and K.W.; supervision, S.X.; project administration, Z.Y. and M.H.; funding acquisition, M.H. All authors have read and agreed to the published version of the manuscript.
Funding
This research received no external funding.
Data Availability Statement
Data are contained within the article.
Conflicts of Interest
Author Shuhong Xie was employed by the company Zhongtian Technology Group Co., Ltd. Authors Zhenzhen Chen, Zhiyu Yan, Xingyu Qiu, Ming Hu and Chunfei Gu were employed by the company Zhongtian Technology Submarine Cable Co., Ltd. The remaining authors declare that the research was conducted in the absence of any commercial or financial relationships that could be construed as a potential conflict of interest.
References
- Perveen, R.; Kishor, N.; Mohanty, S.R. Off-shore wind farm development: Present status and challenges. Renew. Sustain. Energy Rev. 2014, 29, 780–792. [Google Scholar] [CrossRef]
- Xie, Y.; Wang, C. Spatial pattern of global submarine cable network and identification of strategic pivot and strategic channel. J. Geogr. Sci. 2023, 33, 719–740. [Google Scholar] [CrossRef]
- Ide, S.; Araki, E.; Matsumoto, H. Very broadband strain-rate measurements along a submarine fiber-optic cable off Cape Muroto, Nankai subduction zone, Japan. Earth Planets Space 2021, 73, 63. [Google Scholar] [CrossRef]
- Taga, H.; Nakagawa, S.; Goto, K. An experimental study of transmission distance limitation for the submarine cable system using C-band EDFA repeaters and a demonstration of 96 WDM, 10 Gbit/s, over 12,000 km transmission having sufficient engineering margin. In Proceedings of the OFC 2003 Optical Fiber Communications Conference, Atlanta, GA, USA, 28 March 2003. [Google Scholar]
- Xu, Z.N.; Hu, Z.W.; Zhao, L.J.; Zhang, Y.; Yang, Z.; Hu, S.X.; Li, Y.Q. Application of temperature field modeling in monitoring of optic-electric composite submarine cable with insulation degradation. Measurement 2019, 133, 479–494. [Google Scholar] [CrossRef]
- Asakawa, K.; Kojima, J.; Mitsuzawa, K. Computer simulation of the electric transmission characteristics of LW underwater optical telecommunication cables. In Proceedings of the Europe Oceans 2005, Brest, France, 20–23 June 2005. [Google Scholar]
- Chen, Y.H.; Xiao, S.; Li, D. Stability Analysis Model for Multi-Node Undersea Observation Networks. Simul. Model. Pract. Theory 2019, 97, 101971. [Google Scholar] [CrossRef]
- Guo, Y.; Marin, J.M.; Ashry, I. Submarine optical fiber communication provides an unrealized deep-sea observation network. Sci. Rep. 2023, 13, 15412. [Google Scholar] [CrossRef] [PubMed]
- Chen, Y.; Xiao, S.; Li, D. Flashover discharge model of transmission lines in subsea observation network. Simul. Model. Pract. Theory 2020, 103, 102094. [Google Scholar] [CrossRef]
- Mei, W.; Pan, W.; Chen, T.; Song, G.; Di, J. Research and design of DC500kV optical fiber composite submarine cable. In Proceedings of the 2017 4th IEEE International Conference on Engineering Technologies and Applied Sciences (ICETAS), Salmabad, Bahrain, 29 November–1 December 2017. [Google Scholar]
- Li, D.; Zhou, L.; Wang, X. Effect of Crystallinity of Polyethylene with Different Densities on Breakdown Strength and Conductance Property. Materials 2019, 12, 1746. [Google Scholar] [CrossRef] [PubMed]
- Lustiger, A.; Markham, R.L. Importance of tie molecules in preventing polyethylene fracture under long-term loading conditions. Polymer 1983, 24, 1647–1654. [Google Scholar] [CrossRef]
- Contino, M.; Andena, L.; Valle, V.L. A comparison between K and G approaches for a viscoelastic material: The case of environmental stress cracking of HDPE. Mech. Time-Depend. Mater. 2020, 24, 381–394. [Google Scholar] [CrossRef]
- Chen, Y.; Nie, X.; Zhou, S.; Zou, H.; Liang, M.; Liu, P. Investigations of environmental stress cracking resistance of HDPE/UHMWPE and LDPE/UHMWPE blends. J. Polym. Res. 2013, 20, 1111–1127. [Google Scholar] [CrossRef]
- Parmar, H.B.; Gupta, R.K.; Bhattacharya, S.N. Rheological and molecular properties of organic peroxide induced long chain branching of recycled and virgin high density polyethylene resin. Polym. Eng. Sci. 2009, 49, 1806–1813. [Google Scholar] [CrossRef]
- Ghanbari-Siahkali, A.; Kingshott, P.; Breiby, D.W.; Arleth, L.; Kjellander, C.K.; Almdal, K. Investigating the role of anionic surfactant and polymer morphology on the environmental stress cracking (ESC) of high-density polyethylene. Polym. Degrad. Stab. 2005, 89, 442–453. [Google Scholar] [CrossRef]
- ISO 527-2:1993; Plastics—Determination of Tensile Properties—Part 2: Test Conditions for Moulding and Extrusion Plastics. ISO (International Organization for Standardization): Geneva, Switzerland, 1993.
- ISO 1133:1997; Plastics—Determination of the Melt Mass-Flow Rate (MFR) and the Melt Volume-Flow Rate (MVR) of Thermoplastics. ISO (International Organization for Standardization): Geneva, Switzerland, 1997.
- ISO 11357-7-2022; Plastics—Differential Scanning Calorimetry (DSC)—Part 7: Determination of Crystallization Kinetics. ISO (International Organization for Standardization): Geneva, Switzerland, 2022.
- IEC 60811-4-1:2004; Insulating and Sheathing Materials of Electric and Optical Cables—Common Test Methods—Part 4-1: Methods Specific to Polyethylene and Polypropylene Compounds—Resistance to Environmental Stress Cracking—Measurement of The Melt Flow. IEC (International Electrotechnical Commission): Geneva, Switzerland, 2004.
- Kraus, C.; Carter, L. Seabed recovery following protective burial of subsea cables—Observations from the continental margin. Ocean Eng. 2018, 157, 251–261. [Google Scholar] [CrossRef]
- Zhang, P.; Wang, X.; Yang, J.M.; Zhang, Y.Q. Effect of Acetylated SEBS/PP for Potential HVAC Cable Insulation. Materials 2021, 14, 1811. [Google Scholar] [CrossRef] [PubMed]
- Zhang, K.; Zhong, L.; Gao, J.; Li, L.Z.; Cao, L.; Chen, G. Temperature dependence of crystalline structure and DC performance in LLDPE/HDPE blending material. IEEE Trans. Dielectr. Electr. Insul. 2019, 26, 754–759. [Google Scholar] [CrossRef]
Figure 1.
Parallel twin screw mixing diagram.
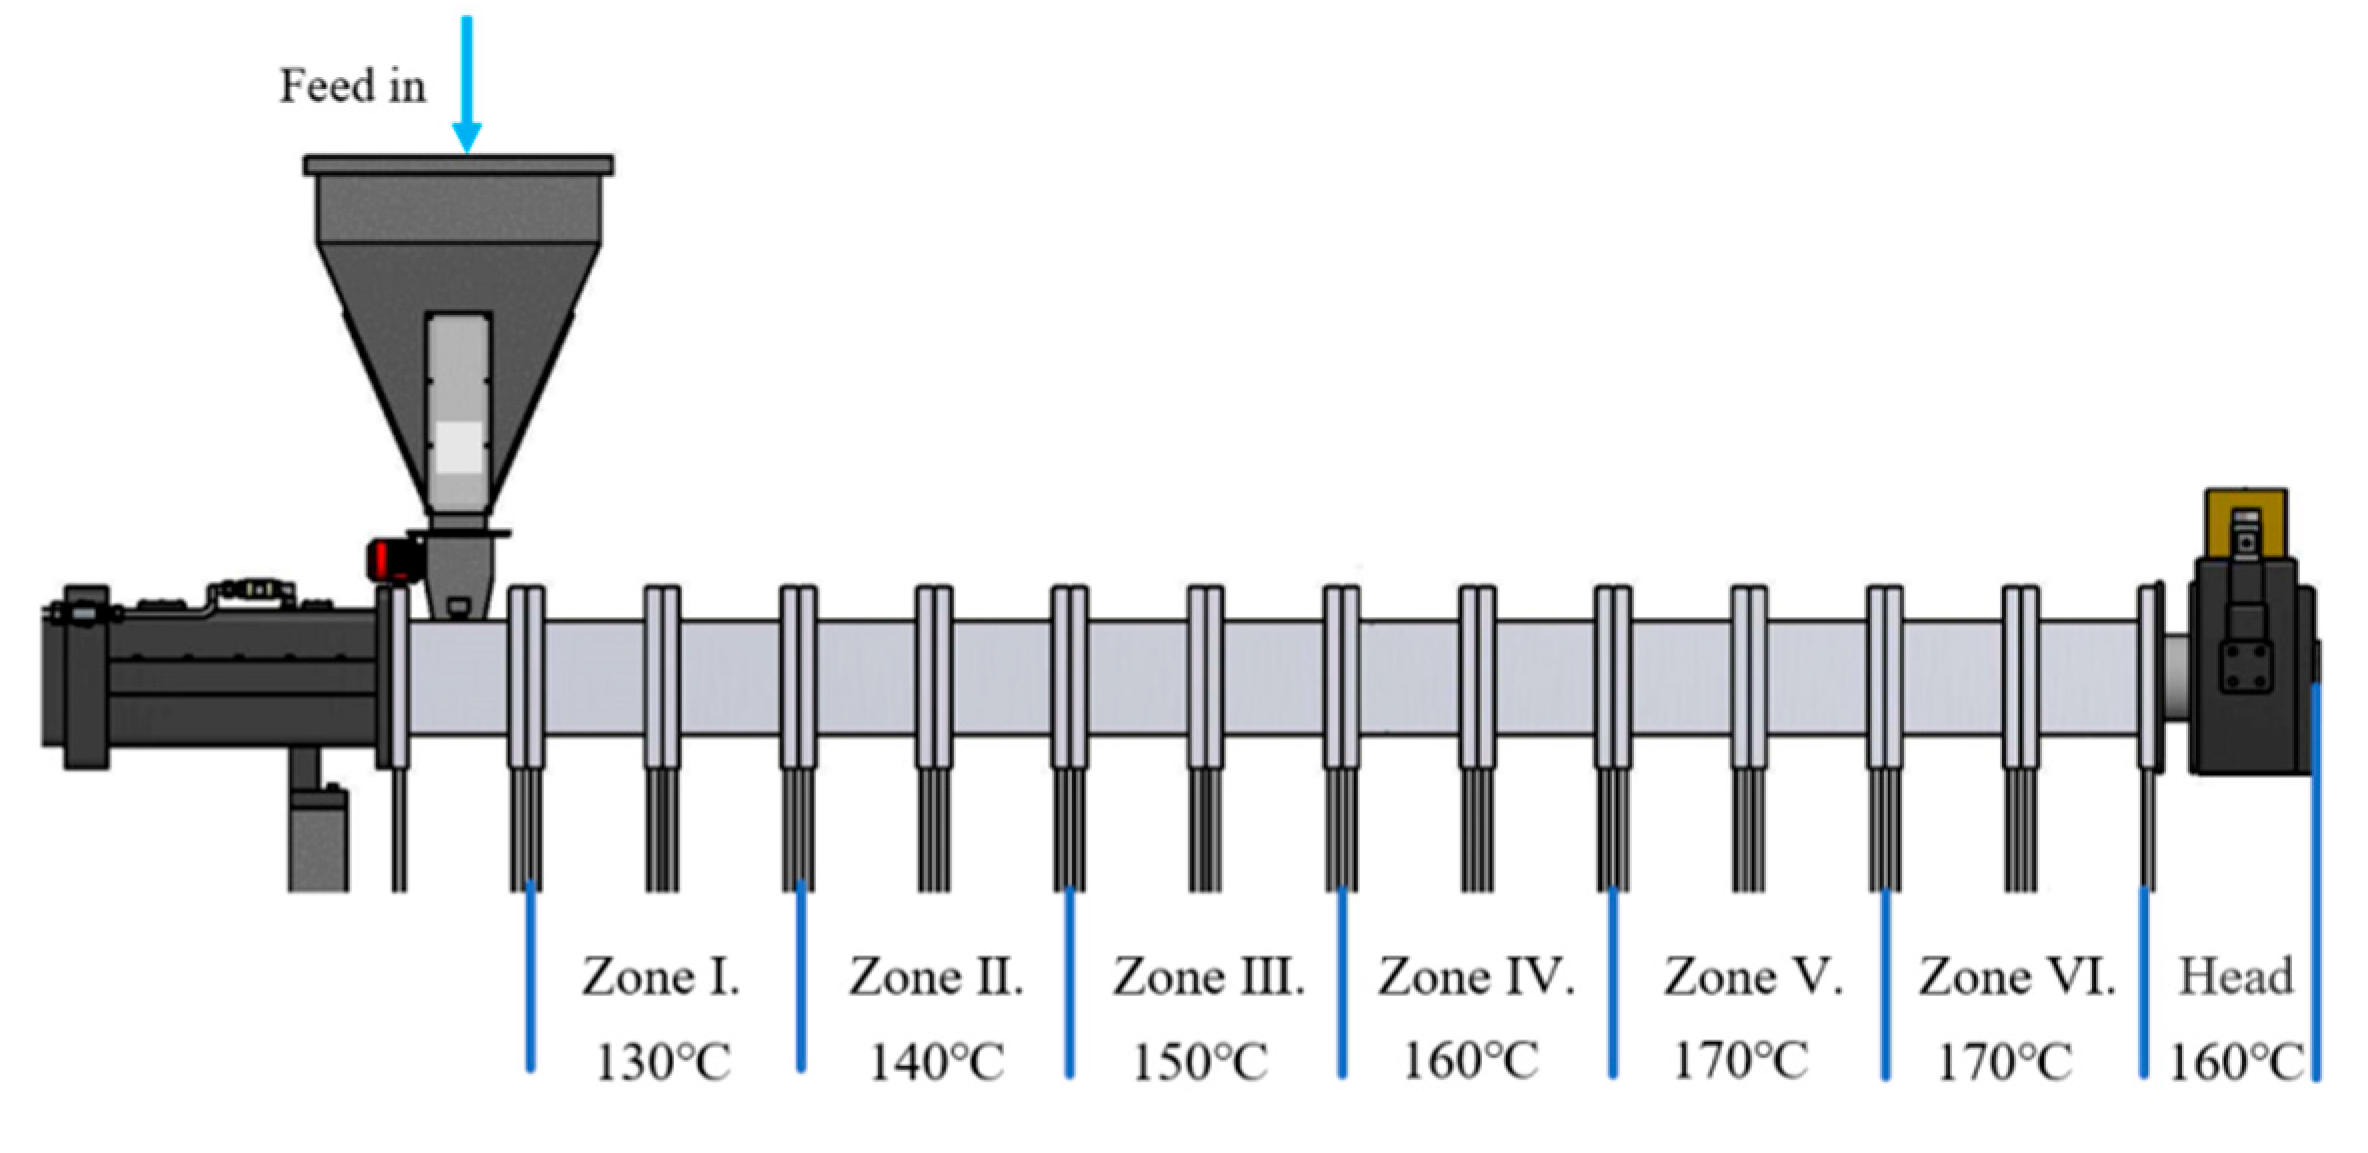
Figure 2.
Rheological properties of base resins. (a) Rheological properties of HDPE; (b) rheological properties of LLDPE; (c) rheological properties of cPE-A.
Figure 2.
Rheological properties of base resins. (a) Rheological properties of HDPE; (b) rheological properties of LLDPE; (c) rheological properties of cPE-A.
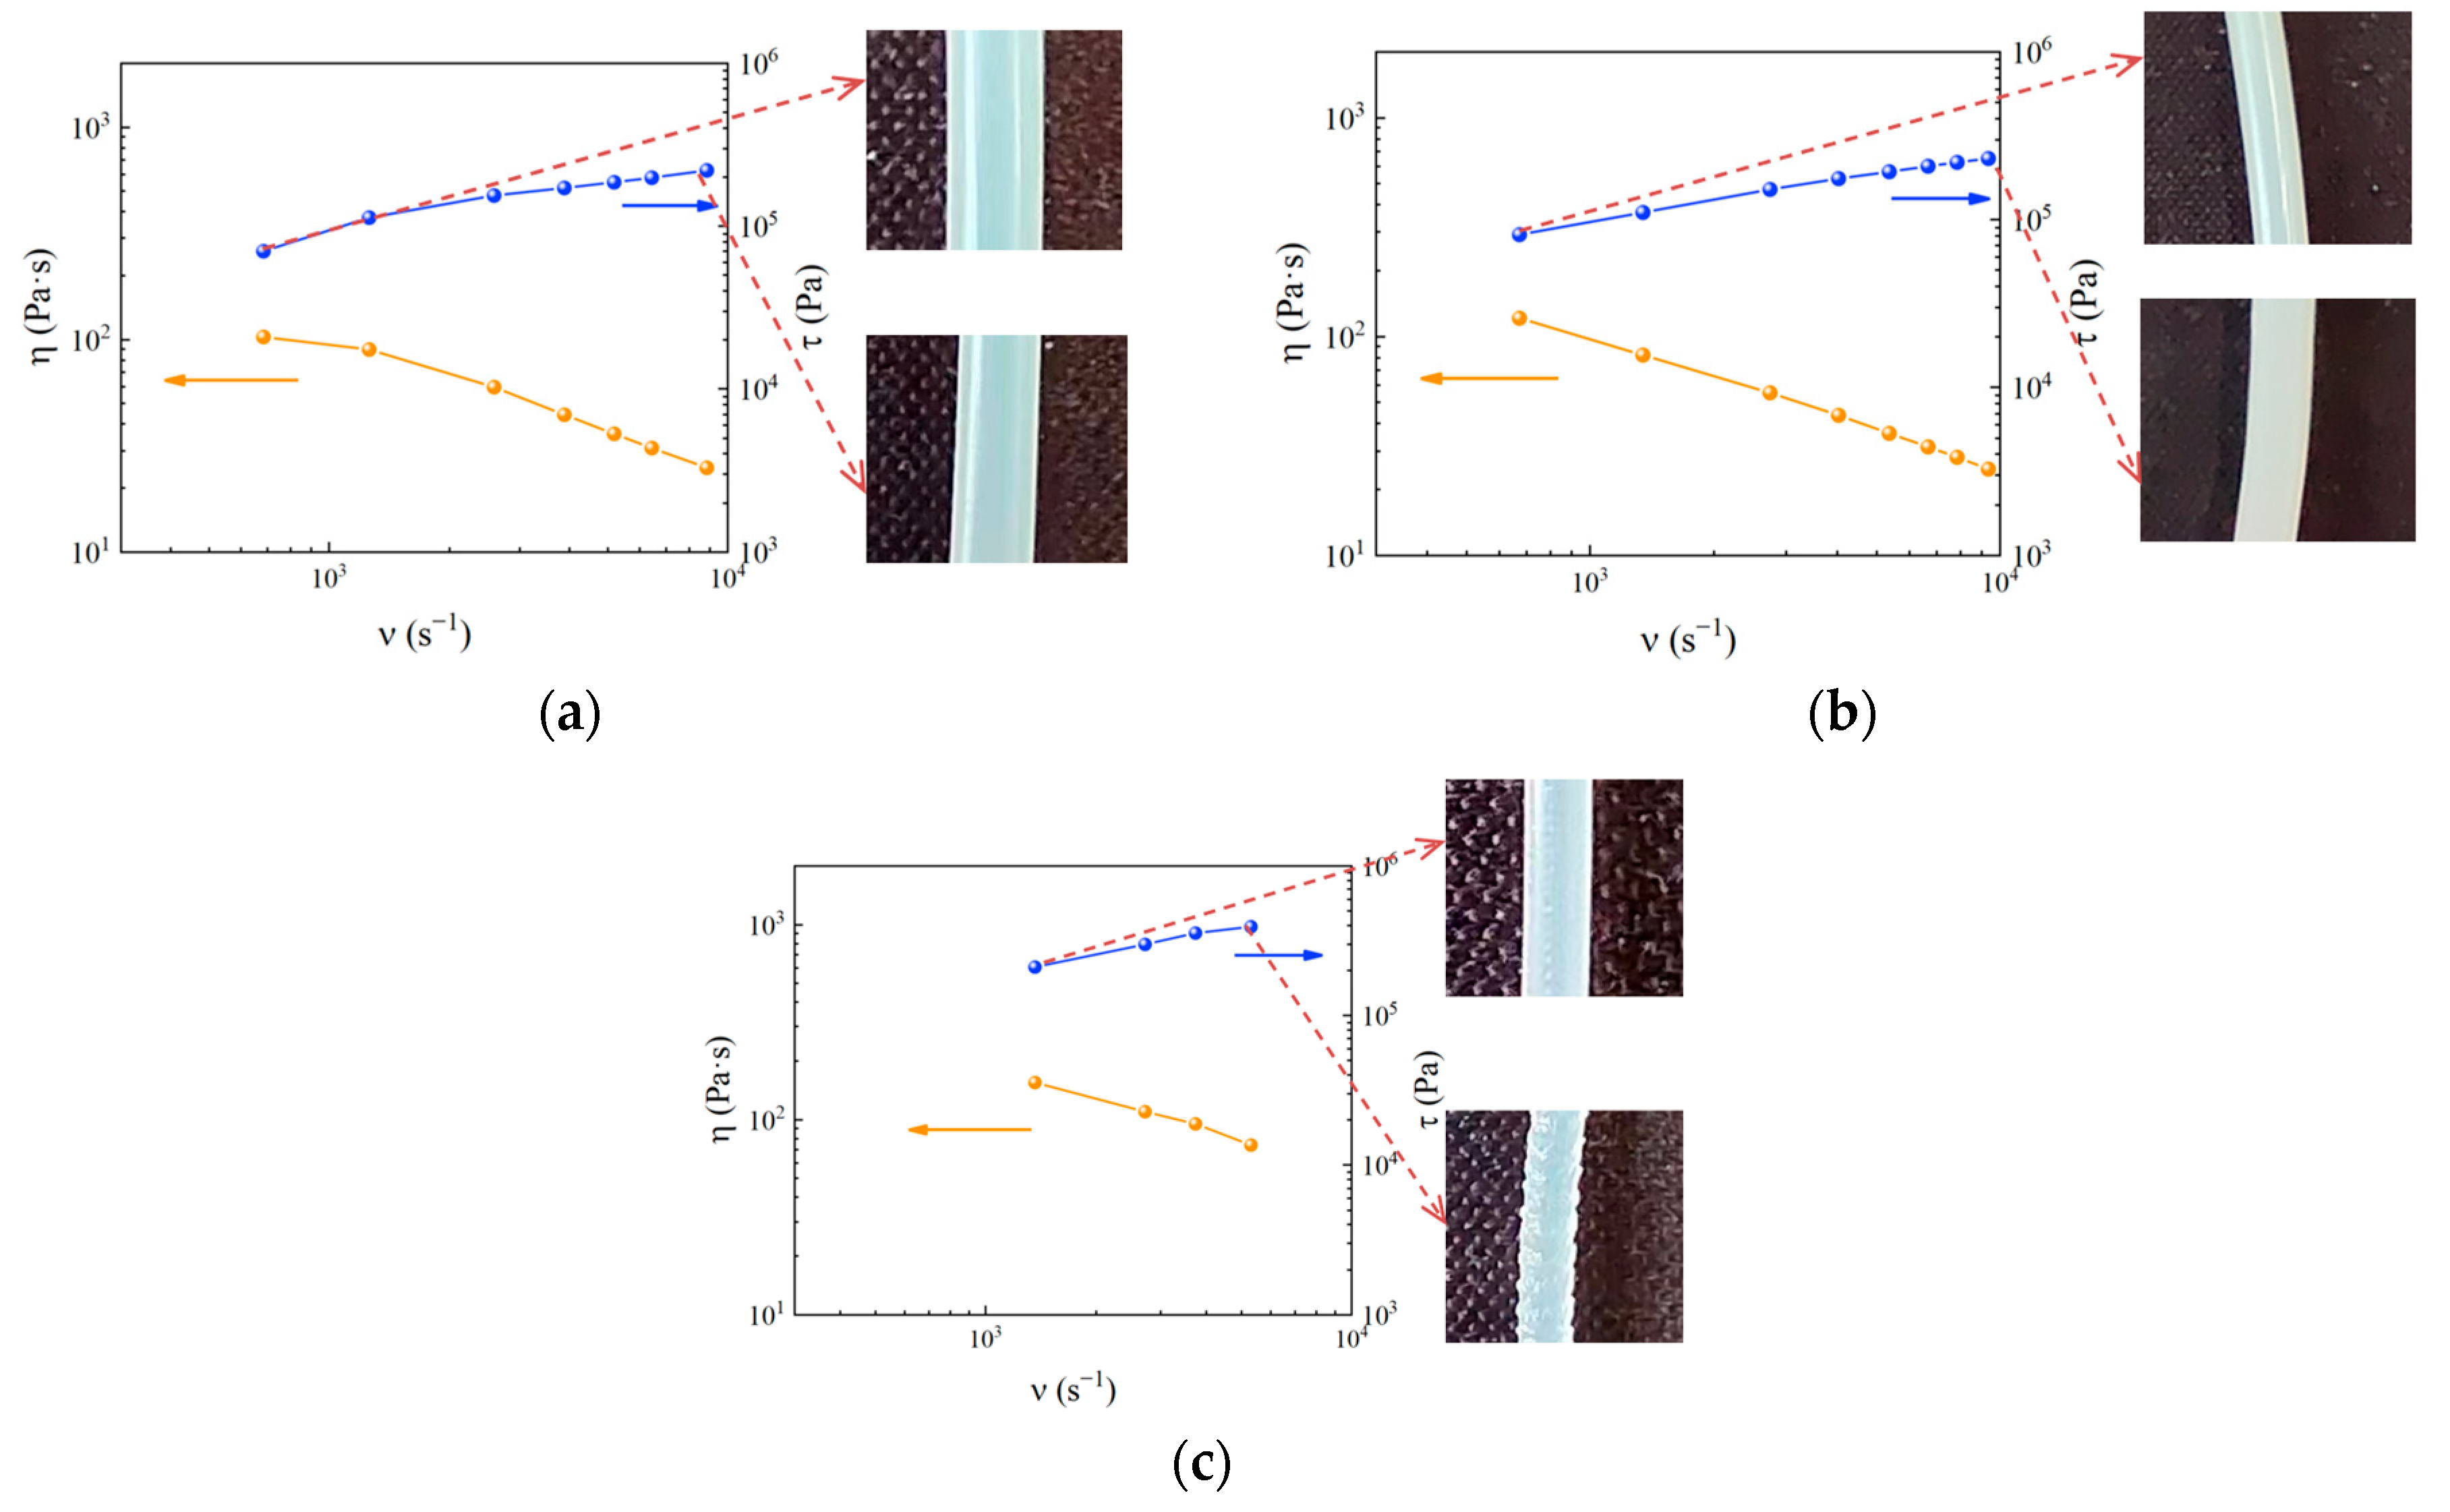
Figure 3.
Environmental stress cracking resistance of three basic polyethylene resins. (a) Resistance to environmental stress cracking time of base resins; (b) environmental stress cracking test diagram of base resin.
Figure 3.
Environmental stress cracking resistance of three basic polyethylene resins. (a) Resistance to environmental stress cracking time of base resins; (b) environmental stress cracking test diagram of base resin.
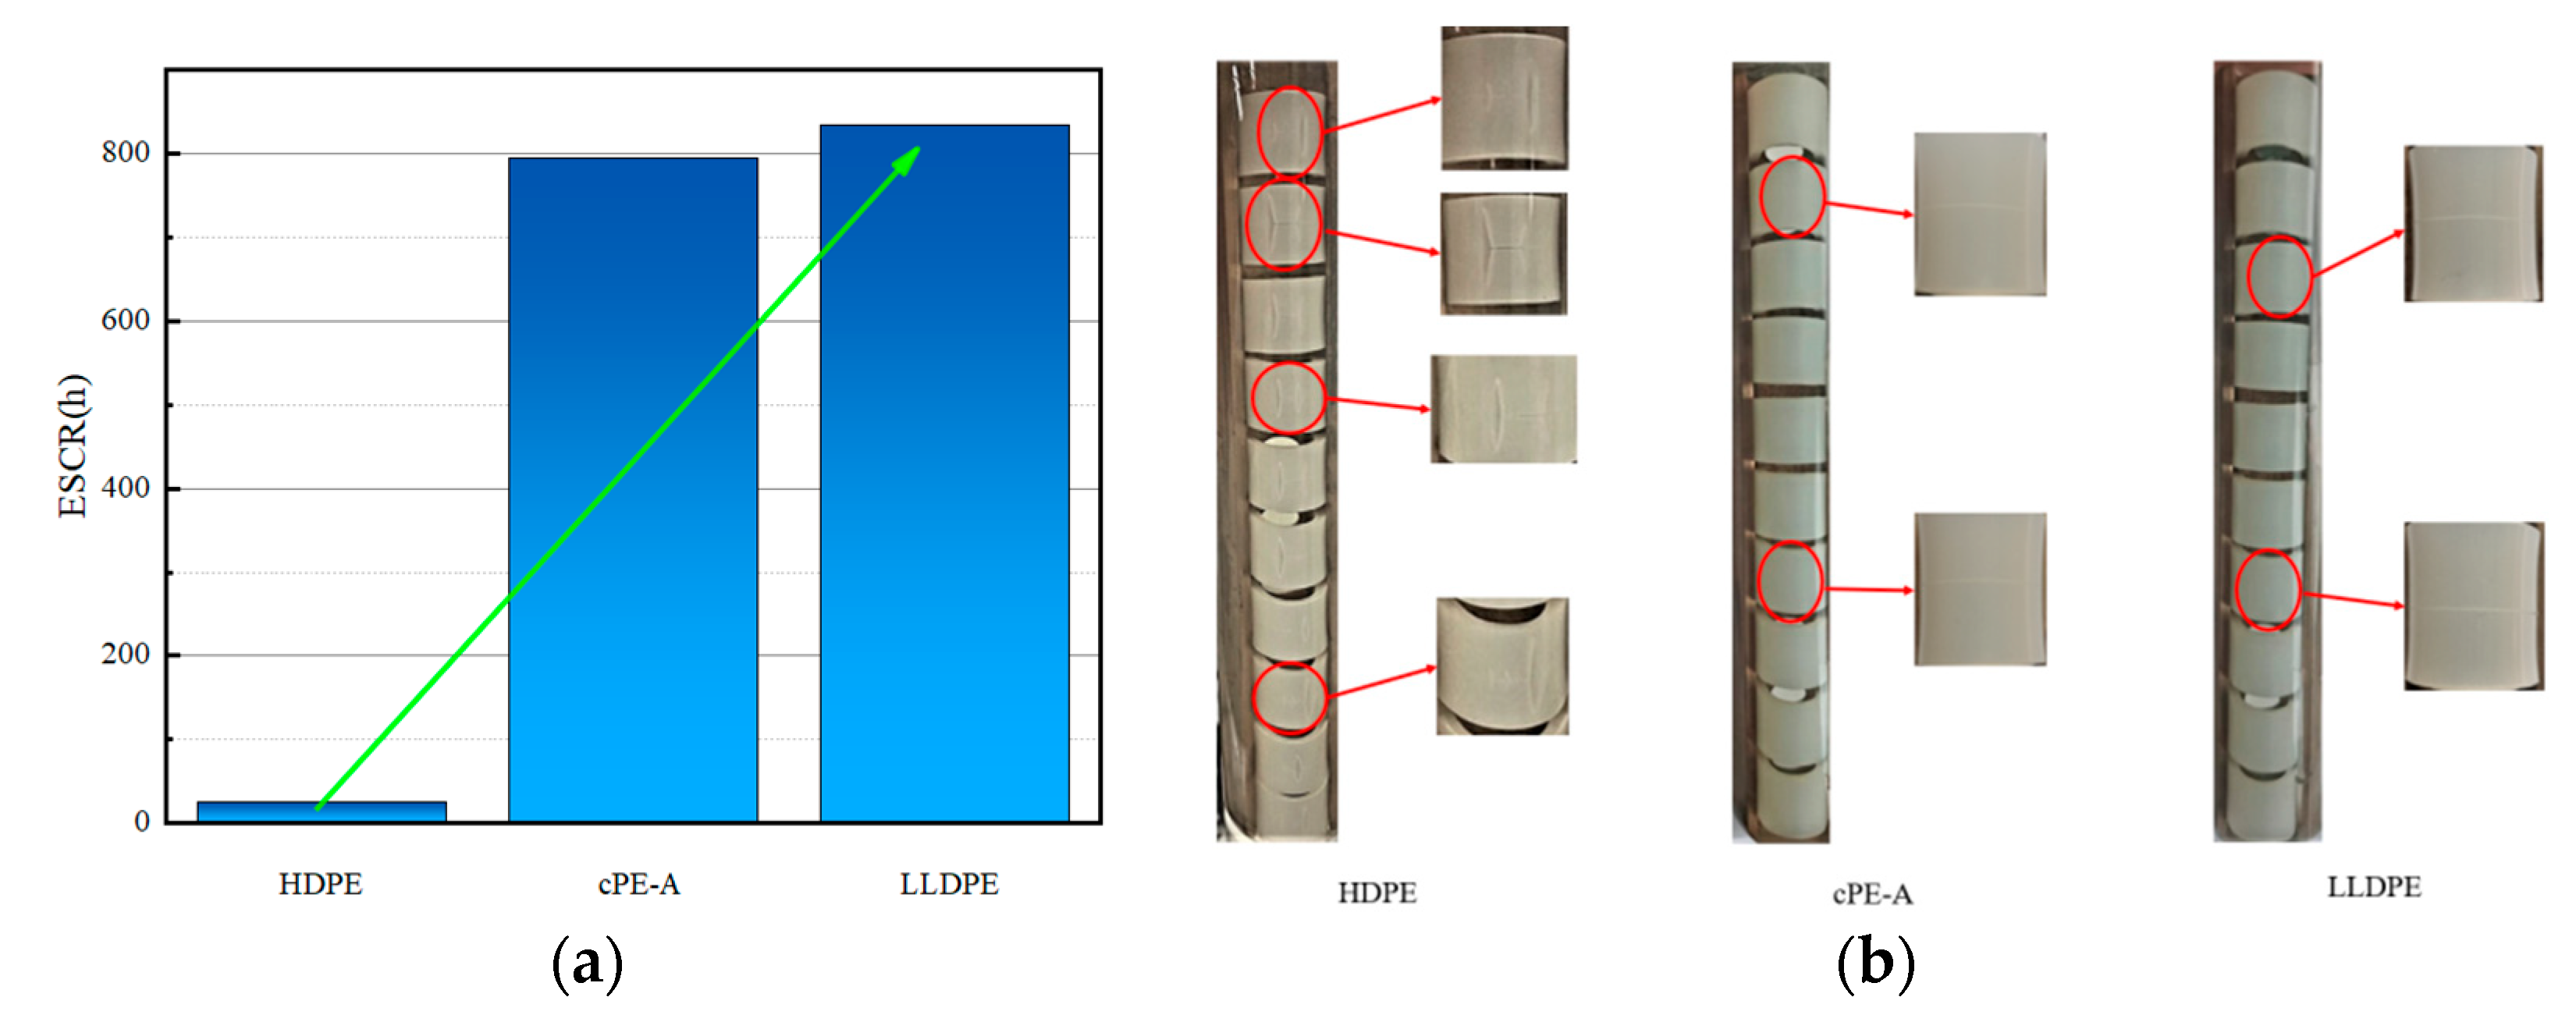
Figure 4.
Environmental stress cracking resistance of HDPE/cPE-A and HDPE/cPE-A/LLDPE. (a) Resistance to environmental stress cracking time; (b) environmental stress cracking test diagram.
Figure 4.
Environmental stress cracking resistance of HDPE/cPE-A and HDPE/cPE-A/LLDPE. (a) Resistance to environmental stress cracking time; (b) environmental stress cracking test diagram.
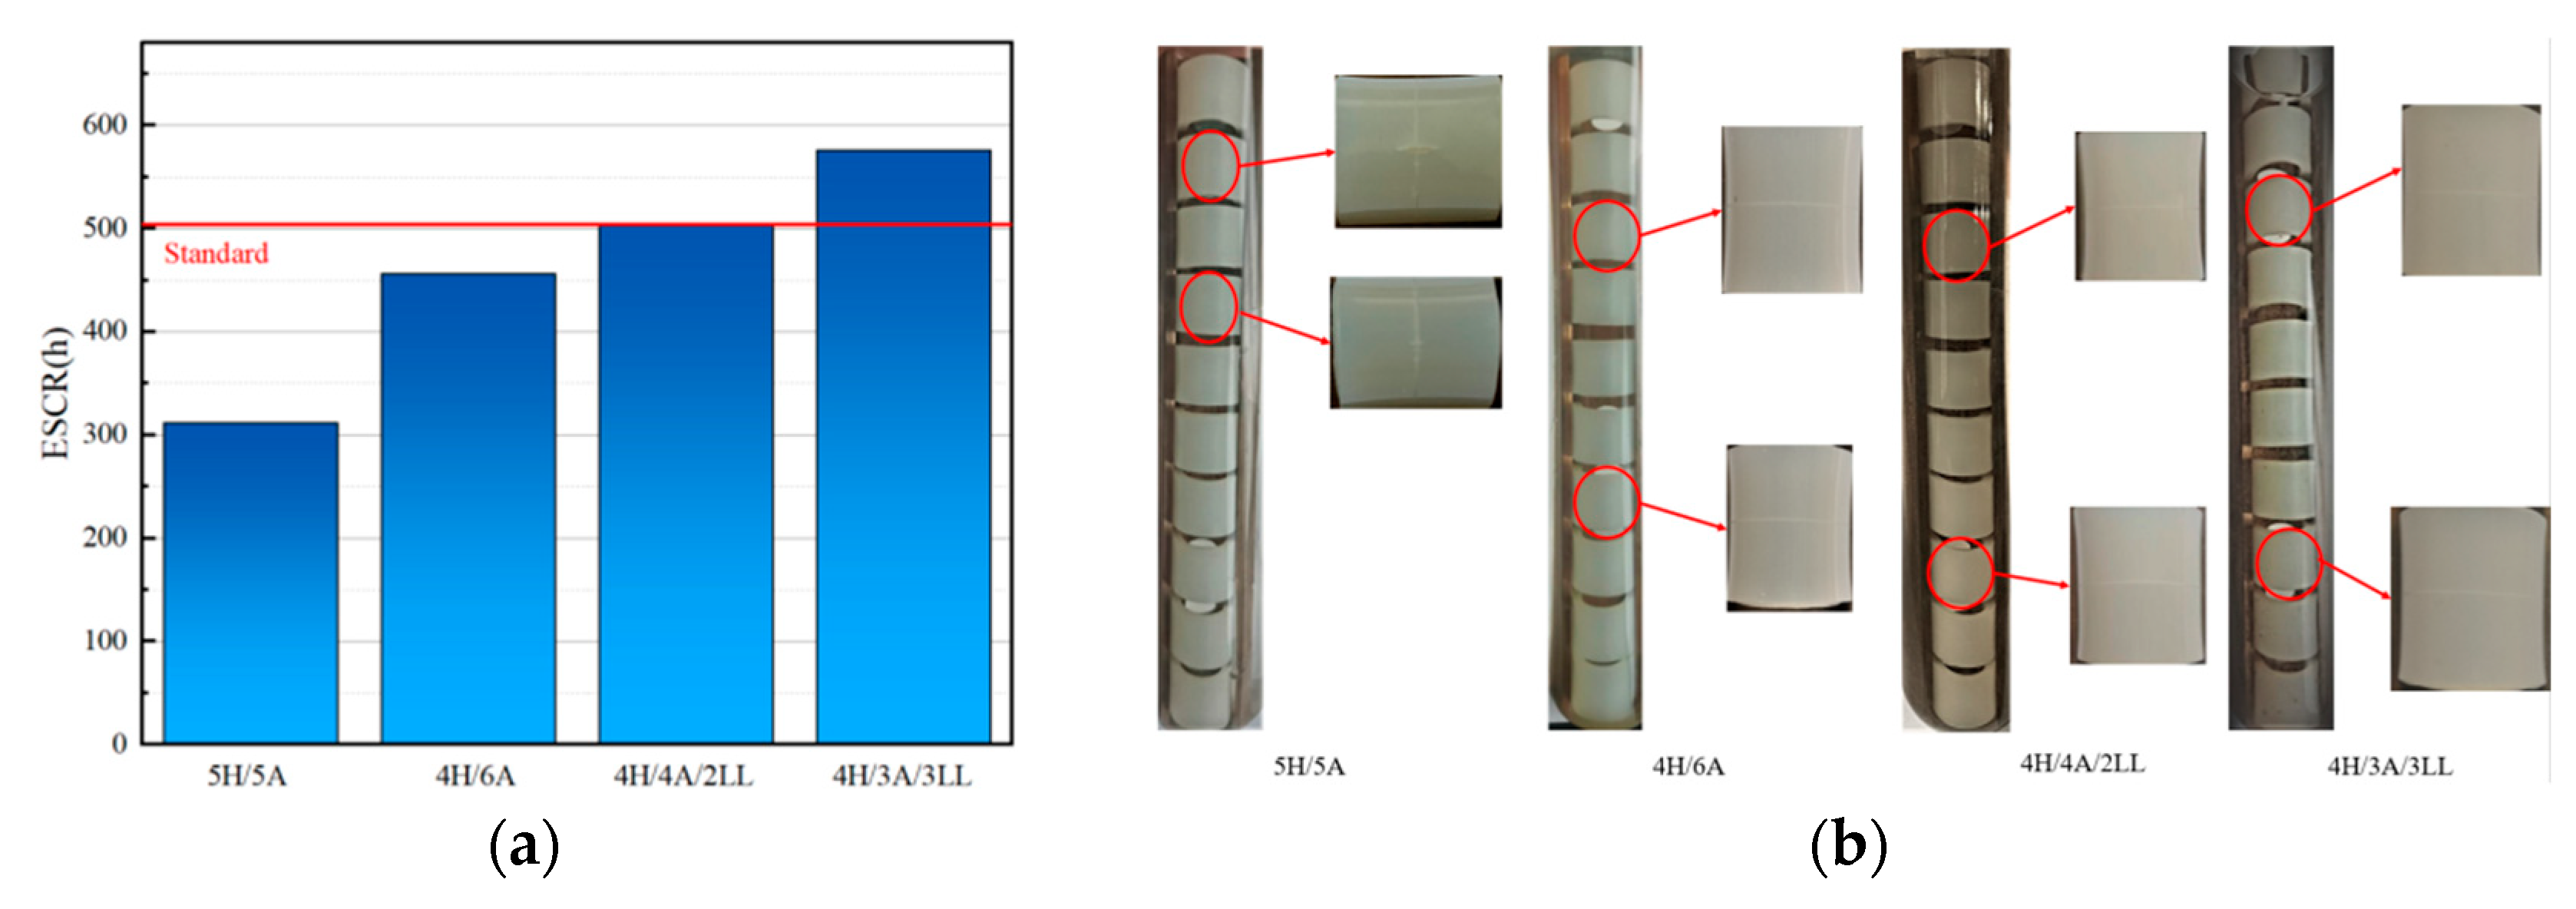
Figure 5.
Environmental stress cracking resistance of HDPE/cPE-B. (a) Resistance to environmental stress cracking time; (b) environmental stress cracking test diagram.
Figure 5.
Environmental stress cracking resistance of HDPE/cPE-B. (a) Resistance to environmental stress cracking time; (b) environmental stress cracking test diagram.
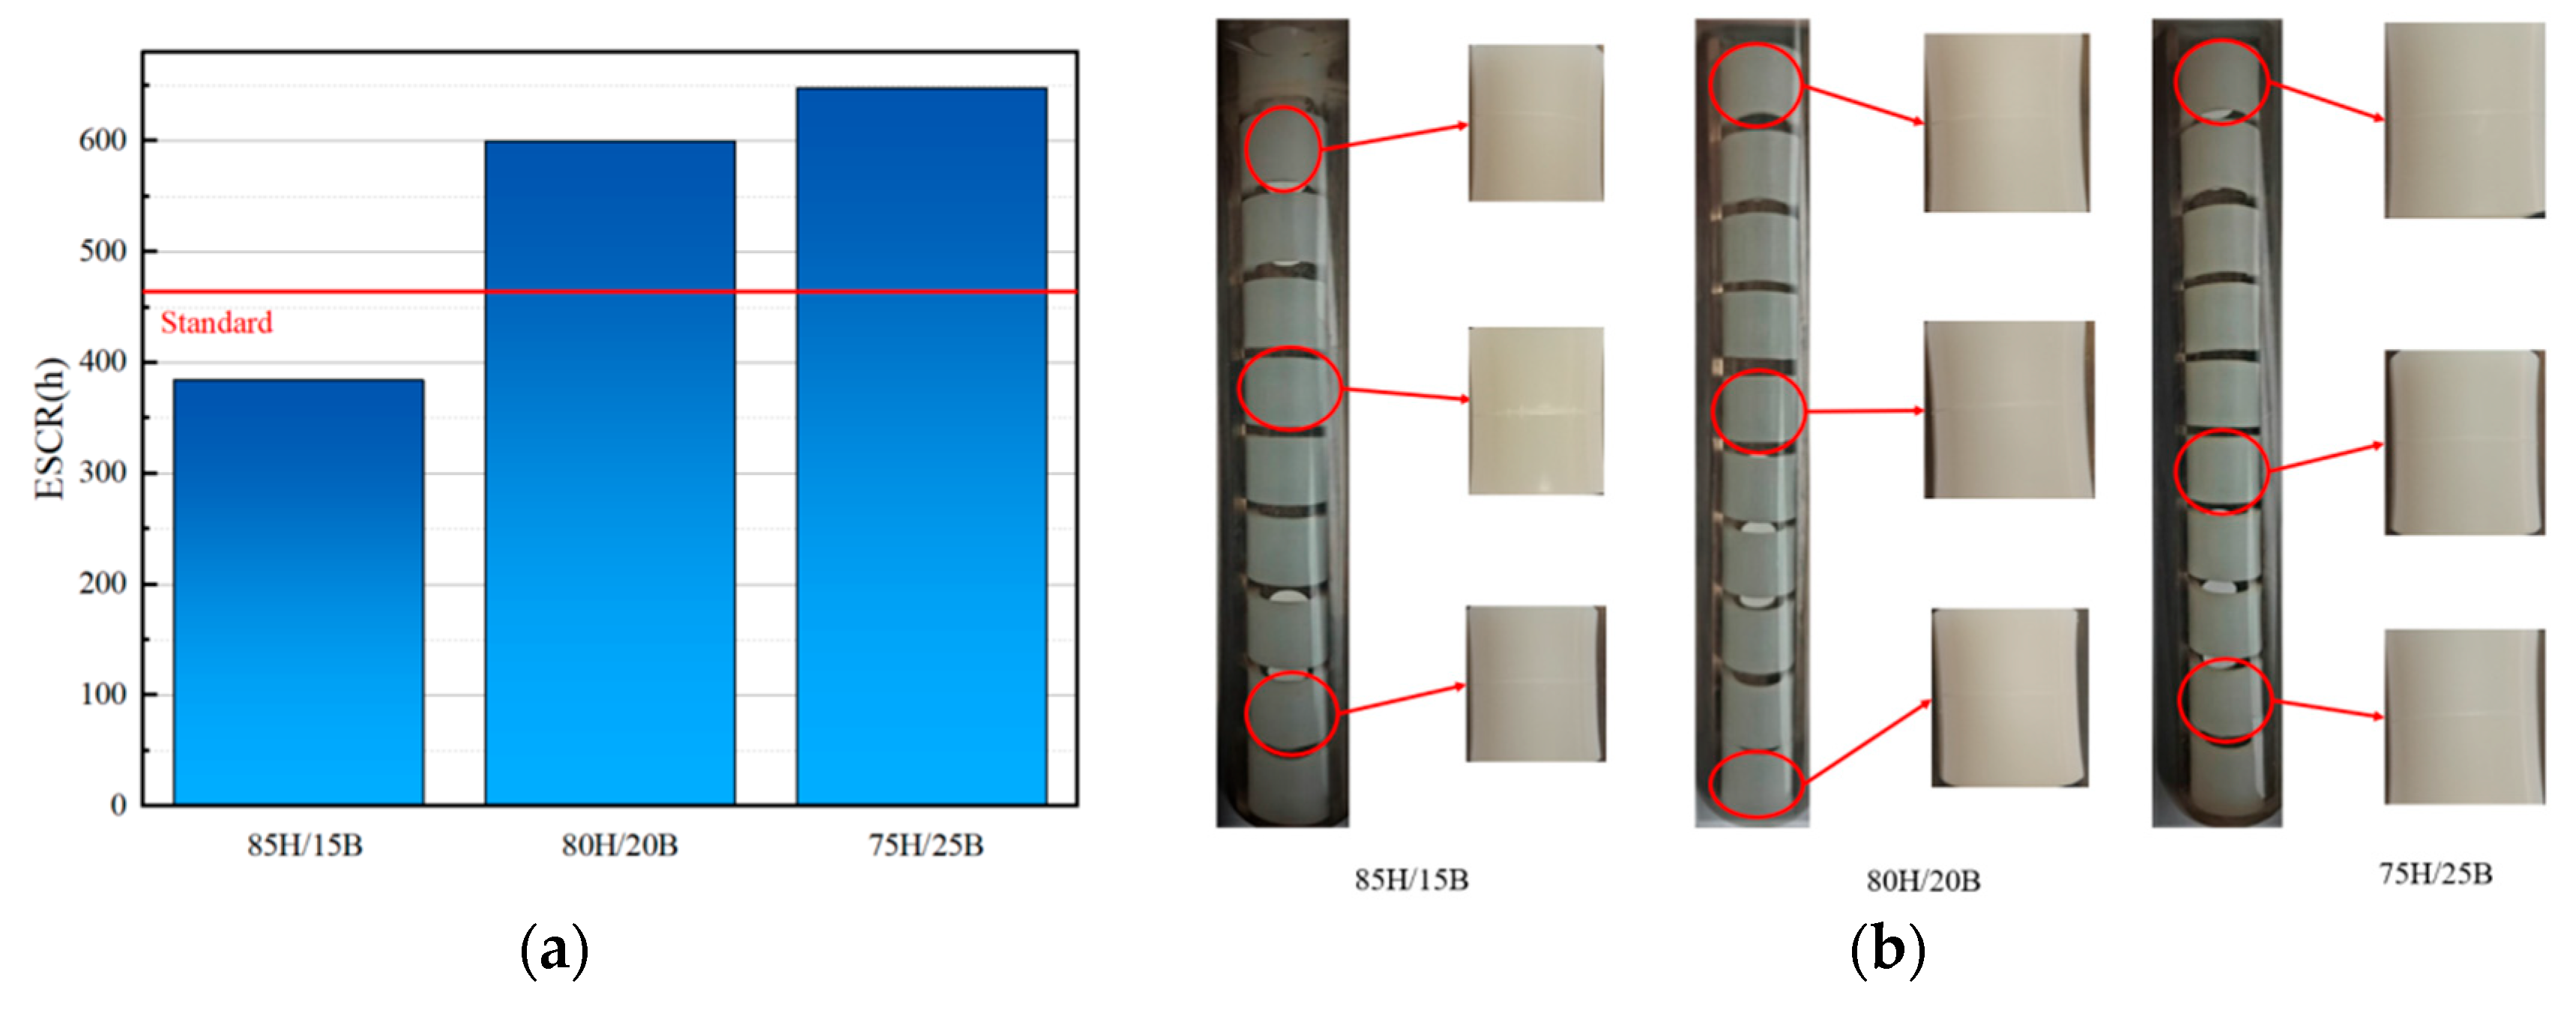
Figure 6.
Water resistance properties of base resins and composites. (a) Water resistance characteristics of polyethylene materials with different densities; (b) water resistance properties of HDPE/cPE-A and HDPE/cPE-A/LLDPE; (c) water resistance characteristics of HDPE/cPE-B.
Figure 6.
Water resistance properties of base resins and composites. (a) Water resistance characteristics of polyethylene materials with different densities; (b) water resistance properties of HDPE/cPE-A and HDPE/cPE-A/LLDPE; (c) water resistance characteristics of HDPE/cPE-B.
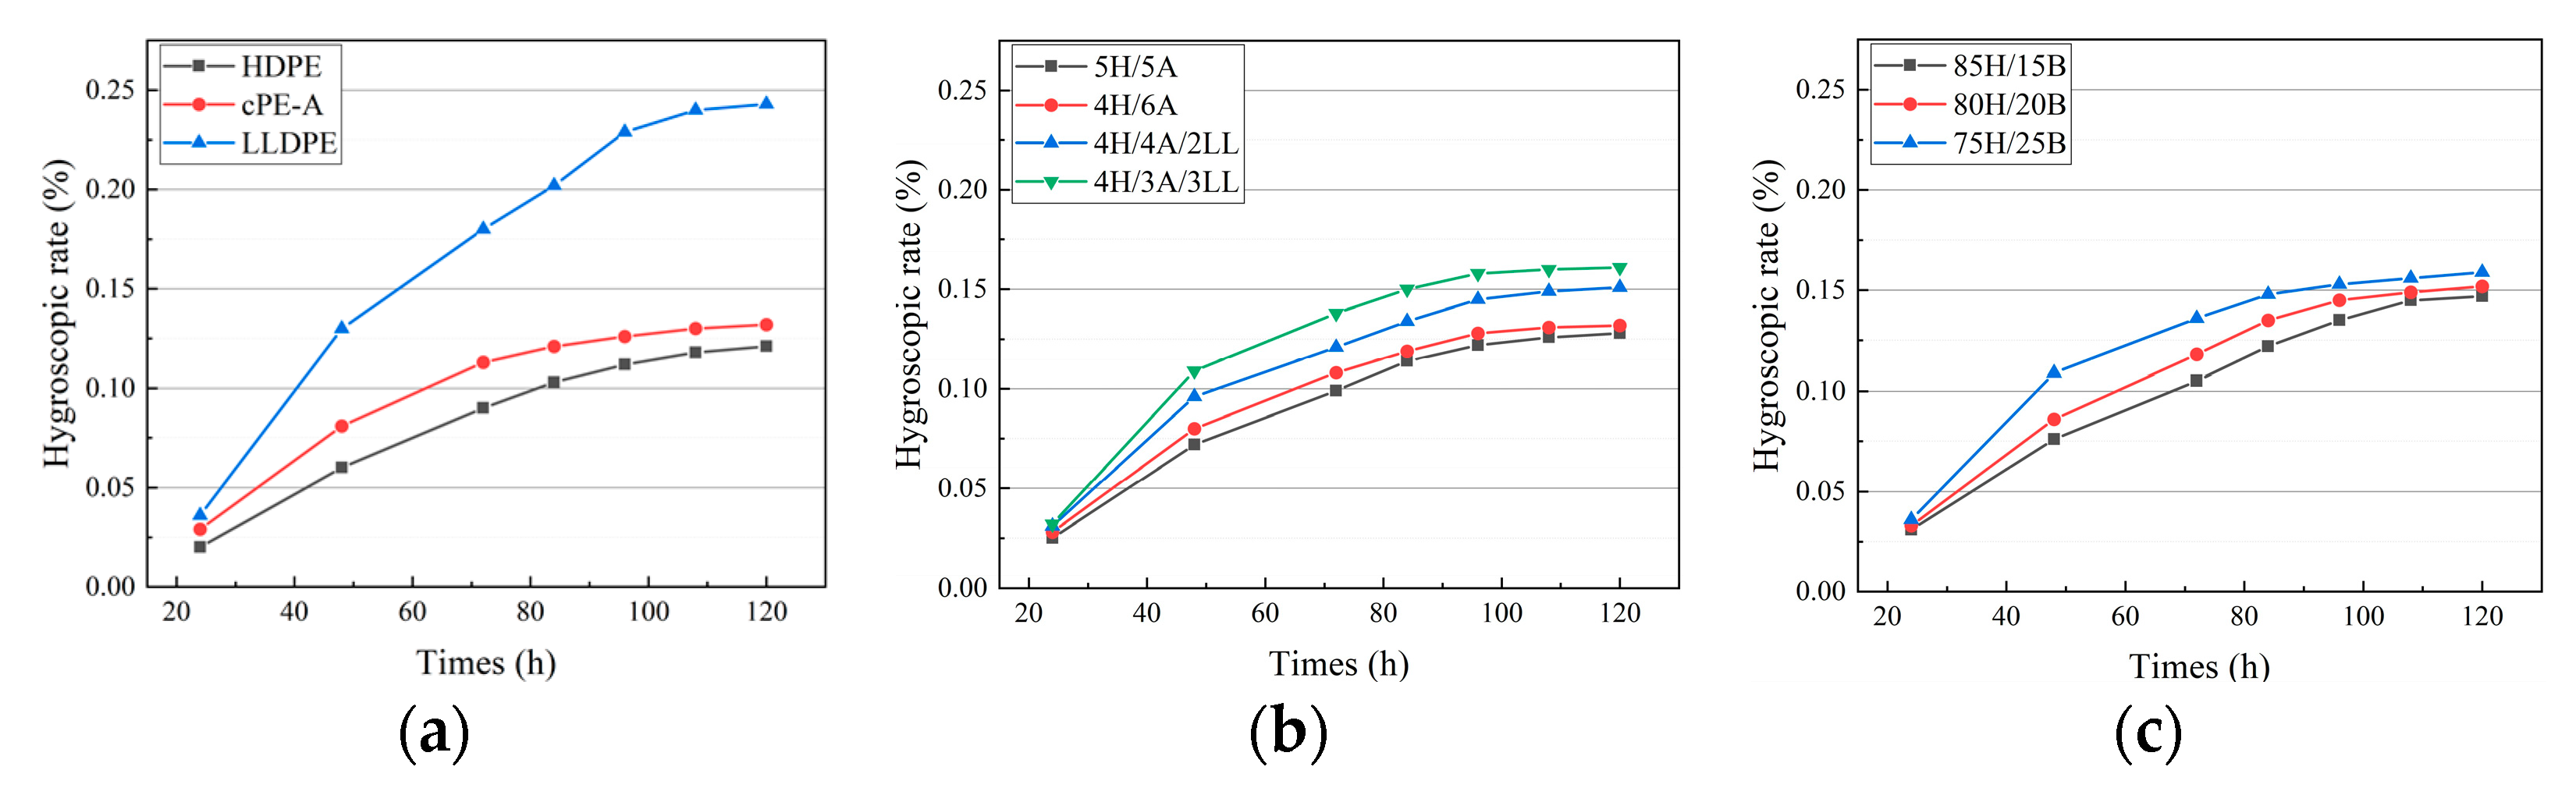
Figure 7.
DSC curves for each sample: (a) melting curves and (b) crystallization curves, which were tested in the temperature range of 30 °C to 170 °C.
Figure 7.
DSC curves for each sample: (a) melting curves and (b) crystallization curves, which were tested in the temperature range of 30 °C to 170 °C.
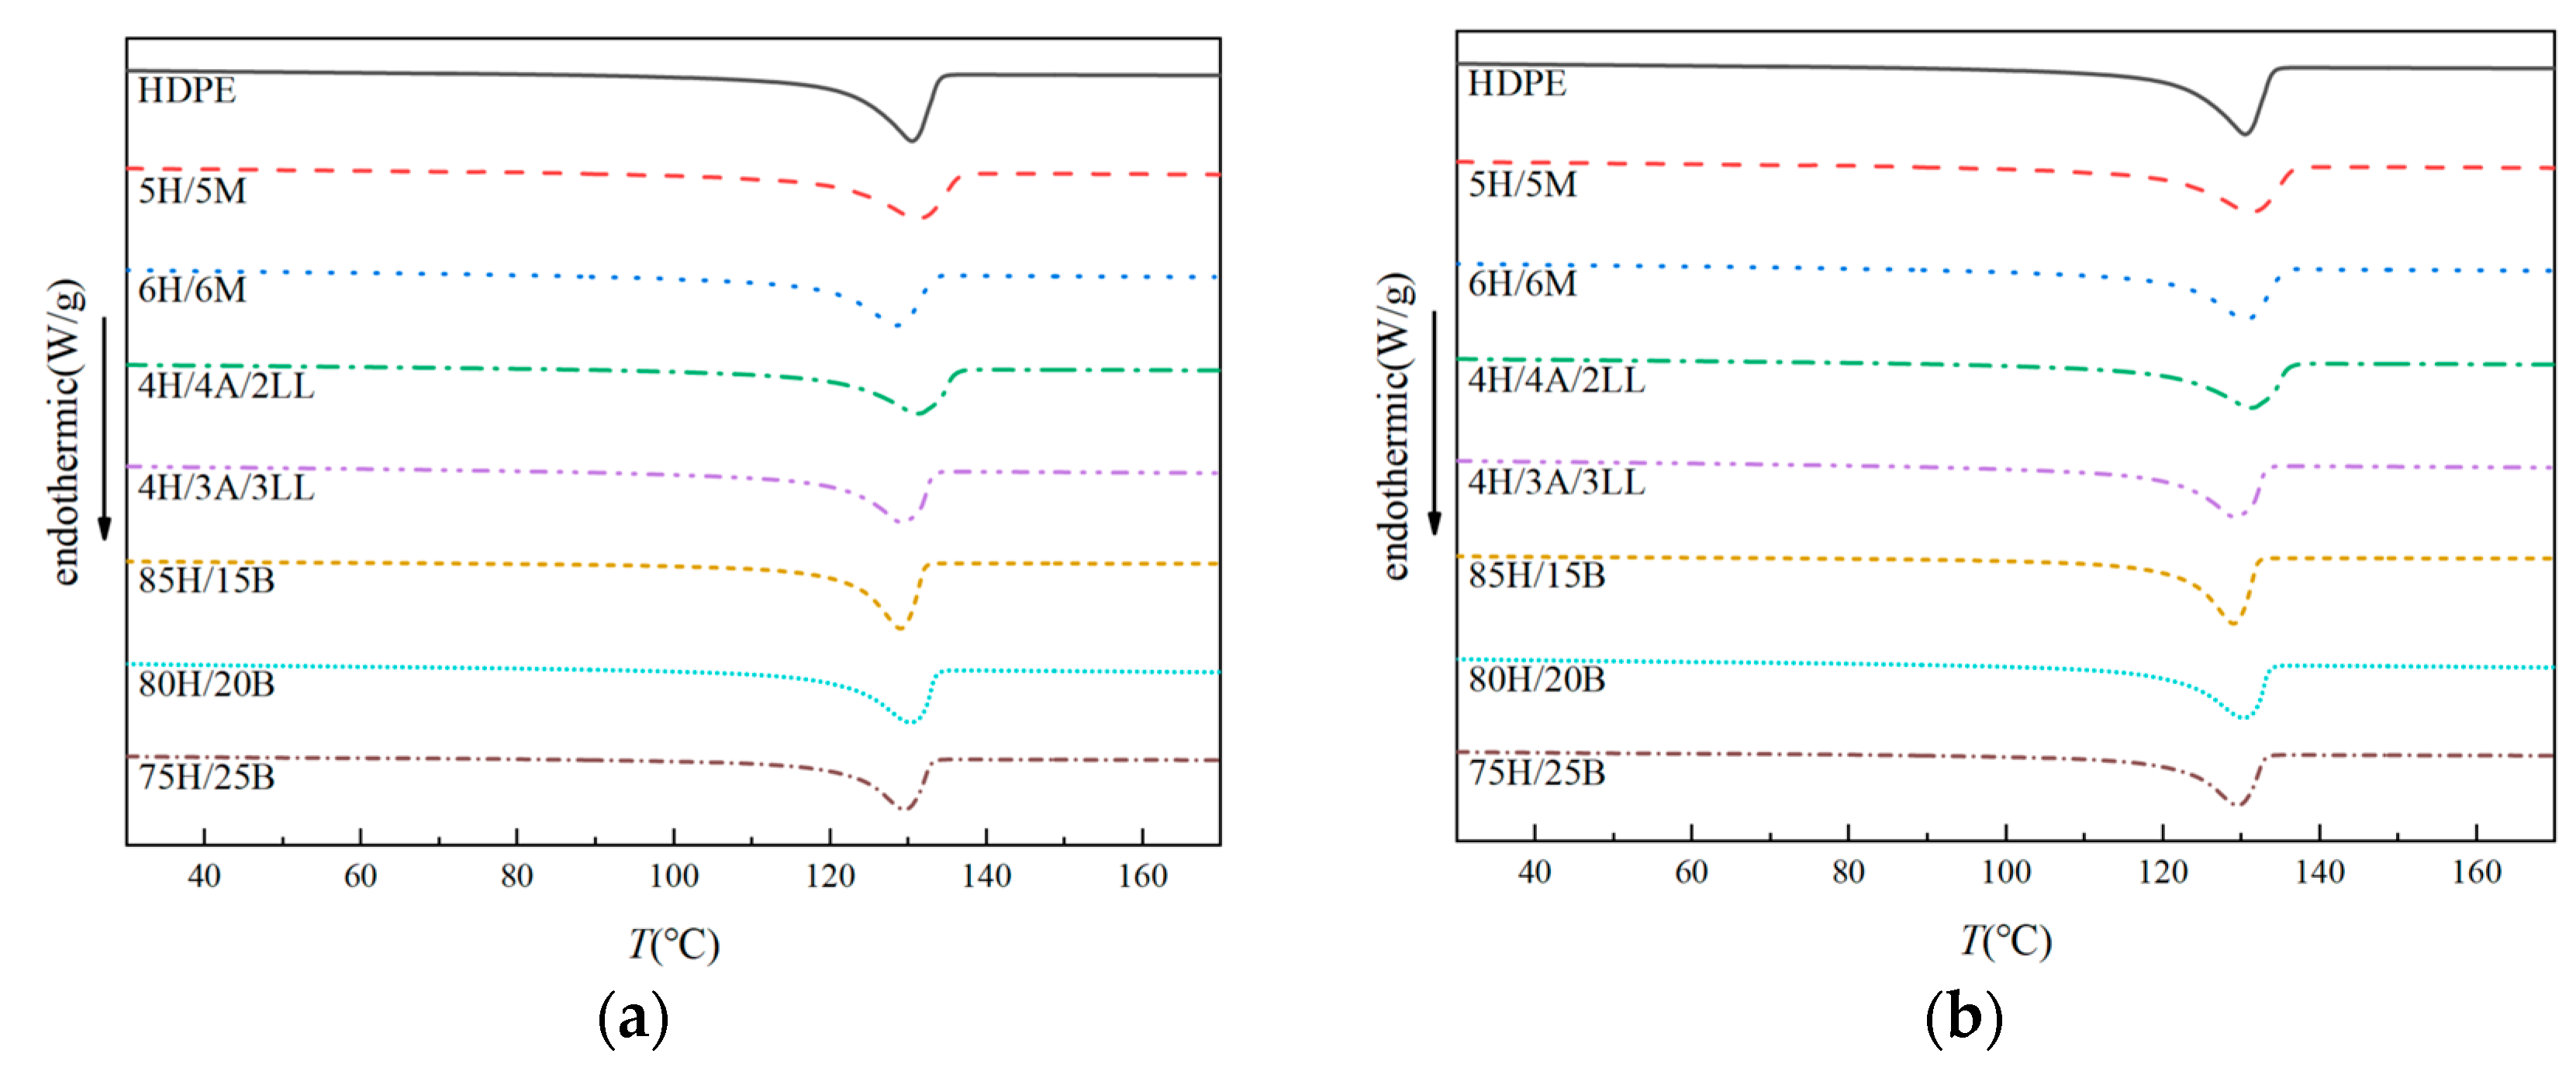
Figure 8.
Space charge distribution of HDPE and composite materials. (a) HDPE; (b) 4H/4A/2LL; (c) 4H/3A/3LL; (d) 80H/20B; (e) 75H/25B.
Figure 8.
Space charge distribution of HDPE and composite materials. (a) HDPE; (b) 4H/4A/2LL; (c) 4H/3A/3LL; (d) 80H/20B; (e) 75H/25B.

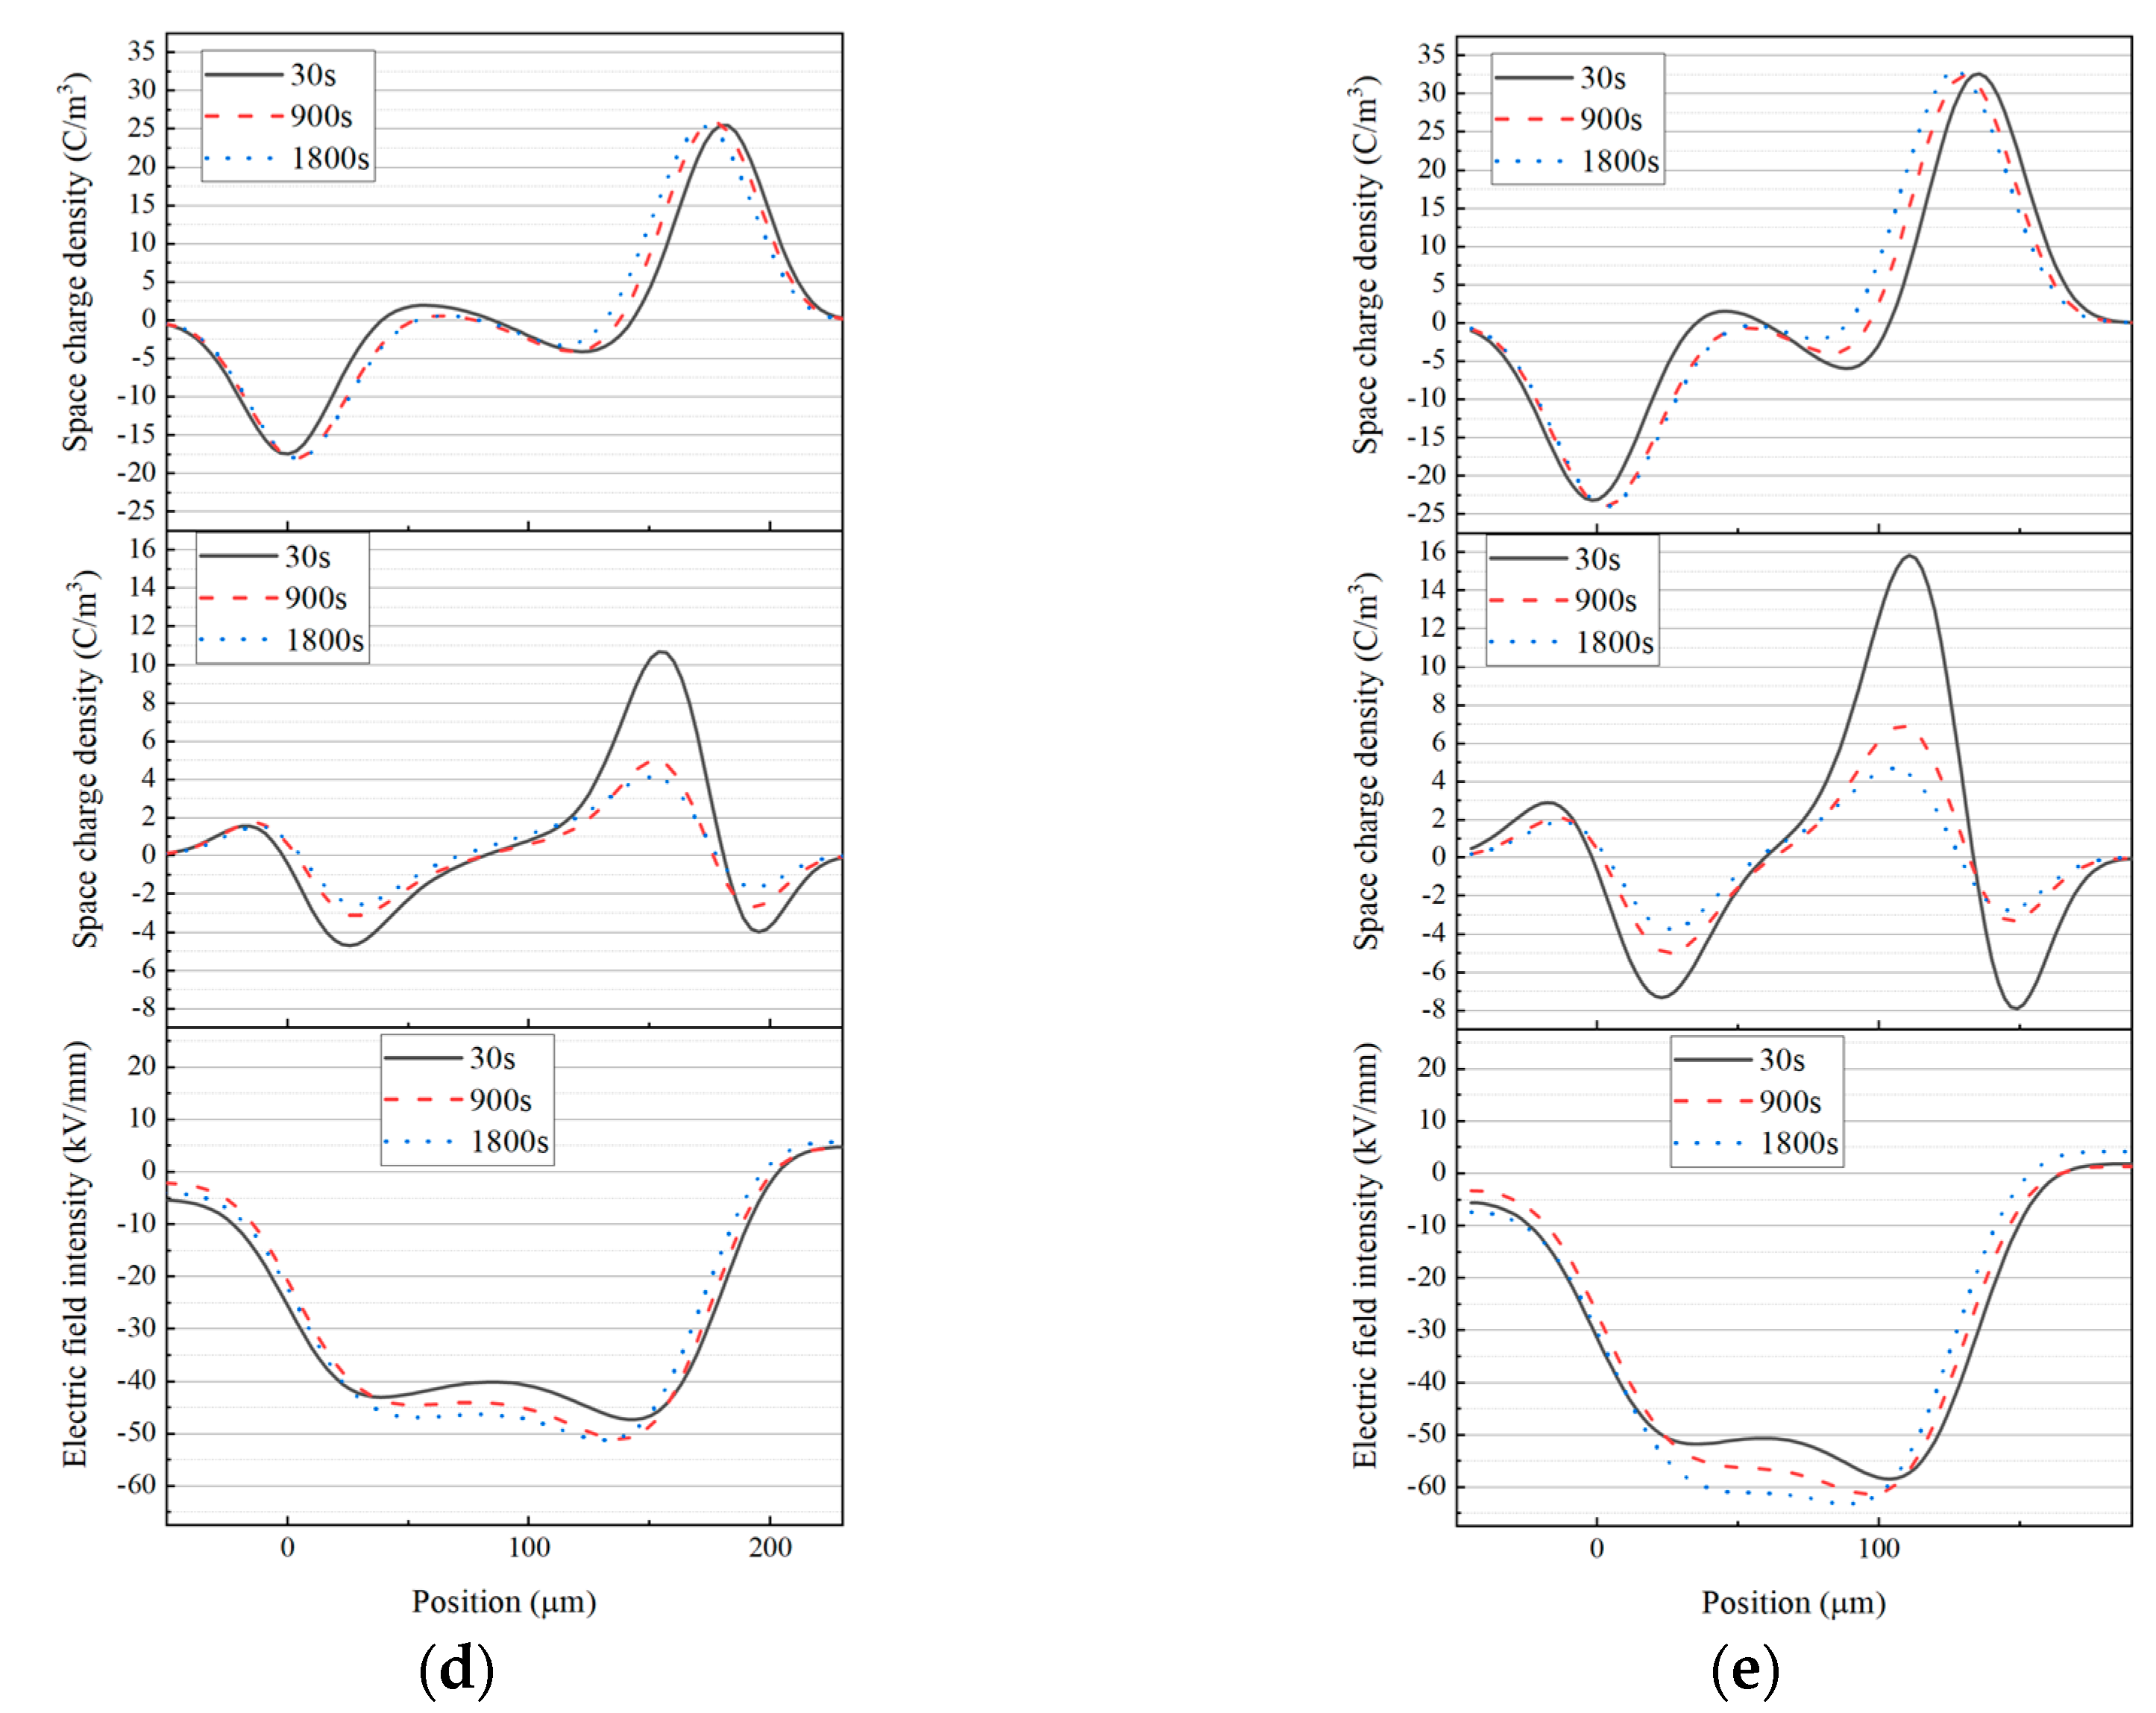
Figure 9.
Volume resistivity and DC breakdown strength characteristics of HDPE and four composite materials.
Figure 9.
Volume resistivity and DC breakdown strength characteristics of HDPE and four composite materials.

Table 1.
Material number and composition ratio.
| Materials | HDPE/phr | cPE-A/phr | LLDPE/phr | cPE-B/phr | Irganox 1010/phr |
|---|---|---|---|---|---|
| HDPE | 100 | 0 | 0 | 0 | 0.3 |
| cPE-A | 0 | 100 | 0 | 0 | 0.3 |
| LLDPE | 0 | 0 | 100 | 0 | 0.3 |
| 5H/5A | 50 | 50 | 0 | 0 | 0.3 |
| 4H/6A | 40 | 60 | 0 | 0 | 0.3 |
| 4H/4A/2LL | 40 | 40 | 20 | 0 | 0.3 |
| 4H/3A/3LL | 40 | 30 | 30 | 0 | 0.3 |
| 85H/15B | 85 | 0 | 0 | 15 | 0.3 |
| 80H/20B | 80 | 0 | 0 | 20 | 0.3 |
| 75H/25B | 75 | 0 | 0 | 25 | 0.3 |
Table 2.
Mechanical properties and extrusion characteristics of different polyethylene materials and composites.
Table 2.
Mechanical properties and extrusion characteristics of different polyethylene materials and composites.
| Materias | MI/(g/10 min) | Maximum Extrusion Speed/rpm | Tensile Strength/MPa | Elongation at Break/% | Shore Hardness/HD |
|---|---|---|---|---|---|
| HDPE | 0.7 | >100 | 28.95 | 826.63 | 59.1 |
| cPE-A | 0.7 | 20 | 46.31 | 781.43 | 58.3 |
| LLDPE | 2.1 | >100 | 26.50 | 958.06 | 48.5 |
| 5H/5A | 0.8 | 60 | 39.86 | 816.32 | 58.4 |
| 4H/6A | 0.8 | 50 | 41.23 | 820.45 | 58.2 |
| 4H/4A/2LL | 0.9 | 65 | 34.85 | 807.32 | 57.5 |
| 4H/3A/3LL | 1.0 | 80 | 27.94 | 860.24 | 57.1 |
| 85H/15B | 0.8 | >100 | 27.65 | 928.32 | 56.3 |
| 80H/20B | 0.9 | >100 | 26.19 | 895.65 | 55.4 |
| 75H/25B | 0.9 | >100 | 28.35 | 918.64 | 54.5 |
Table 3.
The crystalline melting and crystallinity temperatures of HDPE and compatibilized modified materials.
Table 3.
The crystalline melting and crystallinity temperatures of HDPE and compatibilized modified materials.
| Materials | Crystalline Temperature/°C | Melting Temperature/°C | Crystallinity/% |
|---|---|---|---|
| HDPE | 117.21 | 130.67 | 56.88 |
| 5H/5M | 114.69 | 131.35 | 52.31 |
| 4H/6M | 115.43 | 130.66 | 51.87 |
| 4H/4A/2LL | 115.85 | 131.61 | 50.08 |
| 4H/3A/3LL | 116.53 | 129.40 | 51.76 |
| 85H/15B | 117.46 | 129.14 | 50.69 |
| 80H/20B | 116.95 | 130.59 | 48.59 |
| 75H/25B | 117.38 | 129.65 | 41.84 |
Disclaimer/Publisher’s Note: The statements, opinions and data contained in all publications are solely those of the individual author(s) and contributor(s) and not of MDPI and/or the editor(s). MDPI and/or the editor(s) disclaim responsibility for any injury to people or property resulting from any ideas, methods, instructions or products referred to in the content. |
© 2023 by the authors. Licensee MDPI, Basel, Switzerland. This article is an open access article distributed under the terms and conditions of the Creative Commons Attribution (CC BY) license (https://creativecommons.org/licenses/by/4.0/).
Share and Cite
MDPI and ACS Style
Xie, S.; Chen, Z.; Yan, Z.; Qiu, X.; Hu, M.; Gu, C.; Zhao, X.; Wang, K. Blending Modification Technology of Insulation Materials for Deep Sea Optoelectronic Composite Cables. Energies 2024, 17, 820. https://doi.org/10.3390/en17040820
AMA Style
Xie S, Chen Z, Yan Z, Qiu X, Hu M, Gu C, Zhao X, Wang K. Blending Modification Technology of Insulation Materials for Deep Sea Optoelectronic Composite Cables. Energies. 2024; 17(4):820. https://doi.org/10.3390/en17040820
Chicago/Turabian StyleXie, Shuhong, Zhenzhen Chen, Zhiyu Yan, Xingyu Qiu, Ming Hu, Chunfei Gu, Xindong Zhao, and Kai Wang. 2024. "Blending Modification Technology of Insulation Materials for Deep Sea Optoelectronic Composite Cables" Energies 17, no. 4: 820. https://doi.org/10.3390/en17040820
Note that from the first issue of 2016, this journal uses article numbers instead of page numbers. See further details here.