
Measurement Error in Thermoelectric Generator Induced by Temperature Fluctuation
by
 , ,
, ,
Yanan Li
1,2,
Hao Yang
2,
Chuanbin Yu
3,
Wenjie Zhou
2,
Qiang Zhang
2,
Haoyang Hu
2,
Peng Sun
2,
Jiehua Wu
2,
Xiaojian Tan
2,
Kun Song
2,4,*,
Guoqiang Liu
2,* and
Jun Jiang
2,* 1
Faculty of Electrical Engineering and Computer Science, Ningbo University, Ningbo 315211, China
2
Ningbo Institute of Materials Technology and Engineering, Chinese Academy of Sciences, Ningbo 315201, China
3
College of Civil Science and Engineering, Yangzhou University, Yangzhou 225009, China
4
School of Mechanical and Power Engineering, Nanjing Tech University, Nanjing 211816, China
*
Authors to whom correspondence should be addressed.
Energies 2024, 17(5), 1036; https://doi.org/10.3390/en17051036
Submission received: 31 January 2024
/
Revised: 14 February 2024
/
Accepted: 17 February 2024
/
Published: 22 February 2024
(This article belongs to the Topic Energy Storage and Conversion Systems, 2nd Volume)
Abstract
:The thermal-electric conversion efficiency is a crucial metric for evaluating the performance of a thermoelectric generator (TEG). However, accurate measurement of this efficiency remains a significant challenge due to various factors that impact heat flow measurements. We have observed that temperature fluctuations during temperature control are the primary factor contributing to measurement errors in heat flow under vacuum conditions. To address this issue, we have developed a time-dependent theoretical model for the thermal-electric coupling of a TEG measurement system based on Fourier’s theory of heat conduction. This model allows us to investigate the effects of both temperature fluctuation and structural parameters on the measurement error of TEG performance. Furthermore, we have proposed an error correction scheme for TEG performance based on our theoretical and experimental findings. These insights provide a theoretical framework and technical guidance for more precise measurements of TEG performance.
1. Introduction
Thermoelectric generators (TEGs) can directly convert heat into electricity via the Seebeck effect of thermoelectric (TE) materials, which have been widely used in the fields of aerospace [1], microelectronic devices, and low-grade heat recovery due to the advantages of high power density, ultra silent, and no emission [2,3]. Thermal-electric conversion efficiency is an important index in evaluating the performance of a TEG, which is the ratio of the output power to the input thermal energy. Since the maximum conversion efficiency of a TEG firmly depends on the TE figure of merit ZT (, where is the Seebeck coefficient, is the electric conductivity, is the thermal conductivity, and T is the absolute temperature) [4], many efforts have been made to improve the conversion efficiency of TEGs by optimizing ZT values.
Actually, remarkable achievement on TE materials has been obtained in recent years. As commercially available TE materials, the reported p-type Bi2Te3-based material fabricated via liquid-phase compaction has a peak ZT of 1.86 at 320 K [5], while the n-type Bi2Te3 sample with the recorded maximum and average ZT values of ~1.4 and ~1.3, respectively, at temperatures of 300 K–575 K was obtained through introducing electron transport potential wells and texturing [6]. In addition, Tsai et al. [7] achieved a high ZT values of >2.6 in Sb2Te3-doped GeTe. Liu et al. [8] demonstrated that Cu can fill Sn vacancies in SnSe crystals to weaken defects scattering and boost carrier mobility, facilitating an average ZT of ~2.2 at 300 K to 773 K. The continuous optimization of TE materials provides sufficient guarantee in the performance optimization of TEGs.
Both the interfacial optimization and structure design are devoted to improving the performance of TEGs. The interfacial resistivity is the main parameter that needs to be suppressed due to its significant impact on the performance of TEGs. The interfacial resistivity of Bi2Te3-based TEGs is suppressed to 10 μΩ⋅cm2 by pressure in the fabricating process, leading to a 44% improvement of conversion efficiency from commercial devices [9]. The low interfacial resistivity (<1 μΩ⋅cm2) is realized in MgCuSb/MgAgSb junction by using the semimetal MgCuSb as an interface material [10]. The interfacial thermal resistance between TE legs and electrodes is reduced by 3.90–17.0% when considering the near-field thermal radiation effect [11]. In addition to suppressing interfacial resistivity, the structure design is also an effective way to improve the performance of TEGs. For example, Yi et al. [12] developed a theoretical model to optimize the thermal-electric coupling of the TEG system, which is improved by more than 80% of the conversion efficiency. Wang et al. [13] improved the output power and the conversion efficiency of commercial TEGs by 43.1% and 9.67%, respectively, by optimizing the TE leg geometry. Huang et al. [14] improved the compatibility between p-type and n-type TE materials by adjusting the ratio of cross-sectional areas, realizing a conversion efficiency of 6.24% under a temperature gradient of 300 K in the GeTe-based TEG.
Accurate measurement of the conversion efficiency is a prerequisite for evaluating the performance of TEGs. To this end, advanced measurement methods and equipment for TEGs were developed [15,16]. However, the measurement error in the performance of TEGs is hard to be totally eliminated due to various impact factors, especially in the measuring process of heat flow [17]. In the measurement process of the TEG, a heat source and a heat sink should be separately subjected to two ends of a TEG, while the heat flow is derived by the temperature gradient of a standard block with known thermal conductivity [18]. With the aid of the hybrid transient CFD-thermoelectric numerical models, the output power and the conversion efficiency of a TEG were predicted to have an error of 2.90% and 18.53%, respectively, due to the effect of the unstable heat source [19]. The heat sink is the most significant contributor to the measurement error of heat flow for a stable heat source. Current research on heat sinks has found that the air-cooling exchange consumes the least amount of auxiliary energy [20], while the heat pipe cooling exchanger is more effective [21]. In addition, Wang et al. [22] determined the optimal performance of the TEG system corresponding to a suitable size of fins. Zheng et al. [23] investigated the theoretical modeling of TEG using direct evaporative cooling, and the results show that the output power and the efficiency are increased 100.53 and 10.53 times higher than without evaporative cooling, respectively. The most widely used method of cooling TEGs is to flow cool water over the cold side of the TEG. The use of heat pipe cooling in the vacuum environment avoids the influence of heat convection on the test results, but the temperature fluctuation of the low temperature control unit is hard to avoid [24]. However, the study on the effect of temperature fluctuation of the heat sink on the output heat flow is still absence from the literature, which motivates our current work.
In order to analyze the influence of temperature fluctuation on the measurement results of a TEG, we established an unsteady heat transfer model with Dirichlet boundary conditions and Neumann boundary conditions based on the theory of Fourier heat conduction. The theoretical results were validated by using the finite element modeling (FEM), and the measurement error induced by the temperature fluctuation was reduced by changing the size and material parameters of a standard block. In addition, a correction formula was proposed from the theoretical result to make correction on the measured heat flow. Our study effectively avoided the negative effect of temperature fluctuation on heat flow measurement by reducing the maximum error from 11% at the temperature difference of K and 6.6% at K to 1.2% and 0.87%, respectively. It is hoped that our research can provide the theoretical basis on the accurate measurement of the performance of TEGs, particularly in the field of low-grade heat harvesting.
2. Theoretical Analysis and Experimental Method
2.1. Theoretical Solution
During the measurement of a TEG, the cold end of the TEG is in contact with a standard block, and the temperature at the bottom of the standard block is controlled by a temperature control unit, as shown in Figure 1a. The distance between the two temperature points 1 and 2 is d, and the heat energy in the standard block flows from point 2 to point 1. According to the Fourier heat conduction, the heat flow in the standard block can be expressed as:
where is the thermal conductivity and is the cross-sectional area of the standard block, and and are the temperatures at points 1 and 2, respectively. Generally, the heat energy is measured in a steady state with values, independent of time. However, the temperature fluctuation always exists at the bottom of the standard block, and the range of temperature fluctuation depends on the temperature control accuracy of the temperature control unit, resulting in a time-dependent temperature field in the measurement system. For example, when the temperature difference between the hot and cold ends of the TEG is 60 K, the temperature control unit with an accuracy of ±0.35 K leads to a temperature field at point 1, shown in Figure 1b, in which the accuracy of the temperature measurement system is ±0.05 K. Results show that the temperature oscillation conforms a sinusoidal distribution, which can be expressed as:
where is the amplitude of the sinusoidal part of the temperature at point 1.
According to the theory of Fourier heat conduction, the equation governing the heat flux and temperature are as follows [25]:
where and are the density and the specific heat capacity of the standard block, respectively. We assume that the heat flux is conservative in the standard block, and then
Noting that the temperature at the initial state conforms:
the general solution of Equation (3) can be solved based on the parameter separation method as:
where and are the unknown coefficients that can be determined by boundary conditions, and is a constant chosen by the separated variable method. Substituting Equation (8) into Equation (1), the heat flow of the standard block can be derived as:
where and are the coordinates of the temperature measurement point, which are known quantities. In addition, the energy conversion efficiency of the TEG can be expressed as:
On the other hand, the actual value of the heat flow at the cold end of the TEG can be calculated using the thermoelectric coupling model [26], resulting in a heat flow measurement error as:
where is the experimental data and is the calculated value.
2.2. Experimental Method
The schematic diagram of the measurement system is presented in Figure 2a. To prevent heat convection, a TEG was placed inside a vacuum chamber during the measurements. Heat energy was conducted through a copper block to reach the hot end of the TEG. The cold end of the TEG was connected to a standard block and subsequently to a temperature control unit. An electronic load meter and a multi-channel temperature tester were utilized to measure the output power and temperatures. Figure 2b provides an example of determining the output power. When there was a temperature difference between the two ends of the TEG, the electric current of the electronic load was adjusted to determine the maximum output power. Additionally, p-type and n-type Bi2Te3-based TE materials were utilized as the TE legs, with their material parameters provided in Figure 3.
Furthermore, the theoretical model of the TEG was validated through finite element modeling (FEM) using the software “ANSYS”. This model incorporated two copper-clad alumina (CCA) components with a dimension of 40 × 40 mm2, 127 pairs of TE legs, as well as an external resistance. The material parameters of TE legs are provided in Figure 3, whereas the material properties of electrodes and alumina were retrieved from the material databases within the software. The “Thermoelectric” physics was applied to the FEM. The boundary conditions were set according to the theoretical model and the experimental setup. The software simulation calculated the theoretical value of the output heat flow for comparison and analysis with the experimental data.
3. Results and Discussion
3.1. Theoretical Model Validation
To begin with, the boundary conditions were set according to the experimental setup. For a temperature control system of heat sink with an accuracy of ±0.35 K, the temperature at point 1 was confirmed to be 282.8 K, and the heat flow at point 2 was confirmed to be 2.1 W/cm2 when there was a temperature difference of 60 K between the hot and cold ends of the TEG. When the temperature difference between the hot and cold ends of the TEG was 90 K, the temperature at point 1 was 283.9 K and the heat flux at point 2 was 3.1 W/cm2.
Furthermore, Figure 4a presents the theoretical and numerical values of the output heat flow under a temperature boundary condition given by Equation (2). It was observed that the theoretical results align well with the numerical outcomes. Detailed analysis reveals that there were relative errors of 0.35% at 60 K and 0.43% at 90 K between the theoretical and numerical results, which indicates that the theoretical solution holds high credibility. Additionally, the theoretical results were verified by comparing the theoretical conversion efficiency with experimental data. Figure 4b shows theoretical and experimental output power values at the temperature difference = 60 K, which indicates that the relative error of the output power between the theoretical results and the experimental data was only 1.35%. In summary, the theoretical model of TEGs was validated through both the FEM and the experimental data, which proves that the theoretical results had high credibility.
3.2. Parametric Analysis
The temperature fluctuations of the temperature control unit resulted in periodic changes in the temperature of the standard block, which in turn led to periodic variations in the output heat flow and power of the TEG. The temperature-dependent output power of the TEG is presented in Figure 5, indicating that the fluctuation in output power was less than 1% for each cycle of heat flow change during the test. Therefore, the impact of heat flow fluctuations on the output power can be disregarded when calculating the conversion efficiency of the TEG. For simplicity, we considered the output power as the average value in our study of conversion efficiency.
The impact of temperature fluctuations on the heat flow of the standard block is depicted in Figure 6. In this figure, the thermal conductivity of the standard block was set at 400 W/(m∙K), while the temperature control unit experienced a ±0.35 K fluctuation over a period of 320 s. Figure 6a reveals that as the height of the standard block decreased, the relative error in the measurement results also decreased. The results displayed in Figure 6b indicate that as the thermal conductivity of the standard block decreased, the relative error decreased. Figure 6c reveals that the error remained below 1% when the period exceeded 1200 s. Finally, Figure 6d demonstrates that the measurement error was independent of the distance between the two temperature measurement points.
3.3. Error Correction
The output heat flow and the conversion efficiency exhibited by the TEG during three cycles of temperature fluctuations of the temperature control unit are depicted in Figure 7. Figure 7a, b specifically illustrate the heat flow and the conversion efficiency observed when the temperature difference between the hot and cold ends of the TEG was maintained at 60 K. The results indicate that the heat flow oscillated periodically around a standard value calculated by the FEM. Upon comparing the maximum and minimum values of the output heat flow, it was revealed that the error between the peak and the valley output heat flow amounted to 11%. Analogously, the discrepancy between the maximum and minimum values of the conversion efficiency also attained 11%. Figure 7c,d further demonstrate that when the temperature difference was increased to 90 K, the relative error between the extrema (maximum and minimum) values of both the output heat flow and the conversion efficiency narrowed down to 6.6%.
As the output heat flow exhibited oscillations around the standard value with a consistent amplitude, the error could be significantly minimized by taking the average of experimental results over multiple cycles. Figure 8 illustrates the average relative errors of the measured output heat flow for temperature differences of 60 K and 90 K, which amounted to 2.7% and 1.4%, respectively. The relative error was calculated as:
The theoretical results indicate that the output heat flow was influenced by the thermal conductivity and the cross-sectional area of the standard block, as well as the location of the temperature points and the time. In contrast, the numerical results suggest that the output heat flow was independent of the position of the temperature measurement point. When the period of temperature change at the low-temperature end of the heat-conducting block was 320 s, the period of the time-dependent output heat flow could be considered as 320 s. Consequently, two expressions for the corrected values with respect to the height of the standard block and the thermal conductivity can be proposed. Both the height and the thermal conductivity of the standard block are included in the expression of correction as:
where L is the standard block height and aj (j = 1,2,3) are the unknown coefficients that can be fitted with the data shown in Figure 6a, while and can be derived from the data shown in Figure 6b. Therefore, the corrected output heat flow () can be expressed as:
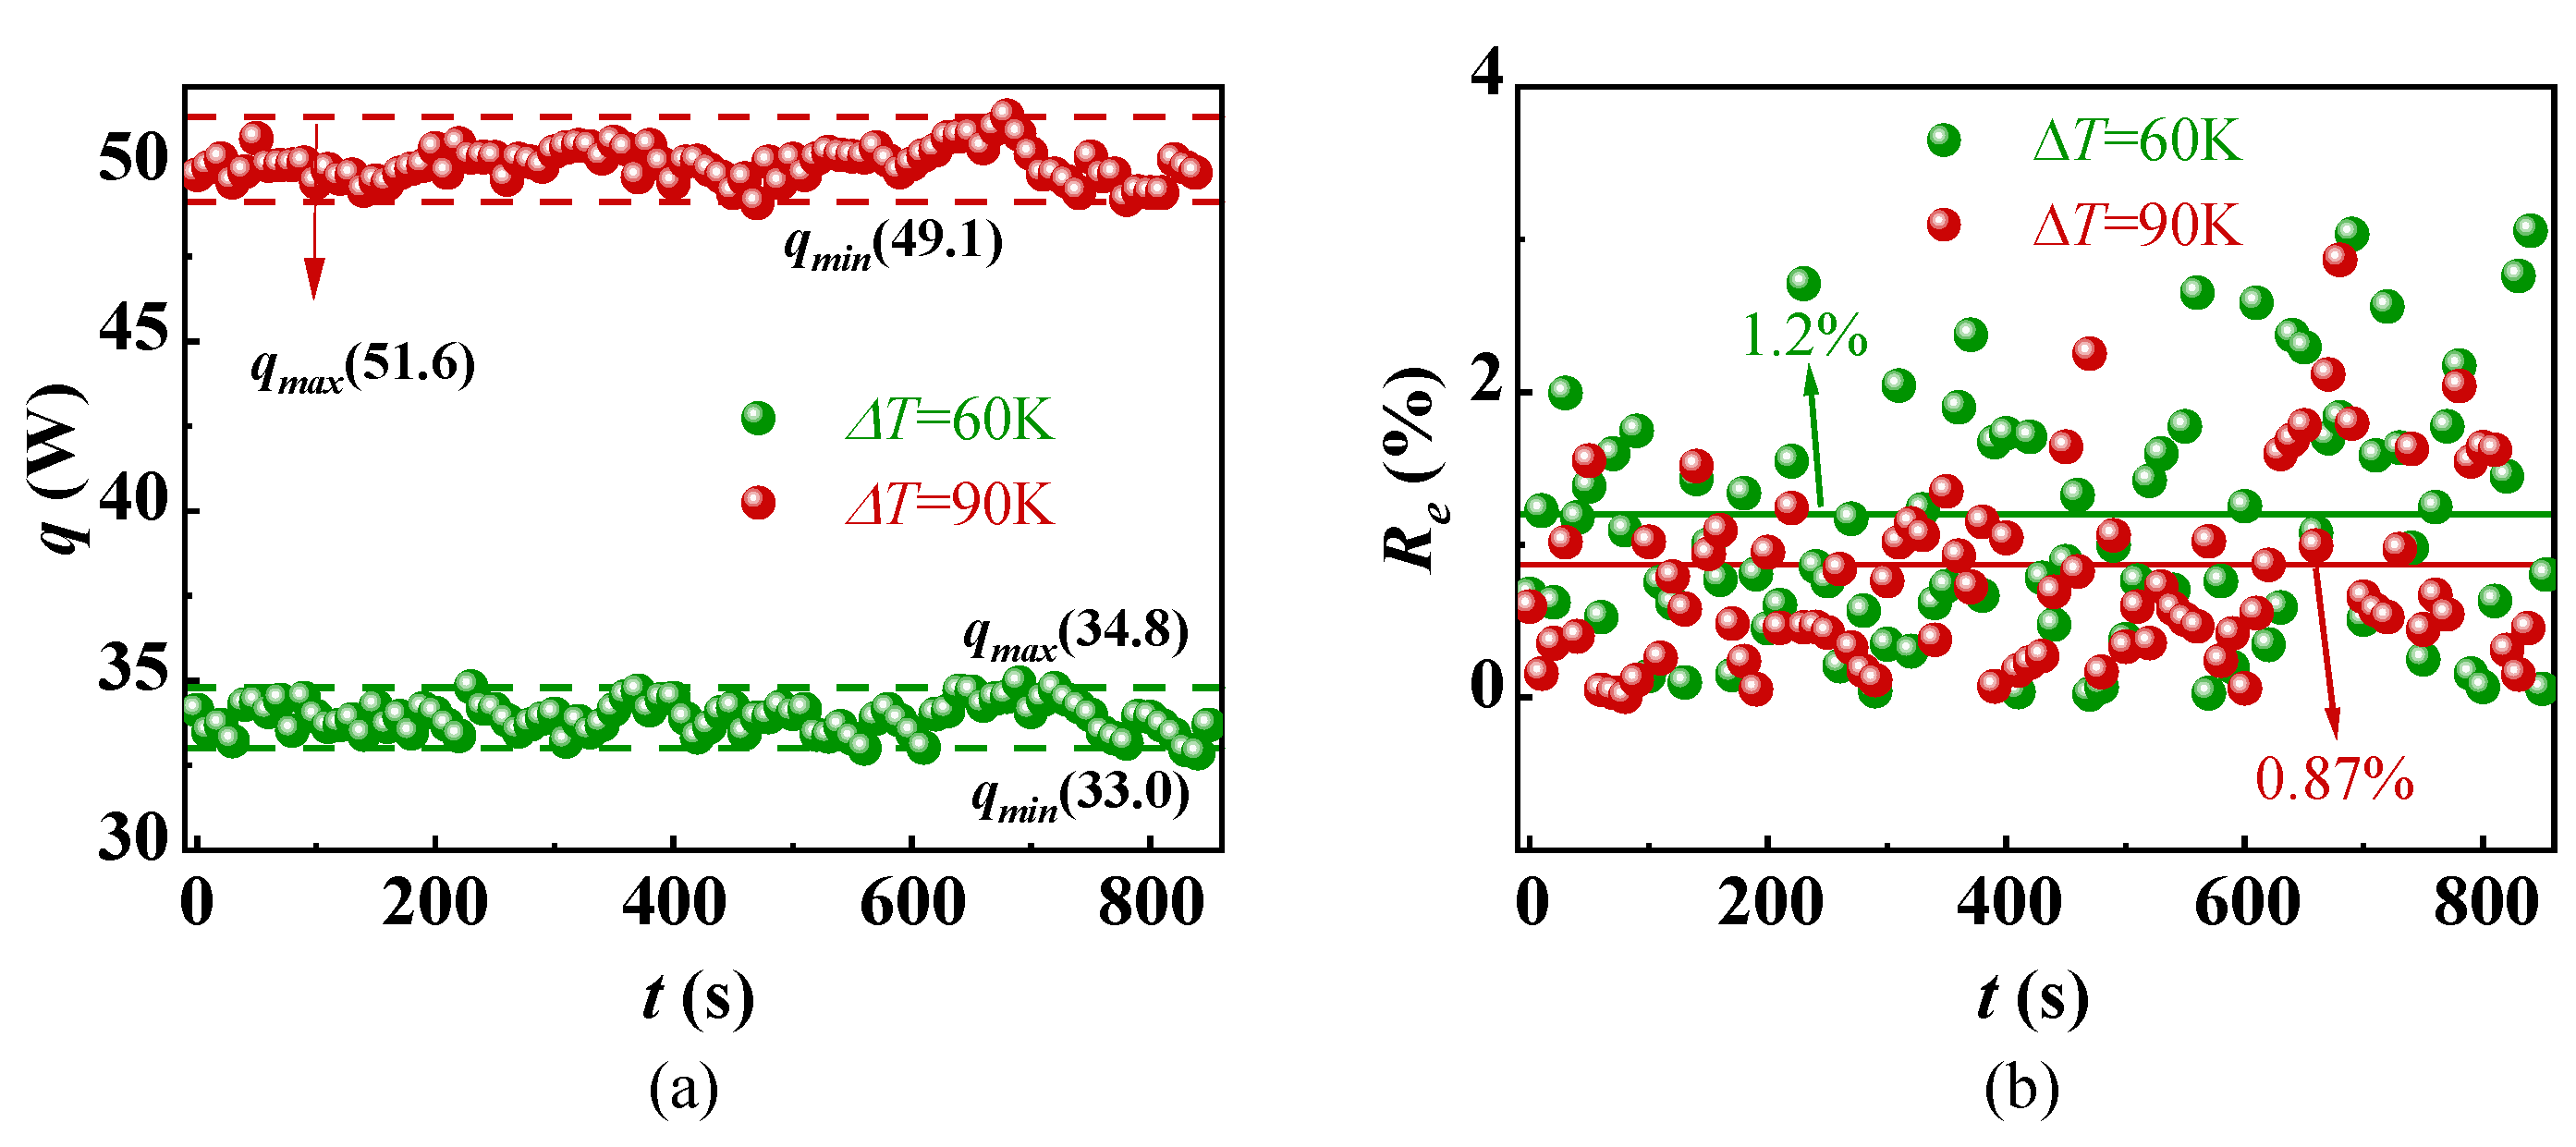
To rectify the measured results of the output heat flow, Equation (14) was applied to the experimental data. As displayed in Figure 9, the mean values of the corrected output heat flow test results for the TEG were 34.0 W and 50.3 W for temperature differences of 60 K and 90 K, respectively. Notably, the relative errors were reduced to 1.2% and 0.87%, respectively. The average relative errors of the corrected output heat flow were reduced by 55.6% and 37.9% when compared to the initial experimental data. These findings suggest that the modified formula effectively mitigates the measurement errors caused by temperature fluctuations of the temperature control unit.
4. Conclusions
This paper examines the impact of temperature fluctuations in the temperature control unit on the measured performance of a TEG. Initially, we derived the time-varying temperature field of the TEG test system using the heat conduction equation. The theoretical results indicate that the output heat flow and the conversion efficiency of the TEG exhibited periodic fluctuations due to temperature fluctuations. We investigated the effects of various parameters on the output heat flow, including the height of a standard block, the thermal conductivity, the temperature fluctuation period, and the location of the temperature measurement point. Our findings reveal that the fluctuation amplitude of the measured output heat flow can be fitted using a polynomial function with respect to the height of the standard block and a logarithmic function with respect to the thermal conductivity of the standard block. Additionally, we observed that as the temperature change period of the temperature control unit increased, the average relative error of the output heat flow decreased. Notably, the measured output heat flow remained unaffected by the location of the temperature measurement point. Based on these findings, we developed a correction formula that took into account the thermal conductivity and structural parameters of the standard block. This formula successfully reduced the relative error of output heat flow by more than 50%, leading to more accurate measurements in TEG conversion efficiency.
Author Contributions
Conceptualization, Y.L. and K.S.; methodology, H.Y., Q.Z. and P.S.; validation, W.Z., Q.Z. and X.T.; formal analysis, C.Y.; investigation, J.W.; resources, H.H. and J.W.; data curation, C.Y. and W.Z.; writing—original draft preparation, Y.L.; writing—review and editing, K.S., G.L. and J.J.; visualization, H.Y.; supervision, K.S., G.L. and J.J.; project administration, X.T.; funding acquisition, K.S. and J.J. All authors have read and agreed to the published version of the manuscript.
Funding
This work was supported by the National Natural Science Foundation of China (grant Nos.: 12102126 and U21A2079), the Natural Science Foundation of Jiangsu Province (BK20210787), the Natural Science Foundation of Guangdong Province (grant No. 2022A1515011773), the Natural Science Foundation of Guangzhou City (grant No. 202201010317), the Zhejiang Provincial Key R&D Program of China (No. 2021C01026), the Key Project of the Director foundation, and the Zhejiang Provincial High-level Talent Special Support Plan (No. 2020R52032).
Data Availability Statement
This work does not create links to publicly archived datasets.
Conflicts of Interest
The authors declare no conflict of interest.
References
- Wu, Z.; Zhang, S.; Liu, Z.; Mu, E.; Hu, Z. Thermoelectric converter: Strategies from materials to device application. Nano Energy 2022, 91, 106692. [Google Scholar] [CrossRef]
- Champier, D. Thermoelectric generators: A review of applications. Energy Convers. Manag. 2017, 140, 167–181. [Google Scholar] [CrossRef]
- Singh, Y.; Singh, S.K.; Hazra, P. The Quest for High-Efficiency Thermoelectric Generators for Extracting Electricity from Waste Heat. JOM 2021, 73, 4070–4084. [Google Scholar] [CrossRef]
- Song, K.; Wang, S.; Duan, Y.; Ling, X.; Schiavone, P. Effect of Inevitable Heat Leap on the Conversion Efficiency of Thermoelectric Generators. Phys. Rev. Lett. 2023, 131, 207001. [Google Scholar] [CrossRef]
- Kim, S.I.; Lee, K.H.; Mun, H.A.; Kim, H.S.; Hwang, S.W.; Roh, J.W.; Yang, D.J.; Shin, W.H.; Li, X.S.; Lee, Y.H.; et al. Dense dislocation arrays embedded in grain boundaries for high-performance bulk thermoelectrics. Science 2015, 348, 109–114. [Google Scholar] [CrossRef] [PubMed]
- Zhu, B.; Liu, X.; Wang, Q.; Qiu, Y.; Shu, Z.; Guo, Z.; Tong, Y.; Cui, J.; Gu, M.; He, J. Realizing record high performance in n-type Bi2Te3-based thermoelectric materials. Energy Environ. Sci. 2020, 13, 2106–2114. [Google Scholar] [CrossRef]
- Tsai, Y.-F.; Wei, P.-C.; Chang, L.; Wang, K.-K.; Yang, C.-C.; Lai, Y.-C.; Hsing, C.-R.; Wei, C.-M.; He, J.; Snyder, G.J.; et al. Compositional Fluctuations Locked by Athermal Transformation Yielding High Thermoelectric Performance in GeTe. Adv. Mater. 2021, 33, 2008808. [Google Scholar] [CrossRef] [PubMed]
- Liu, D.; Wang, D.; Hong, T.; Wang, Z.; Wang, Y.; Qin, Y.; Su, L.; Yang, T.; Gao, X.; Ge, Z.; et al. Lattice plainification advances highly effective SnSe crystalline thermoelectrics. Science 2023, 380, 841–846. [Google Scholar] [CrossRef] [PubMed]
- Xu, H.; Zhang, Q.; Yi, L.; Huang, S.; Yang, H.; Li, Y.; Guo, Z.; Hu, H.; Sun, P.; Tan, X.; et al. High performance of Bi2Te3-based thermoelectric generator owing to pressure in fabrication process. Appl. Energy 2022, 326, 119959. [Google Scholar] [CrossRef]
- Xie, L.; Yin, L.; Yu, Y.; Peng, G.; Song, S.; Ying, P.; Cai, S.; Sun, Y.; Shi, W.; Wu, H.; et al. Screening strategy for developing thermoelectric interface materials. Science 2023, 382, 921–928. [Google Scholar] [CrossRef] [PubMed]
- Gao, G.; Chen, S.-Y.; Ai, L.-Q.; Liu, N.; Gou, J.-J.; Gong, C.-L. A thermal contact model encompassing near-field effects of multi-interface TEGs in hypersonic conditions. Int. J. Heat Mass Transf. 2023, 216, 124543. [Google Scholar] [CrossRef]
- Yi, L.; Xu, H.; Yang, H.; Huang, S.; Yang, H.; Li, Y.; Zhang, Q.; Guo, Z.; Hu, H.; Sun, P.; et al. Design of Bi2Te3-based thermoelectric generator in a widely applicable system. J. Power Sources 2023, 559, 232661. [Google Scholar] [CrossRef]
- Wang, P.; Wang, B.; Wang, K.; Gao, R.; Xi, L. An analytical model for performance prediction and optimization of thermoelectric generators with varied leg cross-sections. Int. J. Heat Mass Transf. 2021, 174, 121292. [Google Scholar] [CrossRef]
- Huang, S.; Yang, H.; Li, Y.; Guo, Z.; Zhang, Q.; Cai, J.; Wu, J.; Tan, X.; Liu, G.; Song, K.; et al. Optimizing GeTe-based thermoelectric generator for low-grade heat recovery. Appl. Energy 2023, 349, 121584. [Google Scholar] [CrossRef]
- Ahiska, R.; Mamur, H. A test system and supervisory control and data acquisition application with programmable logic controller for thermoelectric generators. Energy Convers. Manag. 2012, 64, 15–22. [Google Scholar] [CrossRef]
- Rao, A.; Joshi, G.; Poudel, B.; Ballinger, C. A custom designed modular, scalable test system for an efficient performance evaluation of thermoelectric devices. Energy Convers. Manag. X 2022, 14, 100228. [Google Scholar] [CrossRef]
- He, H.; Liu, W.; Wu, Y.; Rong, M.; Zhao, P.; Tang, X. An approximate and efficient characterization method for temperature-dependent parameters of thermoelectric modules. Energy Convers. Manag. 2019, 180, 584–597. [Google Scholar] [CrossRef]
- Guo, Z.; Song, K.; Yan, Z.; Sun, P.; Tan, X.; Wu, G.; Zhang, Q.; Liu, G.-Q.; Yu, B.; Jiang, J. Broadening the optimum thermoelectric power generation range of p-type sintered Bi0.4Sb1.6Te3 by suppressing bipolar effect. Chem. Eng. J. 2021, 426, 131853. [Google Scholar] [CrossRef]
- Luo, D.; Zhao, Y.; Yan, Y.; Chen, H.; Chen, W.-H.; Wang, R.; Li, Y.; Yang, X. Development of two transient models for predicting dynamic response characteristics of an automobile thermoelectric generator system. Appl. Therm. Eng. 2023, 221, 119793. [Google Scholar] [CrossRef]
- Khattak, Z.; Ali, H.M. Air cooled heat sink geometries subjected to forced flow: A critical review. Int. J. Heat Mass Transf. 2019, 130, 141–161. [Google Scholar] [CrossRef]
- Lv, S.; He, W.; Jiang, Q.; Hu, Z.; Liu, X.; Chen, H.; Liu, M. Study of different heat exchange technologies influence on the performance of thermoelectric generators. Energy Convers. Manag. 2018, 156, 167–177. [Google Scholar] [CrossRef]
- Wang, X.; Deng, W.; Tang, X.; He, H. Experiment and simulation study on the specification parameters of finned heat sink for thermoelectric system in consideration of radiation among fins. Int. J. Therm. Sci. 2023, 185, 108097. [Google Scholar] [CrossRef]
- Zheng, L.J.; Kang, D.H.; Kim, N.K.; Youn, Y.J.; Kang, H.W. Theoretical analysis of natural evaporative cooling to enhance the efficiency of thermoelectric devices. Int. J. Heat Mass Transf. 2019, 143, 118512. [Google Scholar] [CrossRef]
- Zeng, Z.; Zhang, W.; Yu, H.; Cao, D.; Li, X. Dynamic thermal model and control performance analysis over frequency domain of temperature control unit. Case Stud. Therm. Eng. 2023, 45, 102975. [Google Scholar] [CrossRef]
- Želi, V.; Zorica, D. Analytical and numerical treatment of the heat conduction equation obtained via time-fractional distributed-order heat conduction law. Physica A 2018, 492, 2316–2335. [Google Scholar] [CrossRef]
- Song, K.; Song, H.-P.; Gao, C.-F. Macro-performance of multilayered thermoelectric medium*. Chin. Phys. B 2017, 26, 127307. [Google Scholar] [CrossRef]
Figure 1.
(a) Schematic of heat transfer in a standard block; (b) temperature fluctuation at point 1 when the accuracy of the temperature control unit is ±0.35 K and the accuracy of the temperature measurement system is ±0.05 K.
Figure 1.
(a) Schematic of heat transfer in a standard block; (b) temperature fluctuation at point 1 when the accuracy of the temperature control unit is ±0.35 K and the accuracy of the temperature measurement system is ±0.05 K.

Figure 2.
(a) Schematic diagram of the TEG measurement system; (b) the measured output power at the temperature difference K, in which the measurement accuracy of the output power is 1 mW.
Figure 2.
(a) Schematic diagram of the TEG measurement system; (b) the measured output power at the temperature difference K, in which the measurement accuracy of the output power is 1 mW.
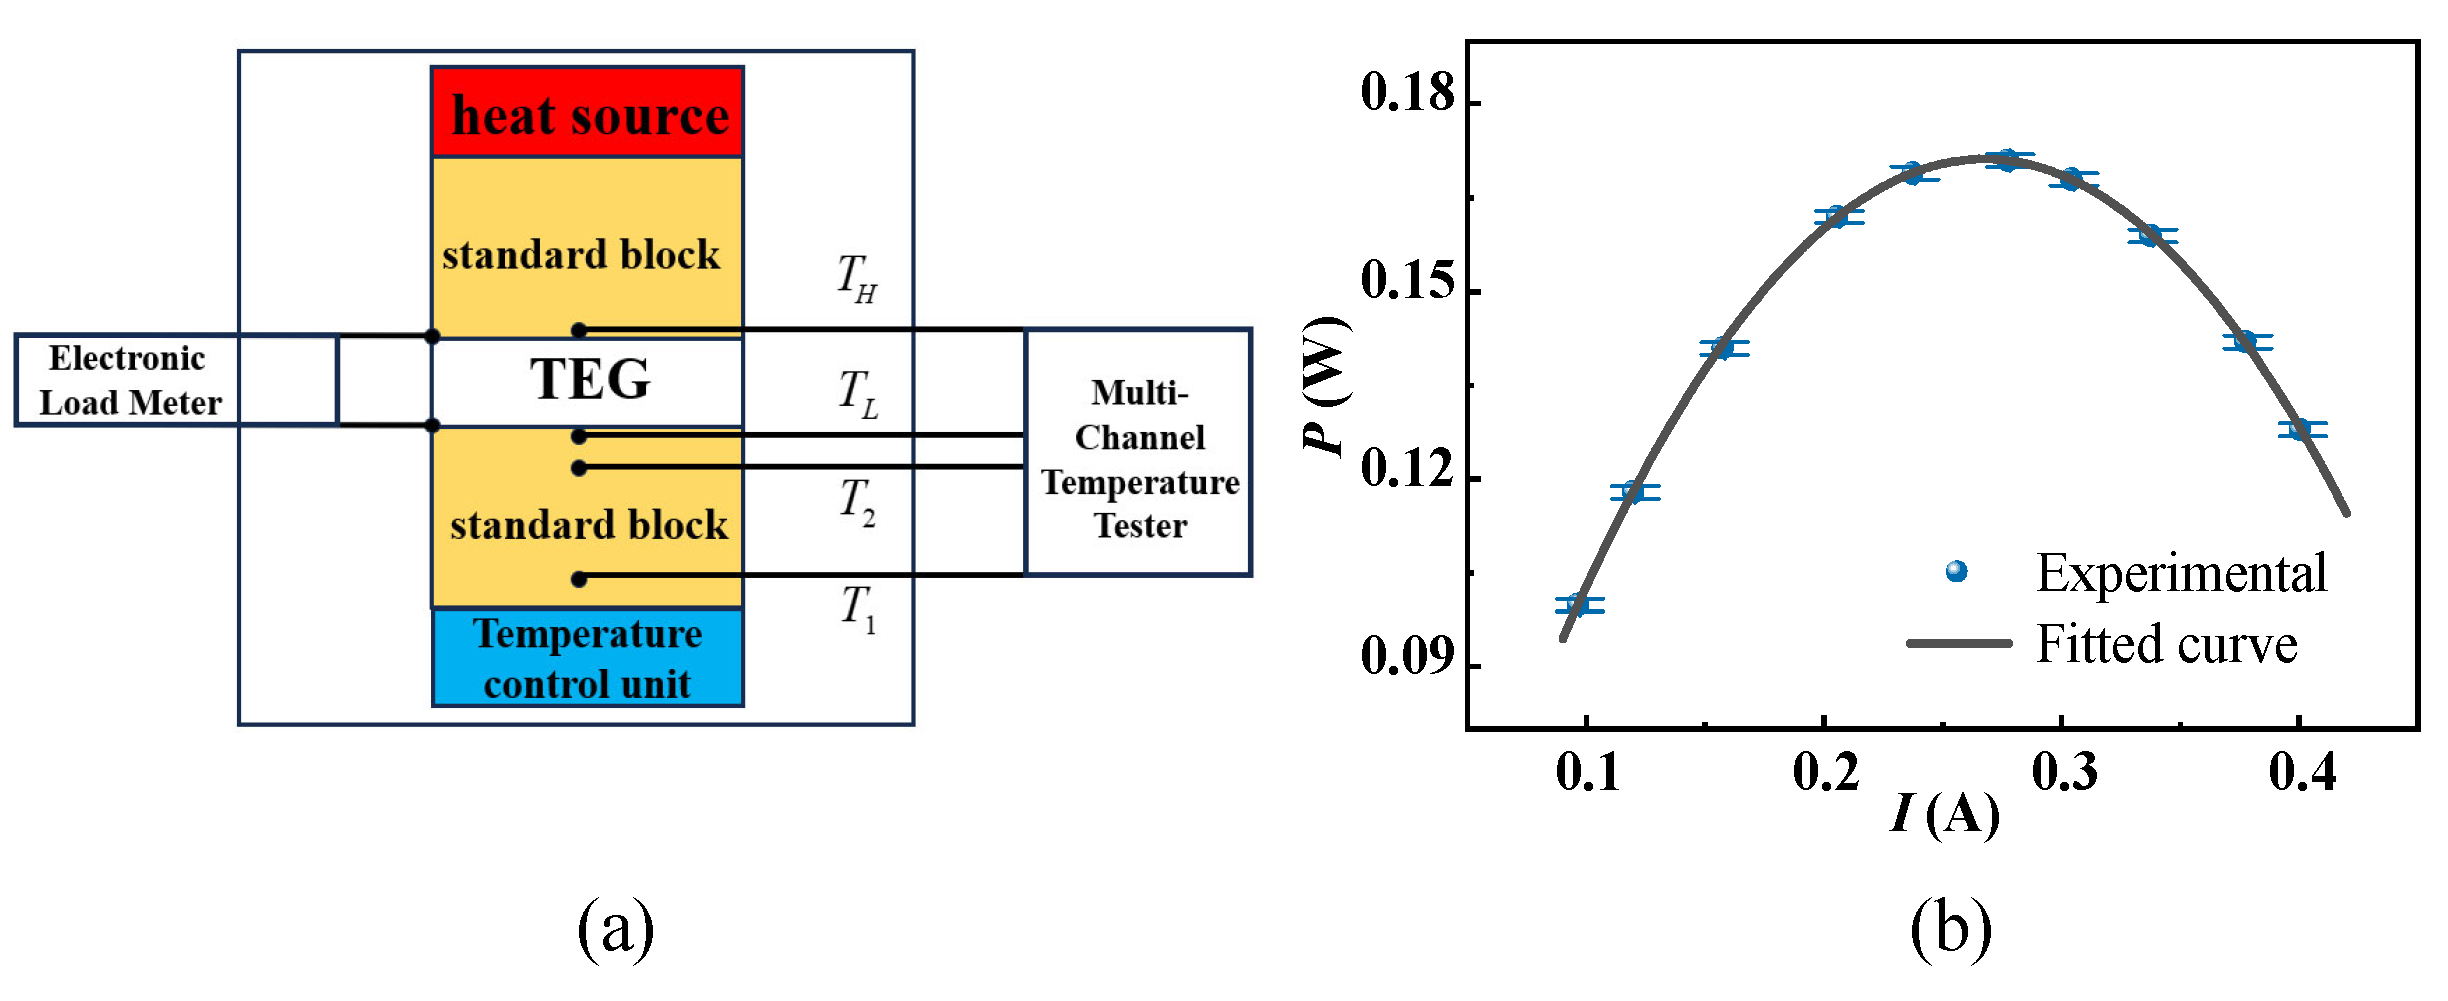
Figure 3.
Material parameters of Bi2Te3-based TE legs: (a) the Seebeck coefficient; (b) thermal conductivity; (c) electric conductivity; (d)ZT.
Figure 3.
Material parameters of Bi2Te3-based TE legs: (a) the Seebeck coefficient; (b) thermal conductivity; (c) electric conductivity; (d)ZT.

Figure 4.
(a) Simulated and theoretical output heat flows of the TEG under the temperature differences of 60 K and 90 K; (b) comparison of theoretical and experimental output power at 60 K.
Figure 4.
(a) Simulated and theoretical output heat flows of the TEG under the temperature differences of 60 K and 90 K; (b) comparison of theoretical and experimental output power at 60 K.

Figure 5.
Fluctuation of the output power in the time of one cycle of heat flow change.
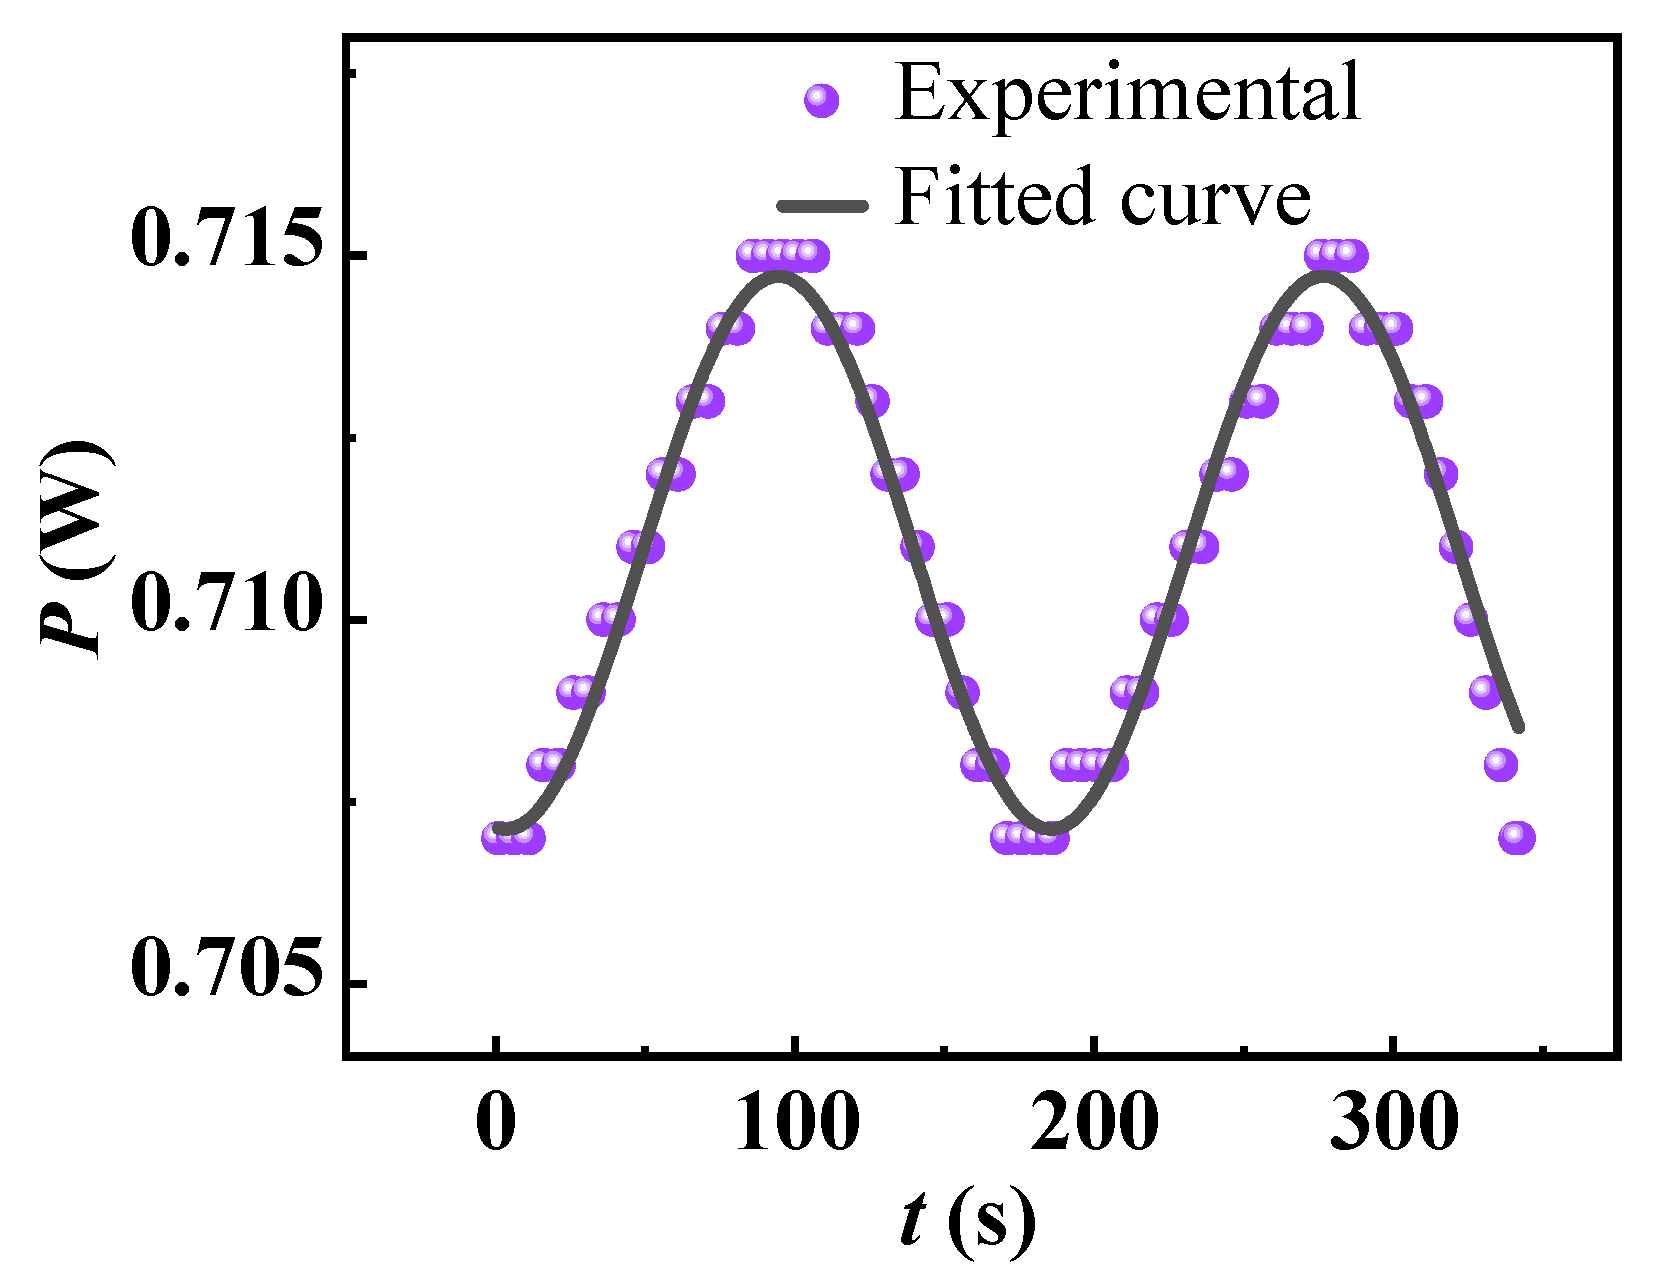
Figure 6.
Hear flow under the conditions of the height of the standard block (a), the thermal conductivity of the standard block (b), the period of temperature change at the bottom of the standard block (c), and the distance between two temperature points (d).
Figure 6.
Hear flow under the conditions of the height of the standard block (a), the thermal conductivity of the standard block (b), the period of temperature change at the bottom of the standard block (c), and the distance between two temperature points (d).
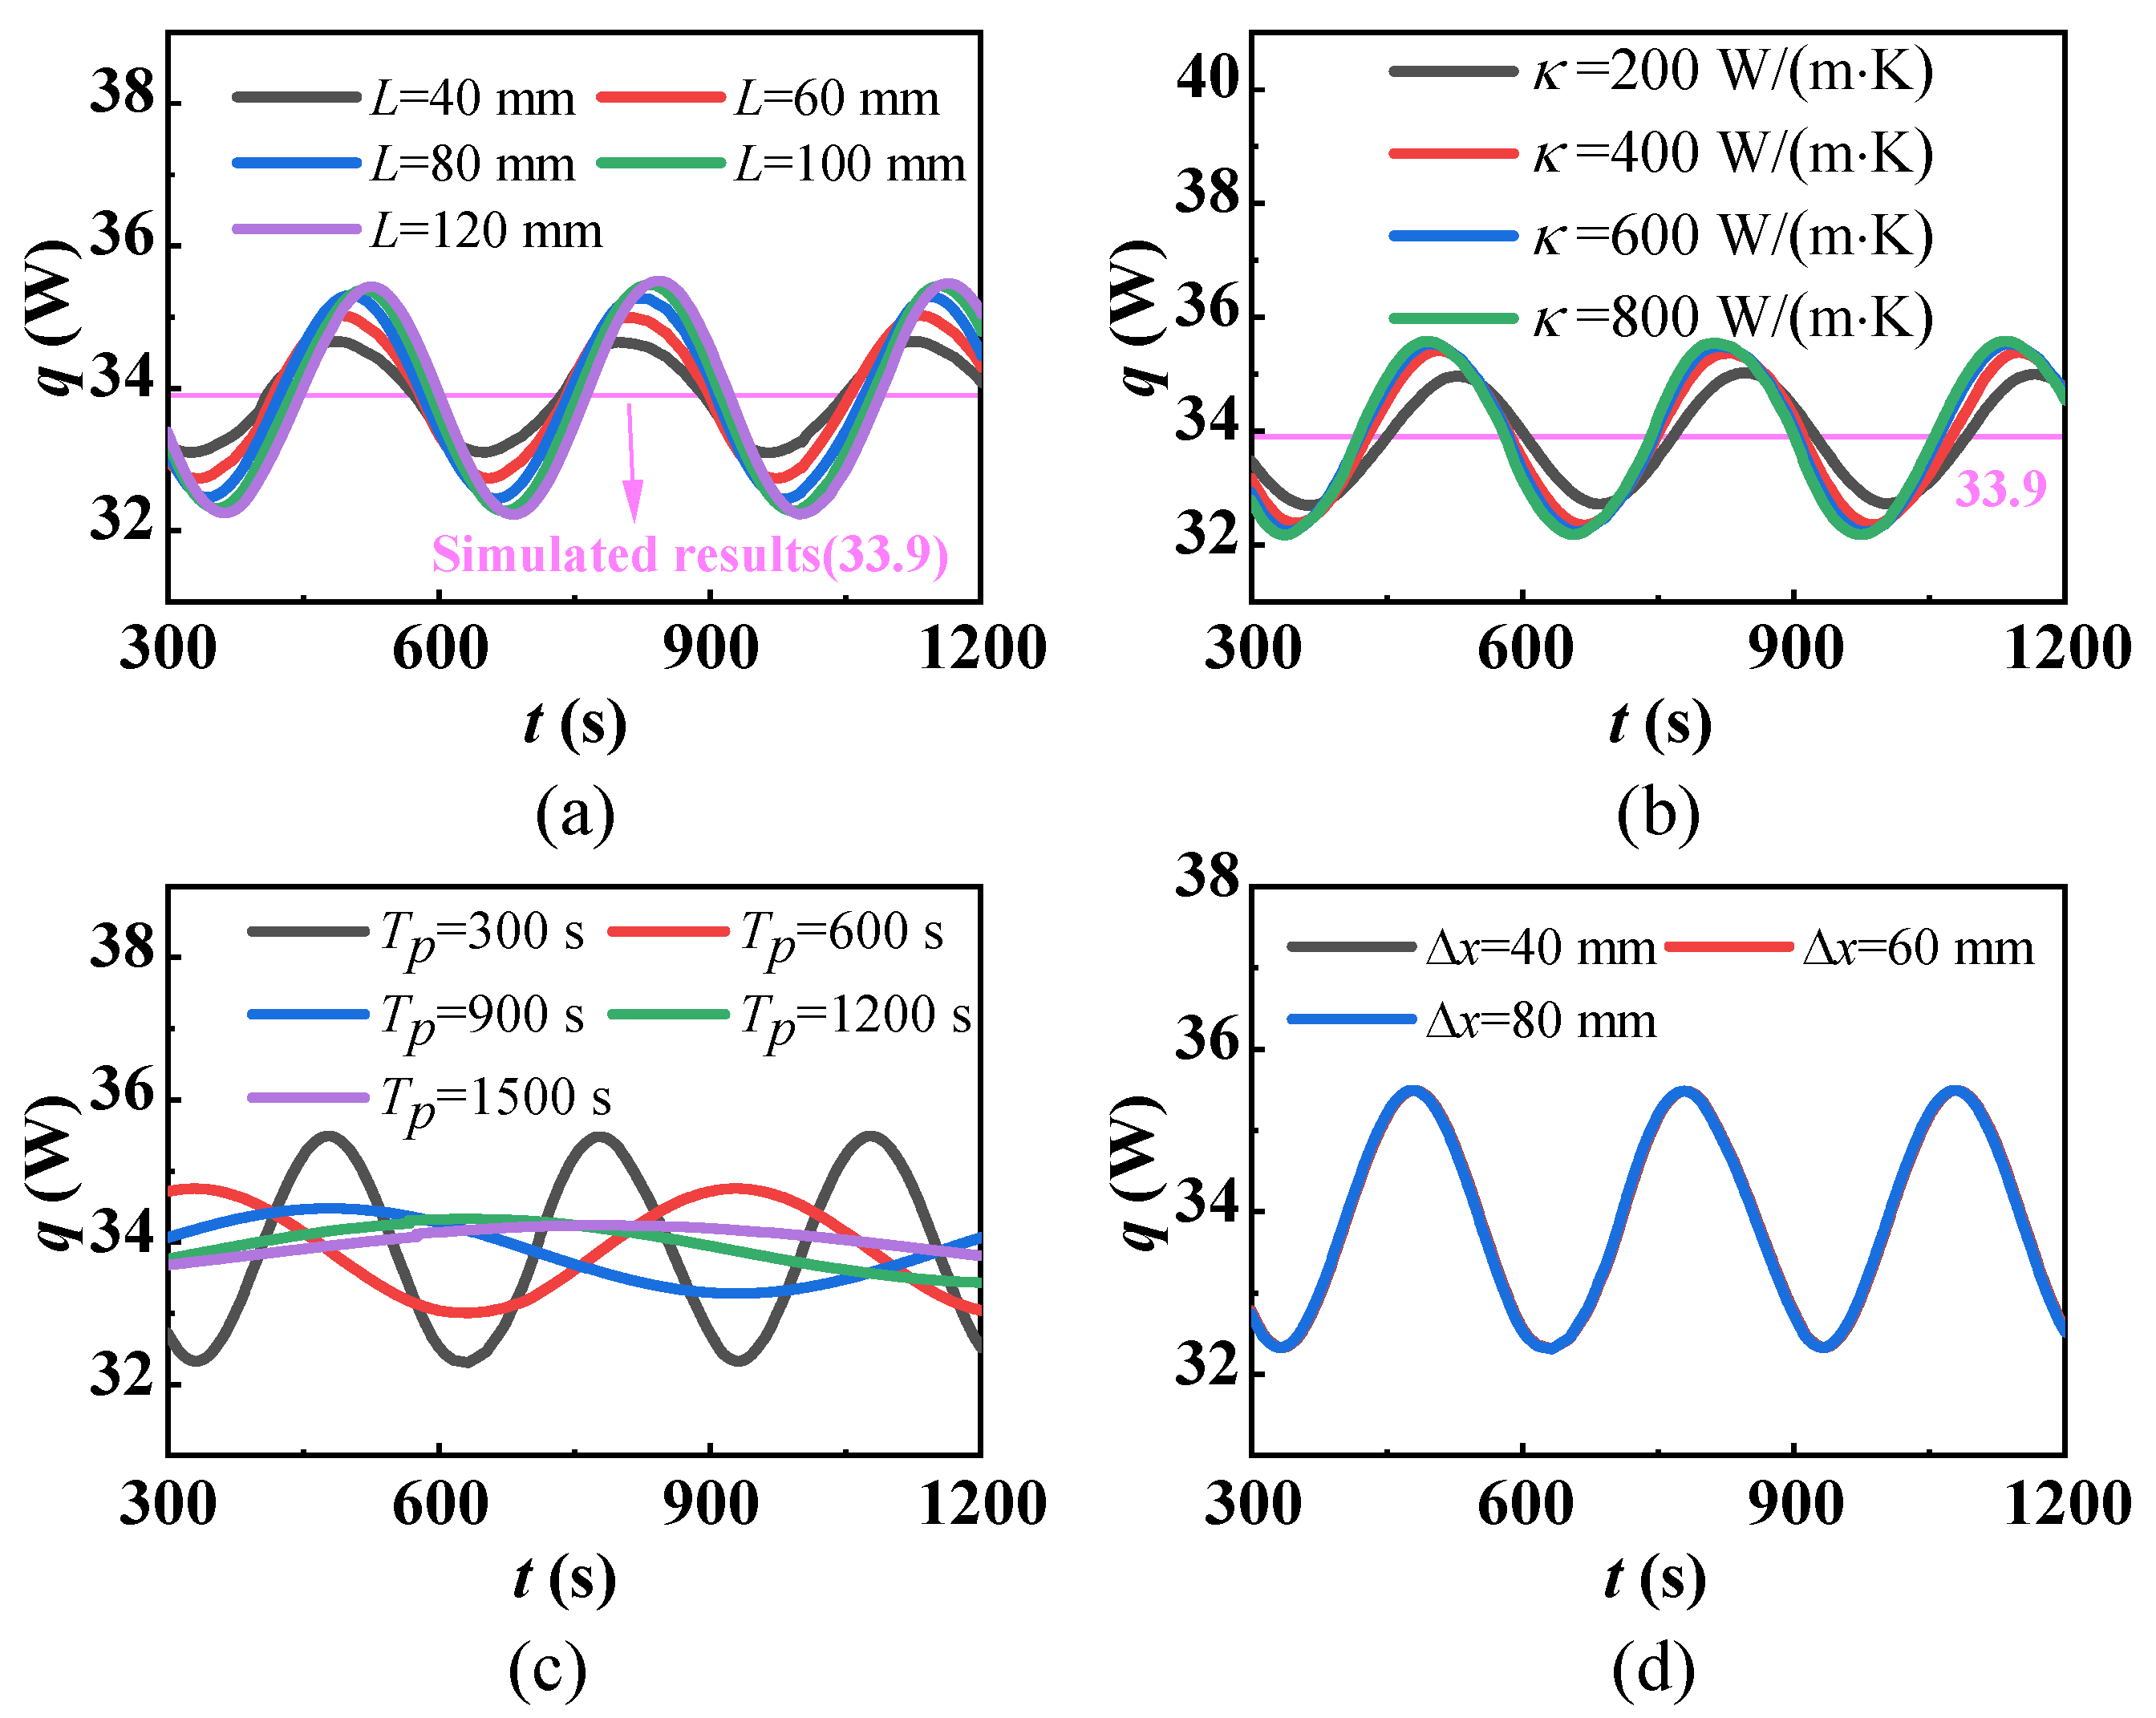
Figure 7.
Output heat flow and conversion efficiency diagrams of the thermoelectric generator: (a) heat flow at 60 K; (b) conversion efficiency at 60 K; (c) heat flow at 90 K; (d) conversion efficiency at 90 K.
Figure 7.
Output heat flow and conversion efficiency diagrams of the thermoelectric generator: (a) heat flow at 60 K; (b) conversion efficiency at 60 K; (c) heat flow at 90 K; (d) conversion efficiency at 90 K.

Figure 8.
Relative error of the output heat flow before correction, in which 2.7% at 60 K and 1.4% at 90 K, where is the average relative error.
Figure 8.
Relative error of the output heat flow before correction, in which 2.7% at 60 K and 1.4% at 90 K, where is the average relative error.

Figure 9.
(a) Corrected output heat flow; (b) corrected relative error, in which 1.2% at 60 K and 0.87% at 90 K.
Figure 9.
(a) Corrected output heat flow; (b) corrected relative error, in which 1.2% at 60 K and 0.87% at 90 K.
Disclaimer/Publisher’s Note: The statements, opinions and data contained in all publications are solely those of the individual author(s) and contributor(s) and not of MDPI and/or the editor(s). MDPI and/or the editor(s) disclaim responsibility for any injury to people or property resulting from any ideas, methods, instructions or products referred to in the content. |
© 2024 by the authors. Licensee MDPI, Basel, Switzerland. This article is an open access article distributed under the terms and conditions of the Creative Commons Attribution (CC BY) license (https://creativecommons.org/licenses/by/4.0/).
Share and Cite
MDPI and ACS Style
Li, Y.; Yang, H.; Yu, C.; Zhou, W.; Zhang, Q.; Hu, H.; Sun, P.; Wu, J.; Tan, X.; Song, K.; et al. Measurement Error in Thermoelectric Generator Induced by Temperature Fluctuation. Energies 2024, 17, 1036. https://doi.org/10.3390/en17051036
AMA Style
Li Y, Yang H, Yu C, Zhou W, Zhang Q, Hu H, Sun P, Wu J, Tan X, Song K, et al. Measurement Error in Thermoelectric Generator Induced by Temperature Fluctuation. Energies. 2024; 17(5):1036. https://doi.org/10.3390/en17051036
Chicago/Turabian StyleLi, Yanan, Hao Yang, Chuanbin Yu, Wenjie Zhou, Qiang Zhang, Haoyang Hu, Peng Sun, Jiehua Wu, Xiaojian Tan, Kun Song, and et al. 2024. "Measurement Error in Thermoelectric Generator Induced by Temperature Fluctuation" Energies 17, no. 5: 1036. https://doi.org/10.3390/en17051036
Note that from the first issue of 2016, this journal uses article numbers instead of page numbers. See further details here.