Article

Experimental Investigation of the Effects of Inorganic Components on the Supercritical Water Gasification of Semi-Coke

1
College of Mechanical & Electrical Engineering, Shaanxi University of Science & Technology, Xi’an 710021, China
2
State Key Laboratory of Multiphase Flow in Power Engineering, Xi’an Jiaotong University, Xi’an 710049, China
3
Zhundong Energy Research Institute, Xinjiang Tianchi Energy Co., Ltd., Changji 831100, China
*
Authors to whom correspondence should be addressed.
Energies 2024, 17(5), 1193; https://doi.org/10.3390/en17051193
Submission received: 26 December 2023 / Revised: 15 February 2024 / Accepted: 21 February 2024 / Published: 2 March 2024
(This article belongs to the Special Issue CO2 Reduction and H2 Promotion Techniques in Energies)

Abstract

:
Inorganic components in coal play a significant role during the supercritical water gasification (SCWG) process. This study comprehensively investigated the effect of major mineral components (SiO2, Al2O3, and CaO) on the SCWG of semi-coke with/without K2CO3. The inhibition/promotion mechanism and conversion of mineral chemical components were explored. The results showed that, without K2CO3, CaO promoted gasification because CaO’s adsorption of CO2 contributed to the fixed carbon steam reforming reaction and the catalysis of highly dispersed calcite. When K2CO3 was added, SiO2 and CaO were prone to sintering and agglomeration due to the formation of low-melting-point minerals, which hindered further gasification of fine carbon particles. Al2O3 prevented the aggregation of slags, increased the probability of fine carbon particles contacting SCW and K2CO3, and promoted complete gasification. This study’s results may provide theoretical guidance for the directional control of minerals in coal during SCWG, and complete gasification of solid-phase carbon can be achieved by properly adjusting the mineral components.

Graphical Abstract

1. Introduction

Coal, as an inexpensive and abundant natural resource, is expected to be the primary energy source long into the future, especially in China [1,2,3]. Global warming and air pollution caused by traditional coal utilization are becoming increasingly serious, which makes the development of clean coal technology urgent [4,5]. When the temperature and pressure of water exceed the critical point (374 °C and 22.1 MPa), the phase interface between the gas and liquid phases of water disappears, and water becomes supercritical, known as supercritical water (SCW) [6,7,8]. SCW has some special physical and chemical properties, such as gas-like viscosity, liquid-like density, low dielectric constant, and high diffusion coefficient. This enables SCW to achieve low mass resistance, high solubility of produced gases, easy separation of salts and impurities, and high reaction rate when used as a gasification medium [9,10]. In recent years, the supercritical water gasification (SCWG) of coal, a novel coal gasification technology, has received extensive attention and in-depth research due to its clean, efficient, and low-cost characteristics [11,12,13,14,15,16,17]. In the SCWG of coal, elements such as C, H, and O will be converted into gas-phase products, mainly existing in the form of H2 and CO2 [18]. Pollution elements such as N, S, P, and Hg are enriched in the form of inorganic salts in ash rather than being discharged into the atmospheric environment. CO2 naturally accumulates at high concentrations, and the cost of separation and capture is very low [15]. Taking a 1000 MW scale power generation unit as an example, the SCWG-based coal consumption rate can be reduced to 244.8 g/kW·h, and the power generation efficiency can reach 56.7%, which is significantly better than traditional coal-fired power generation [9]. The SCWG technology of coal is a breakthrough in the clean utilization of coal, and the research and industrial application of this promising technology are consistent with global sustainable development initiatives such as the United Nations’ Sustainable Development Goals [16].
Coal contains many organic components and a certain amount of mineral components [19], mainly oxides or salts of Si, Al, Ca, Fe, etc. During the coal conversion process, mineral components generally have important effects on the gasification/combustion of organic matter in coal [20]. To study the influence of mineral components on coal combustion, Song et al. [21] investigated demineralized brown coal loaded with Na+, Al3+, K+, Ca2+, Mn2+, and Fe3+ (corresponding to the inherent minerals in lignite) using thermogravimetric research under an air atmosphere. The results showed that Al3+ loading reduced the stability and reactivity of coal combustion, whereas other metal ions (especially Fe3+) could promote the combustion reaction. Ma et al. [22] showed that minerals in coal can promote organic matter gasification below coal ash’s deformation temperature under a CO2 atmosphere, and that anhydrite (CaSO4), oldhamite (CaS), hematite (Fe2O3), and magnetite (Fe3O4) are catalytically active mineral components. Bai et al. [23] found that iron oxides are coal’s only catalytic mineral matter for gasification at high temperatures (1100–1500 °C) with CO2. Wu et al. [24] discovered that CaO reacts with carbon to form CaC above approximately 1200 °C, and that magnetite is quickly reduced to Fe via carbon at 820–920 °C under a N2 atmosphere. Wang et al. [25] found that free CaO has a catalytic effect on coal char graphitization under an Ar atmosphere above 1600 °C, and the presence of silicate or aluminosilicate weakens CaO’s catalytic effect. Kuznetsov et al. [26] studied the conversion of calcium-based minerals in Kansk-Achinsk lignite; the results revealed that highly dispersed calcite-like surface species formed from coal’s aragonite-like species during the steam gasification process had catalytic activity on sp2-hybridized carbon atoms (68–71% of coal’s carbon content). CaCO3, Ca(CH3COO)2, and Ca(C6H5COO)2 were chosen by Ban et al. [27] as coal’s representative calcium structures to identify the calcium catalytic mechanism of steam gasification. They found that these three calcium species had almost the same catalytic effect, and that the calcium-catalyzed processes of steam gasification were accompanied by the decomposition of an in situ-formed CaCO3 analogue.
In view of minerals’ significant influence on the conversion of organic matter in coal, it is particularly necessary to grasp the laws and mechanisms of mineral components’ action on the conversion of organic matter. Based on the above reviews, the current study was primarily conducted under an air [21], CO2 [22,23], steam [26], and inert (N2/Ar) [24,25] atmospheres; relevant studies under a supercritical water (SCW) atmosphere have not yet been developed. In the SCWG of coal, the medium pressure (≥22.1 MPa) is much higher than it is in traditional coal conversion technologies. However, the reaction temperature is relatively low, and carbon gasification efficiency (CGE) greater than 95% can be achieved under mild conditions (below 750 °C) [11,28,29]. Obviously, SCWG’s operating conditions differ from those of other conversion technologies. It is well accepted that the conversion characteristics of organic matter and minerals in different atmospheres are obviously different [2,30,31,32].
Semi-coke is a solid product obtained via the low-temperature pyrolysis of bituminous coal. Compared with brown coal and bituminous coal, the volatile content of semi-coke is relatively low. In SCWG, using semi-coke as raw material can provide a better analysis of the influence of mineral components on gasification efficiency. Based on the SCWG of semi-coke (a solid product obtained via the low-temperature pyrolysis of bituminous coal), this study comprehensively assessed the effects of mineral components (SiO2, Al2O3, and CaO) on the gasification of organic matter. Mineral components with obvious inhibitory/promoting effects were screened out, and their action mechanisms were considered in depth. This study may not only provide theoretical basis for the selection and regulation of mineral components in coal during SCWG, but also provide technical support for the selection of designed coal types during the industrialization of SCWG technology.

2. Materials and Methods

2.1. Materials

The semi-coke used in this study was obtained from Yulin, Shaanxi, China. The ultimate analysis, proximate analysis, and the ash chemical compositions of semi-coke are summarized in Table 1. The ultimate analysis and proximate analysis of semi-coke were carried out in accordance with Chinese standards GB/T30733-2014 [33] and GB/T30732-2014 [34], respectively. The ash chemical compositions were determined using X-ray fluorescence (XRF), which is based on the Chinese standard GB/T37673-2019 [35]. As K2CO3 is the most effective catalyst for improving carbon gasification efficiency in SCWG for coal [11], this study also examined mineral components’ effect on organic matter gasification using a K2CO3 catalyst. K2CO3 and mineral chemical constituent additives (SiO2, Al2O3, and CaO) used in this study’s experiments were all analytical-grade powder reagents purchased from Sinopharm Group Chemical Reagent Co., Ltd., Shanghai, China.

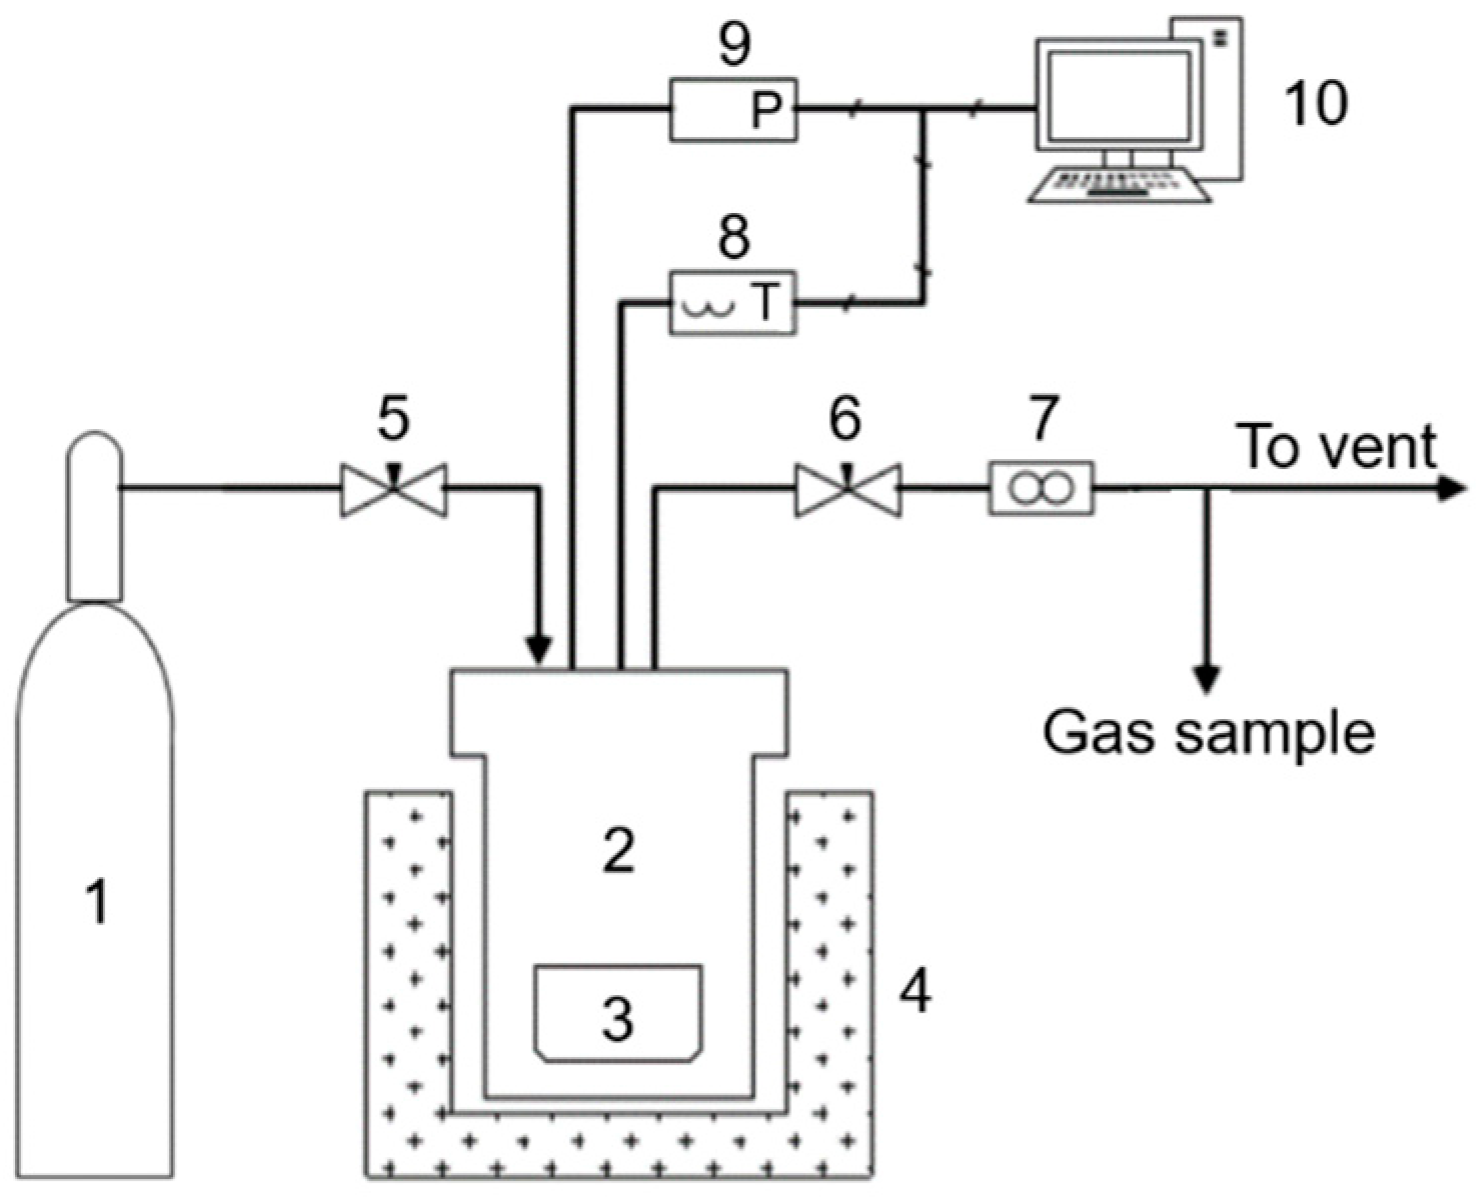
2.2. SCWG Experimental Setup

The SCWG experiment was conducted in a batch autoclave system, as shown in Figure 1. The autoclave was manufactured using Inconel 625 alloy with design parameters of 750 °C and 35 MPa [36]. The inner diameter and volume of the autoclave were 60 mm and 567 mL, respectively. The autoclave was equipped with a 25 mm high stainless-steel crucible with a 55 mm outer diameter and a 3 mm wall thickness, which was used to contain the reactant slurry. The autoclave was sealed using a flange; the flange cover was equipped with a pressure sensor for monitoring pressure and a K-type thermocouple for monitoring the medium temperature in the autoclave. Temperature and pressure signals were transmitted to the computer and displayed in real time. The furnace could be moved vertically up and down to ensure that the autoclave could be wrapped by it or detached from it.
During the experiment, 3 g of semi-coke powder (particle size less than 100 µm) and certain amounts of mineral chemical components were fully mixed in the stainless-steel crucible (the desired amount of K2CO3 was also added in cases of catalytic gasification); next, 30 g of deionized water was added to continue blending. The test conditions in this study are shown in Table 2. The crucible containing the well-mixed slurry was put into the autoclave, and the flange cover was assembled and tightened. High-purity Ar gas was used to purge the autoclave of air. Next, the furnace, which had been preheated to a certain temperature, was moved up to cover the autoclave. The fluid in the autoclave was heated to the reaction temperature (750 °C) and held for 20 min. During the reaction time, the pressure in the autoclave was maintained at 23–28 MPa. Lastly, the furnace was shut off and moved down to be separated from the autoclave; the autoclave was then immediately cooled using cold water. When the temperature in the autoclave dropped to room temperature, the outlet valve was opened and the produced gas flowed out of the autoclave into the wet gas flowmeter to measure its volume; during this process, some gas was collected to detect its composition. To ensure the accuracy of the experiment, three gas samples were collected for composition analysis, and the average value of the three samples is the final value. When the autoclave reached normal pressure, it was disassembled and the crucible was removed to collect the solid products, which were washed multiple times using deionized water to achieve a pH of 7, and then placed in the oven at 110 °C for 24 h. The dried solid products were used for subsequent characterization and analysis.

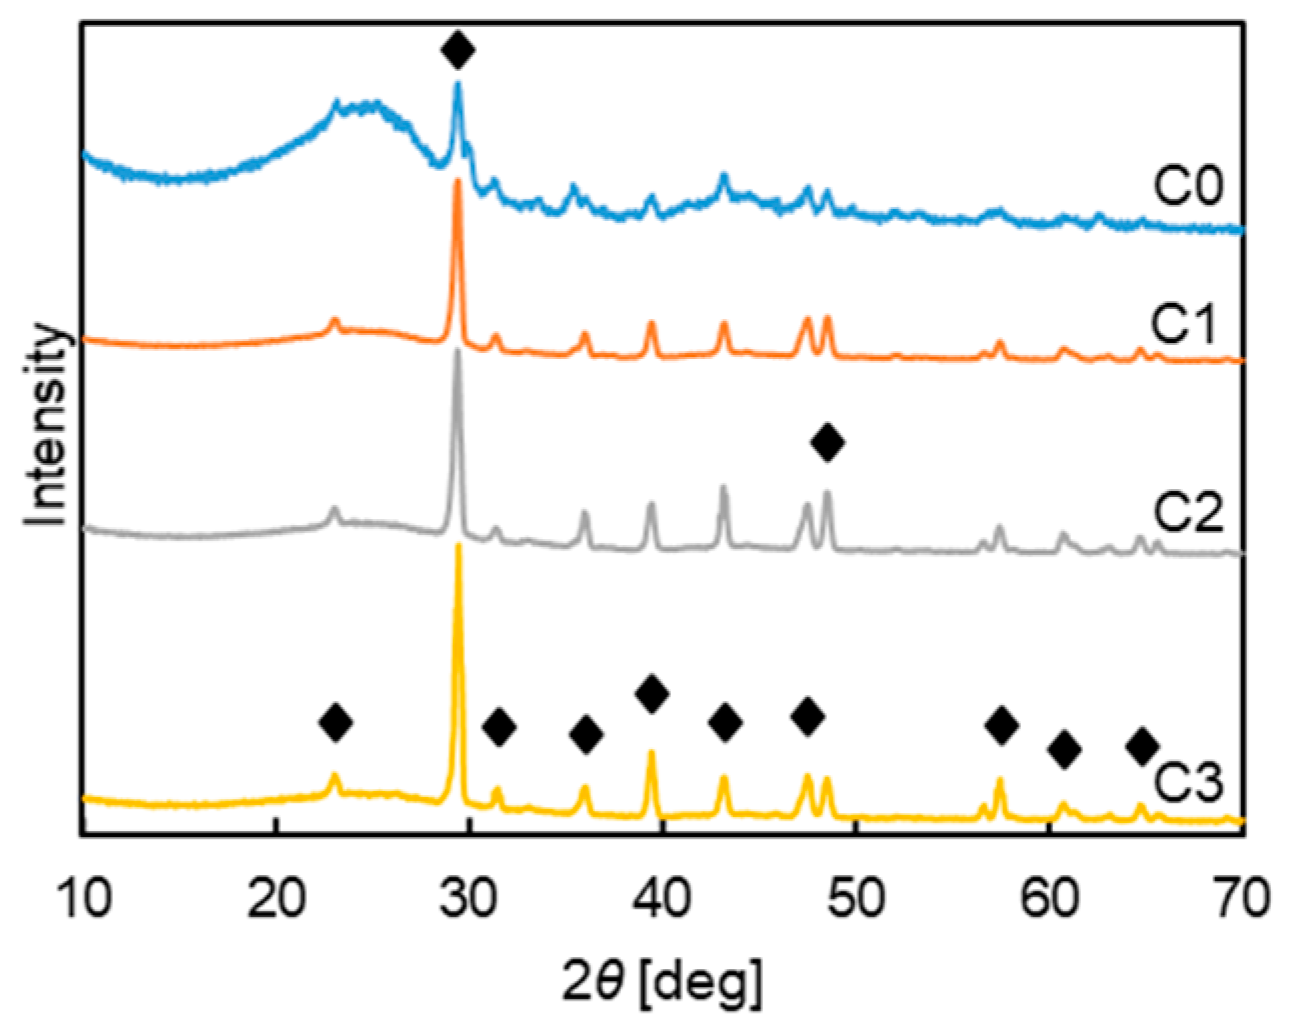
2.3. Characterization Analysis

Gas composition analysis was performed using the Agilent 7890 gas chromatograph equipped with a thermal conductivity detector (TCD) and a Plot C2000 capillary column (purchased from Lanzhou Institute of Chemical Physics, Lanzhou, China). Briefly, 0.4 mL of gas sample was injected into the gas chromatograph through a syringe in this study. High-purity argon (99.999%) with a flow rate of 5 mL/min was used for the carrier gas. The quantitative calculation is based on the standard gas mixture of H2, CO, CO2, and CH4. X-ray diffraction (XRD) patterns were obtained using X’pert MPD Pro from PANalytical using Ni-filtered CuKα radiation (λ = 0.15406 nm, 40 kV, 40 mA) and a scan rate of 2° min−1 in the 2θ range from 10 to 70°. A field-emission scanning electron microscope with energy-dispersive X-ray (SEM-EDX) (JEOL JSM-6700F, Tokyo, Japan) was used to obtain the microstructure and elemental mapping images of the solid samples.

2.4. Data Analysis

To analyze the effect of mineral components on the gasification of organic matter, several technical indicators (carbon gasification efficiency (CGE), gas yield, and gas molar fraction) were used to evaluate the organic matter gasification level. These indicators’ specific meanings are as follows [28]:
C G E = t h e   m a s s   o f   c a r b o n   i n   g a s e o u s   p r o d u c t t h e   m a s s   o f   c a r b o n   i n   f e e d s t o c k × 100 ,   %
G a s   y i e l d = t h e   m o l e   o f   g a s e o u s   p r o d u c t t h e   m a s s   o f   d r y   m a t t e r   i n   f e e d s t o c k × 100 ,   m o l · kg 1
G a s   m o l a r   f r a c t i o n = t h e   m o l e   o f   a   c e r t a i n   g a s   p r o d u c t t h e   s u m m a t i o n   o f   m o l a r   n u m b e r   o f   a l l   t h e   g a s e o u s   p r o d u c t s × 100 , %

3. Results and Discussion

3.1. Effect of Mineral Components without K2CO3

Figure 2 shows that, compared with the case of no minerals, the gas yield and the gas mole fraction did not obviously change after adding SiO2 or Al2O3, which indicated that SiO2 and Al2O3 minerals did not affect organic carbon gasification. However, CaO significantly promoted gasification; the gas yield improved from 26.79 to 36.29 mol/kg due to the addition of CaO. The addition of CaO also led to conspicuous changes in the proportions of H2 and CO2 in the produced gas. The molar fraction of H2 increased from 51.27% to 55.44%, and the molar fraction of CO2 decreased from 37.13% to 33.88%. The following discussion focuses on the CaO-promoting gasification mechanism.
On the one hand, adding CaO could absorb and solidify CO2 in situ. The specific reaction mechanism can be explained as follows. Based on data from the NIST-JANAF thermochemical tables [37], the phase transformation of CaO-Ca(OH)2 in a water environment can be obtained as shown in Figure 3, which demonstrates that added CaO existed in the form of Ca(OH)2 in this study’s SCW environment. Ca(OH)2 can react with the gas-phase product CO2 to generate stable CaCO3. XRD patterns of different CaO additions, displayed in Figure 4, prove that the addition of CaO led to calcite (CaCO3) formation. The steam-reforming reaction of fixed carbon in SCWG is an important source of CO2 and H2 in gas-phase products [38], as per the following equation:
C + 2 H 2 O C O 2 + 2 H 2
The adsorption of CO2 by Ca(OH)2 made the steam-reforming reaction move in the opposite direction. Therefore, more solid-phase carbon was gasified into gas-phase products, and more gas was generated. In summary, CaO’s main reactions during the SCWG process can be expressed as follows:
CaO + H 2 O Ca ( OH ) 2
Ca ( OH ) 2 + C O 2 CaC O 3 + H 2 O
The overall stoichiometric equation is as follows:
CaO + 2 H 2 O + C CaC O 3 + 2 H 2
As shown in Figure 2, compared with other cases, adding CaO resulted in a larger share of H2 and a smaller share of CO2, which was caused by the solidification effect of CaO. Figure 5 shows the gas product components of different CaO additions as the CaO loading increased, the molar fraction of H2 further increased and the molar fraction of CO2 further decreased. This further proves the CaO adsorption effect. From Figure 5, it can also be seen that with the increase in CaO addition, the gas yield does not increase significantly, and even slightly decreases at 30 wt% addition. This is also due to the solidification of CO2 in the gas into calcite.
On the other hand, the highly dispersed calcite obtained after absorbing CO2 had a catalytic effect on gasification. To explore calcite’s catalytic mechanism, the solid residue after gasification was characterized using SEM, as shown in Figure 6. Figure 6a shows that CaCO3 particles with a diameter of approximately 1~4 μm (illustrated as light-colored spheres) became attached to the surface of a char particle (illustrated as a dark-colored block) during the gasification process. Many pits the same size as the CaCO3 particles’ diameters formed on the char particles’ surface; some CaCO3 particles migrated into the carbon matrix in a perforated manner, such as CaCO3 particles in the yellow line area. The char particle shown in Figure 6b had many tunnel-like pore structures in its carbon matrix due to the continuous inward migration of CaCO3. The pore structures intersected with each other and even caused the carbon matrix to be destroyed; this revealed that CaCO3 had a catalytic effect on the gasification of solid-phase carbon, and that the gasification reaction of solid-phase carbon mainly occurred on the contact surface between CaCO3 and char particles. Yu et al. found a similar phenomenon when studying calcium catalytic char gasification in a steam atmosphere [39], and believed that highly dispersed calcium helped prevent the formation of aromatic ring structures and improved the disorder of carbon.

3.2. Effect of Mineral Components with K2CO3

Figure 7 shows that the effect of minerals on gasification under K2CO3 catalysis was obviously different from their effect without K2CO3. Compared with the case of no catalyst (as shown in Figure 2), the addition of K2CO3 catalyst significantly improves the gas yield because K2CO3 can promote the steam-reforming reaction and water–gas shift reaction in the process of SCWG [28]. Under K2CO3 catalysis, SiO2 and CaO had inhibitory effects on gasification, whereas Al2O3 had an accelerating effect. CaO addition caused the H2 mole fraction to increase from 55.75% to 57.96%, and the CO2 mole fraction to decrease from 33.00% to 31.21%. Compared with the case of non-catalytic gasification (as shown in Figure 2), the effect of CaO on the gas composition in the case of K2CO3 catalytic gasification was no longer significant. This can be explained as follows: after adding K2CO3, the K2CO3 catalyzing solid-phase carbon steam-reforming reaction became the dominant reaction in the gasification process. This process produced large amounts of CO2 and H2, which led to the weakening of Equation (7) on the proportion of gas-phase products. Given that SiO2, Al2O3, and CaO all had significant effects on gasification, the following discussion focuses on the analysis of these three minerals’ action mechanisms.

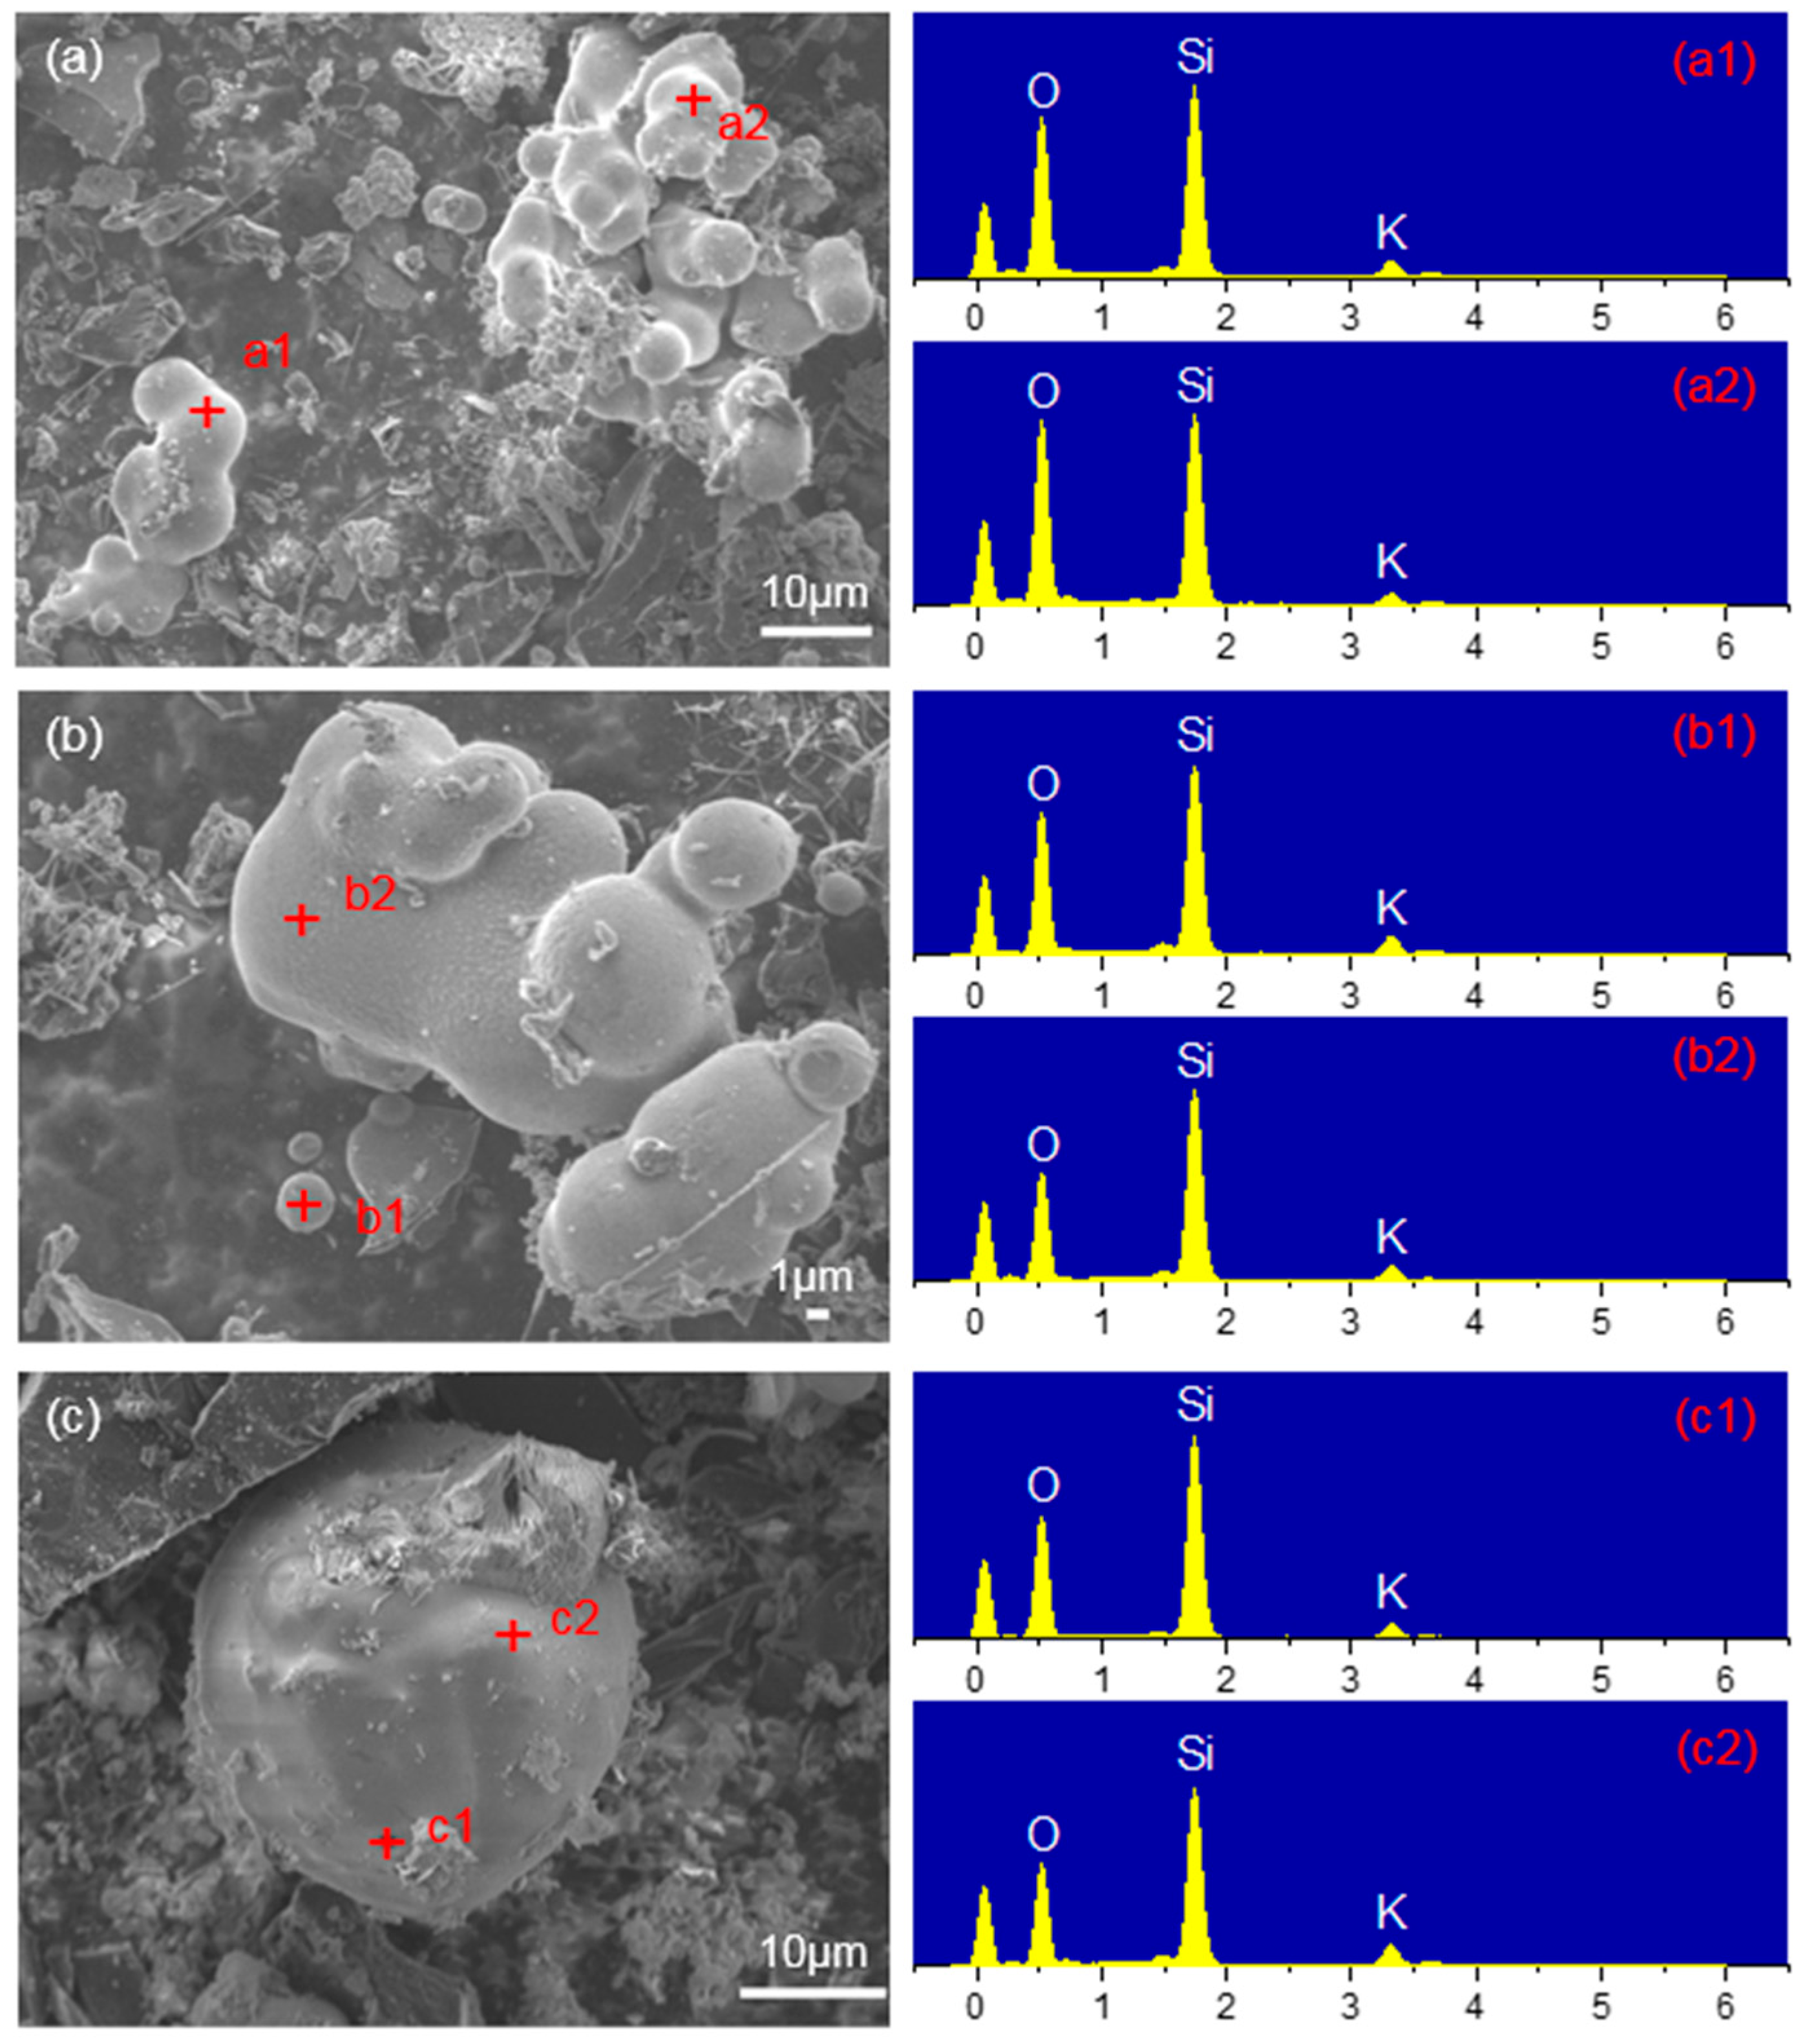
3.2.1. Mechanism Analysis of SiO2 Inhibiting Gasification

Figure 8a shows gas yields and CGEs at different SiO2 additions; as the SiO2 loading increased, the gas yield gradually decreased, and the CGE reduced from 89.50% to 77.92%. The XRD patterns in Figure 8b show that wollastonite (CaSiO3) peaks appeared after adding SiO2, which might have been due to the reaction between SiO2 and calcite (the mineral component of semi-coke) during the gasification process. In addition, as the amount of SiO2 added increased, the minerals’ crystal peaks were no longer significant, which indicates that some minerals might have melted and become amorphous. It can be seen from the SEM photos in Figure 9 that obvious melting agglomeration occurred in the minerals, and multiple small mineral particles agglomerated into new large mineral particles. These molten mineral particles had a dense surface. In the case of only loading the K2CO3 catalyst, the powerful catalytic capacity of K2CO3 increased the CGE to as much as approximately 90%. In such an environment, the larger carbon skeleton in the semi-coke particles was fully disintegrated, which made the solid organic matter particles smaller. At such a high CGE, the number of mineral particles was equivalent to that of small carbon particles, or even higher. In such a case, the molten mineral particles might encapsulate some small carbon particles. Carbon particles wrapped in dense minerals have difficulty in contact with SCW and K2CO3, which hinders the further gasification of solid carbon. The EDX scan showed that the sintered mineral was potassium silicate, which indicates that SiO2’s presence can cause partial K2CO3 deactivation and the formation of low-melting-point minerals. In summary, in the case of K2CO3-catalyzed gasification, the inhibiting mechanism of SiO2 was mainly manifested in two aspects: the formation of low-melting-point minerals and partial K2CO3 deactivation.

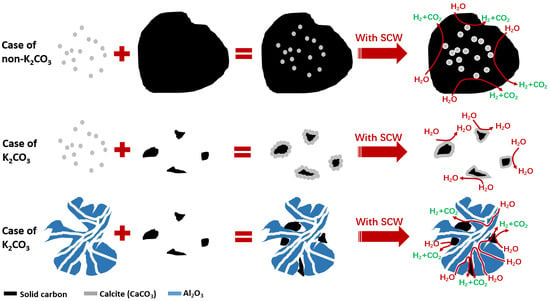
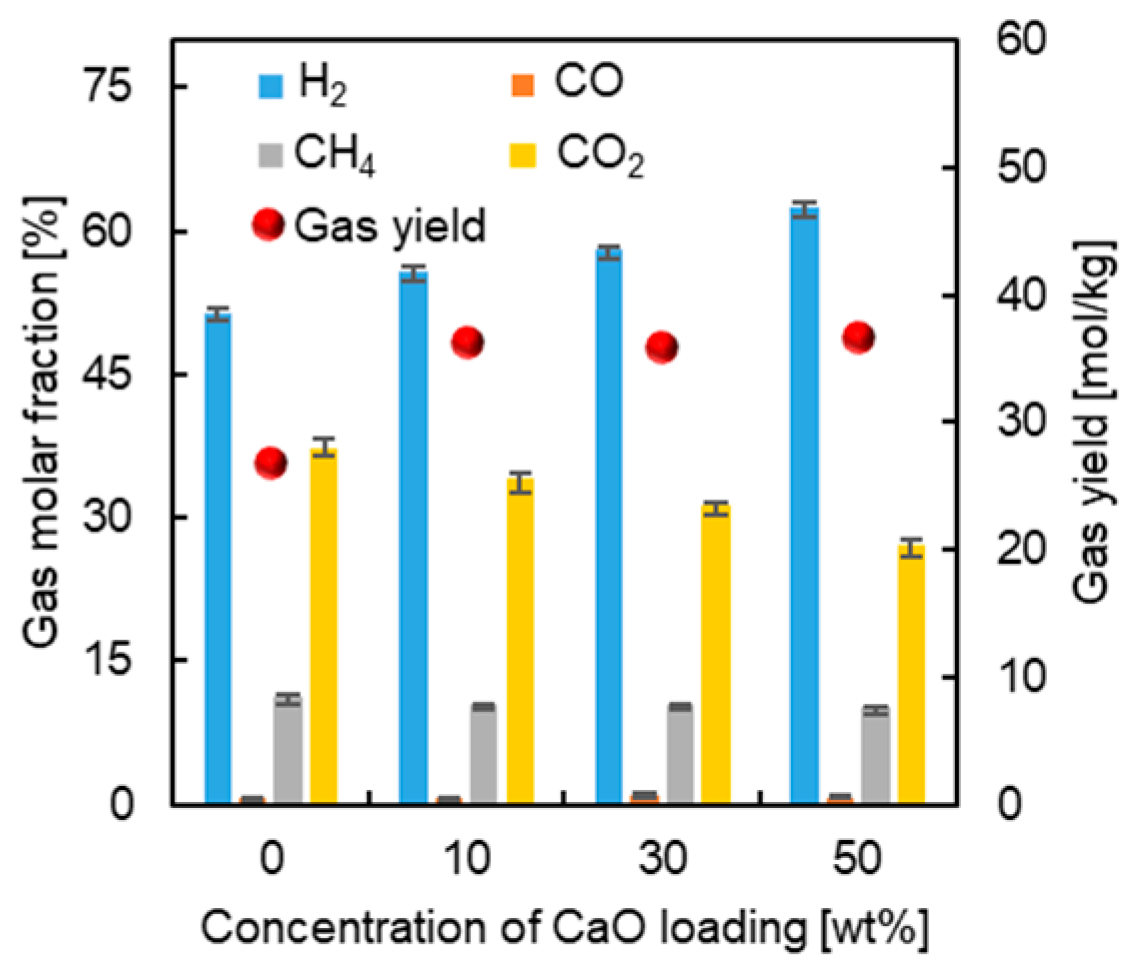
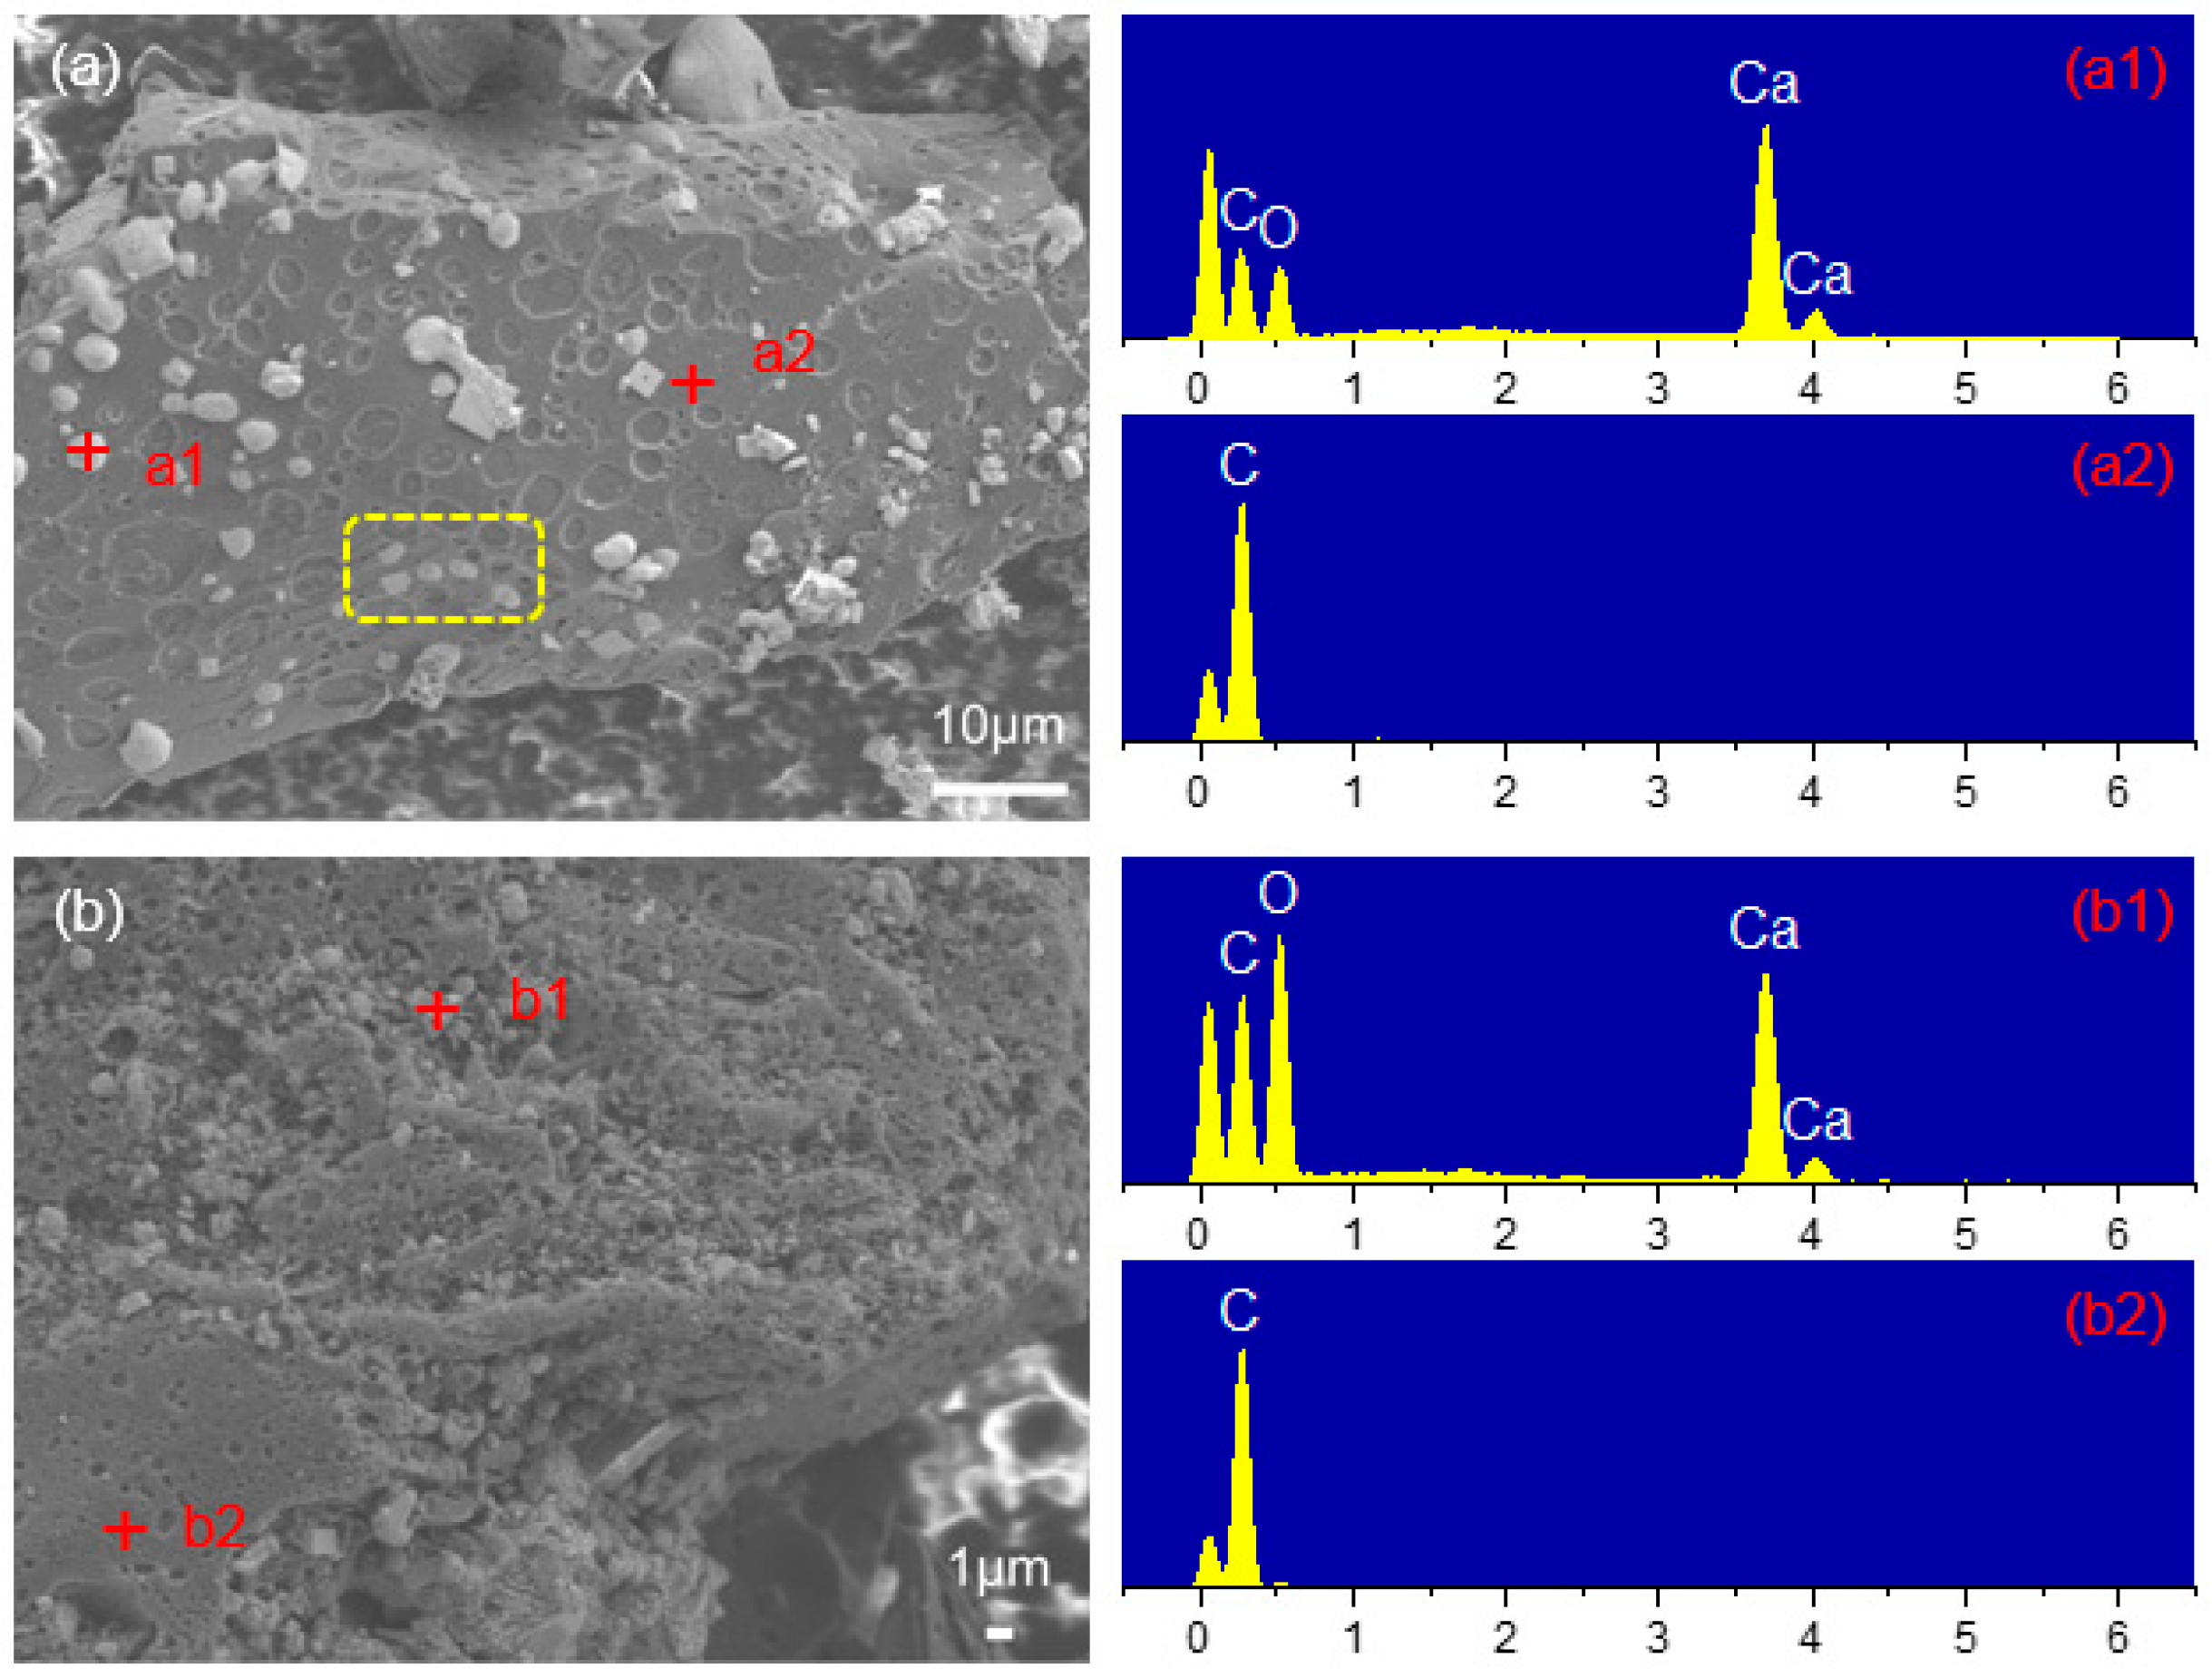
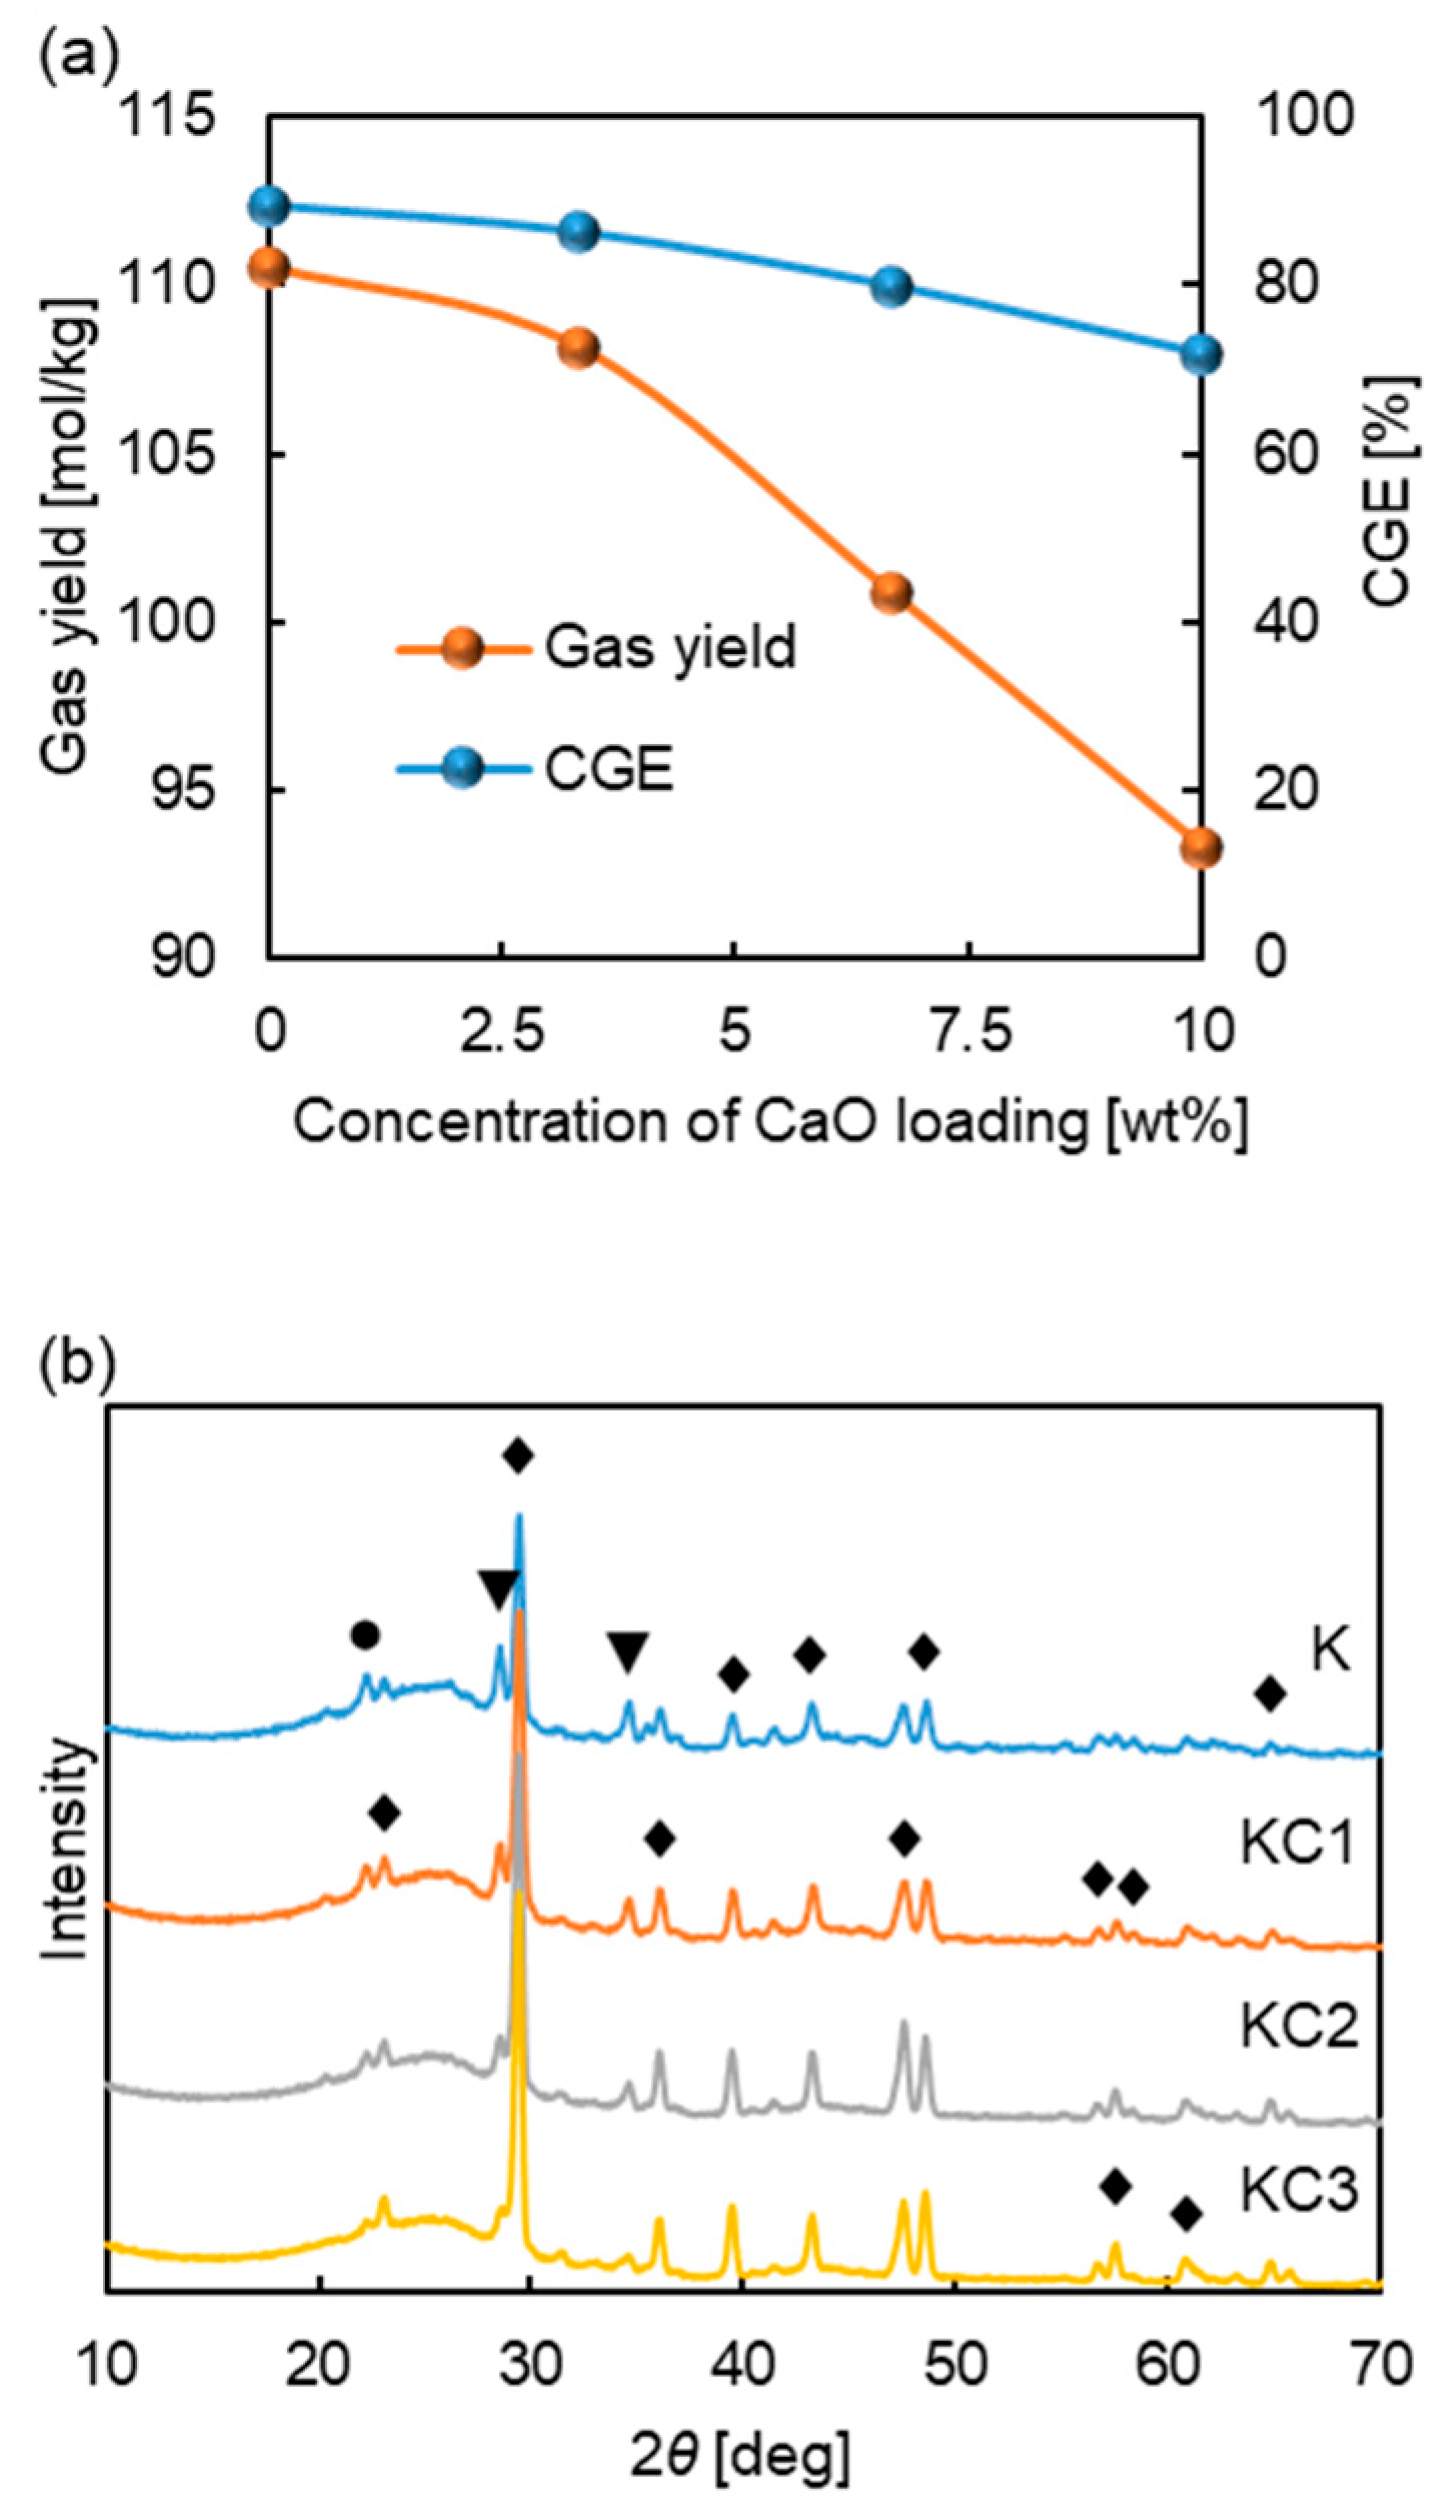
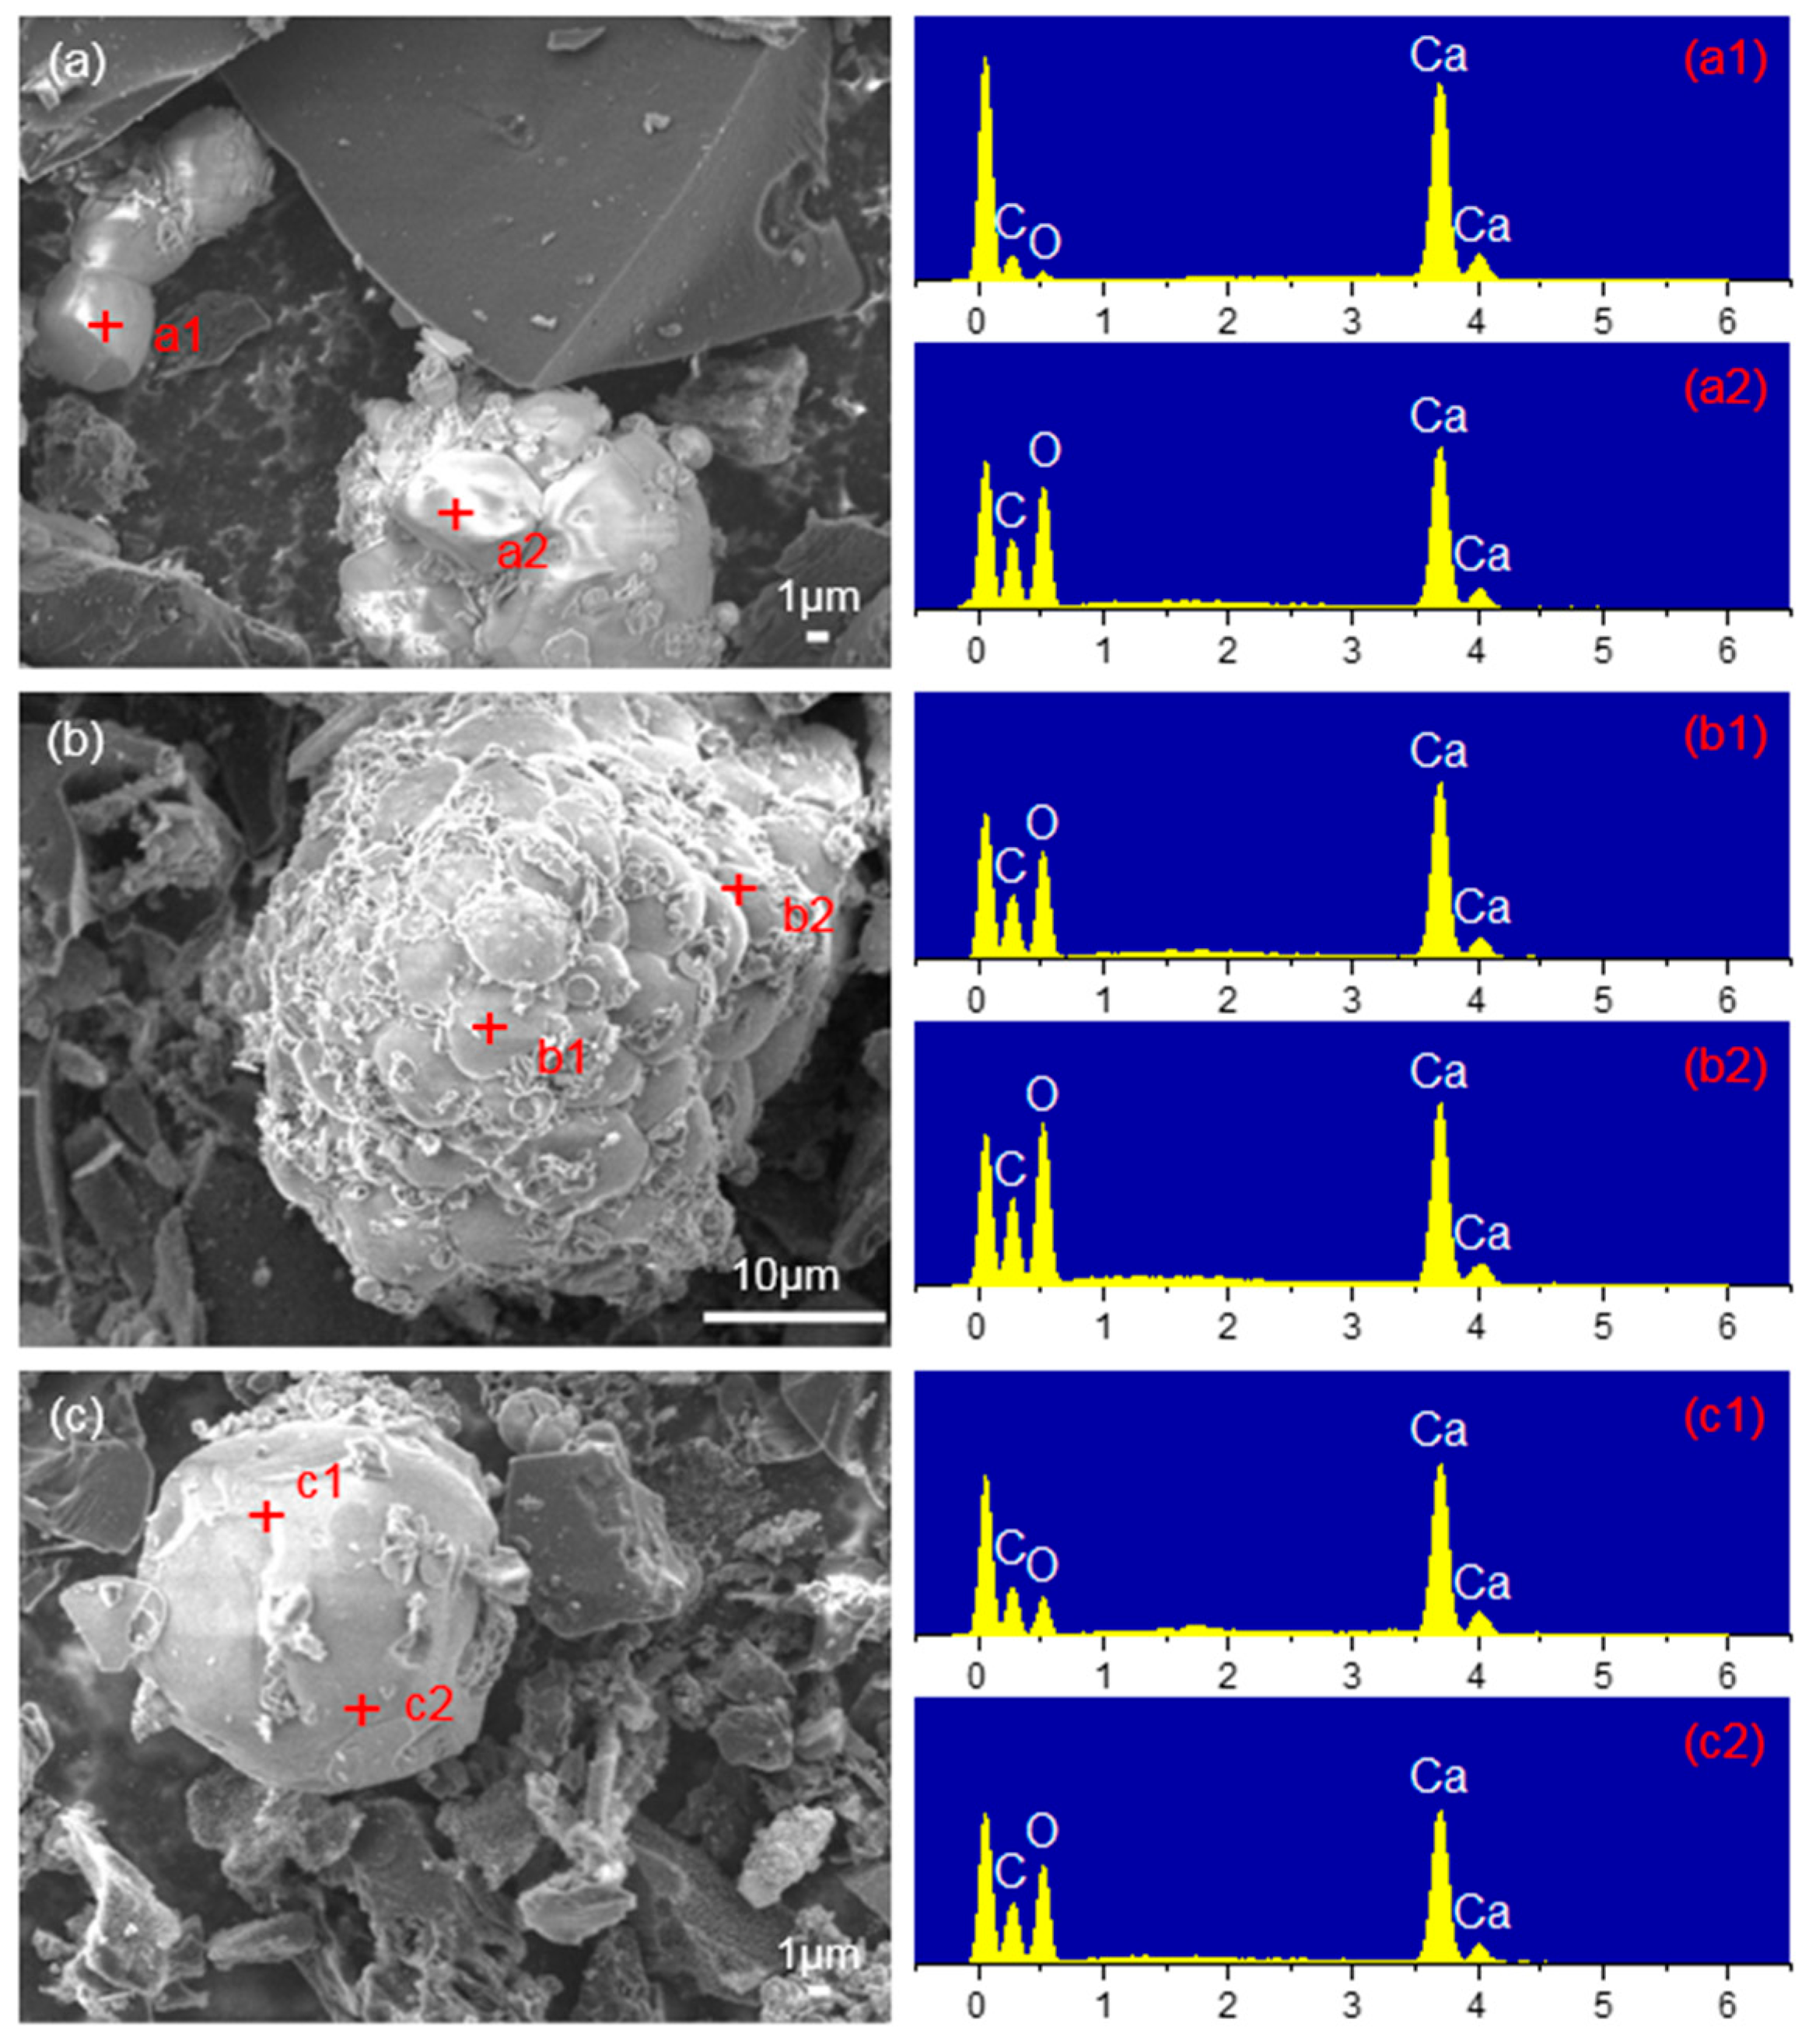
3.2.2. Mechanism Analysis of CaO Inhibiting Gasification

As CaO displayed a completely different effect with and without K2CO3, the gasification conditions under different calcium oxide additions were investigated to further verify the results’ reliability. As shown in Figure 10a, the gas yield and CGE gradually decreased as the CaO loading increased, indicating that CaO’s presence did indeed inhibit the catalytic gasification of K2CO3. Figure 10b’s XRD patterns show that as the amount of CaO added increased, more calcite (CaCO3) crystals were formed in the solid-phase product. SEM images in Figure 11 show that the calcite morphology significantly changed; calcite was no longer dispersed on the surface of the carbon matrix but was sintered and agglomerated between particles. This might have been because when the large carbon matrix was destroyed by K2CO3 catalytic gasification, the calcite lost its attachment position and the probability of direct contact between calcite particles increased. Calcite is a low-melting-point mineral and prone to agglomeration under the current SCWG environment. The particle size of agglomerated calcite particles was larger than 10 μm (as displayed in Figure 11b,c), and the large-particle calcite formed after agglomeration also had a dense surface. This phenomenon is similar to the melting and agglomeration of potassium silicate under the case of SiO2 addition, which easily wraps some small residual carbon particles and hinders the gasification reaction progress. In addition, sintered calcite no longer had a catalytic effect.
When studying the steam gasification of coal char, Jiang et al. [40] believed that the addition of calcium species (Ca(OH)2, Ca(CH3COO)2, or CaCO3) would produce a synergistic effect with K2CO3 and improve the CGE due to the inhibiting deactivation of K2CO3 caused by calcium species. The XRD pattern in Figure 10b shows that as the amount of CaO added increased, the amount of KAlSiO4 (no catalytic activity, obtained via the reaction of mineral components in semi-coke with K2CO3 catalyst) gradually decreased. This indicated that CaO indeed inhibits K2CO3 inactivation. However, the gas yield and CGE results (as shown in Figure 11a) confirmed that in the current study, gasification inhibition caused by calcite sintering and agglomeration played a major role, rather than the promotion of gasification caused by inhibiting K2CO3 inactivation. Arnold et al. [41] also showed that when the CGE was high, the ash’s fusion state had a significant effect on solid carbon gasification, and the catalytic gasification of K2CO3 was suppressed due to CaCO3 sintering.

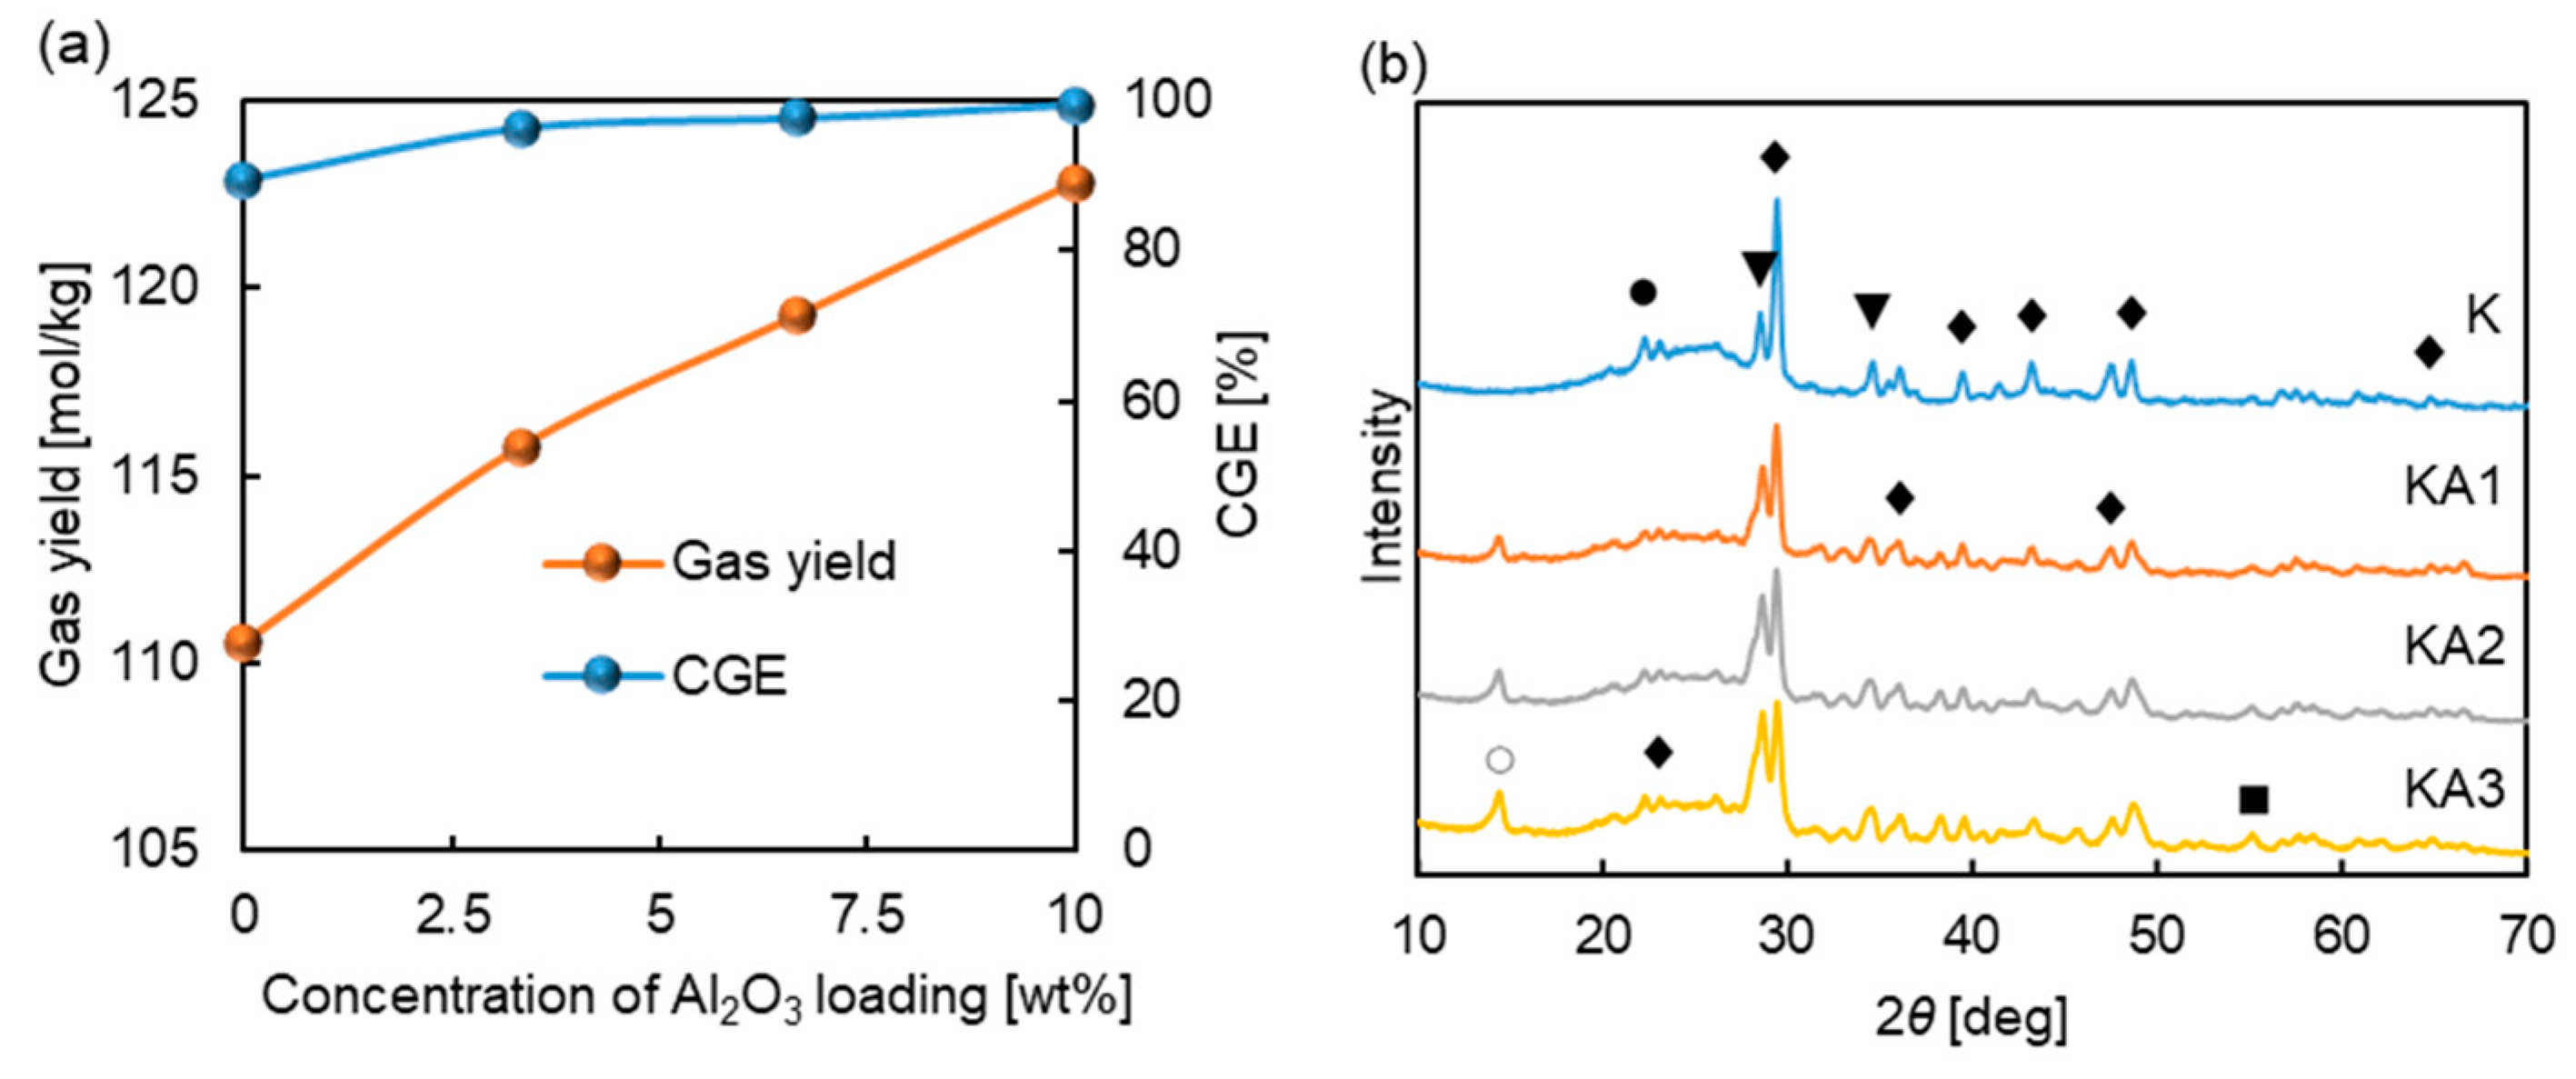
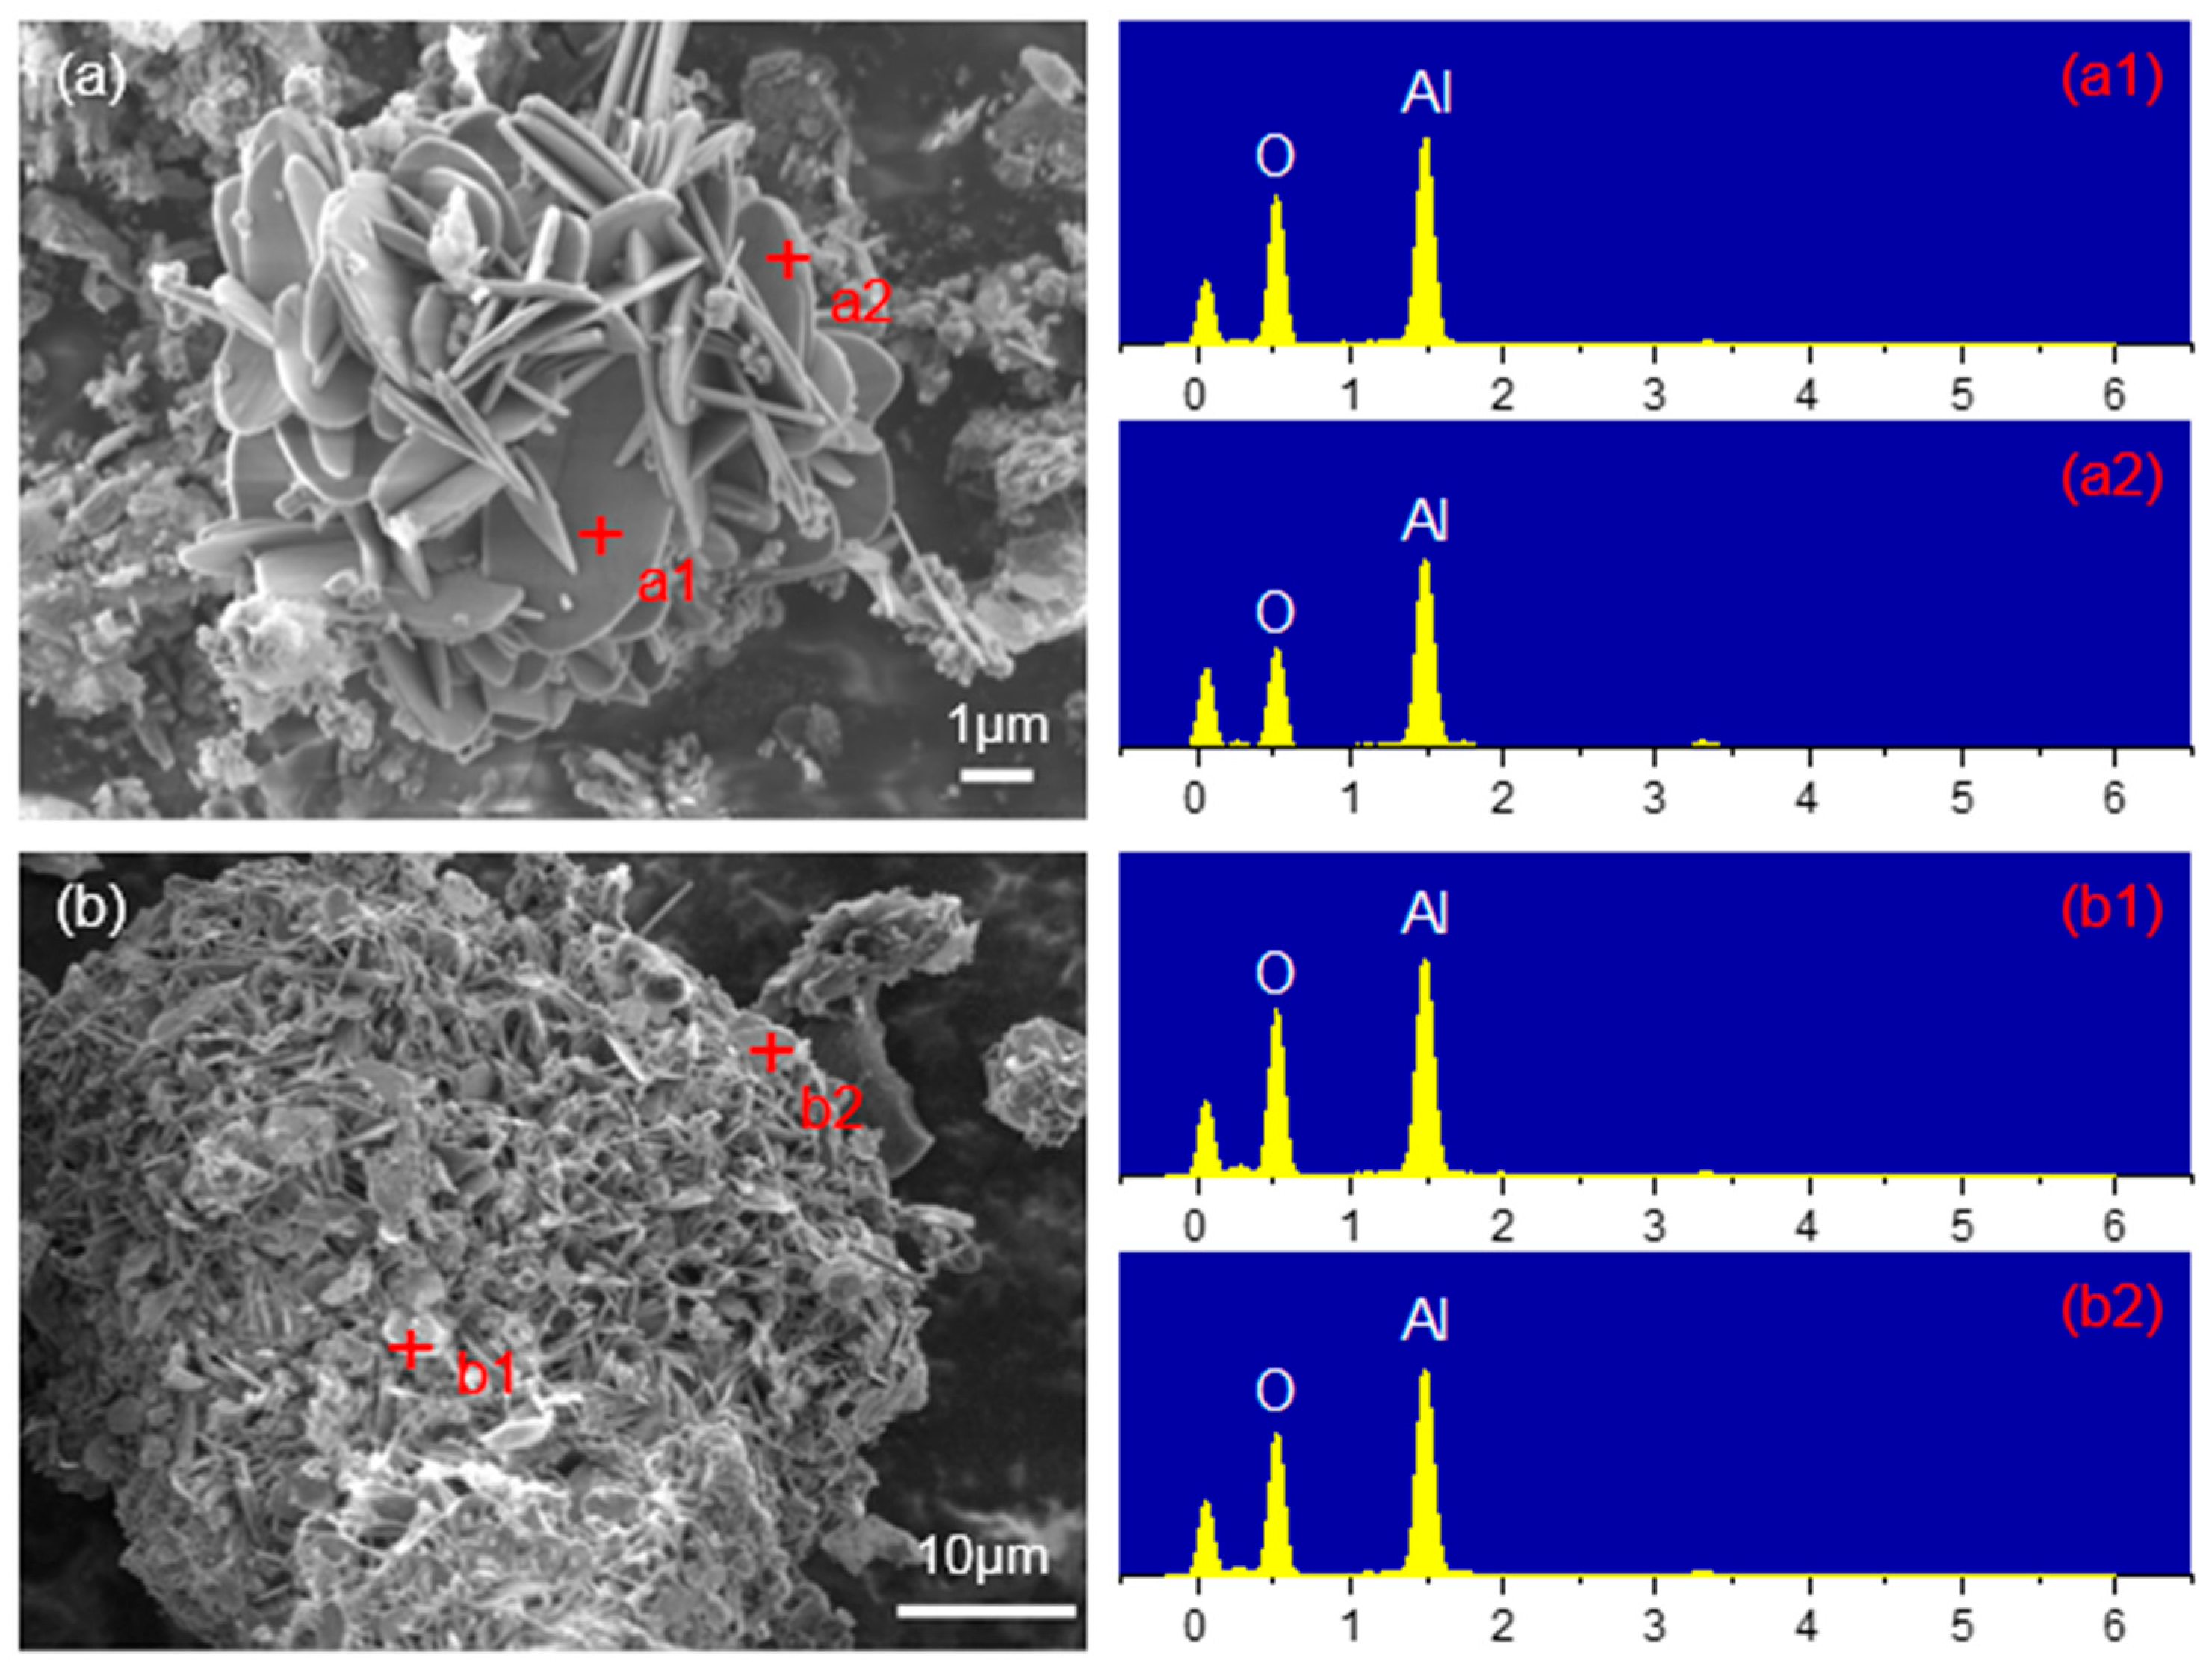
3.2.3. Analysis of the Mechanism of Al2O3 Promoting Gasification

The results under the case of no K2CO3 indicated that Al2O3 had no catalytic effect. However, Al2O3 shows a promotion effect during the K2CO3 catalytic gasification process; appropriately increasing the amount of Al2O3 added was conducive to the complete gasification of semi-coke (as shown in Figure 12a); the CGE reached 99.38% with 10 wt% Al2O3. The presence of K2CO3 helped form low-temperature eutectics [42,43,44], which caused a part of fine carbon particles to be wrapped by molten minerals and these could not be completely gasified. The addition of Al2O3 contributed to the formation of high-melting-point minerals. The XRD patterns in Figure 12b show that the content of high-melting-point minerals (such as Al2O3 and AlO(OH)) in the solid-phase product increased as the amount of Al2O3 added increased. The SEM image in Figure 13a shows that Al2O3 took the form of nano-thickness flakes in the SCWG atmosphere, and that many alumina flakes were messily stacked together. Even though many alumina flakes were in direct contact with each other (as shown in Figure 13b), they were not melted and agglomerated, but were stacked loosely, forming plenty of diffusion channels. The presence of high-melting-point minerals can make solid-phase products better dispersed, which allows incompletely gasified residual carbon particles to be fully exposed to SCW rich in the K2CO3 catalyst. This promotes contact between the reactants (H2O and solid carbon) and the catalyst (K2CO3) during the gasification process and the timely release of gas-phase products from the solid surface. This study’s results are evidence that the proper addition of high-melting-point minerals to prevent the agglomeration of slags is an effective way to promote the complete gasification of organic matter in coal under high-CGE conditions.

4. Conclusions

This study comprehensively investigated the effects of mineral components (SiO2, Al2O3, and CaO) on the SCWG of organic matter in semi-coke. In the case of non-catalytic gasification, SiO2 and Al2O3 had almost no effect on the gasification reaction progress. However, CaO promoted gasification due to CaO’s solidification effect and the catalytic effect of highly dispersed calcite produced by CaO with CO2. In the case of K2CO3 catalysis, both SiO2 and CaO inhibited gasification; these two minerals promoted the agglomeration of minerals and inhibited the contact of supercritical water with solid-phase carbon. Additionally, SiO2 could cause some K2CO3 inactivation. Al2O3 maintained fluffy and porous structures owing to its high melting point; this made it possible to promote the contact of fine residual carbon with K2CO3 and SCW when the CGE was high, which contributed to the complete gasification of solid-phase carbon. This study shows that the complete gasification of solid-phase carbon can be achieved by properly adjusting the mineral components in coal.
In the future, the influence of mineral components on CGE in supercritical water fluidized bed reactor (SCWFBR) will be further explored. The SCWFBR has excellent heat and mass transfer characteristics, which can achieve continuous and efficient gasification of high-concentration coal slurry, demonstrating good industrial prospects. The coupling matching of velocity field, temperature field, and reaction field in a SCWFBR is a great challenge, which is also the focus of subsequent research.

Author Contributions

Conceptualization, P.S., H.J. and Z.C.; methodology, P.S. and H.J.; formal analysis, P.S., Z.L. and C.S.; investigation, P.S., Z.L. and C.S.; data curation, P.S., Z.L. and C.S.; writing—original draft, P.S., Z.L. and C.S.; writing—review and editing, P.S., H.J., L.H., T.R. and Z.C.; visualization, Z.L. and C.S.; supervision, P.S. and Z.C.; funding acquisition, P.S., T.R. and Z.C. All authors have read and agreed to the published version of the manuscript.

Funding

This research was funded by the Basic Science Center Program for Ordered Energy Conversion of the National Natural Science Foundation of China, grant number 51888103, the Tianshan Talent Training Plan, grant number 2022TSYCJC0031, the Natural Science Basic Research Program of Shaanxi Province, grant numbers 2022JQ-539 and 2022JQ-465, and the Youth Innovation Team of Shaanxi Universities (2023).

Data Availability Statement

Data is contained within the article.

Acknowledgments

We thank Wei, Wenwen at State Key Laboratory of Multiphase Flow in Power Engineering, Xi’an Jiaotong University for helping on the ultimate analysis and the proximate analysis. We also thank Ma, Lijing at State Key Laboratory of Multiphase Flow in Power Engineering, Xi’an Jiaotong University for helping on XRF and XRD characterization. In addition, we also greatly appreciate the guidance provided by Guo, Penghui at State Key Laboratory of Multiphase Flow in Power Engineering, Xi’an Jiaotong University during the SEM-EDX characterization process.

Conflicts of Interest

Author Zening Cheng was employed by the Xinjiang Tianchi Energy Co., Ltd. The remaining authors declare that the research was conducted in the absence of any commercial or financial relationships that could be construed as a potential conflict of interest.

References

  1. Krishnamoorthy, V.; Pisupati, S.V. A Critical Review of Mineral Matter Related Issues during Gasification of Coal in Fixed, Fluidized, and Entrained Flow Gasifiers. Energies 2015, 8, 10430–10463. [Google Scholar] [CrossRef]
  2. Liu, S.; Qi, C.; Jiang, Z.; Zhang, Y.; Niu, M.; Li, Y.; Dai, S.; Finkelman, R.B. Mineralogy and geochemistry of ash and slag from coal gasification in China: A review. Int. Geol. Rev. 2017, 60, 717–735. [Google Scholar] [CrossRef]
  3. Cao, X.; Kong, L.; Bai, J.; Ge, Z.; He, C.; Li, H.; Bai, Z.; Li, W. Effect of water vapor on coal ash slag viscosity under gasification condition. Fuel 2019, 237, 18–27. [Google Scholar] [CrossRef]
  4. Beér, J.M. Combustion technology developments in power generation in response to environmental challenges. Prog. Energy Combust. Sci. 2000, 26, 301–327. [Google Scholar] [CrossRef]
  5. Chiesa, P.; Consonni, S.; Kreutz, T.; Williams, R. Co-production of hydrogen, electricity and CO2 from coal with commercially readytechnology. PartA—Performance and emissions. Int. J. Hydrogen Energy 2005, 30, 747–767. [Google Scholar] [CrossRef]
  6. Savage, P.E.; Gopalan, S.; Mizan, T.I.; Martino, C.J.; Brock, E.E. Reactions at Supercritical Conditions: Applications and Fundamentals. AIChE J. 1995, 41, 1723–1778. [Google Scholar] [CrossRef]
  7. Kalinichev, A.G.; Heinzinger, K. Molecular dynamics of supercritical water—A computer simulation of vibrational spectra with the flexible BJH potential. Geochim. Cosmochim. Acta 1994, 59, 641–650. [Google Scholar] [CrossRef]
  8. Hoffmann, M.M.; Conradi, M.S. Are There Hydrogen Bonds in Supercritical Water? J. Am. Chem. Soc. 1997, 119, 3811–3817. [Google Scholar] [CrossRef]
  9. Guo, L.; Ou, Z.; Liu, Y.; Ge, Z.; Jin, H.; Ou, G.; Song, M.; Jiao, Z.; Jing, W. Technological innovations on direct carbon mitigation by ordered energy conversion and full resource utilization. Carbon. Neutrality 2022, 1, 4. [Google Scholar] [CrossRef]
  10. Khandelwal, K.; Nanda, S.; Boahene, P.; Dalai, A.K. Hydrogen production from supercritical water gasification of canola residues. Int. J. Hydrogen Energy 2024, 49, 1518–1527. [Google Scholar] [CrossRef]
  11. Ge, Z.; Jin, H.; Guo, L. Hydrogen production by catalytic gasification of coal in supercritical water with alkaline catalysts: Explore the way to complete gasification of coal. Int. J. Hydrogen Energy 2014, 39, 19583–19592. [Google Scholar] [CrossRef]
  12. Qu, X.; Zhou, X.; Yan, X.; Zhang, R.; Bi, J. Behavior of Alkaline-Metal Catalysts in Supercritical Water Gasification of Lignite. Chem. Eng. Technol. 2018, 41, 1682–1689. [Google Scholar] [CrossRef]
  13. Mu, R.; Liu, M.; Zhang, P.; Yan, J. System design and thermo-economic analysis of a new coal power generation system based on supercritical water gasification with full CO2 capture. Energy 2023, 285, 129384. [Google Scholar] [CrossRef]
  14. Wang, S.; Xie, R.; Liu, J.; Zhao, P.; Liu, H.; Wang, X. Numerical Analysis of the Temperature Characteristics of a Coal—Supercritical Water-Fluidized Bed Reactor for Hydrogen Production. Machines 2023, 11, 546. [Google Scholar] [CrossRef]
  15. Tian, Y.; Feng, H.; Zhang, Y.; Li, Q.; Liu, D. New insight into Allam cycle combined with coal gasification in supercritical water. Energy Convers. Manag. 2023, 292, 117432. [Google Scholar] [CrossRef]
  16. Li, J.; Liu, C.; Han, W.; Xue, X.; Ma, W.; Jin, H. Efficient coal-based power generation via optimized supercritical water gasification with chemical recuperation. Appl. Therm. Eng. 2024, 238, 122164. [Google Scholar] [CrossRef]
  17. Mu, R.; Liu, M.; Yan, J. Advanced exergy analysis on supercritical water gasification of coal compared with conventional O2-H2O and chemical looping coal gasification. Fuel Process. Technol. 2023, 245, 107742. [Google Scholar] [CrossRef]
  18. Zhao, P.; Liu, H.; Xie, X.; Wang, S.; Liu, J.; Wang, X.; Xie, R.; Zuo, S. Efficient Surrogate-Assisted Parameter Analysis for Coal-Supercritical Water Fluidized Bed Reactor with Adaptive Sampling. Machines 2023, 11, 295. [Google Scholar] [CrossRef]
  19. Ward, C.R. Analysis, origin and significance of mineral matter in coal: An updated review. Int. J. Coal Geol. 2016, 165, 1–27. [Google Scholar] [CrossRef]
  20. Gong, X.; Zhang, S. Changes in char structure due to inorganic matters during anthracite pyrolysis. J. Anal. Appl. Pyrolysis 2017, 127, 170–175. [Google Scholar] [CrossRef]
  21. Song, Y.; Feng, W.; Li, N.; Li, Y.; Zhi, K.; Teng, Y.; He, R.; Zhou, H.; Liu, Q. Effects of demineralization on the structure and combustion properties of Shengli lignite. Fuel 2016, 183, 659–667. [Google Scholar] [CrossRef]
  22. Ma, Z.; Bai, J.; Bai, Z.; Kong, L.; Guo, Z.; Yan, J.; Li, W. Mineral Transformation in Char and Its Effect on Coal Char Gasification Reactivity at High Temperatures, Part 2: Char Gasification. Energy Fuels 2014, 28, 1846–1853. [Google Scholar] [CrossRef]
  23. Bai, J.; Li, W.; Li, C.-z.; Bai, Z.; Li, B. Influences of minerals transformation on the reactivity of high temperature char gasification. Fuel Process. Technol. 2010, 91, 404–409. [Google Scholar] [CrossRef]
  24. Wu, S.; Zhang, X.; Gu, J.; Wu, Y.; Gao, J. Interactions between Carbon and Metal Oxides and Their Effects on the Carbon_CO2 Reactivity at High Temperatures. Energy Fuels 2007, 21, 1827–1831. [Google Scholar] [CrossRef]
  25. Wang, J.; Morishita, K.; Takarada, T. High-Temperature Interactions between Coal Char and Mixtures of calcium Oxide, Quartz, and Kaolinite. Energy Fuels 2001, 15, 1145–1152. [Google Scholar] [CrossRef]
  26. Kuznetsov, P.N.; Kuznetsova, L.I.; Mikhlin, Y.L. Chemical Composition of Surface Species in Pyrolyzed Brown Coals and Their Evolution during the Steam Gasification Reaction. Energy Fuels 2019, 33, 1892–1900. [Google Scholar] [CrossRef]
  27. Ban, Y.; Liu, Q.; Zhou, H.; Li, N.; Zhao, B.; Shi, S.; He, R.; Zhi, K. Catalytic effect of representative calcium salts on the steam gasification of a Shengli lignite. Fuel 2019, 255, 115832. [Google Scholar] [CrossRef]
  28. Cheng, Z.; Jin, H.; Liu, S.; Guo, L.; Xu, J.; Su, D. Hydrogen production by semicoke gasification with a supercritical water fluidized bed reactor. Int. J. Hydrogen Energy 2016, 41, 16055–16063. [Google Scholar] [CrossRef]
  29. Jin, H.; Chen, Y.; Ge, Z.; Liu, S.; Ren, C.; Guo, L. Hydrogen production by Zhundong coal gasification in supercritical water. Int. J. Hydrogen Energy 2015, 40, 16096–16103. [Google Scholar] [CrossRef]
  30. Shen, Z.; Zhang, L.; Liang, Q.; Xu, J.; Lin, K.; Liu, H. In situ experimental and modeling study on coal char combustion for coarse particle with effect of gasification in air (O2/N2) and O2/CO2 atmospheres. Fuel 2018, 233, 177–187. [Google Scholar] [CrossRef]
  31. Liu, Y.; Guan, Y.-J.; Zhang, K. Gasification reactivity and morphology of coal chars formed in N2 and CO2 atmospheres. Chem. Pap. 2018, 72, 2045–2054. [Google Scholar] [CrossRef]
  32. Du, Y.; Wang, C.A.; Xin, H.; Che, D.; Mathews, J.P. Competitive or additive behavior for H2O and CO2 gasification of coal char? Exploration via simplistic atomistic simulation. Carbon 2019, 141, 226–237. [Google Scholar] [CrossRef]
  33. GB/T30733-2014; Determination of Total Carbon, Hydrogen and Nitrogen Content in Coal-Instrumental Method. Standardization Administration of the P.R.C.: Beijing, China, 2014.
  34. GB/T30732-2014; Proximate Analysis of Coal-Instrumental Method. Standardization Administration of the P.R.C.: Beijing, China, 2014.
  35. GB/T37673-2019; Determination of Silicon, Aluminum, Iron, Calcium, Magnesium, Sodium, Potassium, Phosphorus, Titanium, Manganese, Strontium and Barium in Coal Ash—X-ray Fluorescence Spectrometric Method. Administration of the P.R.C.: Beijing, China, 2019.
  36. Liu, S.; Jin, H.; Wei, W.; Guo, L. Gasification of indole in supercritical water Nitrogen transformation mechanisms and kinetics. Int. J. Hydrogen Energy 2016, 41, 15985–15997. [Google Scholar] [CrossRef]
  37. Chase, M.W. NIST-JANAF thermochemical tables. J. Phys. Chem. Ref. Data 1998, 9, 703–736. [Google Scholar]
  38. Su, X.; Guo, L.; Jin, H. Mathematical Modeling for Coal Gasification Kinetics in Supercritical Water. Energy Fuels 2016, 30, 9028–9035. [Google Scholar] [CrossRef]
  39. Yu, G.; Yu, D.; Liu, F.; Yu, X.; Han, J.; Wu, J.; Xu, M. Different catalytic action of ion-exchanged calcium in steam and CO2 gasification and its effects on the evolution of char structure and reactivity. Fuel 2019, 254, 115609. [Google Scholar] [CrossRef]
  40. Jiang, M.-Q.; Zhou, R.; Hu, J.; Wang, F.-C.; Wang, J. Calcium-promoted catalytic activity of potassium carbonate for steam gasification of coal char: Influences of calcium species. Fuel 2012, 99, 64–71. [Google Scholar] [CrossRef]
  41. Arnold, R.A.; Hill, J.M. Effect of calcium and barium on potassium-catalyzed gasification of ash-free carbon black. Fuel 2019, 254, 115647. [Google Scholar] [CrossRef]
  42. Zhang, J.; Li, J.; Zhu, M.; Zhang, Z.; Zhou, B.; Shen, G.; Zhang, D. A phenomenological investigation into potassium migration and ash sintering characteristics during p.f. combustion of lignites with and without K2CO3 addition. Appl. Therm. Eng. 2019, 148, 64–77. [Google Scholar] [CrossRef]
  43. Li, J.; Zhu, M.; Zhang, Z.; Zhang, K.; Shen, G.; Zhang, D. The mineralogy, morphology and sintering characteristics of ash deposits on a probe at different temperatures during combustion of blends of Zhundong lignite and a bituminous coal in a drop tube furnace. Fuel Process. Technol. 2016, 149, 176–186. [Google Scholar] [CrossRef]
  44. Zhang, J.; Li, J.; Mao, Y.; Bi, J.; Zhu, M.; Zhang, Z.; Zhang, L.; Zhang, D. Effect of CaCO3 addition on ash sintering behaviour during K2CO3 catalysed steam gasification of a Chinese lignite. Appl. Therm. Eng. 2017, 111, 503–509. [Google Scholar] [CrossRef]
Figure 1. Schematic diagram of the autoclave system (1—high-purity Ar, 2—autoclave, 3—crucible, 4—furnace, 5—inlet valve, 6—outlet valve, 7—wet gas flowmeter, 8—temperature sensor, 9—pressure sensor, and 10—computer).
Energies 17 01193 g001
Figure 2. Effects of different mineral components (10 wt%) on gas components and gas yields without K2CO3.
Energies 17 01193 g002
Figure 3. CaO-Ca(OH)2 phase transformation vs. temperature and pressure of water.
Energies 17 01193 g003
Figure 4. XRD patterns of solid products with/without CaO at 750 °C (C0/C1/C2/C3—0/10/30/50 wt% CaO, ♦ calcite (CaCO3)).
Energies 17 01193 g004
Figure 5. Gas components for different CaO loadings.
Energies 17 01193 g005
Figure 6. SEM-EDX images of solid productions with 10 wt% CaO. (a,b) are SEM images of different solid particles in the solid productions, respectively; (a1,a2) are EDX spectrums of the a1 and a2 test spots in (a), respectively; (b1,b2) are EDX spectrums of the b1 and b2 test spots in (b), respectively.
Energies 17 01193 g006
Figure 7. Effects of different mineral components (10 wt%) on gas components and gas yields with 40 wt% K2CO3.
Energies 17 01193 g007
Figure 8. Effect of SiO2 on gas productions and its own transformation with 40 wt% K2CO3. (a) Effect of different SiO2 loadings on gas productions; (b) XRD patterns of solid productions at different SiO2 loading; K/KS1/KS2/KS3—0/3.33/6.67/10 wt% SiO2, ● mordenite ((Ca, Na2, K2) Al2Si10O24·7H2O), ▼ kalsilite (KAlSiO4), ♦ calcite (CaCO3), ♥ wollastonite (CaSiO3).
Energies 17 01193 g008
Figure 9. SEM-EDX images of solid productions with 10 wt% SiO2 and 40 wt% K2CO3. (ac) are SEM images of different solid particles in the solid productions, respectively; (a1,a2) are EDX spectrums of the a1 and a2 test spots in (a), respectively; (b1,b2) are EDX spectrums of the b1 and b2 test spots in (b), respectively; (c1,c2) are EDX spectrums of the c1 and c2 test spots in (c), respectively.
Energies 17 01193 g009
Figure 10. Effect of CaO on gas production and its own transformation with 40 wt% K2CO3. (a) Effect of different CaO loadings on gas productions; (b) XRD patterns of solid productions at different CaO loading; K/KC1/KC2/KC3—0/3.33/6.67/10 wt% CaO, ● mordenite ((Ca, Na2, K2) Al2Si10O24·7H2O), ▼ kalsilite (KAlSiO4), ♦ calcite (CaCO3).
Energies 17 01193 g010
Figure 11. SEM-EDX images of solid productions with 10 wt% CaO and 40 wt% K2CO3. (ac) are SEM images of different solid particles in the solid productions, respectively; (a1,a2) are EDX spectrums of the a1 and a2 test spots in (a), respectively; (b1,b2) are EDX spectrums of the b1 and b2 test spots in (b), respectively; (c1,c2) are EDX spectrums of the c1 and c2 test spots in (c), respectively.
Energies 17 01193 g011
Figure 12. Effect of Al2O3 on gas productions and its own transformation with 40 wt% K2CO3. (a) Effect of different Al2O3 loading on gas productions; (b) XRD patterns of solid productions at different Al2O3 loadings; K/KA1/KA2/KA3—0/3.33/6.67/10 wt% Al2O3, ● mordenite ((Ca, Na2, K2) Al2Si10O24·7H2O), ▼ kalsilite (KAlSiO4), ♦ calcite (CaCO3), ○ boehmite (AlO(OH)), ■ Al2O3.
Energies 17 01193 g012
Figure 13. SEM-EDX images of solid productions with 10 wt% Al2O3 and 40 wt% K2CO3. (a,b) are SEM images of different solid particles in the solid productions, respectively; (a1,a2) are EDX spectrums of the a1 and a2 test spots in (a), respectively; (b1,b2) are EDX spectrums of the b1 and b2 test spots in (b), respectively.
Energies 17 01193 g013
Table 1. Ultimate analysis, proximate analysis, and ash compositions of the semi-coke.
Ultimate Analysis [wt%]Proximate Analysis [wt%, Air-Dry Base]
CHNSO aMoistureAshVolatilesFixed carbon
65.592.250.952.267.750.7021.2014.5863.52
Ash composition [wt%]
CaOSiO2Al2O3Fe2O3SO3Na2OMgOTiO2Others
32.7722.1222.0911.966.571.310.840.501.84
a By difference.
Table 2. The test conditions in this study.
CaseK2CO3 [wt%]SiO2 [wt%]Al2O3 [wt%]CaO [wt%]
10000
201000
300100
400010
500030
600050
740000
8401000
9400100
10400010
11403.3300
12406.6700
134003.330
144006.670
1540003.33
1640006.67
Disclaimer/Publisher’s Note: The statements, opinions and data contained in all publications are solely those of the individual author(s) and contributor(s) and not of MDPI and/or the editor(s). MDPI and/or the editor(s) disclaim responsibility for any injury to people or property resulting from any ideas, methods, instructions or products referred to in the content.

