

A Composite Index for Tracking the Evolution towards Energy Transition at Urban Scale: The Turin Case Study


1
Department of Energy (DENERG), Politecnico di Torino, 10129 Turin, Italy
2
Energy Security Transition (EST) Lab@energycenter, Politecnico di Torino, 10129 Turin, Italy
*
Author to whom correspondence should be addressed.
Energies 2024, 17(6), 1281; https://doi.org/10.3390/en17061281
Submission received: 9 February 2024
/
Revised: 28 February 2024
/
Accepted: 4 March 2024
/
Published: 7 March 2024
(This article belongs to the Topic Enabling Strategies and Policies toward a Sustainable Environment)
Abstract
:Cities play a pivotal role in achieving worldwide carbon neutrality due to their significant contribution to global energy consumption and carbon emissions. Therefore, planning effective strategies and guiding evidence-based policymaking at the city scale becomes even more crucial. Composite indices serve as a valuable tool for monitoring urban energy transition trends. This paper aims to present a novel approach, robust and flexible even under conditions of data scarcity, for tracking the energy transition trend of a city by means of a composite index (UETI). The Turin case study is introduced to test the applicability of the proposed approach. Additionally, to demonstrate the robustness of the composite index framework, the paper includes the findings of correlation and sensitivity analyses. This study reveals a significant improvement in Turin’s environmental and energy domains, while the socio-economic domain shows more modest improvement. Furthermore, the study highlights the need to address the shortage of urban data to enhance the accuracy and reliability of metric-based frameworks and to extend the assessment to a larger sample of cities.
1. Introduction
The global energy transition aims to shift from a fossil-based system to a new smart and sustainable paradigm, intended as a society able to meet the current needs without compromising the ability of future generations to meet their own needs [1]. As nations strive to decarbonize their energy systems, cities have emerged as vital actors in this transition. In fact, currently, they account for 55% of the global population, two-thirds of global energy consumption and more than 70% of global greenhouse gas emissions (GHGs) [2]. Considering the ambitious Climate Law [3] goal of achieving carbon neutrality in Europe-27 (EU-27) by 2050, it is clear that energy transition at an urban scale is crucial in this process. Since the transition involves not only energy aspects but is strictly intertwined with many other dimensions, to achieve a comprehensive and clear understanding of the phenomenon, policymakers need support from science-based tools, able to measure and track the multifaceted reality of energy transition. Among the diverse science-based tools, composite indicators are effective at describing and capturing multi-dimensional phenomena by means of a single metric. In the context of energy transition at the city level, composite metrics can serve as a powerful tool for monitoring the process and for comparative analyses across various cities and timeframes.
A robust index framework can be helpful to policymakers to set medium- and long-term goals and targets, evaluate the effect of ongoing and future policies, highlight criticalities and communicate the progress over time to the stakeholders.
Literature Review
Due to the relevance for policymaking, many studies have focused on building metrics to quantify the impacts and the performance towards energy transition at different spatial scales, although the multitude of proposed approaches and the absence of a commonly recognized framework prove that a single pre-set “one-size-fits-all” method would be inappropriate [4].
At the global scale, the International Renewable Energy Agency (IRENA) defined a composite index (Energy Transition Welfare Index) [5] which includes five sub-domains to measure the multi-dimensional impacts of the energy transition. The World Economic Forum (WEF) [6] and the World Energy Council (WEC) [7] focus instead on the country level; by allocating a score to each country, they rank countries according to their overall energy transition performance. Similarly, the European Commission ranks countries by means of the Transition Performance Index (TPI) [8] and promotes constructive competition by encouraging emulation of countries with the best performance. Due to the emergency of global warming, the European Climate Foundation (ECF) launched the Net Zero 2050 initiative [9] aimed at monitoring the evolution towards global carbon neutrality. The Climate Change Performance Index (CCPI) report ranks and compares the climate performance of 59 countries [10].
By shifting the focus of the study to the urban scale, the International Organization for Standardization (ISO) published the ISO 37120 standard [11], including a set of 100 indicators for measuring the sustainable development of cities. This document is intended to be coupled with ISO 37122 [12], providing further indicators specific to smart cities, and ISO 37123 [13] for the evaluation of the urban resilience. These standards provide a useful directory but give no instruction on how to perform the aggregation and normalization of indicators.
Various European projects share the common objective of developing a comprehensive framework to evaluate city performance in the context of energy transition: the CITYKEYS project [14] (2015–2017) aimed to measure the sustainability and smartness of European cities by means of specific Key Performance Indicators (KPIs), while the REPLICATE project [15] (2016–2021) focused instead on the evaluation of initiatives implemented at the district level of three European “lighthouse cities”, namely San Sebastian (Spain), Florence (Italy) and Bristol (United Kingdom). Other projects worth mentioning, funded under the European Union’s Horizon 2020 Programme, are POCITYF [16] (2019–2024), IRIS [17] (2017–2023) and SmartEnCity [18] (2016–2022). POCITYF is intended to quantify the impact and effectiveness of adopted strategies in meeting the needs of citizens, whereas IRIS and SmartEnCity are more focused on achieving sustainable, accessible and reliable urban transport and energy supply, by increasing the share of renewable resources in the urban energy mix.
The literature review revealed that many studies do not include the normalization, weighting and aggregation procedures [19,20,21,22]: they just focus on the selection of criteria to choose an appropriate set of indicators to describe the phenomenon of interest (e.g., sustainable development, energy transition, etc.).
Other studies instead adopt hybrid methods of aggregation, normalization and weight allocation: the Carbon Neutrality Capacity Indicator System (CNCIS) [23] combines the best–worst method (BWM) to obtain the subjective criteria weights, together with the entropy method (EM), used to compute the objective criteria weights. Furthermore, the Uniform Smart City Evaluation (USCE) Framework [24] adopts a hybrid method of normalization, coupling the distance to a reference method with the categorical-scale method, and uses both the Budget Allocation (BAL) and the equal weight (EW) weighting methods; BAL is adopted to assign the weights to the indicators comprising the three main sub-indexes (Project Performance Index, Sustainability Impact Index and Sustainability Performance Index). Then, EW is implemented in combination with the additive aggregation to quantify the composite USCE index. The Urban Energy Sustainability Index (UESI) [25] proposes a novel framework to build the composite index, assigning different weight according to the type of indicator (i.e., basic, instrumental and complementary indicator), but its results are intricate and difficult to explain to non-experts. While sophisticated methodologies may offer advantages from a scientific perspective, their complexity can impede comprehension among a less specialized audience. Since these methodologies are intended to support policymaking and public engagement, it is not reasonable to develop methodologies beyond the policymakers’ comprehension. On the other hand, prioritizing clarity and transparency in methodologies can improve effective communication and interpretation of scientific evidence, enabling broader engagement and fostering greater trust and confidence in the information being conveyed. For this reason, less intricate and sophisticated methods are often preferred: as observed from the literature [6,26,27,28], the combination of Min–Max normalization with the equal-weight additive aggregation is one of most used methods. When dealing with comparative analyses, rank-based methodologies are widely used, as observed in the Arcadis’s Sustainable Cities Index (SCI) [29], the IMD’s Smart City Index [30], the Global Cities Report [31], the IESE’s Cities In Motion Index (CIMI) [32] and in the Global Power City Index (GPCI). On one hand, these rankings serve as a useful tool to compare cities, but they do not convey the magnitude or extent of differences between them since they only consider the relative position of cities within the ranking. City rankings generally include a subset of global cities (e.g., the Arcadis’s ranking [29] includes 100 cities, the IMD’s report includes 141 cities, the CIMI’s report comprises 174 cities, etc.), often corresponding to the capitals or the main cities of each country. On one hand, rankings provide the opportunity to simultaneously compare many cities at a global level; on the other, they only include a small portion of these cities: for example, as regards Italian cities, several rankings encompass only Milan and Rome [29,30,31], excluding other important cities like Turin and Naples. In addition, the literature review revealed a limited availability of studies focused on energy transition in Italian cities, except for D’Adamo et al. [33], the Legambiente’s Ecosistema Urbano report [34] and the Municipality Transition Index (MTI) [35].
The first study updates the results obtained with the methodology developed by Fondazione Enrico Mattei [36] to assess the performance of 103 Italian cities across all Sustainable Development Goals (SDGs), encompassing not only energy transition but also other aspects such as poverty, quality education and gender equality. Indeed, the final score obtained by aggregating all SDG performance indicators provides the overall percentage of achievement of all the SDGs [37].
The annual report published by Legambiente [34] serves as a valuable reference point for analysing the trends in environmental performance among 104 Italian cities. It encompasses a total of 18 indicators across six components (air, water, waste, mobility, urban environment and energy) included in the composite index (Indice Ecosistema Urbano, IEU). However, the index framework is mainly focused on environmental aspects (e.g., air quality) and resources management (e.g., water, waste and soil). As regards energy indicators, only one indicator (i.e., kW of installed photovoltaic systems per 1000 inhabitants) is included, while various crucial aspects essential for quantifying energy transition performance (e.g., energy intensity by consumption sector, the quality of the power network, the penetration of renewables in urban final consumption and the integration of green vehicles into the urban system) are excluded. Another crucial element missing in this report is the urban CO2 emissions, a key factor for monitoring the effectiveness of urban decarbonization policies in meeting carbon-neutrality objectives [3]. Furthermore, there is a complete lack of indicators measuring the socio-economic impact of urban energy transition (investments, employment, added value, energy poverty, etc.).
The third study [35] proposes instead the Municipal Transition Index (MTI) to assess energy transition in Italian cities. The MTI is composed of a set of 18 indicators associated with four main dimensions: Digitalization (D); Energy, Climate and Resources (ECR); Sustainable Transport and Mobility (M); and Waste and Materials (W). Although this study provides a valuable overview of the Italian energy transition at an urban scale, covering 7904 municipalities, it does not offer any temporal trends, nor does it specify the reference year for the assessment. In fact, it lacks a consistent reference year for all indicators, using the latest available data, thus resulting in some indicators referring to 2021, others to 2018 and yet others to 2019, thereby creating a discrepancy among indicators and in the overall score of the composite index. In contrast, Shen et al. [28] published in 2023 the assessment of energy transition index of 282 Chinese cities up to 2019, adopting the criterion of extending the analysis up to the year for which all indicators are computable. The literature analysis reveals a prevailing tendency of embracing such compromises to facilitate the application of the proposed method and broaden the study’s coverage across a wider spectrum of cities, even in the presence of a scarcity of updated data.
Hence, the literature review has highlighted the absence of a comprehensive framework for monitoring urban-scale energy transition that meets all of the following four requirements: (1) encompassing a broad spectrum of factors crucial for tracking the multi-dimensional impacts of energy transition (i.e., energy intensity, carbon intensity, green mobility, economic impact, etc.); (2) being easily comprehensible and interpretable by non-experts; (3) demonstrating applicability and adaptability to various urban contexts, even with limited data availability; and (4) including correlation and sensitivity analyses to ensure study transparency.
This paper aims to bridge this gap by proposing a new framework for evaluating urban-scale energy transition in terms of energy, environmental and socio-economic factors (requirement 1) through the Urban Energy Transition Index (UETI) composite index. The choice of preferring more easily understandable methodologies for normalizing, weighting and aggregating indicators (discussed in Section 2) meets requirement 2, while the applicability of the methodology to cities characterized by limited availability of data fulfils requirement 3, as proved by the proposed case study related to the city of Turin (Section 3). Furthermore, in line with requirement 4, both correlation analysis and sensitivity analysis are included (Section 4).
Conclusions and future research are reported in Section 5. Moreover, in line with the aim of enabling the replicability of the proposed approach, the complete list of datasets and data providers are reported in Appendix A.
2. Methodology
Building a composite index is a complex process which requires several intermediate steps which can affect the quality and reliability of the results [38]. Each step is described in the following sub-sections, justifying the choice of adopted methodologies: the definition of the conceptual framework in Section 2.1, the normalization step in Section 2.2 and the weighting and aggregation steps in Section 2.3.
2.1. Conceptual Framework
To evaluate the Urban Energy Transition Index, three main domains have been taken into consideration: Energy, Environmental and Socio-Economic. Each domain is further divided into sub-domains as shown in Figure 1.
The Energy domain encompasses aspects related to the decarbonization of the energy system (energy generation, transmission/distribution and consumption), and it is characterized by four sub-domains: Renewable Energy Resource (RES) penetration, power grid quality, green mobility and energy intensity.
The first sub-domain measures the RES integration in the energy supply; the power grid quality aims to monitor the efficiency of the power grid operations; the green mobility sub-domain is for tracking the electric and hybrid vehicle integration into the traditional automotive fleet as well as the coverage of bike lanes in the urban area; the energy intensity, often used as an approximation of energy efficiency [39], encompasses the energy intensities of the main energy-consuming sectors of the city (residential, industrial, tertiary and transport).
The Environmental domain includes 5 sub-domains: air pollutants, greenhouse gases, waste, water and land. Air pollutants accounts for gaseous emissions dangerous mainly for human health (e.g., PM10 and NOX), greenhouse gases measures the climate-altering emissions in terms of equivalent carbon dioxide (CO2), waste encompasses waste production and management, whereas the last two sub-domains serve to keep under control the consumption of water and land.
The Socio-Economic domain comprises three main sub-domains: health, well-being and economic impact. The first two sub-domains aim to measure both physical (health) aspects and welfare (well-being) of citizens, whereas the economic impact is specifically focused on tracking the investments and the benefits brought by the energy and environmental sectors in terms of employment and added value.
Once the UETI conceptual framework has been defined, it is necessary to select a set of indicators able to quantitatively assess the impact of energy transition in the city across the 12 sub-domains. However, when dealing with city-scale analyses, data scarcity is a relevant issue which can make calculation of indicators challenging. This aspect emphasized the need for a flexible methodology which provides a robust but also adaptable framework for assessing and monitoring urban energy transition even in the presence of data scarcity.
To maintain flexibility and adaptability of the proposed approach, specific indicators (reported in Appendix A, Table A1) are not included in the conceptual framework. The absence of predetermined specific indicators allows for adjustments and inclusion of relevant metrics based on specific characteristics and data availability on the city under examination. This flexibility ensures that the methodology remains applicable and robust in diverse urban settings, preventing data limitations from impeding the tracking of the energy transition. It acknowledges the dynamic nature of urban data landscapes and strives to provide a comprehensive yet adaptable framework for assessing energy transitions in cities.
2.2. Normalization
Given the dimensional differences among the indicators, it is necessary to perform a normalization before proceeding with the aggregation process. The normalization step involves transforming data into a standard or common scale, typically to remove variations in units or scales, allowing data aggregation into a single metric.
Among the existing normalization methods, z-score, Min–Max, distance to a reference and categorical scale are some of the most common in the literature [40,41]. Z-score normalization is performed by dividing the difference between the raw indicator and the average by the standard deviation. It converts all indicators to a common scale with an average of zero and a standard deviation of one. In case of time-dependent performance indicators, the average and the standard deviation are calculated for a reference year [41]. It is widely used since it is a robust technique, and it is easy to apply and interpret. However, if the data are not normally distributed, the resulting normalized values do not reflect the original data. Moreover, it is not appropriate in the case of small sample sizes, as the values of the mean and standard deviation result in unstable or unreliable estimates [40]. Min–Max normalization, like z-score normalization, is a simple and easy-to-implement method, since it requires just basic mathematical operations (subtraction and division) to rescale the values with respect to the minimum and maximum of the dataset. Compared to the z-score, this method can be applied to a wider range of distributions, including normal and non-normal distributions. Nonetheless, the scale is based on best and worst performances; therefore, just the relative ordering of values is kept after the normalization. Similarly to z-score normalization, outliers could distort the results, and, in addition to this, it requires recalibration of the minimum and maximum when further data are added in the dataset [40]. Distance to reference adopts a different approach, by scaling the raw indicators with respect to a reference benchmark. The disadvantage of this methodology is that the results may be very sensitive to the chosen benchmark, and a significant level of subjectivity is involved when the choice of the benchmark is based on experts’ estimations and assumptions rather than universally accepted value from the literature, or normative benchmarks. The same problem occurs in the categorical-scale normalization, which converts the raw indicators into a common scale by assigning categorical (numerical or qualitative) scores, according to a set of reference thresholds. In the case of a lack of universally accepted reference thresholds, they are estimated based on judgements of experts and/or stakeholders [42,43].
The hybrid weighting methods belong to a different category as they combine several subjective and objective methods together: for instance, combining the distance to a reference with the categorical-scale method [24], which allows semi-quantitative (e.g., Likert Scale) and qualitative data (e.g. Boolean logic) to also be included in the analysis. This method could be suitable for cities that do not yet have a robust and organized indicator tracking system, since it works even in the case of a low amount of data [24]; however, it requires the construction of appropriate thresholds, involving a significant degree of subjectivity.
Among these methodologies, the Min–Max normalization method results were the most common and versatile as evidenced by numerous references [26,27,44,45]. Moreover, this normalization allows us to evaluate performance from two perspectives: the performance of a single system or the performance of a set of comparable systems. In the first case, the normalization consists of scaling the values with respect to the minimum and maximum recorded over time by a single system (e.g., country, region, municipality or district), highlighting improvements, worsening and eventual criticalities. As regards the second perspective, Min–Max normalization allows us to compare performances of a group of systems (e.g., European countries, Italian cities or districts of Turin city) by using the minimum and maximum recorded per time unit (e.g., month, quarter or year). This kind of normalization allows us to compare performances of different systems, encouraging healthy competition and emulation of the systems with the highest performance. To assess the energy transition trend in the Turin case study, the first type of Min–Max method has been selected.
2.3. Weighting and Aggregation
As regards weighting and aggregation methods, the OECD’s Handbook [40] serves as a useful reference guide to building a composite index. Two main group of weighting approaches can be distinguished: objective (i.e., equal weighting and statistic-based methods) and subjective (i.e., participatory methods) [4]. Equal weighting (objective) involves assigning the same weight to all indicators, with the logic that an indicator cannot be considered more relevant than the others [33]. The statistic-based (objective) weighting derives weights from statistical properties of data, whereas, on the contrary, the participatory (subjective) methods rely on experts’ opinions [40]. Furthermore, the OECD’s guidelines [40] highlight the limits of application of certain methods: the Min–Max normalization method, for instance, can be used in conjunction with the majority of weighting schemes and aggregation systems, while z-score normalization cannot be used in combination with geometric aggregation or with the Benefit Of Doubt (BOD) weighting method [40].
The Analytic Hierarchy Process (AHP), the conjoint analysis and the Budget Allocation Processes (BAPs) are some of the most common subjective weighting methods [46]. Their main advantage is that they can also be applied in the presence of qualitative input data and in the case of missing or insufficient data. However, they also present several disadvantages such as vulnerability to bias, and personal opinions and experiences of the experts or stakeholders involved can affect the reliability of results; need of many resources (time, effort and expertise) to implement; lack of objectivity; and difficulty in replicating [40]. On the contrary, the objective weighting methods use statistical or data-driven approaches to assign weights to each variable. Examples of objective weighting methods include Principal Component Analysis (PCA), Factor Analysis (FA), data envelopment analysis and regression analysis [40,46]. Similarly to normalization methodologies, some studies adopt hybrid weighting methods by combining subjective with objective weighting methods [23,47]. However, the equal weighting is the most straightforward method among the objective weighting methodologies because of its applicability, ease of communication and simplicity of use. In fact, it assigns the same weight to each variable composing the aggregate metric. The equal-weight method has been selected for this work, both because it is the most common in the literature [5,6,8,26,28,30,32,33,47,48] and because it is often used as reference to perform comparative analyses between different weighting methods [32].
Among the various aggregation approaches observed in the literature, the most straightforward and widely used is the additive aggregation [10,26,27,32,47,48,49], often combined with the equal weighting. Nevertheless, this methodology is characterized by the so-called “perfect compensability” among performances: underperformance in one component can be perfectly compensated by equivalent overperformance in another component [38,40]. Another methodology is the geometric (multiplicative) aggregation, based on the product of the variables instead of the sum and less sensitive to perfect compensability [50]. The multiplicative aggregation encourages improvements in the weaker components of the composite index since it penalizes mostly the unbalanced performances compared to the additive aggregation.
The aggregation process is performed at three levels:
- Bottom level: aggregation of normalized indicators belonging to the same sub-domain to calculate the sub-domain performance index;
- Middle level: aggregation of indexes belonging to the same domain to calculate the domain performance index (Energy, Environmental and Socio-Economic);
- aggregation of the three indexes to obtain the final UETI.
The preference for additive aggregation over geometric aggregation in the chosen case study (discussed in the Section 2) is justified by its widespread acceptance and frequent use in the existing literature. Furthermore, additive aggregation offers simplicity, versatility and ease of interpretation, and it facilitates effective communication of results to policymakers.
3. Case Study: Energy Transition in Turin
The selection of Turin as the city to test the proposed methodology is rooted in its effort to align with the objectives of the European Green Deal by undertaking measures aimed at advancing its energy transition and carbon neutrality [51,52]. This commitment is prominently demonstrated through Turin’s application to the “Climate-Neutral and Smart Cities by 2030” mission (the “100 Cities Mission”) [53], launched by the European Commission to speed up the journey of cities towards climate neutrality. Turin has been chosen as one of the 100 European cities participating in the mission, aiming to reach climate neutrality by 2030, through the adoption of ad hoc policy strategies and innovative solutions. Moreover, Turin’s case becomes even more intriguing if considering its peculiar situation: due to its geographical location, surrounded by mountains, and due to the high volume of vehicle traffic and fossil-based industrial activities, it is one of the cities in Italy [54] and in Europe [55] with the highest concentration of air pollutants (NO2, PM2.5 and PM10). As it is widely known that polluted air has an adverse effect on human health (e.g., resulting in an increased occurrence of respiratory diseases), the need for decarbonization, especially in Turin, extends beyond the climate change challenge and also encompasses the health of citizens. Thus, by committing to the “Cities Mission” goal, Turin has embraced the challenge of shifting from a traditionally fossil-based industrial city to a sustainable, smart and carbon-neutral city. Due to the magnitude of this challenge, policymaking needs to be provided with reliable and up-to-date information for adapting strategies in each domain involved in the transition process. This study aims to show how the science-based approach can help to address the complexity of the energy transition in the city of Turin, providing a comprehensive view of how the city evolved across various domains (Energy, Environmental and Socio-Economic) and over time (from 2014 to 2019). By using the indicators framework, the progress of the city of Turin towards energy transition can be monitored systematically, providing a real-time understanding of the impact of the implemented measures and facilitating the identification of required adjustments. Moreover, this study strives to promote transparent communication of energy transition progress through indicators to a broader audience, fostering stakeholder and citizen engagement and encouraging collective efforts towards achieving carbon neutrality. Out of over 100 data collected from 34 datasets, provided by 12 data-sources (listed in Appendix A, Table A2), 90 raw data were selected to calculate the UETI. A set of 30 indicators (Appendix A, Table A1), tailored to Turin’s context, have been selected to assess the impact of the energy transition across the 12 sub-domains outlined in the Section 2.
Installed capacity (MW) and shares of renewables (RES) in the total final consumption (TFC) are the performance indicators selected to measure the penetration of renewables in the city of Turin. Due to the lack of other renewable resources (wind, hydro and geothermal resources), photovoltaic technology is considered as a benchmark to track the spreading of renewable installations in Turin. On the other hand, due to the lack of data on heat consumption by energy source, the second indicator is obtained by considering the share of renewables on the electricity final consumption, excluding heat consumption. As a result of an increase in RES penetration, power grid quality may suffer from a decrease in grid quality; therefore, three indicators measuring the duration of outages (-), average of disconnections (n.) and power loss (%) are included in the UETI framework. In a city like Turin, characterized by a fossil-fuel-powered transport sector and limited air circulation, air pollution is a critical issue; therefore, PM10 exceedances (n. days/year) and NO2 concentration (μg/m3) deserve particular attention. Another aspect strictly connected to air quality is the green mobility trend: it favours transition away from traditional combustion engine vehicles towards electric (EVs) and hybrid vehicles (HVs), allowing for mitigation of air quality issues and a reduction in the overall carbon footprint of the city. Turin’s transport sector is expected to increase the share of EVs and HVs in the next decade; to measure this trend, the number of EVs and HVs over 1000 passenger vehicles is included in the framework. However, the growth of EVs and HVs needs to be accompanied by adequate infrastructure (i.e., number of EV charging points over 1000 EVs and HVs), engaging in the exploitation of local renewable energy (i.e., number of RES-EV charging points). In addition to this, tracking the evolution of cycle lanes (km/100 km2) is incorporated into green mobility: it provides further information about the development of sustainable transportation infrastructure, and it also reflects the commitment of the city to encourage citizens to choose soft mobility (e.g., bikes and e-scooters) over traditional vehicles. Enhancing energy efficiency is considered as a key strategy to achieve carbon-neutrality goals at an urban scale. Tracking the energy consumed per unit of economic activity (i.e., energy intensity) offers valuable insights into the effectiveness of energy efficiency measures across the most energy-demanding sectors: energy intensity residential sector (MWh/inhab), energy intensity tertiary sector (MWh/kEUR), energy intensity transport (MWh/Mpkm), energy intensity industry (MWh/kEUR) and energy intensity municipal service (MWh/m2). By tracking energy intensity, it is possible to identify trends, evaluate required adjustment and make informed decisions to continually improve efficiency and favour a reduction in the total carbon footprint of the city, specifically measured in terms of tons of CO2 emitted over the population (carbon intensity: tCO2/inhab). To obtain a composite indicator providing a comprehensive picture of sustainable urban development, responsible water and land use are essential aspects to be monitored. Including green coverage and pedestrian areas reflects the commitment of Turin to sustainable urban planning, while considering per capita water consumption and the percentage of water recycling provides insights into the city’s water management efficiency.
Waste, though historically excluded from the category of local energy resources, can instead serve as a significant example of circular economy if managed effectively while pursuing low waste production coupled with high recycling rates. For this reason, municipal waste production and recycling rate are included in the UETI framework.
Considering city-specific factors such as air quality issues (high concentration of PM10 and NO2), high population density and unique geographical and climatic factors, deaths from respiratory system diseases (%) and mortality rate indicators assume particular importance for assessing the expected positive impact of energy transition process on public health. Moreover, UETI encompasses the economic impact of energy transition by including Energy–Environment Investments (%), Energy–Environment Added Value (EUR) and Energy–Environment Employment (%) as reference indicators. These indicators provide valuable insights into the benefits of energy transition for the urban economy of Turin; indeed, even if historically tied to industrial production like automotive manufacturing, energy transition in the city of Turin presents a unique chance for diversification of the economic landscape, offering the opportunity to be aligned with global sustainability goals, creating new jobs and attracting green investments. As regards the effect on the well-being of citizens, the combination of income (kEUR/inhab) and energy poverty [56] (%) allows for assessing eventual social disparities: income serves as an average indicator of the overall economic status of population; on the other hand, the progress of energy poverty highlights a more nuanced reality, indicating that the vulnerability of certain segments of the population is worsening. Together, these indicators act as a socio-economic barometer, providing insights into an ongoing phenomenon that requires attention and intervention in the context of the energy transition.
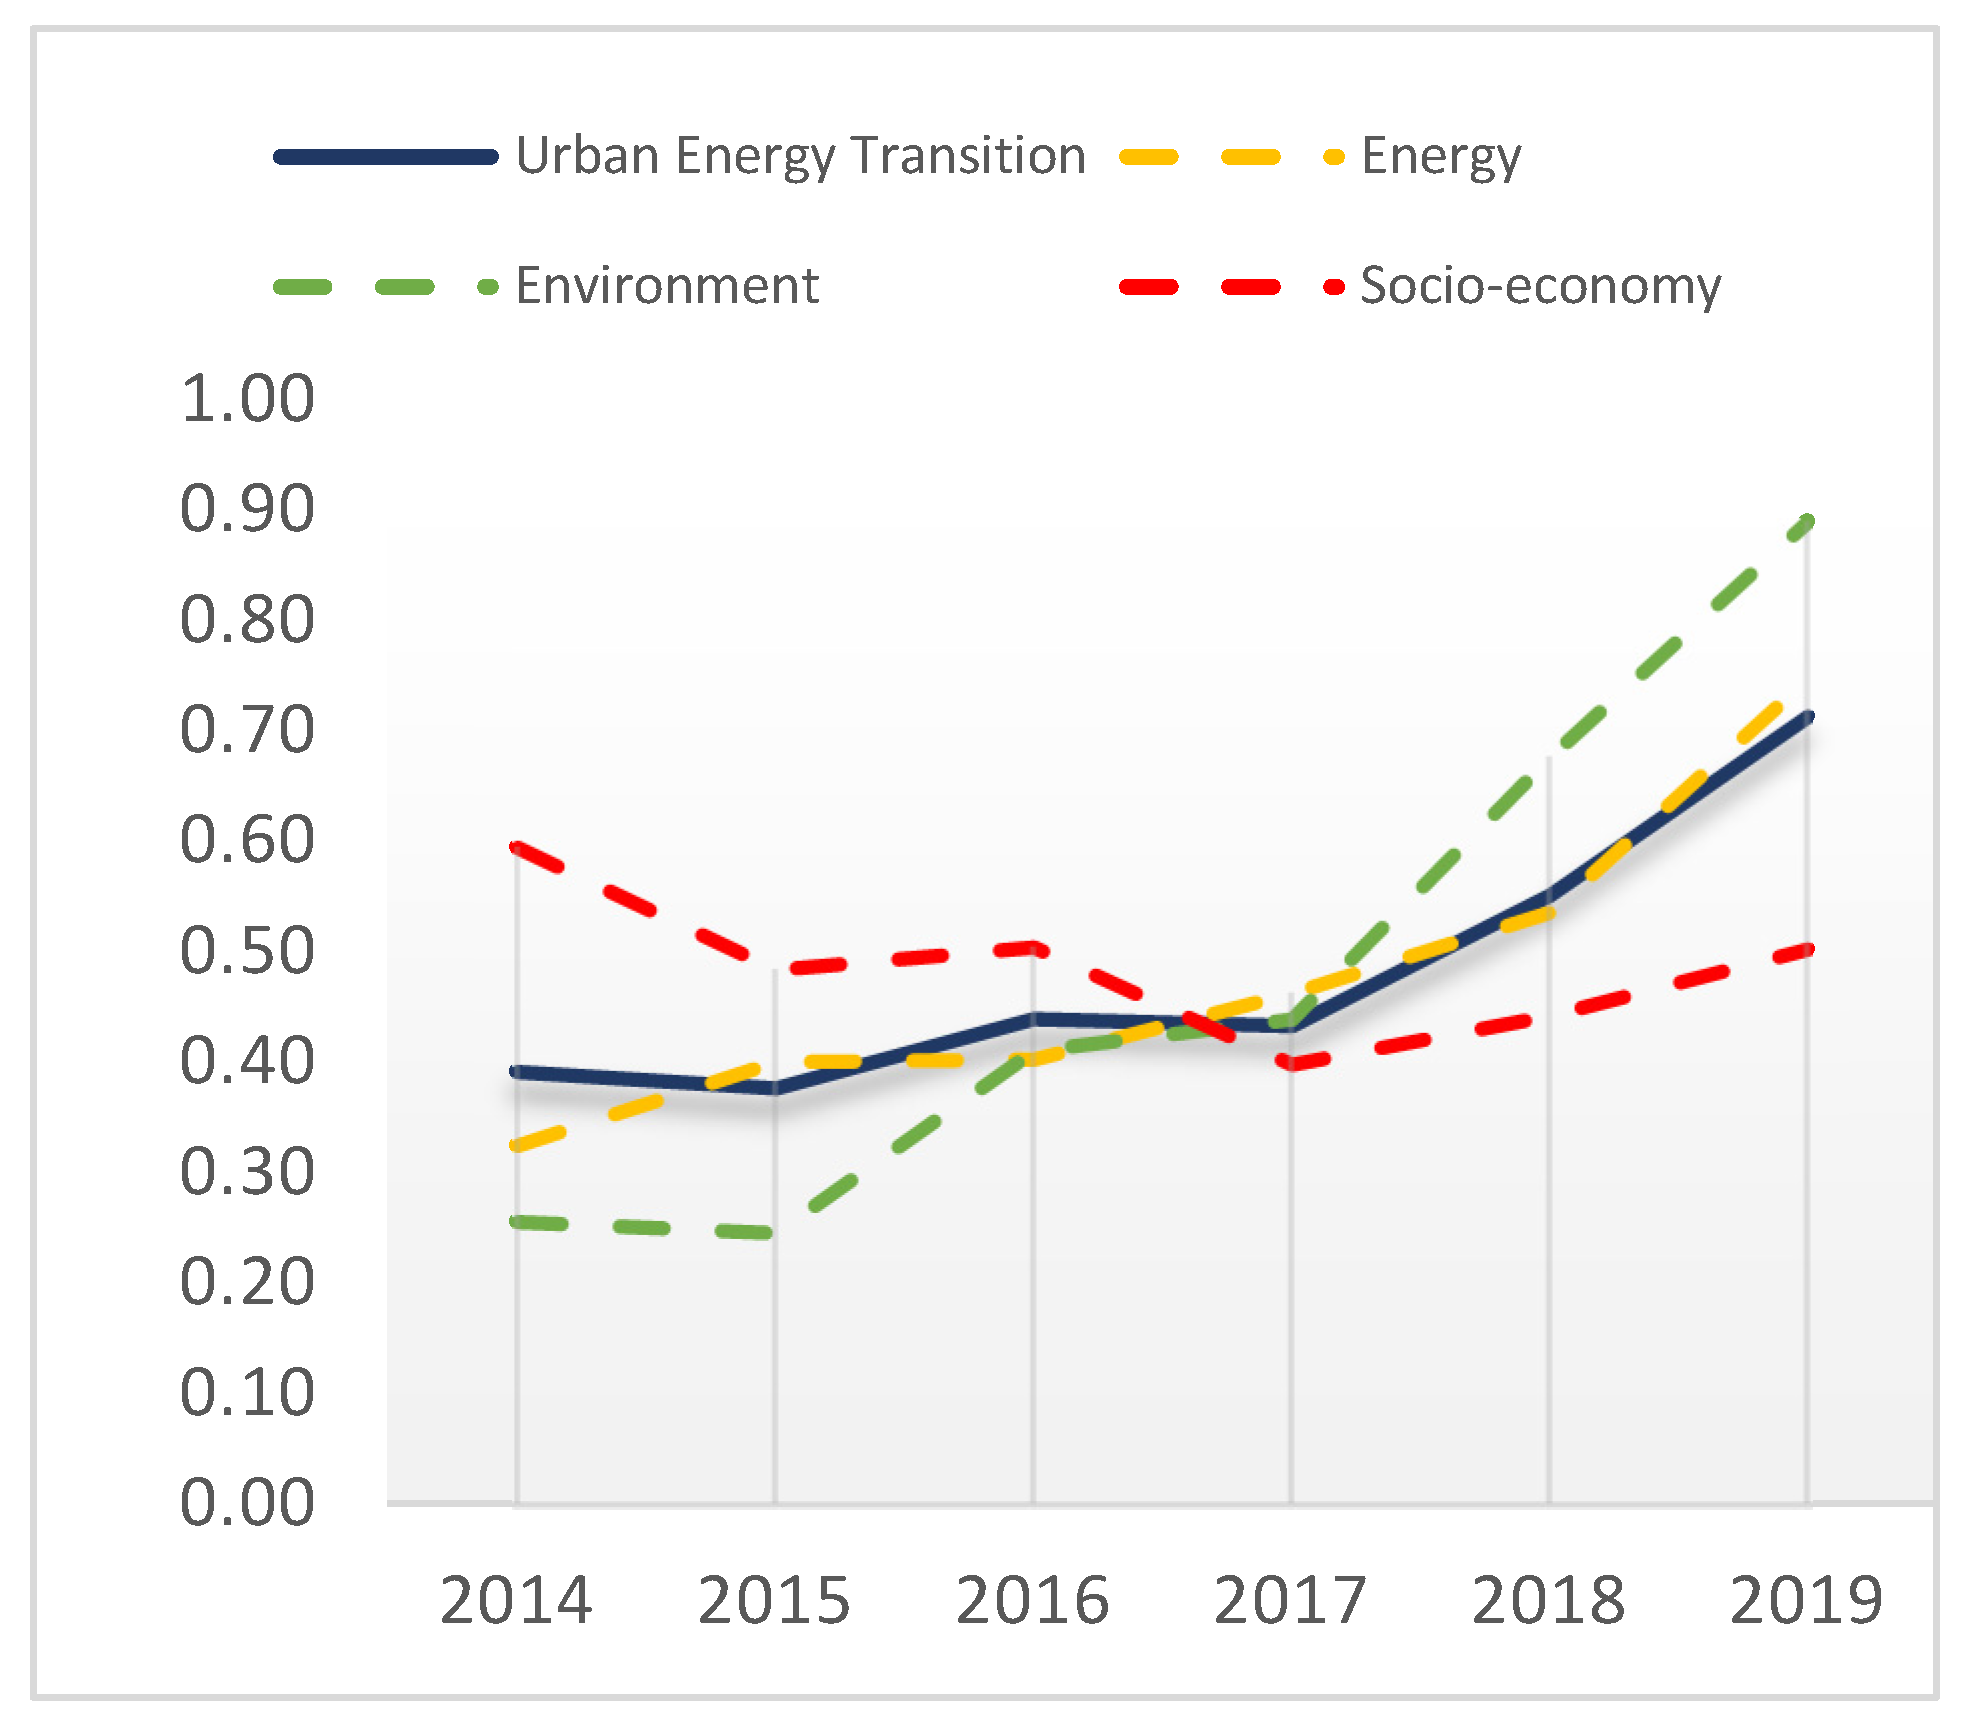
Before proceeding to the aggregation of indicators grouped in the same sub-domain (Table 1), Min–Max normalization is adopted to convert into a common scale each of the 30 indicators: 1 corresponds to the best performance and 0 to the worst performance observed over the period considered (2014–2019). Then, three steps of additive aggregation with equal weight are performed. The first aggregation step results in 12 performance indexes (Table 2): 4 for the Energy domain, 5 for the Environment domain and 3 for the Socio-Economic domain. Similarly, the second aggregation calculates the indexes of performance for the Energy domain, the Environment domain and the Socio-Economic domain. These indexes are combined (third aggregation) to obtain the UETI. The overall scores are shown in Figure 2.
4. Discussion
The results (Table 2) show a clear increase in the overall city performance (UETI) between 2014 and 2019: the Environmental domain shows the best performance, achieving the highest score in 2019, followed by the Energy domain. Despite the other two domains, the Socio-Economic performance decreased over the period of study: in particular, the health performance recorded a significant decrease; indeed, the mortality rate and the deaths from respiratory system diseases increased (Appendix A, Table A1). However, it must be pointed out that this information refers to the province of Turin, because the city-specific data are not available. Similarly, other metrics refer to the regional scale (i.e., energy poverty and Energy–Environment Investment) and provincial scale (i.e., Energy–Environment Added Value and Employment) rather than the city scale due to the lack of data. The Socio-Economic domain lacks updated data for the city of Turin. The utilization of provincial and regional data as an alternative to missing municipal data aligns with the flexibility inherent in the approach proposed in this study, avoiding data constraints to hinder the monitoring of the energy transition. Even though provincial and regional data offer valuable insights, city-specific data provide more accurate representation of the energy transition impact on the specific urban context. For instance, the well-being performance is affected by the low performance of energy poverty at the regional scale (share of people who cannot afford adequate and essential energy services [57]) even if Turin’s income performance increased from 16.9 to 18.6 kEUR/inhabitant between 2014 and 2019 (Table A1). Even though these data affect Turin’s actual performance, their exclusion in the assessment would lead to an impoverishment of the information content of the composite index. Therefore, to improve the accuracy and reliability of this metric-based assessment, is essential to enhance the current system of data collection at the city level.
As regards the environmental performance, in 2019 GHG emissions, water consumption and land use registered the best performances of the period 2014–2019 (Table 2). In particular, the GHG emission index, resulting from the normalization of CO2 emissions per inhabitant, shows a continuous and clear trend of improvement. On the contrary, the air pollutants performance shows a fluctuating trend, registering a sharp increase in performance between 2018 and 2019, whereas the waste performance kept a steady, even if moderate, improvement over time. Similarly to the Environmental domain, the Energy performance registered a net increase between 2014 and 2019, especially thanks to the green mobility and the energy intensity trends which demonstrate, on one hand, the effort of the city to integrate the electrical vehicles (EV) and the installations of recharging points, and on the other, the benefit led by the enhanced energy efficiency in the residential buildings (Table 2). Conversely, the RES penetration trend shows in 2019 a limited increase compared to 2014; however, it must be pointed out that the share of RES in TFC omits heat generation due to the lack of data. Moreover, the fact that the score of grid quality performance in 2019 is close to the value in 2014 proves that no significant progress has been made to reduce power losses and disconnection issues.
4.1. Comparative Analysis with Other Studies
Comparing our method with other studies conducted on Italian cities has revealed both differences and commonalities. Since D’Adamo et al. [33] only provide a snapshot of the SDG performance of Italian cities, it was not possible to perform a thorough comparative analysis over the period under study (2014–2019); however, common points with our findings were observed. For instance, their study identifies air pollutants performance as the most critical issue of the city of Turin: in particular, Turin’s PM10 index is equal to 0.057, significantly below the national average (0.498). On the other hand, coherently with our results, the authors obtain good performance in waste management, especially for municipal waste management with a score equal to 0.695 (above the national average of 0.595) and CO2 emissions score equal to 0.487 (slightly below the national average of 0.501). Similarly to [33], the MTI’s study [35] also provides merely an instant snapshot of the Italian cities’ transition situation; therefore, a year-by-year comparison for the city of Turin cannot be performed. Furthermore, the study does not provide the list of performances achieved by each individual city, as the study is aimed at highlighting differences between regions rather than focusing on individual cities’ performance; therefore, Turin’s performances are deduced from the thematic maps in Figure 5 of the paper [35]. Although it is challenging to deduce precise values for the city of Turin from maps, the comparative analysis appears to confirm that Turin has good performance in waste management and sustainable mobility compared to other Italian cities. On the contrary, the performance of Energy, Climate and Resources (ECR) appears low: the good performance in resource management (e.g., water and soil) and renewable energy penetration is influenced by poor air quality performance. Additionally, the ECR score excludes CO2 emissions indicator, thereby omitting a crucial component for assessing the city’s overall energy, environmental and climate performance.
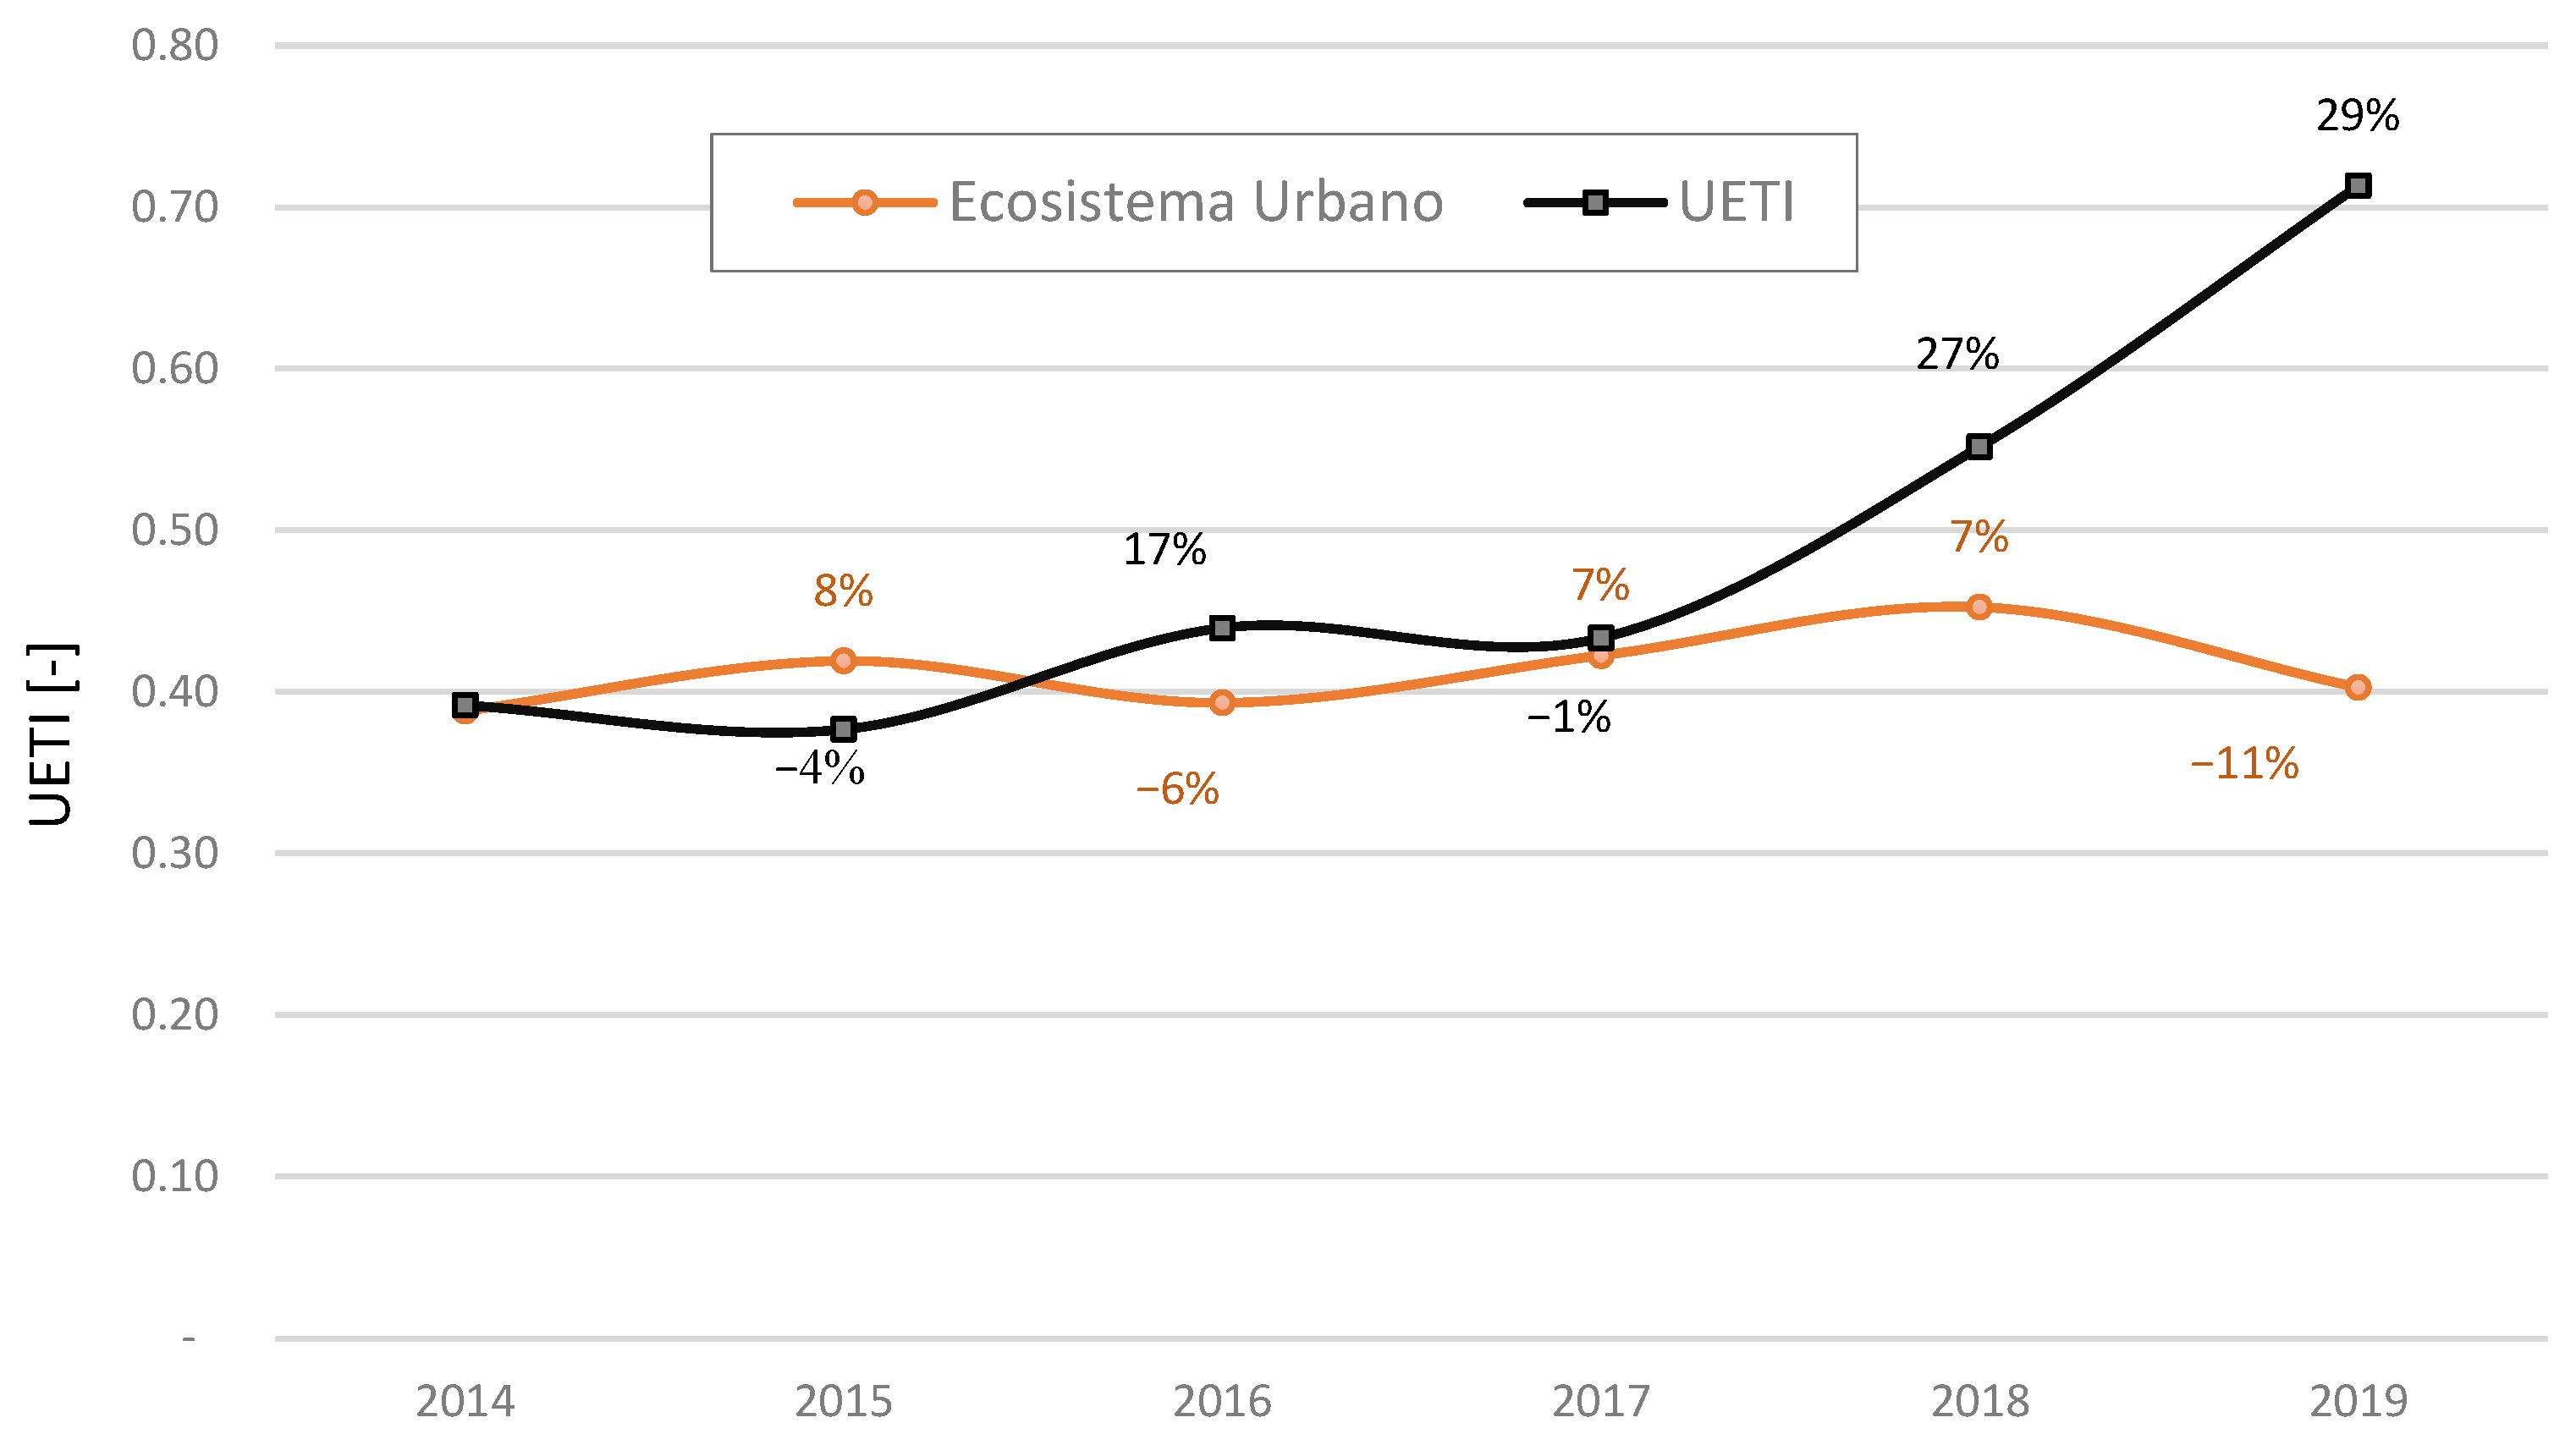
Finally, the UETI trend has been compared with the evolution of Legambiente’s Ecosistema Urbano Index [34] over the period under study (2014–2019). The comparison revealed a similar trend up to 2017, then the trends diverge (Figure 3): the UETI shows continuous growth for two years, reaching its peak in 2019, while the Urban Ecosystem experienced modest growth in 2018 followed by an 11% decrease in 2019. This discrepancy is attributed to intrinsic differences in the composite index frameworks; in particular, the Urban Ecosystem Index mainly addresses environmental and resource management aspects but overlooks critical energy transition indicators like energy intensity, power network quality, renewables penetration, green mobility and CO2 emissions, all of which experienced significant improvement in 2019 compared to 2018, thus contributing to the overall increase in the UETI.
4.2. Correlation Analysis
While the equal-weight method has been selected for weighting, it does not ensure that every sub-domain contributes equally to the Urban Energy Transition Index (UETI). Therefore, to comprehend the extent to which each sub-domain affects the overall score, it is essential to perform a correlation analysis between the UETI and its individual sub-domains. This analysis provides a more nuanced understanding of the main driving factors shaping the UETI evolution over time. The correlation analysis has been performed by calculating the Pearson correlation coefficient r (Table 3). Indeed, the Pearson correlation is the most common way to evaluate the linear correlation between two variables. The absolute value of the coefficient quantifies the “strength” of the correlation, ranging between 1 (perfect correlation) and 0 (no correlation); the sign (“+” or “−”) refers to the orientation (positive or negative) of the correlation: a positive correlation occurs when one variable changes and the other one changes in the same direction (i.e., both variables increase or both variables decrease), while a negative correlation is observed if one variable increases and the other one decreases (they change in opposite directions). When evaluating the correlation coefficient between the composite metric (e.g., UETI) and its components (e.g., Energy, Environmental and Socio-Economic), a strong correlation () is desired, because it proves that the composite index represents the behaviour of its components well. On the contrary, a weak correlation is preferred between the components of a composite metric because it means that they are mutually independent; therefore, the redundancy of the information is avoided. Firstly, the correlation analysis has been performed to study the 15 relationships between sub-domains, domains and the composite index UETI. In particular, the Energy and Environmental domains present a very strong correlation () with the composite urban index UETI, whereas the Socio-Economic domain has a very weak correlation (). This means that the overall score of UETI for the city of Turin over time (2014–2019) is less affected by the behaviour of the Socio-Economic domain. Similarly, other relations present weak correlation but still relevant to compose the city index: the power grid quality shows a weak correlation (0.27) with respect to the Energy domain as well as the economic impact with respect to the Socio-Economic domain (0.21). Nevertheless, more than 60% of the 15 analysed relationships have a strong or very strong correlation (Table 3).
It is important to highlight that the correlation analysis has been performed to provide a complete and transparent view of the proposed methodology, in line with the scope of this paper, which aims to propose a method that is easily replicable; nevertheless, the reliability of the correlation analysis should be further enhanced by improving the data availability with larger time series and constantly updated data.
4.3. Sensitivity Analysis
Conducting sensitivity analysis is crucial for evaluating the robustness and reliability of the composite index, as it systematically explores how variations in input parameters or weights impact the overall results. By subjecting the composite index to sensitivity analysis, one can assess the stability of the index against changes in methodology (e.g., weighting method) and ensure that the final measure is not disproportionately affected by specific variables. Since the proposed methodology is designed to adapt to diverse urban settings, aiming to provide a comprehensive yet adaptable framework, sensitivity analysis is even more relevant to enhance credibility and validity of the composite index. In line with this scope, three cases have been developed to test the UETI robustness (Table 4) [22]. The first case (C1) shows the behaviour of the composite index after varying the weight of those sub-domains characterized by weak correlations (highlighted in pink in Table 3): weights are increased until the moderate level (|r| = 0.4–0.59) of correlation is achieved (Table 4). The weight of power grid quality is increased by 80%, while the weight of economic impact is increased by 10% compared to the reference case (equal weighting). The second case (C2) aims to observe the UETI’s behaviour when, for each of the three domains (Energy, Environmental and Socio-Economic), the sub-domain with the strongest correlation is excluded from the calculation (i.e., green mobility, land use and well-being). The third case (C3) investigates the effect of excluding a specific domain: the Socio-Economic domain, characterized by the least positive trend (red line in Figure 2), has been excluded from the calculation to better understand how much the perfect compensability of additive aggregation affects the overall UETI trend by compensating the low performance of the Socio-Economic domain with the high performances of the Energy and Environmental domains.
Figure 4 shows the sensitivity analysis results: the composite index does not vary significantly even in the presence of relevant weight variations (+80% of power grid quality weight with respect to the equal-weight allocation). The trajectory of C1 closely follows the trend of the reference case (EW), with moderate variations ranging between +5.9% (in 2014) and −1.0% (in 2019). On the contrary, C2 and C3 exhibit more pronounced variations compared to C1, as they entail more significant modifications in the structure of the composite index: C2 excludes sub-domains with the highest correlation, and C3 omits an entire domain. C2 variations vary in a range between +26.3% in 2014 and −12.3% in 2017, while C3 varies in a range between −25.3% in 2014 and +14.7% in 2019.
Ultimately, the analysis reveals that even with substantial modifications to weight allocation (C1) and to the structure of the composite index (C2 and C3), the variations in UETI remain limited, demonstrating the robustness of the composite index in the face of significant adjustments.
4.4. Policy Implications
This case study has revealed both strengths and weaknesses in Turin’s multi-dimensional evolution towards energy transition. As regards the energy domain, Turin shows a consistent improvement, particularly thanks to the significant penetration of renewables in the urban energy mix, the improvement in green mobility and in energy efficiency leading to a reduced energy intensity in all sectors (e.g., residential, transport, etc.). Power grid quality registered a continuous although modest improvement too. From an environmental perspective, there is a greater disparity between carbon emissions and resources management performances (land use, waste and water) compared to air quality trend. Indeed, air quality remains a persistent issue for the city of Turin, necessitating increased efforts, investments and specific measures to address this challenge effectively. Moreover, this study underscores the need for greater attention to the socio-economic dimension, especially concerning the health and well-being of citizens; often overlooked in favour of technical and economic objectives, social aspects are critical for achieving a truly sustainable transition.
Ultimately, this work underscores the relevance and utility of continuously monitoring the city’s evolution towards energy transition through a comprehensive index framework, encompassing not only the energy and environmental aspects but also the economic and social domains. Through consistent monitoring, weaknesses and criticalities can be easily identified and action priorities and investments can be established to advance a balanced energy transition. Therefore, the proposed method can support policymakers in identifying areas of action requiring greater efforts, prioritizing investments and promoting effective and targeted strategies to address the specific challenges faced by the city.
5. Conclusions
Cities will play a crucial role in speeding up the process of energy transition at a wider scale. The quantitative assessment and monitoring of city progress is essential for implementing evidence-informed policymaking, based on decisions grounded in reliable up-to-date information. Indeed, due to the complexity of the process, policymaking should be supported by rigorous science-based tools (methods and technologies) to plan tailored strategies, set targets and track the impacts of policies across the various domains involved in the transition (energy, environmental, society and economy). This study aims to respond to this necessity by proposing a flexible and comprehensive metric-based methodology to assess the energy transition performance at an urban scale. Various metric-based methodologies for monitoring energy transition at an urban scale are available in the literature, but too often the scarcity of urban data constrains the applicability of intricate and sophisticated methods. Furthermore, the intricacy of the methodology could serve as a barrier to effective communication and understanding among a wider and non-expert audience, hindering citizen and stakeholder engagement in the urban transition process.
This case study demonstrates, on one hand, the applicability of the method, and on the other hand, it pointed out the criticality of urban data scarcity.
As highlighted by the preliminary analysis conducted to assess the availability of open-source urban data, the city of Turin, like the majority of Italian municipalities, lacks a systematic data collection and organization system; therefore, the input data necessary to obtain the composite index (UETI) have been collected from 12 different data sources (Appendix A, Table A2) in various formats and time granularity.
The scarcity of urban data required the utilization of provincial- and regional-scale information: to address the lack of socio-economic data, information provided by ISTAT (National Institute of Statistics in Italy) was employed, even if these data primarily pertain to the regional and national scales. This serves as a compromise to overcome data scarcity, but it affects the actual performance of the city (e.g., low performance of energy poverty in Piedmont region impacts the performance of income of Turin).
The overall performance of the city of Turin presents a clear positive trend, mainly thanks to the Environmental and Energy domains, as confirmed by the correlation analysis, which showed that the UETI trend is mainly affected by the Energy and Environmental domains rather than the Socio-Economic trend. The sensitivity analysis proved the robustness of the composite index even in the presence of major modifications in weight allocation (C1) and in the framework structure (C2 and C3). It must be pointed out that to enhance the significance of sensitivity and correlation analyses, it is necessary to extend the sample of data currently limited to five years (2014–2019). Moreover, extending the time series would also improve the overall consistency of time-based Min–Max normalization, which rescales indicators into a 0–1 range according to the best and worst performances recorded in the period under study.
In perspective, developing a standardized data collection system and organizing urban information into a unique database, accessible by means of a simple interface, would be a powerful tool to explore and access municipal data, allowing for comparison among cities and for monitoring over time their UETI trend. Unlike the time-based Min–Max normalization employed in this paper to evaluate the UETI of a single city, when assessing UETI for a set of cities simultaneously, rescaling indicators according to the best and worst performances across cities could serve as incentive for positive competition and continuous collective improvement towards urban energy transition.
Author Contributions
Conceptualization, E.D.; Methodology, E.D.; Writing—original draft, E.D.; Writing—review & editing, E.B. and D.G.; Visualization, E.D.; Supervision, E.B. and D.G.; Project administration, E.B. and D.G. All authors have read and agreed to the published version of the manuscript.
Funding
This research received no external funding.
Data Availability Statement
The complete list of datasets used in the case study is provided in Appendix A, Table A2.
Conflicts of Interest
The authors declare no conflict of interest.
Appendix A

Table A1.
Performance indicators of the city of Turin (2014–2019).
| Performance Indicators | 2014 | 2015 | 2016 | 2017 | 2018 | 2019 |
|---|---|---|---|---|---|---|
| Installed RES capacity (MW) | 18.5 | 18.9 | 19.7 | 21.3 | 22.4 | 23.6 |
| Share RES in electricity consumption (%) | 4.8 | 4.2 | 3.7 | 3.0 | 3.3 | 3.2 |
| Duration of outages (-) | 21.5 | 19.8 | 31.0 | 25.4 | 28.7 | 25.7 |
| Average number of disconnections (-) | 1.2 | 1.4 | 1.3 | 1.7 | 1.4 | 1.4 |
| Power loss (%) | 6.1 | 5.9 | 4.7 | 3.9 | 4.2 | 4.2 |
| Number of RES-EV charging points (-) | 0.0 | 0.0 | 2.0 | 2.0 | 2.0 | 10.0 |
| Number of EV charging points over 1000 EV + HV private vehicles (-) | 4.0 | 3.8 | 4.3 | 15.6 | 45.9 | 53.5 |
| Number of EVs + hybrids over 1000 passenger vehicles (-) | 2.6 | 2.9 | 4.1 | 6.8 | 10.3 | 14.1 |
| Cycle lanes (km/100 km2) | 139.0 | 146.6 | 151.6 | 153.8 | 159.2 | 166.1 |
| Energy intensity residential sector (MWh/inhab) | 8.9 | 6.8 | 6.8 | 6.7 | 6.4 | 6.1 |
| Energy intensity tertiary sector (MWh/kEUR) | 0.2 | 0.2 | 0.2 | 0.2 | 0.2 | 0.2 |
| Energy intensity transport (MWh/inhab) | 3.2 | 3.2 | 3.2 | 3.1 | 3.2 | 2.9 |
| Energy intensity industry (MWh/kEUR) | 0.1 | 0.1 | 0.1 | 0.1 | 0.2 | 0.2 |
| Energy intensity municipal service (MWh/m2) | 3.6 | 3.3 | 3.0 | 2.8 | 2.8 | 2.6 |
| Green surface (ha/100,000 inhab) | 220.0 | 219.2 | 219.8 | 223.9 | 225.0 | 226.2 |
| Pedestrian areas (m2/100 inhab) | 139.0 | 146.6 | 151.6 | 153.8 | 159.2 | 166.1 |
| Municipal waste (kg/inhab) | 491.4 | 493.8 | 482.3 | 498.0 | 523.3 | 510.3 |
| Sorted waste (%) | 41.6 | 42.4 | 42.1 | 44.7 | 46.6 | 47.7 |
| Consumption (l/day·inhab) | 293.0 | 292.0 | 288.0 | 287.0 | 286.0 | 282.5 |
| Loss (%) | 22.4 | 24.6 | 24.7 | 24.6 | 25.0 | 22.2 |
| PM10 exceedances (n days/year) | 58.5 | 85.0 | 63.5 | 94.5 | 36.0 | 45.0 |
| NO2 concentration (μg/m3) | 39.5 | 40.5 | 37.5 | 38.5 | 33.0 | 35.0 |
| Carbon intensity (tCO2/inhab) | 3.9 | 3.5 | 3.4 | 3.4 | 3.1 | 3.0 |
| Deaths from respiratory system diseases (%) | 14.1 | 14.2 | 14.2 | 14.8 | 15.3 | 14.8 |
| Mortality rate (n deaths/10,000 inhab) | 103.1 | 113.6 | 106.6 | 113.5 | 114.7 | 115.5 |
| Energy–Environment Investments (%) | 4.9 | 3.7 | 4.9 | 3.3 | 9.0 | 9.7 |
| Energy–Environment Added value (EUR) | 1761.4 | 1795.4 | 1709.9 | 1836.2 | 1961.9 | 1899.7 |
| Energy–Environment Employment (%) | 4.4 | 4.3 | 4.2 | 4.2 | 4.2 | 4.3 |
| Income (kEUR/inhab) | 16.9 | 17.3 | 17.6 | 17.6 | 18.4 | 18.6 |
| Energy poverty (%) | 4.8 | 4.4 | 4.6 | 4.3 | 5.2 | 5.6 |
Table A2.
List of datasets and data sources.
| ID | Dataset Name | Data Source |
|---|---|---|
| DT1 | Dati di produzione e raccolta differenziata | ISPRA |
| DT2 | Dati sui costi di gestione dei rifiuti urbani (pro capite o per chilogrammo di rifiuto) | ISPRA |
| DT3 | Rifiuti_Produzione rifiuti speciali | ARPA PIEMONTE |
| DT4 | Aria—la qualità dell’aria in Piemonte (Misure) | ARPA PIEMONTE |
| DT5 | Bilancio di sostenibilità SMAT | SMAT |
| DT6 | Ambiente urbano—Verde Urbano | ISTAT |
| DT7 | Consumo del suolo | ISPRA |
| DT8 | Istat_Tavole_Censimento_acque_per_uso_civile | ISTAT |
| DT9 | Catasto Impianti Termici | REGIONE PIEMONTE |
| DT10 | Iren—Bilancio di sostenibilità | IREN |
| DT11 | Ambiente urbano—Energia | ISTAT |
| DT12 | Dichiarazione non finanziaria | GTT |
| DT13 | Autoritratto_2021—Circolante_Copert_2021 | ACI |
| DT14 | Open Parco Veicoli | ACI |
| DT15 | Ambiente urbano—Mobilità | ISTAT |
| DT16 | Ambiente urbano—Eco management (dati su illuminazione pubblica) | ISTAT |
| DT17 | Consumi energetici, Impianti e Attestazione di Prestazione Energetica—APE | REGIONE PIEMONTE |
| DT18 | Popolazione residente ricostruita—Anni 2002–2019 | ISTAT |
| DT19 | Reddito e principali variabili IRPEF su base subcomunale/comunale | MINISTERO DELL’ECONOMIA E FINANZE |
| DT20 | Mortalità per cause | REGIONE PIEMONTE |
| DT21 | Mortalità per territorio di evento | ISTAT |
| DT22 | AAEP—Anagrafe delle Attività Economiche Produttive—Consultazione | REGIONE PIEMONTE |
| DT23 | Principali aggregati territoriali di Contabilità Nazionale—Valore aggiunto per branca di attività | ISTAT |
| DT24 | Imprese e addetti | ISTAT |
| DT25 | Principali aggregati territoriali di Contabilità Nazionale—Investimenti fissi, lordi, interni e Spesa per consumi finali delle amministrazioni pubbliche | ISTAT |
| DT26 | TAPE | COMUNE DI TORINO |
| DT27 | Torino—Informacasa | COMUNE DI TORINO |
| DT28 | Analisi del potenziale solare per i comuni dell’area metropolitana torinese | PROVINCIA DI TORINO |
| DT29 | Relazione annuale relativa al funzionamento e alla sorveglianza dell’impianto—Termovalorizzatore Gerbido | IREN |
| DT30 | Dichiarazione ambientale—Centrale di cogenerazione Torino Nord | IREN |
| DT31 | Dichiarazione ambientale—Centrale di cogenerazione Moncalieri | IREN |
| DT32 | STATO D’AVANZAMENTO ATTIVITA’ DISCARICA E ATTIVITÀ DI GESTIONE DEL BIOGAS | AMIAT |
| DT33 | Annuario Statistico—Settore toponomastica e edilizia | COMUNE DI TORINO |
| DT34 | INDAGINE SULLE SPESE DELLE FAMIGLIE: MICRODATI AD USO PUBBLICO | ISTAT |
References
- United Nations. Sustainability. Available online: https://www.un.org/en/academic-impact/sustainability#:~:text=In%201987%2C%20the%20United%20Nations,to%20meet%20their%20own%20needs.%E2%80%9D (accessed on 22 May 2023).
- Science-Based Climate Targets: A Guide For Cities Science-Based Targets For Climate: A Guide For Cities 2 Contents. 2020. Available online: https://sciencebasedtargetsnetwork.org/wp-content/uploads/2021/04/SBTs-for-cities-guide.pdf (accessed on 1 January 2024).
- EU Parliament and EU Council. European Climate Law. Available online: https://eur-lex.europa.eu/legal-content/EN/TXT/?uri=CELEX%3A32021R1119 (accessed on 30 June 2021).
- Gan, X.; Fernandez, I.C.; Guo, J.; Wilson, M.; Zhao, Y.; Zhou, B.; Wu, J. When to use what: Methods for weighting and aggregating sustainability indicators. Ecol. Indic. 2017, 81, 491–502. [Google Scholar] [CrossRef]
- Renewable Energy Agency. World Energy Transitions Outlook 1.5 °C Pathway. 2021. Available online: www.irena.org (accessed on 1 January 2024).
- World Economic Forum (WEF). Fostering Effective Energy Transition 2021. 2021. Available online: https://www.weforum.org/reports/fostering-effective-energy-transition-2021/in-full (accessed on 1 July 2022).
- World Energy Council. World Energy Trilemma Index Report. 2019. Available online: www.worldenergy.org (accessed on 1 January 2024).
- European Commission. Transitions Performance Inde; EU Publications: Luxembourg, 2021. [Google Scholar] [CrossRef]
- European Climate Foundation. Net-Zero 2050. Available online: https://europeanclimate.org/net-zero-2050/ (accessed on 19 May 2023).
- Burck, J.; Hagen, U.; Bals, C.; Höhne, N.; Nascimento, L. Climate Change Performance Index 2021: Background and Methodology. Available online: www.newclimate.org (accessed on 1 January 2024).
- ISO 37120; Sustainable Cities and Communities-Indicators for City Services and Quality of Life. ISO: Geneva, Switzerland, 2018.
- ISO 37122; Sustainable Cities and Communities-Indicators for Smart Cities. ISO: Geneva, Switzerland, 2019.
- ISO 37123; Sustainable Cities and Communities-Indicators for Resilient Cities. ISO: Geneva, Switzerland, 2019.
- Airaksinen, M.; Huovila, A. CITYkeys indicators for smart city projects and smart cities. CITYkeys Rep. 2017, 14–47. [Google Scholar] [CrossRef]
- REnaissance of Places with Innovative Citizenship And Technology (REPLICATE EU project). 2017. Available online: https://cordis.europa.eu/project/id/691735 (accessed on 1 January 2024).
- POCITYF. Available online: https://cordis.europa.eu/project/id/864400 (accessed on 22 May 2023).
- IRIS Project. Available online: https://cordis.europa.eu/project/id/774199 (accessed on 22 May 2023).
- SmartEnCity. Available online: https://cordis.europa.eu/project/id/691883 (accessed on 22 May 2023).
- Angelakoglou, K.; Kourtzanidis, K.; Giourka, P.; Apostolopoulos, V.; Nikolopoulos, N.; Kantorovitch, J. From a comprehensive pool to a project-specific list of key performance indicators for monitoring the positive energy transition of smart cities—An experience-based approach. Smart Cities 2020, 3, 705–735. [Google Scholar] [CrossRef]
- Efkarpidis, N.; Goranović, A.; Yang, C.-W.; Geidl, M.; Herbst, I.; Wilker, S.; Sauter, T. A Generic Framework for the Definition of Key Performance Indicators for Smart Energy Systems at Different Scales. Energies 2022, 15, 1289. [Google Scholar] [CrossRef]
- Anthopoulos, L.; Kazantzi, V. Urban energy efficiency assessment models from an AI and big data perspective: Tools for policy makers. Sustain. Cities Soc. 2022, 76, 103492. [Google Scholar] [CrossRef]
- Zhang, L.; Bai, W.; Xiao, H.; Ren, J. Measuring and improving regional energy security: A methodological framework based on both quantitative and qualitative analysis. Energy 2021, 227, 120534. [Google Scholar] [CrossRef]
- Chun, Y.; Zhang, J.; Sun, B. Evaluation of carbon neutrality capacity based on a novel comprehensive model. Environ. Sci. Pollut. Res. 2023, 30, 3953–3968. [Google Scholar] [CrossRef]
- Kourtzanidis, K.; Angelakoglou, K.; Apostolopoulos, V.; Giourka, P.; Nikolopoulos, N. Assessing impact, performance and sustainability potential of smart city projects: Towards a case agnostic evaluation framework. Sustainability 2021, 13, 7395. [Google Scholar] [CrossRef]
- Marquez-Ballesteros, M.J.; Mora-López, L.; Lloret-Gallego, P.; Sumper, A.; Sidrach-de-Cardona, M. Measuring urban energy sustainability and its application to two Spanish cities: Malaga and Barcelona. Sustain. Cities Soc. 2019, 45, 335–347. [Google Scholar] [CrossRef]
- Molinaro, R.; Najjar, M.K.; Hammad, A.W.A.; Haddad, A.; Vazquez, E. Urban Development Index (UDI): A comparison between the city of Rio de Janeiro and four other global cities. Sustainability 2020, 12, 823. [Google Scholar] [CrossRef]
- Analisi Trimestrale del Sistema Energetico Italiano. Available online: https://www.pubblicazioni.enea.it/le-pubblicazioni-enea/analisi-trimestrale-del-sistema-energetico-italiano.html (accessed on 22 May 2023).
- Shen, Y.; Shi, X.; Zhao, Z.; Xu, J.; Sun, Y.; Liao, Z.; Li, Y.; Shan, Y. A dataset of low-carbon energy transition index for Chinese cities 2003–2019. Sci. Data 2023, 10, 1–10. [Google Scholar] [CrossRef] [PubMed]
- The Arcadis Sustainable Cities Index. 2022. Available online: https://www.arcadis.com/en/knowledge-hub/perspectives/global/sustainable-cities-index (accessed on 21 February 2024).
- IMD Smart City Index (SCI). 2021. Available online: https://www.imd.org/smart-city-observatory/home/2021/#:~:text=Smart%20City%20Index%202021,-The%20third%20edition&text=Taking%20the%20top%20three%20places,Geneva%20in%208th%20place.&text=What%20does%20it%20mean%20if%20your%20city%20is%20%E2%80%9Csmart%E2%80%9D%3F (accessed on 21 February 2024).
- Global City Index GCI. 2022. Available online: https://www.kearney.com/service/global-business-policy-council/gcr/2022-full-report (accessed on 21 February 2024).
- IESE Cities in Motion Index. 2022. Available online: https://www.iese.edu/media/research/pdfs/ST-0633-E.pdf (accessed on 21 February 2024).
- D’Adamo, I.; Gastaldi, M.; Ioppolo, G.; Morone, P. An analysis of Sustainable Development Goals in Italian cities: Performance measurements and policy implications. Land Use Policy 2022, 120, 106278. [Google Scholar] [CrossRef]
- Ecosistema-Urbano-2023. Available online: https://www.legambientefaenza.it/ambiente/2023/10/ecosistema-urbano-2023/ (accessed on 21 February 2024).
- Muscillo, A.; Re, S.; Gambacorta, S.; Ferrara, G.; Tagliafierro, N.; Borello, E.; Rubino, A.; Facchini, A. An open data index to assess the green transition—A study on all Italian municipalities. Ecol. Econ. 2023, 212, 107924. [Google Scholar] [CrossRef]
- Cavalli, L.; Farnia, L.; Lizzi, G.; Romani, I.; Alibegovic, M.; Vergalli, S. Luglio 2020 Report L’SDSN Italia SDGs City Index per un’Italia Sostenibile: Report di Aggiornamento. Available online: https://econpapers.repec.org/article/femfrepor/2020.07-06.htm (accessed on 21 February 2024).
- European Commission. Sustainable Development Goals (SDGs). Available online: https://commission.europa.eu/strategy-and-policy/sustainable-development-goals_en (accessed on 21 February 2024).
- Pareto, A.; Mazziotta, M. Methods for Constructing Composite Indices: One for All or All for One? Methods for Constructing Composite Indices: One for All or All for One? 1. 2013. Available online: https://www.researchgate.net/publication/281106596 (accessed on 1 January 2024).
- EUROSTAT. Statistics Explained: Glossary. Available online: https://ec.europa.eu/eurostat/statistics-explained/index.php?title=Glossary:Energy_intensity (accessed on 15 September 2023).
- European Commission; Joint Research Centre; Organisation for Economic Co-operation and Development. Handbook on Constructing Composite Indicators: Methodology and User Guide; OECD: Paris, France, 2008. [Google Scholar]
- European Commission. Competence Centre on Composite Indicators and Scoreboards—Step 5: Normalisation. Available online: https://knowledge4policy.ec.europa.eu/composite-indicators/10-step-guide/step-5-normalisation_en (accessed on 13 September 2023).
- Quijano, A.; Hernández, J.L.; Nouaille, P.; Virtanen, M.; Sánchez-Sarachu, B.; Pardo-Bosch, F.; Knieilng, J. Towards Sustainable and Smart Cities: Replicable and KPI-Driven Evaluation Framework. Buildings 2022, 12, 233. [Google Scholar] [CrossRef]
- Becker, W.; Saisana, M.; Paruolo, P.; Vandecasteele, I. Weights and importance in composite indicators: Closing the gap. Ecol. Indic. 2017, 80, 12–22. [Google Scholar] [CrossRef] [PubMed]
- Environmental Perfomance Index. Available online: https://epi.yale.edu/ (accessed on 22 May 2023).
- Human Development Index. Available online: https://hdr.undp.org/data-center/human-development-index#/indicies/HDI (accessed on 22 May 2023).
- European Commission. Competence Centre on Composite Indicators and Scoreboards—Step 6: Weighting. Available online: https://knowledge4policy.ec.europa.eu/composite-indicators/10-step-guide/step-6-weighting_en (accessed on 13 September 2023).
- Antolín, J.; de Torre, C.; García-Fuentes, M.; Pérez, A.; Tomé, I.; Mirantes, M.L.; Hoyos, E. Development of an Evaluation Framework for Smartness and Sustainability in Cities. Sustainability 2020, 12, 5193. [Google Scholar] [CrossRef]
- Bonnet, J.; Coll-Martínez, E.; Renou-Maissant, P. Evaluating Sustainable Development by Composite Index: Evidence from French Departments. Sustainability 2021, 13, 761. [Google Scholar] [CrossRef]
- Prevost, S.; Benavente, D.; Stevenson, A.; Caperna, G.; Panella, F.; European Commission. Directorate-General for Research and Innovation, Transitions Performance index 2021: Towards Fair and Prosperous Sustainability. Available online: https://research-and-innovation.ec.europa.eu/strategy/support-policy-making/support-national-research-and-innovation-policy-making/transitions-performance-index-tpi_en (accessed on 1 January 2024).
- European Commission. Competence Centre on Composite Indicators and Scoreboards—Step 7: Aggregating indicators. Available online: https://knowledge4policy.ec.europa.eu/composite-indicators/10-step-guide/step-7-aggregating-indicators_en (accessed on 31 August 2023).
- Piano d’Azione per l’Energia Sostenibile ed il Clima (PAESC) Città di Torino. Available online: https://servizi.comune.torino.it/consiglio/prg/intranet/display_testi.php?doc=A-P202300598:110302 (accessed on 23 January 2024).
- Bianciardi, G.; Cortassa, C.; Ellena, G.; Iacono, M.; Scarzello, R.; Pagani, R.; Savio, L. Piano D’azione per L’energia Sostenibile. 2010. Available online: https://iris.polito.it/handle/11583/2491508 (accessed on 21 February 2024).
- European Commission. EU Mission: Climate-Neutral and Smart Cities. Available online: https://research-and-innovation.ec.europa.eu/funding/funding-opportunities/funding-programmes-and-open-calls/horizon-europe/eu-missions-horizon-europe/climate-neutral-and-smart-cities_en (accessed on 14 September 2023).
- Laurenti, M.; Nuglio, S.; Poggio, A. Mal’Aria di Città. Available online: https://legambiente.campania.it/2024/02/08/malaria-di-citta-2024-i-nuovi-dati-sullinquinamento-atmosferico-nelle-citta-campane/ (accessed on 21 February 2024).
- European Environment Agency (EEA). European City Air Quality Viewer. Available online: https://www.eea.europa.eu/themes/air/urban-air-quality/european-city-air-quality-viewer (accessed on 14 September 2023).
- Faiella, I.; Lavecchia, L. La Povertà Energetica in Italia. 2014. Available online: https://www.bancaditalia.it/pubblicazioni/qef/2014-0240/QEF_240.pdf (accessed on 21 February 2024).
- European Commission. Energy Poverty in the EU. Available online: https://energy.ec.europa.eu/topics/markets-and-consumers/energy-consumer-rights/energy-poverty-eu_en (accessed on 25 September 2023).
Figure 1.
The UETI index conceptual framework: domains and sub-domains.
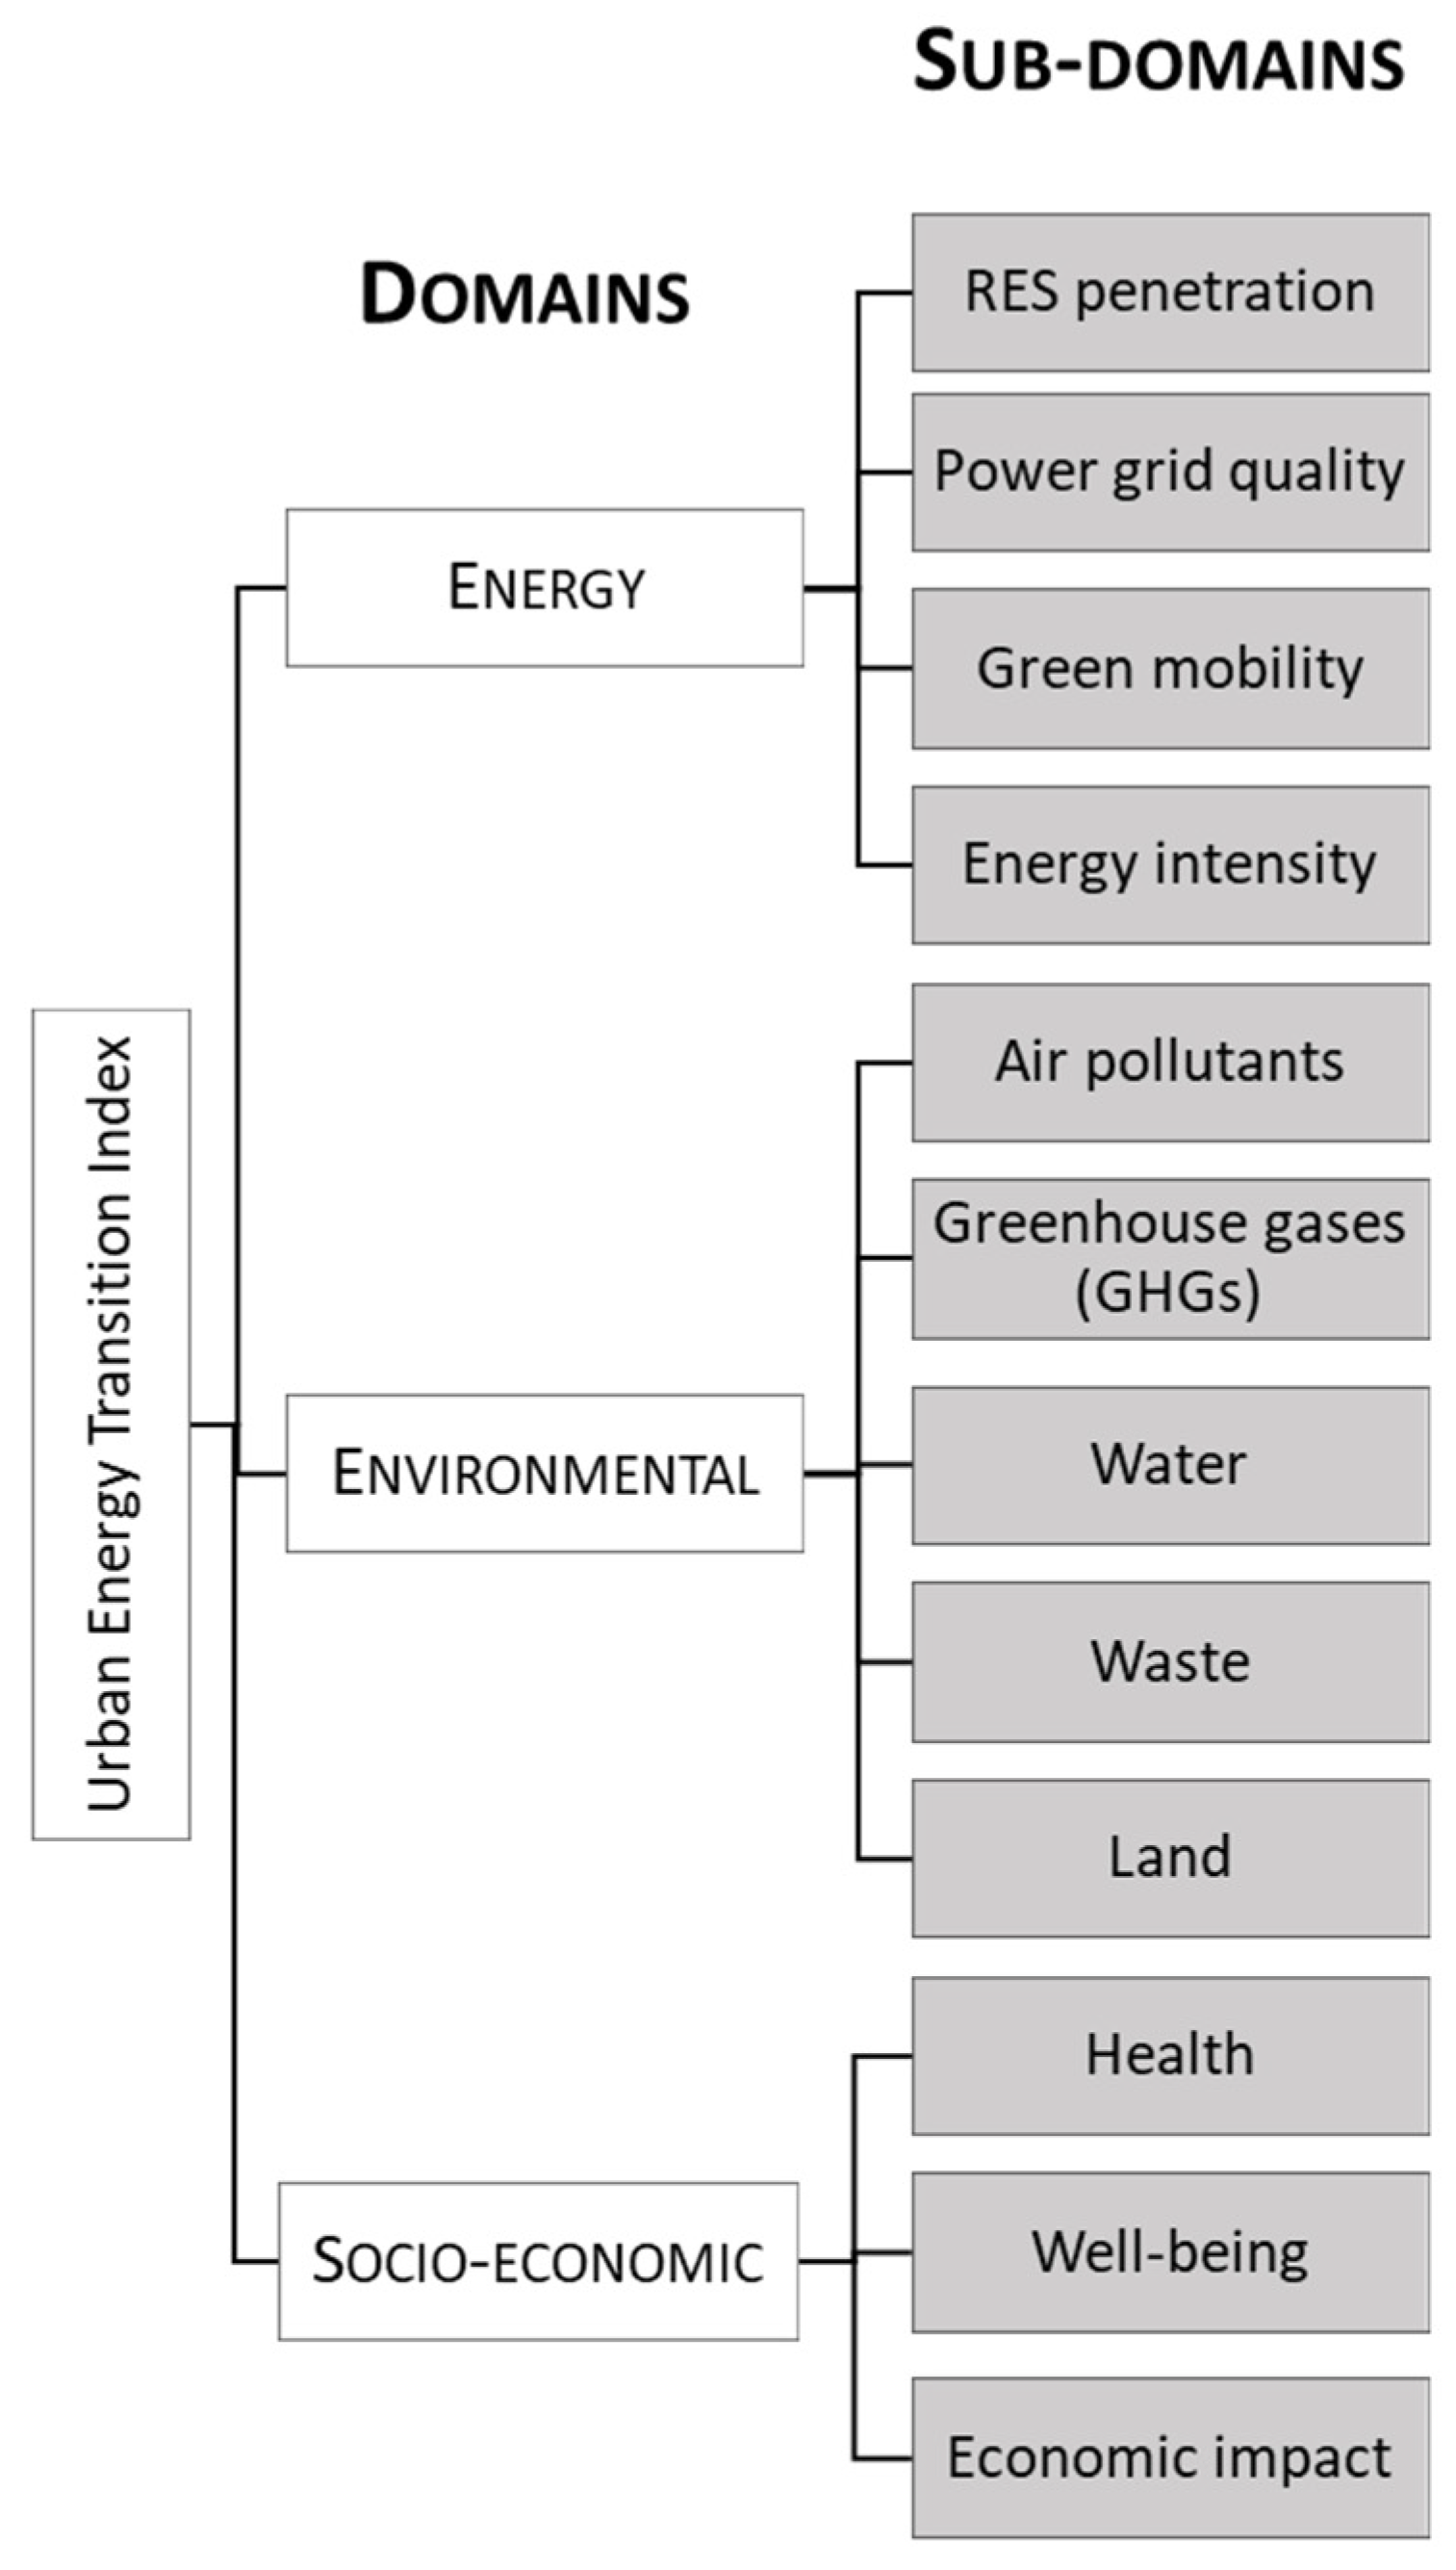
Figure 2.
Evolution of UETI and its three domains (2014–2019).

Figure 3.
Comparison of UETI’s trend with Ecosistema Urbano’s trend over time (2014–2019).

Figure 4.
Sensitivity analysis results.

Table 1.
Selected performance indicators by sub-domain.
| Sub-Domains | Performance Indicators |
|---|---|
| RES penetration | Installed RES capacity (MW) |
| Share RES in electricity consumption (%) | |
| Power grid quality | Duration of outages (-) |
| Average number of disconnections (n.) | |
| Power loss (%) | |
| Green mobility | Number of RES-EV charging points (n.) |
| Number of EV charging points over 1000 EV + HV private vehicles (n.) | |
| Number of EVs + HVs over 1000 passenger vehicles (-) | |
| Cycle lanes (km/100 km2) | |
| Energy intensity | Energy intensity residential sector (MWh/inhab) |
| Energy intensity tertiary sector (MWh/kEUR) | |
| Energy intensity transport (MWh/Mpkm) | |
| Energy intensity industry (MWh/kEUR) | |
| Energy intensity municipal service (MWh/m2) | |
| Land use | Green coverage (ha/100,000 inhab) |
| Pedestrian areas (m2/100 inhab) | |
| Waste | Municipal waste (kg/inhab) |
| Sorted waste (%) | |
| Water | Water consumption (l/day·inhab) |
| Water loss (%) | |
| Air pollutants | PM10 exceedances (n. days/year) |
| NO2 concentration (μg/m3) | |
| GHGs | Carbon intensity (tCO2/inhab) |
| Health | Deaths from respiratory system diseases (%) |
| Mortality rate (n deaths/10,000 inhab) | |
| Economic impact | Energy–Environment Investments (%) |
| Energy–Environment Added Value (EUR) | |
| Energy–Environment Employment (%) | |
| Well-being | Income (kEUR/inhab) |
| Energy poverty (%) |
Table 2.
Trend of Turin’s UETI over time (2014–2019).
| 2014 | 2015 | 2016 | 2017 | 2018 | 2019 | |
|---|---|---|---|---|---|---|
| RES penetration | 0.50 | 0.37 | 0.29 | 0.27 | 0.44 | 0.55 |
| Power grid quality | 0.62 | 0.58 | 0.47 | 0.50 | 0.57 | 0.61 |
| Green mobility | 0.00 | 0.08 | 0.20 | 0.34 | 0.62 | 1.00 |
| Energy intensity | 0.21 | 0.58 | 0.65 | 0.74 | 0.52 | 0.83 |
| Energy index | 0.33 | 0.40 | 0.40 | 0.46 | 0.54 | 0.75 |
| Land use | 0.05 | 0.14 | 0.27 | 0.61 | 0.79 | 1.00 |
| Waste | 0.39 | 0.43 | 0.54 | 0.56 | 0.41 | 0.66 |
| Water | 0.46 | 0.12 | 0.29 | 0.36 | 0.33 | 1.00 |
| Air pollutants | 0.37 | 0.08 | 0.46 | 0.13 | 1.00 | 0.79 |
| GHGs | 0.00 | 0.46 | 0.49 | 0.53 | 0.85 | 1.00 |
| Environmental index | 0.26 | 0.25 | 0.41 | 0.44 | 0.68 | 0.89 |
| Health | 1.00 | 0.56 | 0.82 | 0.30 | 0.03 | 0.20 |
| Economic impact | 0.49 | 0.30 | 0.11 | 0.17 | 0.68 | 0.81 |
| Well-being | 0.30 | 0.59 | 0.59 | 0.72 | 0.62 | 0.50 |
| Socio-economic index | 0.59 | 0.48 | 0.50 | 0.40 | 0.44 | 0.50 |
| UETI | 0.39 | 0.38 | 0.44 | 0.43 | 0.55 | 0.71 |
Table 3.
Pearson correlation coefficient between the UETI, its domains and sub-domains.
| Correlation Analysis Ranges | |||
|---|---|---|---|
| Very Weak |r| ≤ 0.19 | Weak |r| = 0.2–0.39 | Moderate |r| = 0.4–0.59 | Strong or Very Strong |r| ≥ 0.60 |
| 22% | 11% | 6% | 61% |
| Correlation of Urban Energy Transition Index (UETI) with its domains: | |||
| DOMAINS | r | ||
| Energy | 0.97 | ||
| Environmental | 0.98 | ||
| Socio-Economic | −0.12 | ||
| Correlation of Energy Index with its sub-domains: | |||
| SUB-DOMAINS | r | ||
| RES penetration | 0.49 | ||
| Power grid quality | 0.27 | ||
| Green mobility | 0.98 | ||
| Energy intensity | 0.73 | ||
| Correlation of Environmental Index with its sub-domains: | |||
| SUB-DOMAINS | r | ||
| Land use | 0.96 | ||
| Waste | 0.62 | ||
| Water | 0.77 | ||
| Air pollutants | 0.79 | ||
| GHGs | 0.89 | ||
| Correlation of Socio-Economic Index with its sub-domains: | |||
| SUB-DOMAINS | r | ||
| Health | 0.75 | ||
| Economic impact | 0.21 | ||
| Well-being | −0.96 | ||
Table 4.
Sensitivity analysis scheme.
| Case | Objective | Description |
|---|---|---|
| C1 |
|
|
| C2 | Omitting the sub-domains with the strongest correlations to assess how their exclusion impacts the overall composite index | Excluding the sub-domains with the strongest correlation (green mobility, land use, well-being) |
| C3 | Understanding how the exclusion of a specific domain influences the score of UETI | Excluding one specific domain (Socio-Economic) and measuring the perfect compensability effect from additive aggregation |
1 EW: equal-weight allocation.
Disclaimer/Publisher’s Note: The statements, opinions and data contained in all publications are solely those of the individual author(s) and contributor(s) and not of MDPI and/or the editor(s). MDPI and/or the editor(s) disclaim responsibility for any injury to people or property resulting from any ideas, methods, instructions or products referred to in the content. |
© 2024 by the authors. Licensee MDPI, Basel, Switzerland. This article is an open access article distributed under the terms and conditions of the Creative Commons Attribution (CC BY) license (https://creativecommons.org/licenses/by/4.0/).
Share and Cite
MDPI and ACS Style
Desogus, E.; Bompard, E.; Grosso, D. A Composite Index for Tracking the Evolution towards Energy Transition at Urban Scale: The Turin Case Study. Energies 2024, 17, 1281. https://doi.org/10.3390/en17061281
AMA Style
Desogus E, Bompard E, Grosso D. A Composite Index for Tracking the Evolution towards Energy Transition at Urban Scale: The Turin Case Study. Energies. 2024; 17(6):1281. https://doi.org/10.3390/en17061281
Chicago/Turabian StyleDesogus, Eleonora, Ettore Bompard, and Daniele Grosso. 2024. "A Composite Index for Tracking the Evolution towards Energy Transition at Urban Scale: The Turin Case Study" Energies 17, no. 6: 1281. https://doi.org/10.3390/en17061281
Note that from the first issue of 2016, this journal uses article numbers instead of page numbers. See further details here.