
Breakdown Performance Evaluation and Lifetime Prediction of XLPE Insulation in HVAC Cables
by
 ,
,
Zhonglei Li
1 ,
,
Yuming Dong
1, 
You Wu
1,
Zhengzheng Meng
2,
Pengxian Song
2,
Mingzheng Zhu
2,
Xu Li
2 and
Boxue Du
1,* 1
Key Laboratory of Smart Grid of Ministry of Education, School of Electrical and Information Engineering, Tianjin University, Tianjin 300072, China
2
Electric Power Research Institute, State Grid Tianjin Electric Power Company, Tianjin 300384, China
*
Author to whom correspondence should be addressed.
Energies 2024, 17(6), 1337; https://doi.org/10.3390/en17061337
Submission received: 26 January 2024
/
Revised: 3 March 2024
/
Accepted: 5 March 2024
/
Published: 11 March 2024
(This article belongs to the Special Issue Power Cables in Energy Systems)
Abstract
:This article presents the recent developments in the field of evaluation of the breakdown performance and remaining lifetime of XLPE insulation and analyzes the accuracy of existing lifetime prediction models through experiments. The effects of the crystalline morphology, cable thickness and sampling location of XLPE insulation on the evaluation of short-term breakdown performance are reviewed in the context of the experiments. The study reviews the application of the Ramu, Simoni, and Ramu multi-stress lifetime prediction models and explores the other remaining lifetime prediction models under the combined electrothermal stresses which are applicable to XLPE insulation. Finally, this paper recommends the most effective engineering evaluation methods and provides suggestions for improving the electrical performance of XLPE insulation for high-voltage cables.
1. Introduction
Insulated high-voltage cables are widely used in urban power systems and play an important role in power transmission and distribution [1,2]. The reliability of cable insulation is vital to the stability of urban power systems and directly impacts the lives of users and the social economy. In the case of an insulation breakdown, cable lines are completely depowered. For instance, New York experienced widespread outages affecting up to 70,000 people in 2019 due to insulation deterioration of a 13 kV cable [3]. Similarly, Shanghai suffered a large power outage in the central city and hundreds of millions of dollars in economic losses in 2013 due to a 500 kV high-voltage cable insulation failure [4]. Some cables in the power system have been in operation for more than 30 years [5]. Therefore, power companies urgently need to evaluate and analyze the reliability of these cables. It is essential to effectively estimate the reliability of cables by assessing the breakdown performance and predicting the lifetime of XLPE cable insulation.
Short-term breakdown tests are widely used in the assessment of the insulation performance of cross-linked polyethylene (XLPE) cables [6]. However, the results obtained from the short-term breakdown test are significantly affected by the XLPE insulation’s crystalline morphology, thickness and radial position from the center axis of the cable [7]. A water tree was found to grow faster in insulation with larger spherical crystals, indicating that the size of spherical crystals affects the formation process of water trees [8]. A study of the preparation process of XLPE materials showed that cooling rate is a key factor affecting crystallization morphology [9]. The breakdown strength and space charge distribution of low-density polyethylene (LDPE) specimens with thicknesses of 0.1 and 0.18 mm were found to be significantly different, indicating that insulation thickness significantly affects breakdown strength [10]. Analysis of XLPE cable insulation in different radial positions shows that the content of cross-linked byproducts varies with the radial position of the insulation and thus directly affects the electrical properties of the material [11]. Therefore, the crystalline morphology, thickness and radial position of the insulation layer are vital to the insulation performance evaluation of XLPE insulation for high-voltage cables.
Insulation failure of High-Voltage Alternating Current (HVAC) cables results from combined electrothermal factors acting over a long period of time [12,13]. Previous studies have shown that short-term breakdown tests, which reflect the insulation performance of materials, do not accurately predict the length of their lifetime under prolonged stress. Moreover, there are many types of remaining lifetime prediction models for materials under combined electrothermal fields, but there are no unanimously approved lifetime prediction models suitable for XLPE insulation. The researchers conducted a comparative study between XLPE and SiO2 nanocomposite XLPE and found that the voltage withstand index of nano-XLPE, which has a higher short-term breakdown strength, is only 10.76, compared to 13.58 for XLPE, which results in the nano-XLPE being the first to break down at lower electrical field strengths [14]. The long-term breakdown characteristics of cross-linked polyethylene cables must therefore be taken into account when evaluating their insulation performance. Predicting the remaining lifetime of insulation materials under electrical stress has been widely studied [15]. The voltage endurance coefficient (VEC) is usually used to express the resistance of XLPE insulation under electrical stress [16]. The insulation lifetime of XLPE cables under electrical stress was investigated and it was shown that the electrical field strength–lifetime relationship (E–t) for XLPE insulation could be divided into three zones, each satisfying the inverse power model (IPM) [17]. The VEC of XLPE is usually determined from the E–t characteristics of the insulation. The prediction of the remaining lifetime of XLPE insulation under a single source of thermal stress is typically based on the Arrhenius equation [18]. Some studies have carried out thermal aging tests on XLPE insulation at 90 °C and 105 °C and predicted the lifetime of the two materials based on the Arrhenius formula with elongation at break [19]. The insulation aging process is influenced by both electrical and thermal fields, thus affecting the insulation failure time. Other studies have investigated the prediction of insulation lifetime under combined electrothermal stresses and have proposed multifactor aging lifetime prediction models such as the Simoni, Fallou and Ramu models [18,20,21]. However, there is no available lifetime prediction model that is applicable to XLPE under electrothermal stress. The E–t characteristics and remaining lifetime prediction models for XLPE insulation under combined electrothermal stresses remain in need of investigation.
Short-term breakdown characteristics and remaining lifetime prediction models are widely used to evaluate the insulation characteristics of cables. The influences of the selection of cable insulation specimens and the method of analyzing the results of insulation performance evaluation still require further investigation. This paper consists of two main parts: the first part mainly focuses on the multiple factors affecting the short-term breakdown strength of XLPE, and the second part analyzes the long-term lifetime prediction models applicable to XLPE in conjunction with experiments. This paper investigates the following factors affecting the evaluation of XLPE insulation performance: crystallization morphology at different cooling rates, insulation thickness, and insulation at radial positions of different distances from the cable axis. Secondly, the remaining lifetime prediction models for XLPE insulation under electrical and combined electrothermal stresses are analyzed and the reliability of the existing lifetime prediction models is investigated. Finally, based on the results of the study, this paper proposes the influencing factors and related methods in the evaluation process of XLPE insulation performance, and provides engineering guidance ideas for the improvement of XLPE cable insulation performance.
Section 2 describes the specimen preparation and test methods. Section 3 describes the short-term breakdown characteristics in terms of XLPE crystalline morphology, insulation thickness and radial position of the cable, respectively. In Section 4, the remaining lifetime models of combined electrical and electrothermal stresses are investigated. Section 5 provides guidance on engineering evaluation methods for XLPE insulation characteristics based on the studies that have been conducted. Section 6 then discusses the limitations of the research in this paper.
2. Methods
2.1. Sample Preparation
In this investigation, XLPE manufactured by Borealis (Vienna, Austria) was used as the research subject. The composite insulation material was subjected to pre-pressing in a plate vulcanizing press at 125 °C and 15 MPa. The cross-linking reaction was then carried out at 180 °C and 20 MPa. Finally, different cooling methods were adopted to cool the samples completed with cross-linking, in order to obtain XLPE samples with different cooling times. The XLPE crystallization process was achieved using the following four cooling methods: ice water cooling (IC), air convection cooling (AC), natural cooling (NC), and oil cooling (OC), with cooling rates of 32, 10, 4 and 1 °C/min, respectively.
2.2. Physiochemical Properties Test Methods
This part of the test consists of scanning electron microscopy (SEM) observations, differential scanning calorimetry (DSC) and Fourier transform infrared spectroscopy (FTIR) studies. Before the SEM test, the amorphous area of the surface needs to be etched first, and then the surface of the sample needs to be cleaned in order to observe the crystalline morphology properly. The DSC test provides information on the crystallinity of the material. Nitrogen was used as a protective gas during the experiment, the temperature range was 40–150 °C, and the lift temperature rate was 20 °C/min. In order to eliminate the thermal history and residual stress, each specimen was subjected to two lift temperature cycle tests. FTIR testing can characterize the functional chemical groups of the material and obtain the patterns of chemical bonding and functional group changes in XLPE insulation. The absorbance wavelength range was set from 400 cm−1 to 4000 cm−1.
2.3. Electrical Performance Test Methods
The electrical performance test in this paper includes an alternating current (AC) breakdown test and long-term withstand voltage test. A “ball-plate” electrode configuration is employed for the AC breakdown testing. The AC voltage is progressively increased at a ramp rate of 500 V/s. To ensure statistical reliability, 15 breakdown events are induced for each insulation sample and the characteristic breakdown strength is subsequently quantified using a Weibull distribution. The long-term voltage withstand test is carried out based on the E–t characteristics of the XLPE insulation. A constant voltage is applied to the XLPE insulation to obtain the insulation failure time at a specified temperature. To ensure the reliability of the experimental results, no less than ten remaining lifetime experimental results were obtained for each group of tests.
3. Short-Term Breakdown Performance Evaluation
3.1. Effect of Crystalline Morphology
As a material with a semicrystalline structure, the crystalline morphology of XLPE is a key factor in its breakdown strength. In this section, XLPE samples prepared by the four cooling methods were analyzed and studied. Figure 1(a1–a4) shows scanning electron microscopy (SEM) results of XLPE samples with different cooling rates. The cooling rate strongly influences the spherical crystal size of XLPE. Ice-water cooling produces the smallest XLPE spheres, with an average diameter of approximately eight μm, and a large spherical size dispersion. The diameter of the spherical crystals in the XLPE increases with decreasing cooling rate to 8, 9, 12 and 16 μm, and the arrangement of crystal regions becomes more regular. In addition, shattered crystals are distributed around the spherical crystals of the ice-cooled XLPE specimens, possibly due to insufficient growth of the crystal zones resulting from the rapid crystallization rate.
XLPE specimens with different cooling rates were measured using differential scanning calorimetry (DSC) to quantify the crystallinity of XLPE. Figure 1b shows the DSC results for XLPE with different cooling rates. It shows that XLPE has only one melt peak at 100 to 110 °C. The melt peak gradually shifts to the right as the cooling rate decreases. The crystallinity of XLPE decreases with decreasing cooling rate, reaching 35.6% for the oil-cooled samples compared to the 28.3% crystallinity for the ice-cooled samples. This occurs due to the slow cooling rate, which allows the XLPE to crystallize more fully, resulting in an increase in both the size and crystallinity of the spherical crystals. The increase in crystallinity and the regular arrangement of the molecules leads to increases in intermolecular forces and melting temperature.
The AC breakdown experiments were carried out on XLPE samples with different crystalline morphologies, and 15 experiments were conducted for each type of sample. Figure 2 shows the relationship between the AC breakdown strength and the spherical crystal sizes of XLPE specimens with different crystalline morphologies at 30, 50, 70 and 90 °C. The upper and lower boundaries of the boxes in the figure correspond to the upper and lower quartiles of the breakdown strength, while the horizontal lines indicate the maximum and minimum values of the experimental results and the white circles in the middle correspond to the characteristic breakdown strength with a breakdown probability of 63.2%. The longer length of the box corresponds to the greater dispersion of the experimental data. The crystalline morphology of the XLPE directly impacts the AC breakdown strength, which decreases as the size of the spherical crystals decreases. As the temperature increases, the breakdown strength decreases more significantly for XLPE specimens with small spherical crystal sizes such that the material is more likely to break down under the same temperature.
The AC breakdown results are attributed to the differences in the crystalline morphology of XLPE. The breakdown process of XLPE occurs mainly in the amorphous zones between the crystalline zones. The crystallization time of XLPE increases at low cooling rates. The increase in crystallization time leads to larger spherical crystals and a more regular arrangement of crystal zones, reducing the proportion of amorphous zones between them. The neatly arranged crystal zones raise the charge threshold for injection into XLPE’s internal space, such that XLPE with a slower cooling rate has a lower internal charge injection at similar field strengths. Conversely, smaller spherical crystal sizes and crystallinity suggest larger amorphous regions. Electrons show a larger average free path in very dense amorphous regions, leading to significant charge movement at lower voltages and the formation of electron avalanches and breakdowns. Regularly arranged crystalline regions mitigate electrical field distortion within dielectrics and improve the electrical properties of insulating materials. Therefore, controlling cooling rates is necessary to prepare XLPE specimens with similar crystalline morphologies for the evaluation of XLPE insulation breakdown characteristics.
3.2. Effect of Sample Thickness
The breakdown strength of XLPE specimens also varies with sample thickness [22]. In past studies, scholars may have overlooked the differences in the thicknesses of the insulation samples used when comparing and analyzing the AC or direct current (DC) breakdown properties of high-voltage cable insulation materials, including XLPE and PP. In order to illustrate the influence of insulation thickness on the breakdown strength of insulation material, samples with different spherical crystal sizes and thicknesses of 30, 50, 100, 200, 300, 500 and 800 μm were prepared in this section using the cooling method described in the previous section. Specimens of XLPE with different crystalline morphologies and thicknesses of 30, 50, 100, 200, 300, 500 and 800 μm were obtained by controlling the cooling rate. Figure 3 shows the AC breakdown strength of XLPE at different thicknesses for different spherical crystal sizes based on the Weibull distribution. The breakdown strength decreases sharply with increasing material thickness at XLPE thicknesses less than 500 μm, while the change in breakdown strength with thickness tends to stabilize as the material becomes thicker. The maximum insulation breakdown strength of 212.2 kV/mm was achieved when the thickness was 30 μm for a spherical crystal diameter of 12 μm. However, when using the same method to obtain a specimen with a thickness of 800 μm, its breakdown strength was reduced by almost 80% to 44.71 kV/mm.
The effect of insulation thickness on breakdown strength becomes less significant when the thickness of the insulation material is greater than 500 μm. It has been shown that the relationship between breakdown strength and insulation material thickness approximately satisfies the inverse power model [23]
where E is the breakdown strength, d is the insulation thickness, and k and n are the two constants related to material properties. Figure 4 shows the relationship between thickness and breakdown strength obtained by model fitting based on the AC breakdown results. As can be seen, the IPM model effectively reflects, through model fitting, the relationship between the AC breakdown strength and the thickness of XLPE.
E = kd−n,
The production of XLPE inevitably introduces defects such as air gaps and byproducts into the interior of the material. Air gaps have a lower dielectric strength compared to the rest of the XLPE insulation, leading to a distortion of the electrical field strength in the material [24]. There are two main factors that contribute to the thickness effect of the breakdown strength of insulating materials: one is the change in the distortion electrical field strength in the vicinity of the defects with the thickness, and the other is the increase in the number of defects in conjunction the increase in thickness and the increased probability of the occurrence of large-sized defects [25]. In this study, insulation containing different thicknesses was modeled using Comsol VI simulation software, and air gap impurities were added to the model. The air gap was set as an ellipse with an average diameter of 25 μm, and the insulation thicknesses were set to 50, 100, 300, 500 and 800 μm [26]. The relative dielectric constant of the air gap was set to 1 and that of the insulation zone was set to 2.55. The simulation was performed by applying longitudinal voltages with an average electrical field strength magnitude of 100 kV/mm to the insulation models at different thicknesses. Figure 4a shows the results of the electrical field simulation for different thicknesses of insulation.
The electrical field is significantly stronger in the vicinity of the defect. Figure 4b shows that the maximum value of the electrical field strength magnitude increases for thicker materials between insulation thicknesses of 50 and 800 μm, while the electrical field distribution becomes less dependent on thickness at thicknesses greater than 500 μm. At the same time, the increase in insulation thickness also causes an increase in the number of defects within the insulation, which further exacerbates the electrical field distortion in the vicinity of the defects, resulting in a decrease in the breakdown field strength. The large electrical field strength increases electron mobility within the insulation material, which may cause free electrons to bombard intact XLPE insulation, resulting in the breakage of the C-H and C-C bonds in XLPE insulation, increasing the likelihood of insulation failure in areas of high field strength. The simulation results effectively explain the AC breakdown test results for XLPE with thicknesses of 30–800 μm. It is recommended to use XLPE insulation with a thickness over 500 μm to conduct engineering tests, which can effectively reduce the deviations in experimental results caused by inconsistent thickness.
3.3. Effect of Radial Position
The above study shows that XLPE insulation with greater crystallinity has better breakdown characteristics, and it has been shown that the presence of byproducts reduces the breakdown strength by causing electrical distortions and partial discharges within the insulation [27]. Due to the inconsistent preparation conditions of the inner and outer insulation during cable preparation, there are differences in the breakdown properties of the insulation along the radial position [28]. Insulation slices with a thickness of 500 μm were prepared from the inner (IN), middle (MI) and outer (OU) layers of a newly processed XLPE extruded cable insulation, according to the radial position of the cable. There were 15 AC breakdown tests performed at each temperature and each radial position, and the experimental data were processed using the Weibull distribution. Figure 5 shows how AC breakdown strength varies along with radial position in XLPE cable insulation at different temperatures. The AC breakdown strength in the XLPE cable insulation layer varies along its radial position. The middle layer insulation of XLPE extruded cables shows a strong AC breakdown strength at a temperature of 30 °C, while the breakdown strength of the outer XLPE insulation layer decreases significantly when the temperature is higher than 50 °C and is less than that of the middle layer insulation. In contrast, the AC breakdown strength of the inner insulation layer is consistently worse. The AC breakdown strength of all XLPE specimens decreases as the temperature increases. Compared to the outer insulation layer of XLPE cables, the AC breakdown strength of the inner insulation of XLPE specimens decreases more slowly with increasing temperature, and eventually the breakdown performance of each insulation layer is approximately 90 °C.
FTIR and DSC tests were conducted to analyze differences in insulation structure at different radial positions and investigate the reasons for differences in the radial positions of breakdown strength in XLPE extruded cable insulation. Figure 6a shows absorption peaks at 2916 cm−1, 2848 cm−1, 1463 cm−1 and 719 cm−1 that minimally vary with radial position due to vibration of the characteristic -CH2- group within XLPE. Additives such as diammonium peroxide (DCP) initiators and antioxidants were added during the production of XLPE to complete the cross-linking process based on peroxide cross-linking DCP. Other additives produce byproducts such as benzyl alcohol with -OH groups (3370 cm−1), ether bonds with C-O-C groups (1097 cm−1) and aromatic rings (1263 cm−1) during the XLPE preparation process [29]. Characteristics of wave number absorption in the ranges 900 to 1400 cm−1 and 3300 to 3500 cm−1 were selected for observation to analyze differences in byproduct content at each radial position of the insulation layer. XLPE extruded cables contained fewer byproducts closer to the outside and more byproducts on the inside. This may be due to the ease of precipitation for impurities on the outside of the cable insulation.
Figure 6b shows the results of the DSC tests on XLPE cable insulation at different radial positions. The crystallinity of the extruded XLPE insulation cable is influenced by the radial position. As the inner insulation of the XLPE extruded cable moves closer to the copper conductor, which has a high thermal conductivity, the outer insulation is pushed closer to the outer side of the cable, resulting in a higher cooling rate of the XLPE insulation. The XLPE crystalline morphology is influenced by the cooling rate. The crystallinity of the inner and outer insulation layers close to the conductor is lower, at 37.3% and 37.23%, respectively. In contrast, the lower cooling rate of the middle layer insulation leads to a higher crystallinity of 37.43%.
The experimental study of the radial position of the cable is in high agreement with existing studies [30]. Moreover, this study also tested the cross-linking degree of the inner, middle and outer layers of the cable insulation, and the experimental results are 82.63%, 83.03% and 83.47%, respectively. It is speculated that this may be due to the fact that the outer insulation layer may be heated at a higher temperature for a longer period of time than the inner insulation layer during the cable vulcanization process, thus completely decomposing the DCP and cross-linking the polyethylene. The differences in polymer insulation breakdown characteristics are the result of a combination of factors. The middle layer has a significantly higher breakdown strength than the insulation in the other radial position due to its higher crystallinity and fewer byproducts. The outer layers also have good breakdown strengths at low temperatures, probably because the cross-linking degree has a more pronounced effect at low temperatures. Since the byproducts and crystallinity of the inner and outer insulation layers are greatly affected by the degassing and cooling processes, it is recommended that the breakdown characteristics test be carried out using the middle layer of the cable insulation, thus minimizing the influence of the manufacturer’s production process on the experimental results.
4. Long-Term Breakdown Characteristics and Lifetime Prediction for Performance Evaluation
4.1. “E–t” Characteristics of XLPE
The study of the remaining life of XLPE insulation under electrical stress focuses on the VEC, which is an important parameter for the evaluation of the insulation’s electrical aging performance and is usually expressed as a value of n. Figure 7 shows the E–t characteristics of XLPE insulation. The curve is divided into three stages, each with a constant value of n. t1 is usually less than 1000 s at high electrical field strengths and has a small value of n1. XLPE materials are considered to have a uniform life index from t1 to t2, with t2 usually considered to be ten years or more. To ensure the accuracy and ease of residual life prediction, experimental data with failure times between t1 and t2 are used. It is possible to complete the insulation design with a certain safety margin.
The E–t characteristics of XLPE were measured at 30, 50 and 70 °C using the constant voltage method, and failure times longer than 1000 s were obtained. Insulation slices with a thickness of 500 μm were used as experimental materials from the same radial position of a high voltage cable. Tests on the E–t characteristics of XLPE at 30, 50 and 70 °C were conducted based on the constant voltage method. The insulation patterns were subjected to an AC voltage to determine conditions that led to failure times in excess of 1000 s. There were 15 tests carried out at each temperature and electrical field and no fewer than ten sets of experimental data were obtained. Based on the experimental results, Figure 8 shows box plots of the breakdown time of the XLPE insulation for different temperatures. In the figure, the blue boxes correspond to the upper and lower quartiles of the data. The black lines correspond to the upper and lower edges of the data. The blue diagonal line is the lifetime curve obtained by fitting. The E–t curves for XLPE insulation at different temperatures were obtained by fitting the results of the average values of the breakdown time to the IPM.
where E is the electrical field strength magnitude, t is the insulation failure time under this electrical field, and n is the voltage endurance coefficient (VEC).
There is a correlation between the time to failure and the voltage applied to the XLPE insulation. Both the time to failure and its dispersion increase significantly as the voltage decreases. And it can be seen that the temperature directly affects the E–t characteristics of XLPE insulation and that VEC decreases significantly with increasing temperature. The breakdown of the insulating materials is mainly caused by the impingement of electrons on molecular chains under electrical fields and the breakage of molecular chains under thermal oxidative aging. The increase in temperature leads to an increase in the thermal movement of the molecules, which increases the rate at which the electrons hit the molecular chains. Furthermore, the temperature accelerates the thermal oxidative aging process of insulating materials and accelerates the degradation of their electrical properties. Therefore, an increase in temperature accelerates the process of molecular chain breakage, resulting in insulation failure, explaining the experimental phenomenon of a decrease in VEC with increasing temperature at the microscopic level.
Previous studies have shown that the VEC of insulating materials can be obtained by various experimental methods, except for constant voltage tests. The relationship between the tree initiation time and the aging life curve of polyethylene has been investigated and shows a very similar variation pattern [31]. Other studies have found that VEC was stable in the range of 10 to 14 at room temperature by studying the tree-starting time of XLPE insulation of 110 kV AC cables at different voltages [32]. A convenient method for calculating the VEC of XLPE insulation has been proposed based on the equivalence of the damage curve trajectory and the step-up voltage test [33]. The above studies of the E–t characteristics of XLPE insulation all show similar experimental results, demonstrating that using VEC to characterize the voltage endurance of XLPE under a single electrical stress is a correct method.
4.2. XLPE Lifetime Assessment
With the development of the power system, the cable load continues to increase and the insulation is subjected to higher temperatures, so it is necessary to consider the combined electrothermal aging life and thus more accurately evaluate the life of the cable insulation material. The insulation properties and remaining lifetime of cables are mainly affected by electrical fields and temperature. Therefore, the method of predicting the remaining lifetime under a single electrical stress is not applicable for XLPE cables under complex operating conditions. In this section, the Ramu, Fallou and Simoni models are analyzed as the most widely used phenomenological models [34].
The Ramu model is obtained by multiplying the one-factor aging models and treating the constants in the IPM of a single electrical aging model as temperature-dependent quantities, as shown in the following equation:
where L is the lifetime of the insulation material; E is the electrical field strength magnitude; T is the absolute temperature of the test; and B, K1, K2, n1 and n2 are the constants determined by the test.
The Fallou model is a combined electrothermal aging model based on a summary of the electrical aging exponential function model, as shown in the following equation:
where A1, A2, B1 and B2 are constants and relate to the specific insulation material as well as the test environment.
The Simoni model considers the aging of insulating materials as the result of accumulated electrothermal effects. The electrical field strength is the most fundamental parameter of the Simoni model and is expressed as follows:
where ES is the electrical field strength at a pre-applied voltage time of t, ES0 is the initial electric field strength of the insulating medium, U0 is the threshold voltage, T0 is the room temperature and L0 is the lifetime of the insulating material when the voltage is U0 and the temperature is T0. The following equation is obtained when ES = 0 and t = L:
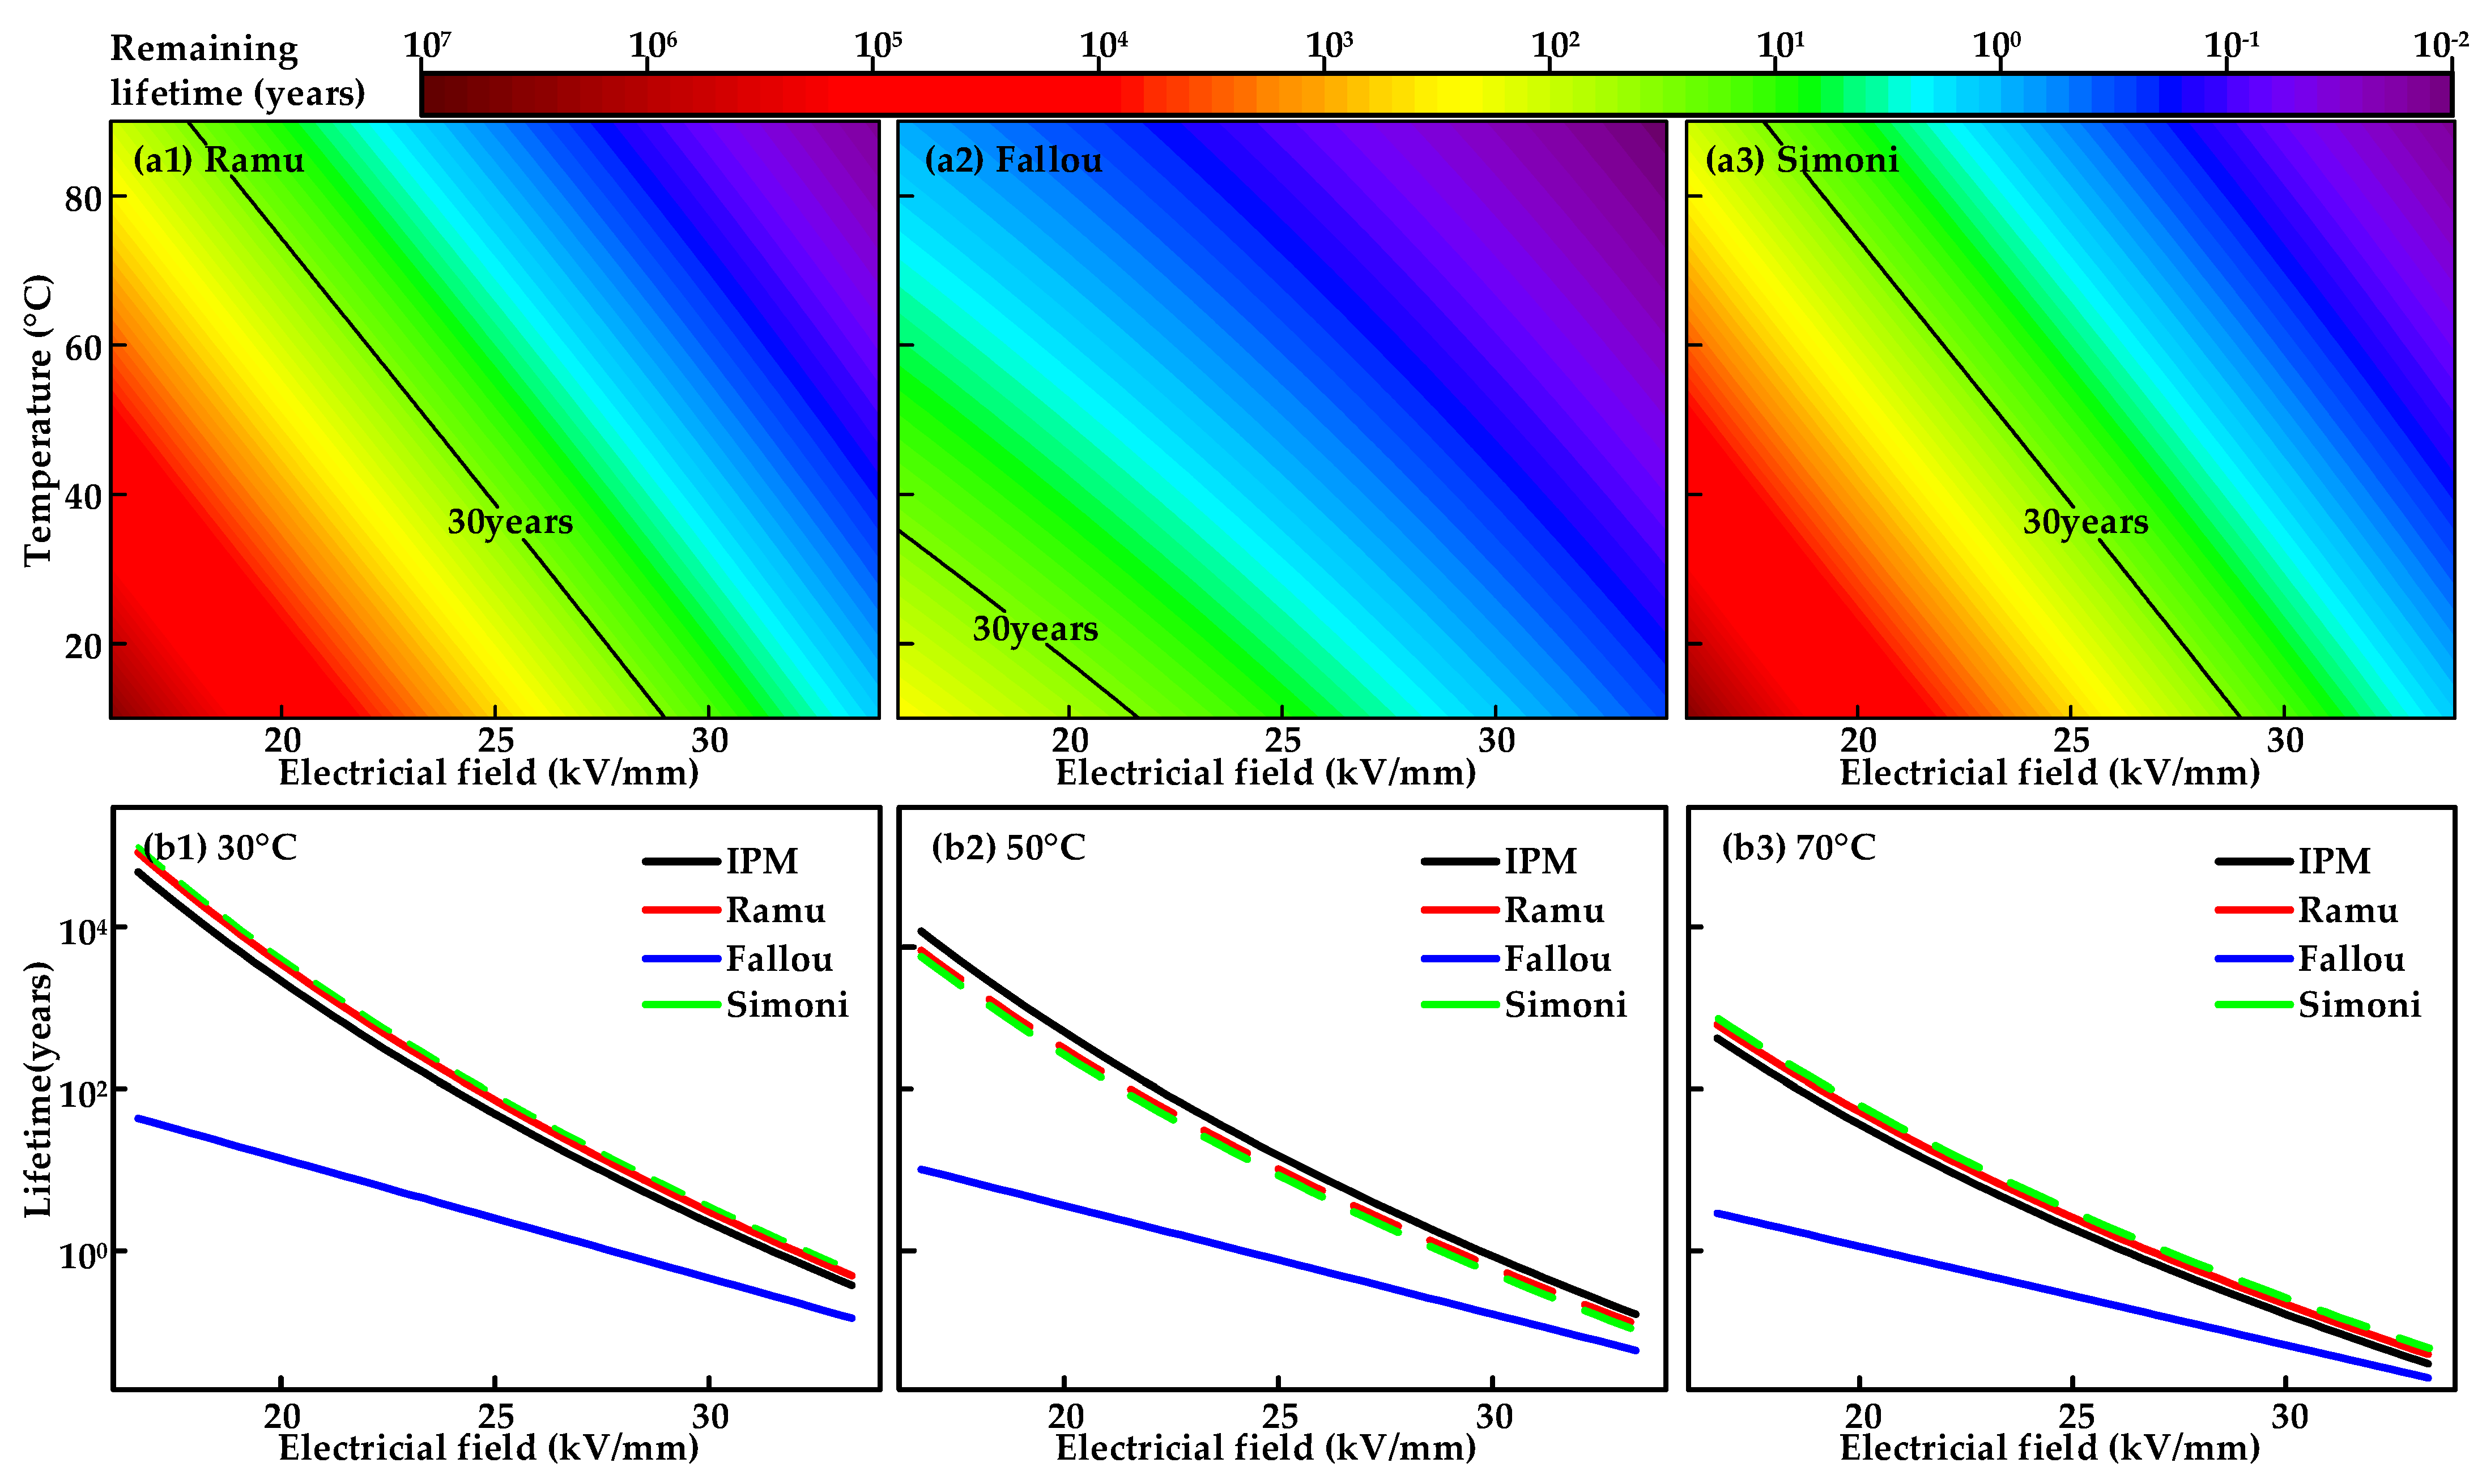
These three models were fitted with parameters based on the experimental results of the XLPE E–t characteristics. The critical temperature T0 is 20 °C, and the critical field strength E0 is chosen as 10 kV/mm, so the aging of the insulation is negligible at this temperature and the electrical field strength is below this value. Figure 9(a1–a3) shows that the model fits for the remaining lifetime of the XLPE insulation under electrothermal stress. The vertical coordinate uses a logarithmic coordinate system to represent the remaining time. The pattern of variation in the remaining lifetime calculated by the three models is similar, with all decreasing with increasing temperature and electrical field strength. The remaining lifetime is low and varies more gently at lower temperatures and electrical field strengths.
The fit results for the Ramu model are similar to those of the Simoni model, as shown in Figure 9(a1–a3). The remaining lifetime calculated by the Fallou model is shorter than the results of the other models, and the difference is particularly significant at low electrical fields. In order to analyze the accuracy of the prediction results of the electrothermal model, the IPM model at different temperatures is used for comparative analysis, as it is the reference electrical lifetime model for XLPE cables in international standards [35]. Figure 9(b1–b3) shows the lifetime prediction curves of the IPM at 30, 50 and 70 °C, which obtain prediction models similar to the lifetime prediction model results under a single stress. The remaining lifetime predictions calculated by the Simoni and Ramu models are similar to the results obtained by the IPM. In contrast, the remaining lifetime prediction results obtained by the Fallou model deviate significantly from the IPM, and the deviation further increases as the electrical field decreases.
The Ramu and Simoni remaining lifetime prediction models are compared and analyzed to investigate the factors leading to the similar results. The results show that after normalization of the model parameters the two equations have a similar structure, as both are obtained by adding the temperature parameter to the inverse power function of the electrical stress. On the other hand, the Fallou model is a two-factor remaining lifetime prediction model derived from an exponential function of electrical aging. Therein, the electric field is located at the exponential position and the coefficient is negative. In contrast, in the IPM model the residual lifetime calculated by the exponential function model is affected less at low electric fields. Therefore, in the lifetime assessment of XLPE cable insulation, when there are large fluctuations in the cable insulation temperature the use of IPM will make the prediction results have large deviations, while the Simoni and Ramu models for lifetime prediction have better accuracies.
5. Engineering Evaluation Methods
This paper puts suggests optimal engineering evaluation methods and ways of improving the electrical performance of XLPE insulation for high voltage cables based on the results of the short-term and long-term breakdown tests of XLPE insulation.
- 1.
- It is necessary to control the cooling rate when evaluating and comparing the breakdown characteristics of XLPE to ensure that the results are not influenced by the morphology of the crystalline wires, since the cooling rate during XLPE preparation has a significant effect on the crystalline morphology.
- 2.
- The electrical performance of XLPE insulation below 500μm is strongly influenced by cable thickness, and it is recommended that XLPE above 500 μm be selected to conduct the breakdown characteristics test to reduce the deviation of the results caused by the thickness effect.
- 3.
- For the insulation performance test of XLPE cables, it is recommended to choose the middle layer slices to carry out the experiment, which can reduce the influence of the differences in crystallinity and byproducts caused by the different degassing times that may be adopted by different manufacturers.
- 4.
- The short-term breakdown test does not adequately reflect the voltage withstand characteristics of XLPE insulation, while the voltage withstand characteristic test can indicate the long-term operating characteristics of XLPE insulation.
- 5.
- In consideration of the gradual increase in the cable loading rate and the fact that the insulation temperature is not constant, it is suggested that a lifetime prediction model under combined electrothermal fields, such as Ramu or Simoni, be used for the analysis of the remaining lifetime characteristics of the XLPE insulation.
6. Shortcomings and Outlook
Although this paper investigates the breakdown characteristics and remaining lifetime of XLPE insulation and obtains relevant conclusions, the current study still has limitations and can be further improved. This paper mainly focuses on mechanistic experimental research and only provides guiding opinions on the actual engineering applications, which are not verified. The remaining lifetime of the film samples is not representative of the insulation lifetime of the cable, and the relationship between the insulation lifetime of the film and that of the whole cable still requires further investigation. Secondly, cables are not subject to only two kinds of stresses (electrical fields and temperature) during operation, and the stresses are not constant. The remaining lifetime prediction methods for variable stresses still require further research.
7. Conclusions
This paper presents recent developments in evaluating the breakdown performance and predicting the remaining lifetime of XLPE. The effects of the crystalline morphology, thickness and radial cable position on the short-term breakdown characteristics of XLPE cable insulation were analyzed. Lifetime prediction models applicable to XLPE insulation have been investigated. The XLPE insulation selection and lifetime prediction models are profiled by evaluating the breakdown characteristics.
- 1.
- During XLPE preparation, insulation samples with fast cooling rates tend to have poor electrical properties due to insufficient crystallization. Examining XLPE specimens obtained by the same preparation method effectively improves the assessment accuracy of breakdown performance.
- 2.
- Increasing the thickness of XLPE insulation leads to lower breakdown strength due to a larger distortional electrical field near internal defects. The breakdown strength of XLPE insulation with a thickness of 500 μm or more is less affected by thickness variations and can be used in the evaluation of cable insulation breakdown characteristics.
- 3.
- The crystallinity and byproduct content are influenced by the radial position of the extruded XLPE insulation, resulting in differences in the breakdown characteristics of the specimens taken from the XLPE cable insulation. The sampling of XLPE cable insulation from the same radial position can effectively improve the accuracy of the electrical performance evaluation.
- 4.
- Failure time can effectively reflect the operational reliability of XLPE cables under electrothermal composite stress. The Raum and Simoni models have prediction results similar to the IPM model, which can be employed as the lifetime prediction model of XLPE insulation under combined electrothermal stress.
Author Contributions
Conceptualization, Z.L. and B.D.; methodology, Y.D. and M.Z.; software, Y.D. and Y.W.; validation, Y.D. and Z.L.; formal analysis, Y.D., X.L. and Z.L.; investigation, Y.D., Z.M. and Z.L.; resources, Y.D., Y.W. and Z.L.; data curation, Y.D., P.S. and Z.L.; writing—original draft preparation, Z.L. and B.D.; writing—review and editing, Z.L. and B.D.; visualization, Z.L. and B.D.; supervision, Z.L.; project administration, Z.L.; funding acquisition, Z.L. All authors have read and agreed to the published version of the manuscript.
Funding
This research was funded by the science and technology project of state grid headquarters of China under the Grant, 5500-202312187A-1-1-ZN.
Data Availability Statement
Data is contained within the article.
Conflicts of Interest
Zhengzheng Meng, Pengxian Song, Mingzheng Zhu and Xu Li were employed by the company Author State Grid Tianjin Electric Power Company. The remaining authors declare that the research was conducted in the absence of any commercial or financial relationships that could be construed as a potential conflict of interest. The authors declare that this study received funding from state grid headquarters of China. The funder was not involved in the study design, collection, analysis, interpretation of data, the writing of this article or the decision to submit it for publication.
References
- Montanari, G.C.; Laurent, C.; Teyssedre, G.; Campus, A.; Nilsson, U.H. From LDPE to XLPE: Investigating the change of electrical properties. Part I. space charge, conduction and lifetime. IEEE Trans. Dielectr. Electr. Insul. 2005, 12, 438–446. [Google Scholar] [CrossRef]
- Orton, H. Power cable technology review. High Volt. Eng. 2015, 41, 1057–1067. [Google Scholar]
- Marcotullio, P.J.; Braçe, O.; Lane, K.; Olson, C.E.; Tipaldo, J.; Ventrella, J.; Yoon, L.; Knowlton, K.; Anand, G.; Matte, T. Local power outages, heat, and community characteristics in New York City. Sustain. Cities Soc. 2023, 99, 104932. [Google Scholar] [CrossRef]
- Guo, D.; Li, Q.; Liu, P.; Shi, X.; Yu, J. Power shortage and firm performance: Evidence from a Chinese city power shortage index. Energy Econ. 2023, 119, 106593. [Google Scholar] [CrossRef]
- Densley, J. Ageing mechanisms and diagnostics for power cables—An overview. IEEE Electr. Insul. Mag. 2001, 17, 14–22. [Google Scholar] [CrossRef]
- Gutierrez, S.; Sancho, I.; Fontan, L.; No, J. Effect of protrusions in HVDC cables. IEEE Trans. Dielectr. Electr. Insul. 2012, 19, 1774–1781. [Google Scholar] [CrossRef]
- Boukezzi, L.; Boubakeur, A.; Laurent, C.; Lallouani, M. Observations on structural changes under thermal ageing of cross-linked polyethylene used aspower cables insulation. Iran. Polym. J. 2008, 17, 611–624. [Google Scholar]
- Fan, Z.H.; Yoshimura, N. The influence of crystalline morphology on the growth of water trees in PE. IEEE Trans. Dielectr. Electr. Insul. 1996, 3, 849–858. [Google Scholar] [CrossRef]
- Wu, Y.; Du, B.X.; Li, Z.L.; Dong, Y.M.; Wang, H.Y. Effect of Crystal Morphology on Breakdown Properties of XLPE at Mesoscale. In Proceedings of the ICHVE, Chongqing, China, 26–29 September 2022; pp. 1–4. [Google Scholar]
- Murakami, Y.; Chen, G. Influence of film thickness on space charge formation under DC ramp voltage. In Proceedings of the ICSD, Bologna, Italy, 30 June–4 July 2013; pp. 448–451. [Google Scholar]
- Dissado, L.A.; Fothergill, J.C.; See, A.; Stevens, G.C.; Markey, L.; Laurent, C.; Teyssedre, G.; Nilsson, U.H.; Platbrood, G.; Montanari, G.C. Characterizing HV XLPE cables by electrical, chemical and microstructural measurements on cable peeling: Effects of surface roughness, thermal treatment and peeling location. In Proceedings of the CEIDP, Victoria, BC, Canada, 15–18 October 2000; pp. 136–140. [Google Scholar]
- Mazzanti, G. The combination of electro-thermal stress, load cycling and thermal transients and its effects on the life of high voltage ac cables. IEEE Trans. Dielectr. Electr. Insul. 2009, 16, 1168–1179. [Google Scholar] [CrossRef]
- Mazzanti, G. Analysis of the Combined Effects of Load Cycling, Thermal Transients, and Electrothermal Stress on Life Expectancy of High-Voltage AC Cables. IEEE Trans. Power Deliv. 2007, 22, 2000–2009. [Google Scholar] [CrossRef]
- Lei, W.; Wu, K.; Wang, Y.; Cheng, Y.; Zheng, X.; Dissado, L.A.; Dodd, S.J.; Chalashkanov, N.M.; Fotherglll, J.C.; Zhang, C.; et al. Are nano-composites really better DC insulators? A study using silica nanoparticles in XLPE. IEEE Trans. Dielectr. Electr. Insul. 2017, 24, 2268–2270. [Google Scholar] [CrossRef]
- Montanari, G.C. Notes on theoretical and practical aspects of polymeric insulation aging. IEEE Electr. Insul. Mag. 2013, 29, 34–44. [Google Scholar] [CrossRef]
- Mazzanti, G.; Marzinotto, M. Extruded Cables for High Voltage Direct Current Transmission: Advances in Research and Development; Power Engineering Series; Wiley-IEEE Press: Hoboken, NJ, USA, 2013. [Google Scholar]
- Wang, Y.; Lv, Z.; Wang, X.; Wu, K.; Zhang, C.; Li, W.; Dissado, L.A. Estimating the inverse power law aging exponent for the DC aging of XLPE and its nanocomposites at different temperatures. IEEE Trans. Dielectr. Electr. Insul. 2016, 23, 3504–3513. [Google Scholar] [CrossRef]
- Montanari, G.; Mazzanti, G.; Simoni, L. Progress in electrothermal life modeling of electrical insulation during the last decades. IEEE Trans. Dielectr. Electr. Insul. 2002, 9, 730–745. [Google Scholar] [CrossRef]
- Zhang, Y.; Li, S.; Gao, J.; Wang, S.; Wu, K.; Li, J. Ageing Assessment of XLPE Cable Insulation by Residual Antioxidant Content. IEEE Trans. Dielectr. Electr. Insul. 2020, 27, 1795–1802. [Google Scholar] [CrossRef]
- Cygan, P.; Laghari, J. Models for insulation aging under electrical and thermal multistress. IEEE Trans. Electr. Insul. 1990, 25, 923–934. [Google Scholar] [CrossRef]
- Mandlik, M.; Ramu, T.S. Moisture aided degradation of oil impregnated paper insulation in power transformers. IEEE Trans. Dielectr. Electr. Insul. 2014, 21, 186–193. [Google Scholar] [CrossRef]
- Bhutta, M.S.; Yang, L.; Ma, Z.; Nazir, M.T.; Akram, S.; Mehmood, M.A.; Faiz, N. Simulation of thickness controlled DC breakdown of XLPE regulated by space charge & molecular chain movement. IEEE Trans. Dielectr. Electr. Insul. 2020, 27, 1143–1151. [Google Scholar] [CrossRef]
- Kim, H.; Shi, F. Thickness dependent dielectric strength of a low-permittivity dielectric film. IEEE Trans. Dielectr. Electr. Insul. 2001, 8, 248–252. [Google Scholar] [CrossRef]
- Li, S.; Huang, Q.; Sun, J.; Zhang, T.; Li, J. Effect of traps on surface flashover of XLPE in vacuum. IEEE Trans. Dielectr. Electr. Insul. 2010, 17, 964–970. [Google Scholar] [CrossRef]
- Taine, E.; Andritsch, T.; Saeedi, I.A.; Morshuis, P.H.F. Size effect and electrical ageing of PDMS dielectric elastomer with competing failure modes. Smart Mater. Struct. 2023, 32, 105021. [Google Scholar] [CrossRef]
- IEC 60840; Power Cables with Extruded Insulation and Their Accessories for Rated Voltages above 30 kV (Um = 36 kV) up to 150 kV (Um = 170 kV)—Test Methods and Requirements. 3rd ed. IEC: Geneva, Switzerland, 2011.
- Amyot, N.; David, E.; Lee, S.; Lee, I. Influence of post-manufacturing residual mechanical stress and crosslinking by-products on dielectric strength of HV extruded cables. IEEE Trans. Dielectr. Electr. Insul. 2002, 9, 458–466. [Google Scholar] [CrossRef]
- Teyssedre, G.; Laurent, C.; Aslanides, A.; Quirke, N.; Dissado, L.A.; Montanari, G.C.; Campus, A.; Martinotto, L. Deep trapping centers in crosslinked polyethylene investigated by molecular modeling and luminescence techniques. IEEE Trans. Dielectr. Electr. Insul. 2001, 8, 744–752. [Google Scholar] [CrossRef]
- Liu, X.; Yu, Q.; Liu, M.; Li, Y.; Zhong, L.; Fu, M.; Hou, S. DC electrical breakdown dependence on the radial position of specimens within HVDc XLPE cable insulation. IEEE Trans. Dielectr. Electr. Insul. 2017, 24, 1476–1484. [Google Scholar] [CrossRef]
- Zhang, Z.P.; Zhao, J.K.; Zhao, W.; Zhong, L.S.; Hu, L.X.; Rao, W.B.; Zheng, M.; Meng, S.X. Influence of morphological variations on the AC breakdown of XLPE insulation in submarine cable factory joints. High Volt. 2020, 5, 69–75. [Google Scholar] [CrossRef]
- Tanaka, T.; Greenwood, A. Effects of Charge Injection and Extraction on Tree Initiation in Polyethylene. IEEE Trans. Power Appar. Syst. 1978, PAS-97, 1749–1759. [Google Scholar] [CrossRef]
- Su, Y.; Liu, Y.; Zhong, L. Evaluation of voltage endurance characteristics for new and aged XLPE cable insulation by electrical treeing test. IEEE Trans. Dielectr. Electr. Insul. 2019, 26, 72–80. [Google Scholar] [CrossRef]
- Bian, H.; Yang, L.; Ma, Z.; Deng, B.; Zhang, H.; Wu, Z. Improved physical model of electrical lifetime estimation for crosslinked polyethylene AC cable. IEEE Trans. Dielectr. Electr. Insul. 2020, 27, 132–139. [Google Scholar] [CrossRef]
- Mazzanti, G. Updated Review of the Life and Reliability Models for HVDC Cables. IEEE Trans. Dielectr. Electr. Insul. 2023, 30, 1371–1390. [Google Scholar] [CrossRef]
- IEC 62067; Power Cables with Extruded Insulation and Their Accessories for Rated Voltages Above 150 kV (Um=170 kV) up to 500 kV (Um=550 kV)—Test Methods and Requirements, 2nd ed. IEC: Geneva, Switzerland, 2011.
Figure 1.
Experimental results of XLPE crystallization: (a1–a4) SEM images of XLPE with different cooling rates; and (b) DSC results of XLPE with different cooling rates.
Figure 1.
Experimental results of XLPE crystallization: (a1–a4) SEM images of XLPE with different cooling rates; and (b) DSC results of XLPE with different cooling rates.
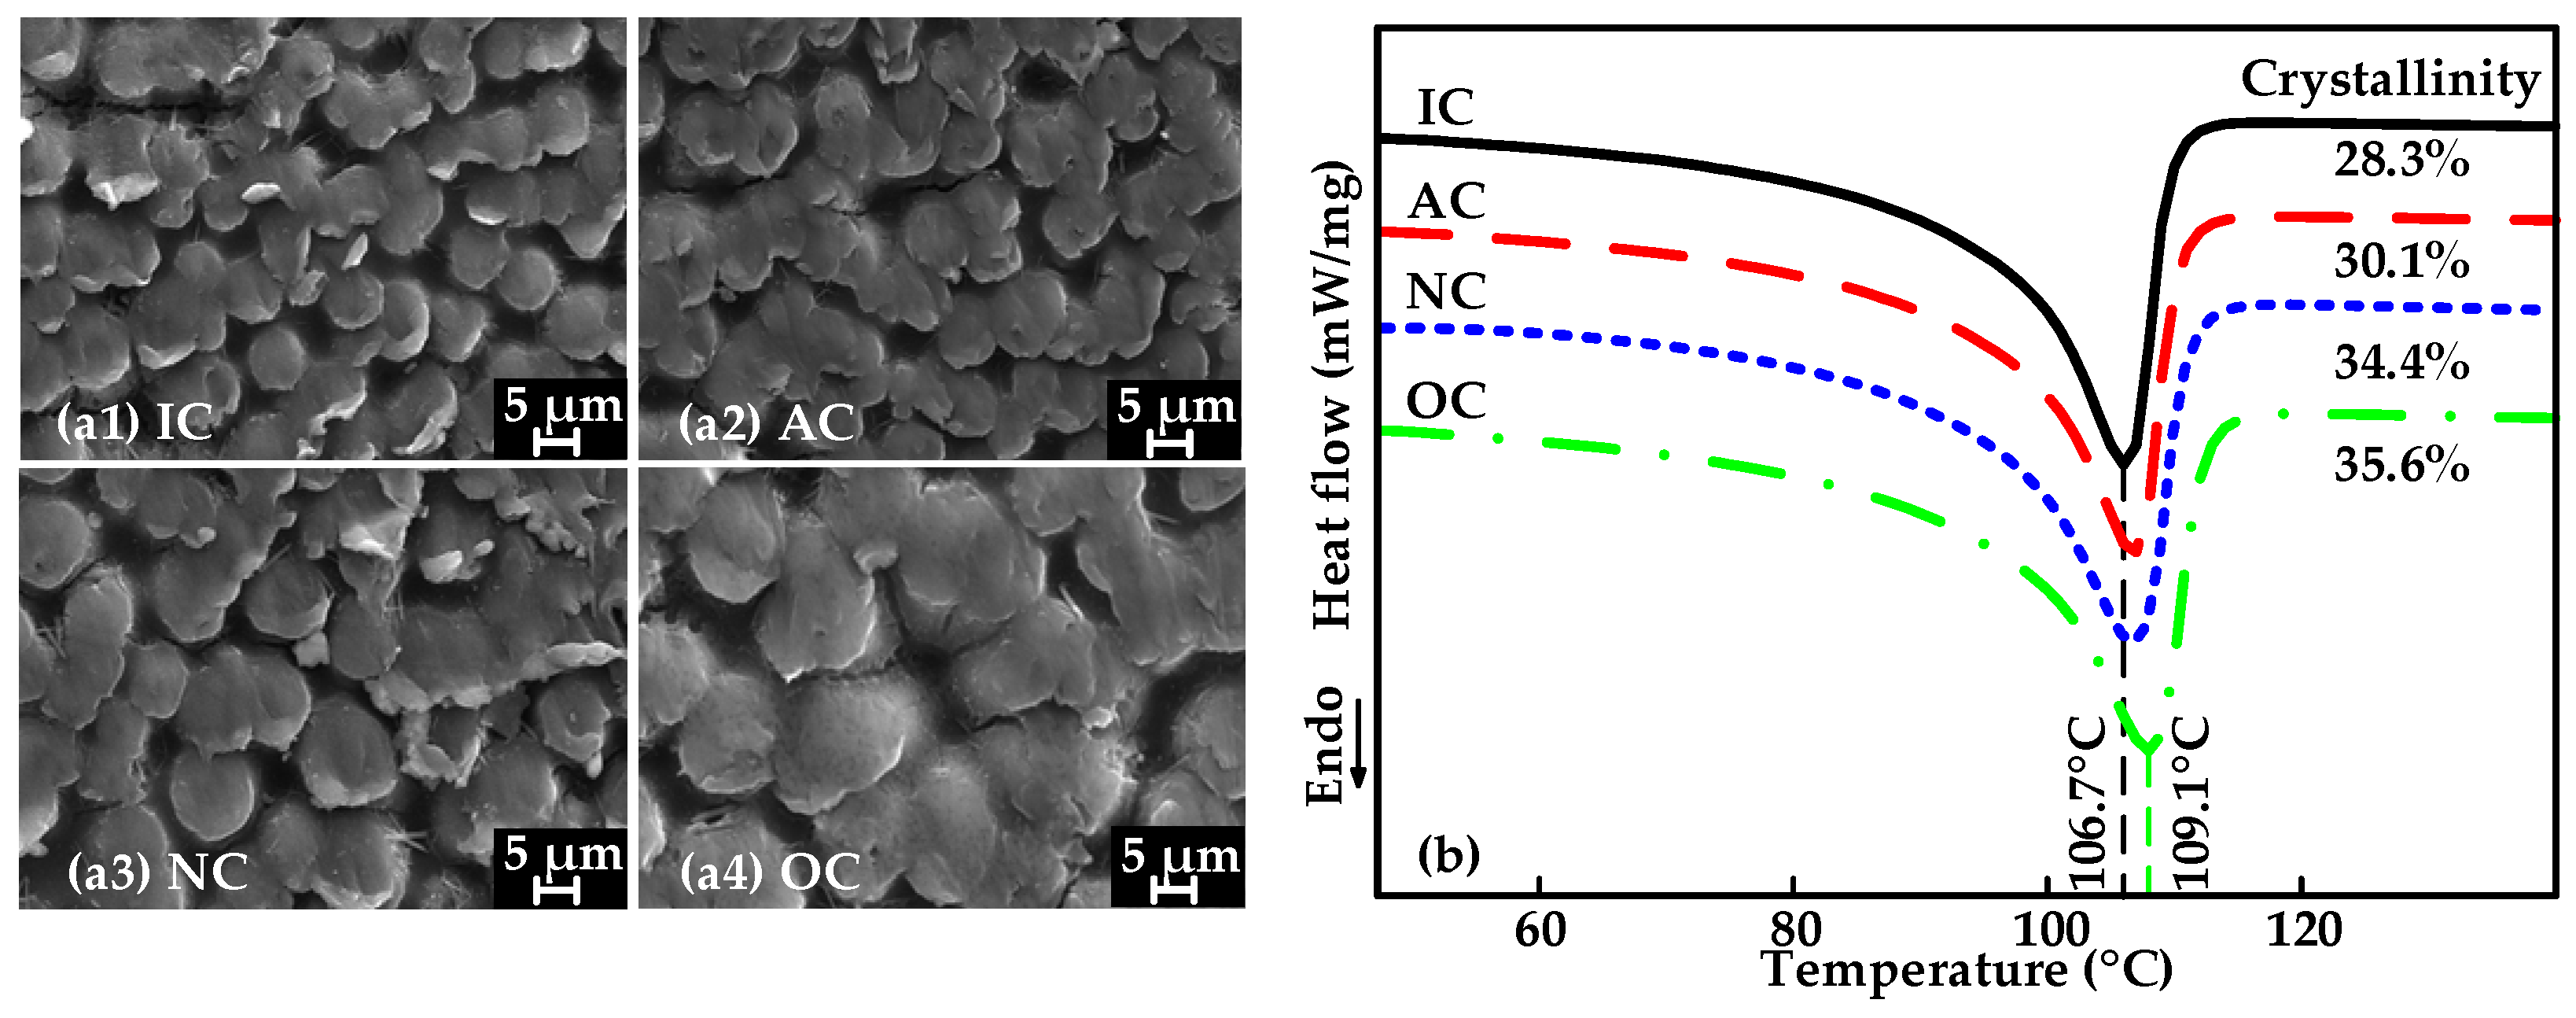
Figure 2.
AC breakdown strength of XLPE with different spherical crystal sizes.
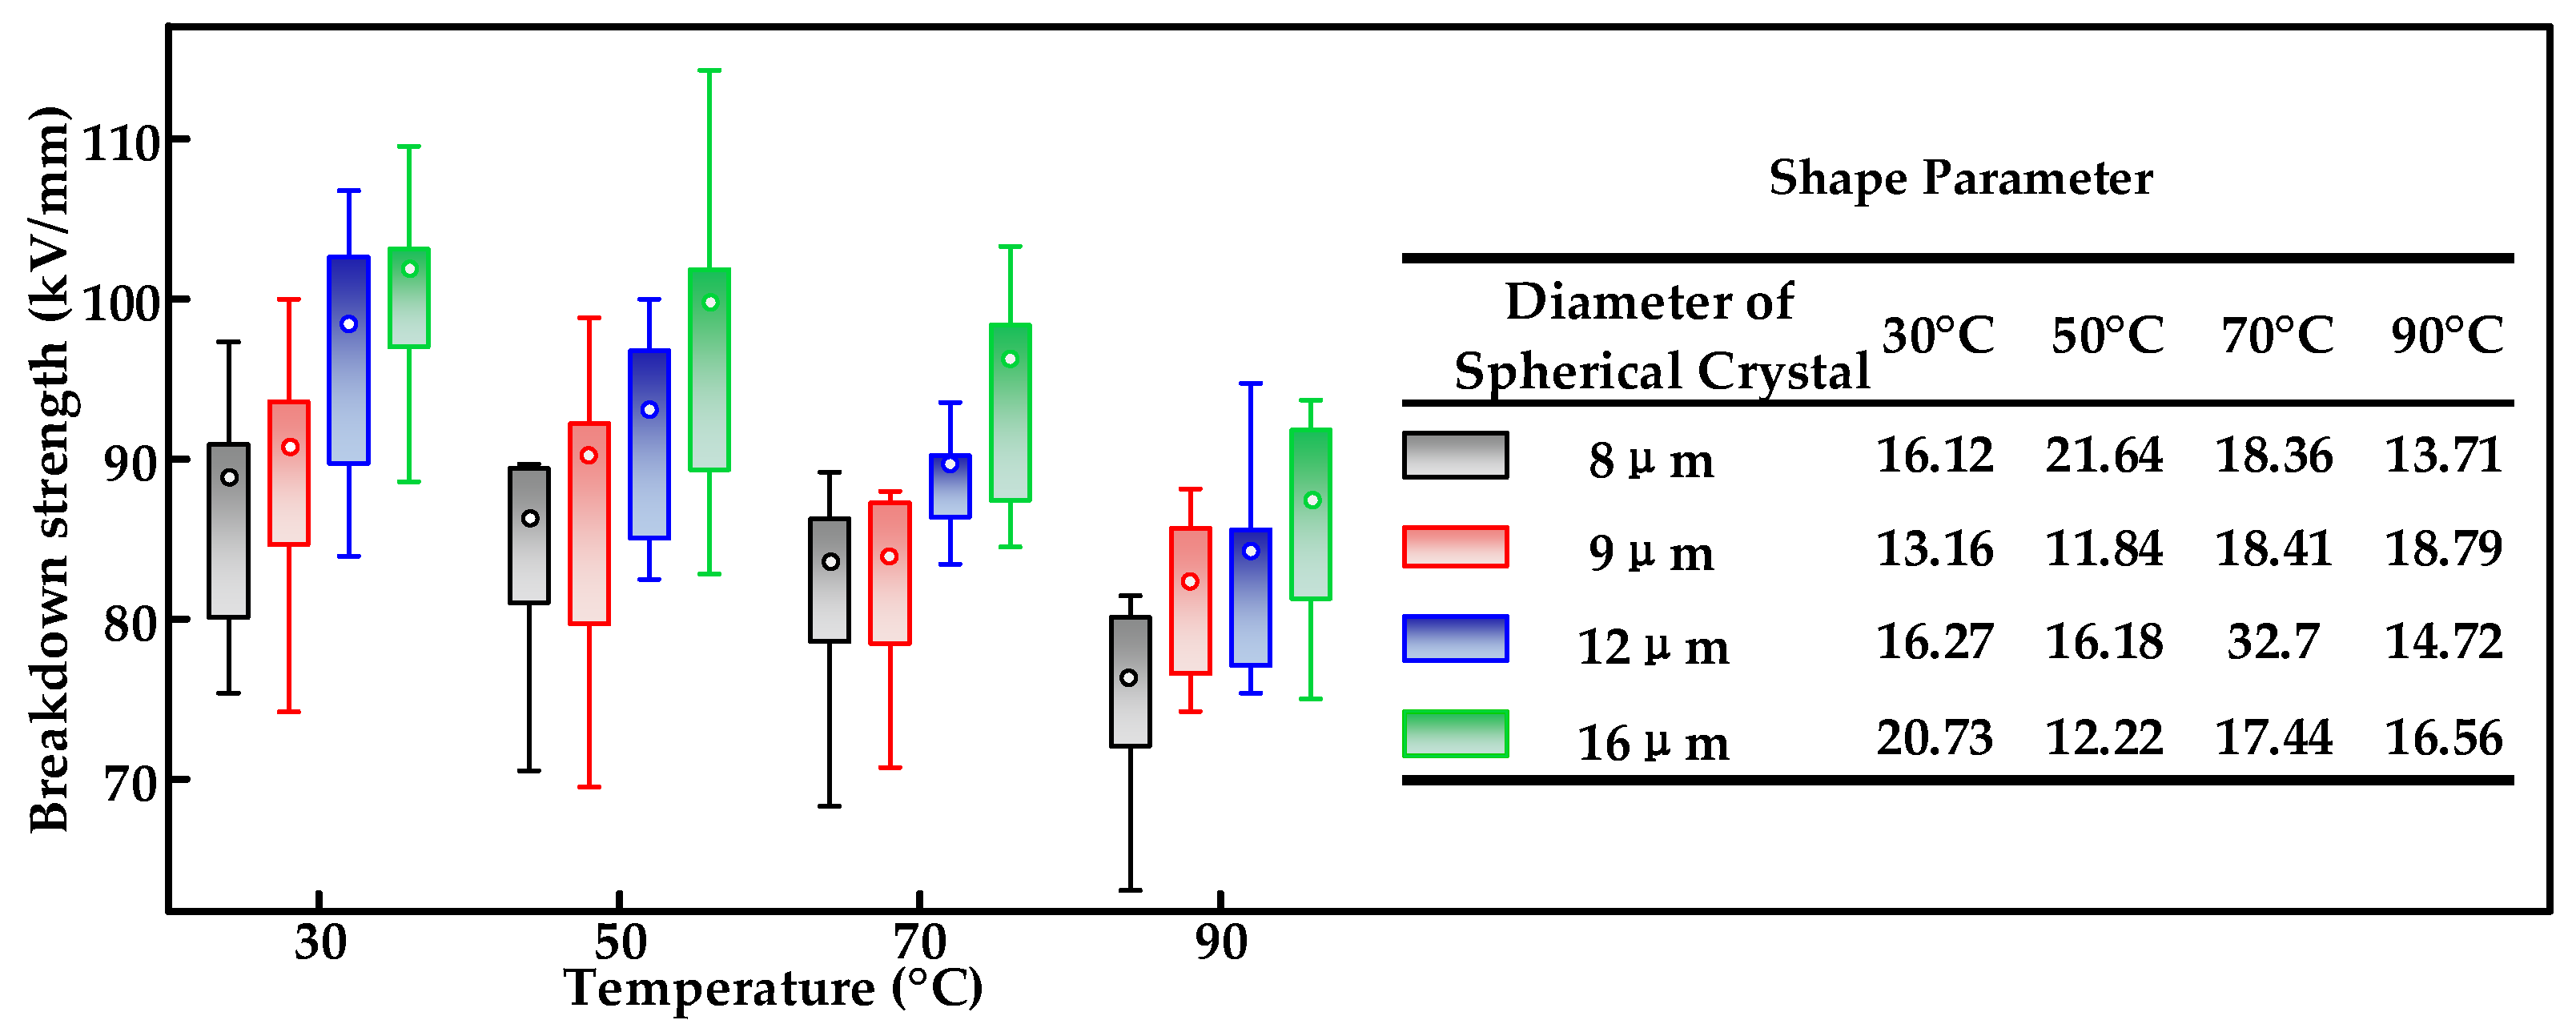
Figure 3.
Relationship between AC breakdown strength and thickness for three crystalline morphologies of XLPE.
Figure 3.
Relationship between AC breakdown strength and thickness for three crystalline morphologies of XLPE.
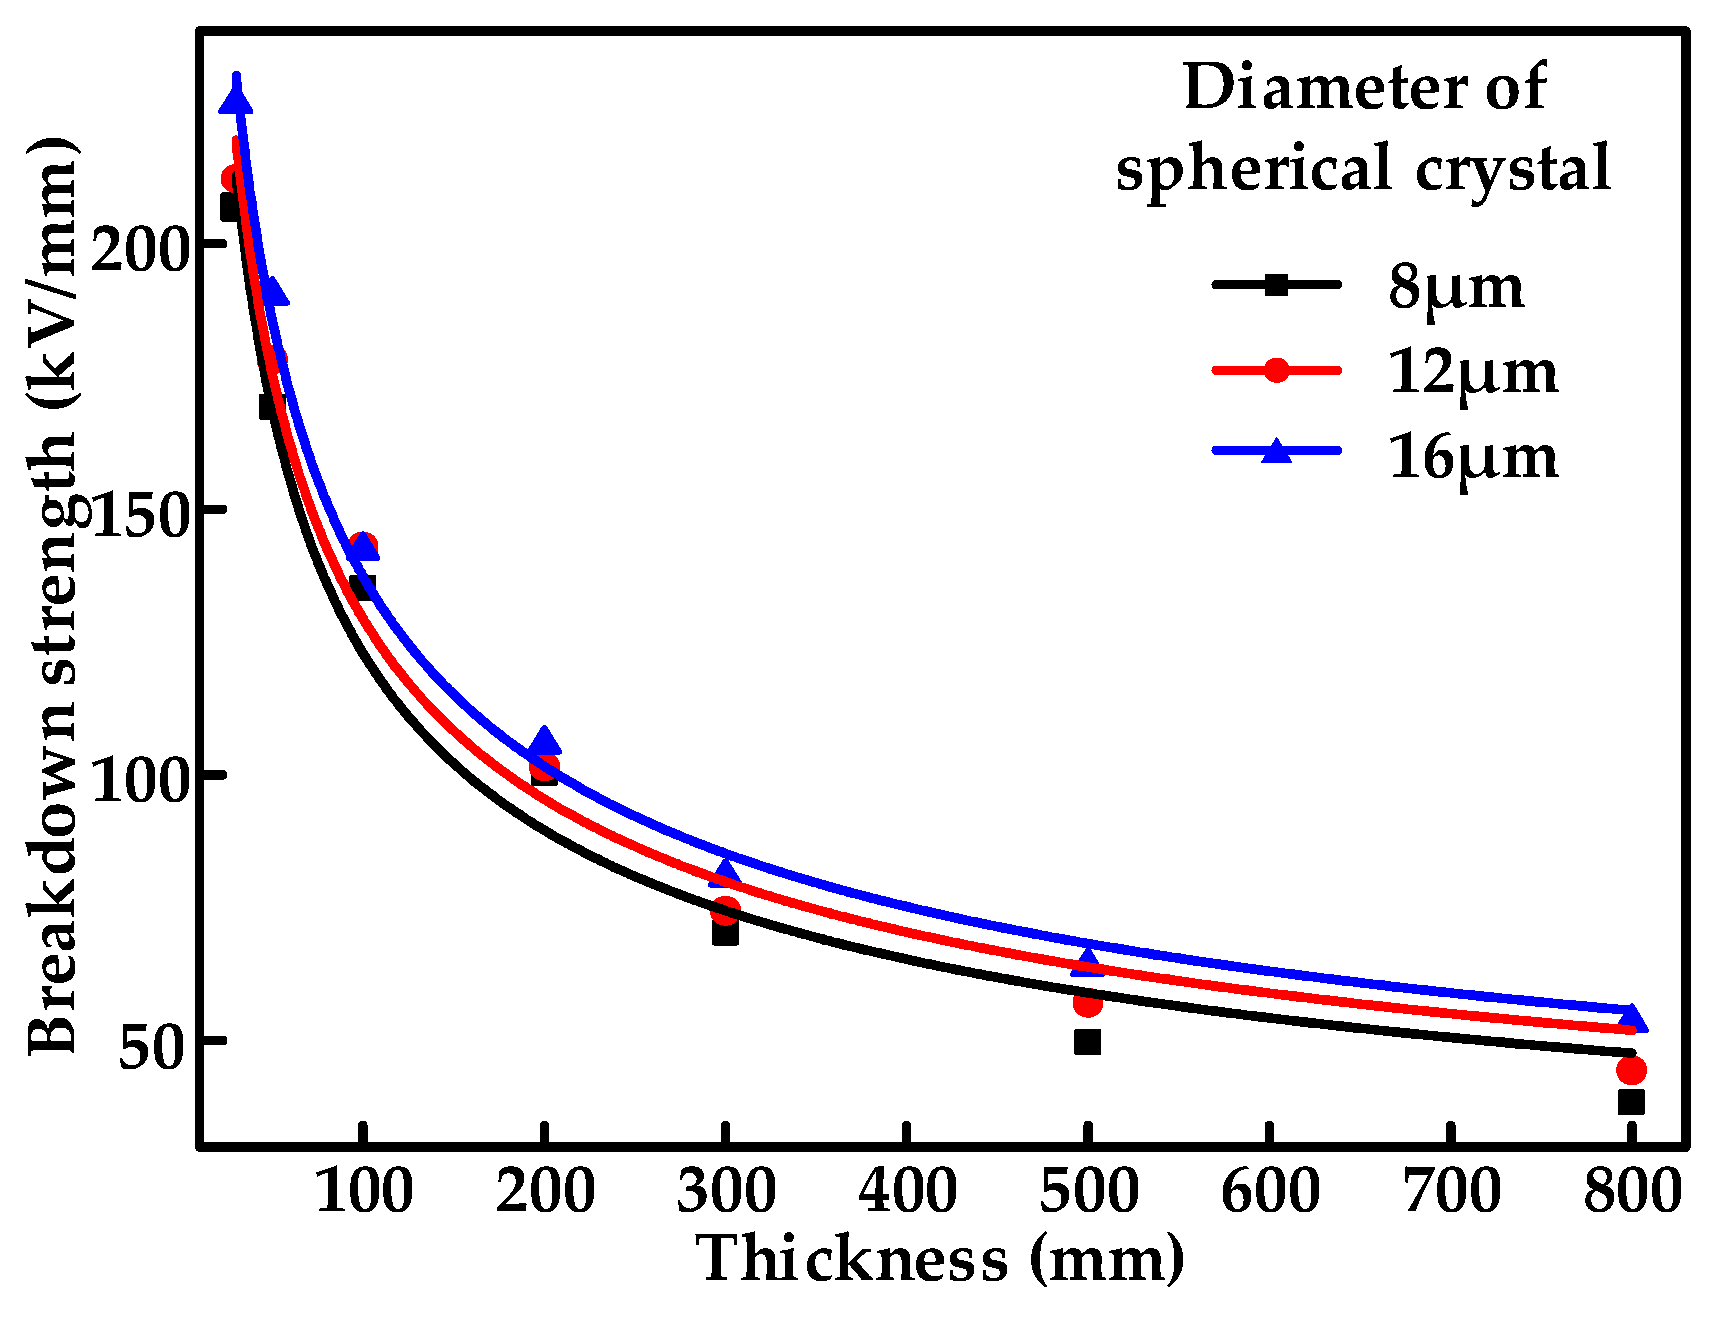
Figure 4.
(a) Electrical field distribution in XLPE of different thicknesses. (b) Relationship between the maximum value of the electrical field strength magnitude and the insulation thickness.
Figure 4.
(a) Electrical field distribution in XLPE of different thicknesses. (b) Relationship between the maximum value of the electrical field strength magnitude and the insulation thickness.

Figure 5.
Relationship between AC breakdown strength and radial positions for XLPE extruded cables.

Figure 6.
(a) FTIR results of XLPE cable slices with different radial positions. (b) DSC curves of XLPE cable slices with different radial positions.
Figure 6.
(a) FTIR results of XLPE cable slices with different radial positions. (b) DSC curves of XLPE cable slices with different radial positions.

Figure 7.
E–t characteristics of XLPE.

Figure 8.
E–t characteristics at different temperatures for XLPE insulation. (a) 30 °C, (b) 50 °C, (c) 70 °C.
Figure 8.
E–t characteristics at different temperatures for XLPE insulation. (a) 30 °C, (b) 50 °C, (c) 70 °C.
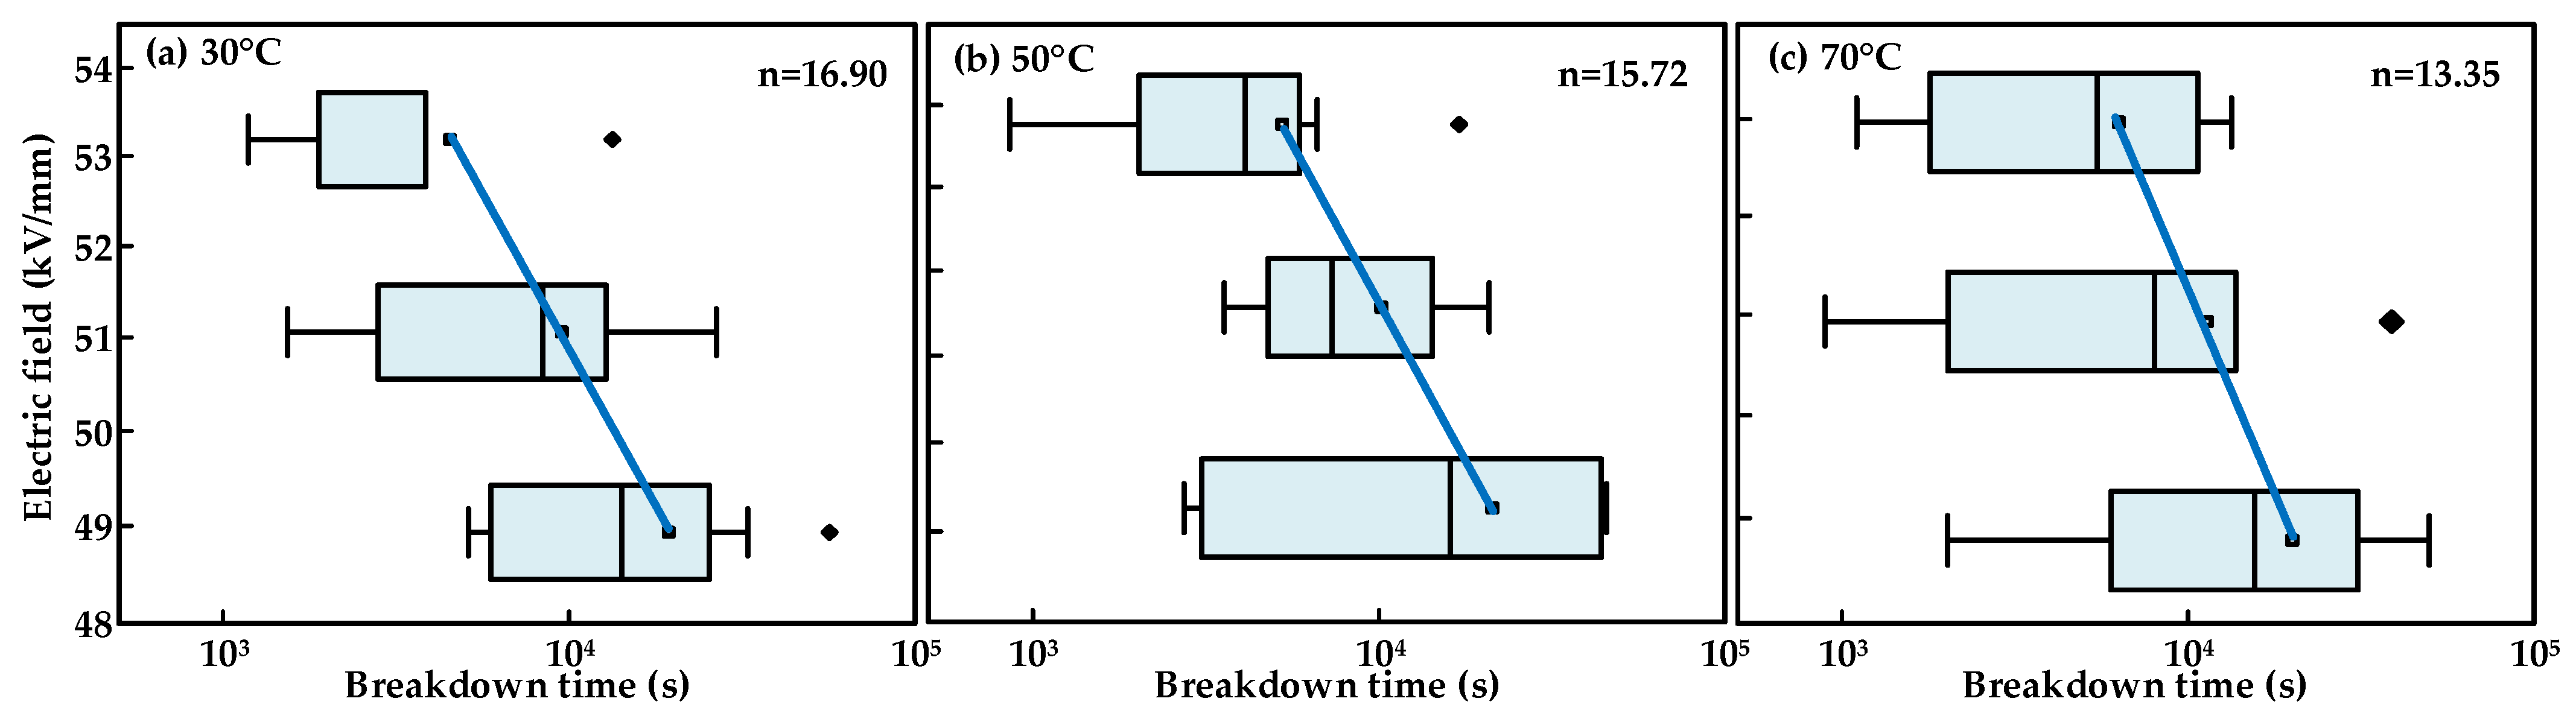
Figure 9.
(a1–a3) Remaining lifetime fitting results for the Ramu, Fallou and Simoni models. (b1–b3) Comparison of remaining lifetime results for the different models at 30, 50 and 70 °C.
Figure 9.
(a1–a3) Remaining lifetime fitting results for the Ramu, Fallou and Simoni models. (b1–b3) Comparison of remaining lifetime results for the different models at 30, 50 and 70 °C.
Disclaimer/Publisher’s Note: The statements, opinions and data contained in all publications are solely those of the individual author(s) and contributor(s) and not of MDPI and/or the editor(s). MDPI and/or the editor(s) disclaim responsibility for any injury to people or property resulting from any ideas, methods, instructions or products referred to in the content. |
© 2024 by the authors. Licensee MDPI, Basel, Switzerland. This article is an open access article distributed under the terms and conditions of the Creative Commons Attribution (CC BY) license (https://creativecommons.org/licenses/by/4.0/).
Share and Cite
MDPI and ACS Style
Li, Z.; Dong, Y.; Wu, Y.; Meng, Z.; Song, P.; Zhu, M.; Li, X.; Du, B. Breakdown Performance Evaluation and Lifetime Prediction of XLPE Insulation in HVAC Cables. Energies 2024, 17, 1337. https://doi.org/10.3390/en17061337
AMA Style
Li Z, Dong Y, Wu Y, Meng Z, Song P, Zhu M, Li X, Du B. Breakdown Performance Evaluation and Lifetime Prediction of XLPE Insulation in HVAC Cables. Energies. 2024; 17(6):1337. https://doi.org/10.3390/en17061337
Chicago/Turabian StyleLi, Zhonglei, Yuming Dong, You Wu, Zhengzheng Meng, Pengxian Song, Mingzheng Zhu, Xu Li, and Boxue Du. 2024. "Breakdown Performance Evaluation and Lifetime Prediction of XLPE Insulation in HVAC Cables" Energies 17, no. 6: 1337. https://doi.org/10.3390/en17061337
Note that from the first issue of 2016, this journal uses article numbers instead of page numbers. See further details here.