
Studying the Improvement of Solar Collector Mechanism with Phase Change Materials

1
College of Engineering, Samarra University, Samara 443086, Iraq
2
Department of Engineering, University of Exeter, Exeter EX4 4QF, UK
*
Author to whom correspondence should be addressed.
Energies 2024, 17(6), 1432; https://doi.org/10.3390/en17061432
Submission received: 15 February 2024
/
Revised: 4 March 2024
/
Accepted: 12 March 2024
/
Published: 16 March 2024
(This article belongs to the Special Issue Advances in Photovoltaic/Solar Collectors and Their Potential for an Industrial Decarbonization)
Abstract
:This study delves into the integration of phase change materials (PCM) in solar thermal collector systems to address this challenge. By incorporating nano encapsulated PCMs, researchers have mitigated concerns surrounding PCM leakage, revolutionizing the potential of solar collector systems to elevate energy efficiency, diminish carbon emissions, and yield manifold benefits. This article comprehensively investigates the design and utilization of solar phase change energy storage devices and examines the transformative impact of employing nano-coated phase change materials (Nano capsules) to augment solar collector performance. The integration of paraffin-based PCM and the insulation of the collector system have been crucial in optimizing heat retention and operational efficacy. The composition of the PCM involves a balanced blend of octadecane phase-change particles and water as the base fluid, designed to maximize thermal performance. Analysis of the experimental findings demonstrates the dynamic thermal behavior of the nano encapsulated phase change material, revealing distinctive temperature profiles about fluid dynamics and absorbent characteristics. Notably, the study emphasizes the nuanced trade-offs associated with the conductivity and melting temperature of the Nano encapsulated PCM, yielding valuable insights into energy storage capacity limitations and thermal performance variations throughout diurnal cycles. Central to the investigation, the optimal nanoparticle proportion is elucidated, shedding light on its pivotal role in modulating PCM performance. Furthermore, findings underscore the complex interplay between nanoparticle volume fraction and thermal fluid temperature, providing critical perspectives on optimizing PCM-enhanced solar collector systems.
1. Introduction
Phase change materials (PCM) are a novel category of thermal substances that change their physical state to store absorbed energy as latent energy. Upon reaching the opportune moment, they revert to their initial state and disperse the accumulated energy into their environment. The utilization of these substances in the supply of hygienic hot water and in the heating and cooling systems of structures has garnered significant interest in recent times, primarily because of the diverse range of melting temperatures shown by these substances. To accomplish a decrease in speed, one can store solar energy during periods of high temperature and utilize it to fulfill the heating requirements of the structure at nighttime. Likewise, the cooling energy produced by refrigeration generators may be stored during periods of low demand and utilized when there is no need for it—expenses related to energy utilization in the structure [1].
The solar thermal collector system used phase change materials (PCM) to enhance its efficiency. Nevertheless, the issue of PCM leakage will be a matter of concern. Researchers have discovered a solution to this problem by encapsulating phase change materials (PCMs) at the nanoscale. Linking a Pulse Code Modulation (PCM) to a solar collector system offers several advantages, such as enhanced energy efficiency and reduced carbon emissions.
Sensible heat and latent heat methods achieve thermal energy storage (TES). This is because the latent technique can store energy at a consistent temperature and possesses a greater density compared to the sensible approach [2]. The latent heat methodology is often more effective and feasible than alternative alternatives. This technology utilizes phase change materials (PCM) that possess a high latent heat capacity and can store significant heat. Despite the advantages above, they also possess disadvantages, such as poor heat conductivity and elevated viscosity. Hence, it is inevitable that flaws will be encountered, such as insufficient heat conduction and non-flowable fluid. The issue of low thermal conductivity has been tackled by methods such as encapsulation and adhesion, which involve the utilization of fins [3], porous media [4], magnetic fields [5], and nanoparticles [6]. Encapsulated micro or nanophase change materials (PCM) have many applications, such as energy storage, specifically for renewable and alternative energies [7], and enhancing thermal comfort in buildings [8]. Thermal comfort may be achieved, and energy can be conserved by utilizing phase-change materials with a suitable temperature range through the fusion process. It is released using freezing if required [9].
For thermal energy storage, the most promising method that has been considered is latent heat storage associated with molten salt mixtures as phase-change material (PCM). The binary salt mixture lithium chloride—lithium hydroxide (LiCl–LiOH) with a specific composition can store thermal energy. However, to the best of our knowledge, there is no information on their thermal stability in previous literature. The key objectives of this article Naveed Hassan et al. [10] We were going to study how the chosen salt mixture behaves when it is heated, and how it breaks down. The scientists used FactSage software to find out what the binary salt mixture was made of. The properties of heat and materials were studied using a thermal analyzer called STA. The thermal tests show that the mixture of 32% LiCl and 68% LiOH salt melts between 269 °C and 292 °C, and it releases 379 joules of heat for every gram of it that melts. We tested how well something keeps its shape when it gets heated and cooled 30 times using a special machine. We found that the temperature it melts at and the amount of heat it takes to melt didn’t change much. When the material was heated, it did not lose much weight until it reached 500 degrees Celsius. This shows that it can withstand high temperatures without breaking down easily.
Phase change materials (PCM) regulate temperature fluctuations or store energy within a defined range. Phase change materials (PCM) undergo endothermic heat absorption when they melt. During an exothermic process, heat release occurs when the phase change material (PCM) freezes. The selection of phase change materials (PCM) is primarily determined by their thermophysical, kinetic, chemical properties, by economic and environmental considerations. Paraffin waxes have been the most often used phase change materials (PCM) in the last three decades. Fatty acids, salt hydrates, and organic and inorganic compounds exhibit eutectic behavior. Modifications should be made to the functioning equipment design to correct any deficiencies [11].
According to Alisti and Roy (2000) [12], who researched the utilization of NanoPCM in functional latent heat fluids, the phase transition of micro-coated phase change particles may be accurately represented by employing the effective heat capacity model of the mixture. When considering four possible functions for the particle heat capacity as a function of temperature, the difference in results was less than 4%. Roy and Avanic published a paper in 2002 [13]. An experimental examination was conducted to study the forced and sluggish heat transfer in a tube’s phase change mixture of n-n-chosenimicro-coated articles. Their research examined the influence of Stephen’s number, volume concentration, particle diameter, and suspension homogeneity on thermal characteristics. The findings revealed that an increase in Stephen’s number at a specific concentration leads to an elevation in the wall temperature.
Additionally, in the case of pure fluid, it causes the temperature to approach the wall temperature. The wall’s temperature varies directly to the concentration, even at deficient levels—2014. The study was conducted by Park et al. [14]. The surface condensation approach was used to construct paraffin nucleation and polyurea shell-based Mag-PCMs, which consist of Fe3O4 magnetic nanoparticles (NPs) encased in PCM nanocapsules. In a study by Youfu LV et al. in 2019 [15]., the focus was on experimental research into effective heating methods for a power battery module that utilizes phase change. The results of the 90 W SP heating strategy exhibit the highest level of heating efficiency.
In a previous study by Kürklü et al. (2002) [16], the researchers examined the effectiveness of including phase transition materials in solar collectors. Specifically, they tested the performance of a solar flat plate collector that included a 50 mm layer of paraffin and a 100 mm layer of water. Papadimitratos and his colleagues: The year is 2016 [17]. An evacuated tube solar collector was employed with phase change material (PCM) to heat water and conduct several experiments. The two identical phase change materials (PCMs) had a heat pipe laced into the inner glass tube. The PCMs were made from tritriacontane and erythritol. The year 2018, Alohi et al. conducted a thorough study on the Integrated Collector Storage Solar Water Heater [18].
Optimal operating conditions were deliberated upon, considering various eventualities. The optimal outcome is achieved by combining a mass flow rate of 0.0015 kg/s, a PCM thickness of 0.01 m, and a preset temperature of 313 K. In 2020, Badei et al. [19] used statistical methods to examine the study focused on enhancing the efficiency of flat plate solar collectors. Adding phase change material (PCM) and fins to flat plate solar collectors significantly boosts summer processing efficiency from 33% to 46%. (Salahuddin et al., 2021) [20] in square brackets. An investigation on the performance of a solar water heating system that utilizes a plate collector and phase change material (PCM) storage. Solar power is a plentiful and inexhaustible source of renewable energy. A solar water heater is a device that utilizes solar energy to heat water. The writers Pawar and Subhansarbandi (2021) [21]. A study was conducted to optimize the performance of an evacuated tube solar collector that incorporates heat pipes and phase change material (PCM) during regular and on-demand operations. The effect of heat pipe position is investigated in phase I and the effect of different PCMs is investigated in phase II.
Al-Kayiem and Lin (2014). Ref. [22] Performed TES measurements on a flat solar collector utilizing paraffin wax as a phase change material (PCM) and 1.0 wt% copper nanoparticles as another PCM. They built upon prior research on nano-encapsulated phase change materials and their application in improving solar collectors. Li and Zhai 2017, [23]. The research explored the performance of an evacuated tube solar collector equipped with a heat pipe using high-performance evacuated tube collector (HPETC) technology and a phase change material (PCM) reinforced with nanoparticles. The study involved both experimental and numerical analysis. By incorporating three wt% expanded graphite, they achieved a significant enhancement in the energy storage efficiency of PCM, raising it to 40.17%.The year 2018. Lee and colleagues. The NEPCM composition employed by [24] remained unchanged, except for substituting a heat pipe with copper water, where water was utilized as the heat transfer medium. The energy storage efficiency of this innovative design was 39.98%. Multiple authors (Elbahjaoui& El Qarnia, 2019) conducted a numerical analysis on a flat plate solar collector during the charging process [25]. The storage unit, known as NEPCM, consists of vertically arranged slabs containing phase change materials reinforced with nanoparticles. (Kumar & Mylsamy, 2020) [26]. The researchers utilized CeO2-Parafins, a nano-reinforced phase change material (PCM), in a thermosiphon evacuated tube solar collector (ETSC) to evaluate the heat storage properties. The optimum NEPCM composition consists of CeO2 nanoparticles, which account for 1% of the total composition. Iachachene and colleagues (2022). Ref. [27] investigated the turbulent flow of single and hybrid nanofluids in a conical diffuser. Heat transfer coefficients and pressure losses are examined for various Reynolds numbers and nanoparticle volume fractions. The diffuser is filled with Al2O3, NEPCM Al2O3 nanofluids, and NEPCM nano-encapsulated phase change materials.
The solar heat collecting system is famous because it is pollution-free and has a high heat collection efficiency. Phase change materials (PCM) may be integrated into the solar thermal collector system to boost the efficiency of the solar collector system, according to the study. However, there will be a PCM leakage issue. By nanocapsulating PCMs, some researchers have found a solution to this problem. PCMs’ thermal conductivity and energy storage performance are strongly modified by microcoating. Connecting a PCM to a solar collector system has various benefits, including enhanced energy efficiency and decreased carbon emissions. The design of solar phase change energy storage devices and their usage are therefore studied in this thesis. A research database was utilized to assess the influence of nanoencapsulated phase change materials on boosting solar collector performance. The main goal of the research is to improve the mechanism of solar collectors with phase change materials. PCMs can be connected with solar collectors to conserve additional solar energy and regulate the temperature of photovoltaic solar collectors. In this research, adding PCM materials increases the efficiency of the solar collector. To calculate this efficiency increase, PFC (Performance Evaluation Criteria) has been used in this research.
2. Nano and Microencapsulation
The heat storage materials may sometimes have a size in the range of microns or millimeters and generally exhibit a core-shell configuration. The core of the material consists of a nanocomposite, including a phase change material, a tiny quantity of materials with very high thermal conductivity, and nanoparticles with a melting point higher than that of the phase change material. The shell comprises a thin layer of neutral nanoparticles with excellent conductivity. Throughout transitioning from a solid to a liquid state, the phase change material within the core can absorb and release latent thermal energy. The microcapsule can completely envelop the core wall and assume a spherical shape. Solidification imparts a stable structure, whereas encapsulation facilitates the safe transportation of dangerous and noxious materials. The kind of microcapsule is mainly determined by the technology employed to fabricate the shell. Figure 1 depicts different types of capsules, such as those with a solitary core, a central nucleus enclosed by a shell, multiple nuclei, multiple cores arranged in a shell, and a background material with a uniform distribution of the core material. Octadecane-n, a phase change material, can be encapsulated within polyurea to exemplify the synthesis process for this category of compounds. The use of chemical processes, such as polymerization, accomplishes this.
2.1. Description of the Solar Collector
This study examines the utilization of nanocapsule phase transition materials to improve the efficiency of solar collectors. This work involves doing numerical assessments of solar collectors that were previously examined in experimental research conducted by Carmona et al. A collector was fabricated by assembling six copper tubes, each with an outer diameter of 80 mm, a thickness of 1 mm, and a length of 1500 mm. The center-to-center spacing between the tubes is 120 mm. Pipes with a 15 mm outer diameter and a 1 mm thickness are utilized to establish a series flow pattern by connecting the copper pipes. The upper section of one pipe is fused to the bottom section of the subsequent pipe. Figure 2 illustrates the reservoir system’s schematic layout and the temperature sensors’ positions on the absorber plate and within the paraffin layer.
A layer of paraffin is used as thermal storage below the solar hot water storage source, as shown in Figure 3. In addition, the appropriate outlet is inserted into the collector, facilitating direct interaction between the paraffin and the absorbent material. To enhance heat retention, the system has been thermally insulated with a solid styrofoam board, which has a density of 40 kg/m2 and a thickness of 50 mm. The single-wall aluminum frame of the collector has precise dimensions of 0.78 m × 1.60 m, with a gap of 3.5 cm between the glass cover and absorber. Table 1. is showing Description and specifications of flat plate solar collectors.
2.2. NEPCM Material Properties
The desired mixture in the present study includes two components of water as the base fluid and phase change particles of octadecane. Water properties are calculated as polynomial functions of temperature and based on the data available in reference [5]. The properties of octadecane organic matter are shown in Table 2. The PCM enclosures were rectangular to support symmetrical expansion of the paraffin in all directions and ensure no leakage occurs in the container.
The characteristics of nanofluids necessary for examination are density, specific heat capacity, thermal conductivity coefficient, and viscosity. In order to determine these qualities, one can utilize the following relationships [28]:
In the equations above, ρ represents the density, φ denotes the volume percentage of nanoparticles in the fluid comprising rat, Cp stands for the specific heat capacity, and k represents the thermal conductivity coefficient. The subscripts w, p, and eff denote the characteristics associated with water, nanoparticles, and effectiveness, respectively.
2.3. Description of the Solar Collector
2.3.1. Governing Equations for the Water Chamber
The equations governing the transfer of momentum and energy in unrestricted motion are derived from the fundamental conservation laws. The significance of inertia and viscosity forces remains, along with energy transmission through displacement and diffusion. The equations that govern this model, as referenced by [23], may be expressed in the following manner:
The equation for the conservation of mass:
Navier-Stokes equation in the x direction:
Energy equation:
2.3.2. Governing Equations for PCM Housing
The governing equations for transient analysis of phase change material melting comprise the Navier-Stokes momentum, continuity, and energy equations. The Boucinsk approximation is employed to simulate the buoyancy forces. Below are the equations:
Momentum equation:
Energy equation:
The subscript “s” denotes the presence of solid or enclosed phase change material (PCM). The energy equation governing the solid-liquid interface during the melting process may be represented as:
S represents the interface where a phase shift occurs between a solid and a liquid. The vector n represents the perpendicular direction to the boundary between the solid and liquid phases, whereas L denotes the heat required for a substance to undergo fusion. During the freezing process, the subscripts l and s are swapped, and the latent heat of fusion is involved. The equation replaces the variable L with its negative counterpart (−L).
2.3.3. Performance Evaluation Criteria
To determine the PEC in collectors similar to the one studied in this research, many connections have been cited in numerous literature, all of which have a similar notion. This measure refers to the enhancement in heat transfer achieved by employing nano-capsule phase change materials compared to the corresponding increase in pumping power. The magnitude of heat transmission is contingent upon the volume coefficient of the phase transition material. The Nusselt number and friction value can represent it [7].
In the above relationship, Nu and f denote the friction coefficient and Nusselt number, respectively. The subscript 0 indicates the collector’s original state or the condition without phase transition material.
2.3.4. Geometric Modeling and Boundary Conditions
Two instances were analyzed during this inquiry utilizing water and PCM as the operational substances. The initial experiment entailed quantifying the sun irradiance and the temperatures of the incoming and outgoing water (Twin and Twout) on a cloudless day in February 2010. The initial conditions for this simulation are an ambient temperature of 25 °C, the freezing point of octane at 30 °C, the melting point of octane at 35 °C, a time step of 10 s, and a maximum simulation time of 24 h.
After discretization, the conditions of the problem’s solution must be explicitly defined and implemented within the AnsysFluent environment. The investigation of the intended collector is based on the premise that it is located in Baghdad, Iraq, with the coordinates of 44.361488 latitude and 33.312805 longitude. The traditional k-model is employed for investigating the turbulence of the flow, and the water will enter the collecting pipes from the south and move towards the north.
The study utilized Solidwork software version 2022 to create a geometric model of the collector. The lower box of the collector is positioned at the beginning, followed by the compartments connected to NPCEM, copper plate, water transfer pipes or nanocapsule phase change material, air chamber, tube holding box, and other components, as specified in the dimensions and sizes mentioned in the previous chapter. Figure 4a illustrates the design of the glass cover. This figure’s exploded view displays all the constituent parts designated for the collector. Furthermore, Figure 4b exhibits the constructed collector inside Solidorex. Once the collector has been developed and assembled, it must be transferred from Solidworks to Ansys software. This allows for further analysis stages, such as discretization and the application of boundary conditions, to be performed on the collector within the program. Ansys Fluent is feasible.
Subsequently, aluminum is chosen for the collector’s body, copper is used for the plate between the NPCM chambers and the pipes, and glass is utilized for the glass cover. Table 3 displays the characteristics of these three materials.
The water entering the collection pipes has a mass flow rate of 0.05 kg/s, and we disregard heat transmission and loss from the bottom and side surfaces of the collector.
3. Results
3.1. Verification
Examine the results of Moore’s previous investigation to ensure their precision and confirm the reliability of the collected data. In order to do this, the created and simulated model was analyzed using the study circumstances outlined by Carmona et al. [28]. The mesh convergence technique was employed to pick the appropriate components for this model. The results of this comparison are depicted in Figure 5.
As seen in the image described earlier, the results of the computational fluid dynamics analysis conducted in line with the criteria provided in the referenced source closely resemble the findings of this study. The maximum disparity between these two plots is around 11%. The disparities observed in some areas between the two graphs may arise from both experimental testing mistakes and inherent discrepancies between the outcomes of the numerical and experimental approaches. It is customary and can be disregarded. Consequently, one can confidently affirm that the research’s outcomes are precise and dependable.
3.2. Analysis of the Fluid Inside The Pipes
The subsequent analysis presents the outlines and outcomes of variations in fluid temperature and other associated factors within the collector, influenced by solar radiation during daylight hours on 21 June in Baghdad city.
3.2.1. Analysis of Fluid Temperature Inside the Collector
Figure 6 displays the contour of the temperature distribution of the fluid inside the collecting tubes.
The graphic illustrates the gradual increase in temperature of the cold fluid as it enters the collector and is dispersed inside the sub-pipes of the collector. As the end rows are approached, the temperature increase in the secondary pipes is exacerbated.
Except for the pipe’s last section, the initial pipe’s temperature, which corresponds to the fluid’s entry point into the collector, remains consistently equal to the intake temperature. As a result of blockage and decreased fluid movement at the end of the pipe, the fluid remains still. It becomes hotter until it reaches its maximum temperature in this specific area of the collecting tubes. The obstructed section on the output side serves as another illustration of this issue. To accurately identify the temperature distribution, fluid turbulence, and fluid calmness at these two locations, Figure 7 exhibits detailed photographs of the contour of the fluid temperature at the sealed ends of the intake and outflow pipes. In addition, the second pipe illustrates the progressive increase in temperature of the fluid as it approaches the output. Figure 8 illustrates the fluctuations in fluid temperature as it leaves the collection point.
From the image shown, it is evident that during the early hours of the day, when solar radiation is minimal, the temperature of the fluid discharged from the collector is low. Nevertheless, the temperature progressively climbs and reaches 5 degrees when the radiation intensity escalates throughout midday. By 14:00, the temperature rises to 57 degrees Celsius. The outflow fluid reaches its peak temperature between 12:00 and 14:00 and remains relatively stable.
This figure demonstrates that the temperature of the fluid leaving the collector lowers as the day proceeds towards sunset. However, the rate of this temperature decline is comparable to the temperature increase in the morning. The duration of the day is somewhat reduced. The PCM function, characterized by a gradual reduction in the temperature of the output fluid, is responsible for the diminished slope shown in the last sections of the figure. This reduction is achieved by releasing the energy stored inside the PCM and transferring it to the fluid inside the collection tubes. During the late hours of the day, when the sun’s radiation is minimal, the utilization of nanoencapsulated phase change material in the collector results in the water temperature exiting the collection being elevated to a level above 40 degrees Celsius. There is an asymmetry in the temperature of the water exiting the collector during different times of the day. Specifically, the graph shows significantly higher values during the last hours of the day. This can be attributed to the utilization of nanoencapsulated phase change material, which enhances the visualization of this observation. If we define the midpoint of the graph as the time when the water temperature from the collector reaches its highest point, it will correspond to the middle hours of the day. The nanoencapsulated phase change material, which has absorbed heat during the day by melting, releases this heat in the evening. It is then transferred to the copper plate and then conducted through the copper plate to the tubes. The item is transferred to the collector. Consequently, the water temperature leaving the collector remains relatively constant in the afternoon, particularly at night, without experiencing a dramatic decline when sunlight diminishes.
3.2.2. Velocity Distribution Inside the Collector Tubes
Figure 9 depicts the flow lines within the collector. From the above graphic, it is evident that the fluid velocity reaches its peak when entering and exiting the collector. However, at the terminal sections of the intake pipe and the initial sections of the output pipe, the fluid velocity approaches its minimum threshold, resulting from the obstruction of the fluid pathway in these regions. Furthermore, the velocity of the fluid is reduced in the sub-pipes close to the collector’s intake. As the fluid progresses through the inlet pipe, the velocity of the fluid in the sub-pipes becomes higher.
As the fluid ascends the input pipe, as seen in Figure 9, the density of the velocity vectors gradually decreases until it nearly reaches zero in the terminal sections of the pipe. The fluid outlet pipe from the collector demonstrates a contrasting behavior compared to the process described earlier. This is due to the gradual release of the fluid into the secondary pipes. In the outlet pipe, as the fluid particles approach the pipe’s end, the velocity vectors’ density and dimensions gradually rise. The velocity vectors in the fluid entering the sub-pipes are noticeably more potent than those departing them. The reduced diameter of the sub-pipes compared to the intake and output pipes is the cause of this phenomenon, resulting in decreased fluid velocity and, thus, reduced velocity vectors.
Furthermore, the dispersion of velocity vectors in different directions indicates a higher level of disruption in the region where fluid enters the sub-pipes. The remarkably sparse distribution of velocity vectors in the obstructed sections of the inlet and outlet pipes indicates stagnation and limited fluid movement in these regions.
Furthermore, Figure 10 demonstrates the impact of the mass flow rate of the entering water on the output water temperature in the collecting pipes. The graph clearly illustrates that the mass flow rate of the fluid entering the pipes reduces the output water’s temperature as the velocity of the incoming fluid rises. Nevertheless, when the incoming fluid’s velocity escalates, the graph’s gradient diminishes. This indicates that doubling the fluid flow rate into the collector will result in a 7.6% decrease in the temperature of the exit.
3.2.3. Pressure Distribution in Collector Pipes
Figure 11 illustrates the variations in pressure within the collecting tubes. This image illustrates a deviation from the temperature growth pattern observed in the preceding section. Specifically, the fluid pressure within the collecting pipes gradually drops as it reaches the output portion. The pressure drop persists until the output fluid pressure reaches equilibrium with the air pressure, as seen in the picture above. Thus, the pressure in the intake pipe, particularly when the fluid enters the collector, reaches its highest level while it reaches its lowest level at the outflow section.
3.2.4. Kinetic Energy of Turbulence
Figure 12 displays the contour of the kinetic energy distribution within the collecting tubes, depicting the turbulence. Figure 12 illustrates that the highest level of turbulence’s kinetic energy occurs at the fluid’s input and outflow sections into the collector. In contrast, the lowest level is observed in the central sections of the pipes. However, when comparing the distribution of this characteristic in the inlet and outlet pipes, it becomes evident that it is more prevalent in the fluid output sections and covers a larger surface area.
3.2.5. Analysis of the Temperature of the Absorbent Copper Plate
Figure 13 illustrates the standard fluctuations in temperature of the copper absorber plate. This plate is positioned between the collection tubes and the enclosed chamber containing the phase change material. This graph illustrates the average temperature fluctuation on the copper absorber plate throughout the day. It closely resembles the behavior of the temperature of the water exiting the collector. However, the numerical value of the average plate temperature remains constant. The temperature of copper is higher than that of the water as it comes out of the collector, which is also quite normal.
The copper absorbent plate attains a peak temperature of 62.48 degrees Celsius at 14:00 and a minimum temperature of 6.0 degrees Celsius, which signifies the beginning of the analysis. Utilizing the nano-encapsulated phase changer beneath it ensures that the copper absorber plate maintains the same temperature as the water leaving the collector, even at high temperatures at the end of the day.
3.2.6. Analysis of the Compartment Containing the Nano Encapsulated Phase Change Agent
This section examines the temperature distribution of the nano-encapsulated phase transition material (Octadane) after examining the water within the collection tubes. Figure 14 illustrates the temperature distribution within the collector’s 5% volume portion at a given hour using the nano encapsulated phase change material. The temperature of the material falls as it advances away from the copper absorber plate, as seen in the image until it reaches the center point of the lowest surface of the material. The highest temperature of the material is located in its outermost layer. The phase transition of the donor exhibits the most minimal temperature. The low heat conductivity of paraffin wax causes this situation.
Consequently, the higher sections of these chambers surpass the temperature at which melting occurs and undergoes liquefaction. In contrast, the lower sections do not reach the necessary temperature to induce the substance to melt. An issue with using this material is that the heat generated in the collector is insufficient to melt the nano encapsulated phase changer material because of its low conductivity and relatively high melting temperature. This hinders the utilization of the code’s full potential for energy storage.
Figure 15 displays the temperature fluctuations in the phase change material with a volume percentage of 5% that has been nano encapsulated. As seen in the figure above, the average temperature variations in the nano encapsulated phase change material exhibit comparable behavior to the average temperature fluctuations in the absorber copper plate and the temperature of the fluid exiting the collector. However, this diagram and the previous diagrams differ regarding the numerical values displayed in this figure. The maximum temperature is determined by subtracting the maximum temperature of the liquid at the collector from the maximum temperature of the copper plate at the absorber. Furthermore, this specific region of the collector exhibits a reduced heat dissipation rate compared to its other sections during the midday hours. This material undergoes partial melting and refreezing in response to decreasing solar radiation, resulting in a gradual reduction in temperature. Figure 16 compares temperatures for the outlet fluid, the absorbent copper plate, and the nano encapsulated phase change material with a volume percentage of 5%. The comparison uses three plots: outlet fluid temperature, absorbent copper plate average temperature, and phase change material average temperature. According to the graph, the temperature of the nano encapsulated phase change material in the morning is intermediate between the temperature of the fluid exiting the collector and the temperature of the absorbent copper plate. Nevertheless, when the temperature of this chemical gradually decreases over the evening, its temperature graph surpasses that of the other two chemicals. But in the last hours of the day, due to the slow process of reducing the temperature of the PCM material, its temperature graph is higher than the other two graphs.
3.2.7. Comparison of Obtained Results with Experimental Results
Figure 17 compares the water temperature produced by the collector in the current study with the results of the experimental research conducted by Carmona et al. in 2017. The graph demonstrates a tight proximity between both plots, with a near coincidence noted at the beginning of the day and continuing until around 10 am. However, the graph generated in this study exhibits a more significant number of data points as the midday approaches compared to the experimental findings of Carmona et al. The collector under investigation was employed in an experimental trial conducted in Colombia, a geographical and solar radiation setting distinct from Iraq. This discrepancy in geographic location may account for the variation observed in the simulated collector, which is associated with Iraq and, specifically, the city of Baghdad. Herdon Modar’s activities, nonetheless, exhibit a comparable level of quality. In each of these figures, the rate of temperature decrease of the water departing the collector is slower during the second half of the day compared to the rate of temperature increase throughout the morning. Approximately 25% of the disparity between these two graphs occurs at 6:00 pm. Moreover, there is a 10-15% disparity between these two plots at the midday period.
3.2.8. The Effect of Using a Phase Changer
Figure 18 illustrates the temporal variations of the collector’s output temperature in two modes throughout the save/recovery cycle, one with and without a phase change material (PCM). Furthermore, the curves in both situations are indistinguishable. There is a noticeable time delay between the two profiles, with the temperature in the PCM temperature mode reaching its highest point of 57.55 °C around 2:00 PM. In contrast, the temperature in the second example (without the PCM) reaches its highest point of 65.7 °C about 1:00 PM. Indeed, the temperature of the collector equipped with PCM increases to a lesser extent during the day than that of the collector without PCM. This occurs because solar radiation directly impacts the melting of the PCM, thereby enabling the storage of latent heat. The amount of heat stored in both situations is directly proportional to the difference between the highest temperatures. The temperature curve with PCM exhibits greater values in the afternoon than the curve without PCM, suggesting that PCM effectively provides an equivalent level of heat storage during daylight.
3.2.9. Effect of Nano Capsule Volume Fraction
Figure 19 investigates the effect of incorporating phase change material (PCM) at two distinct mass concentrations (5% and 10%) on the temperature of the resulting hot water. The results suggest that the researchers achieved higher water temperatures by encapsulating phase change material (PCM) at the nano level, compared to using pure PCM alone. Indeed, a volume proportion of 5% significantly elevates the temperature of the hot water discharged from the outlet. Because the nanoparticles can store more thermal energy than typical PCM in the morning, they can swiftly recover that energy in the evening.
In reality, only a short duration is spent at the elevated temperature of micro PCM. Nano encapsulating PCM enhances the conductive heat transmission from the copper pipe to the hot water outlet. This phenomenon may be attributed to the enhanced energy storage capabilities of the nano-PCM contained within the chamber. Consequently, the hot water supply duration is prolonged due to the efficient charging, particularly when solar radiation reaches its maximum intensity. While undergoing the discharge operation, it was subjected to heat.
Consequently, using Nano-PCM within the housing increases heat retention throughout the charging process. Nano encapsulated PCM has a higher capacity to store thermal energy than pure PCM due to its improved thermal conductivity. Nevertheless, the increase in the proportion of PCM volume can decrease the temperature of the hot water outlet. The exit hot water temperature is effectively reduced by 10% due to the presence of a volume proportion of PCM. The volume fraction of 5% is more than that of 10%, indicating that the rise in volume fraction is not arbitrary. An increase in the volume fraction of PCM can reduce the outlet temperature of hot water. In fact, a volume fraction content of 10% PCM lowers the outlet hot water temperature. Therefore, it can be claimed that adding volume fraction to any value is not effective and the optimal fraction volume should be found.
3.2.10. Effect of Nano Capsule Volume Fraction
Figure 20 displays the average water temperature within the collector during 14 h, while different volume fractions of PCM are flowing at a mass flow rate of 0.05 kg/s. The fluid temperature experiences a decreasing rate of increase throughout the length of the collector due to the elevated incoming radiation intensity, as seen in the picture. The lower the volume percentage, the greater the radiation energy absorption by the nanofluid at the bottom. Hence, when dealing with minuscule volume fractions, accurately assessing the impact of solar radiation intensity on the temperature of the top surface becomes challenging.
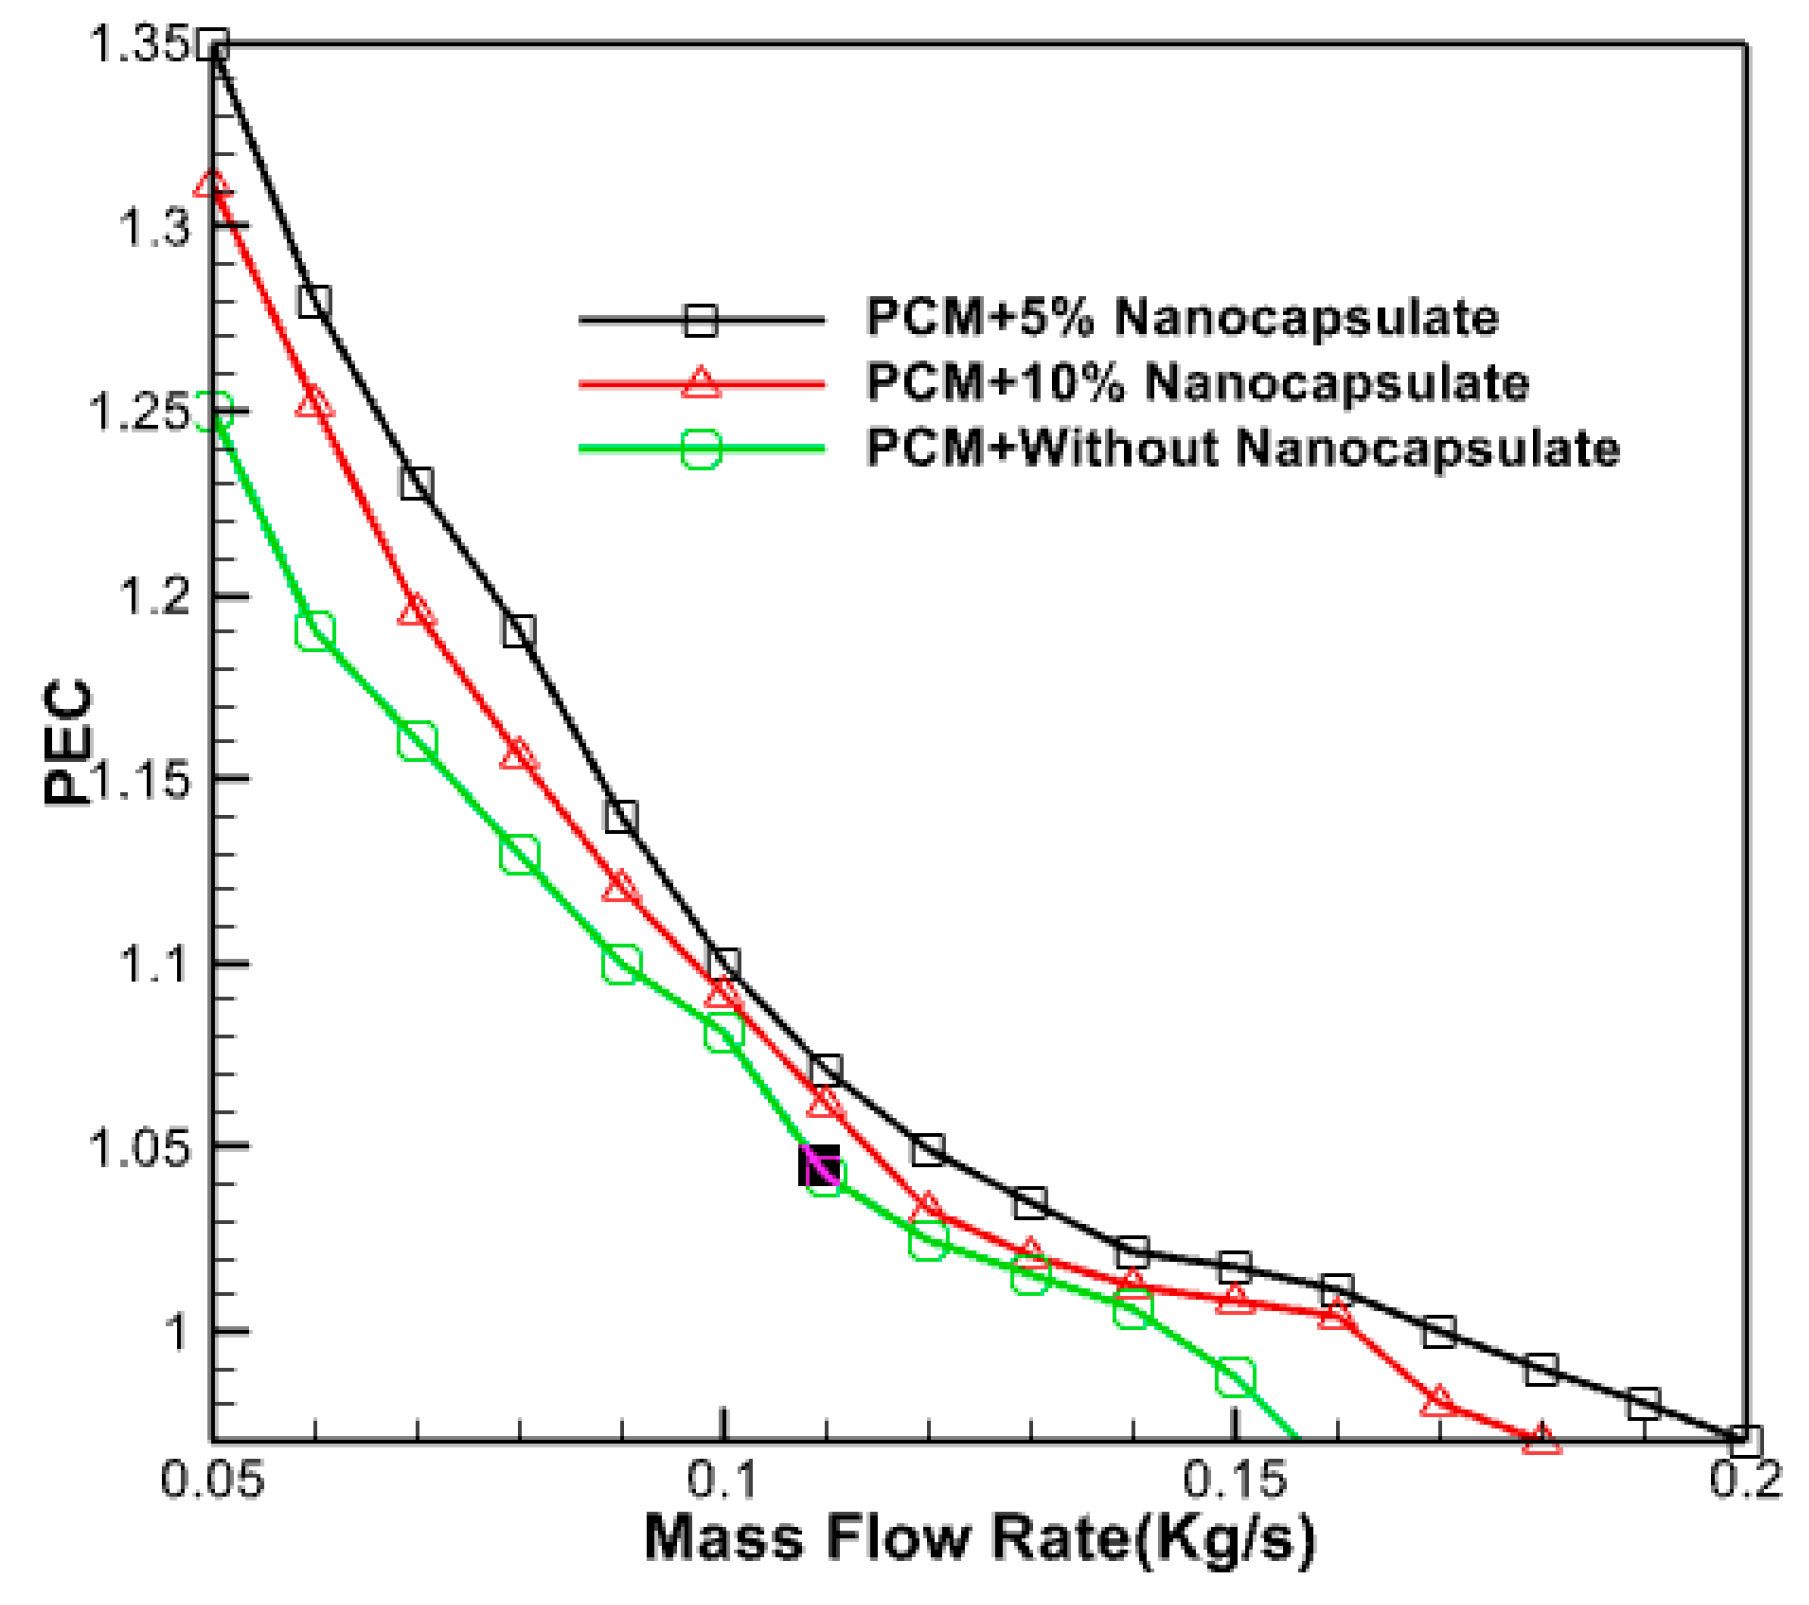
3.2.11. In Thermal Efficiency of the Collector with the Addition of Nano Capsule Phase Change Materials
Figure 21 illustrates the changes in the thermal efficiency of the collector for different volume percentages of PCM in proportion to the mass flow rate of the input fluid. The graphic demonstrates the collector’s efficiency decline as the mass flow rate increases. The optimal efficiency is achieved with a volume percentage of 5% and a mass flow rate of 0.05 kg/s.
By augmenting the concentration of phase-changer particles, one may enhance adequate fluid absorption and heat storage capabilities. The mixed fluid then absorbs and releases more heat from the system as it flows through the collector, enhancing the system’s cooling efficiency. The maximum coefficient of performance of 1.4 has been seen when the mass flow rate is at its lowest, and the volume fraction is at its highest. The coefficient of performance drops as the mass flow rate increases and the particle concentration lowers. A complete analysis has determined that a combination of phase change nano capsules in this configuration exhibits superior thermo-hydrodynamic performance compared to pure water. This conclusion is based on the observation that all performance coefficients for nano capsule states are more significant than one. Nevertheless, the performance improvement is more significant at lower fluid flow rates. Consequently, employing these nanoparticles that undergo phase change within the heat absorbers of the collector at lower velocities is recommended.
4. Conclusions
In this research, the performance improvement of solar collectors was studied using nano encapsulated phase change materials with the help of computational fluid dynamics method. The most important results obtained from this research are:
- The fluid becomes stagnant and reaches its highest temperature in this section of the collecting tubes at the end of the pipe due to the obstruction and absence of movement.
- The utilization of nano encapsulated phase change material, which releases and transfers stored energy to the fluid inside the collector tubes, reduces the outlet fluid’s temperature with a smaller gradient. This phenomenon can be attributed to the decreased slope observed in the terminal sections of the temperature change diagram of the fluid exiting the collector.
- The peak fluid velocity is observed at the collection’s entry and exit points. Nevertheless, the velocity of the fluid is at its minimum at the termination of the intake pipe and the commencement of the outflow pipe.
- The density and magnitude of the velocity vectors progressively increase in the outflow pipe as the fluid particles reach the end of the conduit.
- The outflow fluid reaches its peak temperature between 12:00 and 14:00 and remains relatively stable.
- At 6 PM, there is a 25% disparity between the graphs computed in this study and the graph given by Carmona et al. in 2017. There is a 10% disparity between the two plots during the daytime. Their values might differ by a maximum of 15%.
- The study determined that the ideal proportion of nanoparticles was 5%. Augmenting the volume fraction of nanoparticles within the PCM does not invariably enhance performance and elevate the temperature of the fluid emerging from it.
Author Contributions
Conceptualization, S.O., A.R., M.D., M.R.R. and M.A.; methodology, A.R. and M.A.; validation, A.R., M.D. and M.A.; formal analysis, A.R. and M.A.; investigation, M.A., S.O. and M.D.; resources, M.A.; writing—original draft preparation, A.R. and S.O.; writing—review and editing, M.R.R., A.R., M.A. and M.D.; visualization, A.R., S.O., M.D. and M.A.; supervision, M.A. and M.D.; project administration, M.A. and M.D. All authors have read and agreed to the published version of the manuscript.
Funding
This research received no external funding.
Data Availability Statement
Data are available upon request.
Conflicts of Interest
The authors declare no conflict of interest.
References
- Yang, L.; Jin, X.; Zhang, Y.; Du, K. Recent development on heat transfer and various applications of phase-change materials. J. Clean. Prod. 2020, 287, 124432. [Google Scholar] [CrossRef]
- Sadeghi, H.M.; Babayan, M.; Chamkha, A. Investigation of using multi-layer PCMs in the tubular heat exchanger with periodic heat transfer boundary condition. Int. J. Heat Mass Transf. 2020, 147, 118970. [Google Scholar] [CrossRef]
- Jahangiri, A.; Ahmadi, O. Numerical investigation of enhancement in melting process of PCM by using internal fins. J. Therm. Anal. Calorim. 2019, 137, 2073–2080. [Google Scholar] [CrossRef]
- Sheikholeslami, M. Solidification of NEPCM under the effect of magnetic field in a porous thermal energy storage enclosure using CuO nanoparticles. J. Mol. Liq. 2018, 263, 303–315. [Google Scholar] [CrossRef]
- Ghalambaz, M.; Doostanidezfuli, A.; Zargartalebi, H.; Chamkha, A.J. MHD phase change heat transfer in an inclined enclosure: Effect of a magnetic field and cavity inclination. Numer. Heat Transf. Part A Appl. 2017, 71, 91–109. [Google Scholar] [CrossRef]
- Ghalambaz, M.; Doostani, A.; Chamkha, A.J.; Ismael, M.A. Melting of nanoparticles-enhanced phase change materials in an enclosure: Effect of hybrid nanoparticles. Int. J. Mech. Sci. 2017, 134, 85–97. [Google Scholar] [CrossRef]
- Su, J.F.; Wang, L.X.; Ren, L. Preparation and characterization of double-MF shell microPCMs used in building materials. J. Appl. Polym. Sci. 2005, 97, 1755–1762. [Google Scholar] [CrossRef]
- Hawlader, M.; Uddin, M.; Zhu, H.J. Preparation and evaluation of a novel solar storage material: Microencapsulated paraffin. Int. J. Sol. Energy 2000, 20, 227–238. [Google Scholar] [CrossRef]
- Liu, C.; Rao, Z.; Zhao, J.; Huo, Y.; Li, Y. Review on nanoencapsulated phase change materials: Preparation, characterization and heat transfer enhancement. Nano Energy 2015, 13, 814–826. [Google Scholar] [CrossRef]
- Hassan, N.; Minakshi, M.; Ruprecht, J.; Liew, W.Y.H.; Jiang, Z.-T. A Binary Salt Mixture LiCl–LiOH for Thermal Energy Storage. Materials 2023, 16, 1434. [Google Scholar] [CrossRef]
- Souayfane, F.; Fardoun, F.; Biwole, P.-H. Phase change materials (PCM) for building cooling applications: A review. Energy Build. 2016, 129, 396–431. [Google Scholar] [CrossRef]
- Alisetti, E.L.; Roy, S.K. Forced convection heat transfer to phase change material slurries in circular ducts. J. Thermophys. Heat Transf. 2000, 14, 115–118. [Google Scholar] [CrossRef]
- Roy, S.K.; Avanic, B.L. Laminar forced convection heat transfer with phase change material suspensions. Int. Commun. Heat Mass Transf. 2001, 28, 895–904. [Google Scholar] [CrossRef]
- Park, S.; Lee, Y.; Kim, Y.S.; Lee, H.M.; Kim, J.H.; Cheong, I.W.; Kohl, W.-G. Magnetic nanoparticle-embedded PCM nanocapsules based on paraffin core and polyurea shell. Colloids Surf. A Physicochem. Eng. Asp. 2014, 450, 46–51. [Google Scholar] [CrossRef]
- Lv, Y.; Yang, X.; Zhang, G.; Li, X. Experimental research on the effective heating strategies for a phase change material-based power battery module. Int. J. Heat Mass Transf. 2019, 128, 392–400. [Google Scholar] [CrossRef]
- Kürklü, A.; Özmerzi, A.; Bilgin, S. Thermal performance of a water-phase change material solar collector. Renew. Energy 2002, 26, 391–399. [Google Scholar] [CrossRef]
- Papadimitratos, A.; Sobhansarbandi, S.; Pozdin, V.; Zakhidov, A.; Hassanipour, F. Evacuated tube solar collectors integrated with phase change materials. Sol. Energy 2016, 129, 10–19. [Google Scholar] [CrossRef]
- Allouhi, A.; Ait Msaad, A.; Benzakour Amine, M.; Saidur, R.; Mahdaoui, M.; Kousksou, T.; Pandey, A.K.; Jamil, A.; Moujibi, N.; Benbassou, A. Optimization of melting and solidification processes of PCM: Application to integrated collector storage solar water heaters (ICSSWH). Sol. Energy 2018, 171, 562–570. [Google Scholar] [CrossRef]
- Badiei, Z.; Eslami, M.; Jafarpur, K. Performance improvements in solar flat plate collectors by integrating with phase change materials and fins: A CFD modeling. Energy 2020, 192, 116719. [Google Scholar] [CrossRef]
- Syahruddin, A.S.; Jalaluddin, J.; Hayat, A. Performance Analysis Of Solar Water Heating System With Plate Collector Integrated Pcm Storage. EPI Int. J. Eng. 2021, 3, 143–149. [Google Scholar] [CrossRef]
- Pawar, V.R.; Sobhansarbandi, S. Design optimization and heat transfer enhancement of energy storage-based solar thermal collector. Sustain. Energy Technol. Assess. 2021, 46, 101260. [Google Scholar] [CrossRef]
- Al-Kayiem, H.H.; Lin, S.C. Performance evaluation of a solar water heater integrated with a PCM nanocomposite TES at various inclinations. Sol. Energy 2014, 109, 82–92. [Google Scholar] [CrossRef]
- Li, B.; Zhai, X. Experimental investigation and theoretical analysis on a mid-temperature solar collector/storage system with composite PCM. Appl. Therm. Eng. 2017, 124, 34–43. [Google Scholar] [CrossRef]
- Li, B.; Zhai, X.; Cheng, X. Experimental and numerical investigation of a solar collector/storage system with composite phase change materials. Sol. Energy 2018, 164, 65–76. [Google Scholar] [CrossRef]
- Elbahjaoui, R.; El Qarnia, H. Performance evaluation of a solar thermal energy storage system using nanoparticle-enhanced phase change material. Int. J. Hydrogen Energy 2019, 44, 2013–2028. [Google Scholar] [CrossRef]
- Kumar, P.M.; Mylsamy, K. A comprehensive study on thermal storage characteristics of nano-CeO2 embedded phase change material and its influence on the performance of evacuated tube solar water heater. Renew. Energy 2020, 162, 662–676. [Google Scholar] [CrossRef]
- Iachachene, F.; Haddad, Z.; Arıcı, M.; Abu-Nada, E. The effect of nano encapsulated phase change materials and nanoparticles on turbulent heat transport: A conical diffuser scenario. J. Energy Storage 2022, 52, 104703. [Google Scholar] [CrossRef]
- Carmona, M.; Palacio Vega, M.; Martinez, A. Experimental analysis of a flat plate solar collector with integrated latent heat thermal storage. Contemp. Urban Aff. 2017, 1, 7–12. [Google Scholar] [CrossRef]
Figure 1.
Schematic image of the capsule.
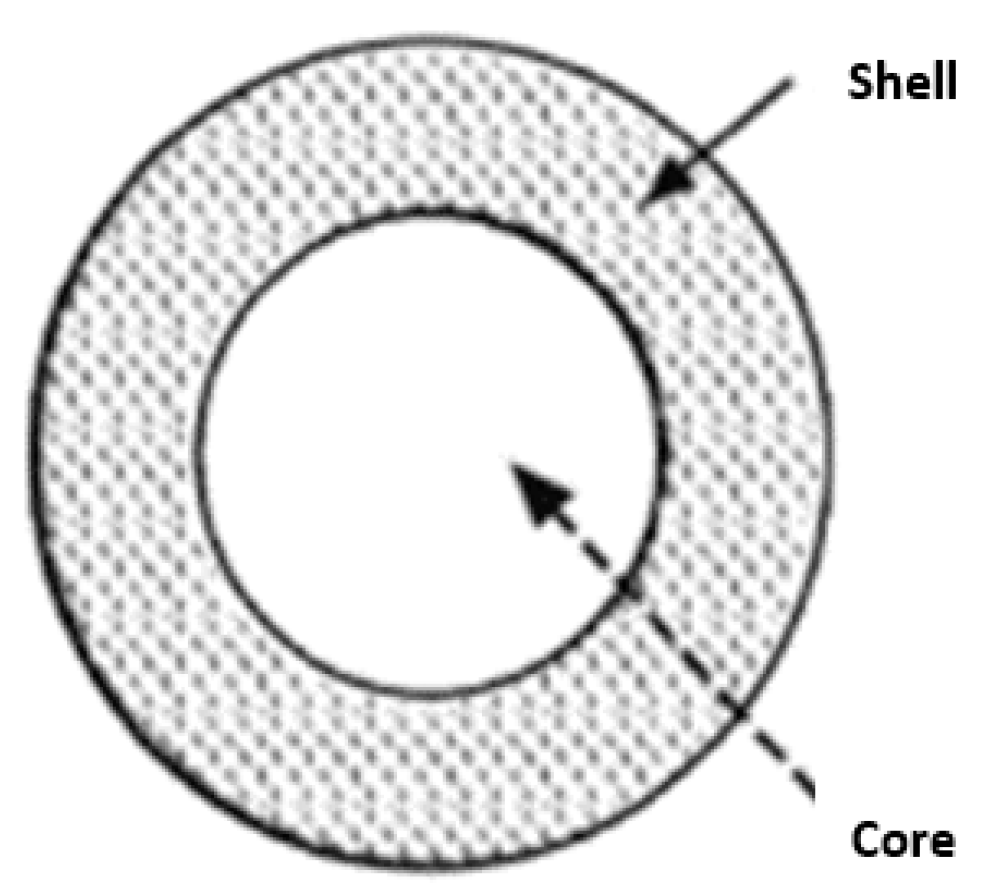
Figure 2.
Schematic of the storage system showing the temperature measurement location inside the paraffin and on the absorbent plate, [28].
Figure 2.
Schematic of the storage system showing the temperature measurement location inside the paraffin and on the absorbent plate, [28].
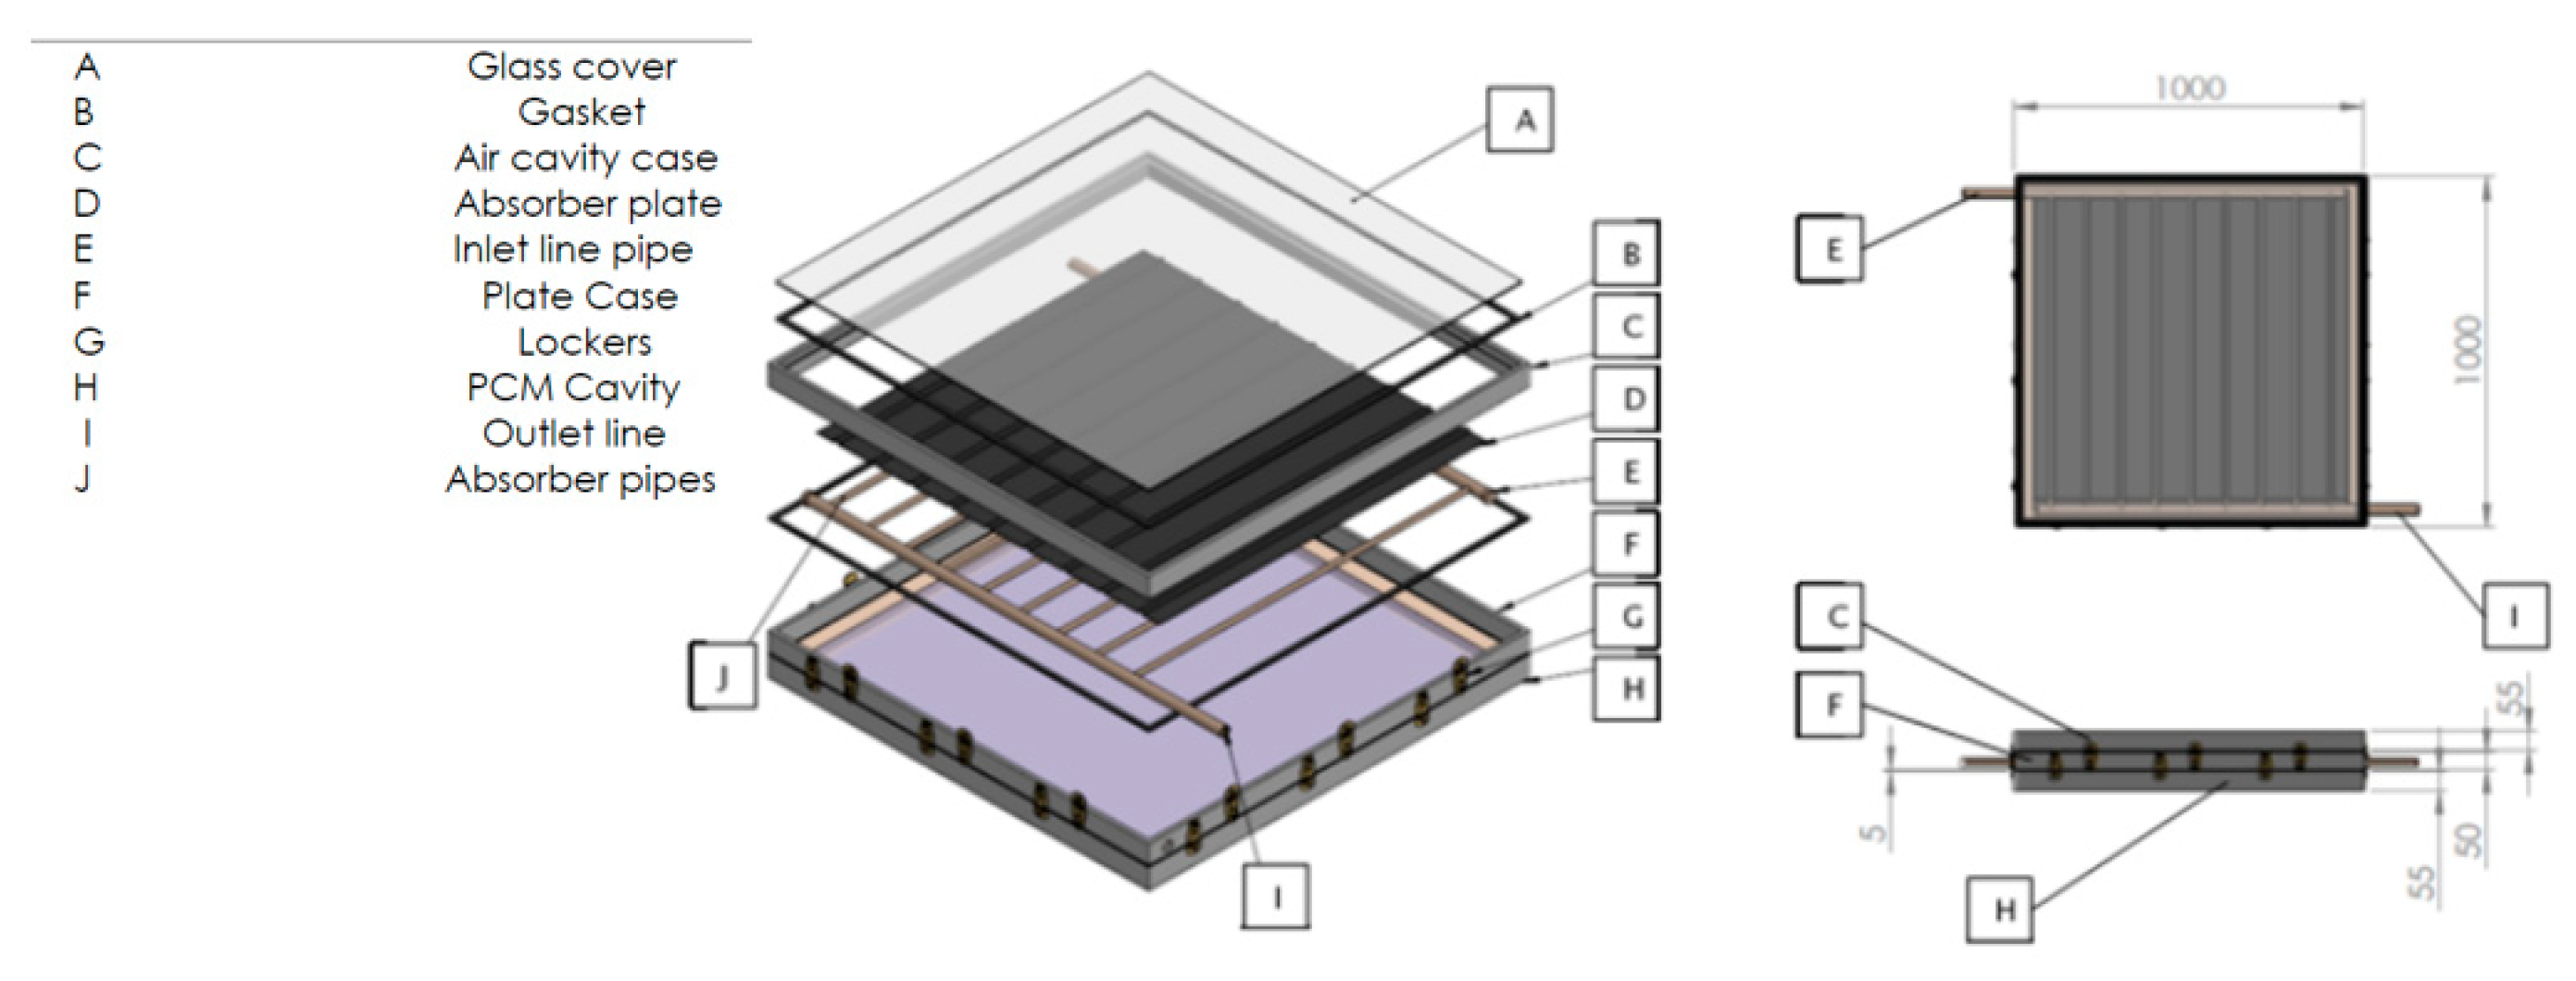
Figure 3.
Schematic of the storage system showing the location of the paraffin backing layer, [28].
Figure 3.
Schematic of the storage system showing the location of the paraffin backing layer, [28].
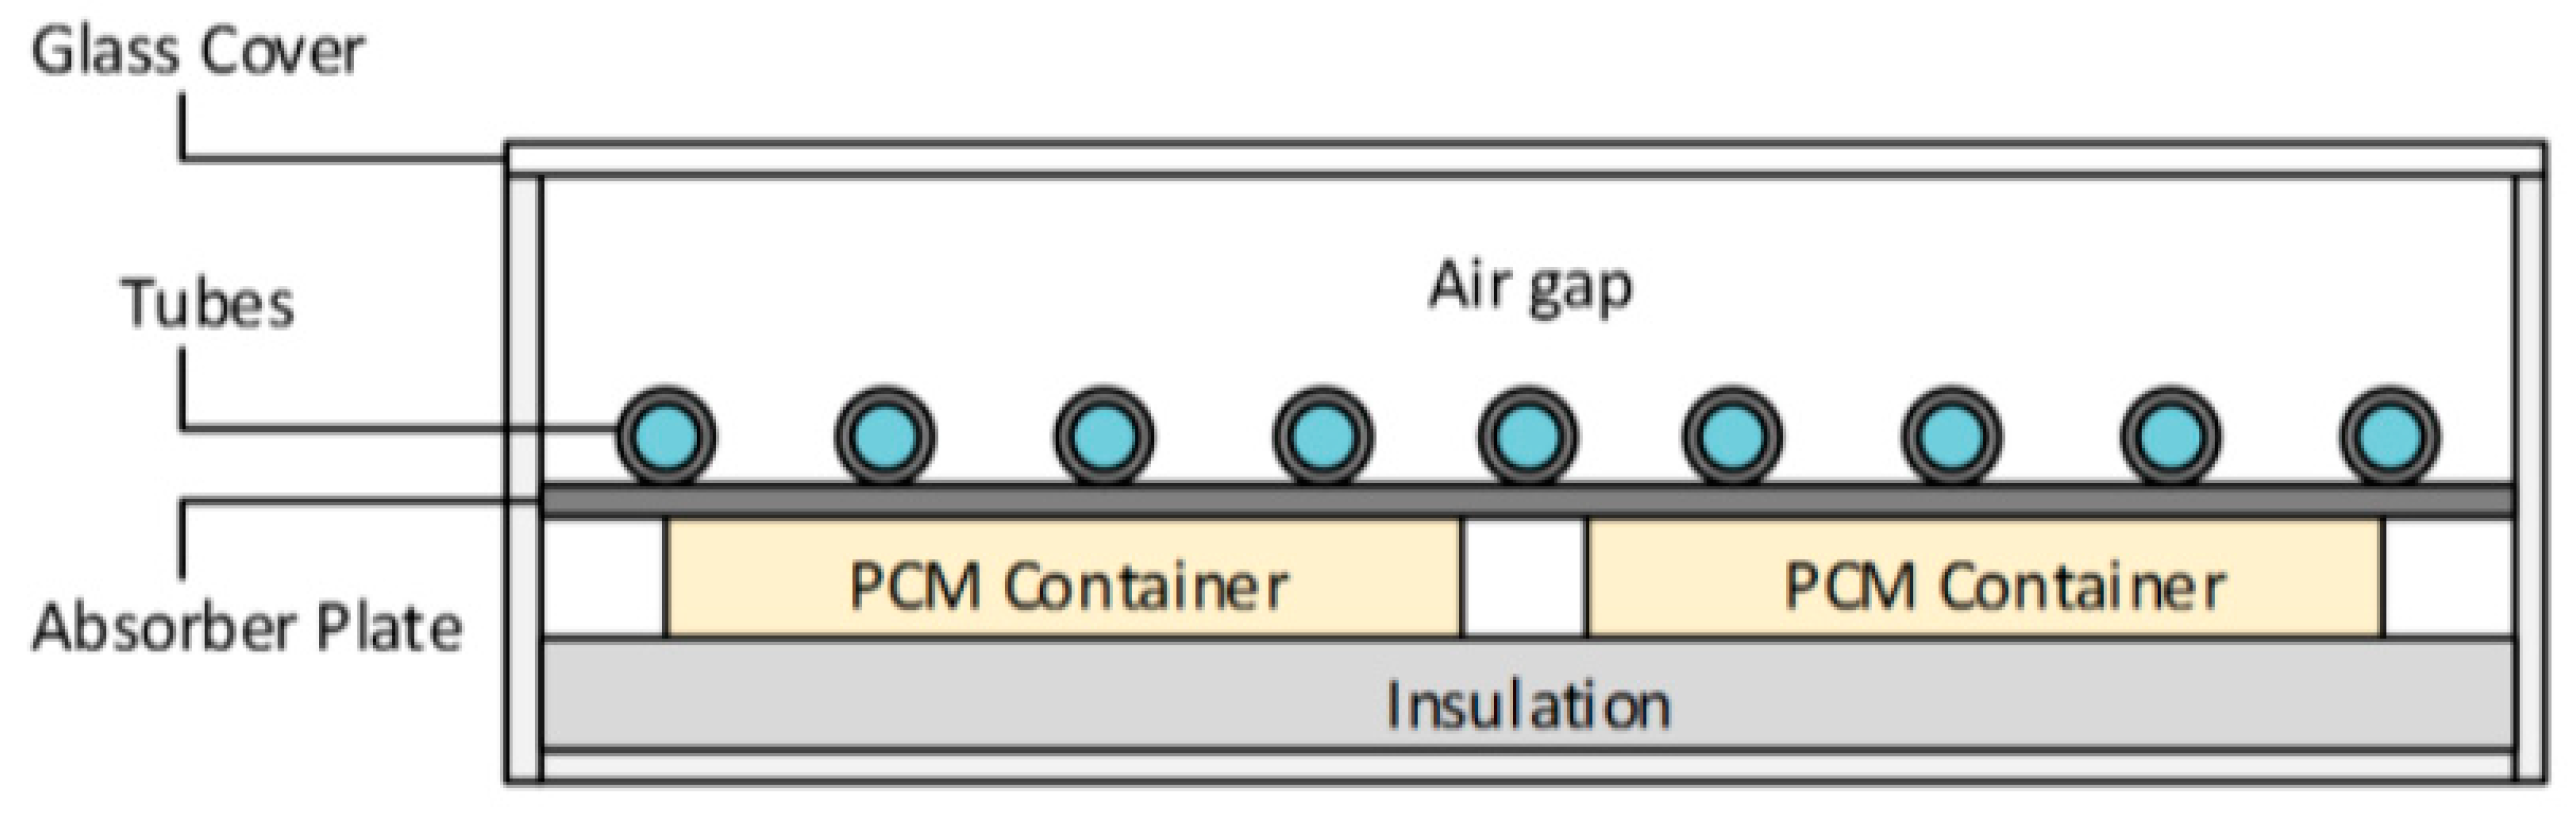
Figure 4.
Collector view. (a) Exploded view of designed collector. (b) Collector assembly view.
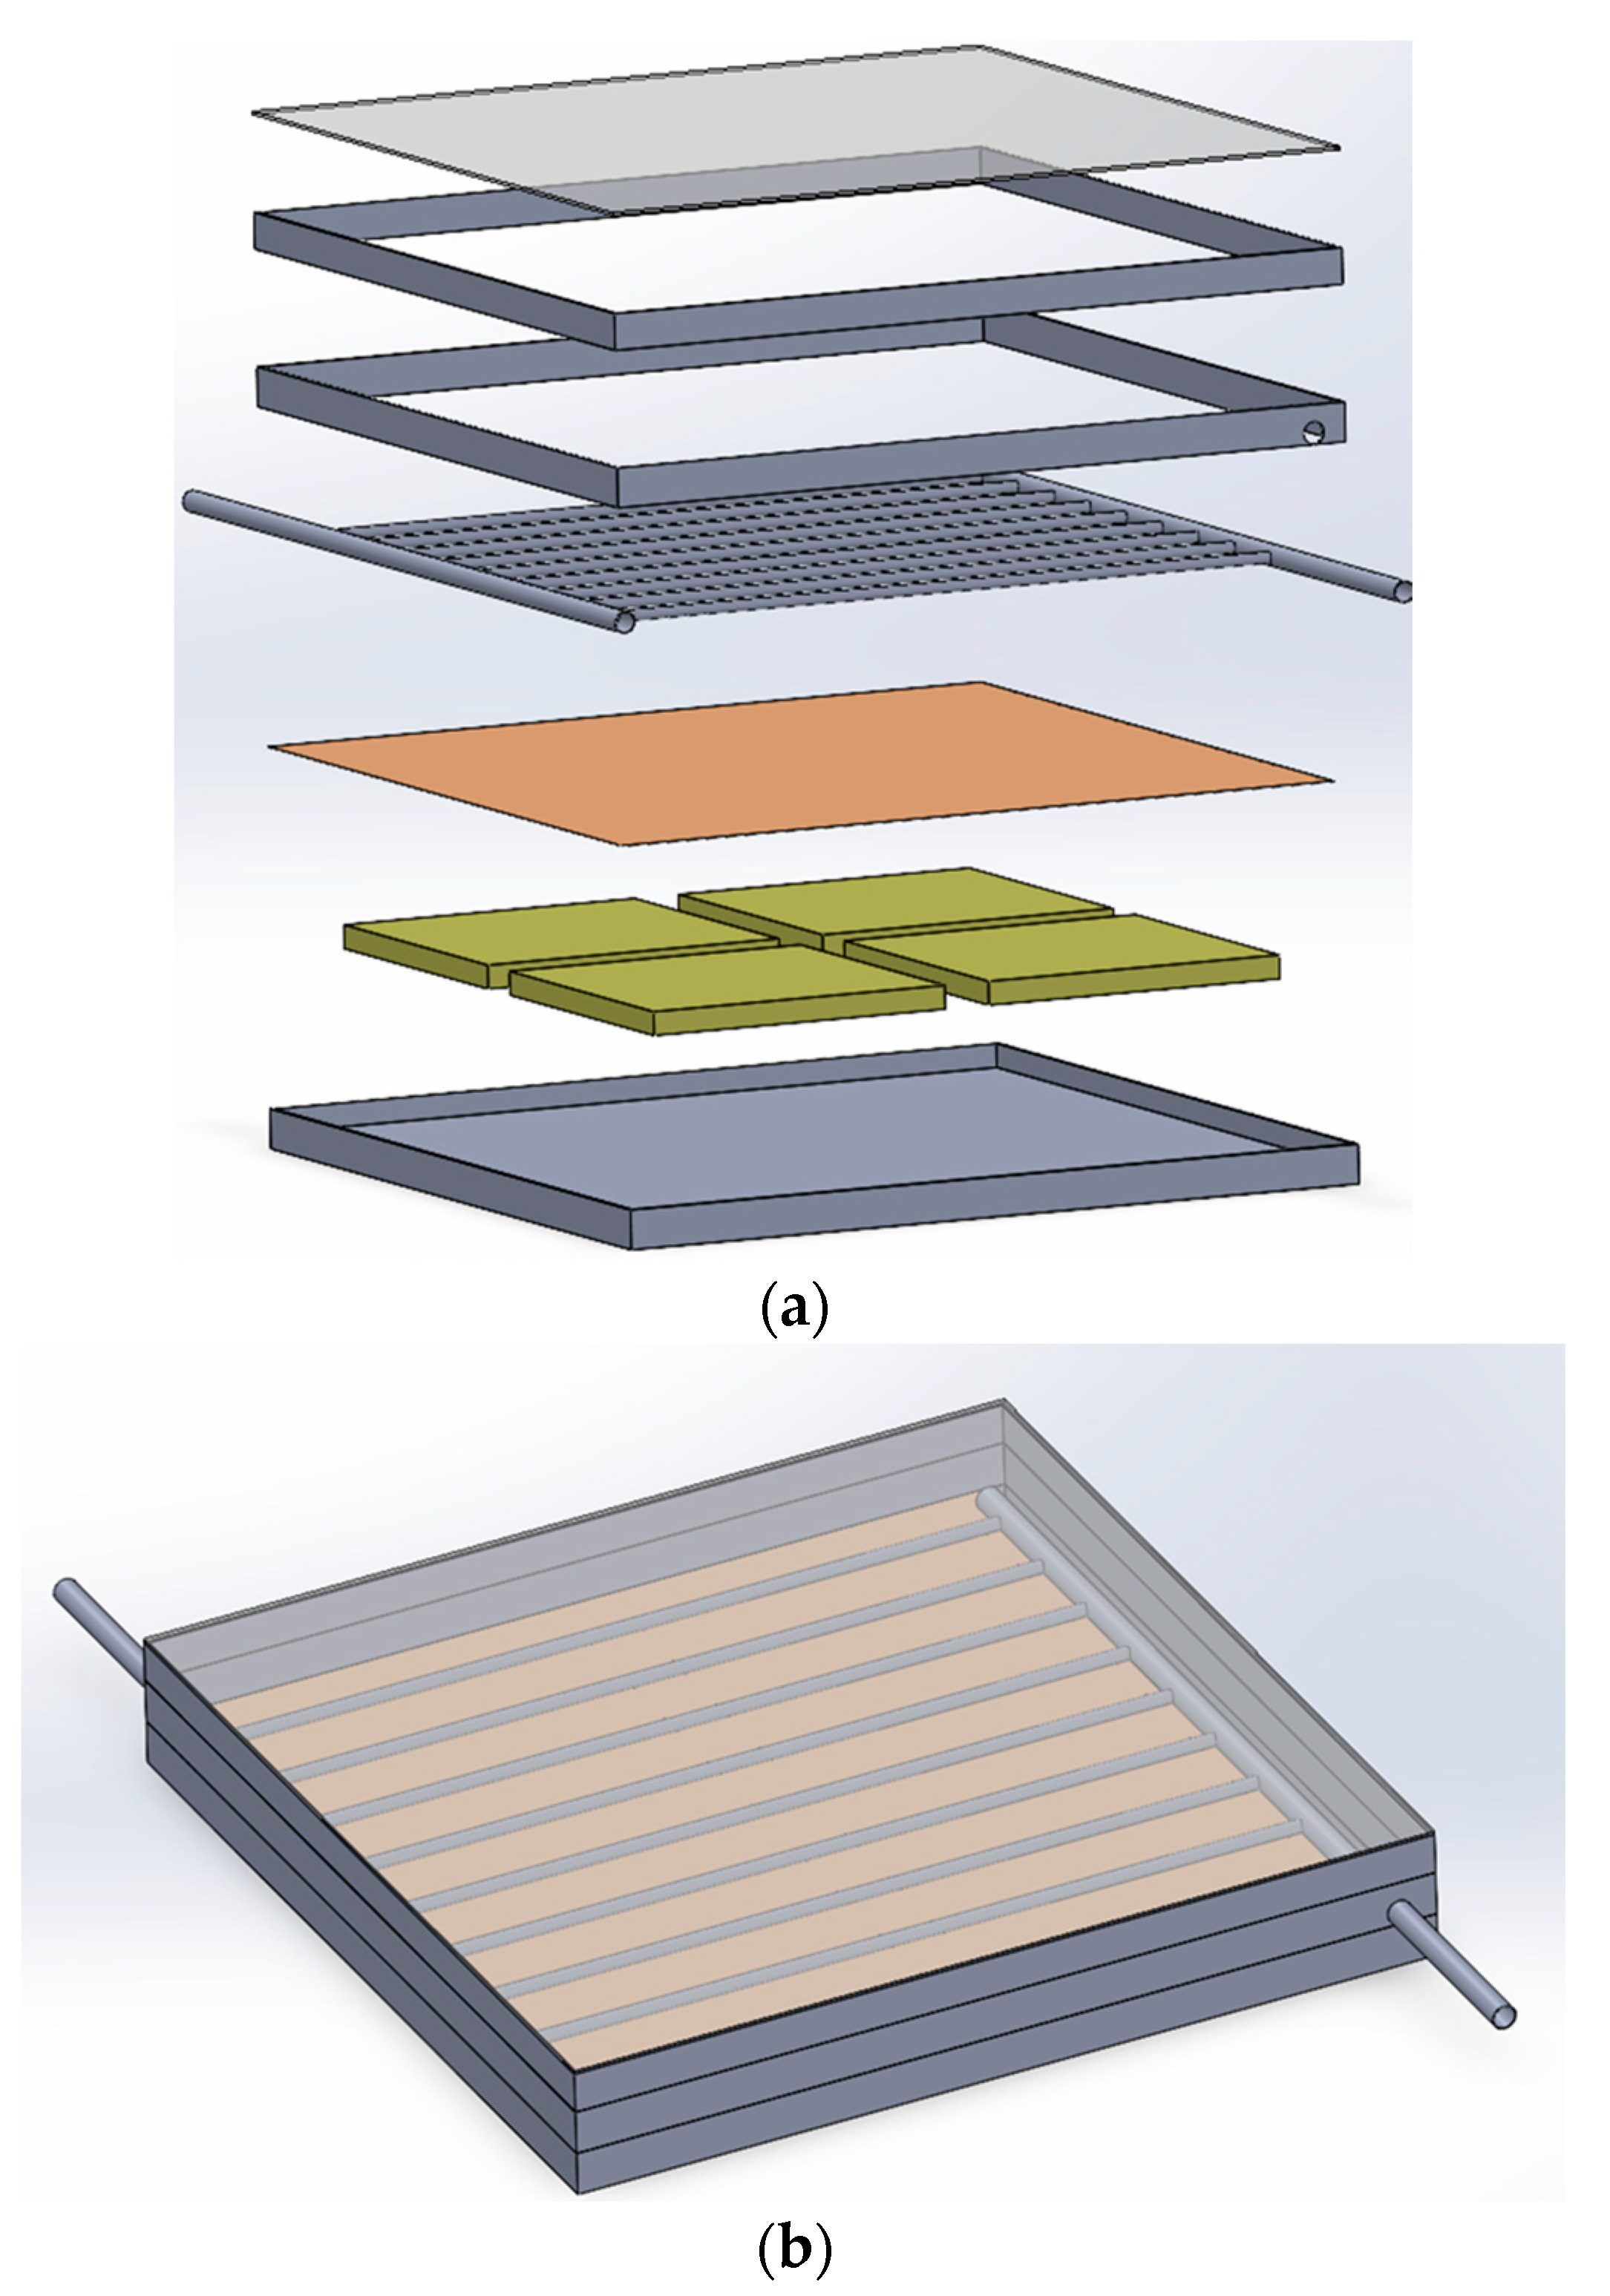
Figure 5.
Validation of the results of the current research by comparison with the research of Carmona et al. [28].
Figure 5.
Validation of the results of the current research by comparison with the research of Carmona et al. [28].
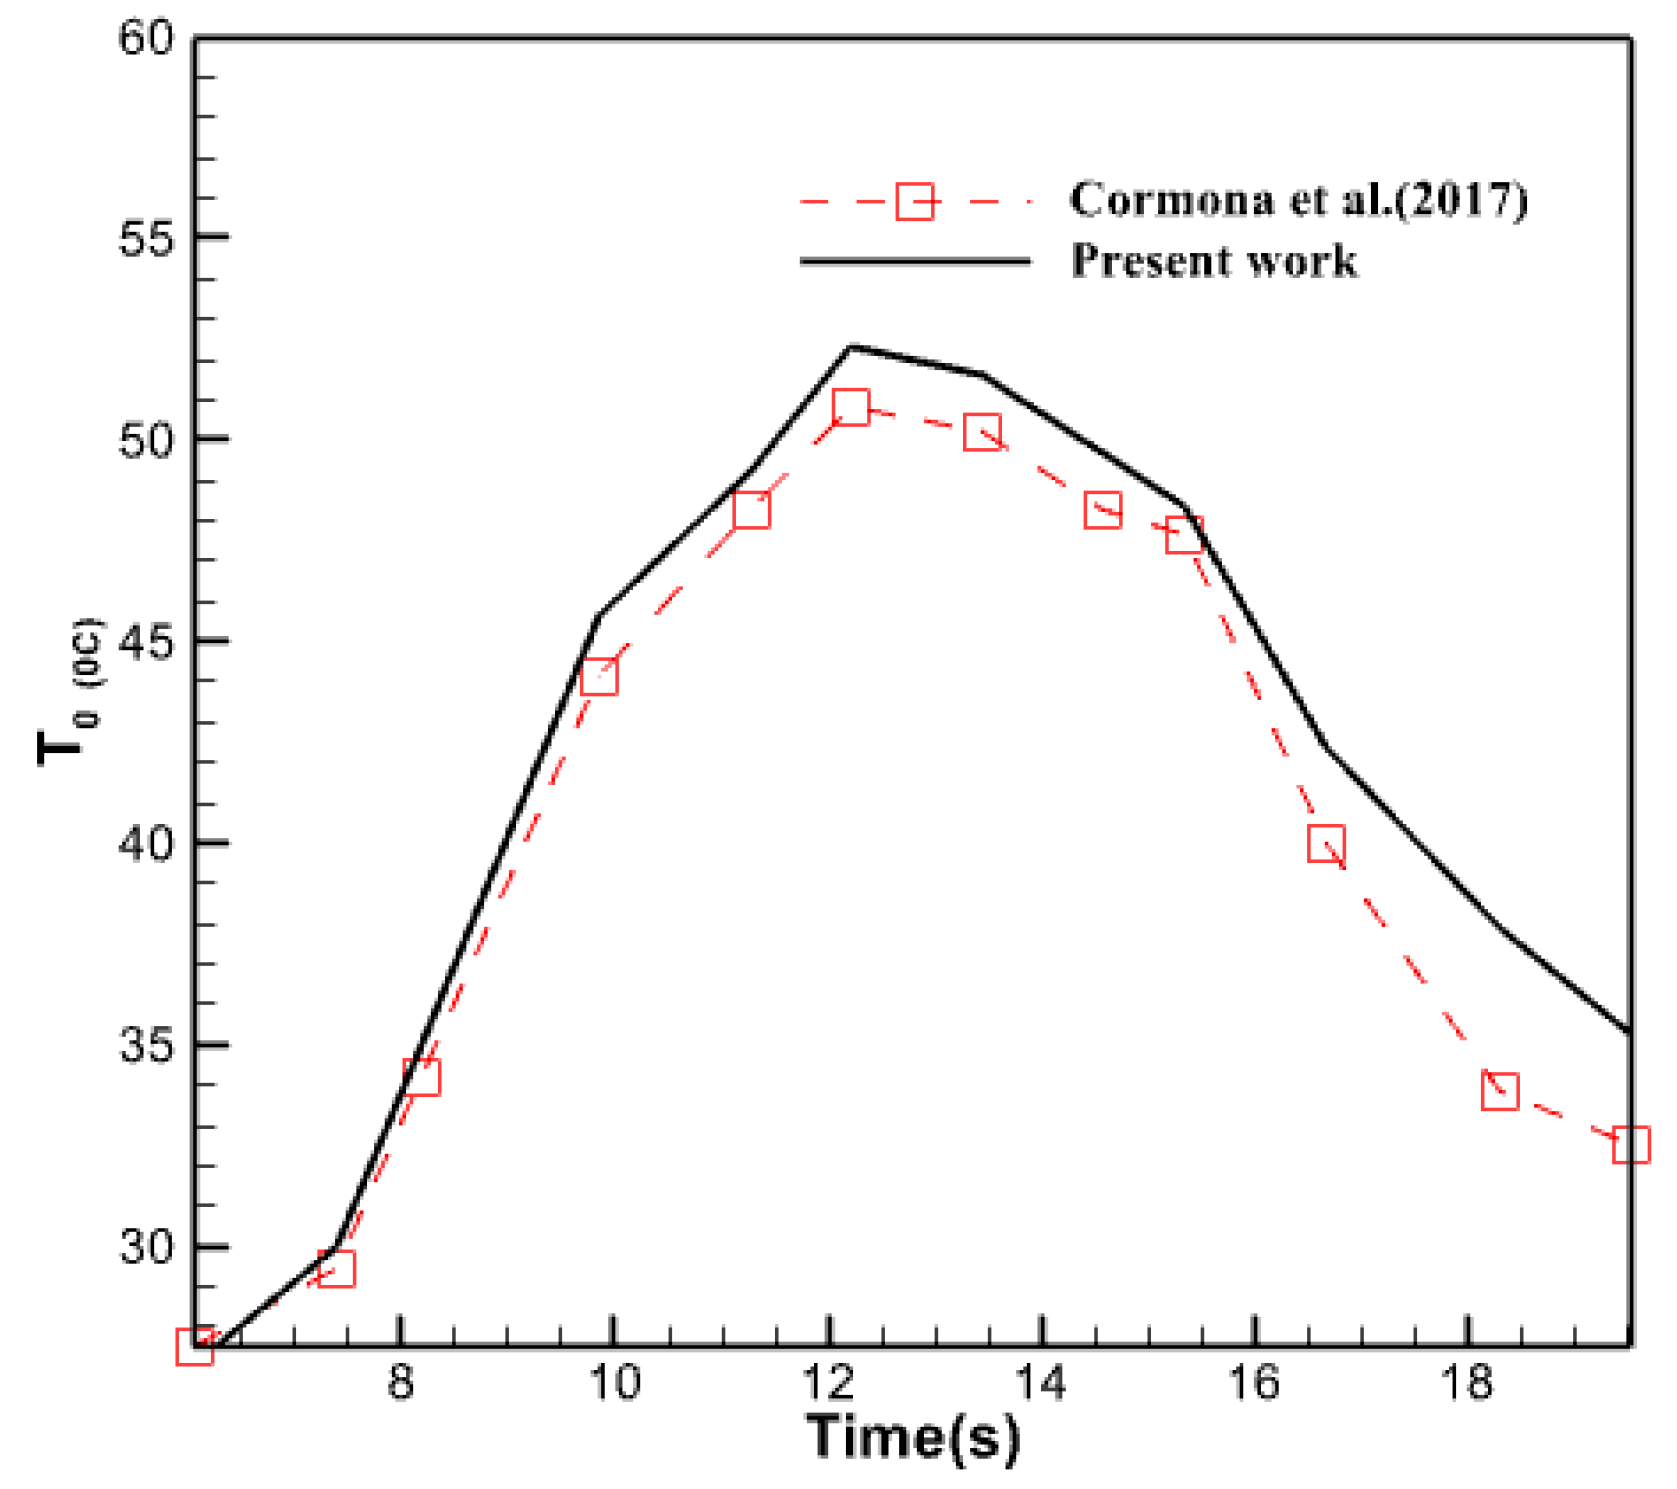
Figure 6.
Fluid temperature distribution contour inside the collector tubes.
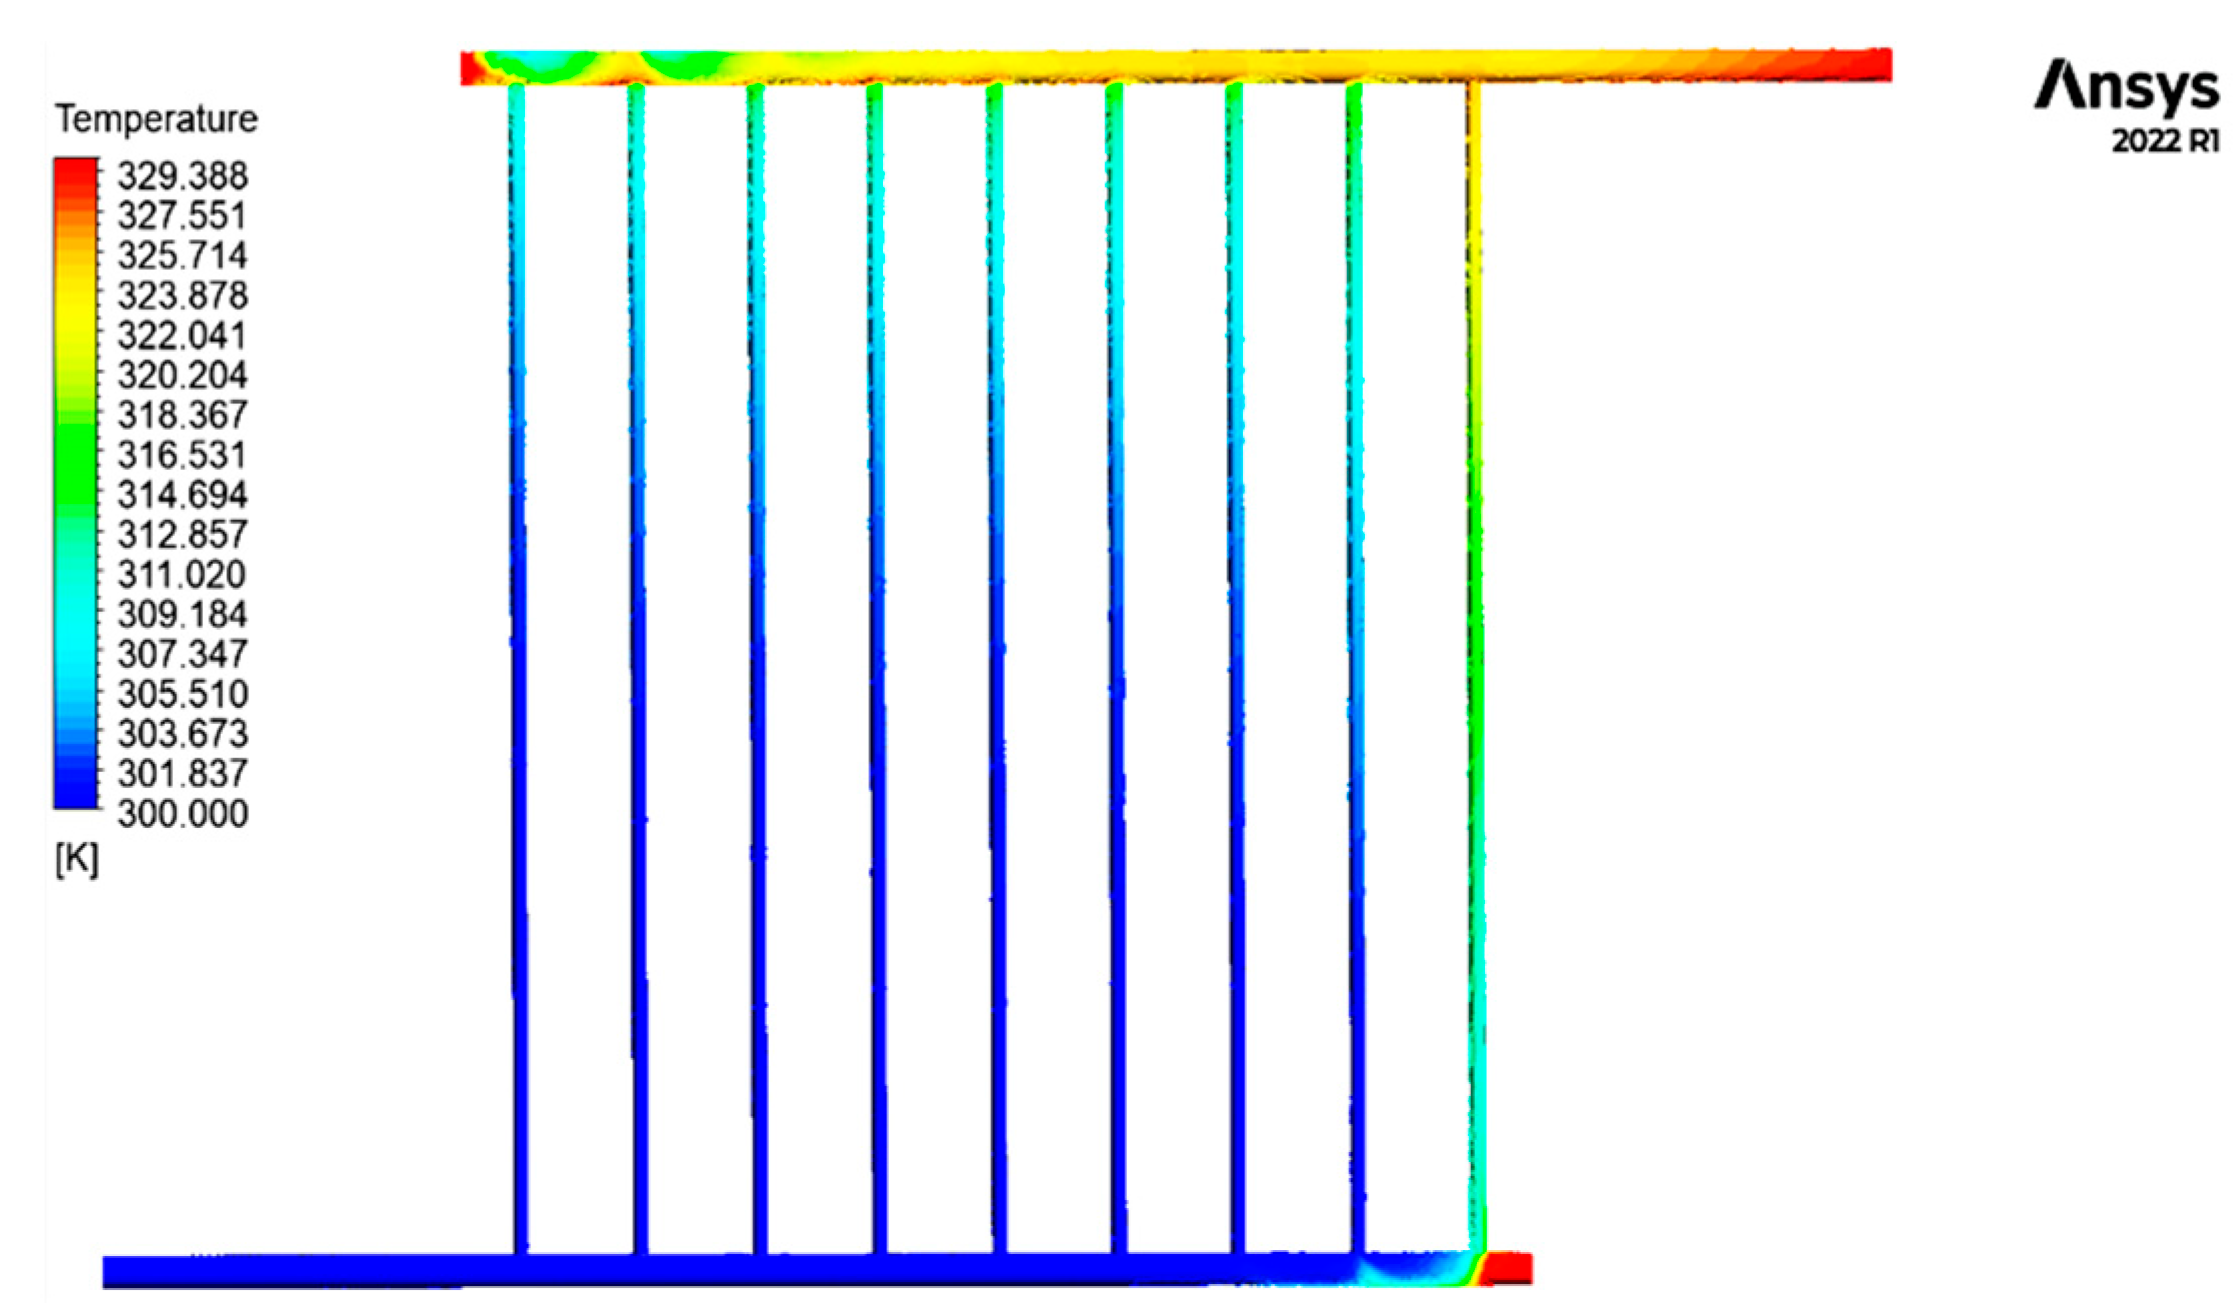
Figure 7.
(a) Fluid distribution contour at the end of the inlet pipe. (b) Fluid temperature distribution contour at the closed end of the outlet pipe.
Figure 7.
(a) Fluid distribution contour at the end of the inlet pipe. (b) Fluid temperature distribution contour at the closed end of the outlet pipe.

Figure 8.
Changes in the temperature of the fluid coming out of the collector.
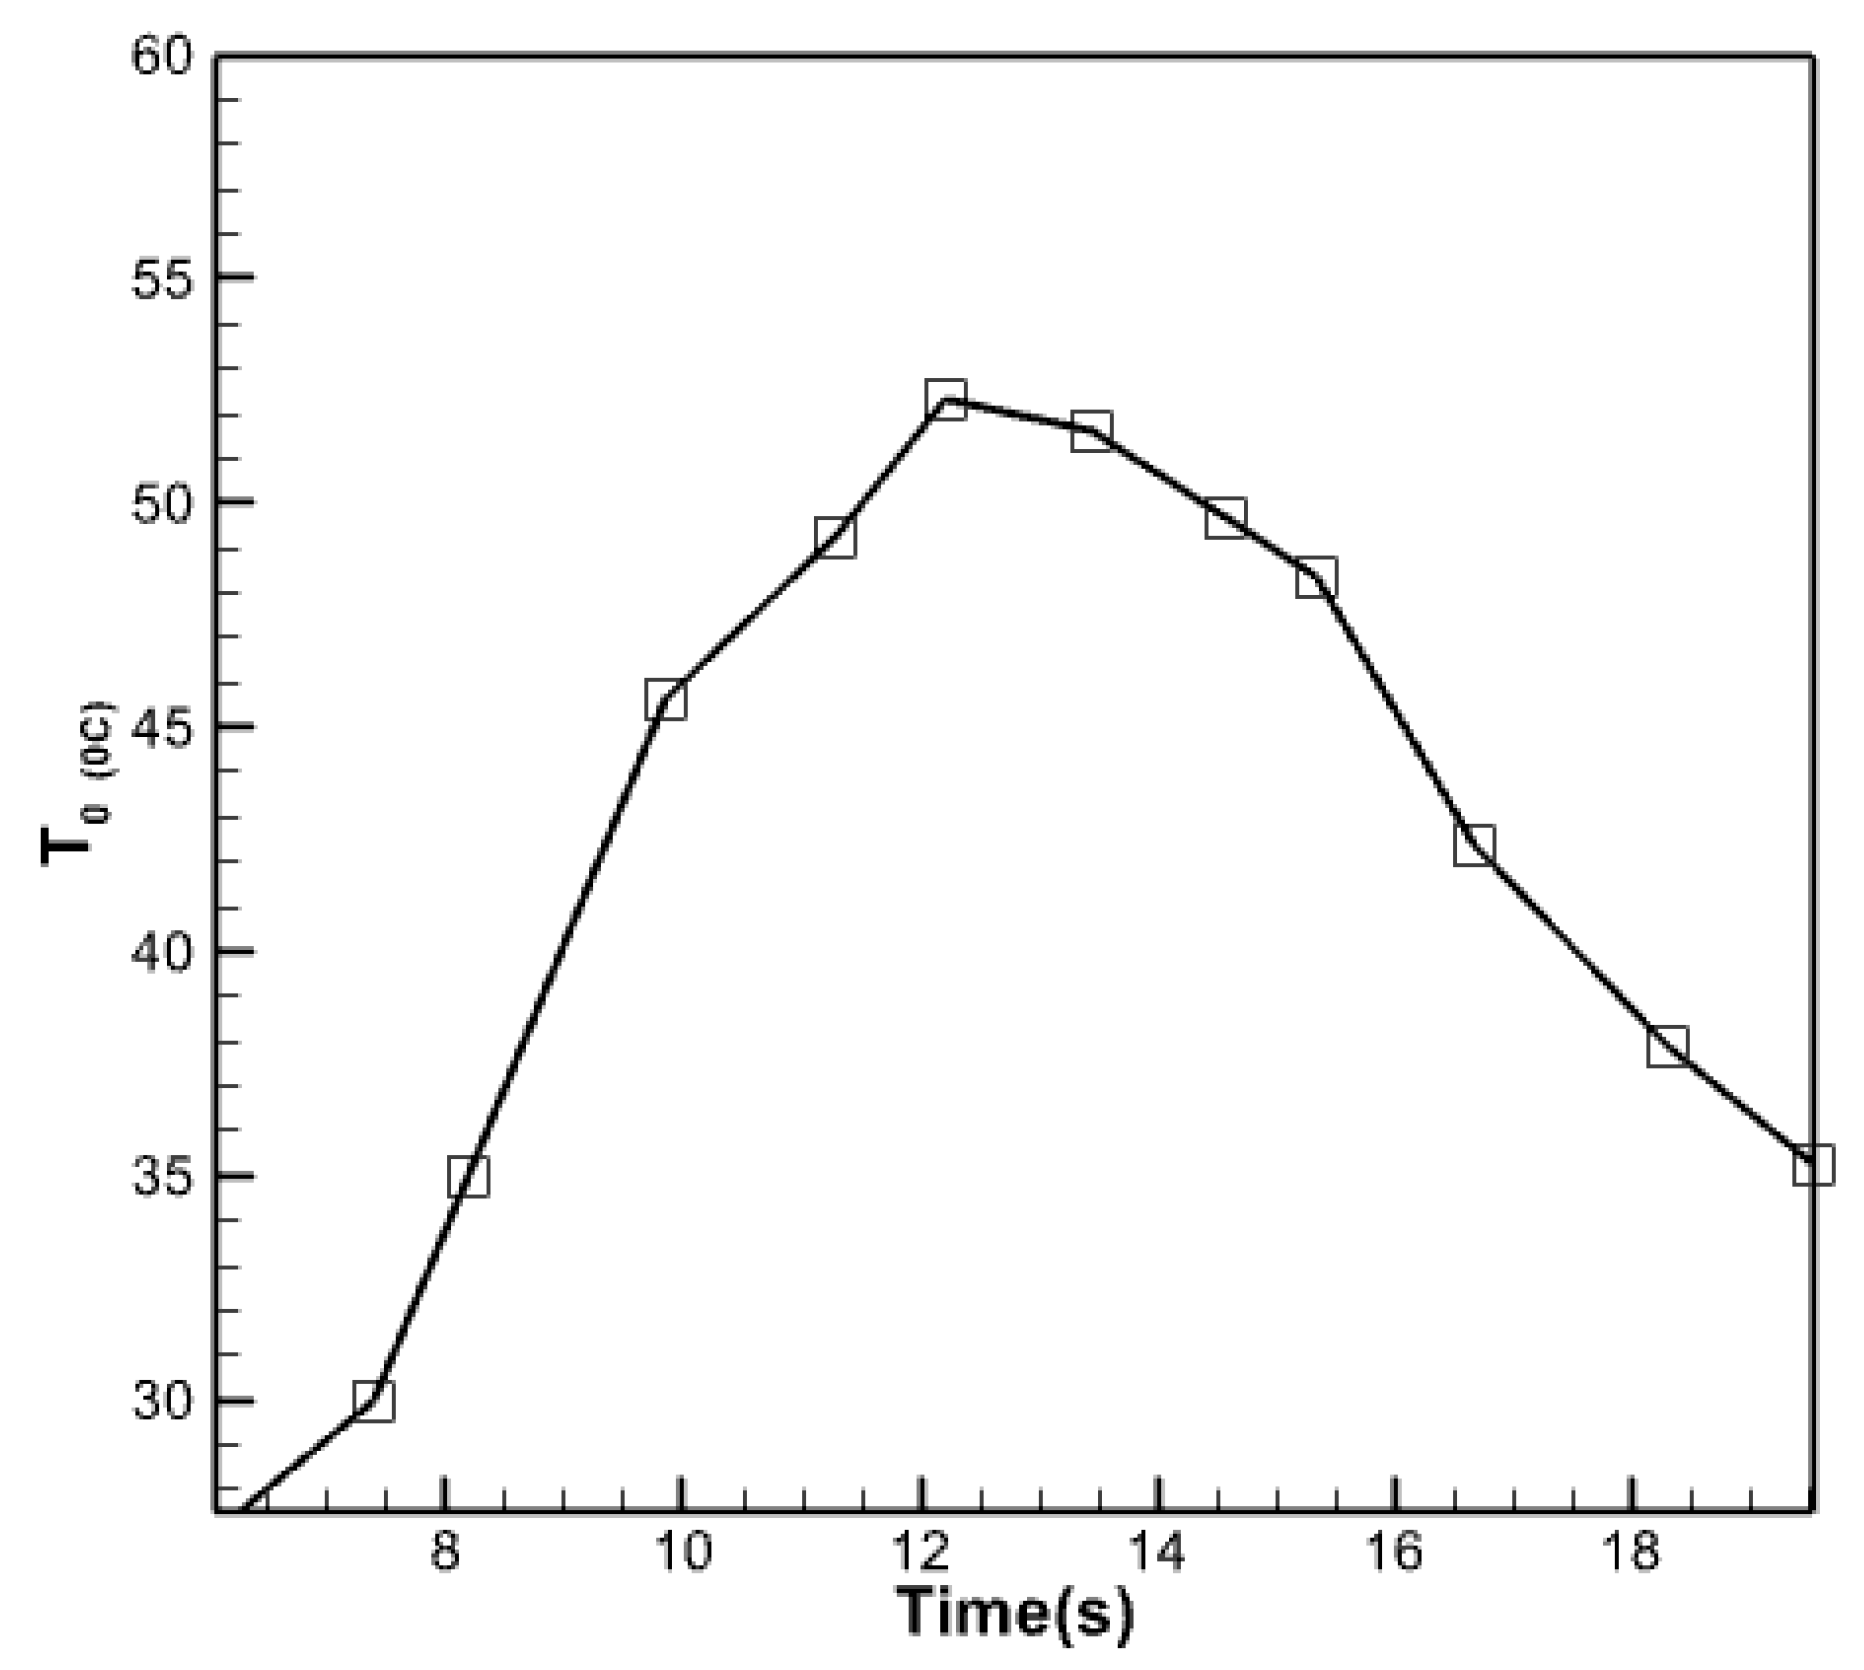
Figure 9.
Fluid velocity vectors in the pipes of the middle part of the collector.
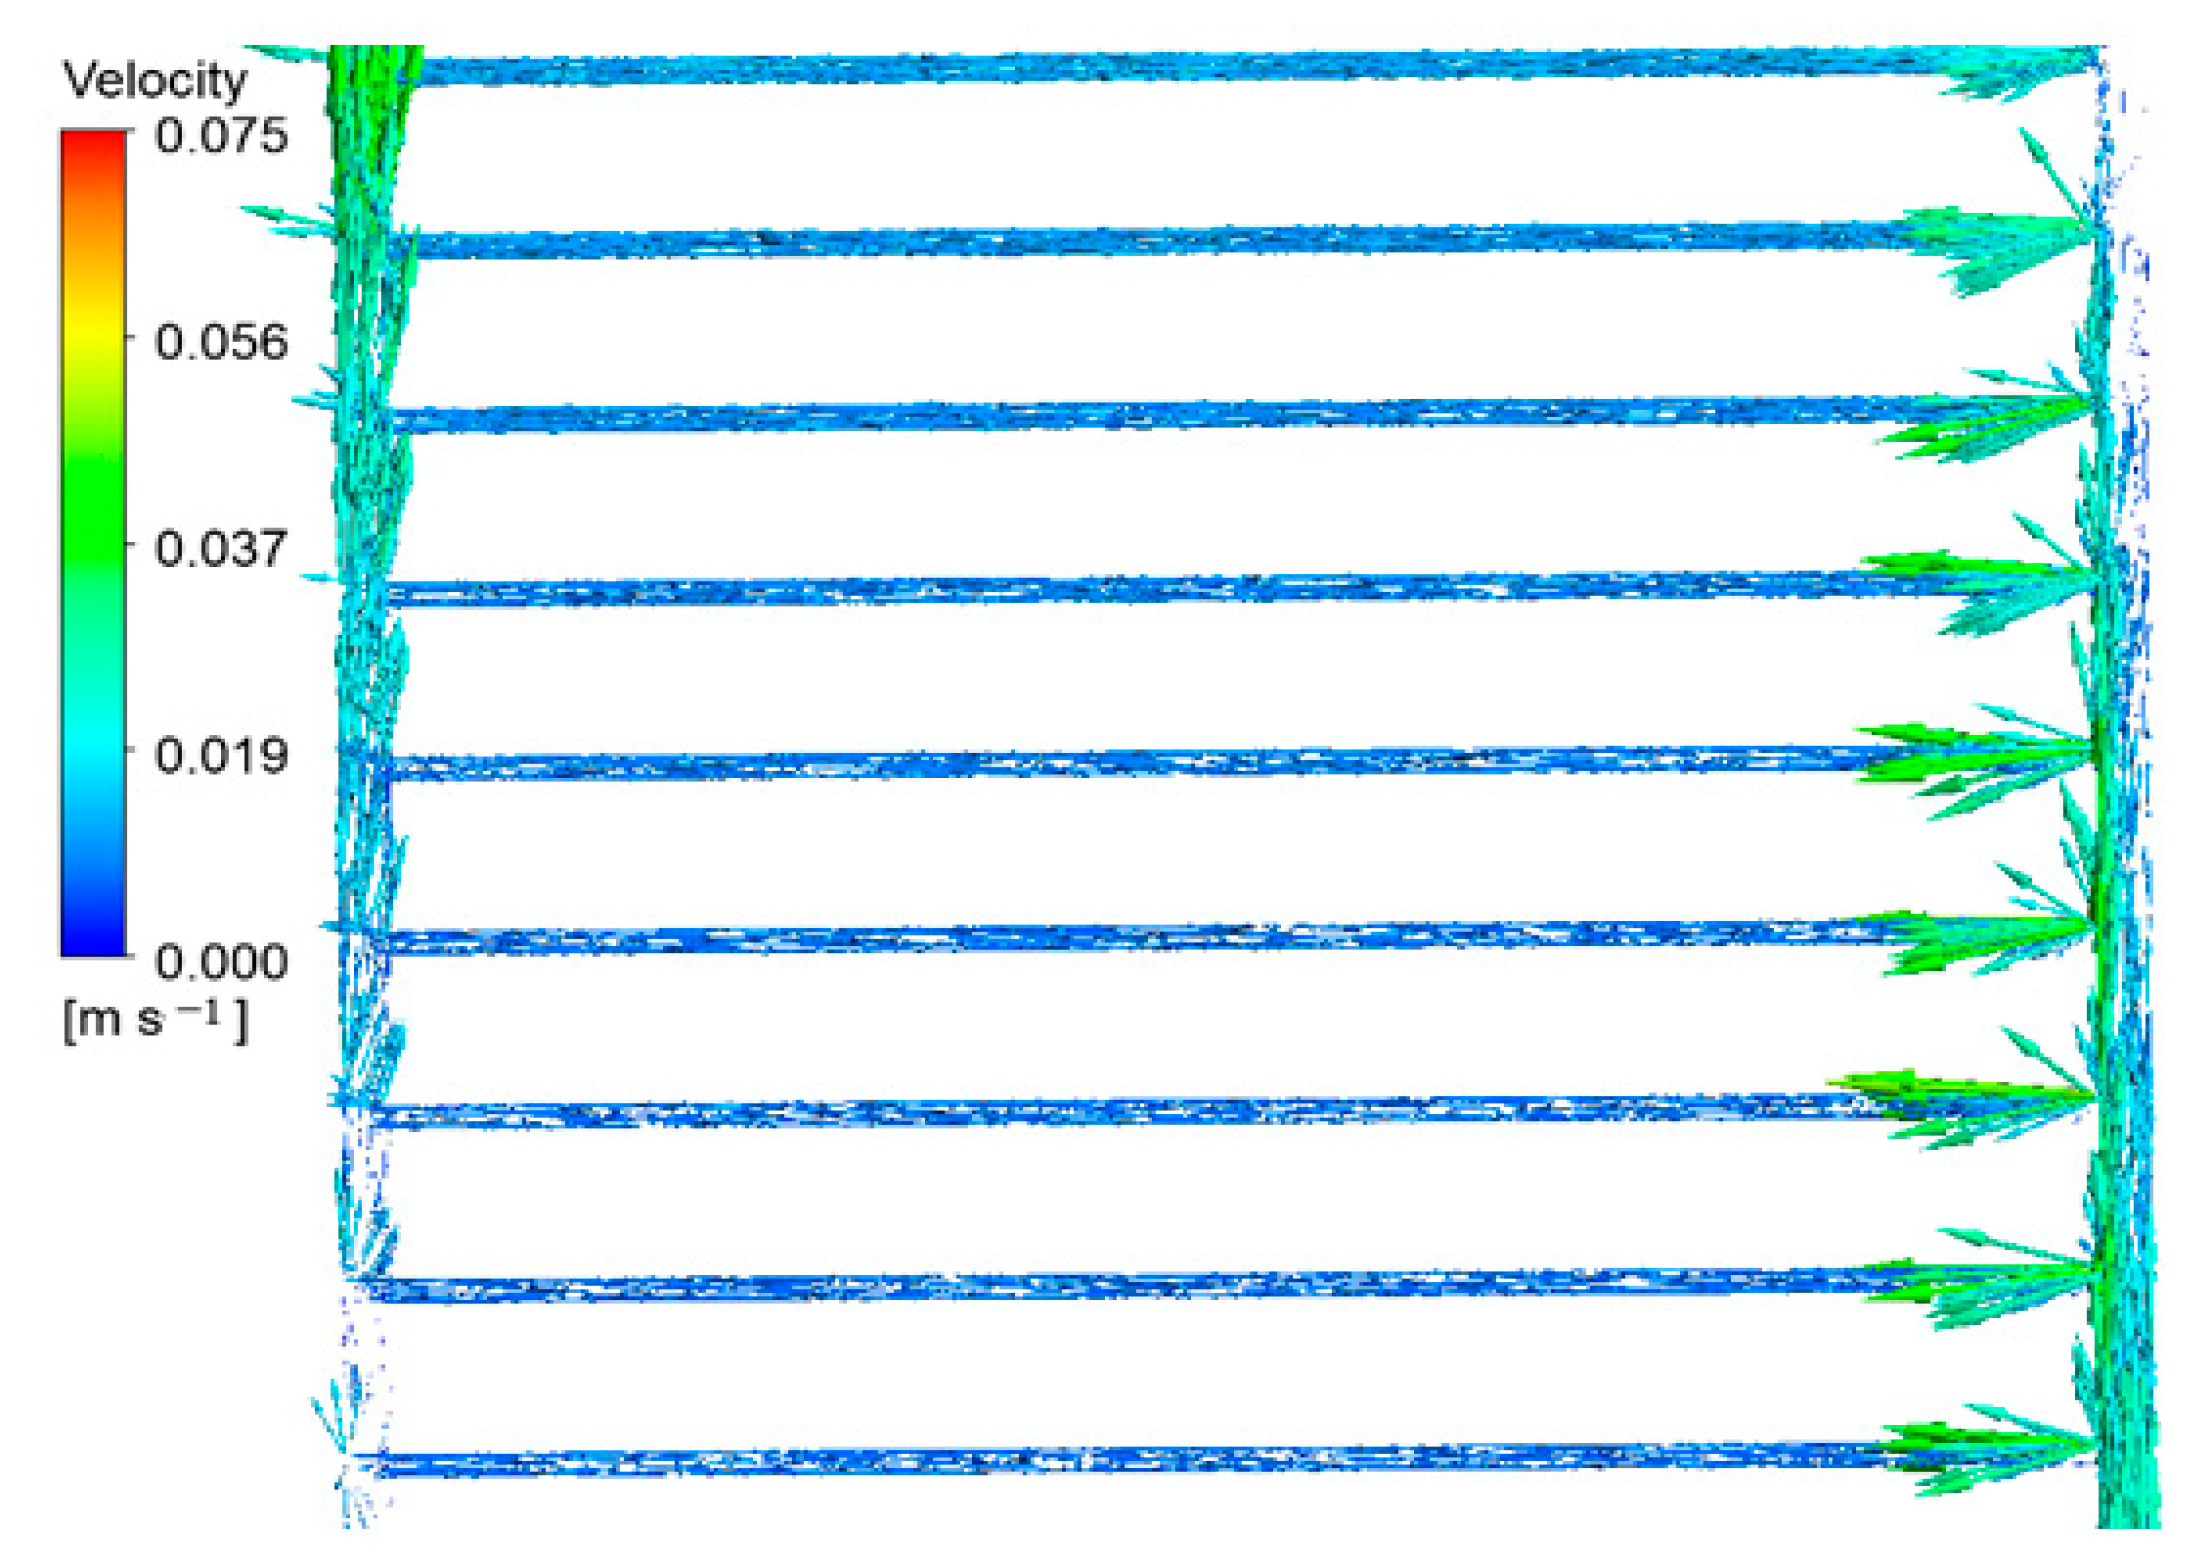
Figure 10.
The effect of the flow rate of the incoming water to the collector pipes on the temperature of the outgoing water.
Figure 10.
The effect of the flow rate of the incoming water to the collector pipes on the temperature of the outgoing water.
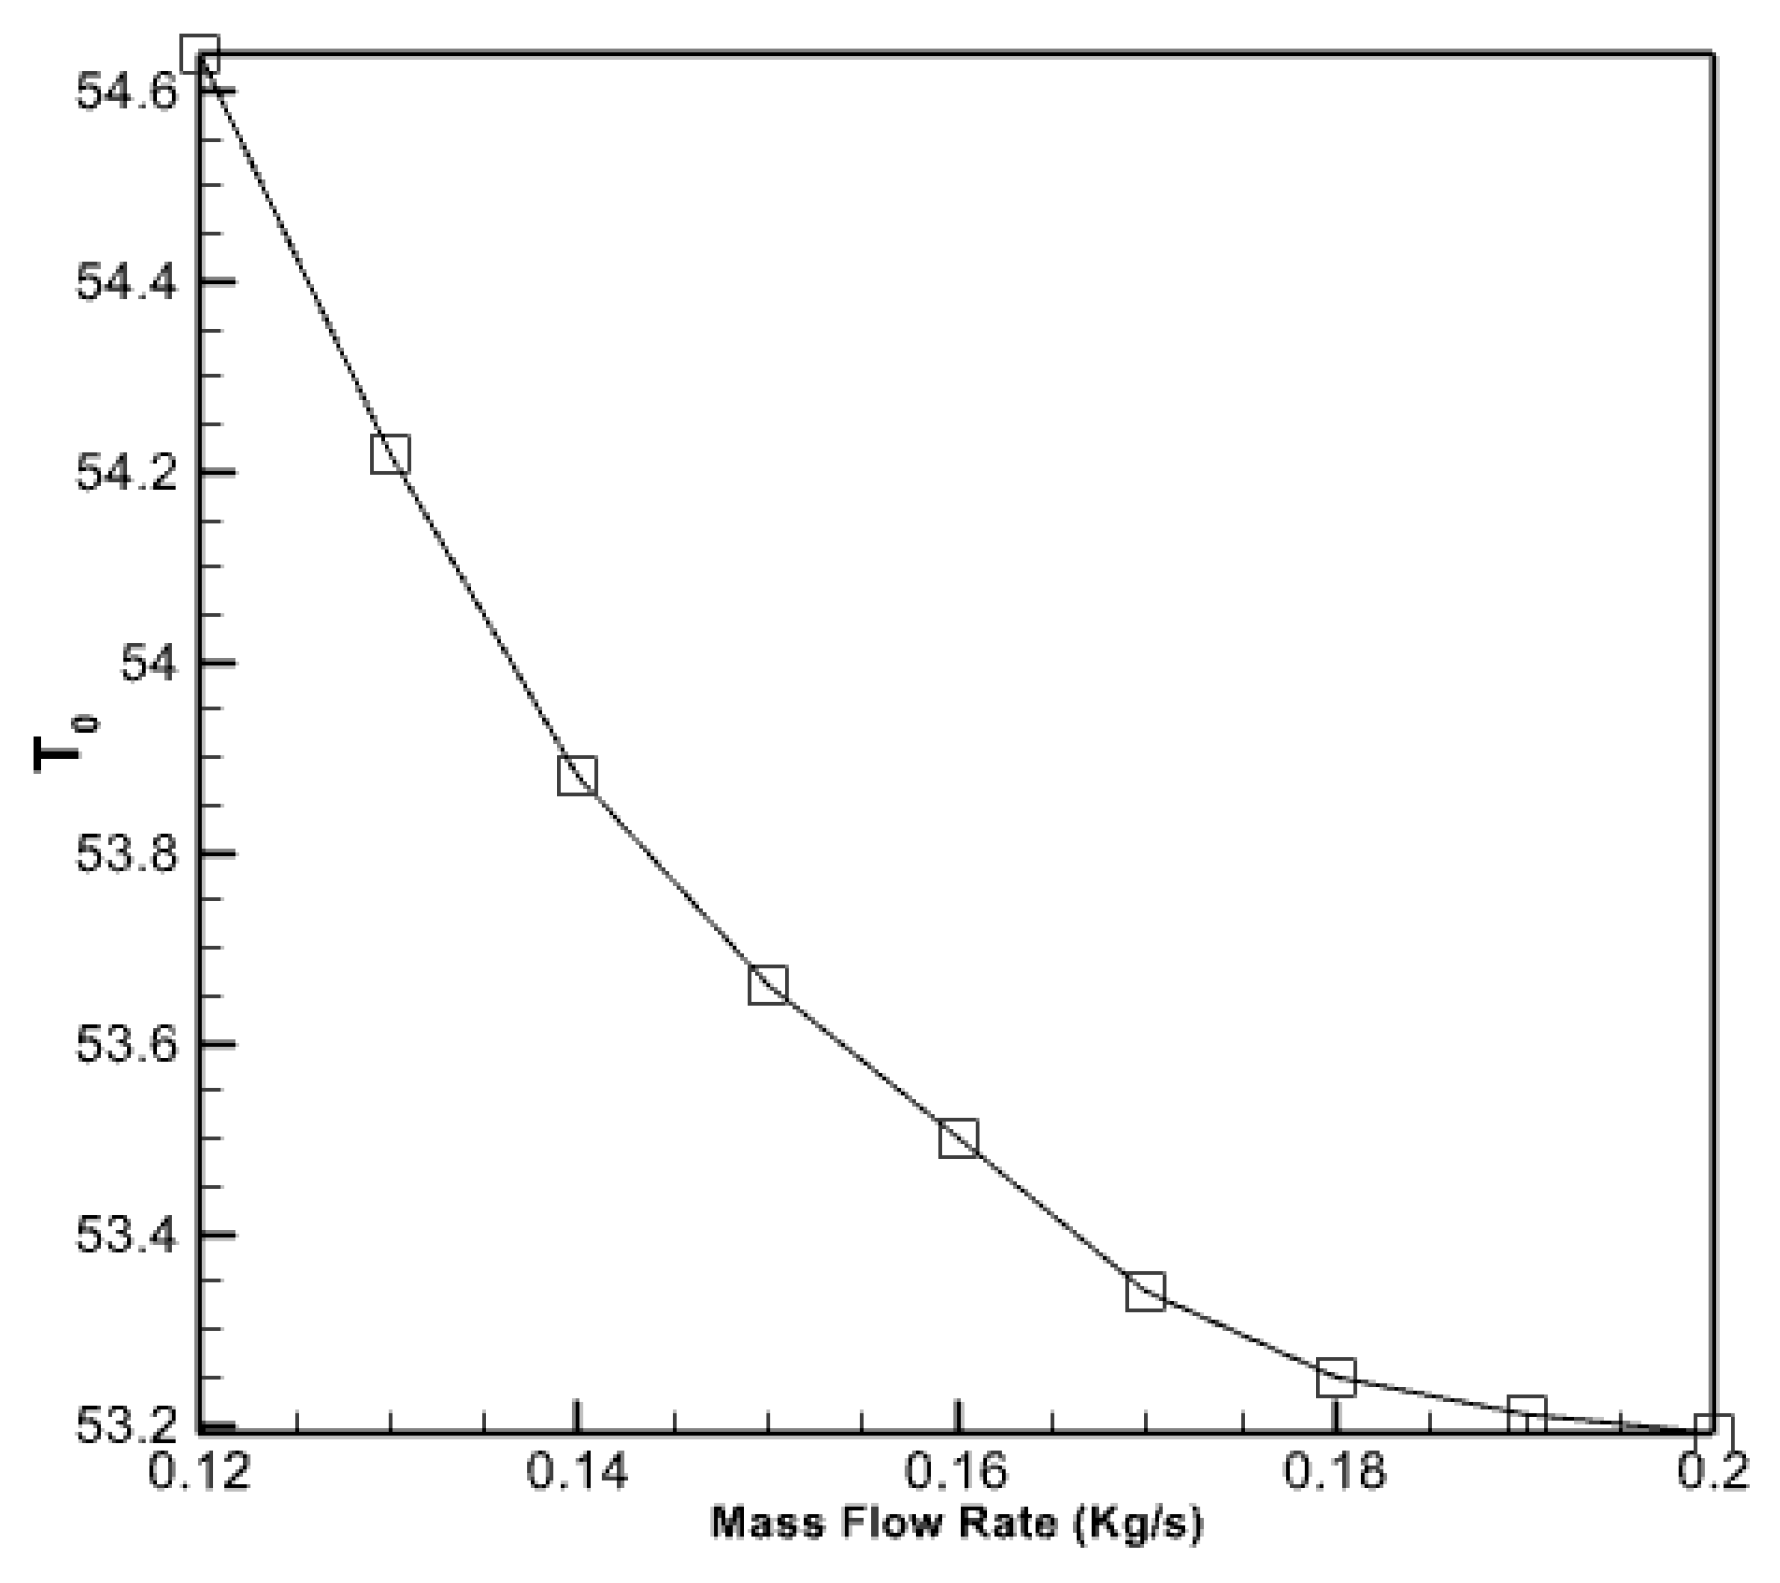
Figure 11.
Pressure contour inside the collector pipes.
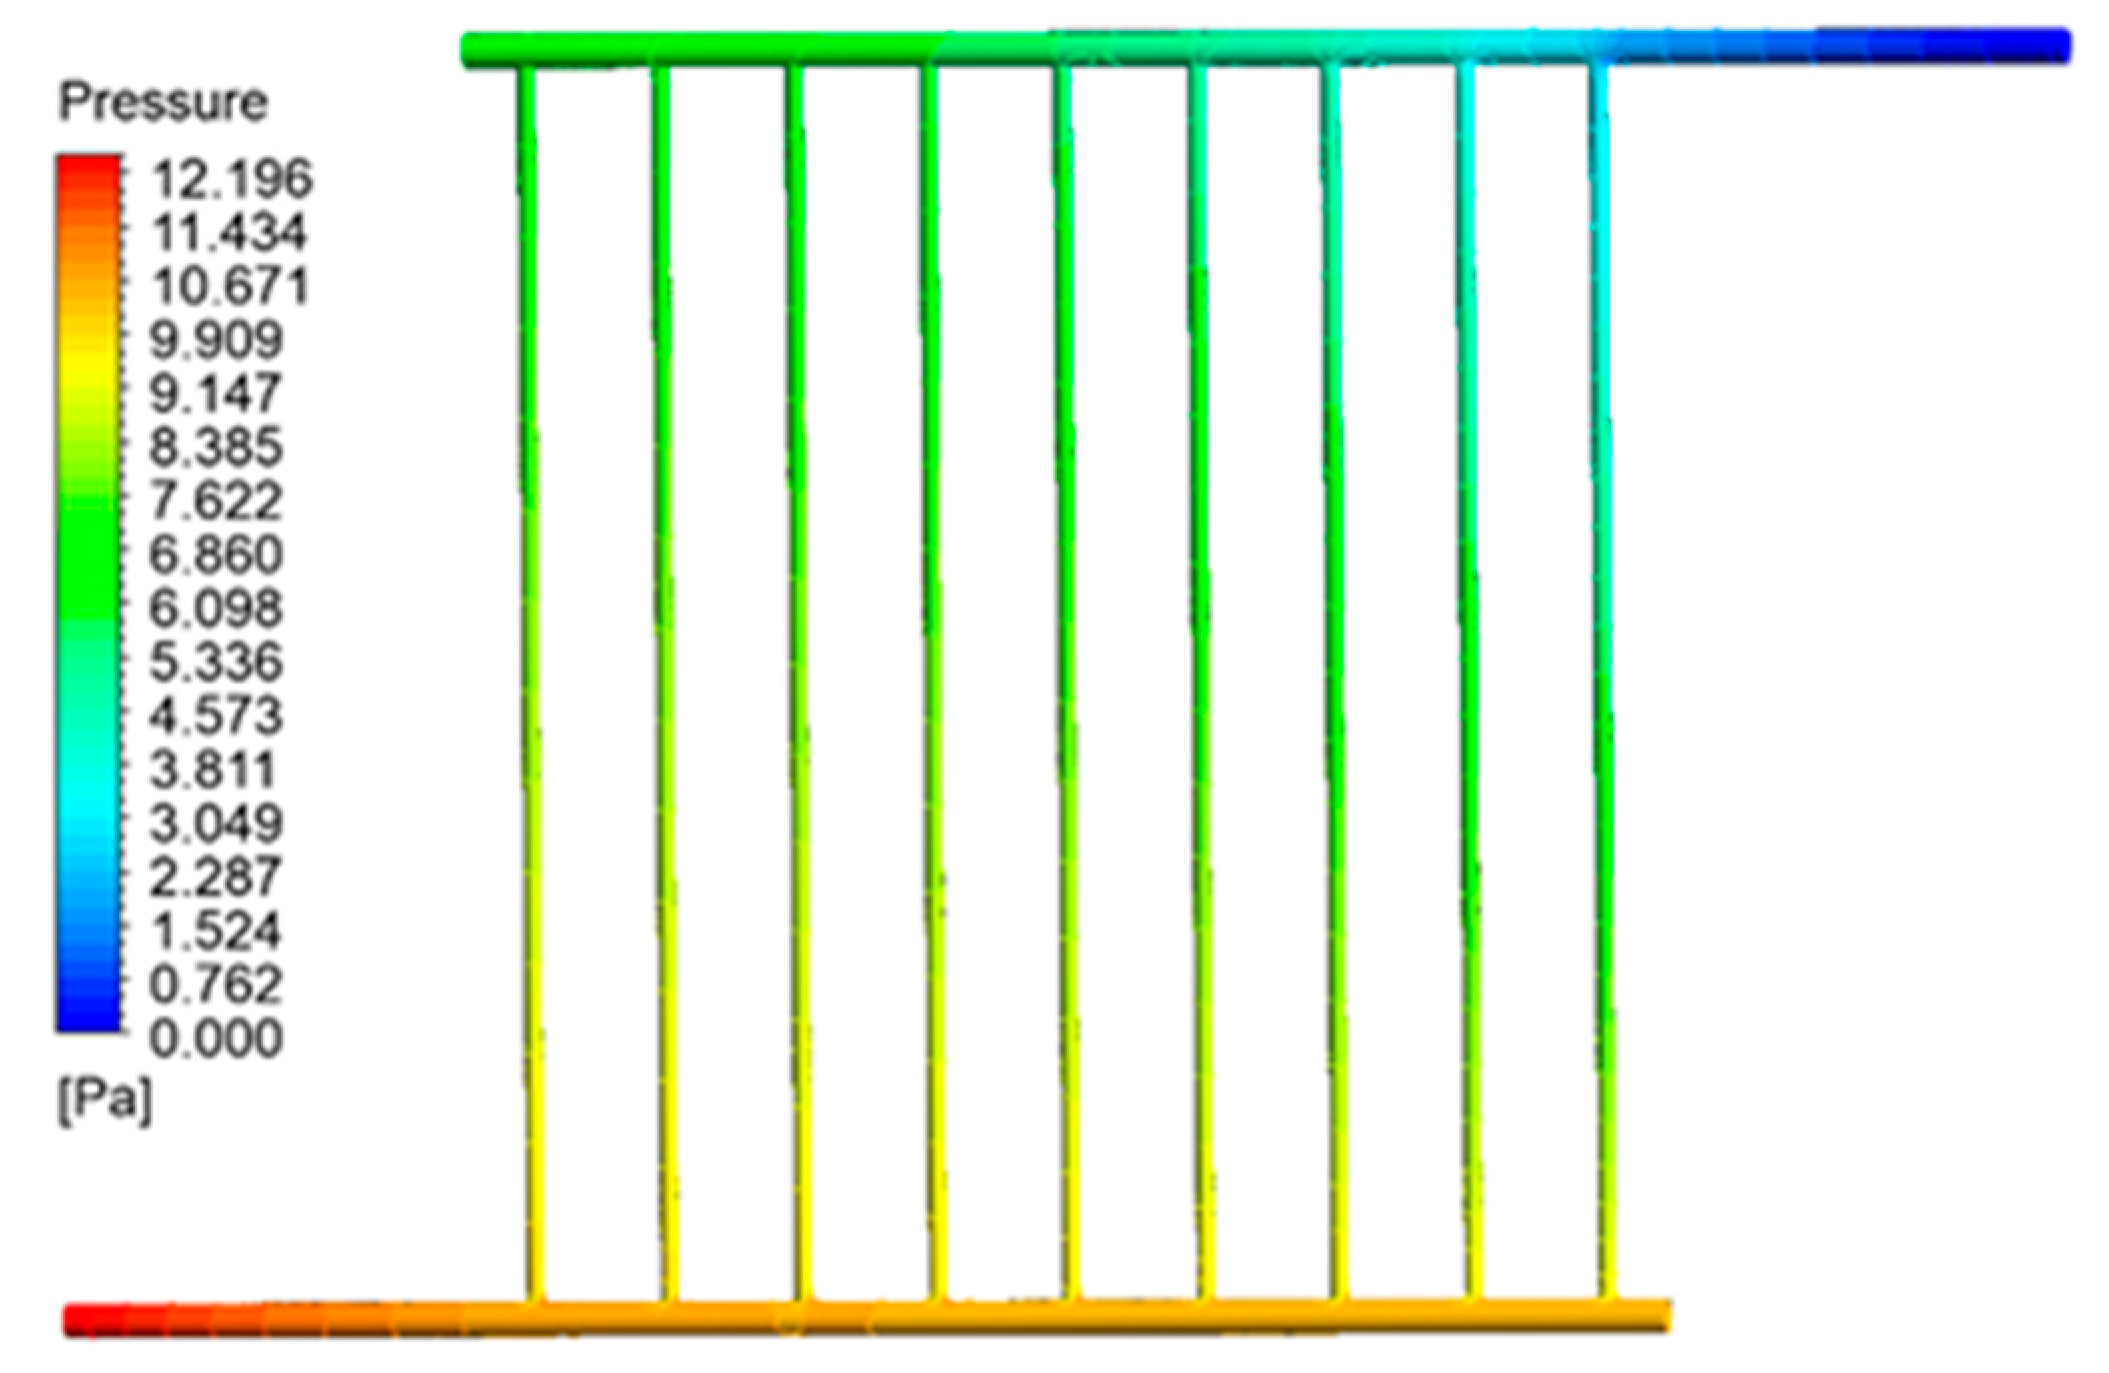
Figure 12.
The contour of the kinetic energy distribution of turbulence inside the collector tubes.
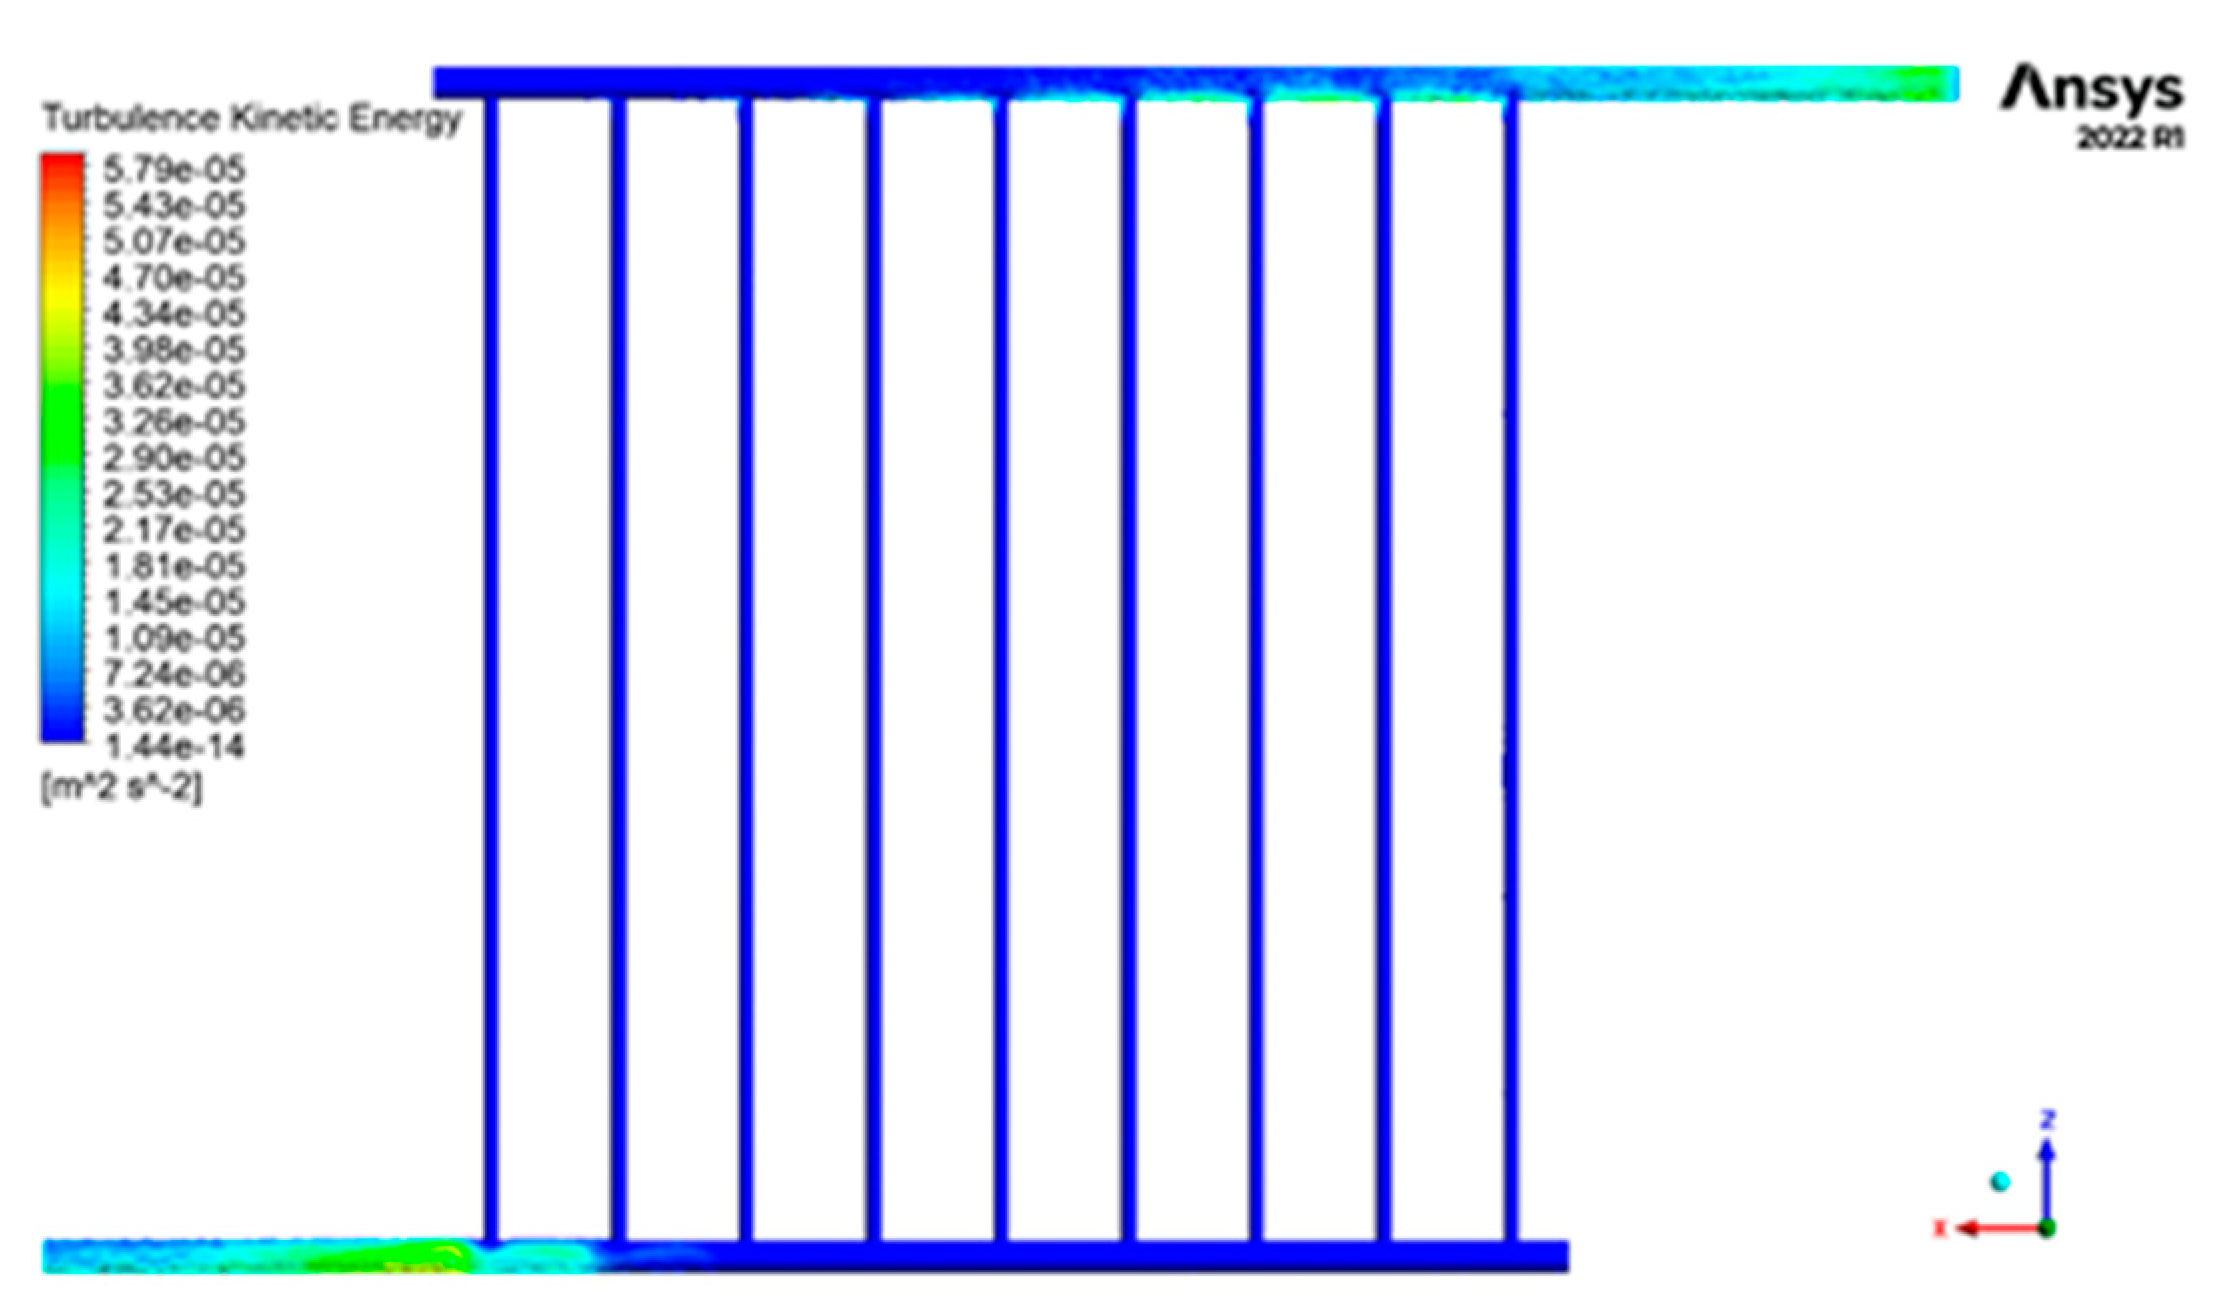
Figure 13.
Changes in the average temperature of the copper absorber plate.
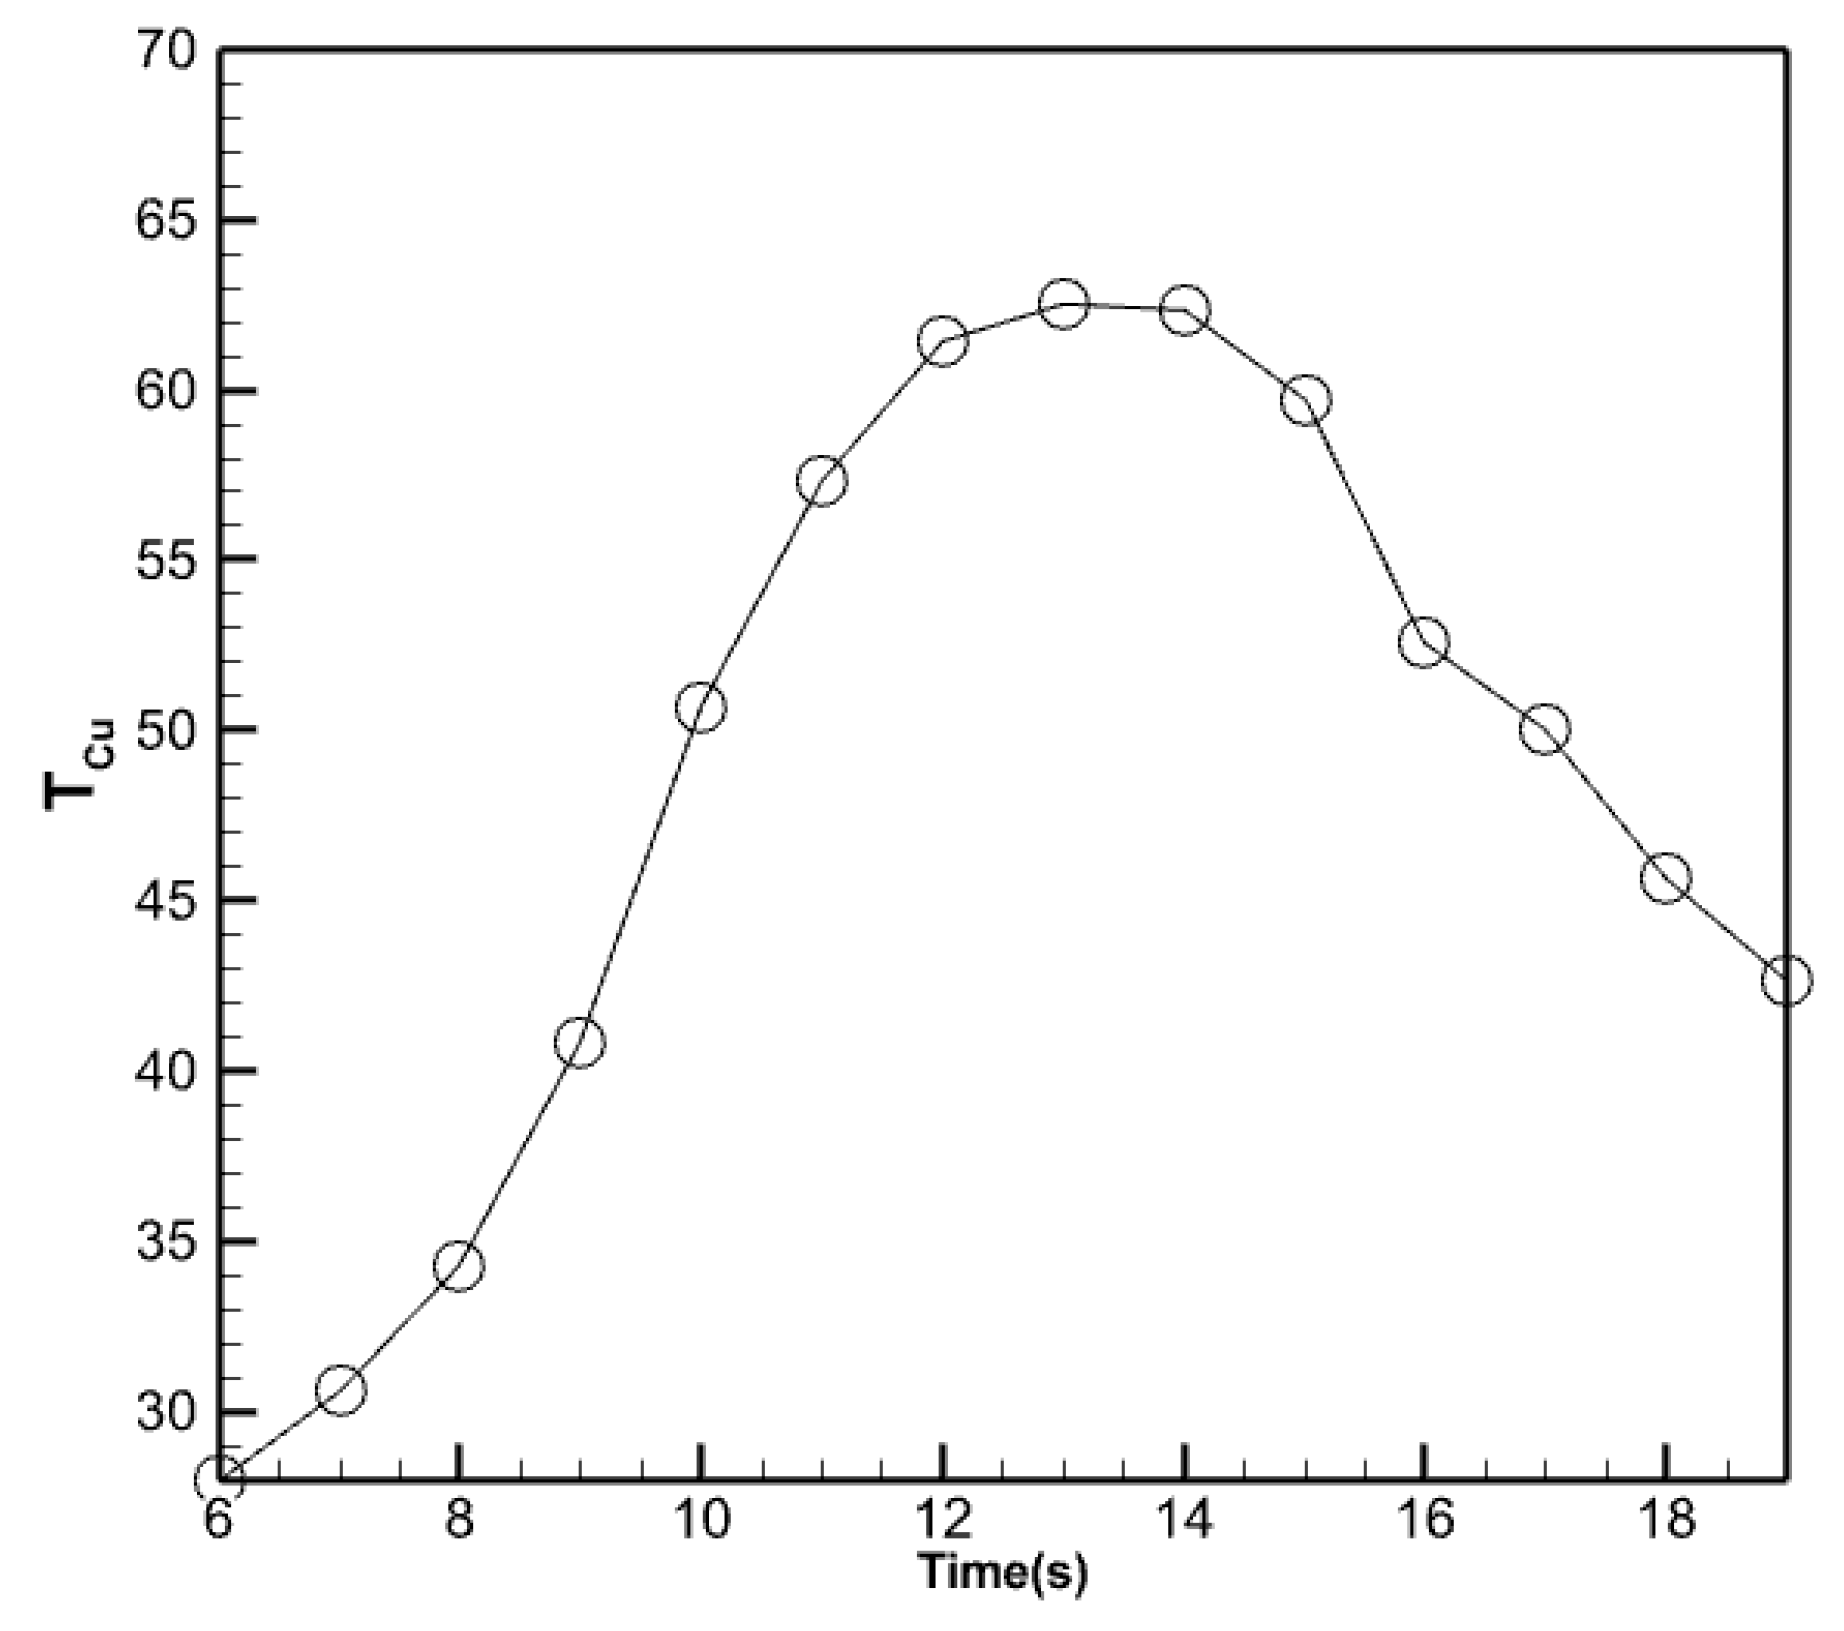
Figure 14.
Temperature distribution in nano encapsulated phase change material with 5% volume fraction.
Figure 14.
Temperature distribution in nano encapsulated phase change material with 5% volume fraction.
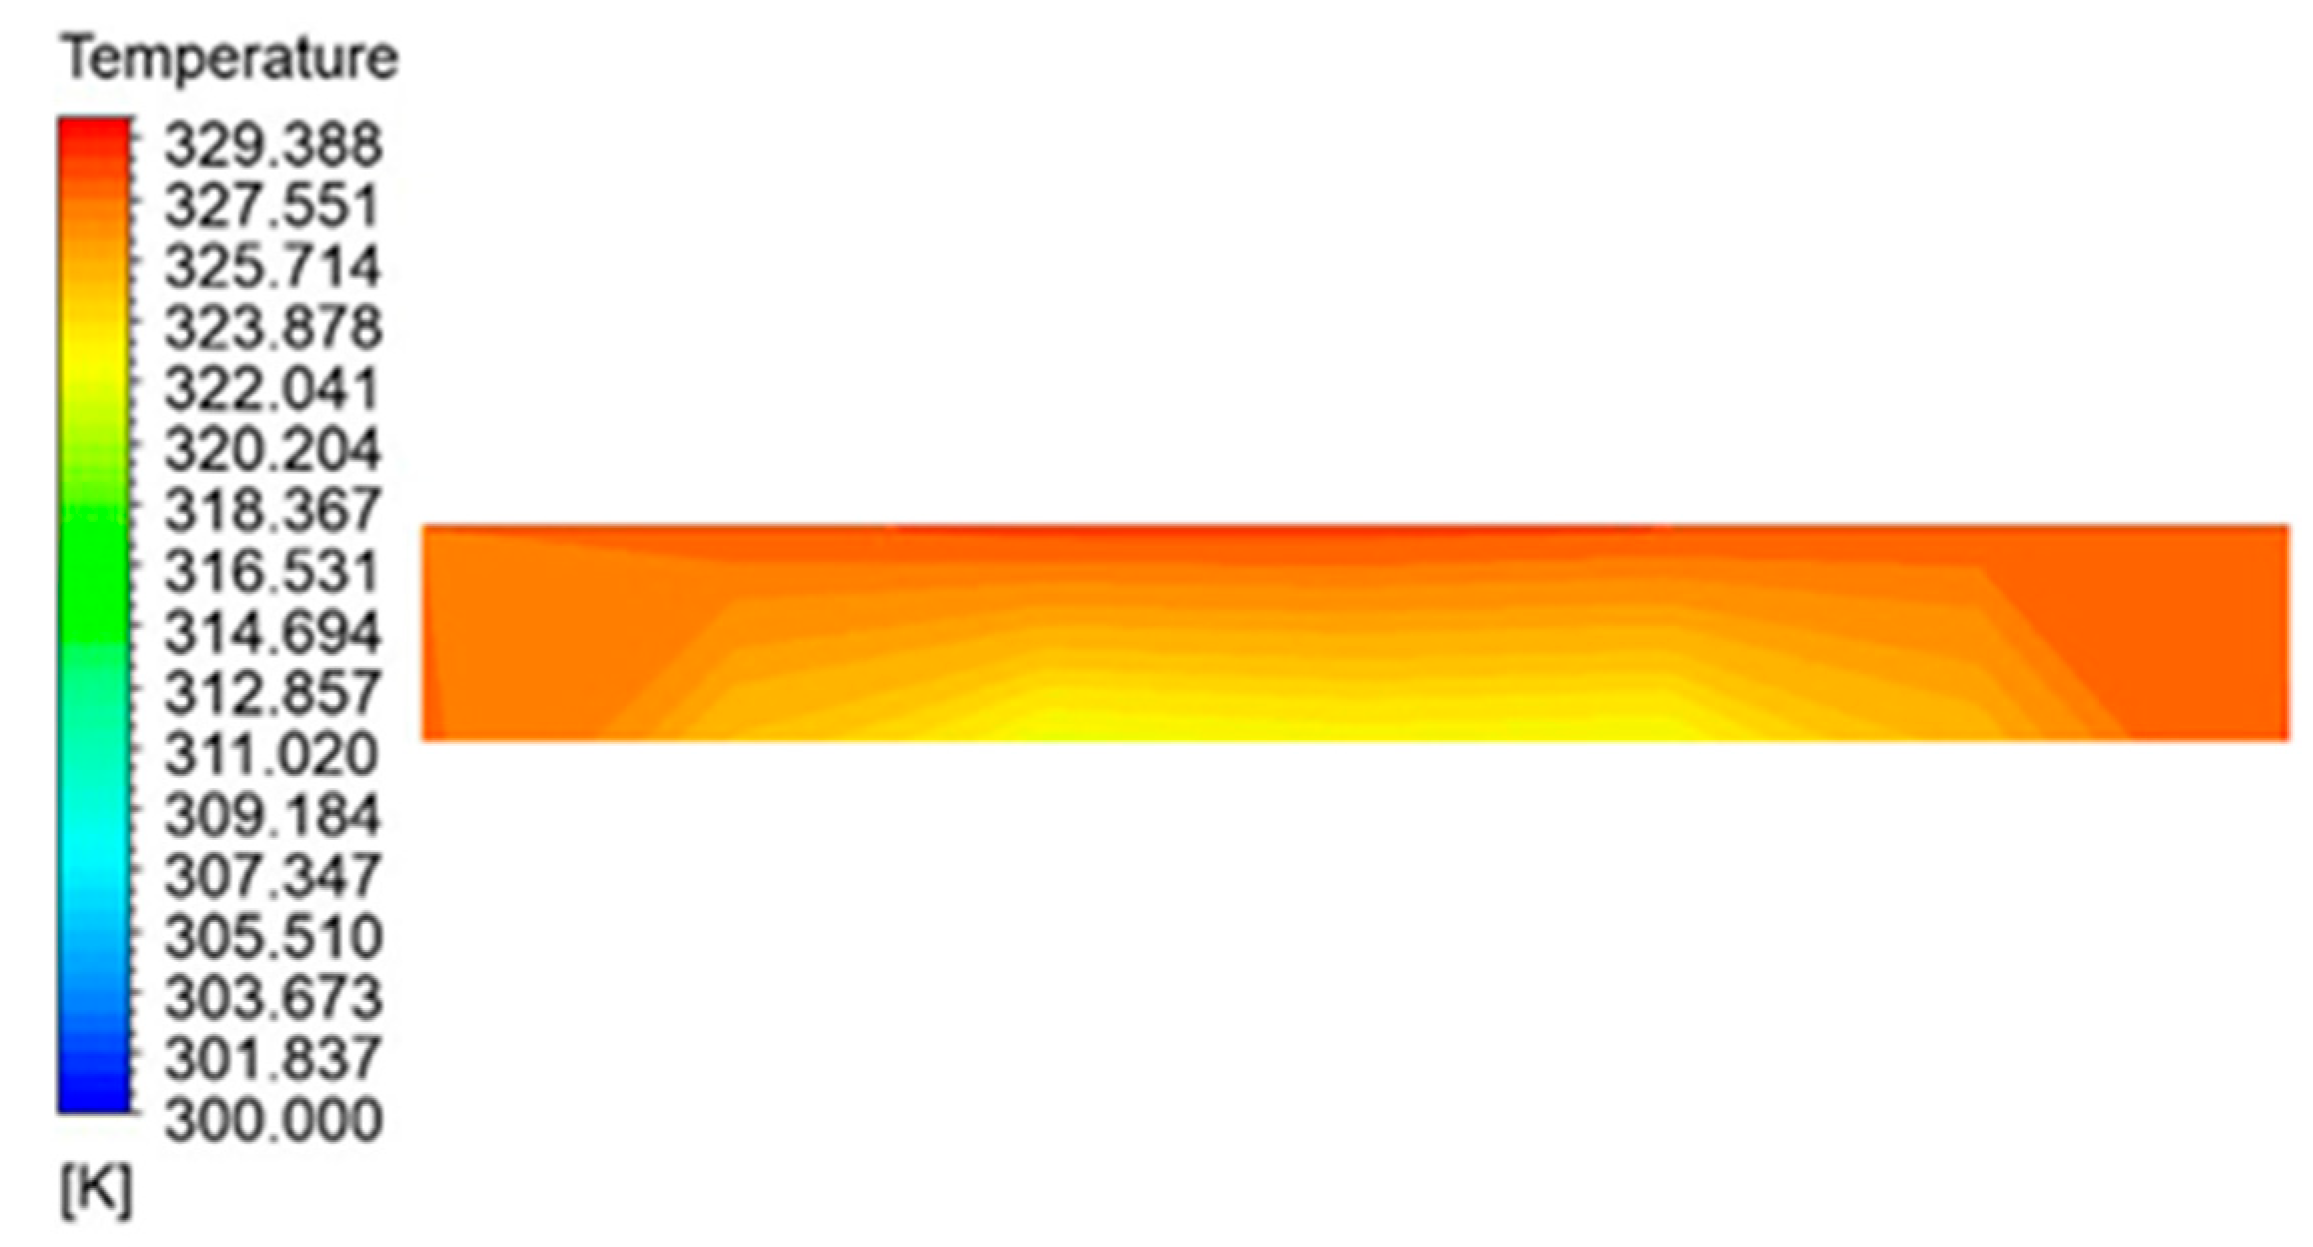
Figure 15.
Average temperature changes in the nano encapsulated phase change material with a volume fraction of 5%.
Figure 15.
Average temperature changes in the nano encapsulated phase change material with a volume fraction of 5%.

Figure 16.
The diagram of the output fluid temperature, the average temperature of the absorbent copper plate and the average temperature of the nano encapsulated phase change material with a volume fraction of 5%.
Figure 16.
The diagram of the output fluid temperature, the average temperature of the absorbent copper plate and the average temperature of the nano encapsulated phase change material with a volume fraction of 5%.
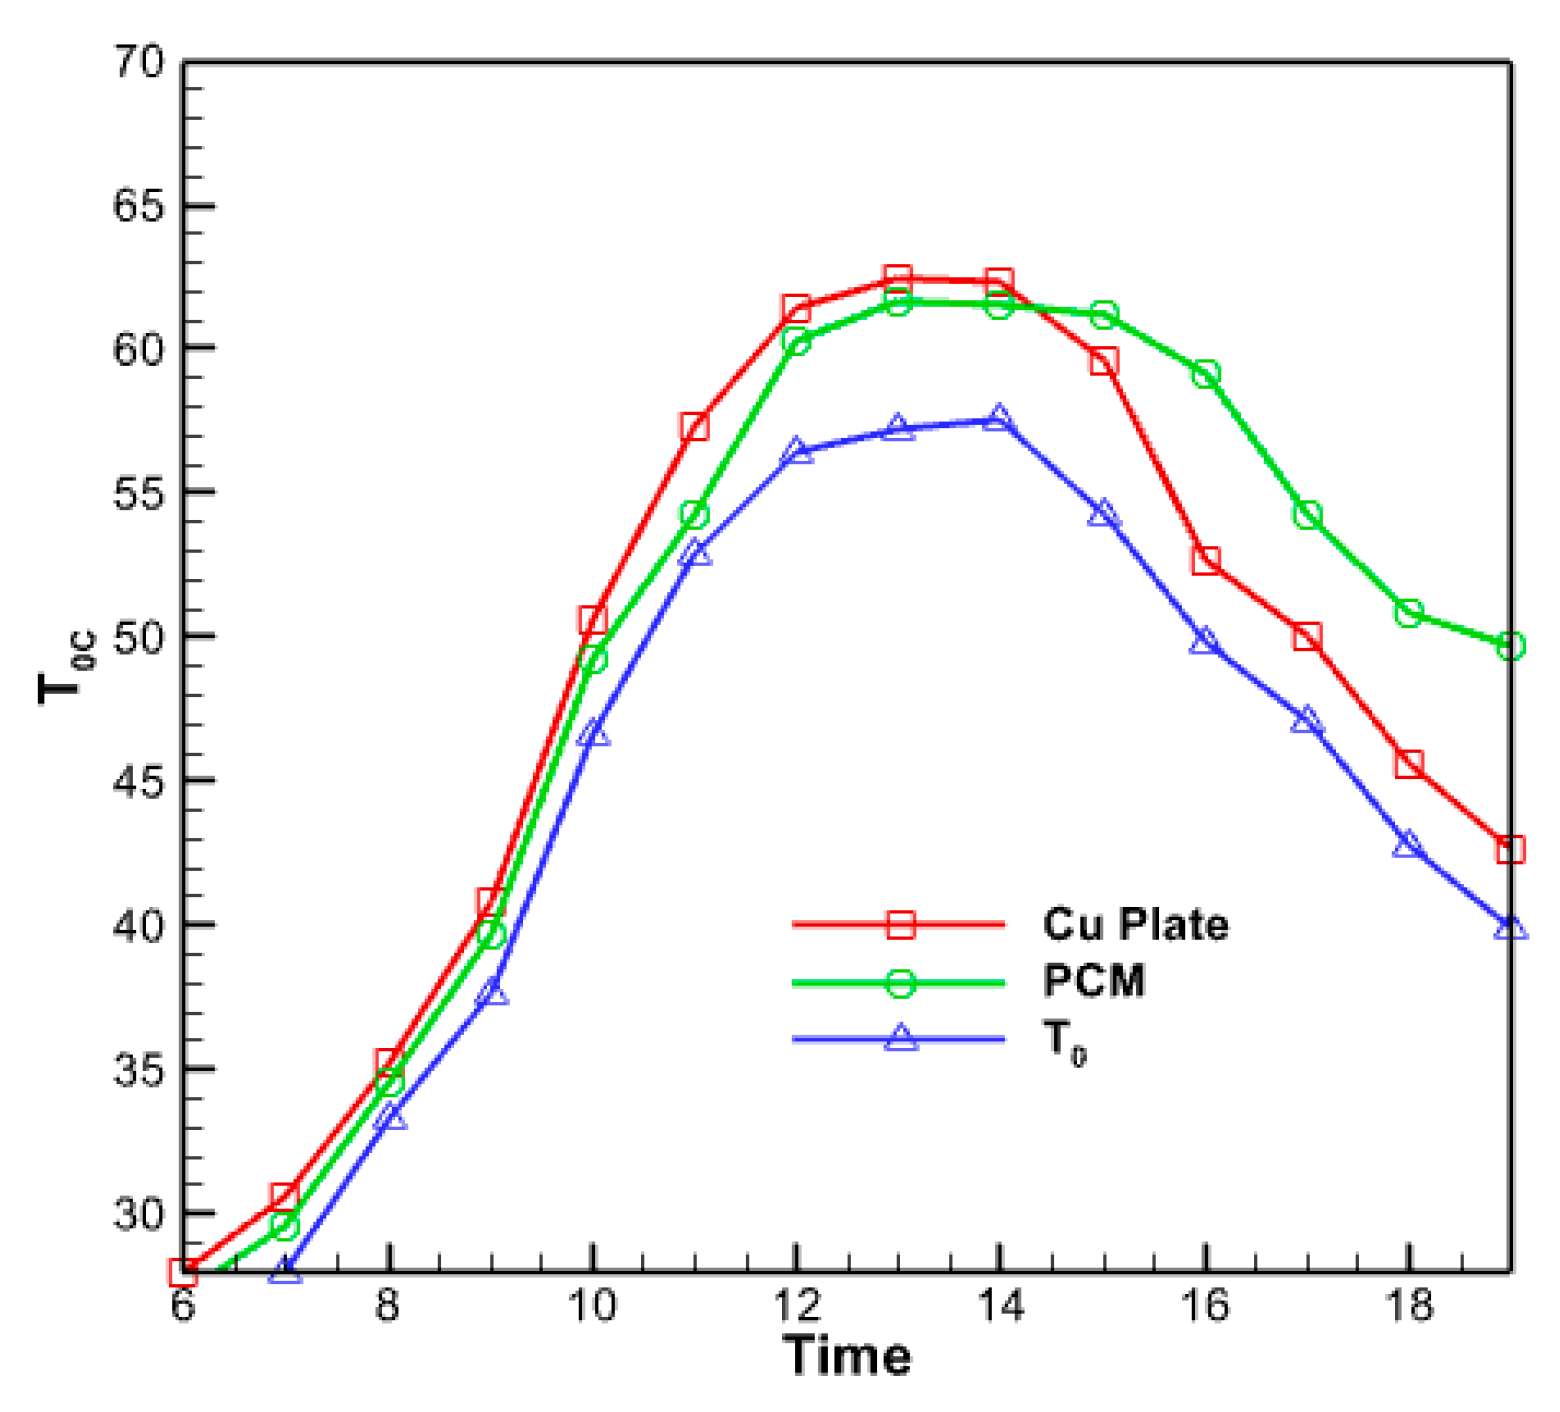
Figure 17.
Comparison of the temperature changes of the outlet water from the collector in the present work and the research of Carmona et al. [28].
Figure 17.
Comparison of the temperature changes of the outlet water from the collector in the present work and the research of Carmona et al. [28].
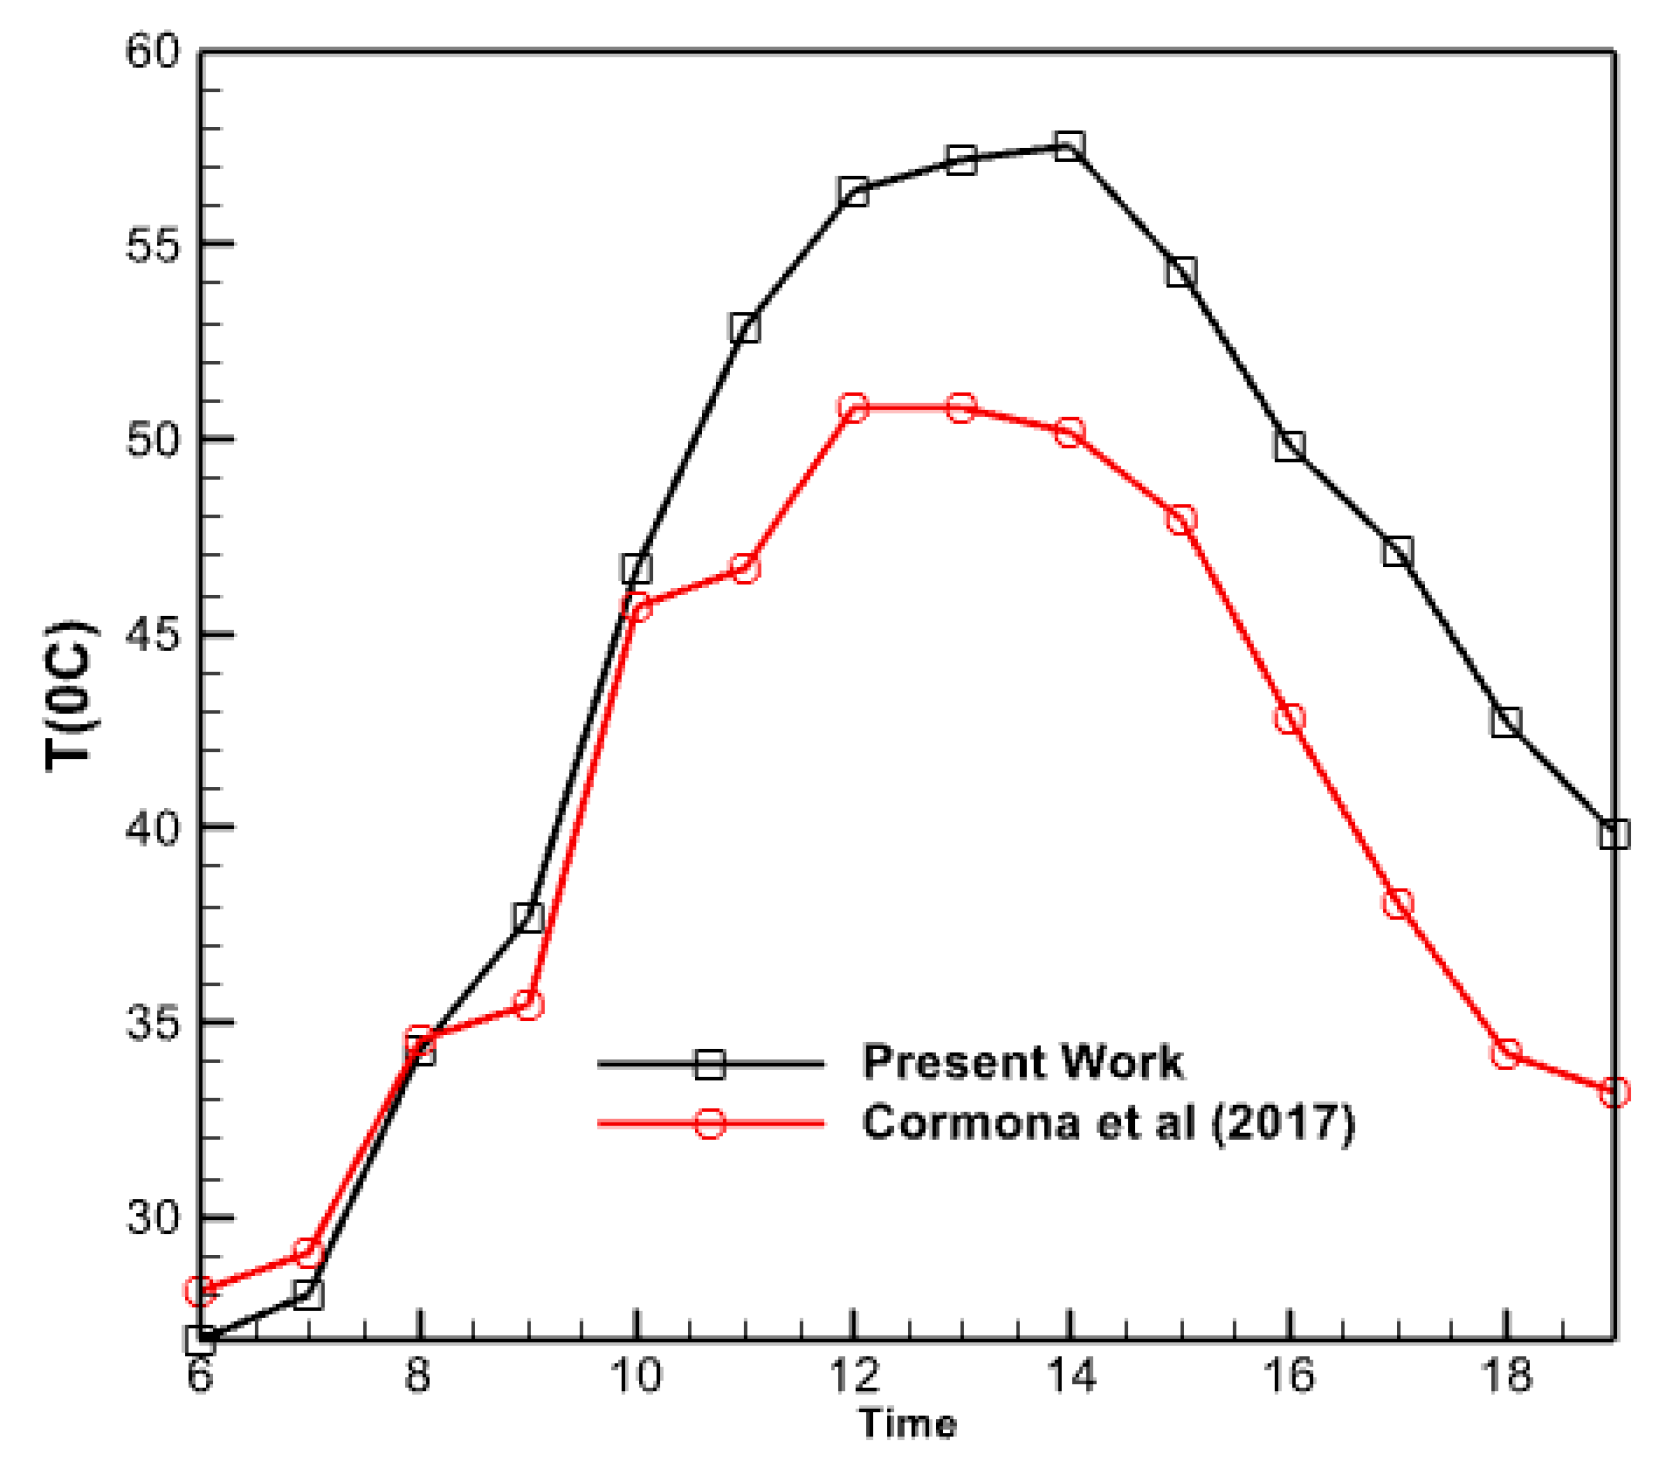
Figure 18.
Time changes of the output temperature from the collector in two cases with and without PCM.
Figure 18.
Time changes of the output temperature from the collector in two cases with and without PCM.
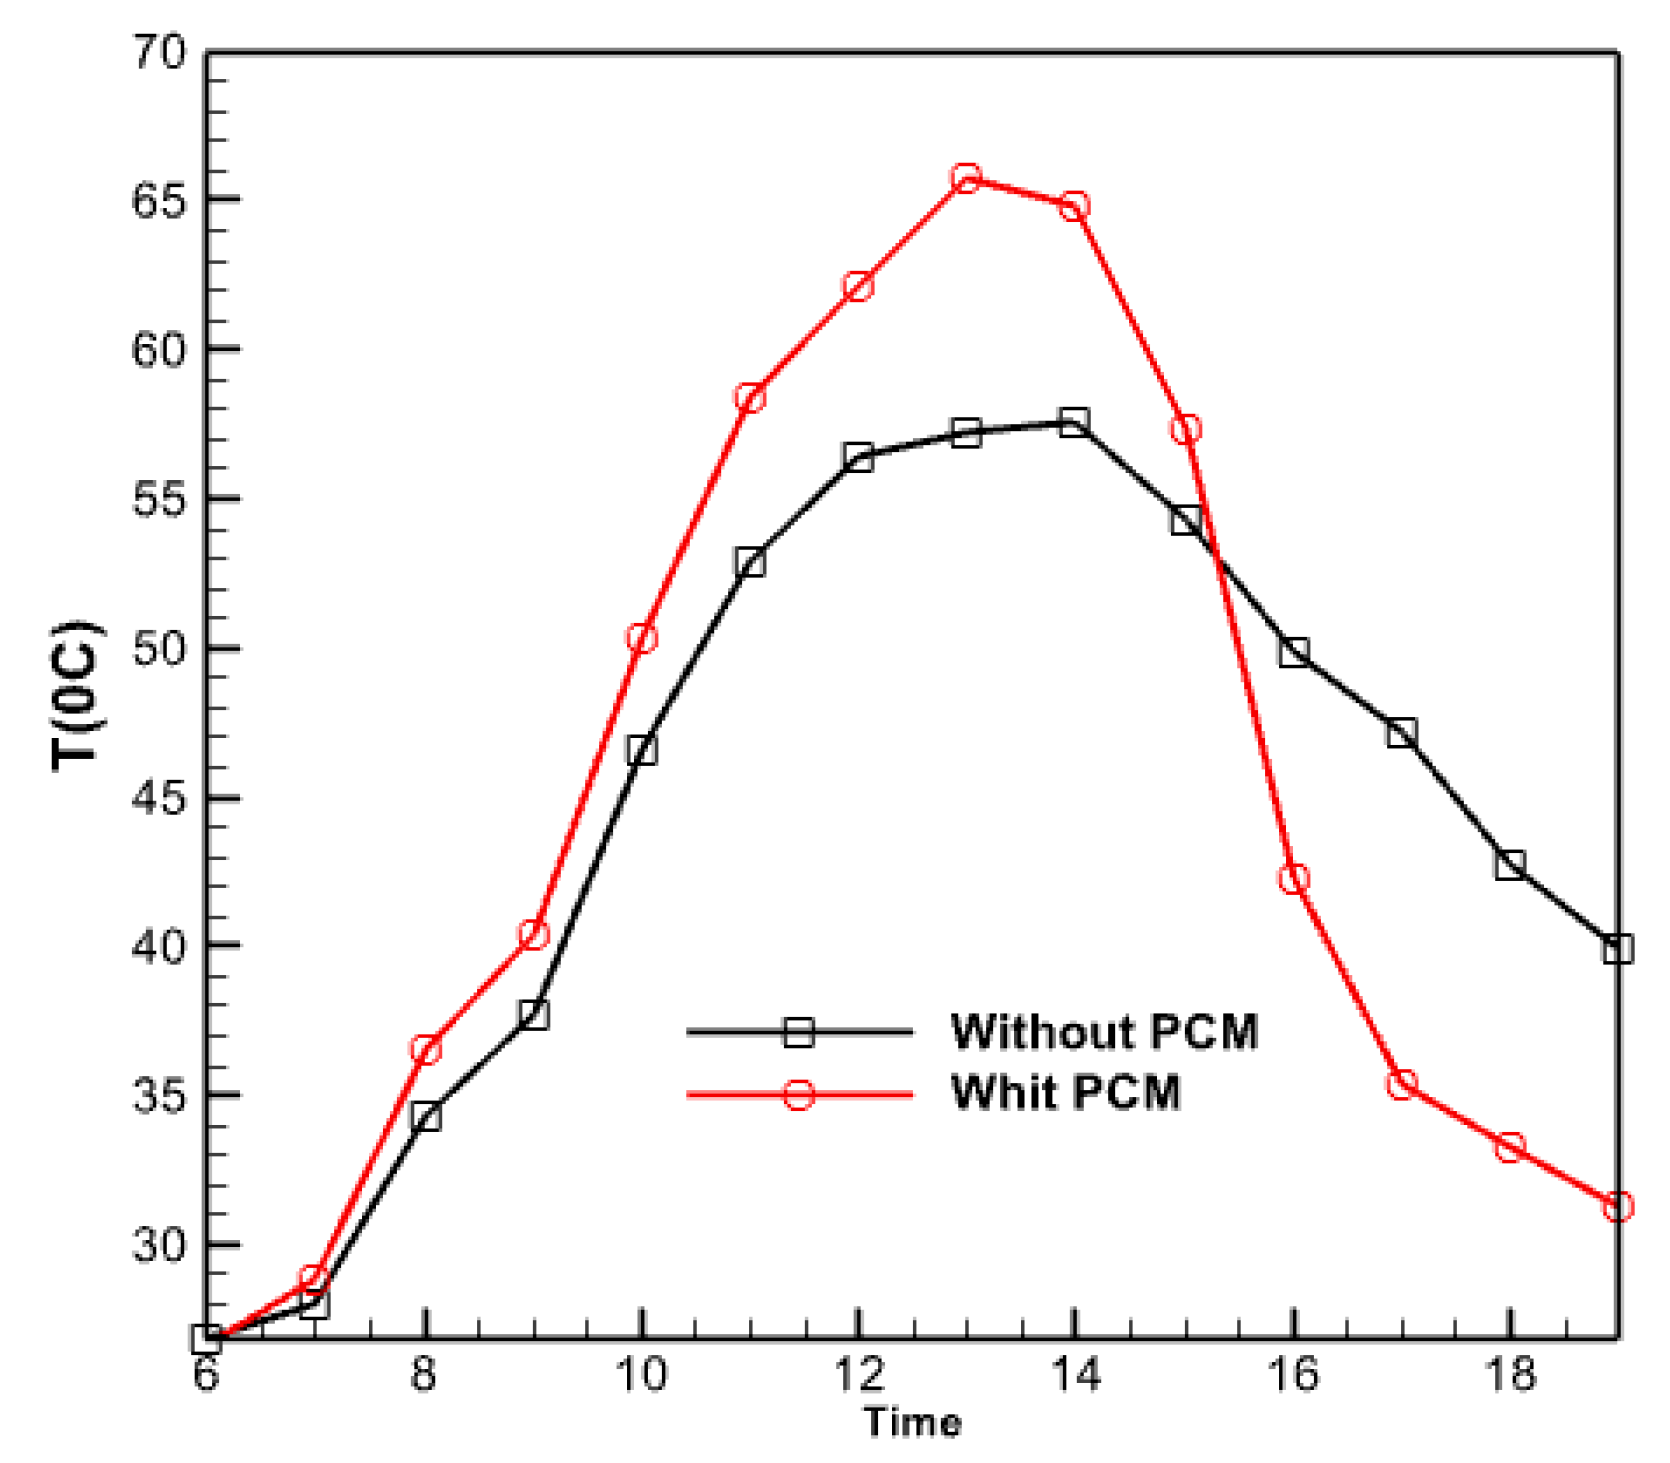
Figure 19.
The effect of adding copper nanoparticles to PCM on hot water outlet temperature.
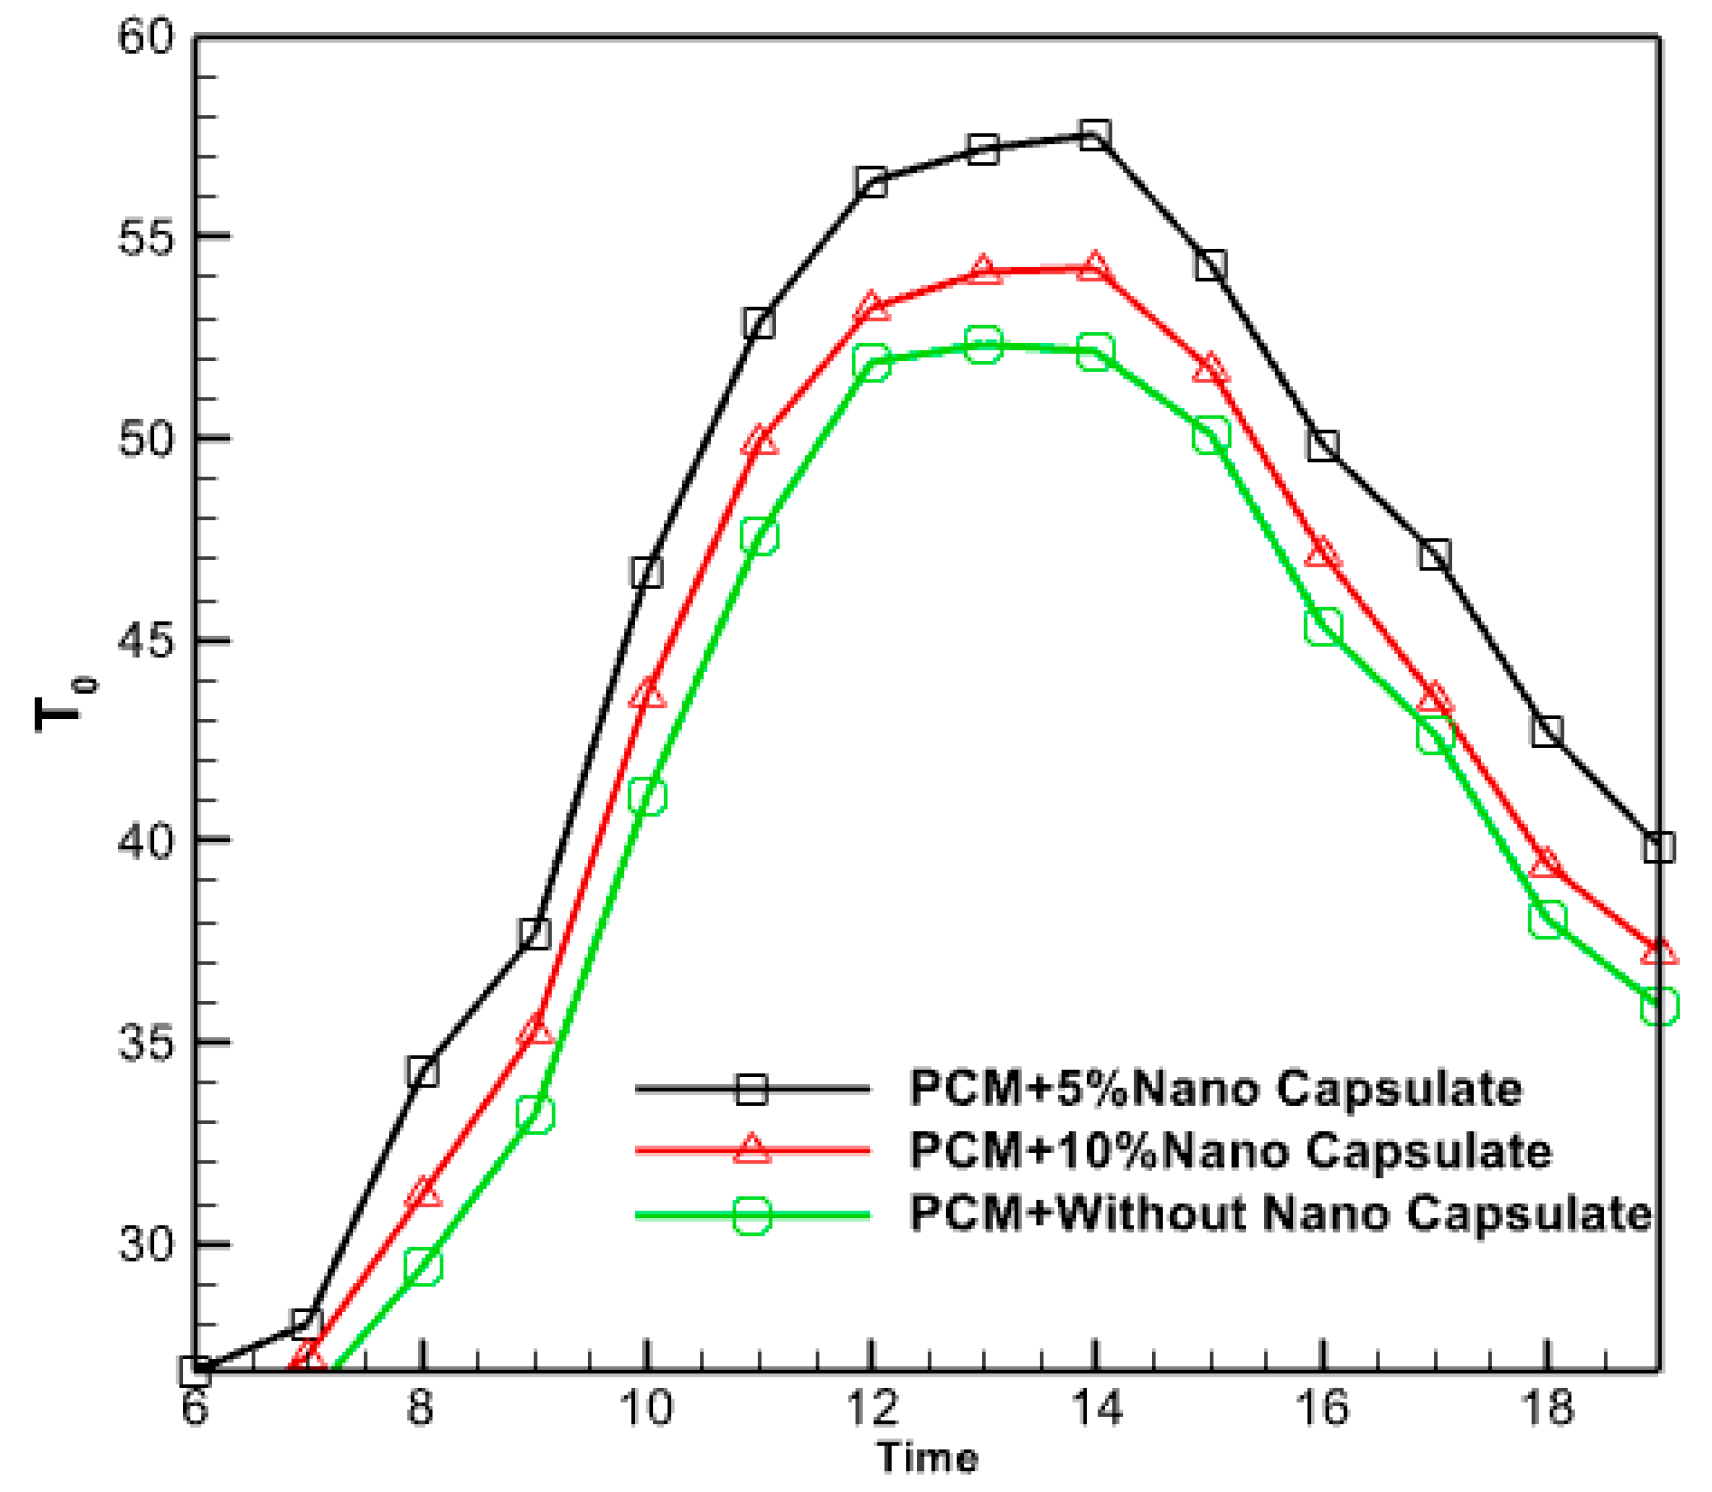
Figure 20.
The average temperature of the water inside the collector during it, at 14 h.
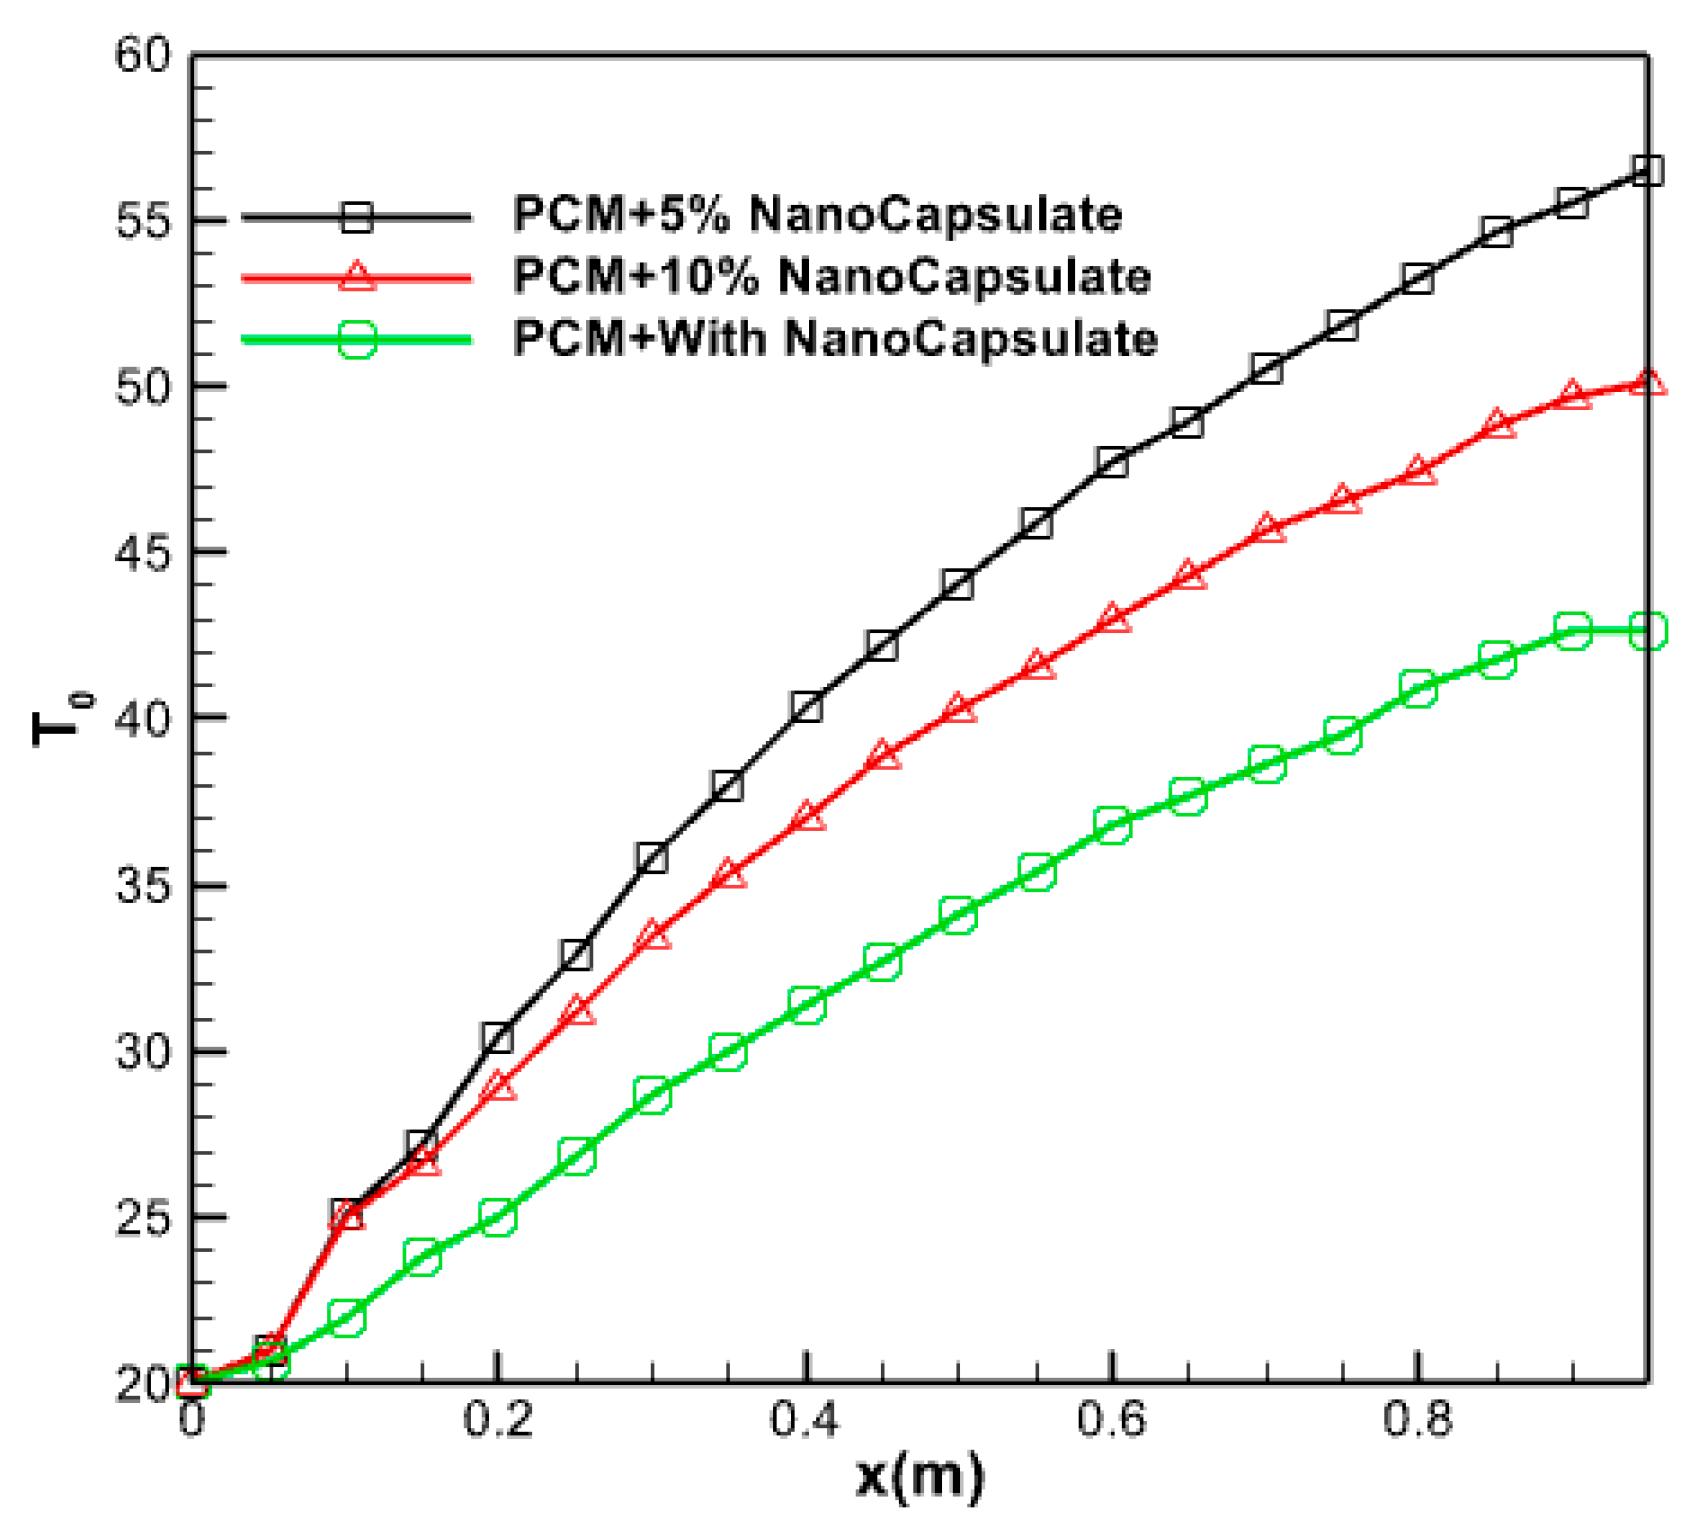
Figure 21.
Changes in thermal efficiency of the collector according to the mass flow rate of the input fluid.
Figure 21.
Changes in thermal efficiency of the collector according to the mass flow rate of the input fluid.

Table 1.
Description and specifications of flat plate solar collectors.
| Description | Specifications |
|---|---|
| cover | 3 mm: Glass |
| Pipe | 80-mm-outside diameter: copper |
| Connecting pipes | 1-mm-thick pipes: Copper |
| outlet pipe | 1-mm-thick pipes: Copper |
| Inlet pipe | 1-mm-thick pipes: Copper |
| Single wall frame | Aluminum with final dimensions of 0.78 by 1.60 m |
| air cavity | 3.5 cm spacing between the glass cover and the absorber |
| Solid Styrofoam board | Density of 40 kg/m3 and a thickness of 50 mm |
Table 2.
Thermophysical properties of paraffin.
| Density | 815 (Kg/m3) |
|---|---|
| hidden heat | 244 (kj/kg) |
| Thermal conductivity | 0.18 (W/m.k) |
| heat capacity | 2000(J/kg) |
| Particle diameter | 100(nm) |
| latent heat of fusion | 190 kg/kj |
| melting point | 53.7 °C |
Table 3.
Properties of solid materials used in collector simulation.
| ρ (Kg/m3) | Cp (J/KgK) | ||
|---|---|---|---|
| aluminum | 2719 | 871 | 4.202 |
| copper | 8978 | 381 | 6.387 |
| Glass | 2800 | 750 | 0.7 |
Disclaimer/Publisher’s Note: The statements, opinions and data contained in all publications are solely those of the individual author(s) and contributor(s) and not of MDPI and/or the editor(s). MDPI and/or the editor(s) disclaim responsibility for any injury to people or property resulting from any ideas, methods, instructions or products referred to in the content. |
© 2024 by the authors. Licensee MDPI, Basel, Switzerland. This article is an open access article distributed under the terms and conditions of the Creative Commons Attribution (CC BY) license (https://creativecommons.org/licenses/by/4.0/).
Share and Cite
MDPI and ACS Style
Rahi, M.R.; Ostadi, S.; Rahmani, A.; Dibaj, M.; Akrami, M. Studying the Improvement of Solar Collector Mechanism with Phase Change Materials. Energies 2024, 17, 1432. https://doi.org/10.3390/en17061432
AMA Style
Rahi MR, Ostadi S, Rahmani A, Dibaj M, Akrami M. Studying the Improvement of Solar Collector Mechanism with Phase Change Materials. Energies. 2024; 17(6):1432. https://doi.org/10.3390/en17061432
Chicago/Turabian StyleRahi, Maha Rahman, Saba Ostadi, Amin Rahmani, Mahdieh Dibaj, and Mohammad Akrami. 2024. "Studying the Improvement of Solar Collector Mechanism with Phase Change Materials" Energies 17, no. 6: 1432. https://doi.org/10.3390/en17061432
Note that from the first issue of 2016, this journal uses article numbers instead of page numbers. See further details here.