Article

Analysis of the Solar Pyrolysis of a Walnut Shell: Insights into the Thermal Behavior of Biomaterials

by
Arturo Aspiazu-Méndez
1,
Nidia Aracely Cisneros-Cárdenas
1,
Carlos Pérez-Rábago
1,
Aurora M. Pat-Espadas
2,
Fabio Manzini-Poli
1 and
Claudio A. Estrada
1,*
1
Institute of Renewable Energy, National Autonomous University of Mexico (IER-UNAM), Priv. Xochicalco S/N, Temixco 62580, Morelos, Mexico
2
Institute of Geology, National Autonomous University of Mexico, Hermosillo 83000, Sonora, Mexico
*
Author to whom correspondence should be addressed.
Energies 2024, 17(6), 1435; https://doi.org/10.3390/en17061435
Submission received: 27 January 2024 / Revised: 3 March 2024 / Accepted: 8 March 2024 / Published: 16 March 2024
(This article belongs to the Special Issue Advances in Bioenergy and Waste-to-Energy Technologies)

Abstract

:
The state of Sonora, Mexico, stands as one of the leading producers of pecan nuts in the country, which are commercialized without shells, leaving behind this unused residue. Additionally, this region has abundant solar resources, as shown by its high levels of direct normal irradiance (DNI). This study contributes to research efforts aimed at achieving a synergy between concentrated solar energy technology and biomass pyrolysis processes, with the idea of using the advantages of organic waste to reduce greenhouse gas emissions and avoiding the combustion of conventional pyrolysis through the concentration of solar thermal energy. The objective of this study is to pioneer a new experimental analysis methodology in research on solar pyrolysis reactors. The two main features of this new methodology are, firstly, the comparison of temperature profiles during the heating of inert and reactive materials and, secondly, the analysis of heating rates. This facilitated a better interpretation of the observed phenomenon. The methodology encompasses two different thermal experiments: (A) the pyrolysis of pecan shells and (B) the heating–cooling process of the biochar produced in experiment (A). Additionally, an experiment involving the heating of volcanic stone is presented, which reveals the temperature profiles of an inert material and serves as a comparative reference with experiment (B). In this experimental study, 50 g of pecan shells were subjected to pyrolysis within a cylindrical stainless-steel reactor with a volume of 156 cm3, heated by concentrated radiation from a solar simulator. Three different heat fluxes were applied (234, 482, and 725 W), resulting in maximum reaction temperatures of 382, 498, and 674 °C, respectively. Pyrolysis gas analyses (H2, CO, CO2, and CH4) and characterization of the obtained biochar were conducted. The analysis of heating rates, both for biochar heating and biomass pyrolysis, facilitated the identification, differentiation, and interpretation of processes such as moisture evaporation, tar production endpoint, cellulosic material pyrolysis, and lignin degradation. This analysis proved to be a valuable tool as it revealed heating and cooling patterns that were not previously identified. The potential implications of this tool would be associated with improvements in the design and operation protocols of solar reactors.

1. Introduction

Mexico is a significant producer of pecan nuts (Carya illinoinensis). The state of Sonora, located in the northwest of Mexico, is the second-largest national producer, with 18,326 tons in 2016 [1]. The largest volume of pecans is sold without shells, resulting in an equivalent amount of shell waste for every gram of nuts produced. Sonora also has a considerable solar resource, with 7 kW h/m2 of direct irradiation [2]. Hence, it is reasonable to explore the development of an efficient and low-cost process that harnesses this solar resource and transforms nutshells into high-value commercial material. Concentrated Solar Power (CSP) technology can be used as a heat source for biomass pyrolysis and gasification processes. The process studied in this paper mainly consists of the solar pyrolysis of biomass, which is the thermal degradation of the material within an inert atmosphere to prevent combustion [3].
The pyrolysis process yields combustible gases and liquids, along with the production of biochar, which is a solid fuel. Biochar, produced through pyrolysis, serves various environmental purposes, such as soil remediation, industrial wastewater treatment, and carbon capture. It helps counteract CO2 emissions resulting from the decomposition of plant and agro-industrial waste by storing biochar in the soil for thousands of years. Therefore, biochar production is an important strategy for carbon sequestration [4,5,6,7,8,9]. Additionally, biochar holds potential for various applications beyond its conventional use. For instance, biopolymers derived from biochar show promise as alternative electrode materials for high-performance supercapacitors, indicating their potential in electrochemical energy storage applications [10].
To develop industrial-scale biomass pyrolysis reactors that allow the use of the resources mentioned above, it is necessary to overcome operational challenges. Vuppaladadiyam [11] reported the problems that, to date, have not been fully resolved and that hinder the commercial development of the technology. According to Vuppaladadiyam, the most important issues are as follows: (i) aerosol formation, (ii) tar control, (iii) modeling of heat transfer processes, (iv) the selection of reaction mechanisms and mathematical modeling, (v) designs highly dependent on the characteristics of the raw material, and (vi) scaling. In principle, if the six points listed are understood, it would be possible to establish commercially competitive pyrolysis plant designs. One of the topics addressed in this study is determining the optimal conditions for the production of biochar and synthesis gas in reactors powered by concentrated solar energy.
An essential feature of solar-powered pyrolysis lies in the elimination of hydrocarbon combustion, which has historically served as the primary source of thermal energy in conventional processes. In contrast to traditional methods such as downdraft gasifiers, solar pyrolysis requires a different approach. This type of reactor generates syngas and degrades tar simultaneously, with the reactions occurring in a section called the hearth [12,13]. However, this configuration is not found in solar gasification reactors, which implies the need to remove the tars before introducing the gasifying agent into them. Therefore, during the solar pyrolysis process, it is imperative to allow the tar formed to exit the reactor before the introduction of the gasifying agent. Otherwise, tar vapors could inhibit the gasification reaction [14]. Hence, it is essential to determine the point at which tar stops forming.
The objective of this study was to analyze the thermal behavior of the materials inside a stainless-steel reactor under high-flux concentrated solar radiation, particularly focusing on the formation of biochar, tar, and synthesis gas during the biomass pyrolysis process.
The thermal behavior of a material is understood as its response to heating and cooling, which can lead to physical or chemical changes such as phase transitions, molecular rearrangements, or chemical reactions of any type [15].
During this study, heating rates became one of the variables under study. Behavioral patterns were sought to determine the moment at which biochar production begins and the moment at which tar production ceases. The initial phase consisted of heating an inert material (volcanic stone). Subsequently, pyrolysis experiments were carried out using walnut shells to produce biochar. The final stage involved heating the produced biochar to determine whether tar production continues or ceases during the heating of the biochar.

2. Methods

2.1. Experimental Setup

In the context of experimentation with high-temperature solar reactors that use concentrated solar energy (CSP), the heating regime is one of constant thermal power [16,17]. To facilitate experimentation with concentrated solar energy, solar simulators, also known as high-flux solar simulators (HFSS), are used. These devices consist of a mirror that concentrates the radiation from a short-arc xenon lamp in a focal area where temperatures can exceed 1000 °C. An advantage of solar simulators is that they emit a spectrum very similar to that of natural sunlight in the range of 305–775 nm [18]. Another advantage is that these instruments can be used for long periods at constant power without risk of interruptions caused by weather events. The difference between xenon lamp simulators and natural sunlight lies in the fact that simulators emit large characteristic peaks in the range of 200–400 nm [19], which are part of the ultraviolet (UV) spectrum. The sun also emits this same part of the spectrum; however, it does so to a much smaller magnitude [20].
Figure 1 shows the schematic of the experimental setup for biomass pyrolysis employed in this study. It consists of the following four parts: (i) the solar simulator; (ii) the cylindrical stainless-steel reactor; (iii) the gas cleaning system; and (iv) the gas chromatography unit. Within the reactor, the raw material is placed, and one of its sides is exposed to heat generated by the solar simulator. This solar simulator features a 7 kWe Xenon lamp that concentrates radiation using an ellipsoidal mirror. The concentrated radiation hits one of the faces of the reactor that functions as a receiver, heats it, and the absorbed thermal energy is transferred to the interior of the reactor, mainly by conduction and convection processes. The reactor is a partially closed vessel. Thus, the heating of the biomass is carried out indirectly. One of the advantages of using a solar simulator is the control of radiative power and its constancy during experimentation.
The system instrumentation was integrated with sensors for temperature, pressure, and chemical composition of the gases. Temperature sensors were categorized into two types: peripheral thermocouples, which contact the external surfaces of the reactor, and internal thermocouples, which come into contact with the biomass and gases. To determine the composition of the gases produced, a gas chromatography unit connected to the outlet of the system was used. Additionally, Figure 1 shows the process flow diagram with instrumentation. Thermocouples T1, T2, T3, and T4 correspond to the peripheral sensors situated at the front, rear, top, and bottom of the reactor, respectively. T5 is an internal thermocouple in direct contact with the biomass. P1 is the reactor internal pressure sensor. T6 measures the temperature of the gases leaving the reactor. T7 measures the condensation temperature of the tar. The thermocouples T8 and T9 measure the temperature of each of the glass condensers depicted in Figure 1. The exhaust gases pass through a cleaning system that eliminates tars and aerosols, allowing the gas composition to be measured in a gas chromatograph (GC). The gas cleaning system comprises three condensers that cool down the carrier gas flow, with each condenser collecting a fraction of the liquids produced in the pyrolysis reaction. Additionally, a cotton filter was placed for safety reasons to prevent damage to the GC, as the liquids and aerosols from biomass pyrolysis are corrosive [21].
For the experimental campaign, the Agilent 490 Micro GC Biogas chromatography unit was employed. This unit comprises two columns: Molsieve 5 Å and Pora PLOT U. The former operates using argon and measures H2, CO2, and CH4, while the latter column operates with helium and measures CO2.

2.2. Experimental Design

As previously mentioned, this study aims to investigate the thermal behavior of walnut shell pyrolysis and its produced biochar by identifying patterns in temperature curves that can be observed during phase changes or chemical reactions. The experimental design encompasses two different thermal experiments: (A) the pyrolysis of walnut shells and (B) the heating–cooling process of the biochar produced in experiment (A). Additionally, an experiment involving the heating of volcanic stone is presented, which reveals the temperature profiles of an inert material and serves as a control group for the experiment (B).
The goal of the experiments with volcanic stone, as a control group, was to generate heating curves for comparison with biochar heating and its analysis of heating rates. Using 71.5 g of volcanic stone (particle diameters: 1–4 mm), three experiments were carried out at thermal powers of 234, 482, and 725 W with a carrier gas flow of 1 L/min.
Following the inert material experiments with volcanic stone, biomass pyrolysis experiments were conducted using pecan shells. These experiments utilized a continuous Argon carrier gas flow of 1 L/min to prevent potential combustion reactions. The thermal powers employed were consistent at 234, 482, and 725 W. A quantity of 50.7 g of pecan nutshell, with particle diameters ranging from 1 to 4 mm, was employed for these trials. To distinguish them, these pecan shell experiments were categorized as reactive experiments and denoted as case A (CA).
The third phase of the experimentation involved heating and cooling the biochar under the same conditions as the previous experiments, referred to as case B (CB) experiments. Notably, biochar heating occurred immediately after the pecan nutshell pyrolysis experiments (CA). In this phase, 50.7 g of pecan nutshell was introduced into the steel reactor and heated with a constant radiative power of 234 W for 75 min using the solar simulator. Subsequently, the reactor underwent a cooling period of approximately 3 h until reaching ambient temperature (around 28 °C). The solar simulator was then reactivated and operated for an additional 75 min at 234 W. This sequence was replicated with thermal powers of 482 and 725 W, adjusting the durations based on the maximum reaction temperature.
In summary, the experimental campaign included observations with volcanic stone to understand the thermal behavior of dry and inert materials, comparing it with biochar. The pecan nutshell experiments focused on discerning the specific behavior of biomass pyrolysis within the solar reactor. The subsequent biochar heating experiments aimed to pinpoint the cessation of tar production. Throughout this campaign, the primary emphasis was on understanding the thermal behavior of the materials involved.

2.3. Materials

Some of the properties of the walnut shell used are reported in Table 1, which are relevant to the experiment; for example, the measured humidity of the shell was 7.73 wt%. These data are important because they seek to observe the response of the temperature and pressure sensors during drying. Likewise, an elemental analysis was carried out so that, at the end of the experiments, a comparison of the elemental composition with the biochar produced could be made.
A thermogravimetric analysis (TGA) of the walnut shell was also performed. This was performed with a heating ramp of 10 °C/min. Figure 2 shows the results of the TGA. Three peaks can be observed in the mass-versus-time derivative. The first peak is associated with the drying of the sample moisture, and the other two are associated with the decomposition of hemicellulose and cellulose.
For the experimentation, volcanic stone commonly referred to as “tezontle” was utilized. This type of stone falls under the basaltic category. This material is primarily composed of SiO2, constituting 45–50% of its composition [22]. The remainder consists of oxides of Fe, Mg, Ca, and Na [23]. Tezontle is a highly prevalent stone in Mexico with numerous applications, including construction, architecture, sculpture, agricultural soil substrate, kitchen or metallurgical furnaces, and various other uses [24]. For the experiments, the volcanic stone was pulverized using a hammer and sieved to obtain particles with a diameter ranging from 1 to 4 mm.
The abundance of tezontle stone is not the only reason why it was chosen for this work. Previous studies have reported that basaltic rock is a candidate material for sensible thermal energy storage systems because it has been determined that its physicochemical properties and thermal stability are suitable for such applications [25].

3. Results and Discussion

3.1. Sensitive Heat: Thermal Behavior of Volcanic Stone and Biochar

This section focuses solely on outcomes from volcanic stone and biochar heating (case B), excluding walnut shell pyrolysis results.
Figure 3a displays heating profiles for 71.5 g of volcanic stone at three thermal power levels (low: 234 W; medium: 482 W; high: 725 W). Figure 3b shows corresponding heating rates. The volcanic stone remains dry and inert in the air, and it does not undergo pyrolysis due to its high melting point (>1000 °C) [25]. Throughout the experiments, its temperature stays below 800 °C with no observed phase transitions, indicating that the absorbed thermal energy manifests as sensible heat.
The examination of temperature curves and heating rates for biochar showed a behavior similar to that observed with the stone (refer to Figure 3c,d). Furthermore, gas chromatography was employed to quantify the gases generated during biochar heating, yielding a negligible amount.
The biochar heating curves are presented in Figure 3c and their respective rates are presented in Figure 3d. The differences between the temperature curves and their corresponding rates are attributed to the distinct masses and thermal properties of the materials. Additionally, the reactor’s mass plays a crucial role, as thermal energy transfer occurs primarily through thermal conduction from the reactor body to the internal material. Table 2 reports the values of mass, heat capacity, and thermal conductivity of each material.
It is noteworthy that in the heating rate analysis (Figure 3f), similar heating patterns and a convergence point among them were observed. These results were obtained independently of mass, heat capacity, thermal conductivity, and thermal power. Although the peaks of the rates do not exactly match in time, nor do the curves precisely converge, these patterns reveal the characteristic behavior of the reactor heating dry and inert material contained within.
The employment of constant thermal power leads to the observation of only one peak in their derivative, which corresponds to an inflection point in the heating rates (see Figure 3b,d,f). Therefore, after this inflection point, the temperature increase will progressively slow down until reaching a steady state. Also, experimentally, only one peak was observed for each of the working thermal powers because there were no variations in power. If this had not been the case, multiple inflection points would have been observed in the heating rate graphs. Likewise, if phase changes had occurred, plateaus would have been observed during the period when the material absorbs latent heat; however, this was not the case. In the following section, the results are presented, where phase changes and chemical reactions disrupting heating rates were observed in the samples. Therefore, the heating behavior of tezontle (volcanic stone) and biochar corresponds to that of an inert material, a material that does not undergo chemical reactions; however, biochar is not entirely inert because the gas chromatography unit detected the formation of synthesis gas. For this reason, biochar is categorized as a quasi-inert material.

3.2. Latent Heat and Interpretation of Pyrolysis Stages

This section details the outcomes of walnut shell pyrolysis (case A) and biochar heating–cooling (case B). Figure 4a,c,e illustrate the temperature curves for both cases at power levels (234, 482, and 725 W), while Figure 4b,d,f show the corresponding heating rate curves. The curves were analyzed and segmented into distinct stages: S1 and S2, the valley (V), the convergence zone (Conv), and the cooling zone.
The initial phase (S1) exhibits a peak and a plateau, indicating the drying of the sample (refer to Figure 4). The first peak in S1 marks the initiation of drying, while the plateau represents the transition from liquid to water vapor. Segment S2 features a peak covering the pyrolysis of hemicellulose, cellulose, lignin’s glass transition, and the initial stage of lignin pyrolysis. Grønli [29] and Ding [30] reported cellulose pyrolysis results, noting its near-complete consumption at 370 °C with a heating rate of 5 °C/min. In this study’s medium- and high-power experiments, the second peak temperature in the heating rates surpassed 400 °C, strongly suggesting complete pyrolysis of cellulose and hemicellulose.
Moreover, the reported glass transition temperature (Tg) of lignin falls within the range of 120–160 °C [31]. Notably, temperatures in all experiments exceed this reported Tg range. In the heating rate analysis for case A, a valley in the heating rate occurred, with its minimum value coinciding with the end of interval S2 (refer to Figure 4), effectively defining the conclusion of this interval. This valley is interpreted as the final stage of tar formation during lignin pyrolysis. The literature reports highlight an incomplete understanding of lignin reaction mechanisms [32].
Lignin, a phenolic polymer primarily composed of p-hydroxyphenyl, guaiacyl, and syringyl, sets itself apart from cellulose by being predominantly formed by D-glucose monomers. Although the exact formation time of heavier tars during biomass pyrolysis remains uncertain, certain reports suggest that the pyrolysis of the three main lignin components degrades within the range of 200–500 °C [33,34]. Consequently, lignin pyrolysis aligns with the time window of period S2, indicating that the valleys observed only represent the final stage of tar production.
It is important to acknowledge that temperature ranges for the decomposition of different lignin components may vary among studies and authors due to differences in experimental conditions and methodologies [34]. This variability is often reflected in the scientific literature, presenting variations in reported temperature values for lignin component decomposition during pyrolysis. After each of the valleys depicted in Figure 4, the convergence of heating rates for Cases A and B is observed. This outcome is unexpected, given that the literature reports predominantly describe biomass pyrolysis reactions as endothermic [35].
In the course of the literature review, no scientific articles or commercial prototypes were identified that clearly explain or promote biomass pyrolysis as a self-sustaining process in the absence of oxygen. Consistently, it is reported that this process requires an external energy source or combustion assistance [36,37]. Studies only provided results indicating exothermic behavior for brief periods or specific temperature ranges [38].
Considering these factors, our initial hypothesis suggested that the heating rates in case A would be lower than those in case B. However, contrary to this expectation, convergences were noted following the valleys. These convergence points indicate an equalization in mass and thermal properties of the heated substances, as illustrated notably in Figure 4f. Beyond these points, the heating rates suggest that the residual biochar sample exhibits quasi-inert thermal behavior.
Due to the reported endothermic nature of biomass pyrolysis, anticipation was held that temperatures in case A would consistently remain below those in Case B. Contrary to this expectation, during walnut shell drying, brief periods were observed where temperatures in case A surpassed those in case B. This phenomenon was consistently noted across all three power levels. It is crucial to emphasize that this behavior cannot be attributed to an exothermic reaction. There are no documented cases in the literature where the evaporation of moisture is regarded as an exothermic process.
The observed anomaly is likely attributable to the increased mass of water in vapor form, leading to enhanced contact with the sample, reactor walls, and the thermocouple in direct contact with the sample during the drying process. This increased contact subsequently augments convective heat transfer efficiency. Therefore, it is implausible to attribute this behavior to an exothermic reaction.
Based on the thermogravimetric analysis (TGA) results presented in Figure 2, it is inferred that the walnut shell mainly absorbs sensible heat within the range of 100–200 °C, and the pyrolysis reaction starts after 200 °C. Consequently, during the experiments conducted in the stainless-steel reactor, the walnut shell sample increases its temperature in the range of 100–200 °C without undergoing phase changes or pyrolysis reactions.
Once the temperature reaches 200 °C, the pyrolysis process is initiated. At this point, the thermal energy supplied to the reactor is divided, with a portion increasing the temperature of the biomass and another part breaking its chemical bonds. Consequently, the observed heating rates for the three thermal power levels used reflect the combined influence of sensible energy and reaction enthalpy. Despite the sensitivity of the instrumentation to detect small temperature changes, the methodology employed does not facilitate the determination of the presence of exothermic reactions.
When addressing the thermic nature of pyrolysis reactions, it is essential to avoid generalizations and qualify each case. This is because several cases with the presence of exothermic reactions during biomass pyrolysis have been reported in the literature. An example of those are the experiments conducted by Branca [39] that demonstrated clear evidence of exothermic peaks in the pyrolysis of potato waste. In this case, the phenomenon is described by Branca as “runaway pyrolysis” due to the remarkably high exothermic effect observed, with significantly elevated temperature increases surpassing the temperature of the reactor walls by at least 200 °C.
Another similar example is the study reported by Tabakaev [40], who compared the pyrolysis of straw and peat with a constant heating rate of 10 °C/min employing a fixed-bed reactor. Tabakaev used heating shutdowns that allowed clear exothermic effects to be observed during straw pyrolysis. However, in the case of peat, the exothermic energy released was significantly lower. Other examples found in the literature reporting exothermic events during biomass pyrolysis include Müsellim [41] for pea waste and Rath [42], who highlighted the coexistence of endothermic and exothermic processes during the pyrolysis of beech wood.
The aforementioned authors provide reasonable arguments that point to the oxygenated compounds of the biomass as responsible for the exothermic events in different feedstocks. However, the exact interactions that produce them are still unknown, as is why the magnitude varies between feedstocks. At the moment, there are only hypotheses that require more research.
For the specific case of pecan shells, contradictory information has been found. Fasina [43] suggested that the pyrolysis of this material is predominantly endothermic, while Loredo [44] maintains that the pyrolysis of walnut shell is slightly exothermic within the range of 236–360 °C. El Hamdouni’s [45] comparative experiment of combustion with pyrolysis of walnut shells revealed a significantly higher exothermic nature in combustion compared to almost negligible energy release during pyrolysis in differential scanning calorimetry (DSC).
The same effect was reported by Shen [38], who investigated the pyrolysis and combustion of various biomass types. Two of the raw materials studied by Shen exhibited exothermic behaviors: corn stalks and big bluestem. He reported the release of 0.00329 W and 0.00168 W during the pyrolysis of corn stalks and big bluestem, respectively. Additionally, during combustion, 0.0311 W and 0.107 W were released for corn stalks and the big bluestem. This implies that combustion releases between 9 and 63 times more energy than pyrolysis. With this information, it was assumed that the exothermic energy is negligible during walnut shell pyrolysis; however, a thorough investigation of the thermal behavior of this material with different heating rates is necessary.
The examples presented above serve as a glimpse into the still unclear nature of the endothermic and exothermic phenomena of biomass pyrolysis. Thus far, only broad patterns of exothermicity have been discerned based on feedstock; however, a more in-depth investigation into the chemical constituents responsible for the exothermic peaks is imperative. Furthermore, what remains evident is that biomass pyrolysis requires an external source of thermal energy, regardless of the occurrence of brief exothermic events.
In Figure 4a, it is evident that the temperature in case A remains above that of case B for approximately 40 min. This observation suggests that during the volatilization of cellulose, hemicellulose, and lignin components, the additional mass in the gaseous state absorbs energy from the hottest spots on the walls and redistributes it throughout the reactor through convection. This explanation is a hypothesis that requires further testing and verification, which could involve manipulating the heat supply at specific times. However, such investigations are beyond the scope of the current experimental campaign.
The conducted experiments did not ascertain exothermic effects. However, an unrelated phenomenon was observed, possibly linked to increased convective heat transfer efficiency during volatilization.
The dashed lines in Figure 4 delineate the time window of the reactor’s heating process. In simpler terms, the heating initiates at minute zero and concludes after the second dashed line for all cases. During the subsequent cooling phase, noteworthy observations were made, wherein the temperature curves and heating rates exhibited remarkable similarity. This observation underscores quasi-inert thermal behavior. Surprisingly, this result deviates from the initial hypothesis, which anticipated a more pronounced manifestation of the endothermic effect associated with pyrolysis reactions. Intriguingly, this absence persisted even when the energy supply was severed, and the reactor’s temperature remained sufficiently high for the continuation of pyrolysis reactions.

3.3. Analysis of Gas Outlet Temperatures and Tar Condensation

During the process of biomass pyrolysis, the formation of corrosive tars is a critical concern, emphasizing the necessity to remove as much of these tars as possible before gasification. Prior studies have made considerable efforts to elucidate the pathways of tar formation, analyzing precursors, primary, and secondary products derived from cellulose [46]. Despite these efforts, the exact moment of tar formation remains unknown. In this study, aimed at detecting the occurrence of tar and condensation, two temperature sensors were strategically installed: T6 and T7. The T6 thermocouple measures the temperature at the reactor gas outlet, situated in a thermally insulated area. Thermocouple T7 was placed in a tar trap designed to measure vapor condensation (refer to Figure 1). The tar trap, an uninsulated metal tube, is cooled with ambient air. Figure 5 presents the results for sensors T6 and T7 for Cases A and B. On the left side of Figure 5, the temperature versus time results for the three power levels (234 W, 482 W, and 725 W) are depicted, and on the right side, their respective temperature derivatives are shown, representing the analysis of the heating rates.
The dashed lines in Figure 5 delineate the initiation and termination of the heating process using the solar simulator. In the pyrolysis results of the walnut shell (case A), several peaks were discerned, with one occurring at 45 min (Figure 5a), another at 30 min (Figure 5c), and a third at 20 min (Figure 5e). These peaks align approximately with the valleys observed in Figure 4. It is interpreted that these peaks signify the zenith of tar production. Following this peak, a consistent cooling trend is observed, irrespective of whether the solar simulator continues to supply thermal energy to the reactor. This suggests a decline in the efflux of hot gas mass produced within the reactor, indicative of the depletion of reactants responsible for tar formation.
Figure 5 also illustrates the outcomes of the gas outlet thermocouple for the biochar heating case (T6-CB), serving as a benchmark for the heating of a dry and/or inert material. T6-CB gauges the temperature of the carrier gas (argon) entering the reactor. Initially, the argon gas flow is at room temperature; however, after being in contact with the biochar and the reactor walls, this gas is heated and exits the reactor. The role of the T6 thermocouple was to register abrupt temperature changes during various phases of biomass pyrolysis. As depicted in Figure 5, this objective was successfully accomplished, with notable fluctuations observed during the pyrolysis of walnut shell (case A). Conversely, during the biochar heating (case B), a smooth and consistent heating pattern was observed for the three heating powers used. Similarly, it was noted that the heating rates did not exceed 0.6 °C/min, representing a marked contrast with case A.
Another experimental observation was the convergence of temperatures recorded by thermocouple T6 when comparing the results of case A with case B. However, these convergences were noted after the cooling phase had initiated. This suggests a progressive equalization of the thermal properties of the measured gases.
Figure 5 also presents the experimental results of readings from thermocouple T7, representing measurements inside the first condenser or tar trap. Its purpose was to gauge the condensation of vapors formed during pyrolysis.
Curves T6-CA and T7-CA exhibit a similar pattern in terms of tar condensation, showing a continuous decline after the cessation of tar production, irrespective of whether the reactor continues to receive thermal energy from the solar simulator. Once again, another convergence is observed, this time between curves T7-CA and T7-CB, further supporting the nearly inert thermal behavior.
The right-hand side of Figure 5 illustrates the heating rate analysis of curves T6 and T7 for walnut shell pyrolysis (CA) and biochar heating (CB) cases. Two distinct peaks are identified in these figures: the first peak is labeled as CM (coincidence with moisture drying), and the second peak is labeled as CV (coincidence with valleys).
The CM peaks closely align with the onset of moisture evaporation from the biomass, coinciding with the peaks observed in Segment 1 (S1) of Figure 4. In contrast, the CV peaks in Figure 5 align with the valleys observed in Figure 4. The assertion that these valleys in Figure 4 represent the final production of tars is substantiated by both a literature review and experimental evidence supporting this argument.
As previously mentioned, one of the objectives of this research was to determine the point at which tar production ceases. In addition to this, the lack of concrete answers reported in the literature regarding tar formation mechanisms motivated the execution of biochar heating experiments (CB). Initially, it was thought that during the heating of biochar with low thermal power, tar volatilization would be observed; however, this did not occur. Likewise, for cases of medium and high power, readings from temperature sensors T5, T6, and T7 showed no evidence of tar formation. Furthermore, after each of the experiments in case B, the pipes, condensers, and cotton filters were inspected, revealing no signs of dirt or tar evidence. This latter exercise served to corroborate that the temperature sensor readings were adequate. Therefore, one of the conclusions drawn from these experiments is that when biochar is heated under the same conditions as when it was produced, tar formation does not occur.

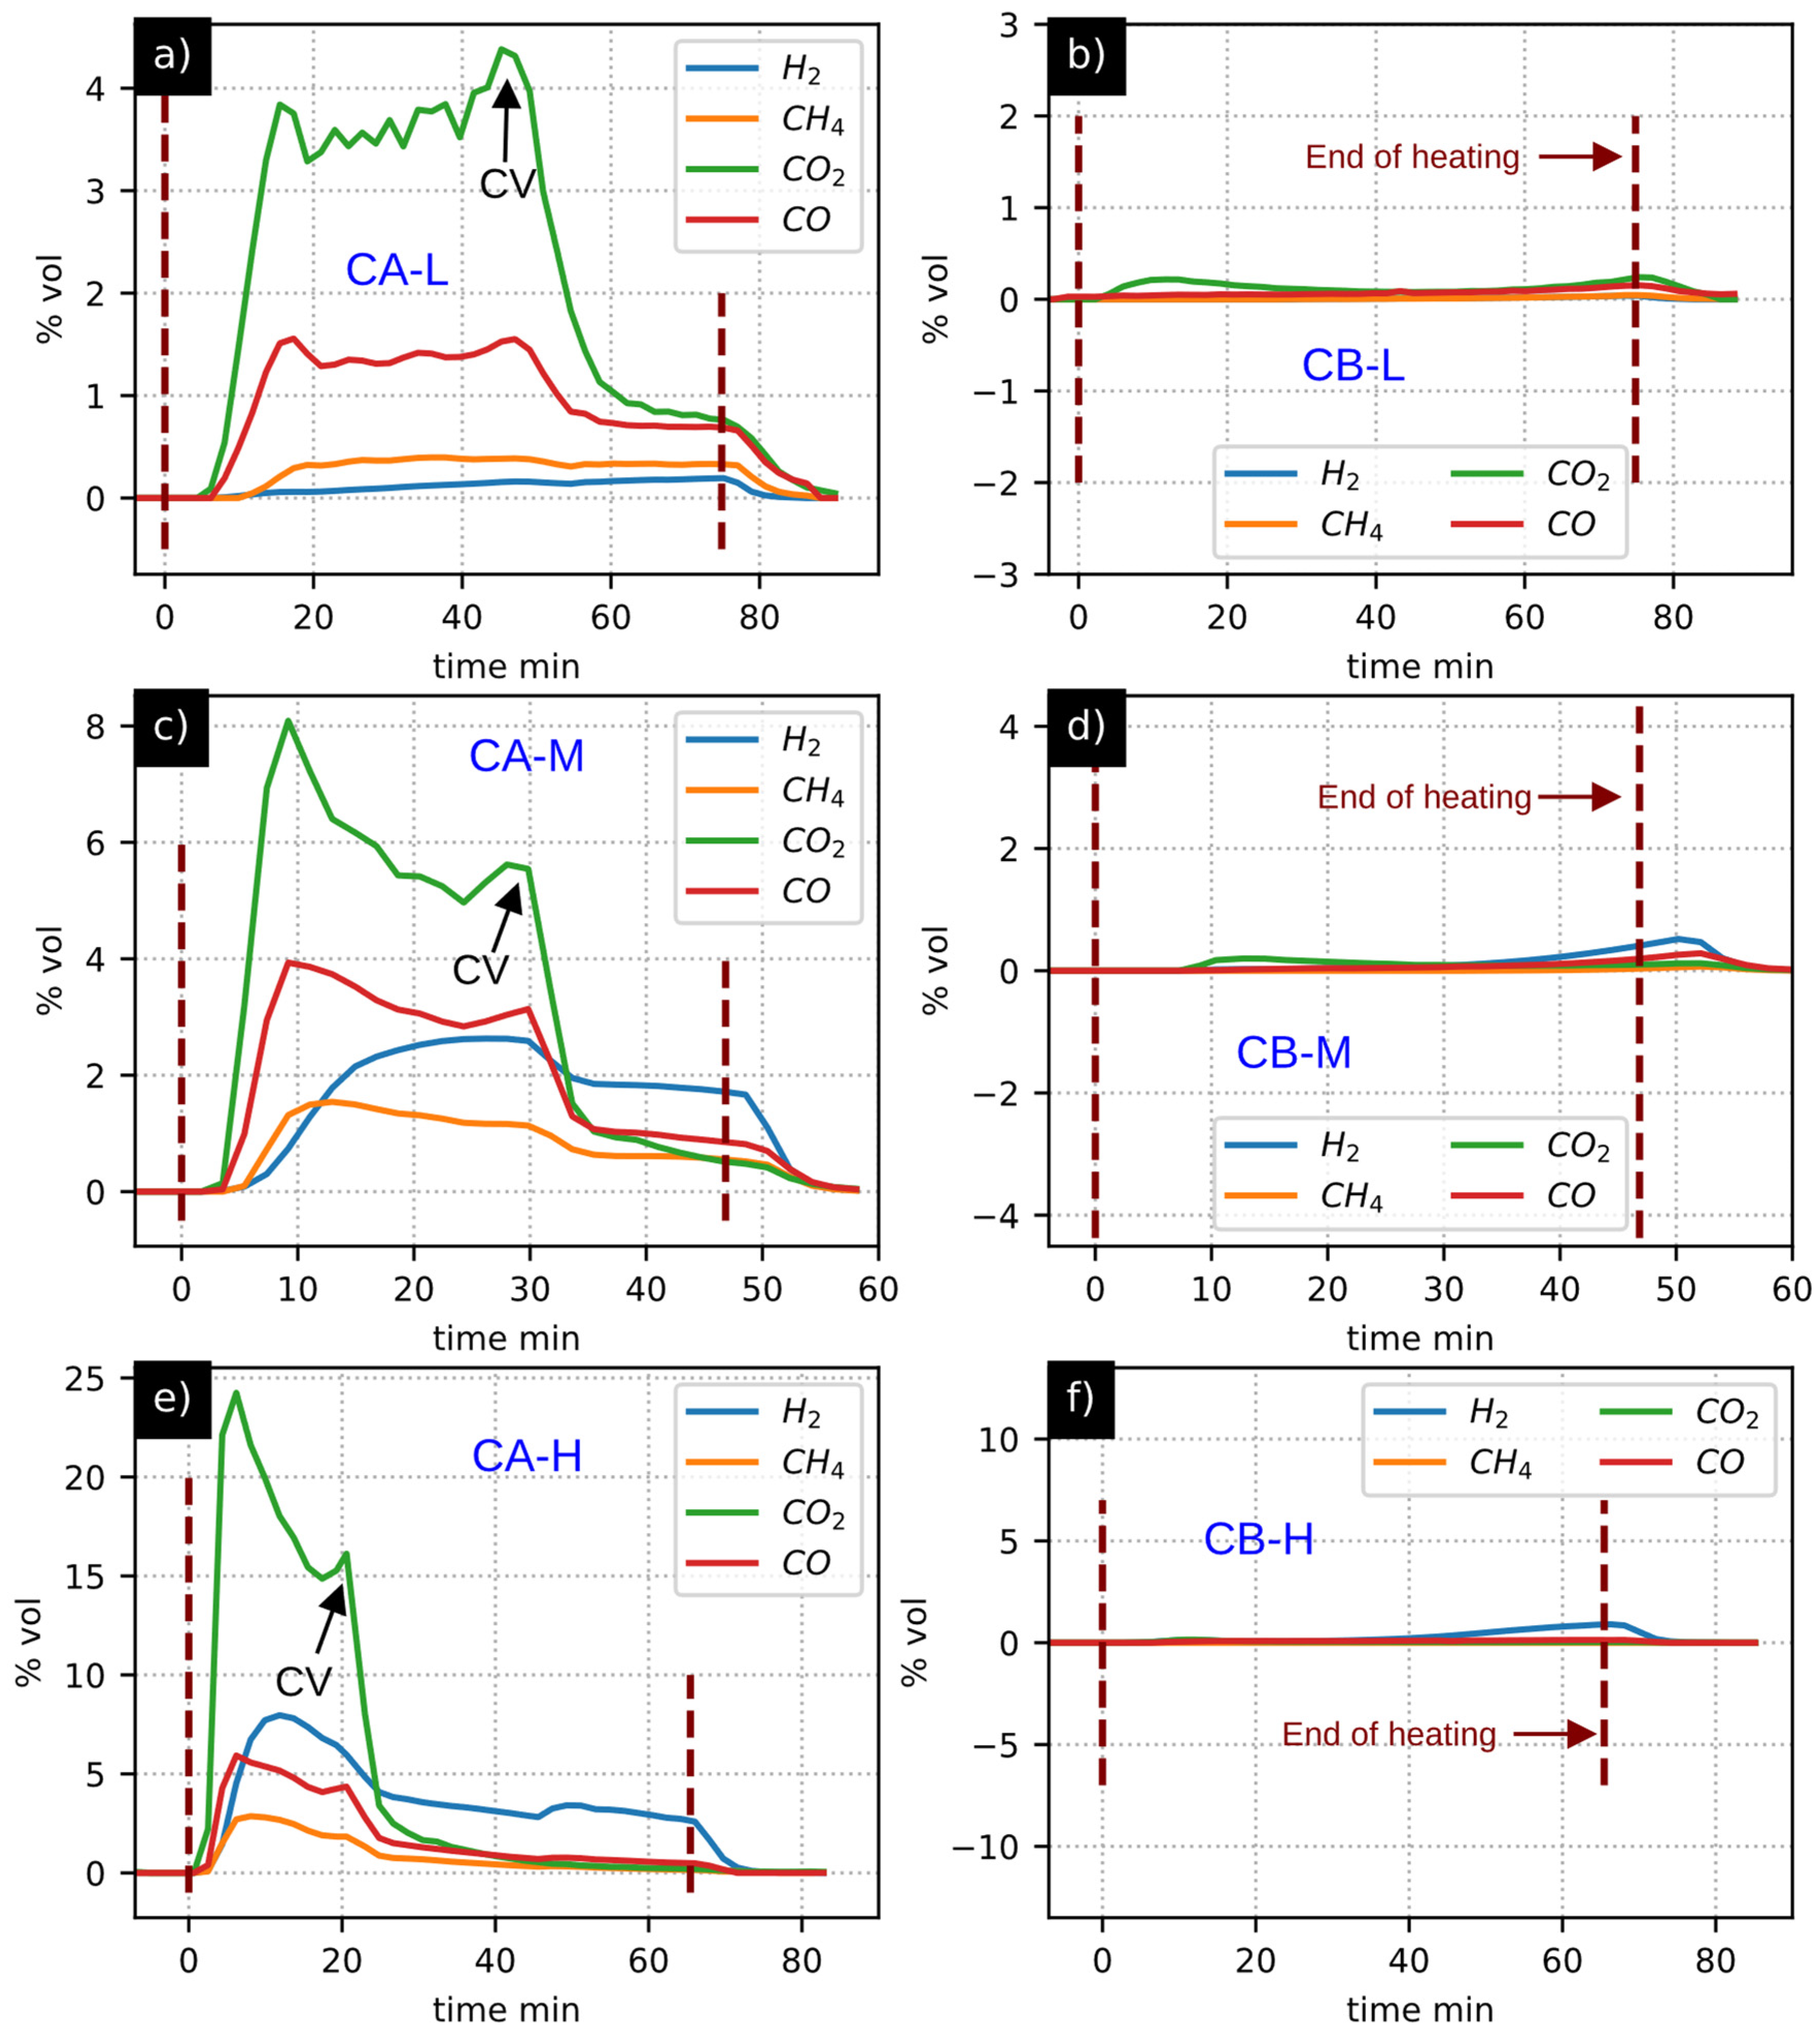
3.4. Gas Composition Analysis

Analysis of the gases produced during the pyrolysis of the walnut shell (CA) and the heating of the biochar was carried out. Figure 6 presents the data obtained using the gas chromatograph (GC), measuring the most representative gases generated during the pyrolysis of biomass: H2, CH4, CO2, and CO. On the left side are shown the pyrolysis data of the walnut shell (case A). On the right side, the data for heating with biochar (case B) is shown. As can be seen from this last graph, almost no gases are produced in this temperature range, justifying that biocarbon behaves as a quasi-inert material.
During the pyrolysis of the walnut shell (CA), a distinct initial CO2 peak is evident and is illustrated in Figure 6a,c,e. This peak’s emergence is ascribed to the front part of the reactor being the hottest surface, receiving concentrated radiation. A portion of the sample comes into contact with this front surface, making it likely that a small amount of biomass undergoes pyrolysis before the rest of the sample. This outcome aligns with expectations due to the cylindrical geometry of the reactor, which distributes heat from the front to the back. The significance of this observation is underscored by the fact that the first CO2 peak coincides with the evaporation of humidity. Specifically, it appears when thermocouple T5 indicates a temperature of approximately 100 °C (refer to Figure 4). Meanwhile, the temperature of thermocouple T1 (on the front wall) is recorded at 500 °C, 700 °C, and 880 °C for cases L, M, and H, respectively. Notably, the first CO2 peak aligns precisely with the drying phase of the walnut shell.
The second CO2 peak, as illustrated in Figure 6a,c,e, unmistakably aligns with the valleys depicted in Figure 4. Consequently, these peaks have been designated with the label “CV” signifying “Coincidence with Valley”. The CV peaks serve as indicators of non-condensable gas production, establishing a reasonable association between tar production and CO2 generation.
Following the CV peaks, a notable decline in CO2 production is observed, gradually tapering off. A comparable pattern is evident for other gases, with H2, CO, and CH4 production stabilizing post the CV peaks—particularly in medium- and high-power experiments. The stabilization of syngas production aligns with the convergence regions highlighted in Figure 4. This implies that biomass pyrolysis and syngas generation persist seamlessly until the solar simulator is deactivated.
In the case of heating biochar (CB), a noteworthy observation is the considerably lower production of syngas, approximately within an order of magnitude, ranging from 10 to 20 times lower for all three heating powers, as seen in Figure 6.
Similarly, a subtle uptick in syngas production becomes evident only when the biochar temperature approaches the maximum recorded in case A. These findings reinforce the notion of quasi-inert thermal behavior. It is noteworthy that experiments involving walnut shell pyrolysis (CA) exhibit a thermal response akin to that observed during biochar heating. However, the chemical behavior markedly differs. In the former case, chemical reactions are evidently pronounced, whereas in the latter case, they are negligible, despite both demonstrating analogous thermal behavior under identical experimental conditions.

3.5. Mass Balance

Following the conclusion of the experiments, we determined the mass of the recovered tar and biochar through precise measurements using an analytical balance. The mass of the generated gases was computed by integrating the area under the curve derived from the gas chromatography (GC) data. Table 3 provides a comprehensive breakdown of the mass percentages (%) for each product by weight.
Figure 7 presents the TGA curve of the walnut shell sample again, but this time displaying the percentage results obtained in the experiments at each of the power settings. The maximum reaction temperature of thermocouple T5 was used to plot the biochar yields against temperature.
Observing the data in Figure 7, it becomes evident that the percentage of biochar obtained at each power setting, plotted against the maximum temperature, closely mirrors the percentages illustrated in the Thermogravimetric Analysis (TGA) curve. This alignment provides additional support for the concept of quasi-inert thermal behavior. It is crucial to emphasize the intentional efforts made to ensure optimal contact between the biomass and thermocouple T5. The consistent readings presented in the figure underscore the reliability of the data obtained from this sensor.
Table 4 presents the results of the elemental analysis of the biochar produced at each power setting. The first row presents the results of the fresh walnut shell’s elemental analysis (CHONS). The elemental analysis results of the biochar indicate that the percentage of carbon increases with the power setting. Additionally, it is observed that the percentage of oxygen decreases as a function of power.
The results presented in Table 4 delineate the extent of biomass carbonization. In all three cases, residual percentages of oxygen and hydrogen were evident, holding the potential for synthesis gas (H2 and CO) production. However, the gas chromatography (GC) results indicated the absence of such gas production. One potential implication of this finding is that, for forthcoming experiments involving biomass and biochar blends, biochar could be regarded as a non-reactive carrier of thermal energy, on the condition that its maximum production temperature is not exceeded. This consideration would streamline calculations associated with material balance, as observed, since this material does not release tars or non-condensable gases, positioning biochar as a material solely engaged in heat transfer. However, it remains imperative to expand the scope of the study and investigate how the chemical structure of biochar evolves during each reheating cycle.
A limitation of this methodology was the impossibility of performing an elemental analysis of the chemical composition of the biochar after initial heating (AC). Elemental analysis was only performed after the second heating (CB). The main reason for this was that every time the reactor was manipulated to open or close it, the biomass particles lost their original position. Consequently, the decision was made not to alter the position of the studied sample and to perform the second heating without moving the biochar inside the reactor. Naturally, this resulted in the loss of potentially valuable information. In other words, there is a need for chemical validation of quasi-inert behavior. However, it is possible to propose future experimental designs specifically aimed at chemical corroboration of this concept.
Fortunately, this limitation does not invalidate the concept defined as the quasi-inert thermal behavior of the biochar because the readings from thermocouples T5, T6, and T7, combined with the analysis of heating rates and the gas chromatograph results, provide reasonably sufficient information to support this notion.

4. Conclusions

This study centered on the examination of the pyrolysis process of walnut shells within a reactor utilizing concentrated radiant energy. The emphasis was placed on comprehending the thermal characteristics of the raw material and its resulting products. Furthermore, a comprehensive overview of the experimental setup and the methods employed was provided. The research comprised two essential phases: initially, the pyrolysis of walnut shells (referred to as experiments A), and subsequently, the application of cycles of heating and cooling to the biochar derived from the pyrolytic process (designated as experiments B). In addition, experiments were carried out with volcanic stone, a chemically inert material, to compare it with the thermal behavior of biochar.
This study’s innovation lies in its groundbreaking comparison of heating curves between reactive material (walnut shell) and inert material (biochar). This comparison offers a deeper insight into the pyrolysis process, particularly in identifying the critical moment when tar formation ceases.
A central outcome of this research relates to the examination of biochar heating, based on two key considerations:
(a)
Initially, a comparative investigation between the heating profiles of biochar and volcanic stone revealed a notable similarity in their thermal behaviors during the heating process.
(b)
Subsequently, through a comparative analysis of the thermal behaviors between biochar and biomass, different stages of walnut shell pyrolysis were discerned. As a corollary, the most notable findings included the unambiguous identification of moisture evaporation and the termination point of tar production.
Analysis of heating rates has become a valuable tool in this study for three main reasons:
(a)
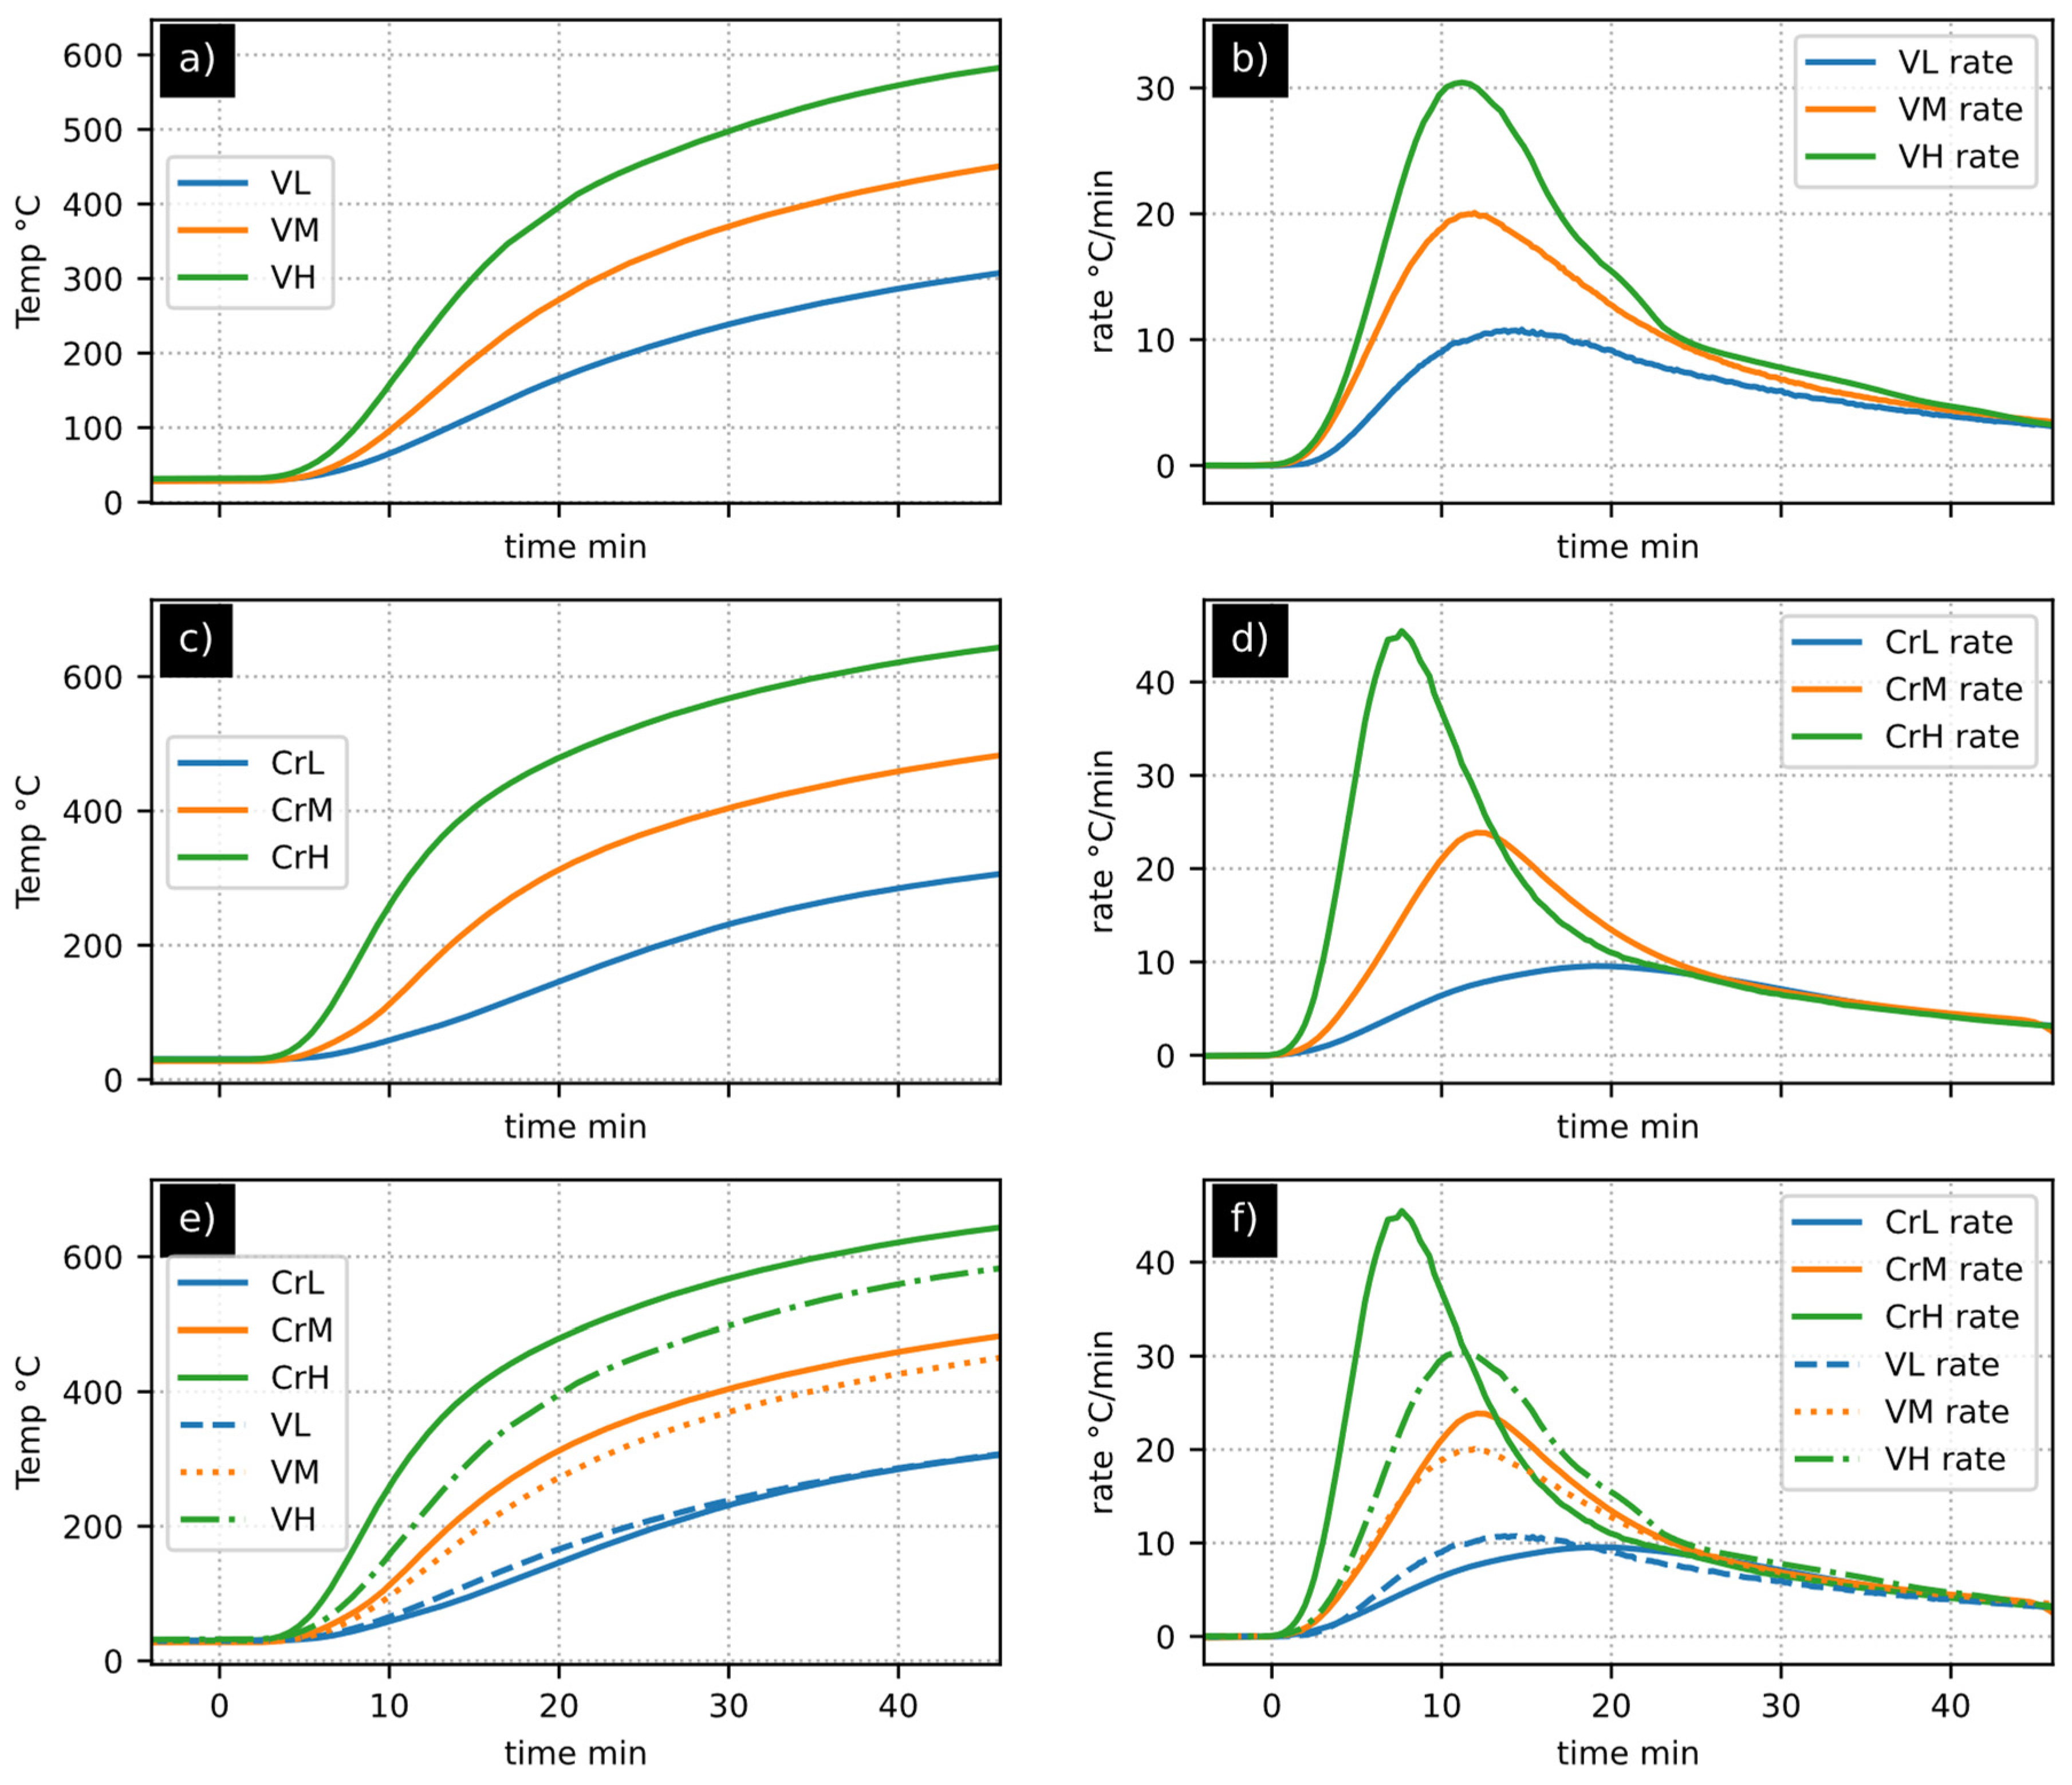
In the specific context of solar reactors, generating consistent heating ramps proves highly intricate and impractical, particularly when dealing with materials undergoing phase changes or chemical reactions. Consequently, this variable goes from a controlled parameter to a subject of investigation. Accordingly, the analysis of heating rates simplifies the interpretation of observed phenomena.
(b)
While the observation and analysis of temperature curves provide insights into the process, heating rates amplify fluctuations in direct measurements. This amplification facilitates the identification of the quasi-inert thermal behavior of biochar.
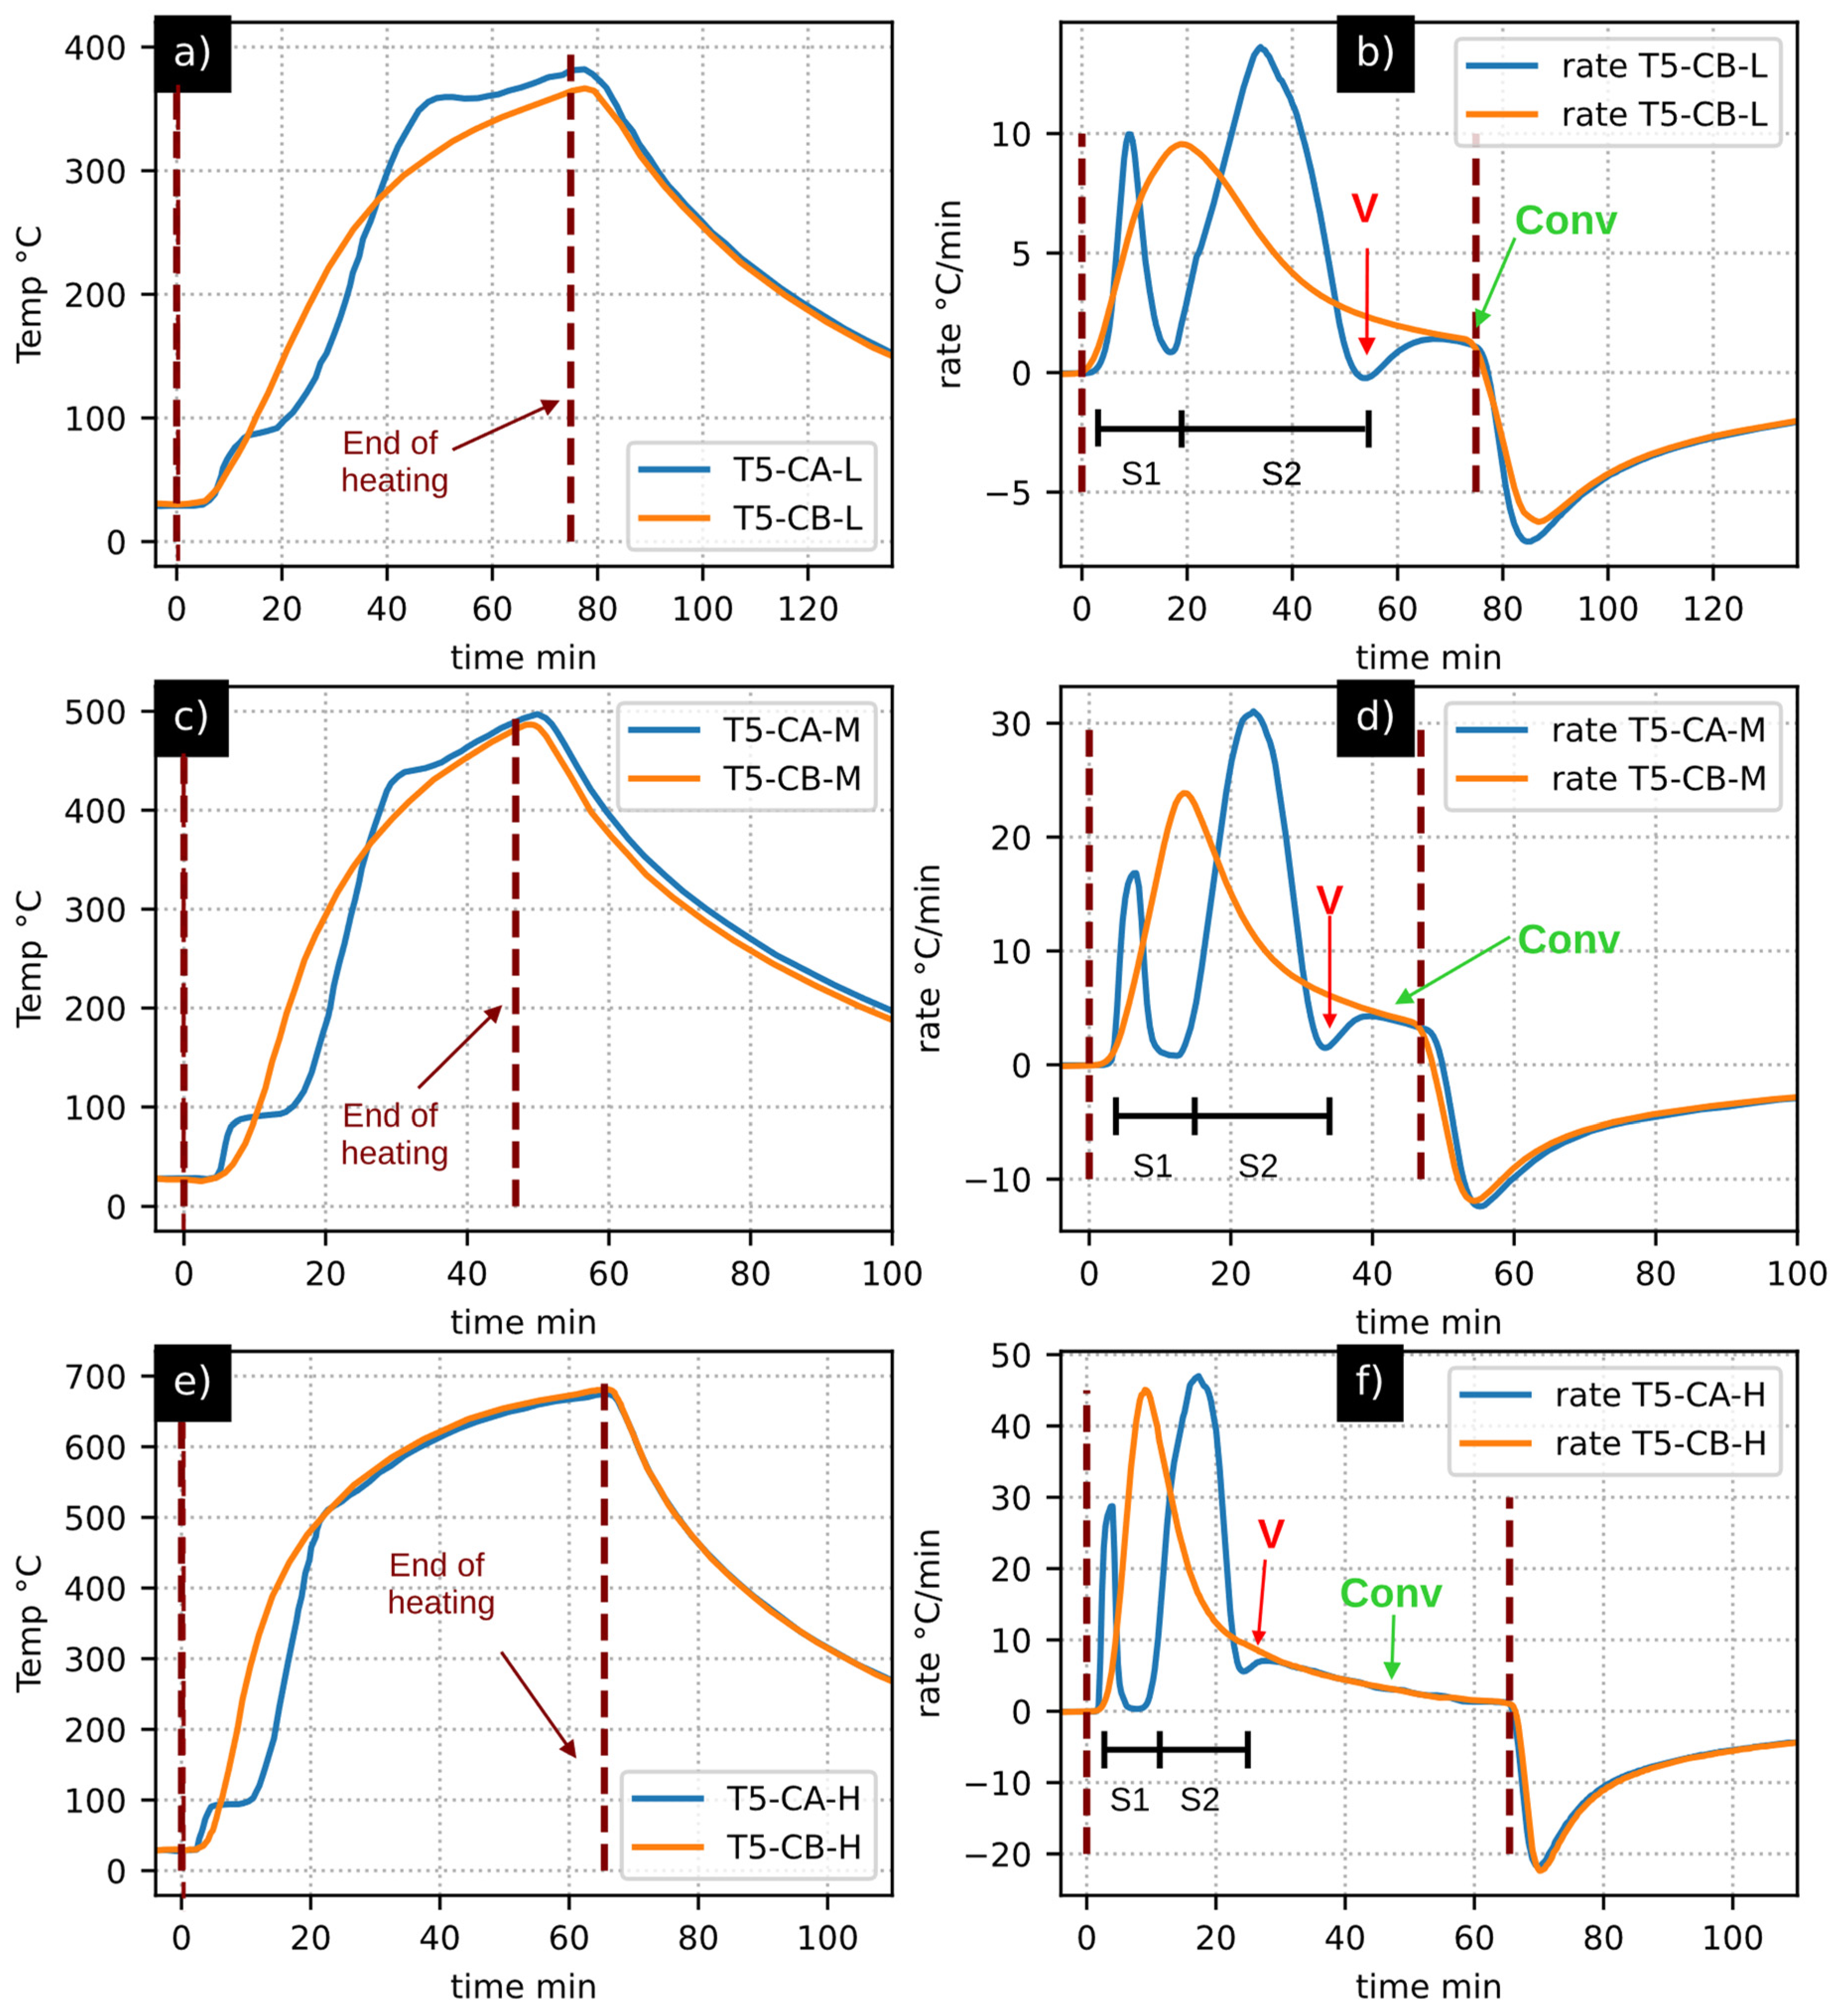
(c)
The installed thermocouples exhibited variations, resulting in temperature curves of different natures. However, during pronounced fluctuations in the experiments, the analysis of heating rates revealed coincidences of nearly simultaneous shapes. Therefore, this tool not only served for result analysis but was also crucial for real-time monitoring throughout the experimental process.

Author Contributions

Conceptualization: C.A.E. and C.P.-R.; Methodology: C.A.E., A.A.-M. and C.P.-R.; Software: A.A.-M.; Formal Analysis: A.A.-M., C.A.E. and F.M.-P.; Investigation: A.A.-M., C.A.E., A.M.P.-E. and F.M.-P.; Resources: C.A.E. and C.P.-R.; Data Curation: A.A.-M.; Writing—original draft preparation: A.A.-M. and C.A.E.; Writing-review and editing: A.A.-M., C.A.E. and N.A.C.-C.; Visualization: A.A.-M.; Supervision: C.P.-R. and C.A.E.; Project administration: C.P.-R. and C.A.E.; Funding acquisition: C.A.E. All authors have read and agreed to the published version of the manuscript.

Funding

This research was funded by DGAPA-UNAM grant number PAPIIT AG101422. The authors thank CONACYT for the scholarship awarded to A.A.-M.

Data Availability Statement

The raw data supporting the conclusions of this article will be made available by the authors on request.

Acknowledgments

The authors thank Patricia Eugenia Altuzar Coello for the TGA analysis.

Conflicts of Interest

The authors declare no conflict of interest.

Nomenclature

CACase A: walnut shell pyrolysis
CBCase B: biochar heating
CMCoincidence moisture drying
ConvConvergence between CA and CB
CSPConcentrated Solar Power
CVCoincidence with valley
GCGas chromatography
S1Segment 1
S2Segment 2
TgGlass transition temperature of lignin
TGAThermogravimetric analysis
VValley: tar formation

References

  1. Castillo, I.O.; Sangerman-Jarquín, D.M.; Vázquez, M.G.C.; Arellano, J.D.J.E.; Moreno, J.H.N. La producción y comercialización de nuez pecanera en México. Rev. Mex. Cienc. Agríc. 2019, 10, 1797–1808. [Google Scholar]
  2. Arancibia-Bulnes, C.; Peón-Anaya, R.; Riveros-Rosas, D.; Quiñones, J.; Cabanillas, R.; Estrada, C. Beam Solar Irradiation Assessment for Sonora, Mexico. Energy Procedia 2014, 49, 2290–2296. [Google Scholar] [CrossRef]
  3. Zeng, K.; Gauthier, D.; Soria, J.; Mazza, G.; Flamant, G. Solar pyrolysis of carbonaceous feedstocks: A review. Sol. Energy 2017, 156, 73–92. [Google Scholar] [CrossRef]
  4. Encinas-Vázquez, A.; Quezada-Renteria, J.A.; Cervantes, F.J.; Pérez-Rábago, A.C.; Molina-Freaner, F.E.; Pat-Espadas, A.M.; Estrada, C.A. Unraveling the mechanisms of lead adsorption and ageing process on high-temperature biochar. J. Chem. Technol. Biotechnol. 2021, 96, 775–784. [Google Scholar] [CrossRef]
  5. Poli, F.L.M.; Islas-Samperio, J.M.; Bustamante, C.A.G.; Rivero, J.C.S.; Grande-Acosta, G.K.; Gallardo-Álvarez, R.M.; Lagunes, R.M.; Pineda, F.N.; Escobedo, C.A. Sustainability Assessment of Solid Biofuels from Agro-Industrial Residues Case of Sugarcane Bagasse in a Mexican Sugar Mill. Sustainability 2022, 14, 1711. [Google Scholar] [CrossRef]
  6. Mazurek, K.; Drużyński, S.; Kiełkowska, U.; Wróbel-Kaszanek, A.; Igliński, B.; Cichosz, M. The Application of Pyrolysis Biochar Obtained from Waste Rapeseed Cake to Remove Copper from Industrial Wastewater: An Overview. Energies 2024, 17, 498. [Google Scholar] [CrossRef]
  7. Cross, A.; Sohi, S.P. A method for screening the relative long-term stability of biochar. GCB Bioenergy 2013, 5, 215–220. [Google Scholar] [CrossRef]
  8. Zhao, Y.; Li, X.; Li, Y.; Bao, H.; Xing, J.; Zhu, Y.; Nan, J.; Xu, G. Biochar Acts as an Emerging Soil Amendment and Its Potential Ecological Risks: A Review. Energies 2022, 16, 410. [Google Scholar] [CrossRef]
  9. Nayak, N.; Mehrotra, R.; Mehrotra, S. Carbon biosequestration strategies: A review. Carbon Capture Sci. Technol. 2022, 4, 100065. [Google Scholar] [CrossRef]
  10. Yang, C.; Wu, H.; Cai, M.; Zhou, Y.; Guo, C.; Han, Y.; Zhang, L. Valorization of Biomass-Derived Polymers to Functional Biochar Materials for Supercapacitor Applications via Pyrolysis: Advances and Perspectives. Polymers 2023, 15, 2741. [Google Scholar] [CrossRef]
  11. Vuppaladadiyam, A.K.; Vuppaladadiyam, S.S.V.; Sikarwar, V.S.; Ahmad, E.; Pant, K.K.; Murugavelh, S.; Leu, S. A critical review on biomass pyrolysis: Reaction mechanisms, process modeling and potential challenges. J. Energy Inst. 2023, 108, 101236. [Google Scholar] [CrossRef]
  12. Reed, T.B.; Das, A. Handbook of Biomass Downdraft Gasifier Engine Systems; Solar Energy Research Institute: Golden, CO, USA, 1988. [Google Scholar]
  13. Patra, T.K.; Sheth, P.N. Biomass gasification models for downdraft gasifier: A state-of-the-art review. Renew. Sustain. Energy Rev. 2015, 50, 583–593. [Google Scholar] [CrossRef]
  14. Rios, M.L.V.; González, A.M.; Lora, E.E.S.; del Olmo, O.A.A. Reduction of tar generated during biomass gasification: A review. Biomass Bioenergy 2018, 108, 345–370. [Google Scholar] [CrossRef]
  15. Maciejewska, M.; Rogulska, M. Thermal Behavior of Polymeric and Other Advanced Materials. Materials 2023, 16, 2875. [Google Scholar] [CrossRef] [PubMed]
  16. Cisneros-Cárdenas, N.; Pérez-Enciso, R.; Pérez-Rábago, C.; Calleja-Valdez, R.; Maytorena-Soria, V.; García-Gutiérrez, R.; Cabanillas-Lopez, R. Thermal experimental study of a volumetric receiver-reactor using a Mini-Solar furnace. Appl. Therm. Eng. 2023, 234, 121276. [Google Scholar] [CrossRef]
  17. Arreola, C. Reactor Solar de Receptor Volumétrico Poroso para la Producción de Combustibles Solares. Ph.D. Thesis, UNAM, Temixco, Mexico, 2023. [Google Scholar]
  18. Rolt, S.; Clark, P.; Schmoll, J.; Shaw, B.J. Xenon arc lamp spectral radiance modelling for satellite instrument calibration. In Proceedings of the Space Telescopes and Instrumentation 2016: Optical, Infrared, and Millimeter Wave, Edinburgh, UK, 26 June–1 July 2016. [Google Scholar]
  19. Sznajder, M.; Renger, T.; Witzke, A.; Geppert, U.; Thornagel, R. Design and performance of a vacuum-UV simulator for material testing under space conditions. Adv. Space Res. 2013, 52, 1993–2005. [Google Scholar] [CrossRef]
  20. Dibowski, G.; Esser, K. Hazards Caused by UV Rays of Xenon Light Based High Performance Solar Simulators. Saf. Health Work. 2017, 8, 237–245. [Google Scholar] [CrossRef]
  21. Gooty, A.T.; Li, D.; Berruti, F.; Briens, C. Kraft-lignin pyrolysis and fractional condensation of its bio-oil vapors. J. Anal. Appl. Pyrolysis 2014, 106, 33–40. [Google Scholar] [CrossRef]
  22. Miyashiro, A. Nature of alkalic volcanic rock series. Contrib. Mineral. Petrol. 1978, 66, 91–104. [Google Scholar] [CrossRef]
  23. Kushiro, I.; Kuno, H. Origin of Primary Basalt Magmas and Classification of Basaltic Rocks. J. Pet. 1963, 4, 75–89. [Google Scholar] [CrossRef]
  24. Barros, M.D.R.M. El tezontle, la piedra de México. MoleQla Rev. Cienc. Univ. Pablo Olavide 2019, 33, 3. [Google Scholar]
  25. Nahhas, T.; Py, X.; Sadiki, N. Experimental investigation of basalt rocks as storage material for high-temperature concentrated solar power plants. Renew. Sustain. Energy Rev. 2019, 110, 226–235. [Google Scholar] [CrossRef]
  26. Popescu, F.; Mahu, R.; Ion, I.V.; Rusu, E. A Mathematical Model of Biomass Combustion Physical and Chemical Processes. Energies 2020, 13, 6232. [Google Scholar] [CrossRef]
  27. Boumaaza, M.; Belaadi, A.; Bourchak, M.; Juhany, K.A.; Jawaid, M.; Marvila, M.T.; de Azevedo, A.R. Optimization of flexural properties and thermal conductivity of Washingtonia plant biomass waste biochar reinforced bio-mortar. J. Mater. Res. Technol. 2023, 23, 3515–3536. [Google Scholar] [CrossRef]
  28. Raj, R.A.; Anand, M.D.; Ramabalan, S. Mathematical Modelling and Volume Prediction of Metal Melted by Electron Beam Welding in Copper and Stainless Steel 304 Dissimilar Metal Joints. Int. J. Recent Technol. Eng. 2019, 8, 0782S319. [Google Scholar]
  29. Grønli, M.; Antal, M.J.; Várhegyi, G. A Round-Robin Study of Cellulose Pyrolysis Kinetics by Thermogravimetry. Ind. Eng. Chem. Res. 1999, 38, 2238–2244. [Google Scholar] [CrossRef]
  30. Ding, Y.; Wang, C.; Chaos, M.; Chen, R.; Lu, S. Estimation of beech pyrolysis kinetic parameters by Shuffled Complex Evolution. Bioresour. Technol. 2016, 200, 658–665. [Google Scholar] [CrossRef]
  31. Madyaratri, E.W.; Iswanto, A.H.; Nawawi, D.S.; Lee, S.H.; Fatriasari, W. Improvement of Thermal Behavior of Rattan by Lignosulphonate Impregnation Treatment. Forests 2022, 13, 1773. [Google Scholar] [CrossRef]
  32. Shang, Z.; Li, H. Unraveling pyrolysis mechanisms of lignin dimer model compounds: Neural network-based molecular dynamics simulation investigations. Fuel 2024, 357, 129909. [Google Scholar] [CrossRef]
  33. Kawamoto, H. Lignin pyrolysis reactions. J. Wood Sci. 2017, 63, 117–132. [Google Scholar] [CrossRef]
  34. Leng, E.; Guo, Y.; Chen, J.; Liu, S.; Jiaqiang, E.; Xue, Y. A comprehensive review on lignin pyrolysis: Mechanism, modeling and the effects of inherent metals in biomass. Fuel 2022, 309, 122102. [Google Scholar] [CrossRef]
  35. Van de Velden, M.; Baeyens, J.; Brems, A.; Janssens, B.; Dewil, R. Fundamentals, kinetics and endothermicity of the biomass pyrolysis reaction. Renew. Energy 2010, 35, 232–242. [Google Scholar] [CrossRef]
  36. Hu, X.; Gholizadeh, M. Biomass pyrolysis: A review of the process development and challenges from initial researches up to the commercialisation stage. J. Energy Chem. 2019, 39, 109–143. [Google Scholar] [CrossRef]
  37. Huang, Y.; Li, B.; Liu, D.; Xie, X.; Zhang, H.; Sun, H.; Hu, X.; Zhang, S. Fundamental Advances in Biomass Autothermal/Oxidative Pyrolysis: A Review. ACS Sustain. Chem. Eng. 2020, 8, 11888–11905. [Google Scholar] [CrossRef]
  38. Shen, J.; Igathinathane, C.; Yu, M.; Pothula, A.K. Biomass pyrolysis and combustion integral and differential reaction heats with temperatures using thermogravimetric analysis/differential scanning calorimetry. Bioresour. Technol. 2015, 185, 89–98. [Google Scholar] [CrossRef] [PubMed]
  39. Branca, C.; Galgano, A.; Di Blasi, C. Multi-scale analysis of the exothermic behavior of agricultural biomass pyrolysis. J. Anal. Appl. Pyrolysis 2023, 173, 106040. [Google Scholar] [CrossRef]
  40. Tabakaev, R.; Astafev, A.; Shanenkova, Y.; Dubinin, Y.; Yazykov, N.; Yakovlev, V. Thermal effects investigation during biomass slow pyrolysis in a fixed bed reactor. Biomass Bioenergy 2019, 126, 26–33. [Google Scholar] [CrossRef]
  41. Müsellim, E.; Tahir, M.H.; Ahmad, M.S.; Ceylan, S. Thermokinetic and TG/DSC-FTIR study of pea waste biomass pyrolysis. Appl. Therm. Eng. 2018, 137, 54–61. [Google Scholar] [CrossRef]
  42. Rath, J.; Wolfinger, M.; Steiner, G.; Krammer, G.; Barontini, F.; Cozzani, V. Heat of wood pyrolysis. Fuel 2003, 82, 81–91. [Google Scholar] [CrossRef]
  43. Fasina, O.; Littlefield, B. TG-FTIR analysis of pecan shells thermal decomposition. Fuel Process. Technol. 2012, 102, 61–66. [Google Scholar] [CrossRef]
  44. Medrano, J.A.L.; Martínez, D.B.; De la Rosa, J.R.; Pedraza, E.S.C.; Flores-Escamilla, G.A.; Ciuta, S. Particle pyrolysis modeling and thermal characterization of pecan nutshell. J. Therm. Anal. 2016, 126, 969–979. [Google Scholar] [CrossRef]
  45. El Hamdouni, Y.; El Hajjaji, S.; Szabo, T.; Trif, L.; Felhősi, I.; Abbi, K.; Shaban, A. Biomass valorization of walnut shell into biochar as a resource for electrochemical simultaneous detection of heavy metal ions in water and soil samples: Preparation, characterization, and applications. Arab. J. Chem. 2022, 15, 104252. [Google Scholar] [CrossRef]
  46. Jia, X.; Che, Y.; Li, J.; Yan, B.; Cheng, Z.; Chen, G.; Zhao, J. From cellulose to tar: Analysis of tar formation pathway with distinguishing the primary and secondary reactions. Bioresour. Technol. 2023, 390, 129846. [Google Scholar] [CrossRef] [PubMed]
Figure 1. Scheme of the experimental setup for biomass pyrolysis in a stainless-steel reactor with a solar simulator.
Energies 17 01435 g001
Figure 2. TGA of walnut shell. Heating rate: 10 °C/min.
Energies 17 01435 g002
Figure 3. Temperature profiles during the heating of inert material (volcanic stone) and biochar: (a,c). Heating rate profiles during the heating of inert material (volcanic stone) and biochar: (b,d). Comparison between profiles of volcanic stone and biochar: (e,f). Labels: V = volcanic stone; Cr = biochar; power: L = low 234 W; M = medium 482 W; and H = high 725 W.
Energies 17 01435 g003
Figure 4. Temperature and heating rate analysis. Labels: T5 = internal thermocouple; CA = case A. CB = case B; L = low (234 W). M = medium (482 W). H = high (725 W); V = valley; Conv = convergence; S = segment. Dashed lines = onset and termination periods of heating. (a,c,e) correspond to the temperature column. (b,d,f) correspond to the heating rate column.
Energies 17 01435 g004
Figure 5. Temperature and heating rate analysis of gas outlet (T6) and tar trap (T7); CA = case A; CB = case B; L = low (234 W); M = medium (482 W); H = high (725 W). CV = coincidence with valley; CM = coincidence moisture drying; dashed lines = onset and termination periods of heating. (a,c,e) correspond to the temperature column. (b,d,f) correspond to the heating rate column.
Energies 17 01435 g005
Figure 6. Syngas composition CA = case A; CB = case B; L = low (234 W); M = medium (482 W); H = high (725 W); CV = coincidence with valley; dashed lines = onset and termination periods of heating (a,c,e) correspond to the walnut shell pyrolysis column. (b,d,f) correspond to the biochar heating column.
Energies 17 01435 g006
Figure 7. TGA compared to biochar percentage produced. Y = product yield; L = low (234 W); M = medium (482 W); H = high (725 W); heating rate = 10 °C/min.
Energies 17 01435 g007
Table 1. Walnut properties.
Proximate Analysis (wt%)Ultimate Analysis (wt%)
Moisture7.73C47.97
Ash1.19H5.41
Volatiles80.46O45.92
Fixed carbon10.62N0.61
Table 2. Thermal properties: reactor and materials.
MaterialMass (g)Specific Heat Capacity
(J g−1K−1)
Heat Capacity
(J K−1)
Thermal Conductivity
(W m−1K−1)
Volcanic stone71.50.89 [25]63.61.55 [25]
Biochar17.31.5 [26]25.90.4 [27]
Stainless steel12600.53 [28]667.816.2 [28]
Table 3. Maximum reaction temperatures and percentage of products (% by weight) for the three-power level.
Power (W)Max Reaction Temp (°C) [T5]Char (%)Tar (%)Gas (%)
23438241.6149.379.02
48249832.9057.619.49
72567428.1753.2918.54
Table 4. Biochar’s elemental analysis for the three-power level.
Power (W)Max Reaction Temp (°C) (T5)C (%)H (%)O (%)N (%)
-Nutshell (raw material)47.975.4145.920.61
23438273.703.1822.430.69
48249877.883.1518.020.95
72567482.842.2614.220.68
Disclaimer/Publisher’s Note: The statements, opinions and data contained in all publications are solely those of the individual author(s) and contributor(s) and not of MDPI and/or the editor(s). MDPI and/or the editor(s) disclaim responsibility for any injury to people or property resulting from any ideas, methods, instructions or products referred to in the content.

