
Global Residual Demand Analysis in a Deep Variable Renewable Energy Penetration Scenario for Replacing Coal: A Study of 42 Countries

1
Department of Nuclear & Quantum Engineering, Korea Advanced Institute of Science & Technology (KAIST), 291, Daehak-ro, Yuseong-gu, Daejeon 34141, Republic of Korea
2
Qvist Consulting Limited, London UB1 3EP, UK
*
Author to whom correspondence should be addressed.
Energies 2024, 17(6), 1480; https://doi.org/10.3390/en17061480
Submission received: 29 January 2024
/
Revised: 10 March 2024
/
Accepted: 14 March 2024
/
Published: 20 March 2024
(This article belongs to the Special Issue Repurposing Coal Power Plants with Nuclear Power Plants)
Abstract
:This study analyzes the residual demand curves of 42 countries under five scenarios with varying variable renewable energy (VRE) levels to observe how replacing coal with VRE can alter the demand curve. Using 2018 demand data, the residual demand was calculated and analyzed by subtracting the VRE supply curve from the demand curve. The operational requirements for low-carbon load-following sources amid high VRE penetration are examined. Key findings indicate that substantial peak residual demand persists even with 70% energy from VREs, emphasizing the need for significant load-following resources. Transitioning to a 70% VRE scenario could reduce CO2 emissions by approximately 16.799 billion tons, advancing towards carbon neutrality. However, this benefit depends on maintaining grid stability, highlighting the importance of adequate load-following plants to manage VRE intermittency. Countries like Malaysia, South Korea, Tunisia, the UK, Japan, Indonesia, Thailand, and Libya face higher load-following demands due to specific renewable energy contexts. This study reveals varying renewable energy environments across countries, suggesting that a universal strategy for carbon neutrality and replacing coal may not be feasible. Each nation must develop its own approach to emission reduction, considering its unique conditions. This research emphasizes the urgent need for developing cost-effective, flexible, low-carbon load-following sources to enhance decarbonization potential globally.
1. Introduction
Transitioning to a society with zero carbon emissions has become a critical global priority. To achieve carbon neutrality, replacing coal with other carbon-free energy sources is an important step. To keep global warming below a 1.5-degree-Celsius increase, the Intergovernmental Panel on Climate Change (IPCC) recommends reaching carbon neutrality worldwide by 2050 [1]. However, the 6th Assessment Report of the IPCC predicts that global warming will likely exceed 1.5 degrees during the 21st century based on the nationally determined contributions (NDCs) announced in October 2021 [2]. In order to limit warming to 2 degrees, immediate action is required.
The transition to a green society ‘an b’ summarized into two major tasks: electrification and electricity decarbonization [3,4,5]. Electrification is needed in transportation, heating and cooling, industrial processes, and cooking [6,7,8,9,10]. Electricity decarbonization is mainly being pursued through expanding VRE (variable renewable energy) sources. However, achieving net zero in the power sector by moving away from coal and solely relying on VREs is close to impossible as power generation from these sources depends on the weather conditions and does not follow the demand curve.
With the growing prevalence of VREs, the demand for load-following plants capable of adapting their power output to meet demand has increased. At present, low-carbon load-following power sources are scarce, with hydropower being among the few viable choices.
However, a critical aspect that warrants further exploration is the operational requirements and implications of integrating low-carbon load-following sources within grids characterized by high VRE penetration. The variability and unpredictability of renewable sources necessitate the development and deployment of energy systems that are not only low in carbon but also highly flexible and responsive to the fluctuating energy landscape. This includes a detailed examination of how such systems can be scaled, their economic viability, and their potential environmental impacts in comparison to existing solutions.
Given the increasing reliance on renewable energies, the role of low-carbon load-following sources becomes ever more pivotal. These sources, capable of quickly adjusting their output to balance the supply–demand mismatch inherent in high VRE scenarios, are crucial for ensuring grid reliability and stability. Yet, the transition towards these advanced systems poses a myriad of challenges, from technological hurdles to financial and regulatory barriers. It is essential to delve into these challenges, exploring innovative solutions such as advanced battery storage, demand response mechanisms, and novel generation technologies that promise greater flexibility and lower carbon footprints.
Moreover, the integration of these technologies into existing grids requires a comprehensive understanding of their operational dynamics, particularly in terms of their interaction with VREs. This involves a thorough analysis of grid management strategies, including the optimization of energy storage, the potential for repurposing existing infrastructure for carbon capture and storage, and the role of digital technologies in enhancing grid responsiveness. Addressing these aspects is fundamental to devising practical pathways for the transition to a low-carbon, resilient energy system capable of supporting the ambitious goals of carbon neutrality and sustainable development.
By incorporating a focused discussion on these critical operational requirements and potential solutions, this paper aims to contribute valuable insights into the complex interplay between low-carbon load-following technologies and high VRE penetration. Understanding these dynamics is key to unlocking the full potential of renewable energies and achieving a seamless transition towards a greener, more sustainable energy future.
Nevertheless, emerging technologies, including Small Modular Reactors (SMRs) and gas turbines fueled by clean hydrogen, may become feasible in the future. Fuel cells may also be implemented at a large scale if costs can be brought down to comparable prices. Additionally, natural gas power combined with carbon capture and sequestration could be another potential alternative. All these options can be first utilized for coal repowering.
An excess generation of renewable energy may result in higher costs and diminished environmental advantages, highlighting the importance of efficient energy storage solutions [11,12,13,14,15,16]. Energy storage systems, such as batteries and pumped hydro, can mitigate the variability of renewable energy sources and offer backup power during periods of low renewable energy supply. Nevertheless, these technologies remain relatively costly and have limited capacity. Other storage technologies, such as Thermal Energy Storage, Liquid Air Energy Storage, Compressed Air Energy Storage, are also being developed in several countries. Any storage method that can be economically built at the grid scale will be useful in the near future.
In summary, the transition to a carbon-neutral society and walking away from coal power necessitates a variety of technologies and strategies to achieve equilibrium between energy supply and demand. As the VRE penetration rate increases, volatility in the grid increases rapidly and it becomes increasingly harder to operate load-following power plants to match the demand. The discrepancy between the demand curve and the VRE load curve is called the residual demand. To maintain grid stability, it is crucial to predict the residual demand of countries as their VRE penetrates deeply into the system.
This paper aims to predict the residual demand in some of the major countries globally under circumstances of deep variable renewable energy penetration and analyze its implications. Scenarios with different energy mixes will be analyzed to observe the outcome in different countries. Ultimately, it will show which countries are more vulnerable in high VRE share environments while reducing reliance on coal.
Currently, the most rigorous peak load following is primarily handled by Open Cycle Gas Turbines (OCGTs). To sustain a low-carbon profile, alternative load-following methods are necessary; however, rapid and substantial changes in the grid create an unfavorable environment for less flexible energy sources. With this study, it will be possible to find the operational standard for these environmentally friendly load-following sources.
Our study aims to fill a crucial gap in renewable energy research by focusing on the analysis of residual demand in systems with high VRE penetration. This objective is vital for understanding the operational challenges posed by the variability of renewable energy sources. By examining residual demand across various countries, we contribute to a better understanding of how different regions might be affected by a shift towards greater reliance on VREs.
The importance of this analysis lies in its potential to inform energy policy and planning. By identifying patterns of vulnerability in high VRE environments, our findings offer insights into the future needs of energy systems transitioning away from fossil fuels. This research is pivotal in highlighting the complexities of integrating renewable energy at scale, underscoring the need for innovative thinking in grid management and capacity planning.
In essence, our paper aims to contribute to the global dialogue on sustainable energy transition by providing a detailed examination of the challenges associated with high VRE penetration. Through this focused analysis, we aspire to enhance the understanding of energy system dynamics in the era of renewable energy, supporting the ongoing efforts towards achieving carbon neutrality.
2. Literature Review
Transitioning towards carbon neutrality and improving energy efficiency necessitates an integrated approach, combining policy frameworks, technological innovation, and market adaptations. This literature review outlines the progression from global energy policy impacts and technological advancements to specific regional implementations and challenges.
The pivotal role of policy instruments in enhancing energy efficiency is highlighted in research focusing on the OECD countries, where environmental taxes and green technology are shown to significantly improve energy efficiency and productivity. The criticality of governance, specifically the “Rule of Law,” in facilitating these outcomes suggests that effective policy frameworks are fundamental to achieving sustainability goals [17].
Furthering the discussion on policy frameworks, the transition to renewable energy sources emerges as a crucial strategy for meeting climate goals and mitigating the adverse effects of fossil fuel usage on the environment, economy, and human health. Halkos and Gkampoura [18] illustrate the variance in consumer willingness to pay for renewable energy across nations, indicating the pressing need for tailored policy interventions to foster its widespread adoption. This analysis aligns with the narrative that effective policy instruments are key to driving the transition towards sustainable energy systems.
Expanding the scope to economic factors influencing energy efficiency, a study on G7 countries reveals that trade and financial development are conducive to energy efficiency improvements [19]. This study also notes the indirect impact of governance and research and development on energy efficiency, pointing to the complex interplay between economic policies and sustainability efforts. Building on this, Paramati, Sinha, and Dogan [20] demonstrate that renewable energy consumption significantly enhances economic output while reducing CO2 emissions in developing economies, thereby supporting sustainable economic development. This suggests that integrating renewable energy considerations into economic policies is crucial for long-term sustainability and efficiency.
In the realm of technological solutions and market mechanisms, the economic potential of variable renewable energy (VRE) sources in U.S. ancillary services markets underscores the benefits and challenges of integrating VRE into the grid [21]. The significant potential of solar energy to meet global energy demands, highlighted by Lewis and Nocera [22], emphasizes the need for technological innovation in efficiently harnessing and storing solar power. This discussion complements the exploration of a blockchain-based energy trading platform for renewable energy microgrids, showcasing the role of digital technologies in facilitating efficient and secure energy transactions and enhancing renewable energy markets [23].
Moving to regional impacts and the implications of renewable energy generation, the analysis of the French power system illustrates how increased renewable capacity contributes to system flexibility and stability by improving the balance between supply and demand [24]. Bhattacharya, Paramati, Ozturk, and Bhattacharya [25] further assert that renewable energy consumption significantly enhances economic output in top renewable energy-consuming countries, underscoring the importance of increasing renewable energy investments for low carbon growth. These insights highlight the transformative potential of renewable energy in regional power systems and its critical role in achieving decarbonization targets and enhancing energy efficiency.
The challenges of integrating high shares of VRE and achieving decarbonization targets are addressed in a study on Spain’s power grid. It concludes that without new technologies to address flexibility and stability constraints, ambitious decarbonization goals may not be realistic, highlighting the technological and operational challenges in high VRE environments [26].
Technological advancements and their role in supporting ecological improvements are further examined in South Asia, where energy efficiency and productivity growth are attributed to technological changes rather than efficiency improvements. This finding emphasizes the importance of innovation in driving regional sustainability efforts [27].
Lastly, the examination of China’s carbon emission trading scheme (ETS) on high-carbon firms illustrates the financial implications of environmental policies. The increased debt financing costs for firms under the ETS due to credit risk and environmental reputation issues underscore the need for careful policy design and implementation to support firms in transitioning towards lower emissions [28].
Collectively, these studies offer insights into the multifaceted approach required for the transition to sustainable energy systems. They highlight the significance of policy, technology, and market mechanisms in navigating the complexities of energy efficiency, carbon neutrality, and the pivotal role of renewable energy. Integrating renewable energy into global energy policies, economic strategies, and technological innovation is vital for achieving sustainability goals, underscoring the importance of a cohesive strategy that leverages policy frameworks, market adaptations, and technological advancements in driving the shift towards a sustainable and energy-efficient future.
3. Methodology
3.1. Data Sources
In order to model the residual demand, hourly grid demand data are required. The data of 42 countries were acquired from Tong D. et al. [29], which includes a combination of government and public data. All the countries from the paper were analyzed.
Data from 2018 were utilized, as this precedes the economic recession caused by COVID-19. The data were subsequently normalized by the hourly average demand, as the focus was on the profile and trend of the hourly demand curve rather than the absolute value. Only data from one calendar year were used as the demand curve is changing rapidly due to increased VRE proportions. Many private solar power generators are prosumers, meaning they consume their own electricity and therefore reduce their footprint on the demand curve.
Hourly capacity factor data for wind and solar power plants were obtained from a study by Lei Duan et al. [30]. According to the reference study, the modeling is as follows. The Modern-Era Retrospective Analysis for Research and Application, Version-2 (MERRA-2) reanalysis product was employed to model the profile. The world was segmented into 207,936 cells, and the capacity factor for each cell was computed. The latitude was 0.5° and the longitude was 0.625°. The calculation of the wind capacity factor assumed a wind turbine hub height of 100 m with a cut-in speed of 3 m/s and a cut-out speed of 25 m/s. The capacity factor was 1.0 when the speed was higher than 12 m/s but 0 when above the cut-out speed. For solar PVs, the zenith angle was determined based on location and time. To calculate the capacity factor for individual countries, the average of the top 25% of grid cells within each country was taken.
Hydropower plants, together with Pumped Hydro Storage (PHS) plants, are among the few low-carbon power plants with high ramp rates. As the penetration of VREs increases, there is a need to address greater intermittency. Since hydropower plants provide rapid responses to sudden changes in load, their significance also grows. Data on the total capacity and generation amount of hydropower plants and PHS plants were obtained from the International Hydropower Association [31].
3.2. Scenarios
Many countries are aiming to achieve carbon neutrality in the power generation sector by replacing coal with carbon-free energy sources. This includes a significant proportion of the energy mix to be taken care of by VRE sources in the future. Five scenarios were simulated and compared. The five scenarios are as follows:
Scenario 1: VRE 30% (solar/wind = 1:1).
Scenario 2: VRE 50% (solar/wind = 1:1).
Scenario 3: VRE 70% (solar/wind = 1:1).
Scenario 4: VRE 70% (solar/wind = 1:2).
Scenario 5: VRE 70% (solar/wind = 2:1).
In the first three cases, the installed capacity of solar and wind power was 1:1. The total VRE (solar and wind) penetration rate was 30%, 50%, and 70%, respectively. However, in some countries, solar power is more effective than wind power or vice versa. Therefore, in cases 4 and 5, the solar and wind ratio was set as 1:2 and 2:1, respectively.
3.3. Residual Demand Modeling
The normalized demand had the electricity generated from VREs subtracted on an hourly basis. The VRE generation proportion was set as 30, 50, or 70% depending on the scenario. The ratio between solar and wind is 1:1 in scenarios 1 to 3 and altered to 0.333:0.666 and vice versa in scenarios 4 and 5. The total VRE capacity is given an initial guess and then iterated to match the generation proportion. The subtraction of VRE load from demand leaves the residual demand, which must be managed by load-following sources.
Hydropower plants and PHS plants can assist in flattening the residual demand by operating only when the ramp rate of the load-following source, which represents the change in residual demand over time, exceeds a certain threshold. This approach reduces the maximum ramp rate, enabling less flexible load-following sources to contribute more effectively. In Section 4, the residual demand will refer to the residual demand after the subtraction of solar, wind, and hydroelectricity.
The total generation from hydro is first normalized to the same scale. Generation capacity (GWh) is divided by the total electricity consumption of a country. The load from hydroelectricity is only increased when the ramp rate of residual demand surpasses the threshold. The maximum generation power rating (GW) is capped on the actual hydroelectricity data of each country. The total generation from hydroelectricity is summed up to check if the hydro proportion is equal to the current hydro share of each country. The threshold ramp rate is increased or decreased according to the generation amount and the process is iterated until errors becomes less than 0.1%.
In many countries, the electricity grid is interconnected with neighboring countries. The importance of load-following plants is often underestimated because of interconnection. In this study, interconnection was not modeled in order to evaluate each country’s electricity generation environment in deep VRE penetration situations.
No generation or transmission losses were accounted for. Unless curtailed due to excessive load, all generated electricity was absorbed by the demand curve. Also, no base load energy was modeled as, in the given scenarios (i.e., no coal power), residual demand will often drop to zero and leave no space for base load plants.
By analyzing the residual load, the no-residual-load time can be calculated, which shows how much time of the year does not require any other dispatchable sources. Curtailed VRE energy can be calculated to see how effectively the plants are operating and to see if implementing ESS can be a viable option. The top VRE load can be checked along with the top residual demand, which are proportional to the installed capacity of VRE plants and load-following plants.
In load-following modes, arguably the most important parameter is the ramp rate. In this study, the hourly ramp rate of residual demand was compared. The maximum ramp rate can give operational specifications for load-following sources under development. Also, in order to reflect the frequency and magnitude of ramping, the sum of ramp up and ramp down was calculated.
4. Results and Discussion
The analysis of solar and wind capacity factors across 42 countries reveals a diverse landscape of renewable energy potential. As depicted in Table 1, countries exhibit varying degrees of solar and wind capacity factors, highlighting the influence of geographical and climatic factors on renewable energy generation. For instance, countries such as Argentina and Chile boast high-capacity factors for both solar and wind power, indicating favorable conditions for renewable energy deployment. Conversely, countries like Malaysia and Sweden demonstrate lower capacity factors, suggesting challenges in harnessing solar and wind resources efficiently.
Expanding upon the scatter plot presented in Figure 1, which illustrates the relationship between solar and wind capacity factors, a linear trend emerges, indicating a general correlation between the two variables. Countries with poorer solar power conditions tend to exhibit lower wind capacity factors, and vice versa. Out of the 42 countries, 3 countries had a less than 0.1 wind capacity factor and 2 of them had a solar capacity factor under 0.22. This observation underscores the interconnectedness of solar and wind resources and emphasizes the importance of considering multiple energy sources in energy planning and policy formulation.
In addition to the existing analysis, it is worth delving deeper into the specific factors influencing the capacity factors of solar and wind power in different countries. Factors such as geographical location, topography, atmospheric conditions, and investment in renewable energy infrastructure can significantly impact the efficiency and utilization of solar and wind resources.
The modeling approach employed in this study utilizes normalized values and assumes a similarity between the profile of future demand curves and that of 2018. While providing valuable insights into potential renewable energy deployment scenarios, it is essential to acknowledge the limitations and assumptions inherent in the modeling process. The reliance on historical data for demand curve projection may overlook emerging trends or disruptive factors that could influence future electricity demand patterns.
To enhance the accuracy of future demand predictions, it is imperative to incorporate yearly increase rates of demand and consider dynamic factors such as technological advancements, demographic shifts, and policy changes. By adopting a more dynamic and adaptable modeling framework, stakeholders can better anticipate future energy needs and devise informed strategies for renewable energy integration and grid optimization. Nevertheless, to gain insight into the magnitude of the values, the value of total electricity generated in 2018 was utilized for this study.
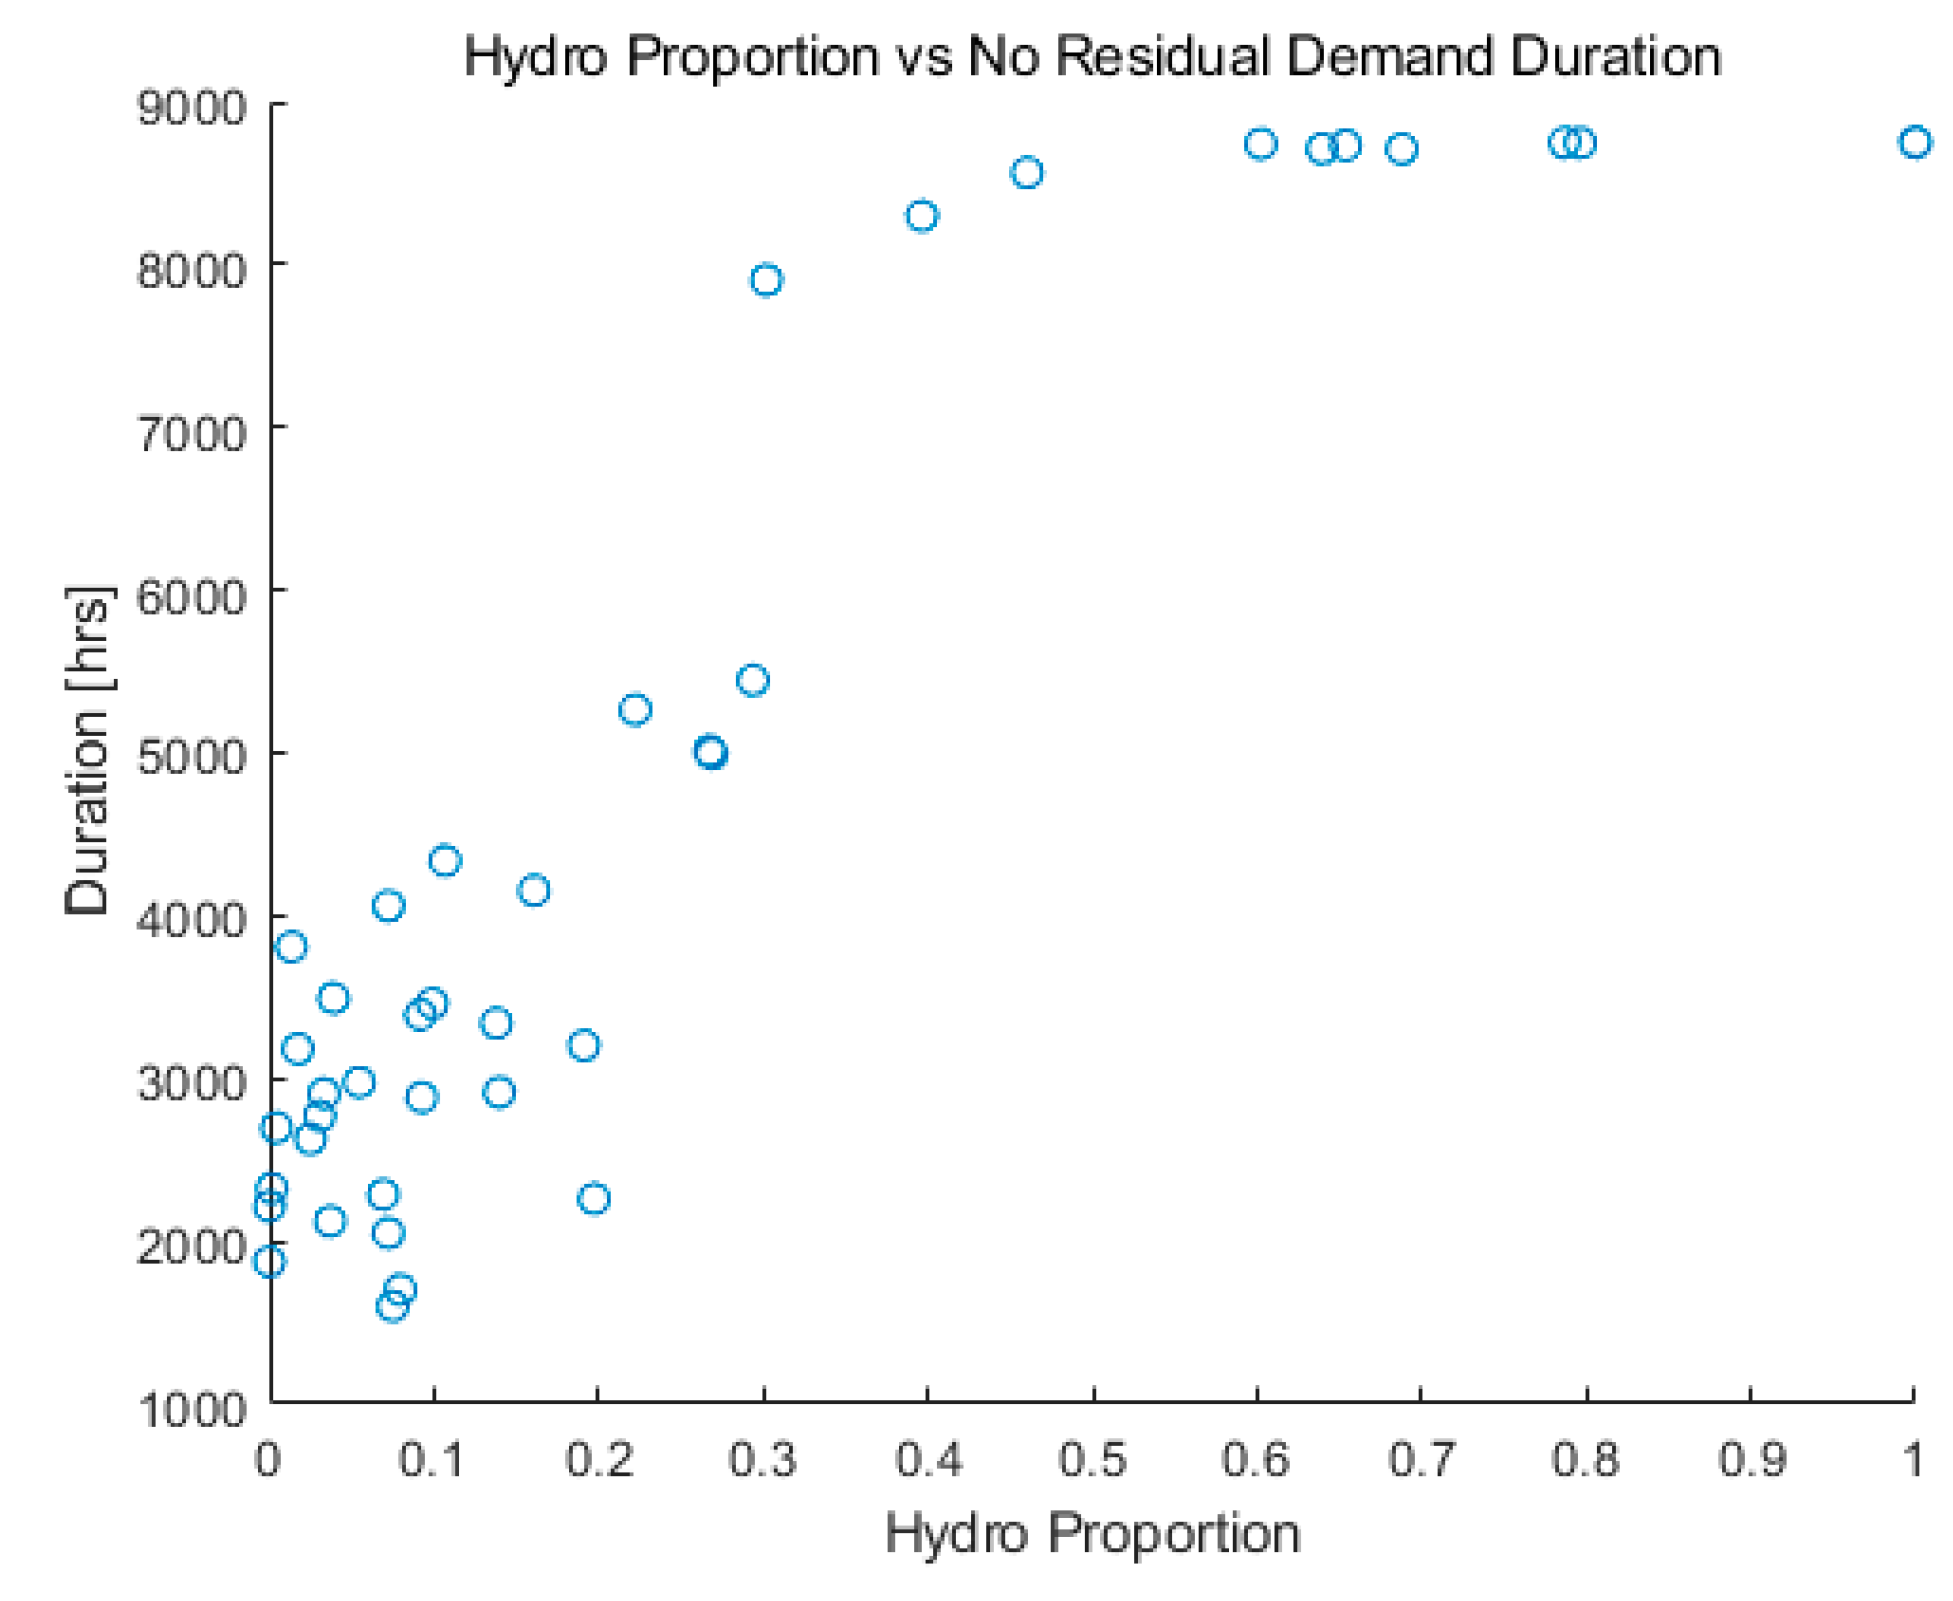
The examination of the no-residual-time duration sheds light on the availability of uninterrupted periods with no need for load-following plants other than hydroelectric facilities. Figure 2 and Figure 3 depict the relationship between hydroelectricity proportion and the duration of no residual demand for different scenarios. In scenario 1, where VRE contributes 30% of electricity generation, countries with over 70% hydroelectricity demonstrate extended periods of no residual demand, highlighting the complementary nature of renewable energy sources and hydroelectric power in meeting fluctuating electricity demand.
Expanding upon these findings, it is evident that countries with significant hydroelectric capacity possess inherent advantages in managing renewable energy variability and ensuring grid stability. Other studies also show that countries like Iceland, Norway, Costa Rica, Brazil, and Canada have electric grids with high fractions of renewables, primarily hydropower, showcasing its role in achieving near or complete renewable energy supply. Hydropower’s affordability and renewability, despite being limited by geography and rainfall, have been pivotal [32].
However, it is essential to recognize the geographical constraints and environmental considerations associated with hydroelectric development, underscoring the need for a balanced and diversified approach to renewable energy deployment.
To augment the analysis, further investigation could explore the temporal and spatial variability of the no-residual-time duration across different regions and climatic zones. Additionally, assessing the economic implications of prolonged periods of no residual demand on energy markets and grid operations can provide valuable insights for energy stakeholders.
Table 2 identifies countries with hydro shares of 30% and above, providing insights into their energy profiles and renewable energy integration strategies. These countries, including Paraguay, Mozambique, and Colombia, exhibit a reliance on hydroelectricity as a primary source of renewable energy, contributing to grid resilience and energy security. By examining the experiences of these countries, policymakers and energy planners can glean valuable lessons on optimizing renewable energy portfolios and mitigating the impacts of climate variability on energy systems.
In addition to the listed countries, it would be beneficial to explore case studies of other countries with varying levels of hydroelectric capacity to offer a comprehensive understanding of the challenges and opportunities associated with hydro-based renewable energy integration. Furthermore, analyzing the role of cross-border energy cooperation and interconnections in harnessing hydroelectric resources can provide valuable insights for regional energy planning.
Malaysia and South Korea curtailed more than 300 GWh of energy in scenario 1, topping the list. The numbers even surpassed 300,000 GWh in scenario 5.
These countries were also among the countries with the most VRE capacity installed. The installed VRE capacity of Malaysia increased from 25 GW (scenario 1) to 159 GW (scenario 3). The capacity of South Korea increased from 69 GW (scenario 1) to 220 GW (scenario 3). This is because these countries have very low VRE capacity factors. Since a large portion of electricity is being supplemented with these low capacity factor plants, the installed capacity needs to be very high and high curtailment comes along with it. Furthermore, economic burdens due to the installation of transmission lines will become inevitable in these countries. Figure 4 shows the large discrepancy between the VRE load and demand. Without energy storage systems, all this energy is lost. Peru tops the VRE curtailment list in many of the scenarios. Even though Peru has generous sunlight, the wind capacity factor is among the lowest, making wind farms very ineffective.
Expanding upon the discussion of VRE curtailment, it is essential to highlight the implications of such high curtailment levels on energy security, economic efficiency, and environmental sustainability. High curtailment rates not only represent wasted energy resources but also entail financial losses for energy stakeholders and potential environmental impacts due to increased reliance on conventional energy sources.
The United Kingdom, Tunisia, and Japan had three of the highest peak residual demands. This can be translated to the load-following plant capacity required as load-following plants will be operating to fill the gap between VRE generation and demand. Demand usually peaks near noon but solar plant generation also peaks around noon and negates the peak demand. Therefore, the peak residual demand usually happens during sunset when people are still relatively active but power generation from solar plants drop dramatically. Wind power generation is quite random; if wind happens to stop blowing during sunset, then it is highly possible for the yearly peak residual demand to happen.
France topped the list in scenario 1 but quickly descended in the following scenarios. The UK required 53 GW (Figure 5) of capacity and Japan 153 GW (Figure 6) in scenario 1.
Further elaborating on the peak residual demand analysis, it is essential to discuss the challenges associated with balancing variable renewable energy generation with fluctuating demand patterns. This includes the need for flexible and responsive grid infrastructure, as well as the potential role of energy storage technologies in mitigating peak demand periods and enhancing grid stability. The variations in peak residual demand observed across different countries underscore the importance of tailoring energy policies and investment strategies to address specific regional energy dynamics and maximize the efficiency of renewable energy integration.
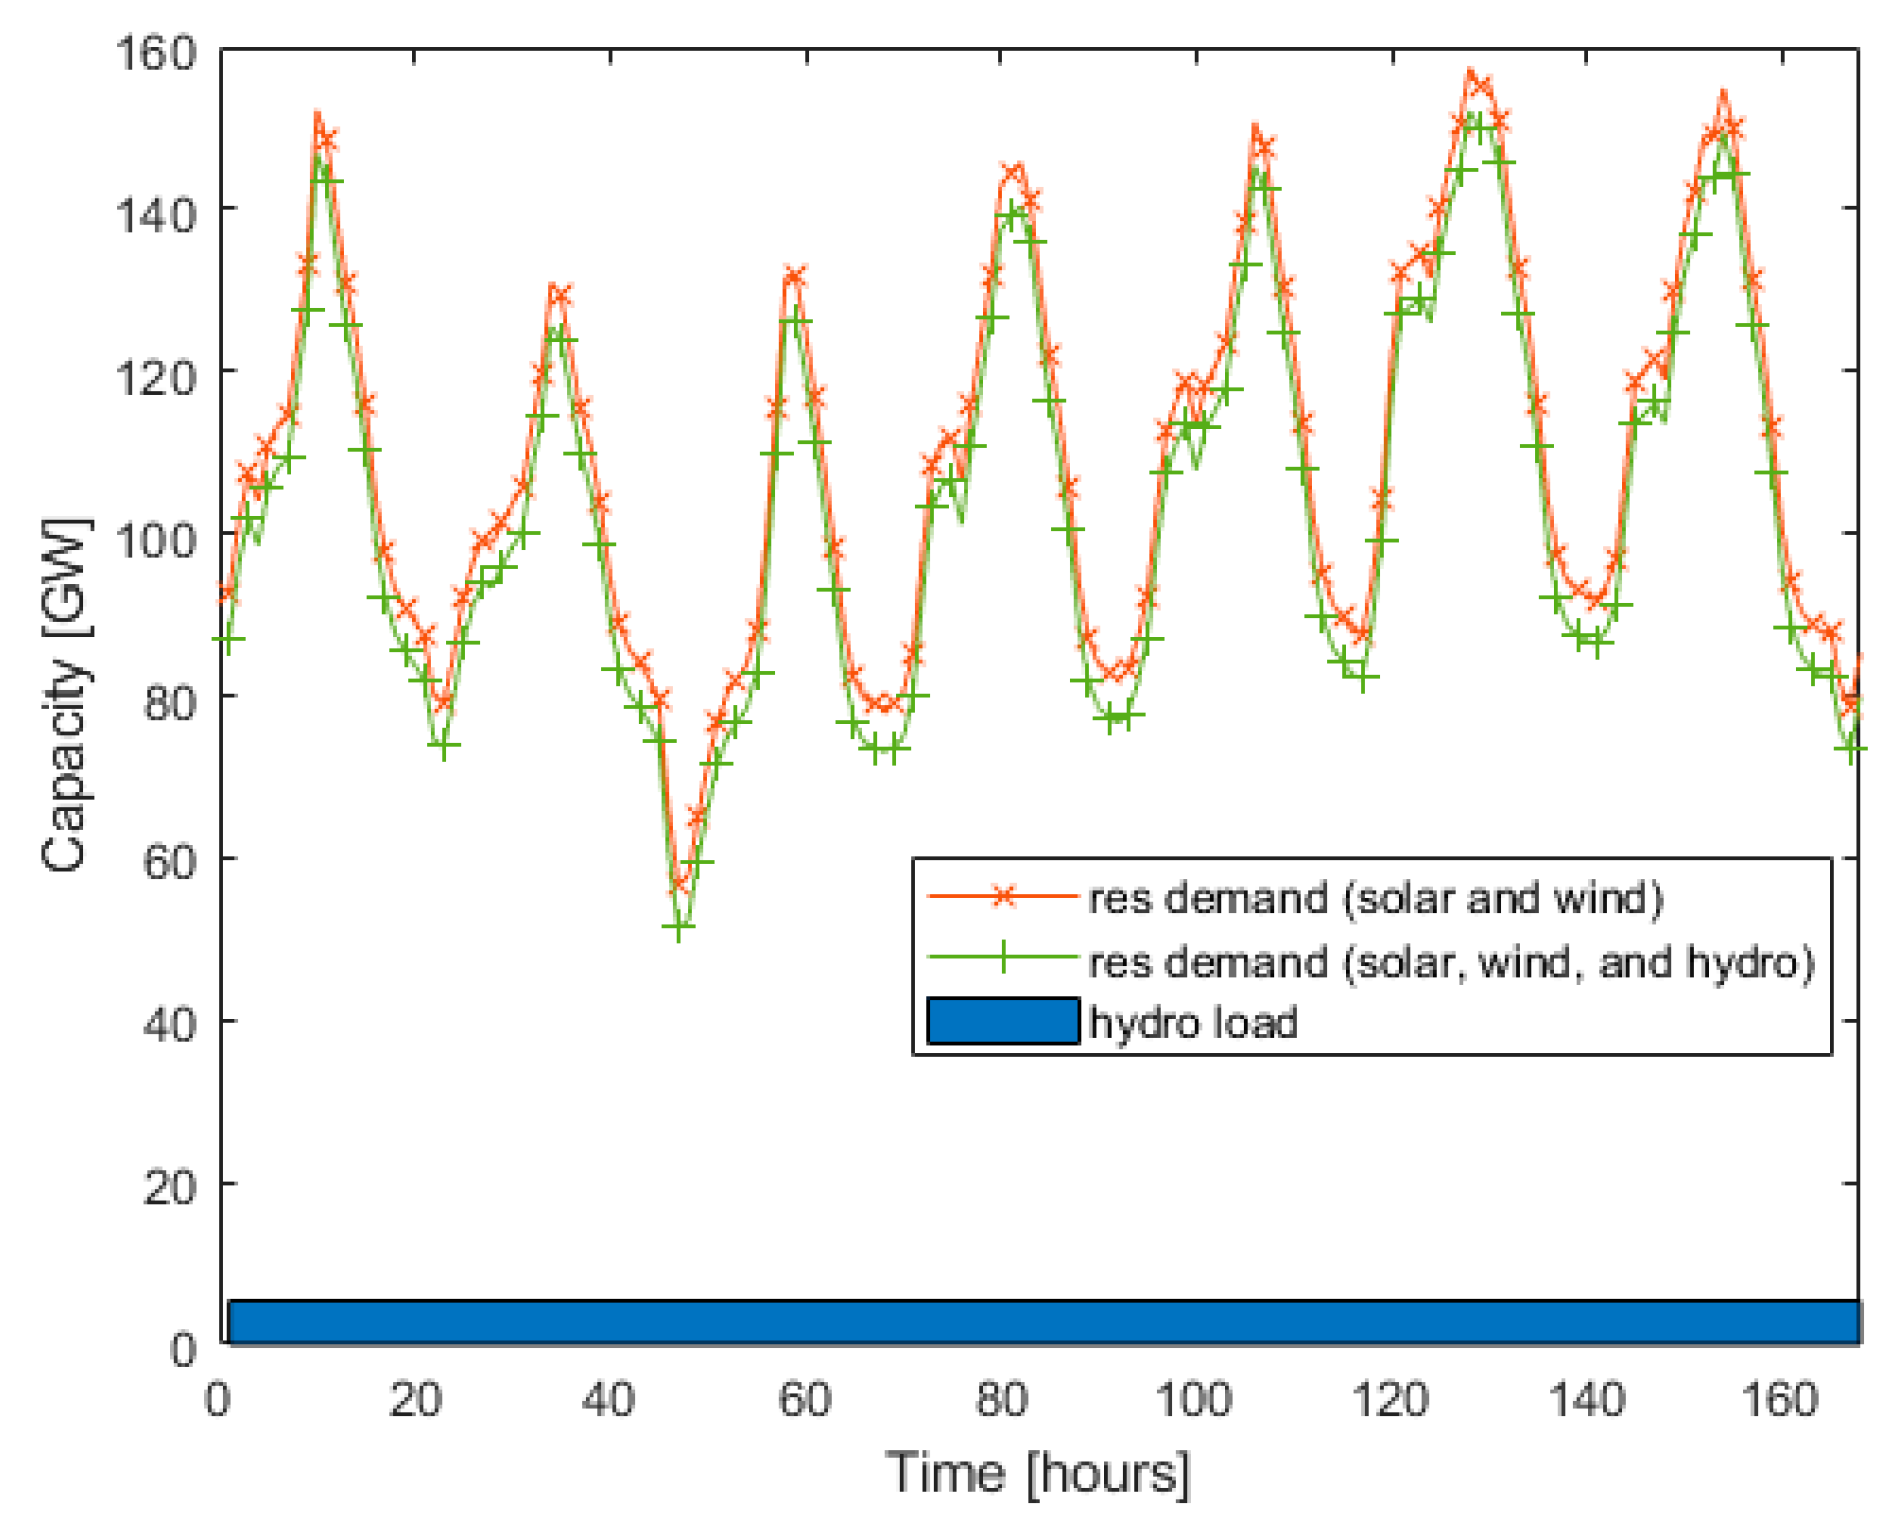
Tunisia, Malaysia, and South Korea had the highest hourly ramp up rates. South Korea needed 35 GW of additional electricity within an hour in scenario 5. Considering that the load-following capacity needed in this scenario is 70 GW, very harsh operating conditions are required for the load-following plants. The maximum ramp down rate required in that same scenario was also incredibly high (33 GW/h). In Figure 7, it can be observed that residual demand drops to zero around noon and rises abruptly when the sun sets, triggering the hydroelectric sources to operate and mitigate the high ramp rate of load-following plants.
However, the table can change from year to year. Solar power usually shows a repetitive pattern from day to day. If the wind generation happens to drop near sunset, the residual demand can rise rapidly. Although wind power tends to have a higher capacity factor than solar power in many countries, wind speed and direction can change abruptly and affect wind power generation. Countries must be prepared for such abrupt changes that can jeopardize the power grid and must have enough firm sources ready [33].
Not only the maximum ramp rate but also the summation of ramp rates matter. This shows how much pressure is applied to the load-following plants on a year-long basis. The ramp rates for ups and downs were added up individually. Malaysia, Indonesia, Thailand, and Libya were among the highest in the ramp up and down list. Although these countries do not necessarily have the highest solar capacity factors, they have a very regular solar generation pattern. On most days, the residual demand decreases rapidly, often times reaching zero, then increases substantially during sunset. Since these countries are located near the equator and do not experience winter, the pattern continues throughout the year.
In addition to analyzing the ramp rates, it is important to discuss the operational challenges faced by load-following plants in meeting rapid changes in electricity demand. This includes the need for advanced control systems and grid management strategies to ensure system reliability and stability amidst fluctuating renewable energy generation. The high ramp rates observed in countries like Tunisia, Malaysia, and South Korea underscore the urgency of implementing measures to enhance grid flexibility and resilience, such as demand response programs, grid-scale energy storage, and advanced forecasting techniques. Furthermore, the reliance on hydroelectric sources to mitigate ramp rates highlights the interconnectedness of different renewable energy technologies and the importance of adopting a holistic approach to energy planning and management.
5. Summary and Conclusions
The residual demand curves of 42 countries were compared. Five scenarios with different VRE proportions and different VRE compositions were modeled on an hourly basis to understand the implication of replacing coal with VRE. The demand data of the year 2018 were used. The analysis of residual demand aimed to comprehend the operational necessities for future low-carbon load-following sources under extensive VRE penetration with no coal. Even when 70% of energy is generated from VREs, the peak residual demand remains considerably high, meaning that great amounts of load-following sources will be required.
If all 42 countries in the study can transition to scenario 3 (VRE 70%), a maximum of approximately 16.8 billion tons of CO2 emissions can potentially be reduced and move closer to carbon neutrality by moving away from coal. However, all the environmental benefits from the transition can be questioned if the grid stability is jeopardized. To maintain stability, it is crucial to have enough load-following plants to support the intermittency of VREs and substantial investment is needed to install large transmission infrastructure.
Some countries were more vulnerable than others under deep VRE penetration scenarios. Malaysia, South Korea, Tunisia, the United Kingdom, Japan, Indonesia, Thailand, and Libya showed aggressive load-following requirements if these countries transition from coal to VRE aggressively. Great amounts of low-carbon load-following sources will be needed in these countries. This is usually due to the low capacity factor of solar and wind power plants. Countries near the equator also tended to be more vulnerable as sunrise and sunset was very regular throughout the year and high ramp rates were required all throughout the year.
Countries have very different environments for generating renewable energy. Implementing a single uniform strategy to reach carbon neutrality and move away from coal may not be effective. With different VRE generation patterns, load-following patterns will differ too. Countries must each find the best pathway to lower their carbon emissions in their given conditions.
The need for flexible low-carbon energy is higher than ever and whether a cost-effective, low-carbon, load-following source can be developed or not will determine the decarbonization potential of countries.
The findings of this study underscore the urgent need for robust policy frameworks that facilitate a smoother transition towards VRE. Governments should prioritize policies that incentivize the development of low-carbon load-following capabilities and support the expansion of transmission infrastructure to ensure grid stability. Given the diverse operational challenges identified across different countries, policies must be tailored to address specific regional vulnerabilities and energy generation patterns. Implementing differentiated strategies that consider each country’s unique environmental and geographical conditions is crucial for an effective transition to carbon neutrality.
This analysis, while comprehensive, acknowledges its limitations. The reliance on demand data from 2018 may not fully capture future fluctuations in energy demand or the rapid advancements in renewable energy technologies. Additionally, this study’s approach to modeling a uniform transition across all countries may oversimplify the complex, country-specific challenges involved in shifting from coal to VRE and other low-carbon sources. The varying capacity factors of solar and wind power plants highlight the necessity for more nuanced, context-specific energy transition models.
Future research should aim to address these limitations by incorporating more dynamic, multi-year datasets to account for potential shifts in energy demand and technological innovation. Exploring the socio-economic impacts of VRE transitions, especially in regions identified as highly vulnerable, will provide deeper insights into the challenges and opportunities of moving away from coal. Investigating emerging low-carbon load-following technologies that are economically viable could significantly contribute to the global decarbonization effort. Furthermore, studies examining the effectiveness of different policy interventions in accelerating the transition to renewable energy are essential for informing policymakers and stakeholders.
The extensive VRE penetration scenarios analyzed across these 42 countries highlight the multifaceted challenges and investments required to achieve a sustainable, low-carbon future. Significant efforts in policy-making, technological innovation, and infrastructure development are essential for navigating the complexities of this energy transition. Collaborative efforts among policymakers, researchers, and industry stakeholders are imperative to develop and implement strategies that address the unique energy landscapes and vulnerabilities of each country, ensuring a balanced approach to global decarbonization and energy sustainability.
Supplementary Materials
The following supporting information can be downloaded at: https://www.mdpi.com/article/10.3390/en17061480/s1. Tables with results from each scenario are attached. Eight tables for five scenarios each with results from 42 countries are presented.
Author Contributions
Conceptualization, J.-O.C., J.I.L. and S.Q.; Data curation, J.-O.C. and S.Q.; Formal analysis, J.-O.C. and S.Q.; Funding acquisition J.I.L. and S.Q.; Investigation, J.-O.C. and S.Q.; Methodology, J.-O.C., J.I.L. and S.Q.; Project Administration J.I.L.; Resources, J.I.L. and S.Q.; Software, J.-O.C. and S.Q.; Supervision, J.I.L.; Validation, J.-O.C., J.I.L. and S.Q.; Visualization, J.-O.C.; Writing—original draft, J.-O.C.; Writing—review and editing, J.-O.C., J.I.L. and S.Q. All authors have read and agreed to the published version of the manuscript.
Funding
This research was funded by the Quadrature Climate Foundation, grant number 12-20-000071.
Data Availability Statement
Data is contained within the article and Supplementary Materials.
Conflicts of Interest
Author Staffan Qvist was employed by the company Qvist Consulting Limited. The authors declare no conflict of interest. The funders had no role in the design of the study; in the collection, analyses, or interpretation of data; or in the writing of the manuscript. The funder supported the decision to publish the results.
References
- IPCC. Global Warming of 1.5 °C; IPCC: Geneva, Switzerland, 2018; Available online: https://www.ipcc.ch/sr15/ (accessed on 29 October 2023).
- IPCC. Summary for Policymakers. In Climate Change 2022: Impacts, Adaptation, and Vulnerability. Contribution of Working Group II to the Sixth Assessment Report of the Intergovernmental Panel on Climate Change; Pörtner, H.-O., Roberts, D.C., Tignor, M., Poloczanska, E.S., Mintenbeck, K., Alegría, A., Craig, M., Langsdorf, S., Löschke, S., Möller, V., et al., Eds.; Cambridge University Press: Cambridge, UK; New York, NY, USA, 2022; pp. 3–33. [Google Scholar] [CrossRef]
- Martins, F.; Moura, P.; de Almeida, A.T. The Role of Electrification in the Decarbonization of the Energy Sector in Portugal. Energies 2022, 15, 1759. [Google Scholar] [CrossRef]
- Daniel, S.; Dave, B.; Josh, E.; Kelly, E.; Jeff, L.; Trieu, M.; Colin, M.; Andrew, P.; Laura, V.; Eric, W. 2017; Electrification and Decarbonization: Exploring U.S. Energy Use and Greenhouse Gas Emissions in Scenarios with Widespread Electrification and Power Sector Decarbonization”. United States. Available online: https://www.osti.gov/servlets/purl/1372620 (accessed on 28 September 2023). [CrossRef]
- Masiello, R.; Fioravanti, R.; Chalamala, B.; Passell, H. Electrification, decarbonization, and the future carbon-free grid: The role of energy storage in the electric grid infrastructure [point of view]. Proc. IEEE 2022, 110, 324–333. [Google Scholar] [CrossRef]
- Zhang, R.; Fujimori, S. The role of transport electrification in global climate change mitigation scenarios. Environ. Res. Lett. 2020, 15, 034019. [Google Scholar] [CrossRef]
- Fajardy, M.; Reiner, D.M. An Overview of the Electrification of Residential and Commercial Heating and Cooling and Prospects for Decarbonization Energy Policy Research Group; University of Cambridge: Cambridge, UK, 2020; Available online: https://www.jstor.org/stable/resrep30466 (accessed on 29 October 2023).
- Schiffer, Z.J.; Manthiram, K. Electrification and Decarbonization of the Chemical Industry. Joule 2017, 1, 10–14. [Google Scholar] [CrossRef]
- Wei, M.; McMillan, C.A.; de la Rue du Can, S. Electrification of Industry: Potential, Challenges and Outlook. Curr. Sustain. Energy Rep. 2019, 6, 140–148. [Google Scholar] [CrossRef]
- Im, H.; Kim, Y. The Electrification of Cooking Methods in Korea—Impact on Energy Use and Greenhouse Gas Emissions. Energies 2020, 13, 680. [Google Scholar] [CrossRef]
- Rose, S.; Apt, J. The cost of curtailing wind turbines for frequency regulation and ramp-rate limitation. In Proceedings of the 29th USAEE/IAEE North American Conference on Energy and the Environment: Conventional and Unconventional Solutions, Calgary, AB, Canada, 14–16 October 2010. [Google Scholar]
- Denholm, P.; O’Connell, M.; Brinkman, G.; Jorgenson, J. Overgeneration from Solar Energy in California. A Field Guide to the Duck Chart; Report No.: NREL/TP-6A20-65023; National Renewable Energy Laboratory (NREL): Golden, CO, USA, 2015.
- Golden, R.; Paulos, B. Curtailment of Renewable Energy in California and Beyond. Electr. J. 2015, 28, 36–50. [Google Scholar] [CrossRef]
- Denholm, P.; Mehos, M.S. Enabling Greater Penetration of Solar Power via the Use of CSP with Thermal Energy Storage; National Renewable Energy Laboratory: Golden, CO, USA, 2011.
- Marcos, J.; Storkël, O.; Marroyo, L.; Garcia, M.; Lorenzo, E. Storage requirements for PV power ramp-rate control. Sol. Energy 2014, 99, 28–35. [Google Scholar] [CrossRef]
- Álvaro, D.; Arranz, R.; Aguado, J.A. Sizing and operation of hybrid energy storage systems to perform ramp-rate control in PV power plants. Int. J. Electr. Power Energy Syst. 2018, 107, 589–596. [Google Scholar] [CrossRef]
- Yasmeen, R.; Zhang, X.; Tao, R.; Shah, W.U.H. The impact of green technology, environmental tax and natural resources on energy efficiency and productivity: Perspective of OECD Rule of Law. Energy Rep. 2023, 9, 1308–1319. [Google Scholar] [CrossRef]
- Halkos, G.E.; Gkampoura, E.-C. Reviewing Usage, Potentials, and Limitations of Renewable Energy Sources. Energies 2020, 13, 2906. [Google Scholar] [CrossRef]
- Shah, W.U.H.; Hao, G.; Yan, H.; Yasmeen, R.; Padda, I.U.H.; Ullah, A. The impact of trade, financial development and government integrity on energy efficiency: An analysis from G7-Countries. Energy 2022, 255, 124507. [Google Scholar] [CrossRef]
- Paramati, S.R.; Sinha, A.; Dogan, E. The significance of renewable energy use for economic output and environmental protection: Evidence from the Next 11 developing economies. Environ. Sci. Pollut. Res. 2017, 24, 13546–13560. [Google Scholar] [CrossRef]
- Kim, J.H.; Kahrl, F.; Mills, A.; Wiser, R.; Montañés, C.C.; Gorman, W. Economic evaluation of variable renewable energy participation in U.S. ancillary services markets. Util. Policy 2023, 82, 101578. [Google Scholar] [CrossRef]
- Lewis, N.S.; Nocera, D.G. Powering the planet: Chemical challenges in solar energy utilization. Proc. Natl. Acad. Sci. USA 2006, 103, 15729–15735. [Google Scholar] [CrossRef]
- Lei, Y.-T.; Ma, C.-Q.; Mirza, N.; Ren, Y.-S.; Narayan, S.W.; Chen, X.-Q. A renewable energy microgrids trading management platform based on permissioned blockchain. Energy Econ. 2022, 115, 106375. [Google Scholar] [CrossRef]
- Deman, L.; Boucher, Q. Impact of renewable energy generation on power reserve energy demand. Energy Econ. 2023, 128, 107173. [Google Scholar] [CrossRef]
- Bhattacharya, M.; Paramati, S.R.; Ozturk, I.; Bhattacharya, S. The effect of renewable energy consumption on economic growth: Evidence from top 38 countries. Appl. Energy 2016, 162, 733–741. [Google Scholar] [CrossRef]
- Guerra, K.; Haro, P.; Gutiérrez, R.; Gómez-Barea, A. Facing the high share of variable renewable energy in the power system: Flexibility and stability requirements. Appl. Energy 2022, 310, 118561. [Google Scholar] [CrossRef]
- Shah, W.U.H.; Hao, G.; Yan, H.; Yasmeen, R.; Lu, Y. Energy efficiency evaluation, changing trends and determinants of energy productivity growth across South Asian countries: SBM-DEA and Malmquist approach. Environ. Sci. Pollut. Res. 2023, 30, 19890–19906. [Google Scholar] [CrossRef]
- Ren, Y.-S.; Derouiche, I.; Hassan, M.; Liu, P.-Z. Do creditors price climate transition risks? A natural experiment based on China’s carbon emission trading scheme. Int. Rev. Econ. Finance 2024, 91, 138–155. [Google Scholar] [CrossRef]
- Tong, D.; Farnham, D.J.; Duan, L.; Zhang, Q.; Lewis, N.S.; Caldeira, K.; Davis, S.J. Geophysical constraints on the reliability of solar and wind power worldwide. Nat. Commun. 2021, 12, 6164. [Google Scholar] [CrossRef]
- Duan, L.; Petroski, R.; Wood, L.; Caldeira, K. Stylized least-cost analysis of flexible nuclear power in deeply decarbonized electricity systems considering wind and solar resources worldwide. Nat. Energy. 2022, 7, 260–269. [Google Scholar] [CrossRef]
- International Hydropower Association, 2019, 2019 Hydropower Status Report: Sector Trends and Insights. Available online: https://www.hydropower.org/publications/status2019 (accessed on 30 November 2023).
- Kroposki, B.; Johnson, B.; Zhang, Y.; Gevorgian, V.; Denholm, P.; Hodge, B.-M.; Hannegan, B. Achieving a 100% Renewable Grid: Operating Electric Power Systems with Extremely High Levels of Variable Renewable Energy. IEEE Power Energy Mag. 2017, 15, 61–73. [Google Scholar] [CrossRef]
- Liu, Y.; Wang, H.; Han, S.; Yan, J.; Li, L.; Chen, Z. Quantitative method for evaluating detailed volatility of wind power at multiple temporal-spatial scales. Glob. Energy Interconnect. 2019, 2, 318–327. [Google Scholar] [CrossRef]
Figure 1.
Solar capacity factor vs. wind capacity factor scatter plot of different countries.

Figure 2.
Hydroelectricity proportion of each country vs. no residual demand duration for scenario 1.
Figure 2.
Hydroelectricity proportion of each country vs. no residual demand duration for scenario 1.

Figure 3.
Hydroelectricity proportion of each country vs. no residual demand duration for scenario 3.
Figure 3.
Hydroelectricity proportion of each country vs. no residual demand duration for scenario 3.

Figure 4.
Week 10 (peak VRE load) of Malaysia in scenario 3.

Figure 5.
Week 4 (peak residual demand) of United Kingdom in scenario 1.

Figure 6.
Week 35 (peak residual demand) of Japan in scenario 1.

Figure 7.
Week 3 (peak ramp rate) of South Korea in scenario 5.


Table 1.
Average capacity factor of solar and wind power in each country (Green for high CF countries and red for low CF countries).
Table 1.
Average capacity factor of solar and wind power in each country (Green for high CF countries and red for low CF countries).
| Country Name | Solar CF | Wind CF |
|---|---|---|
| AR Argentina | 0.304 | 0.553 |
| AU Australia | 0.300 | 0.407 |
| BR Brazil | 0.269 | 0.234 |
| CA Canada | 0.190 | 0.391 |
| CL Chile | 0.347 | 0.522 |
| CN China | 0.303 | 0.369 |
| CO Colombia | 0.226 | 0.107 |
| DE Germany | 0.196 | 0.395 |
| DZ Algeria | 0.293 | 0.377 |
| EG Egypt | 0.310 | 0.383 |
| ES Spain | 0.259 | 0.289 |
| FR France | 0.233 | 0.368 |
| GB United Kingdom | 0.183 | 0.469 |
| GH Ghana | 0.216 | 0.161 |
| ID Indonesia | 0.218 | 0.087 |
| IN India | 0.271 | 0.248 |
| IR Iran | 0.300 | 0.343 |
| IT Italy | 0.231 | 0.248 |
| JP Japan | 0.223 | 0.298 |
| KR South Korea | 0.233 | 0.270 |
| LY Libya | 0.310 | 0.353 |
| MA Morocco | 0.300 | 0.462 |
| MX Mexico | 0.281 | 0.257 |
| MY Malaysia | 0.197 | 0.044 |
| MZ Mozambique | 0.282 | 0.294 |
| NG Nigeria | 0.253 | 0.259 |
| NZ New Zealand | 0.227 | 0.405 |
| PE Peru | 0.303 | 0.067 |
| PL Poland | 0.187 | 0.352 |
| PY Paraguay | 0.251 | 0.352 |
| RU Russia | 0.190 | 0.357 |
| SA Saudi Arabia | 0.301 | 0.337 |
| SD Sudan | 0.318 | 0.400 |
| SE Sweden | 0.168 | 0.230 |
| TH Thailand | 0.221 | 0.193 |
| TN Tunisia | 0.280 | 0.338 |
| TR Turkey | 0.262 | 0.226 |
| UA Ukraine | 0.205 | 0.333 |
| US United States | 0.270 | 0.402 |
| VE Venezuela | 0.259 | 0.277 |
| VN Vietnam | 0.227 | 0.203 |
| ZA South Africa | 0.308 | 0.360 |
Table 2.
Countries with hydro shares of 30% and above.
| Country Name | Hydro Share |
|---|---|
| Paraguay | 99.68% |
| Mozambique | 80.36% |
| Colombia | 71.92% |
| Venezuela | 64.38% |
| Sudan | 60.28% |
| Canada | 60.25% |
| New Zealand | 55.23% |
| Peru | 54.85% |
| Brazil | 54.76% |
| Sweden | 43.71% |
| Ghana | 34.43% |
| Vietnam | 30.36% |
Disclaimer/Publisher’s Note: The statements, opinions and data contained in all publications are solely those of the individual author(s) and contributor(s) and not of MDPI and/or the editor(s). MDPI and/or the editor(s) disclaim responsibility for any injury to people or property resulting from any ideas, methods, instructions or products referred to in the content. |
© 2024 by the authors. Licensee MDPI, Basel, Switzerland. This article is an open access article distributed under the terms and conditions of the Creative Commons Attribution (CC BY) license (https://creativecommons.org/licenses/by/4.0/).
Share and Cite
MDPI and ACS Style
Cho, J.-O.; Lee, J.I.; Qvist, S. Global Residual Demand Analysis in a Deep Variable Renewable Energy Penetration Scenario for Replacing Coal: A Study of 42 Countries. Energies 2024, 17, 1480. https://doi.org/10.3390/en17061480
AMA Style
Cho J-O, Lee JI, Qvist S. Global Residual Demand Analysis in a Deep Variable Renewable Energy Penetration Scenario for Replacing Coal: A Study of 42 Countries. Energies. 2024; 17(6):1480. https://doi.org/10.3390/en17061480
Chicago/Turabian StyleCho, Jai-Oan, Jeong Ik Lee, and Staffan Qvist. 2024. "Global Residual Demand Analysis in a Deep Variable Renewable Energy Penetration Scenario for Replacing Coal: A Study of 42 Countries" Energies 17, no. 6: 1480. https://doi.org/10.3390/en17061480
Note that from the first issue of 2016, this journal uses article numbers instead of page numbers. See further details here.