Article

Experimental Study on Improving Oil Recovery Mechanism of Injection–Production Coupling in Complex Fault-Block Reservoirs

1
School of Petroleum Engineering, Xi‘an Shiyou University, Xi’an 710065, China
2
The Second Production Plant, SINOPEC Henan Oilfield Branch, Nanyang 473400, China
3
Xi’an Key Laboratory of Tight Oil (Shale Oil) Development, Xi’an Shiyou University, Xi’an 710065, China
4
School of Earth Sciences and Engineering, Xi’an Shiyou University, Xi’an 710065, China
*
Author to whom correspondence should be addressed.
Energies 2024, 17(6), 1505; https://doi.org/10.3390/en17061505
Submission received: 22 December 2023 / Revised: 8 February 2024 / Accepted: 13 February 2024 / Published: 21 March 2024
(This article belongs to the Special Issue Fundamentals of Enhanced Oil Recovery II)

Abstract

:
In order to improve the effect of injection–production coupling development to improve crude oil recovery in complex fault-block reservoirs, we carried out a physical simulation experiment based on a sandpack model of transforming water-driven development into injection–production coupling development and quantitatively evaluated the influence of rounds of injection pressure coupling on the crude oil mobilization in reservoirs with different permeability levels and on oil recovery. Meanwhile, the characteristics of residual oil were studied via a numerical simulation method. The mechanism of increased oil production via injection–production coupling development was revealed by analyzing the water and oil contents, formation pressure, and streamline fields through the establishment of mechanism models. The results of the physical experiment show that injection–production coupling can improve the recovery effect of medium- and low-permeability reservoirs by 55.66%. With an increase in the injection pressure, the oil recovery percentage of the low-permeability sandpack model at 20 MPa is 100%, and this study finds that injection–production coupling is the main way to develop the recoverable oil in a low-permeability reservoir. The numerical simulation results show that among the four remaining oil distribution types (interwell-enriched, low-permeability zone-enriched, well network imperfection, and mismatch between injection and production), the interwell-enriched type of the remaining oil reserves accounts for the highest proportion (48.52%). The simulation results of the mechanism model show that water-driven development easily leads to streamline solidification, resulting in ineffective circulation of the injected water. Compared with conventional water-driven development, the pressure propagation range is significantly increased in injection–production coupling development. The reservoir streamline distribution is more continuous and uniform, and the flooding wave is wider in volume and range. This research provides a theoretical basis for the injection–production coupling technology policy in complex fault-block reservoirs.

1. Introduction

Due to increasing global energy demand and the continuous consumption of world crude oil reserves, it has been difficult to efficiently exploit and utilize conventional oil and gas resources, as was done in the early 20th century. In 2022, China’s external oil dependence exceeded 70%, and the exploration of high-quality oil and gas resources was urgent. Unconventional oil and gas resources in China have very broad exploration prospects [1,2,3,4,5]. In recent years, with the continuous improvement of technology and the deepening of exploration and study, unconventional oil and gas resources have become an important force supporting the sustained development of industrial modernization in our country [6]. However, due to complex geological structures, strong heterogeneity, the poor physical properties of reservoirs, the difficult realization of water-driven displacement systems, and rapid productivity declines in the late stage of development, the reservoir matrix is difficult to use, and the reservoir development effect is not ideal [7,8,9]. Therefore, conventional water-driven reservoirs are no longer suitable for high-water-cut reservoirs in the middle and late stages of development.
At present, the mainstream development methods of unconventional reservoirs based on the multistage volume transformation of horizontal wells include depletion (elastic) exploitation, water-driven development, injection–production coupling development in late depletion development, huff-n-puff gas injection development, etc. [10,11,12]. Water-injection coupled mining is an important development mode in the later stage of an oilfield. The mode of “only injection without production and pressure-maintaining and stewing injection” breaks the single seepage channel formed in the original conventional injection–production mode, making the superior channel formed between injection–production wells due to reservoir heterogeneity no longer obvious and forming a radial pressure gradient drop from the injection well to the surrounding area (Figure 1). The reservoir pressure is constantly changing during the injection–production coupling process. In each coupling cycle, the injected water body is likely to continue to break through to the area outside the previous channel, expanding the swept volume and scope of the injected water and realizing the effective potential of the remaining oil [13,14].
Some progress has been made in experimental research on the seepage law of 2D sandpack models and the coupling of injection and production in complex fault-block reservoirs of unconventional oil and gas. Experts and scholars have carried out laboratory experiments with physical models on the coupling development and adjustment of the Paleogene fault-block reservoir in the Jiyang Depression, Bohai Bay Basin, and found that coupling technology can play a similar role in “profile control”, which can increase the water drive diversion rate of the low-permeability core to 18.6% in the period of high water-cut, effectively expanding the water-driven conformance coefficient and improving the oil drive efficiency [15]. Taking a typical dynamic coupled injection–production unit well group of fault-block reservoirs as an example, other authors adopted the multifactor analysis method to find that the development characteristics of short injection and long production are more suitable for multiple rounds of development, the expansion coefficient of periodic injection water is stable at 1.1–1.2, the intervention time should be kept in the low-water-cut period, and the development effect is the key cycle of the first cycle of coupled injection and production [16]. Sun (2019) used the sandpack model to carry out an injection–production coupling model experiment and analyzed the influence of elastic energy on the effect of enhanced oil recovery. The study found that the remaining elastic energy in the sand-filled model could still drive out crude oil after closing the outlet and holding the pressure for energy storage, and the total oil recovery was increased by 19.48% [17]. Another researcher established a numerical model of a triangular closed fault-block reservoir to analyze the pressure, remaining oil saturation, and flow rate of each characteristic block during the injection–production process. The study showed that the injection–production coupling technology can change the flow field in a reservoir to expand the water’s swept volume and improve the residual oil production efficiency of complex fault-block reservoirs [18]. Compared with conventional continuous water-driven methods, the injection–production coupling technology can significantly change the spread range of an existing flow line and improve the utilization effect of the remaining oil in low-permeability areas [19].
Different from conventional fractured carbonate reservoirs and low-permeability reservoirs, complex fault-block reservoirs are characterized by poor physical properties, more complex structural development, loose reservoir lithology, and strong microscopic heterogeneity [20,21,22,23]. The mechanisms by which injection–production coupling development improves the water-driven development effect of complex fault-block reservoirs and the oil production characteristics of heterogeneous reservoirs have not been deeply studied. Based on this, this study took the complex fault-block reservoir in the Biyang Depression, Nanxiang Basin, as the research object; comprehensively evaluated the distribution characteristics of the remaining oil in the study area; used the sandpack model as a medium to determine the impact of the injection–production coupling development of complex reservoirs after being water-driven on the crude oil production effect and oil recovery efficiency of reservoirs with different permeability levels; and combined their geological characteristics with the distribution characteristics of the remaining oil. The mechanism by which injection–production coupling enhances oil recovery was studied via numerical simulation to achieve balanced multilayer production in the reservoir and provide a theoretical basis for the policy of alternating injection–production coupling technology between lower layers under different reservoir conditions.

2. Physical Simulation Experiment

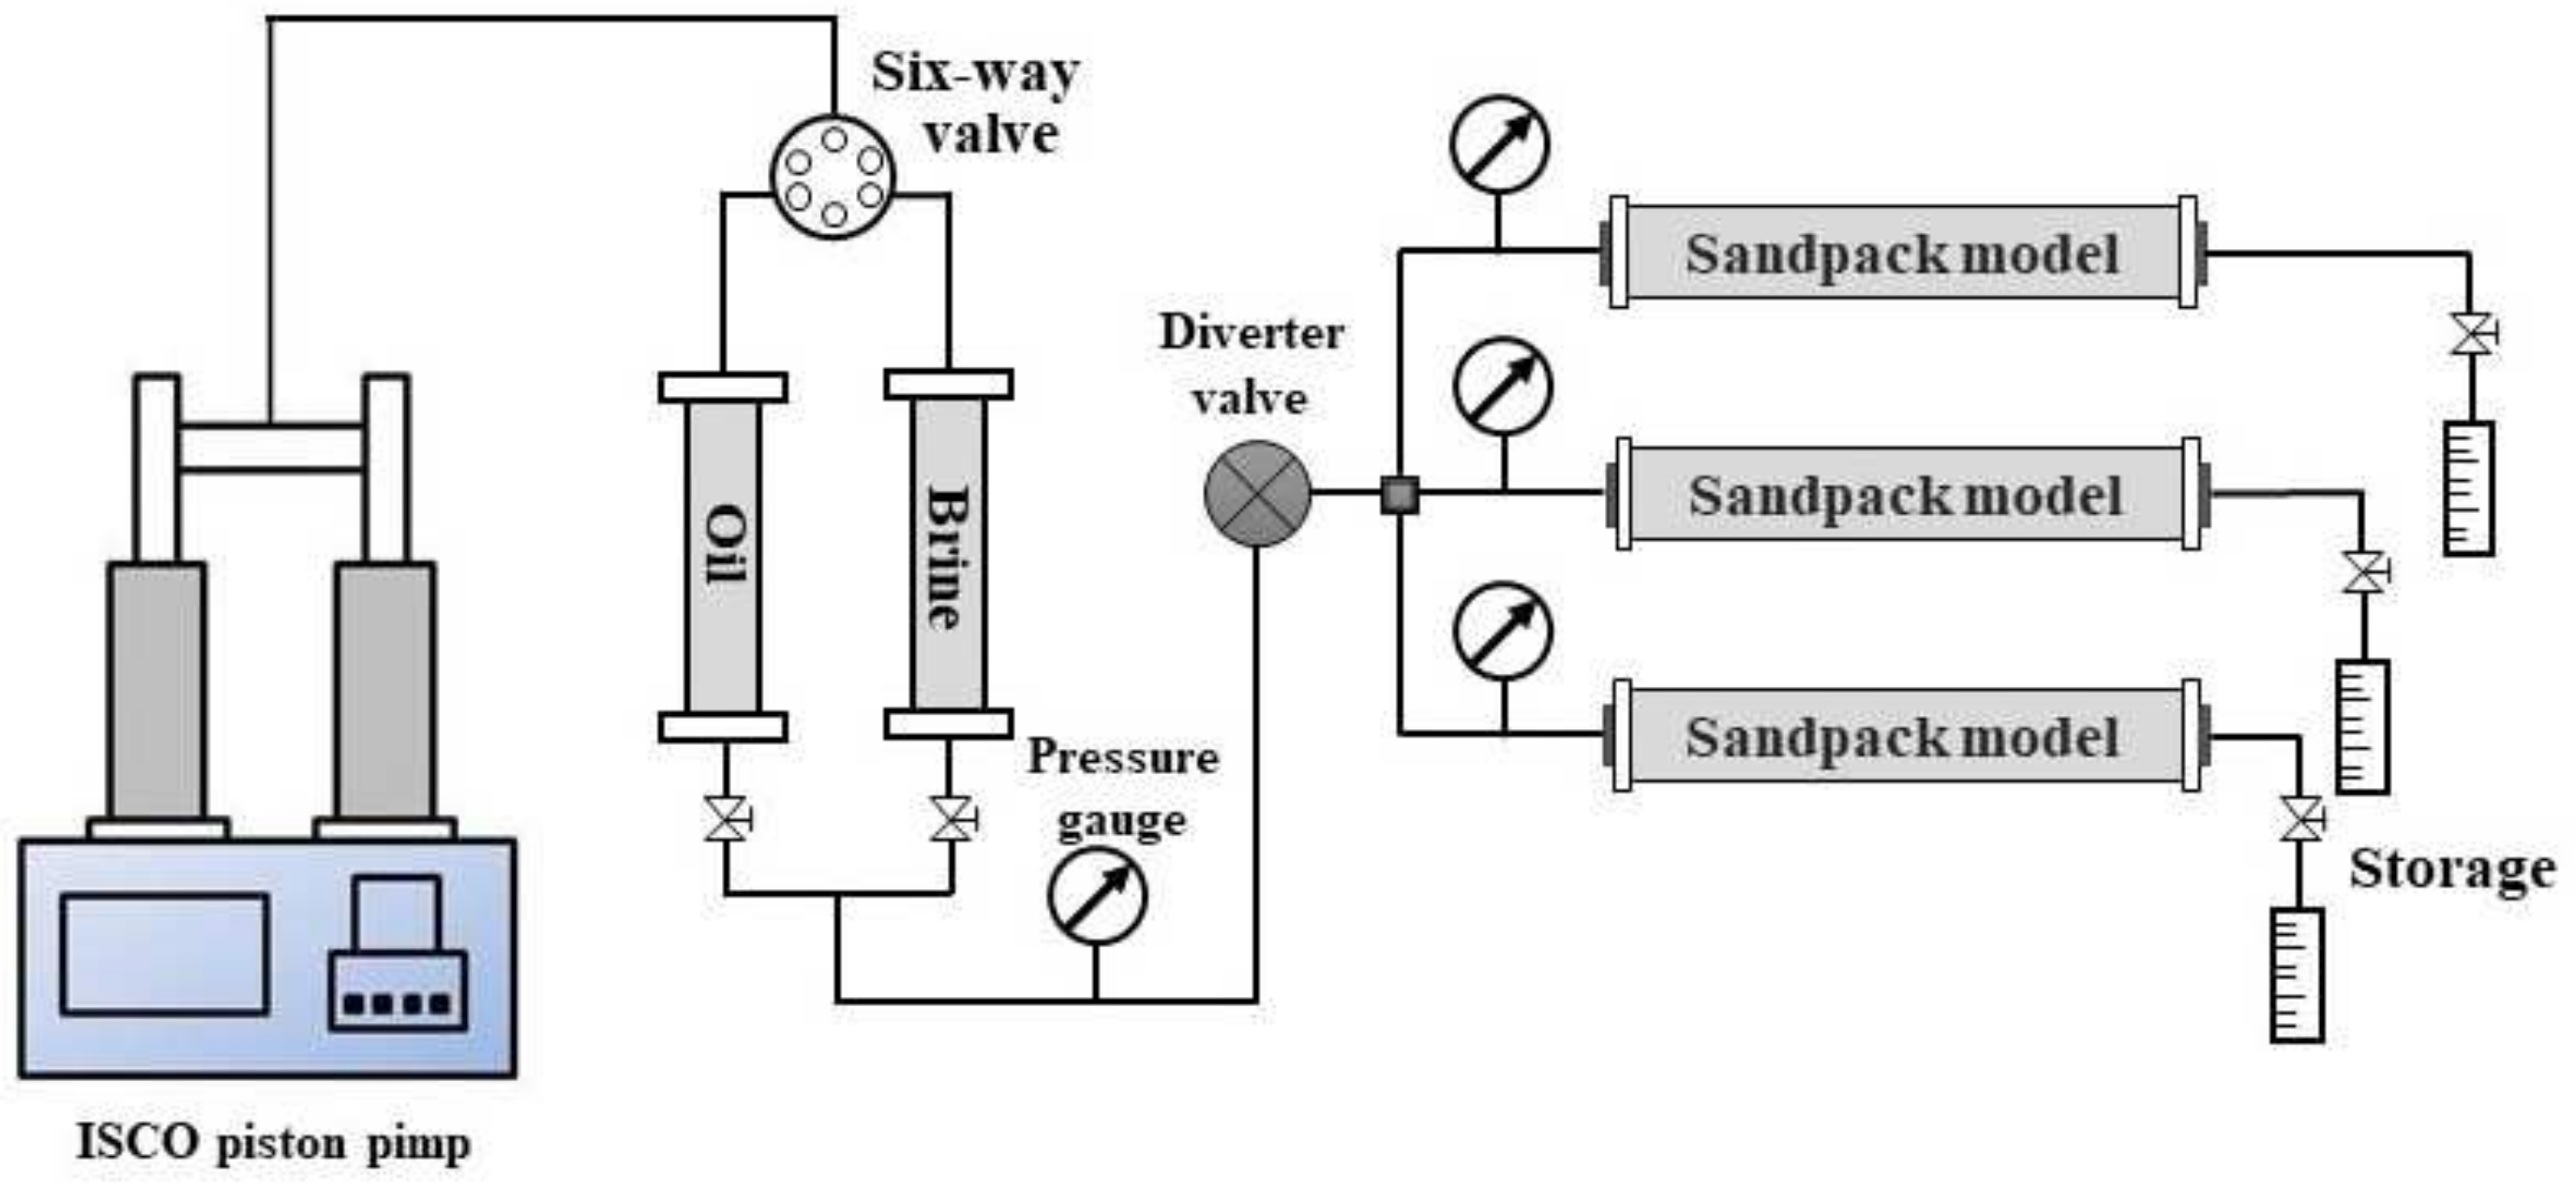
2.1. Experimental Apparatus

Because an experiment with a large physical model could not realize pressure monitoring during the injection–production coupling process [24,25], the sandpack model was designed to carry out the experiment. The sandpack pipe was manufactured by Nantong Huaxing Petroleum Instrument Company (Nantong, China). The length of a single pipe was 500 mm, the inner diameter was 40 mm, and the calculated volume was 602.88 mL. The maximum pressure of the model was 50 MPa, and the maximum temperature was 150 °C (Figure 2).

2.2. Experimental Material

The simulated formation water used in the experiment was configured according to the test results, and the salinity was 25,000 mg/L. The simulated crude oil used in the experiment was obtained by mixing 124 lower layers of dehydrated crude oil and kerosene at 1:2 in the Gucheng Oilfield, and the viscosity of the simulated crude oil was 6.73 mPa·s under laboratory conditions (24.5 °C and 0.1 MPa). The sandpack material was selected from the quartz sand used in the laboratory, and the number of sand grains ranged from 10 to 200 mesh, corresponding to the converted particle size range of 0.045–0.85 mm. Before the injection–production coupling experiment, quartz sand with different mesh ratios was placed in the sandpack pipe and compacted. The permeability of the sandpack model with different ratios was measured using a flow meter. After multiple cycles of comparative testing, the ratio of quartz sand needed to meet the permeability parameters set for the experiment was obtained (Table 1).

2.3. Experimental Process

(1)
The sandpack model was numbered, and the displacement device of the sandpack model was connected according to the experimental design requirements.
(2)
When the formation water was saturated at a rate of 0.10 mL/min and the liquid output was approximately 3–4 PV, the internal pores of the sandpack model were considered to be completely saturated. The porosity and permeability were calculated according to the mass difference before and after the formation water saturated the model (Figure 3).
(3)
When the simulated crude oil was saturated at a displacement rate of 0.10 mL/min, the core was considered to be completely saturated when the simulated crude oil was completely discharged from the outlet, and the original oil–water distribution of the reservoir was established.
(4)
The displacement device was connected to the sandpack model, and the formation water was injected into the model at a rate of 0.10 mL/min to displace the simulated crude oil. When there was no more simulated crude oil flowing out of the outlet and the liquid output was approximately 3–4 PV, it was considered that the water-cut limit had been reached, and the water-driven volume limit was recorded with the measuring cylinder (Figure 4).
(5)
The outlet end was closed, the injection–production coupling test pressure was set, and the overall pressure of the sandpack model was raised to the experimental set value at a flow rate of 0.10 mL/min. After stabilizing for 30 min, the inlet end was closed, and the simulated well was standing for 24 h. The outlet was opened until there was no more liquid flowing out of each sandpack model, and the amount of liquid flowing out was recorded. The above experiments were repeated to carry out several cycles of injection–production coupling simulation experiments under different pressure conditions.
(6)
The experimental instruments were cleaned, and the experiment was ended.
Figure 3. Injection–production coupling displacement experiment.
Energies 17 01505 g003
Figure 4. Experiment equipment.
Energies 17 01505 g004

2.4. Results

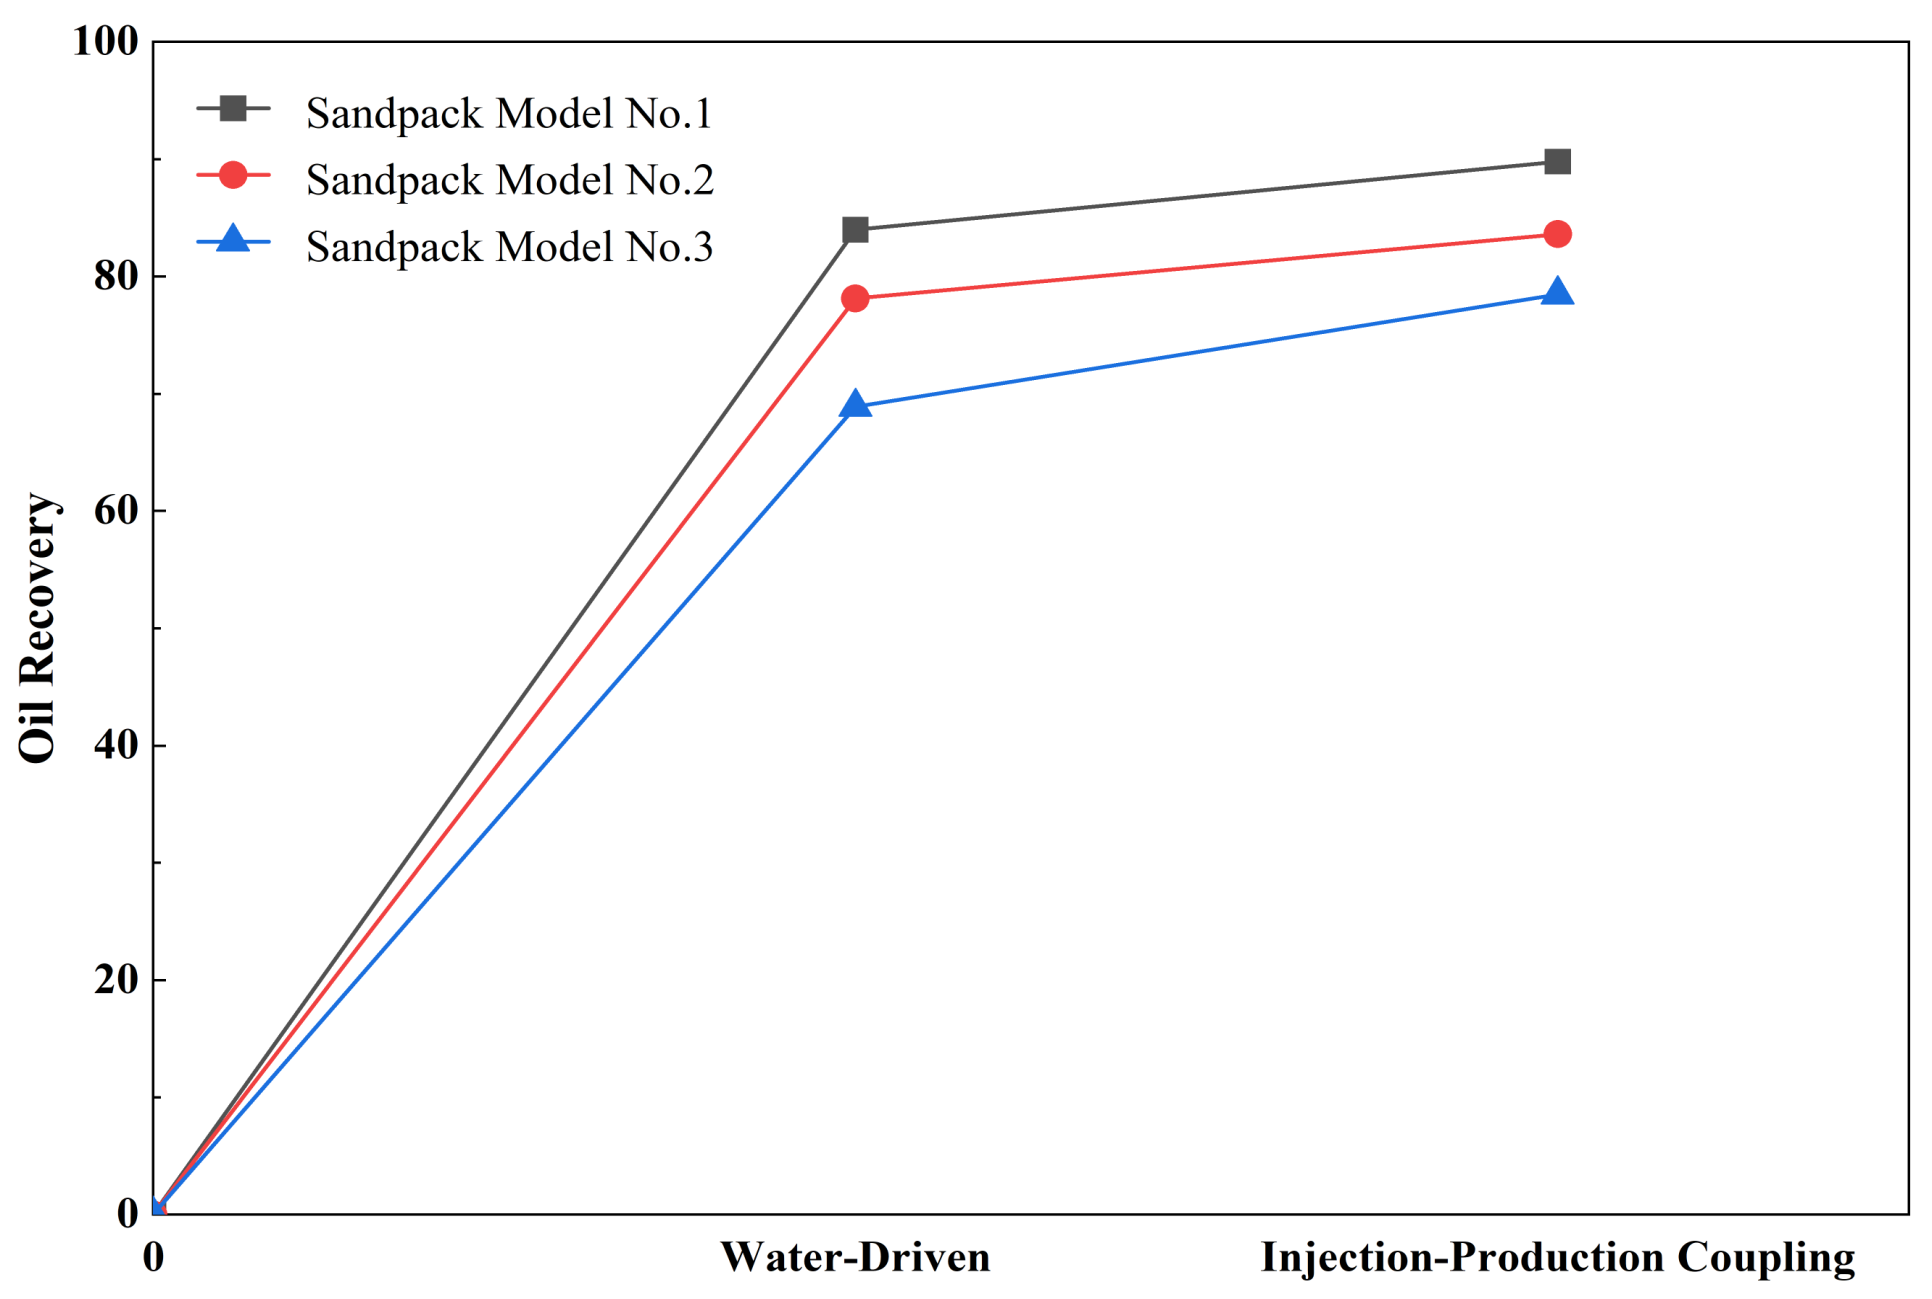
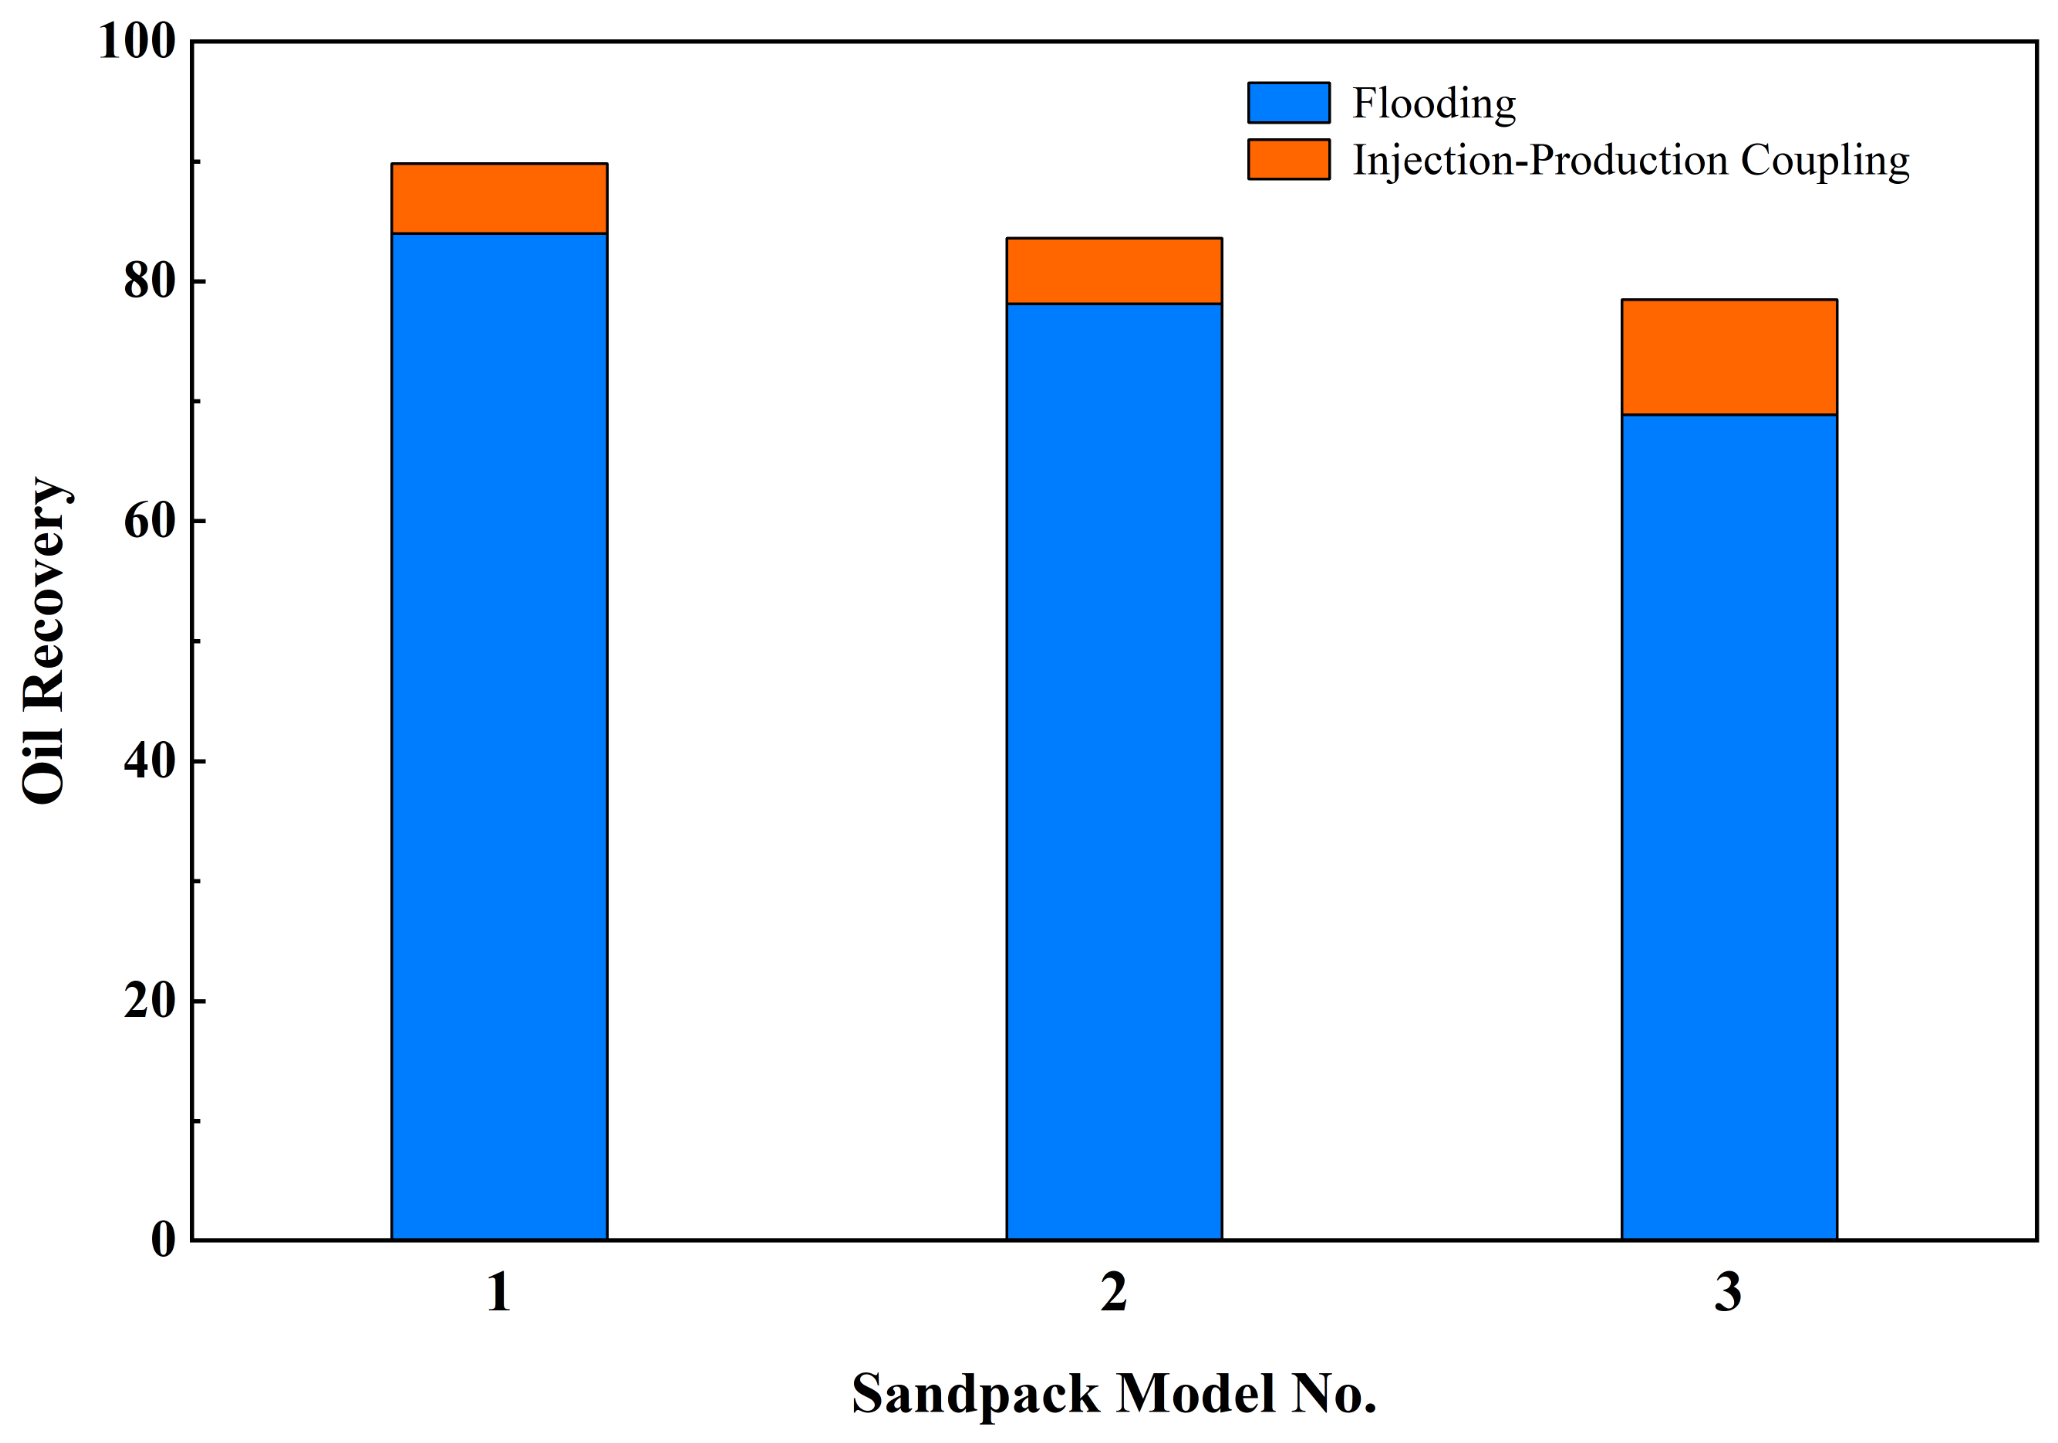
2.4.1. Single-Layer Injection–Production Coupling Experiment

Three kinds of sandpack models with different permeability levels were subjected to an indoor physical simulation of injection–production coupling after being water-driven to the water-cut limit, and the oil extraction effect was evaluated. According to an analysis of the single-layer coupled recovery efficiency of the sandpack model under different permeability conditions (Figure 5), there was a positive correlation between the oil recovery effect and the permeability of the sandpack model as a whole. The higher the permeability of the model, the higher the oil displacement and recovery effect. However, the coupled injection recoveries of sandpack models No. 2 and No. 3, with relatively low permeabilities, were only 83.61% and 78.47%, respectively.
By comparing the oil recovery efficiency of the two oil-displacement and extraction modes of different sandpack models (Figure 6), it can be seen that since the single-layer sandpack model did not have a disturbance effect caused by other intervals during the experiment, and the oil recovery efficiency of the sandpack models of each permeability level reached a high level under extreme water-driven conditions. After being water-driven, the cumulative recovery rate of the three types of sandpack models increased from 68.89% to 83.98%, and the average recovery rate increased by 77%. After the injection–production coupling experiment, some crude oil was still driven out in different models. The recovery rate of sandpack model No. 3, with the lowest permeability, increased by 9.57% after the injection–production coupling method, while the recovery rates of sandpack models No. 1 and No. 2 were only 5.81% and 5.47%, respectively, indicating that for low-permeability unconventional reservoirs, injection–production coupling development can achieve the effect of improving water-driven recovery.

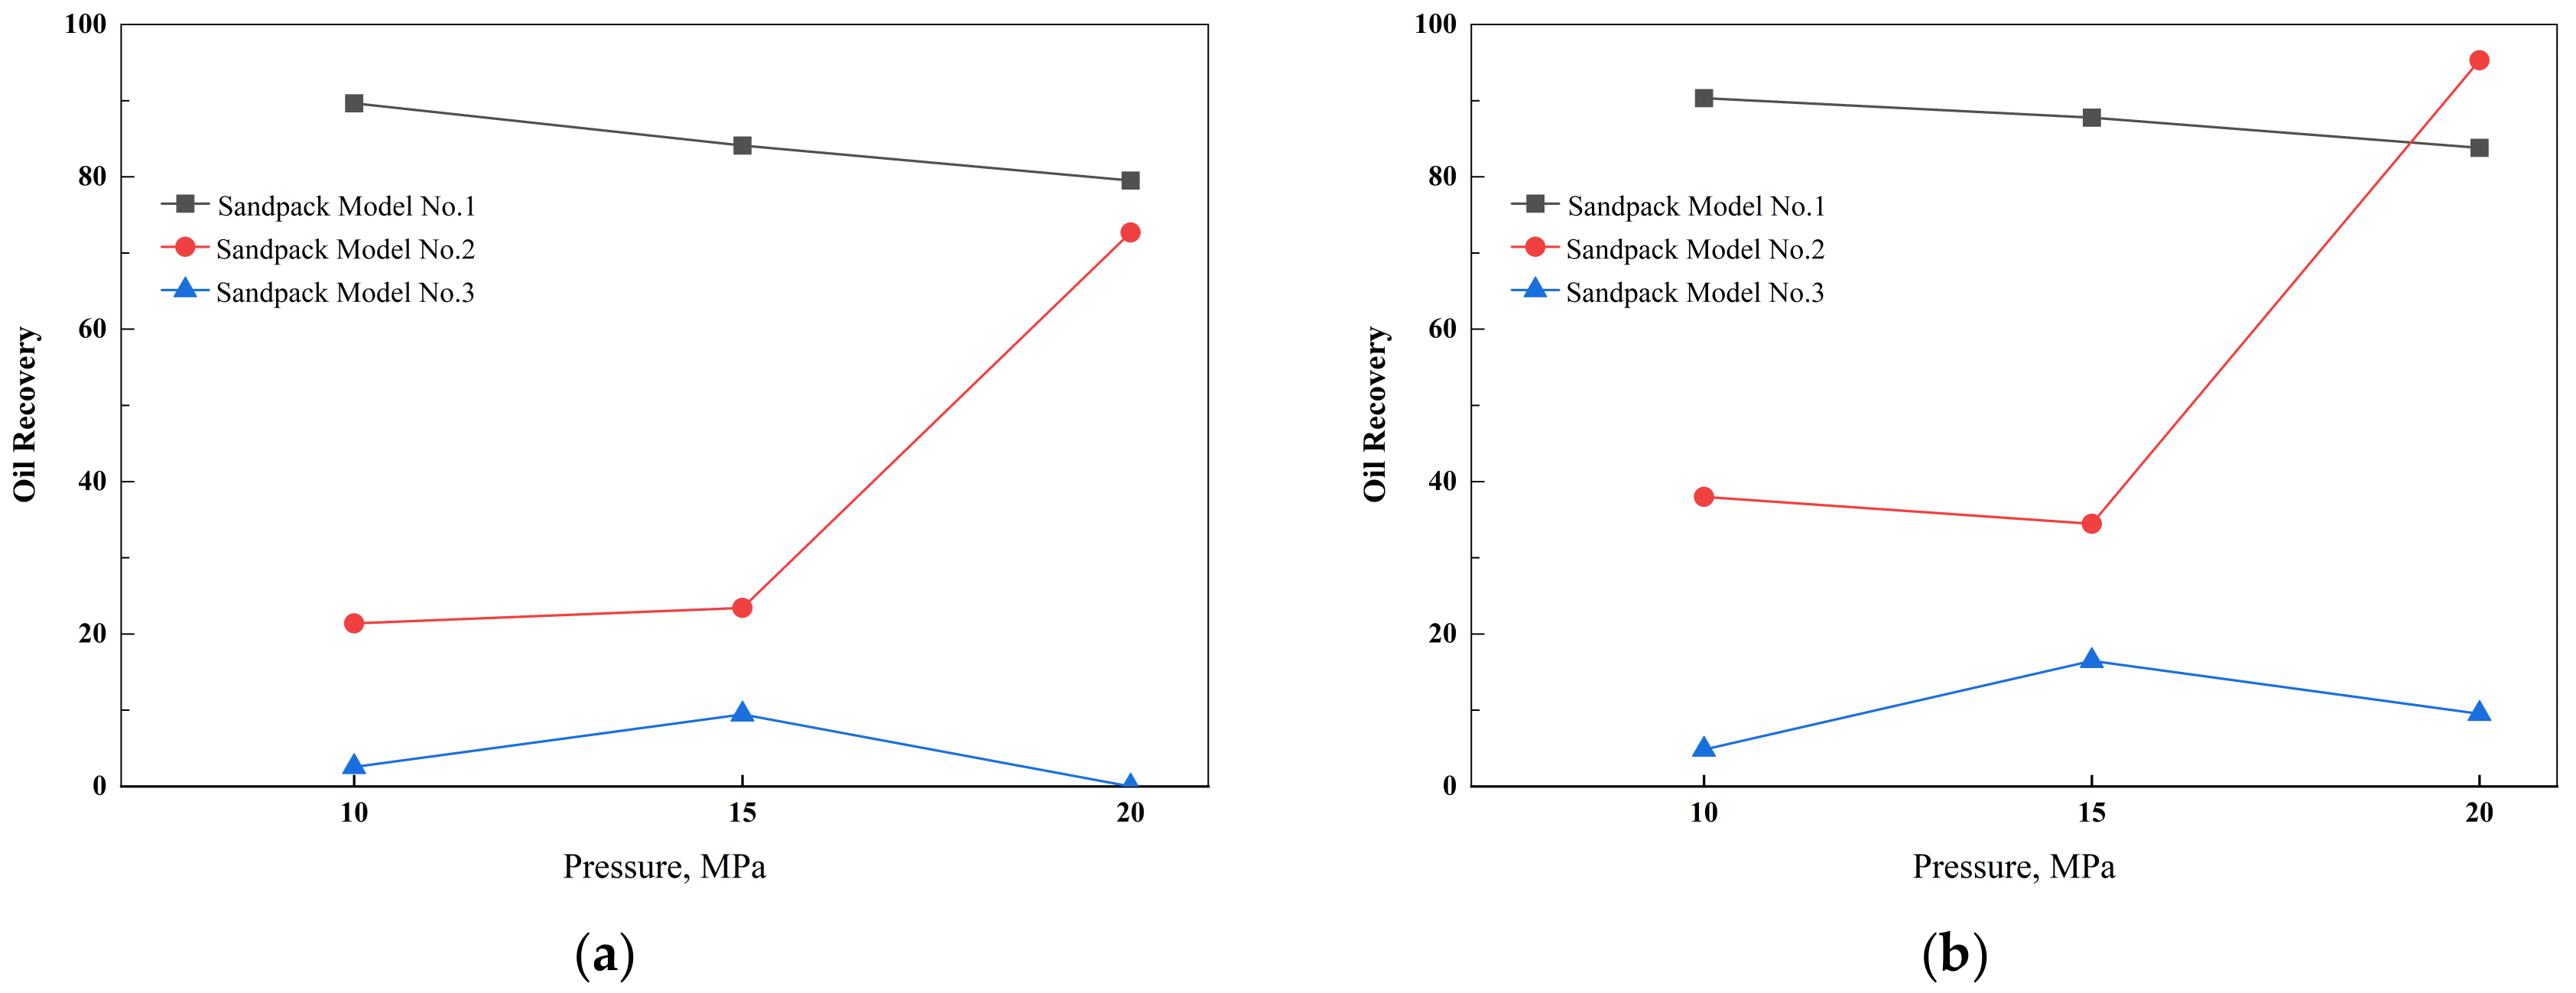
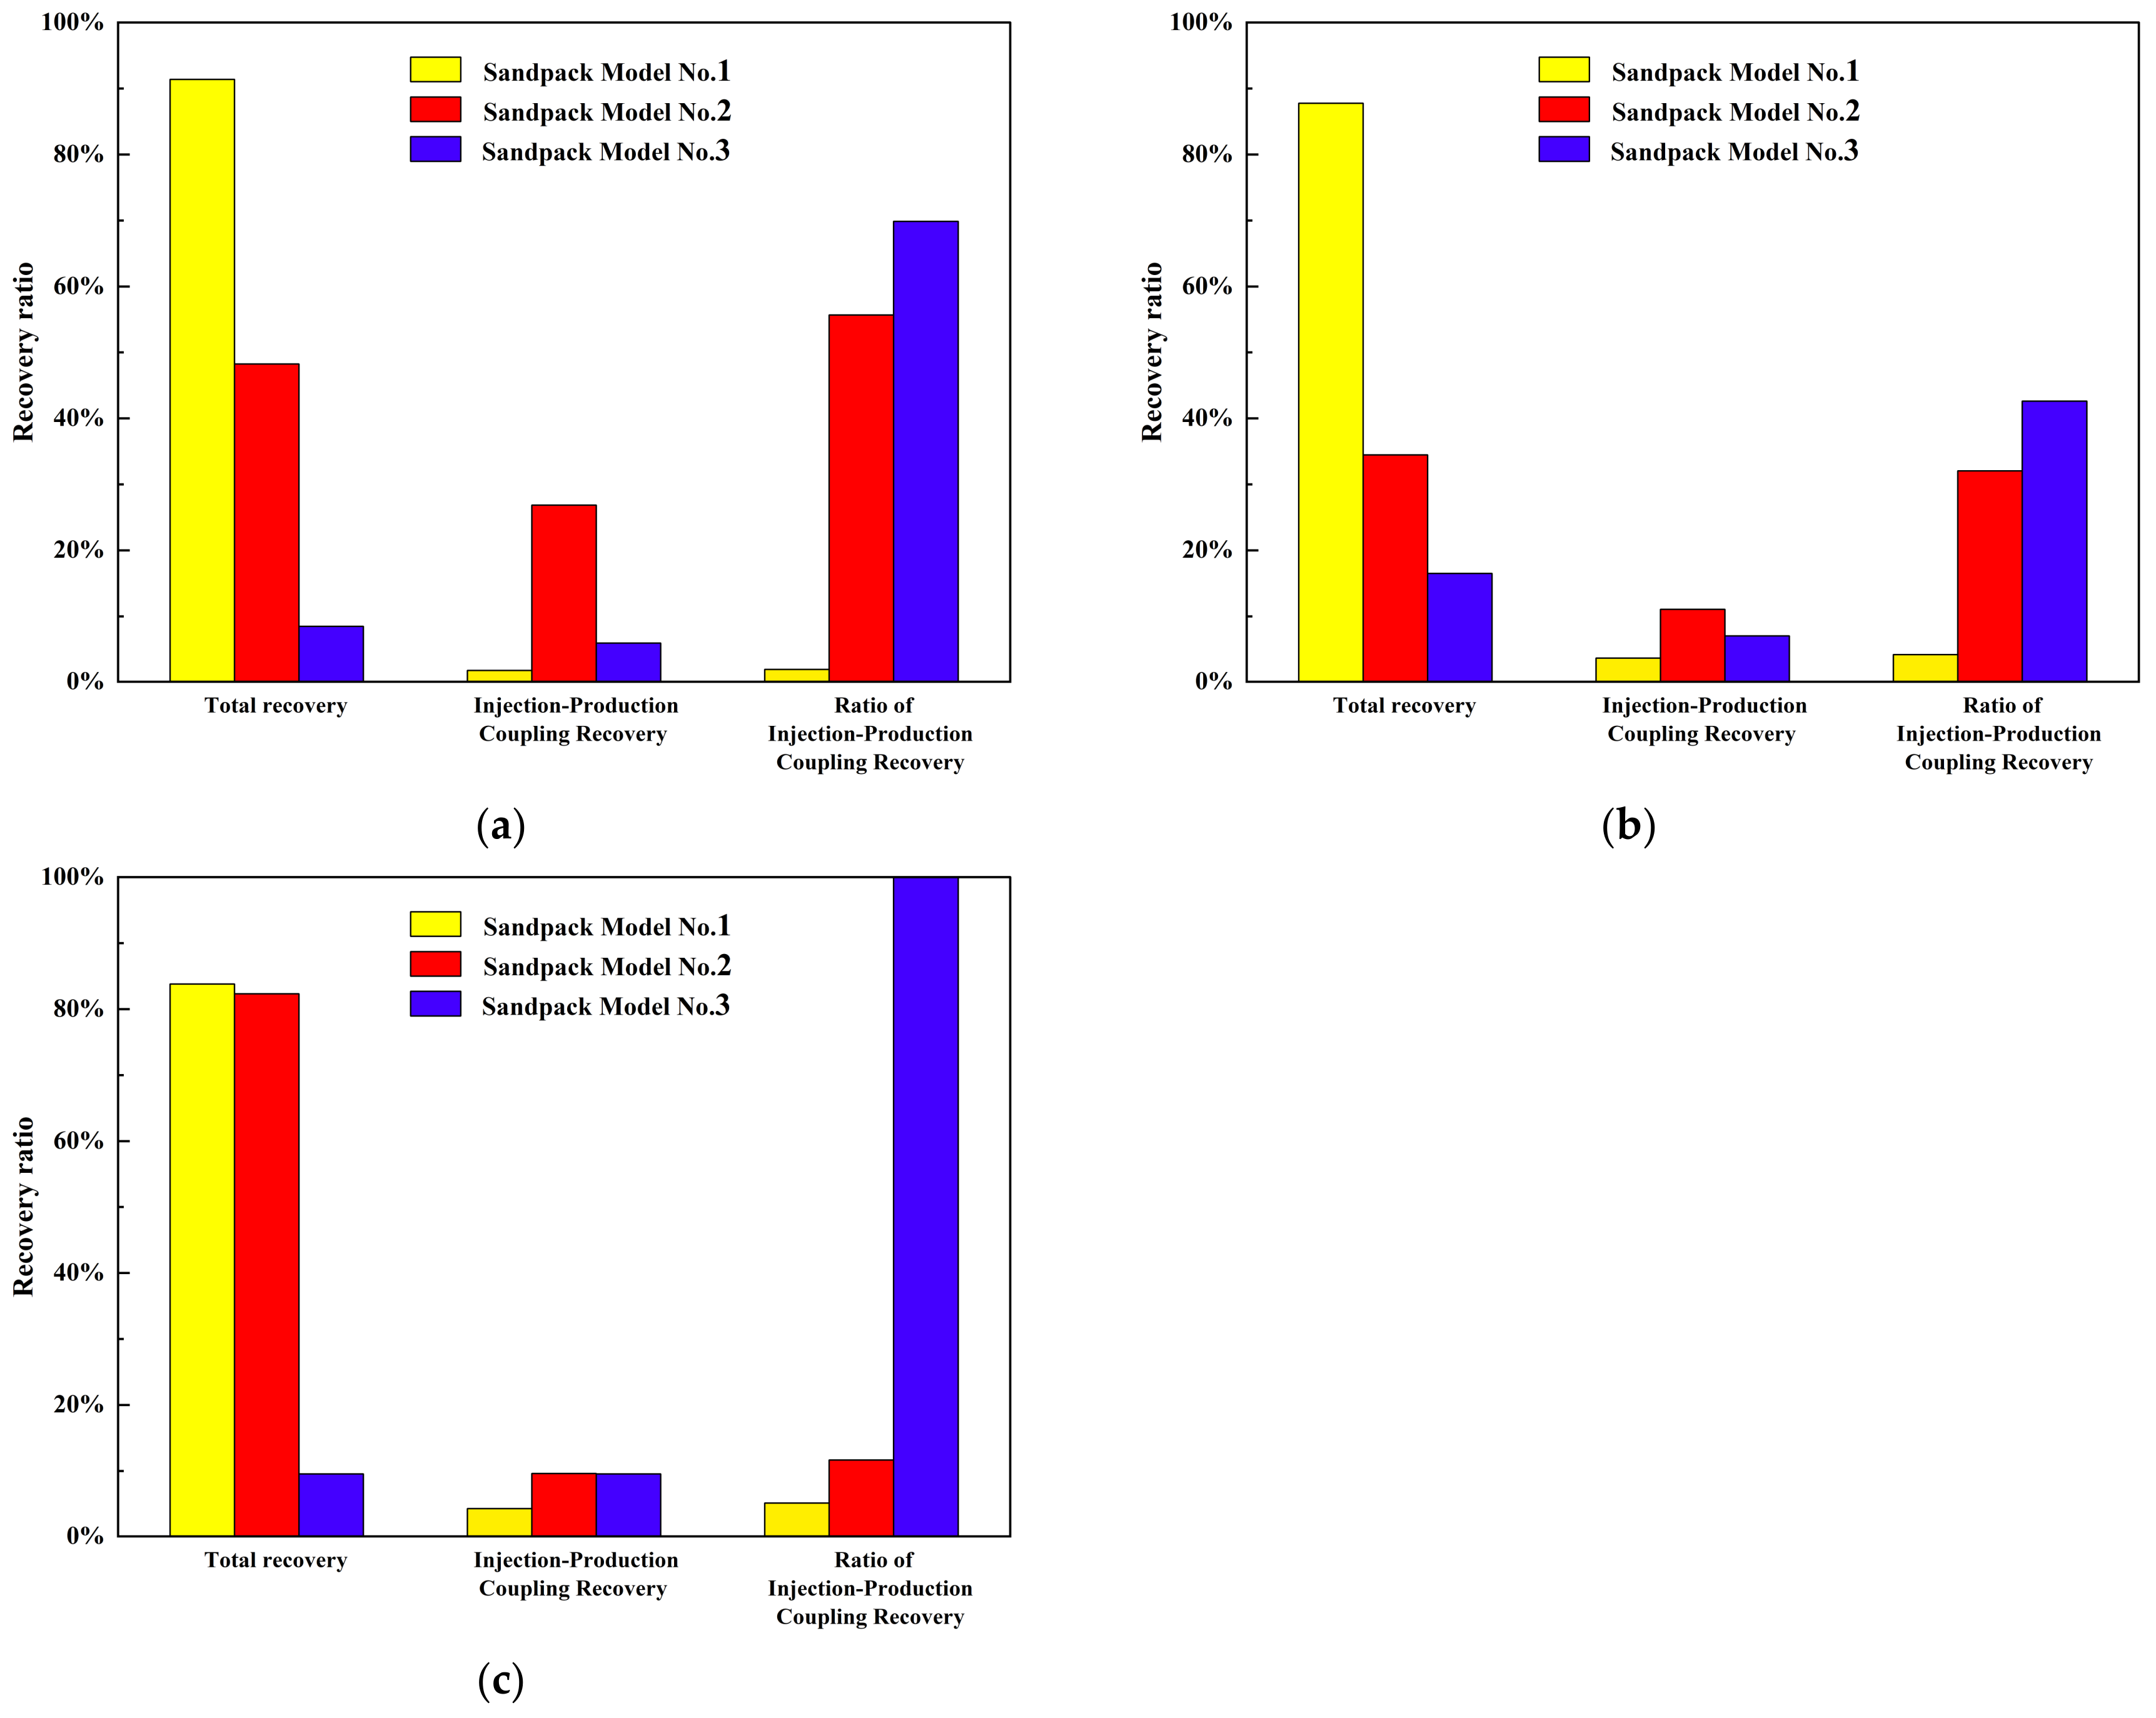
2.4.2. Multilayer Injection–Production Coupling Model Experiment

Different from the single-layer injection–production coupling experiment, the multilayer injection–production coupling experiment simulated and analyzed the variation characteristics of oil recovery from multiple layers with different permeability levels in the same flow field by connecting different permeability levels to the sandpack model in parallel, making it uniformly controlled by the same injection–production system. The effects of different injection pressures and injection–production coupling test cycles on oil recovery were quantitatively evaluated.

Impact of Injection Pressure

According to the oil recovery efficiency of the conventional water-driven stage coupled with injection and production under different injection pressure conditions (Figure 7), the three types of sandpack models showed different change trends with increasing injection pressure. As shown in Figure 7a, in the conventional water-driven stage, when the injection pressure reached 10 MPa, the oil recovery rate of sandpack model No. 1 was 89.66%, and when the pressure continued to increase to 15 MPa and 20 MPa, the oil recovery rate dropped to 84.13% and 79.52%, respectively, indicating that with increasing injection pressure, the oil recovery rate of sandpack model No. 1 was 89.66%. Sandpack model No. 1, with relatively high permeability, did not improve significantly, but the oil displacement efficiency showed a decreasing trend. For sandpack model No. 2, when the injection pressure increased from 10 MPa to 15 MPa, the oil recovery rate only increased by 2.03% (from 21.4% to 23.43%), while when the injection pressure increased to 20 MPa, the oil recovery rate increased to 72.71%. With increasing injection pressure, the water-driven effect of the medium-permeability sandpack model was significantly improved. Sandpack model No. 3 had the lowest permeability, and its oil recovery rate first increased and then decreased with increasing injection pressure. When the injection pressure was 10 MPa, the oil recovery rate was only 2.55%, and when the injection pressure was increased to 15 MPa, the oil recovery rate was 9.46%. However, when the pressure continued to increase to 20 MPa, no simulated oil was expelled in model No. 3, indicating that increasing the injection pressure had no obvious effect on the oil displacement and recovery of the low-permeability sand model.
Figure 7b further presents the variation in oil recovery with increasing injection pressure for the different permeability levels of the sand-filled models after the injection–production coupling methods. The oil recovery efficiencies of all three types of sandpack models increased to different degrees. Among them, the oil recovery rate of sandpack model No. 2 increased significantly. When the injection pressure was 10 MPa, the oil recovery rate increased from 21.4% to 38.01% after the water-driven flow. Although the recovery rate decreased with increasing injection pressure, the recovery rate after injection–production coupling still reached 34.48%, an increase of 11.05% compared with the value of 23.43% observed during water-driven coupling. When the injection pressure increased from 15 MPa to 20 MPa, the oil recovery increased from 72.71% to 95.32%. It is worth noting that sandpack model No. 3 also expelled the simulated crude oil during the water-driven experiment with an injection pressure of 20 MPa, but the oil recovery rate reached 9.53% after injection–production coupling. However, sandpack model No. 1, with the highest permeability, had a poor extraction effect after injection–production coupling.

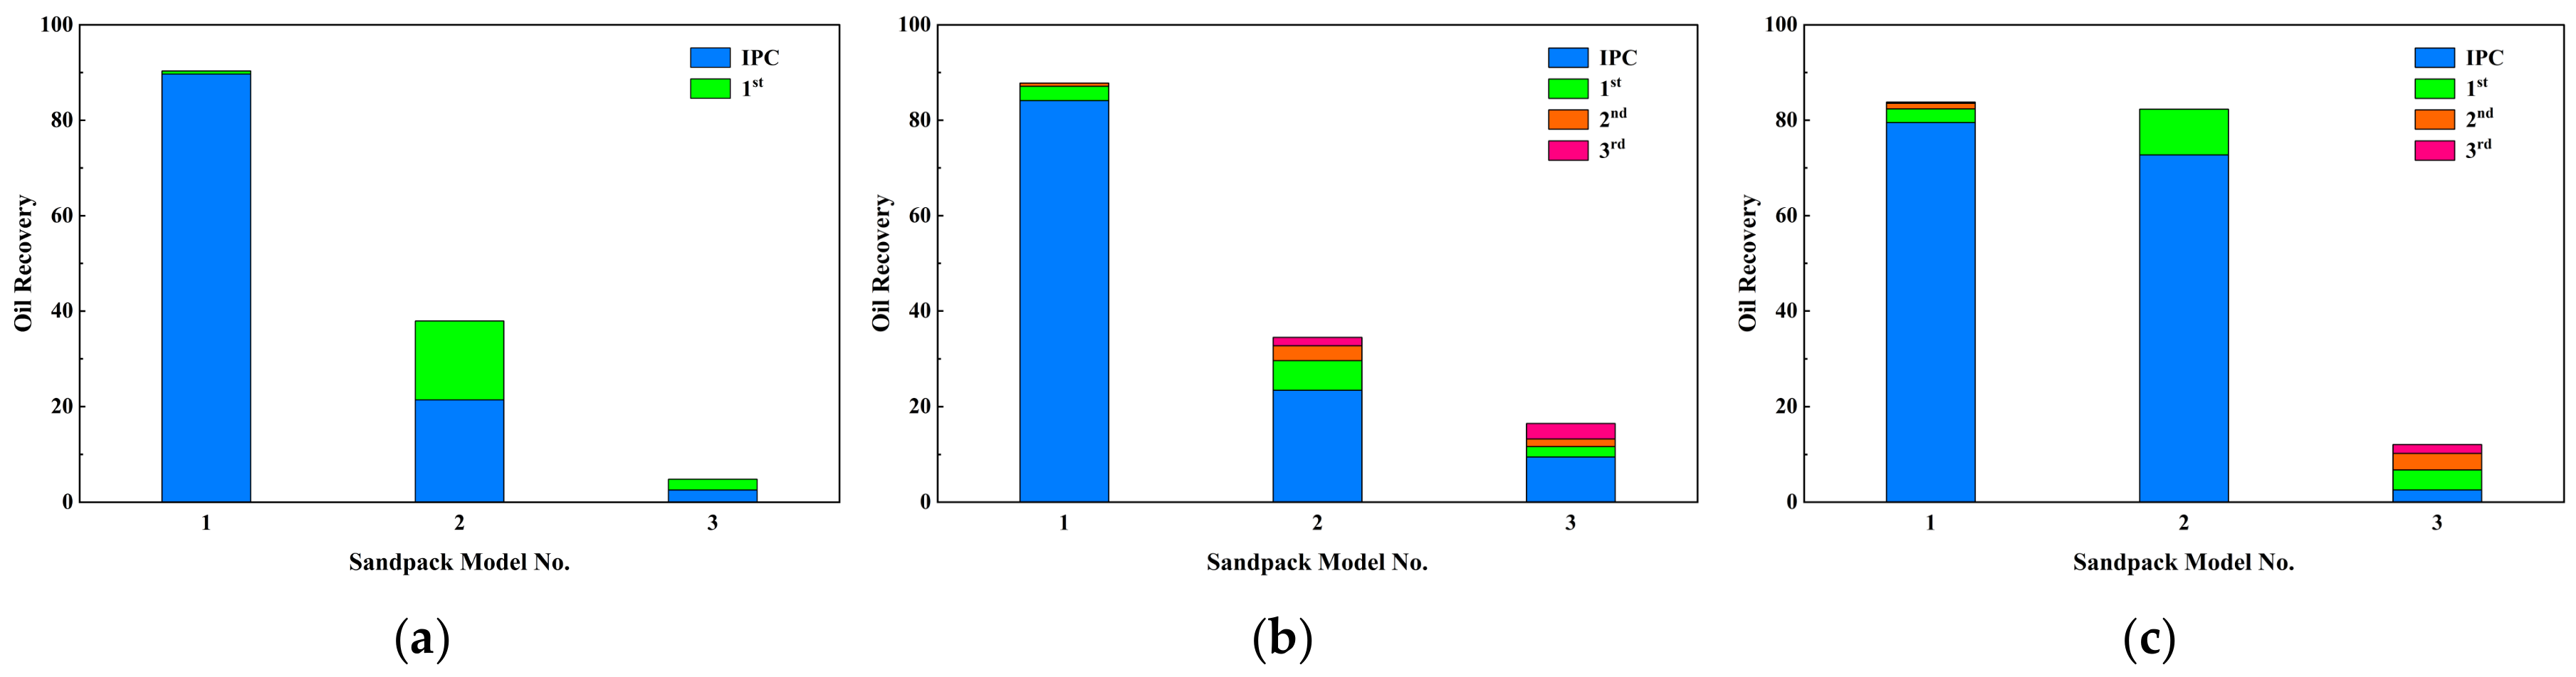
Impact of Coupling Cycles

For the actual development process of injection–production coupling in unconventional reservoirs, it is necessary to consider how many coupling experiments need to be carried out to achieve the desired level of oil recovery. Therefore, the determination of the number of coupling cycles is crucial to the influence of changing water-driven methods to injection–production coupling to enhance oil recovery in complex fault-block reservoirs. Considering that the determination of the optimal number of coupling cycles was not universal in the indoor physical simulation experiment of injection–production coupling, this experiment studied multiple cycles and multiple pressure points (10~20 MPa) for sandpack models with different permeabilities (0.286, 0.523, and 0.964 × 10⁻³ μm2). The relationship between the changes in recovery efficiency and system pressure and the coupled injection–production test cycles was plotted, as shown in Figure 8.
As shown in Figure 8a, for sandpack model No. 1, with high permeability, the effect of multiple water-driven injection–production couplings on oil recovery was not obvious. After three cycles of injection–production coupling, the cumulative increase in the recovery efficiency was only 0.68%, which was much lower than that of the conventional water-driven model (89.66%). After the first cycle of the injection–production coupling experiment, the recovery rate of sandpack model No. 2 was 16.51%, which was significantly higher than that of the conventional water-driven model. Compared with the first two types of sandpack models, whether the conventional water-driven method (oil recovery rate of 2.55%) or the injection–production coupling method (oil recovery rate of 2.28%) was adopted in model No. 3, the impact on the degree of recovery was not significant, and the degree of recovery is relatively low. This shows that the main contribution of the high-permeability sand model to the recovery of heterogeneous reservoirs under low coupled-injection pressure was from conventional water-driven flow, and the coupling of multiple cycles of injection and production did not significantly improve oil production. For the medium-permeability model, the injection–production coupling method greatly improved oil recovery. However, due to the low injection pressure, the effect of crude oil production on the low-permeability model was not obvious.
When the injection pressure reached 15 MPa, the effect of multiple injection–production couplings on oil recovery gradually became obvious, but the oil recovery rate decreased with each injection–production coupling. For model No. 2, with medium permeability, the recovery rate after the first cycle of injection–production coupling reached 6.17%, while those of models No. 1 and No. 3 were only 3.02% and 2.16%, respectively, but the recovery performance in subsequent cycles of injection–production coupling was significantly weaker than that of model No. 3. After the third cycle, the increase in recovery was very slow, indicating that very little simulated oil was expelled from the sandpack model (Figure 8b). It can be seen from the above analysis that with the increase in the standing injection pressure, the total recovery rate of the sandpack model with lower permeability increased more noticeably. After multiple cycles of injection–production coupling, some crude oil was still expelled from the medium- and low-permeability models, indicating that the multicycle coupling of injection and production had a good effect on oil recovery.
The water-driven recovery rates of sand-filled models No. 1, No. 2, and No. 3 at an injection pressure of 20 MPa were 79.52%, 72.71%, and 0.00%, respectively. After three cycles of injection–production coupling, the cumulative recovery rate of the three sandpack models increased from 4.29% to 9.61%, and the recovery rate of sandpack model No. 3, with the lowest permeability, reached 5.35% after two cycles of injection–production coupling, equivalent to 56.08% of the cumulative recovery rate of three cycles of injection–production coupling (Figure 8c). From the above analysis, it can be found that in this group of experiments, a new hyperpermeability channel was formed in the sand-filled model during the water-driven sweep process, which led to preferential flow to the dominant channel. Therefore, in the case of conventional water-driven oil, the water-driven recovery rates of the high- and medium-permeability sandpack models were similar, as both reached a high level, and oil could not be produced from the low-permeability sandpack model. Multiple cycles of injection coupled with the medium- and low-permeability sandpack models still left part of the oil to be effectively utilized, which indicates that after the end of conventional water-driven oil, injection can further improve the effect of the oil drive; the lower the permeability, the better the improvement.

2.4.3. Law of Injection–Production Coupling to Enhance Oil Recovery

Figure 9 compares the ratios of recovery efficiency of sandpack models with different permeabilities and pressures. The oil displacement and recovery effects of different sandpack models in the injection–production coupling modes showed different changing trends with increasing pressure. Due to the good physical properties of the reservoir, sandpack model No. 1 mainly used the water-driven method to use the oil in the reservoir, and the average total recovery rate of the water-driven method reached 84.44%. The effect of the injection and production coupling displacement on the oil displacement effect was very small, and the recovery ratio was 3.73%, which was almost an insignificant improvement. For sandpack model No. 2, the total oil recovery rates at 10 MPa, 15 MPa, and 20 MPa were 48.26%, 34.48%, and 82.32%, respectively. Although the total recovery rate was not the highest at 10 MPa, the oil production effect was still the best in the injection–production coupling stage, and the combined extraction ratio reached 55.66%. When the injection pressure was increased to 20 MPa, although the injection–production coupling recovery rate was still 9.61%, due to the dominant contribution of recovery in the water-driven stage, the recovery efficiency was not obvious after the later phase of injection–production coupling development. Sandpack model No. 3 had the lowest total recovery, which was closely related to the physical properties of the model. In the water-driven process, sandpack model No. 3 showed the same law as the first two types of models, and the fluid preferentially entered the hyperpermeability channel to displace crude oil (Figure 8c). However, after being water-driven, the coupling development of injection and production had the most significant impact on the oil displacement effect in the low-permeability model. In this case, all the crude oil was used from the coupling development of injection and production, and the proportion of enhanced oil recovery reached 100%. It can be seen that for sandpack model No. 3, with the lowest permeability, the worst physical property, and a strong degree of heterogeneity, the coupling development of water-driven transfer injection and production could effectively increase the oil production of the low-permeability reservoir and significantly improved the oil increase effect.

3. Injection–Production Coupling Numerical Simulation

A typical complex fault-block oil reservoir was selected: Block Bi124 of Gucheng Reservoir was taken as the research object to establish a fine geological model adapted to the geological characteristics of the reservoir, and numerical simulation methods were used to study the flow field of the flow line and the characteristics of the residual oil distribution and to classify and evaluate the potential of the residual oil. At the same time, combined with the actual development of Block Bi124, the optimal interlayer alternating injection–production coupling development parameter scheme was determined via numerical simulation.

3.1. Study of Streamline Field and Remaining Oil Distribution Characteristics

Combined with the geological characteristics of the study area and the dynamic and static data of oil and water wells, geological modeling was carried out on Block Bi124. The phased multiparameter collaborative constraint interpolation technique was applied to the model using Petrel software(Vision Number: Petrel2018.1) to establish the plane, fault plane, and 3D structural model. The plane model adopted a corner grid system, the grid step length was 5 m × 5 m, and the number of nodes was 314 × 200 × 193 = 1,212,0400. The longitudinal model was based on the stratification data and was combined with the construction contour data to establish a 29-level model including 28 sublayers (Table 2), with a certain degree of inheritance in the construction of each sublayer. By analyzing the existing fault data, the morphology and combination characteristics of the faults were determined, the spatial state of the faults was corrected, and the relationship between fault morphology and combination was finely described. The result is shown in Figure 10.

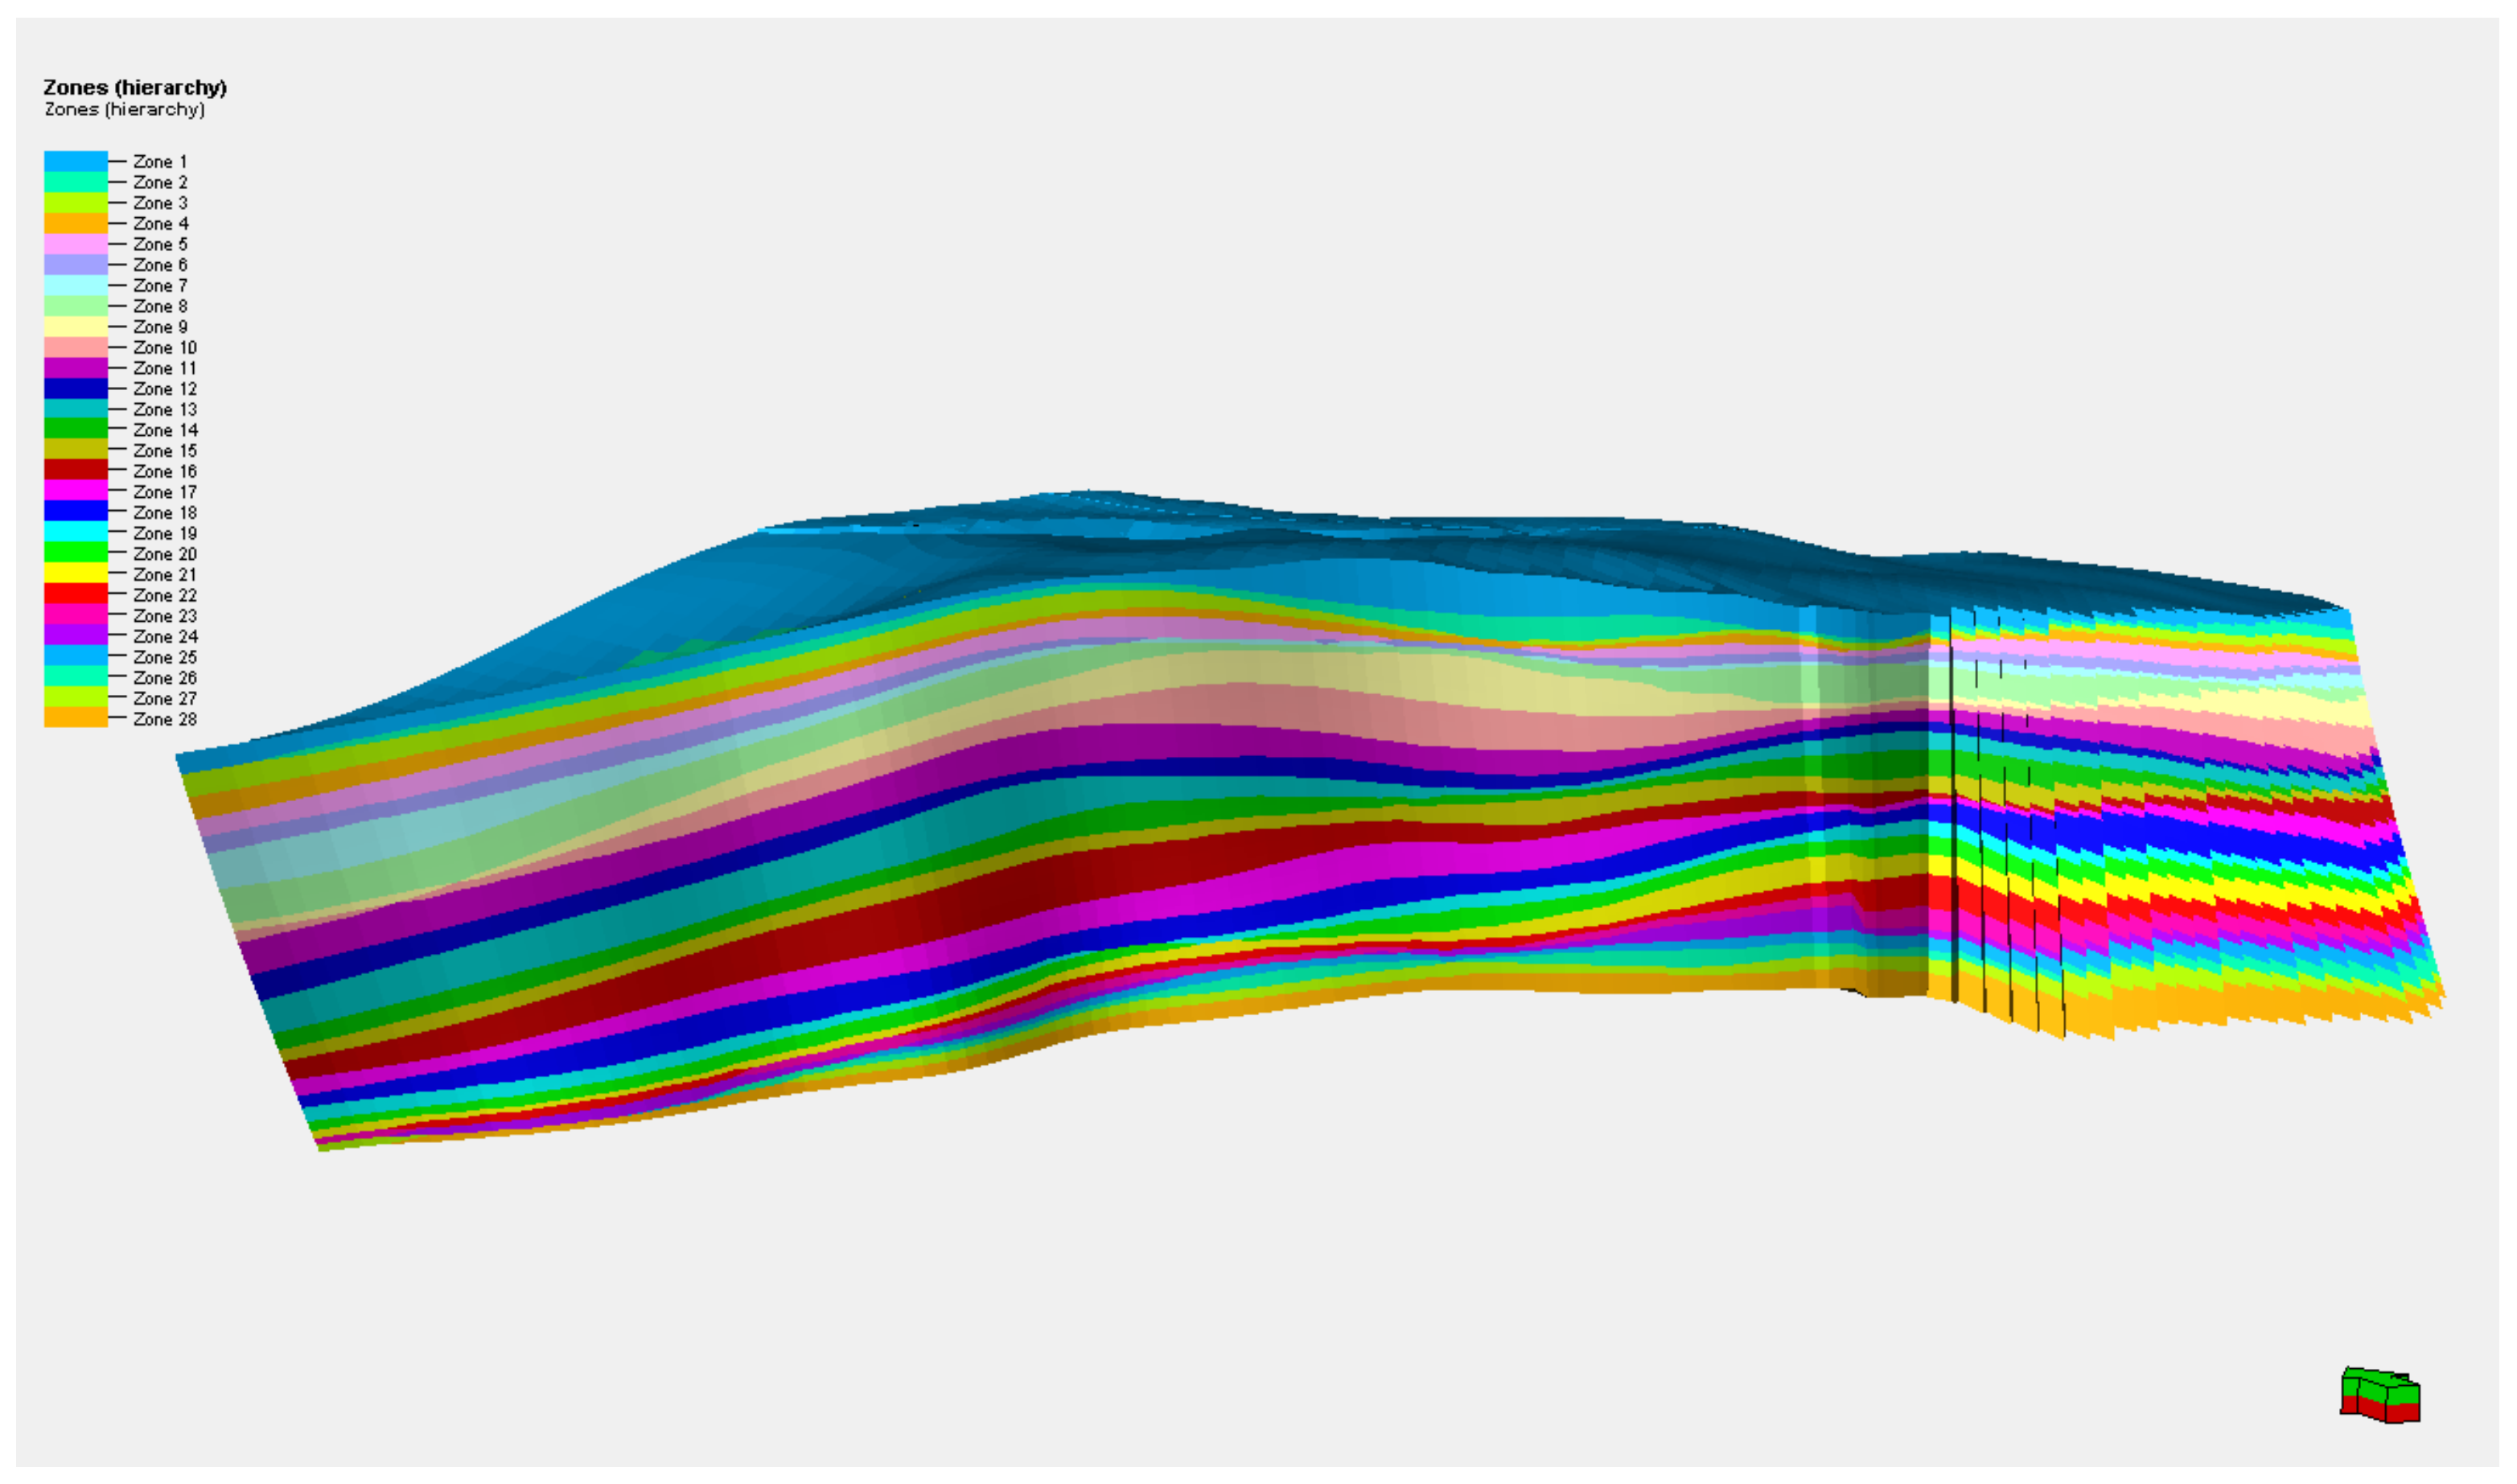
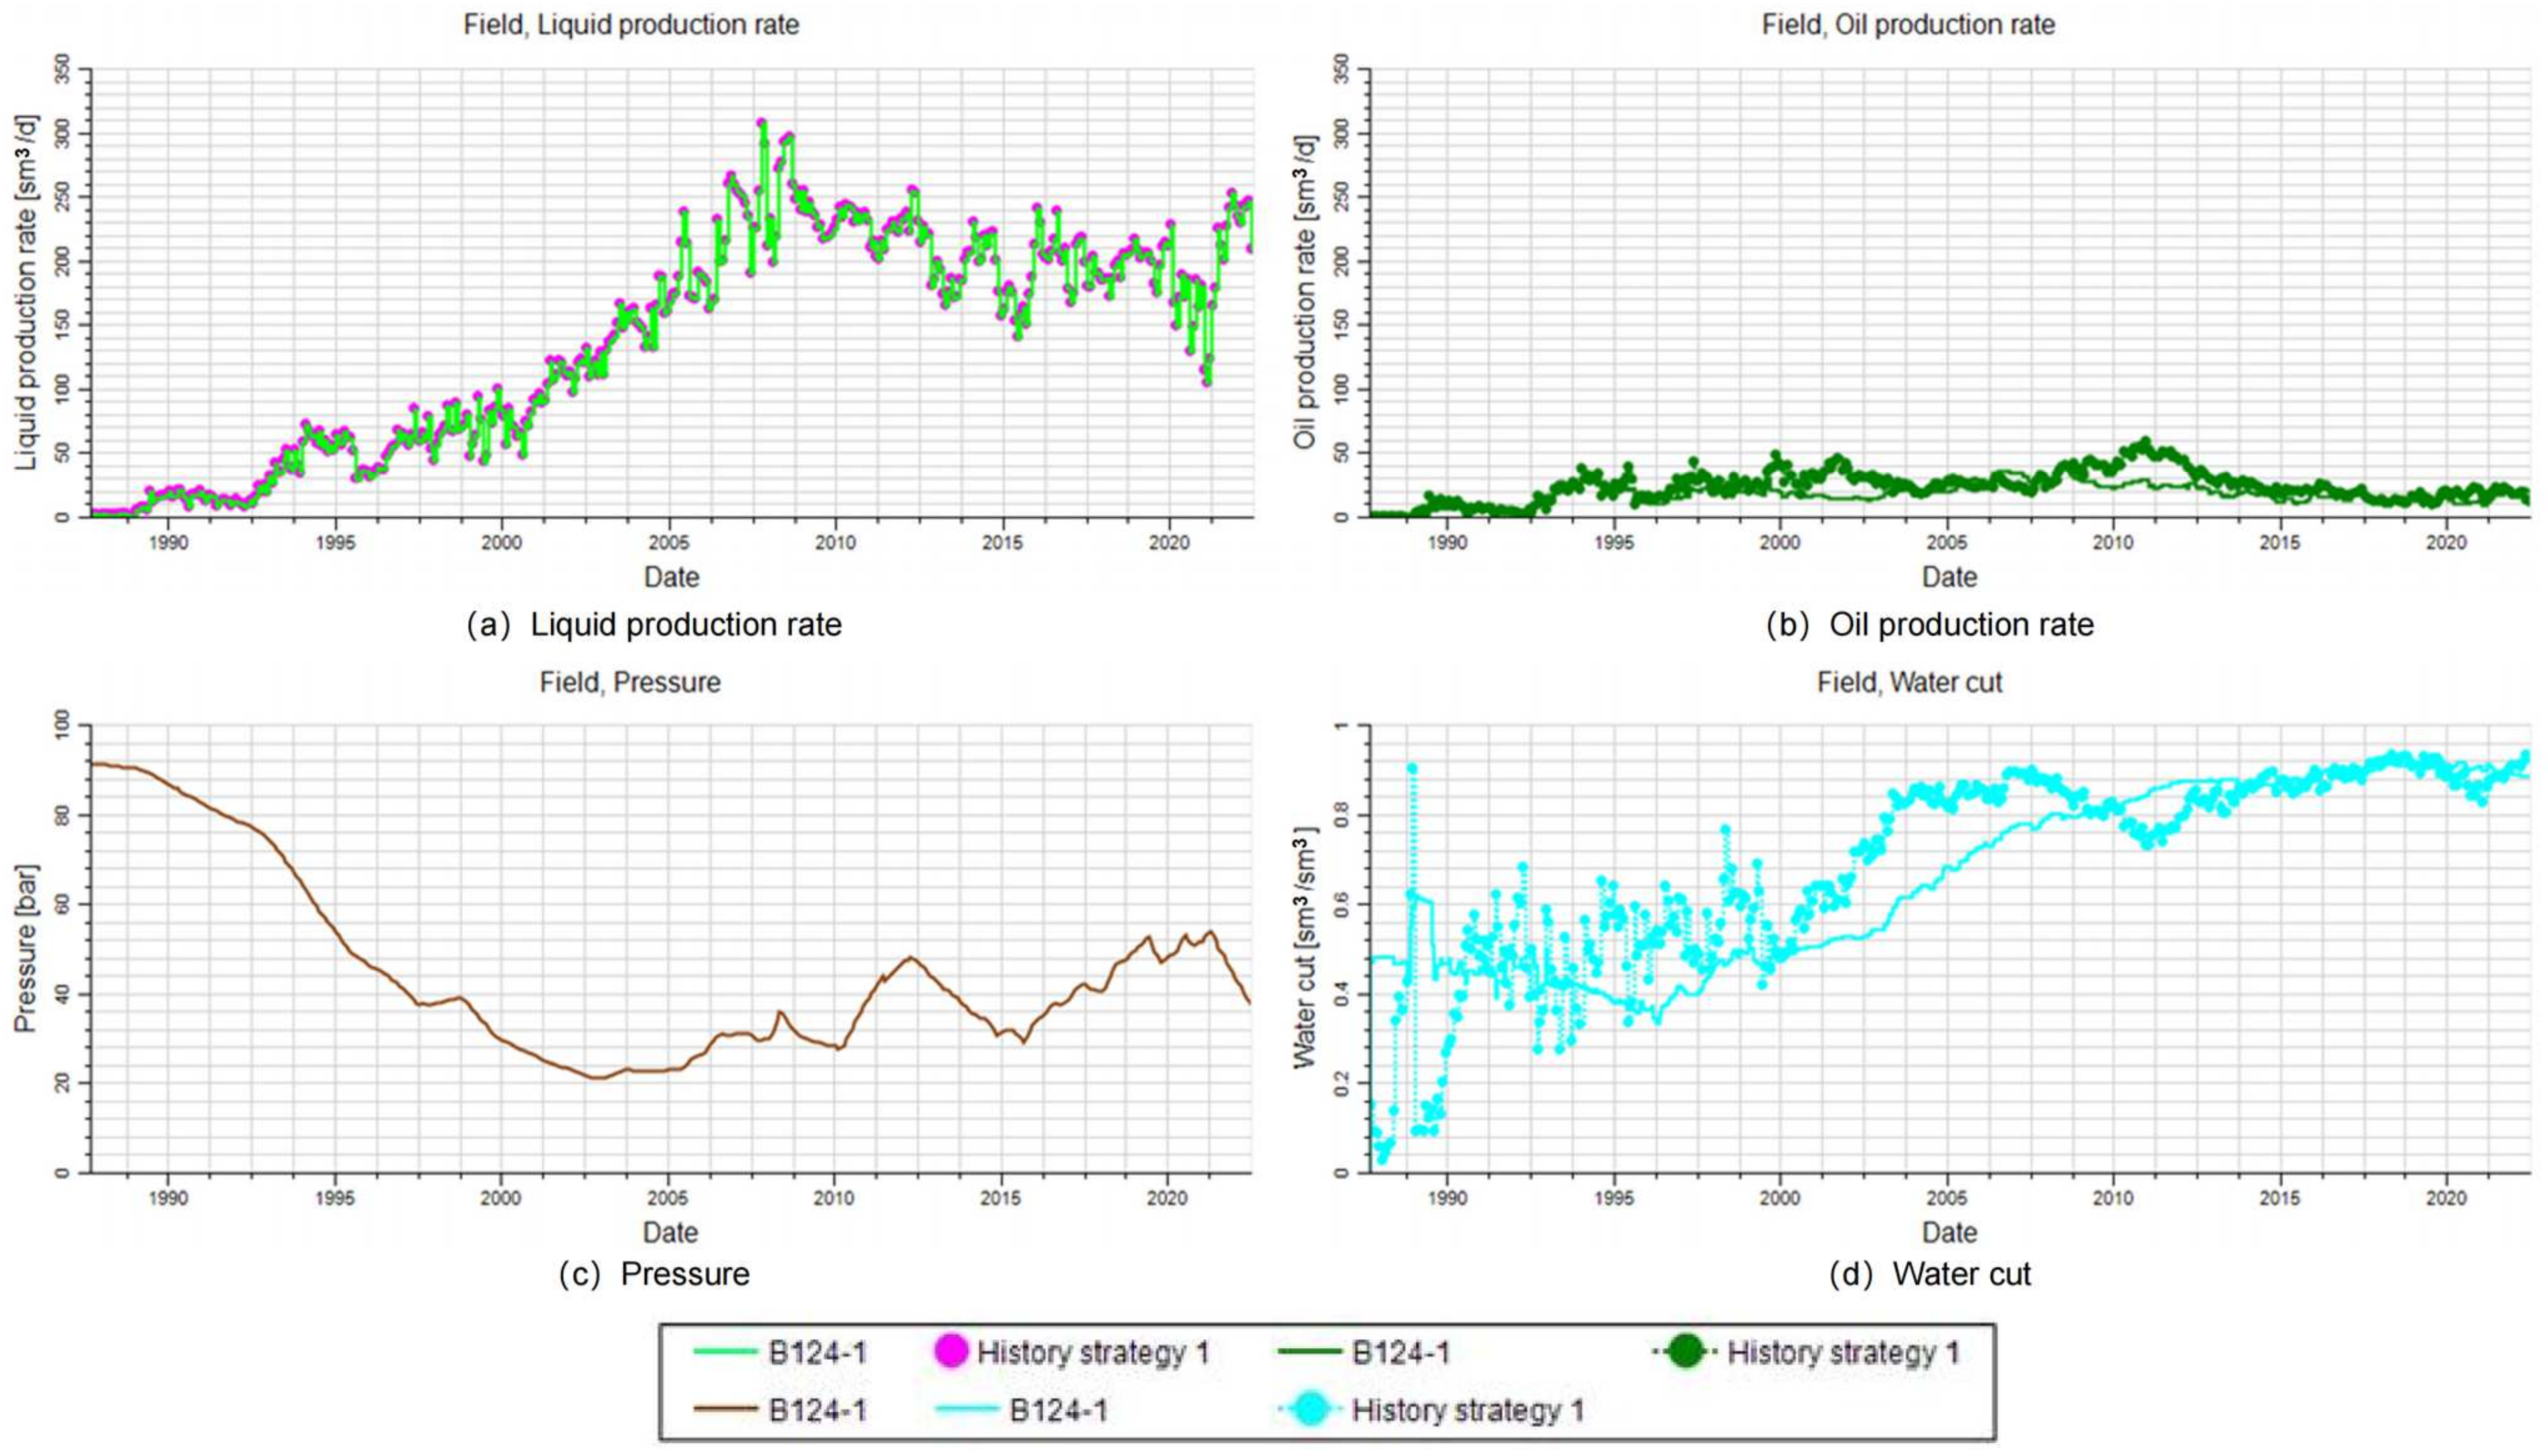
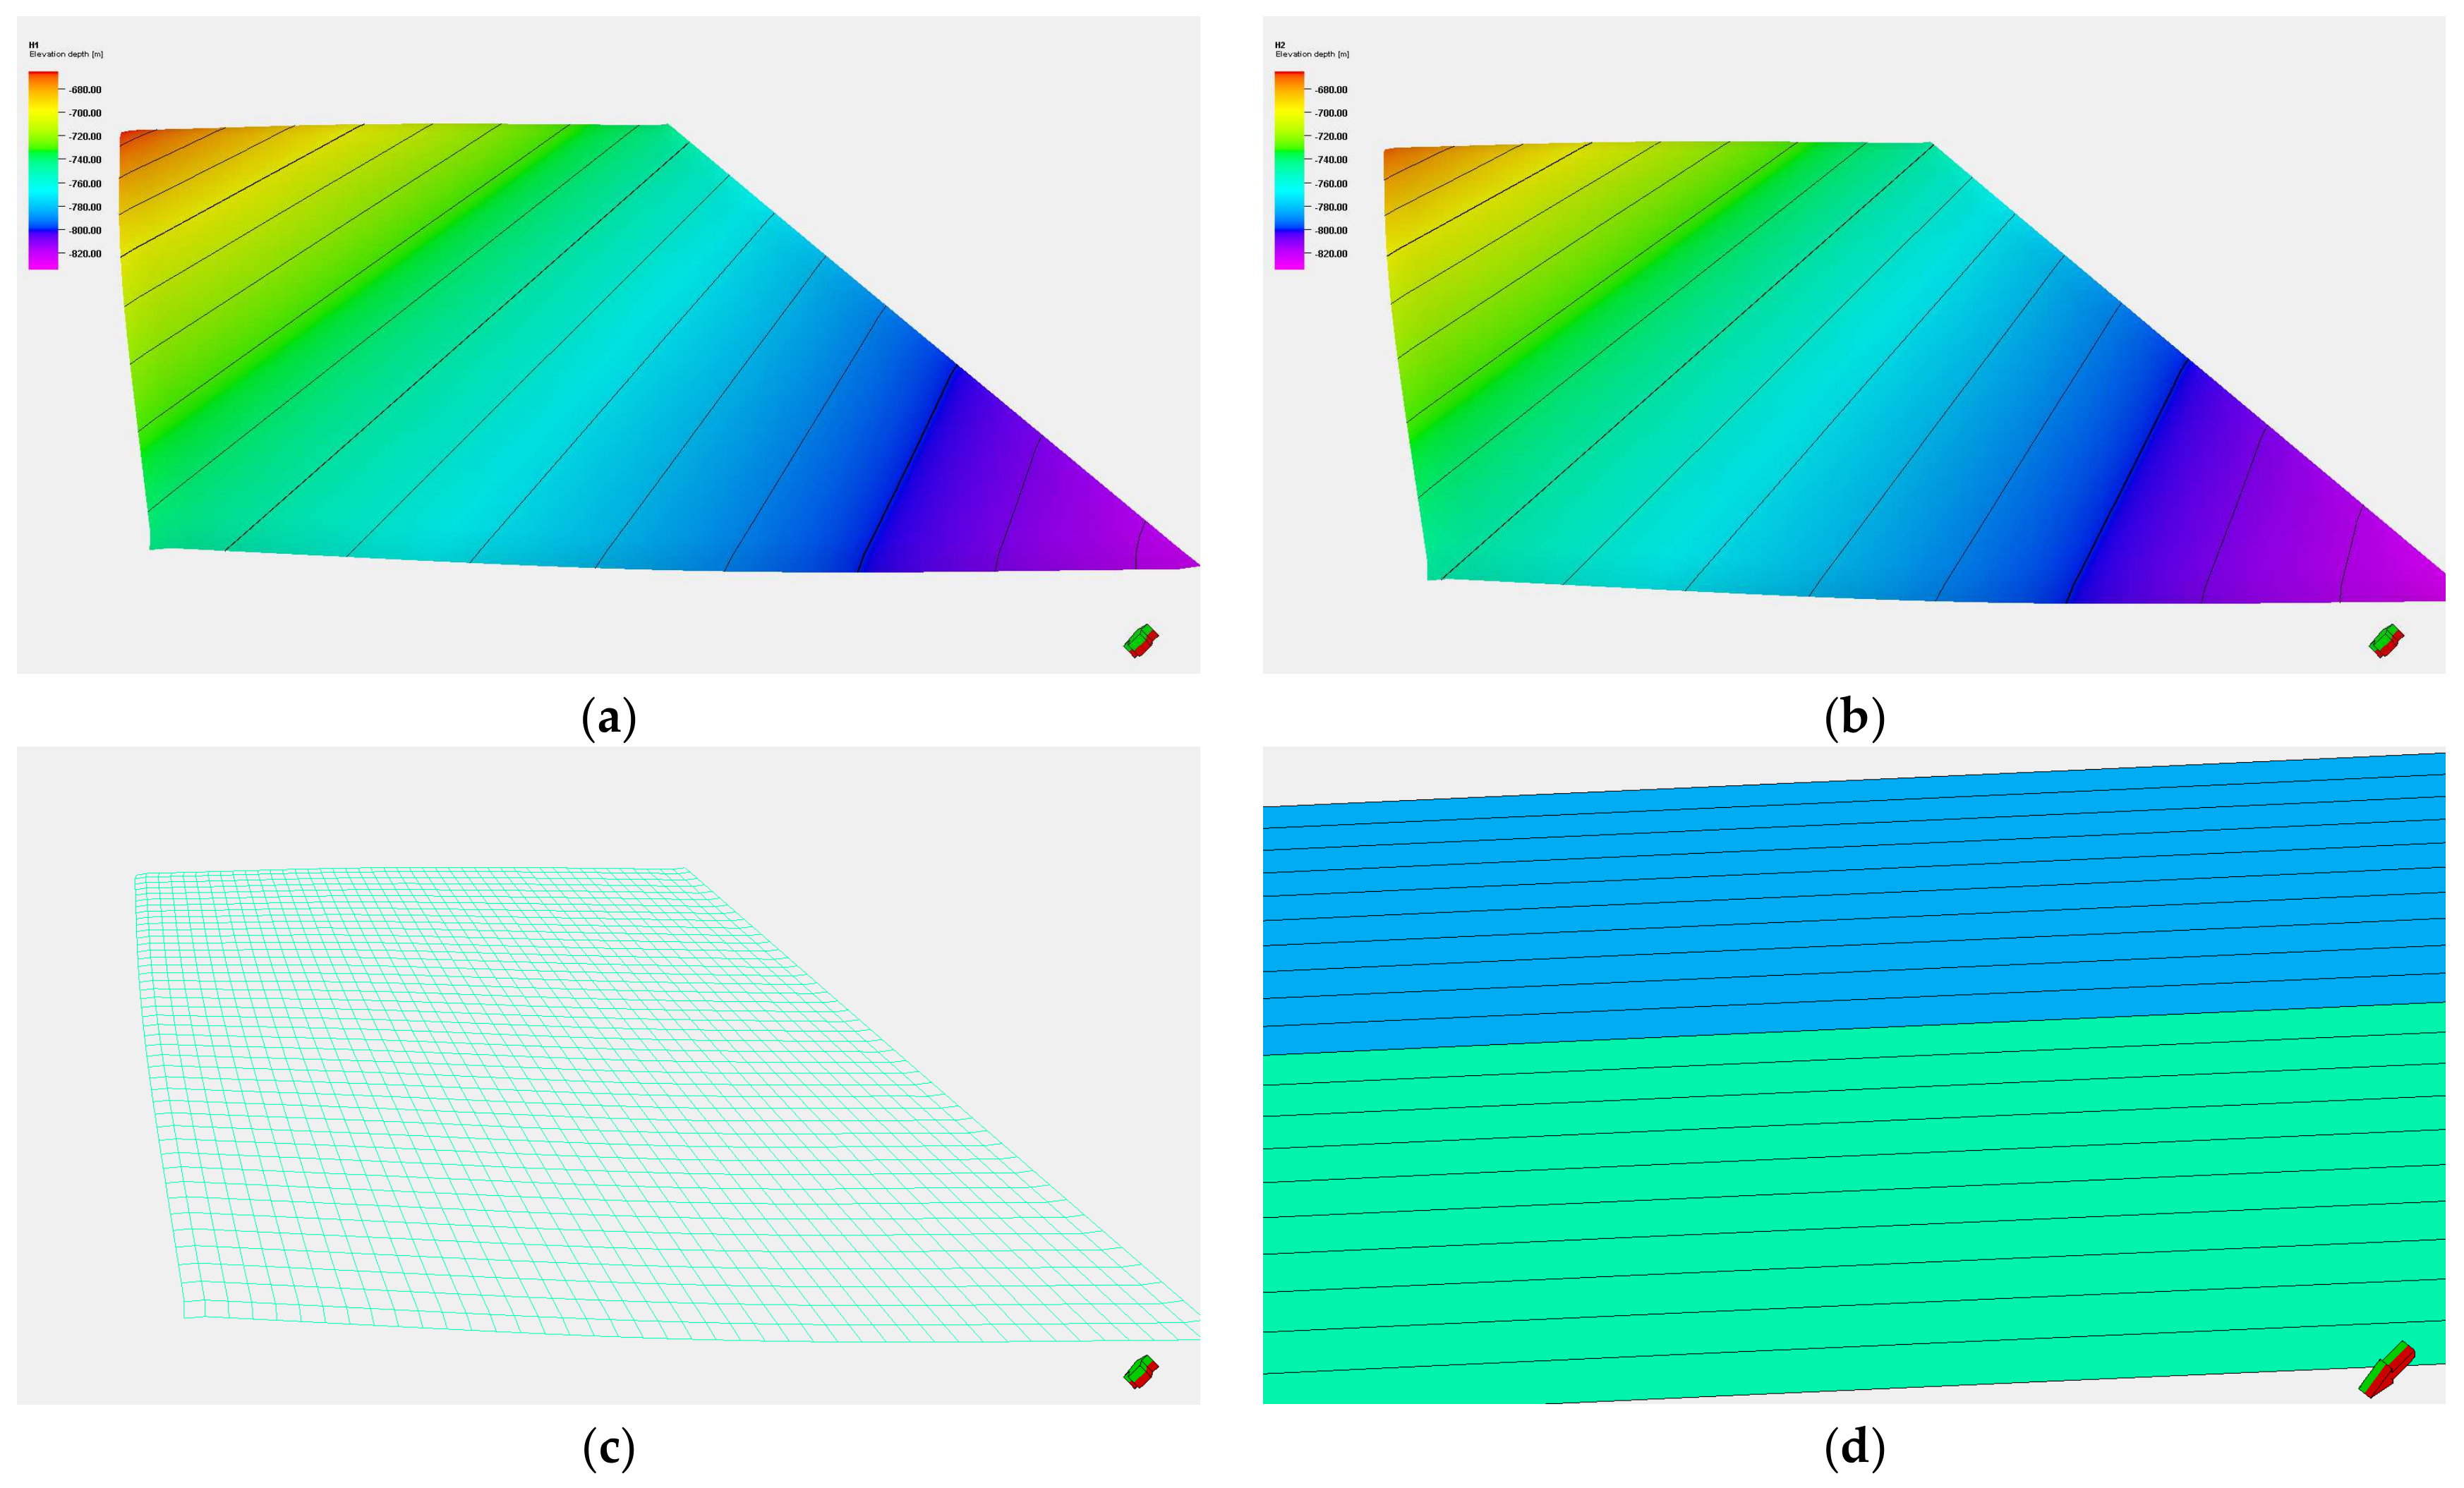
3.1.1. Modeling and History Fitting

The whole research block, including 47 production wells, was selected as the simulation object. Because the block had a complex structure, a loosely consolidated reservoir lithology, strong heterogeneity, and a large water–oil fluidity ratio, we selected the Petrel-re 3D black oil model simulator in this study. To simulate the fine construction of the target reservoir and consider the deployment of production well patterns, the mesh size of the main interval in the study area was 15 m × 15 m × 1.5 m, with a total of 105 × 68 × 70 = 499,800 grids. According to the reservoir modeling results in the study area, the grid data fields of porosity, permeability, saturation pressure, gas–oil ratio, API, water saturation (Table 3 and Figure 11), and other parameters were obtained via coarser grid processing. The sequential Gaussian simulation algorithm was used to calculate the porosity, permeability, and saturation models, so the simulated values of the model had the same probability distribution trend as the original data, ensuring that the model had high accuracy.
Through multiple fittings of liquid production profile data such as the liquid production rate, formation pressure, water cut, single-well production dynamic data, historical data, and other data in the production stage of the reservoir in the study area, combined with an understanding of the geological characteristics and development dynamics of Block Bi124, the influence parameters of the numerical model were repeatedly adjusted to fit the production history of the reservoir (Figure 12). The model could approximate the real underground situation as much as possible under the fitting of the actual production dynamic data and better accorded with the actual situation of the reservoir. The final historical fitting rate was 91.5%, and the fitting result was good.

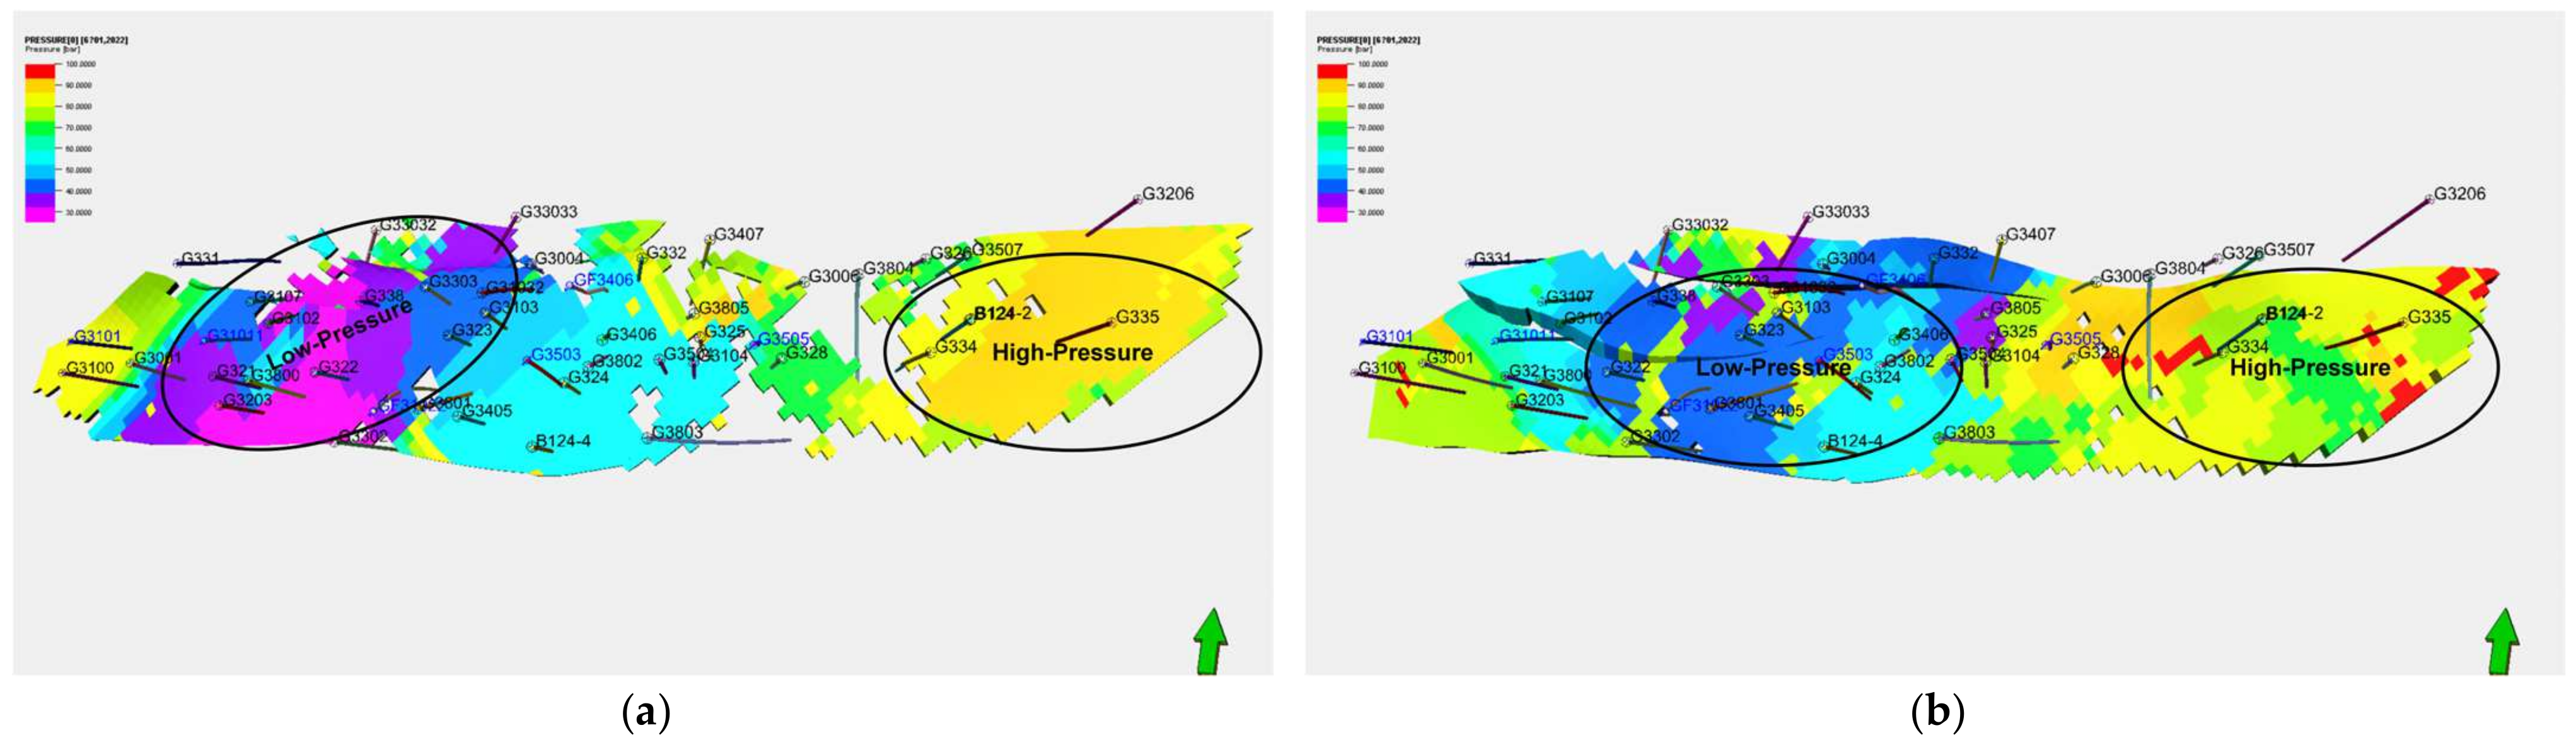
3.1.2. Numerical Simulation of Formation Pressure Characteristics and Streamline Field

As shown in Figure 13, the degree of extraction in the block had a negative correlation with the regional pressure values; i.e., the higher the degree of extraction, the lower the pressure in the corresponding block. Due to the differences in the degree of exploitation and the degree of production, the stratum with a high degree of production showed low pressure in the plane and section, and the stratum with a low degree of production showed high pressure in the plane and section. In some areas where the recovery degree was low and the reservoir utilization degree was relatively poor, the reservoir remained at the initial formation pressure.
Since conventional numerical simulation mainly uses the finite element difference method to simulate reservoir fluid, the flow direction of the fluid is consistent with the mesh direction, and the influence of numerical dispersion cannot be avoided. Therefore, this experiment adopted the streamline simulation method, which is based on the finite element difference method, to calculate the pressure field, establish the velocity field distribution model, and calculate and trace the streamline pattern according to the model operation data.
Figure 14 reflects the change characteristics of the streamline field of the reservoir in different periods. By comparing and analyzing the changes in the streamline after water-driven, polymer water-driven, and main-material coupling development, it can be clearly seen that obvious main streamline channels formed around the wellbore of the reservoir oil well after water-driven development, the sweep scope of the water body was very limited, and the phenomenon of flow appeared around part of the wellbore (Figure 14a). This indicated that the conventional water-driven development method was no longer suitable for the development of Block Bi124. In the stage of injection–production coupling, the streamline distribution in the low-pressure area in the middle of the study area and the high-pressure area with a low production degree on the left end was complex and tight, and the seepage conditions of the reservoir obviously improved. On the left end, the region with a low production degree tended to gather, while on the right end, the region with a low production degree formed a complex streamline channel, and the range of the fluid further expanded.

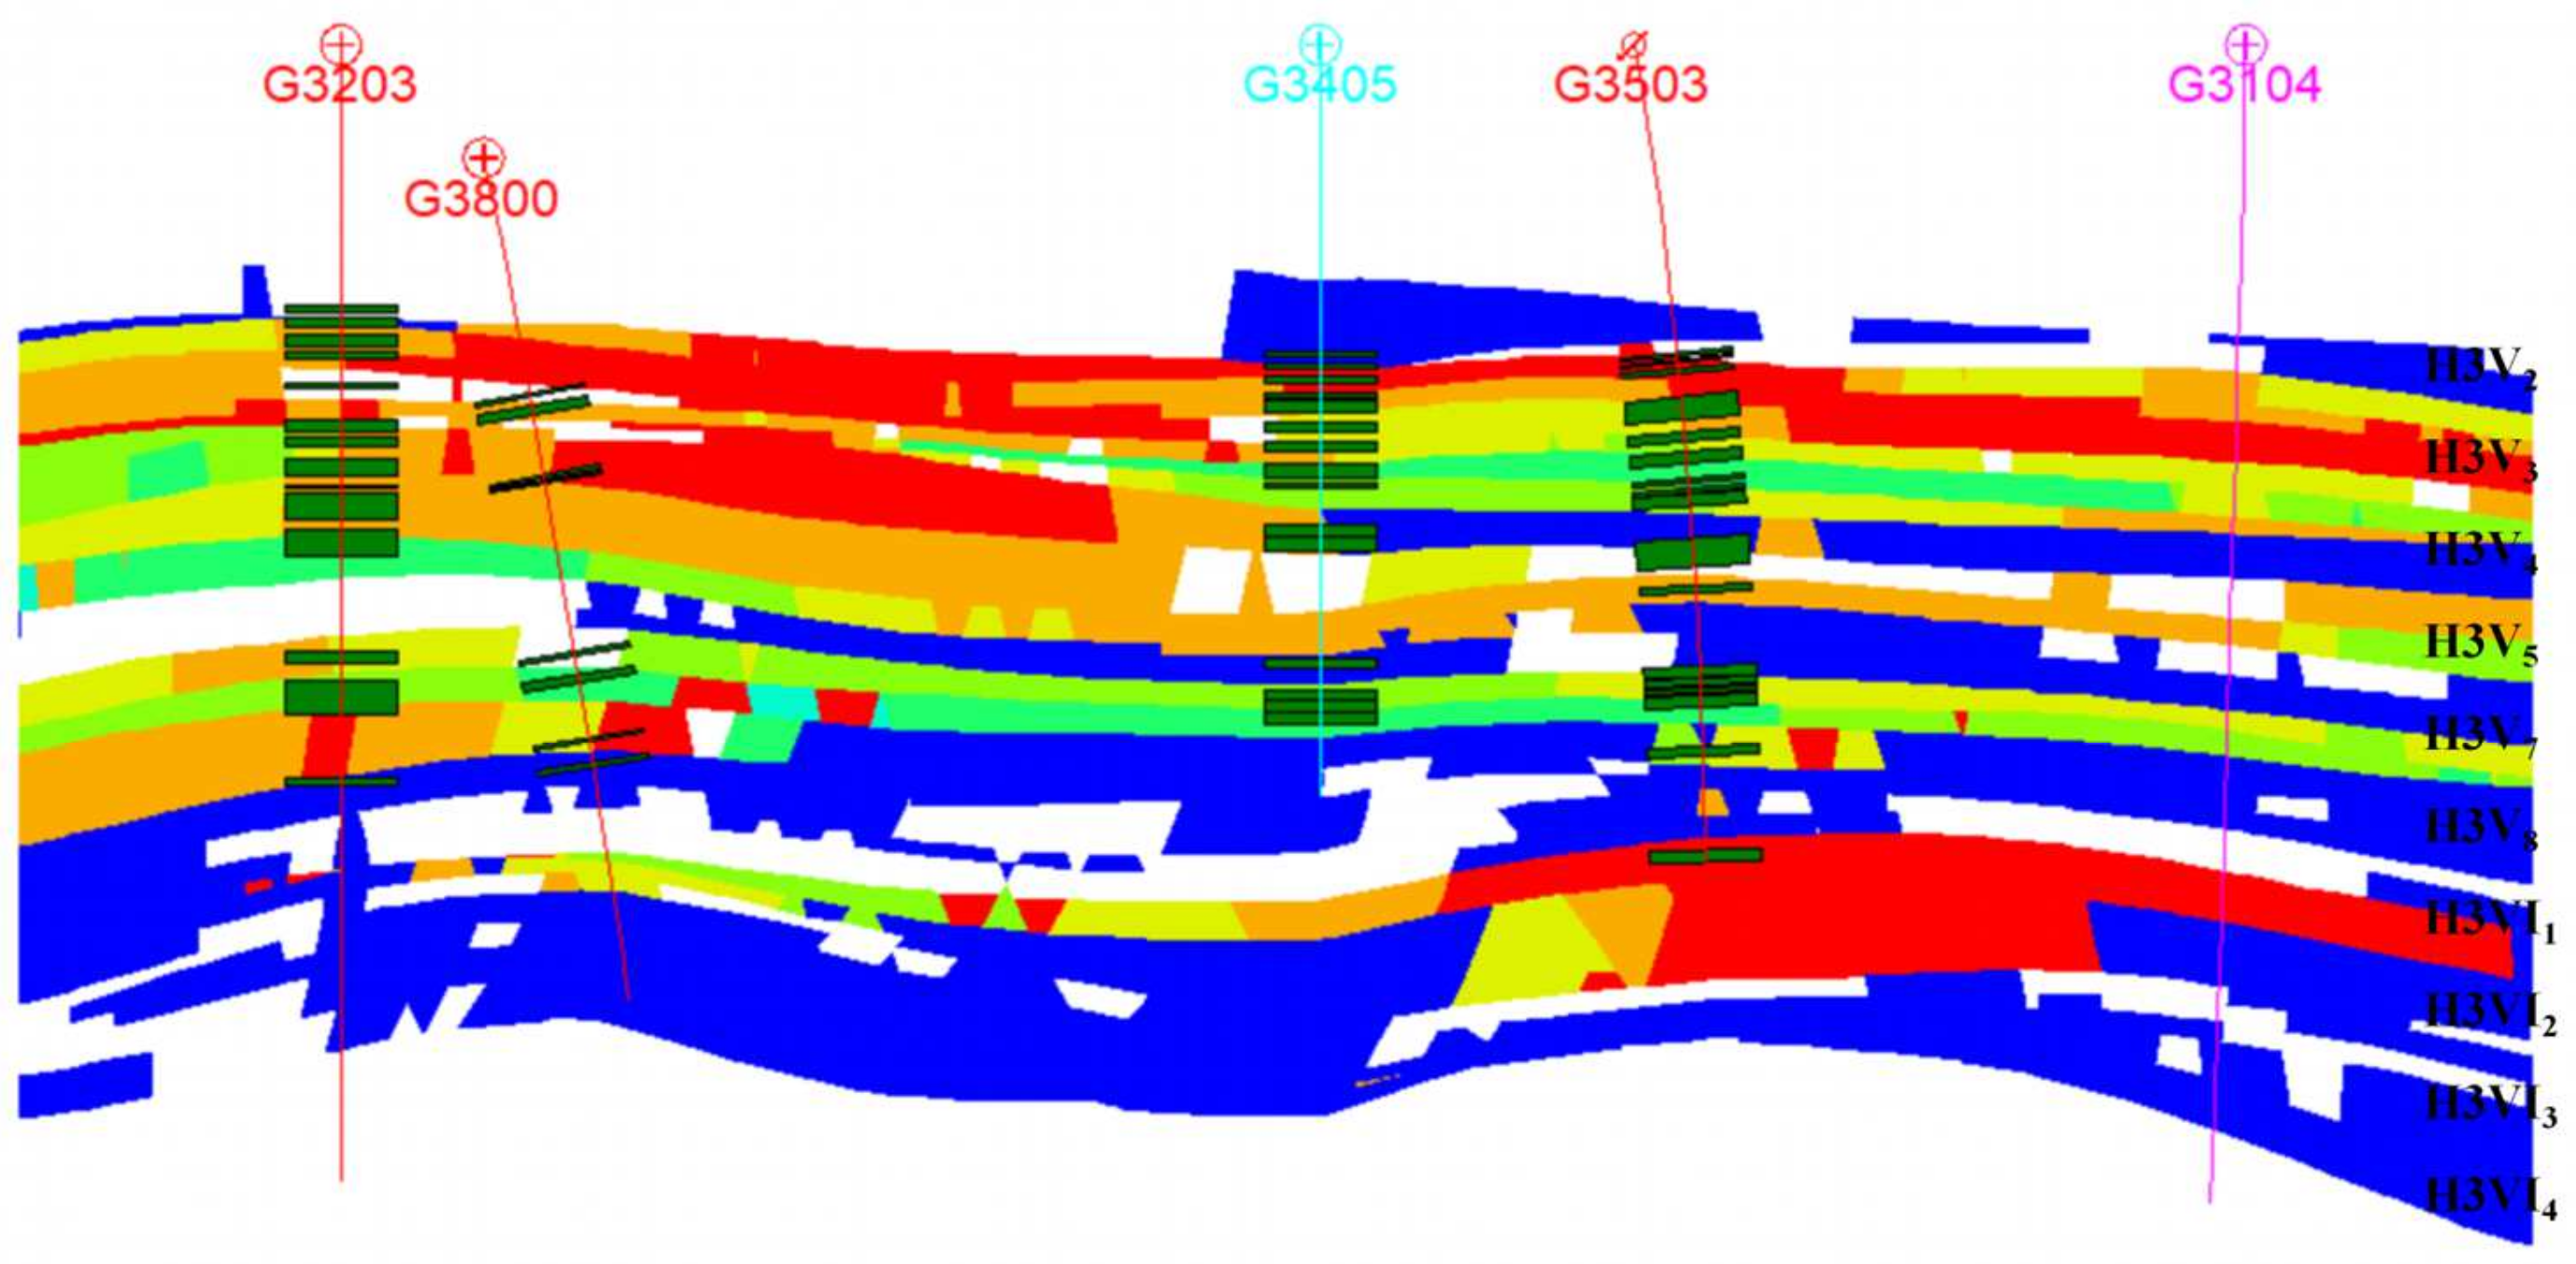
3.1.3. Distribution of Residual Oil

The distribution of residual oil in some reservoir profiles is shown in Figure 15, which shows that the distribution of residual oil between layers was not uniform and that the residual oil in each small layer varied greatly. Vertically, the residual oil was preferentially enriched in the overall less utilized or unutilized layers due to the obvious differences in the sequence of utilization and the perforations of each layer in the actual production process. For the shot-hole layer, due to the large physical differences between layers, it was vertically affected by the interlayer nonhomogeneity and the influence of the interlayer, resulting in a low degree of water-driven homogeneity between the small layers in the longitudinal direction, which led to the enrichment of residual oil.
To clarify the residual oil’s vertical enrichment law, for the medium-porosity, high-permeability, and high-viscosity reservoir’s characteristics and Block Bi124’s residual oil layer distribution status, the residual oil was classified into four types, i.e., interwell enrichment, enrichment in low-permeability areas, imperfect well pattern, and mismatch between injection and production. By simulating the production situation and quantitatively analyzing the distribution characteristics of the different types of residual oil in each layer, we found that among the four types of residual oil, interwell enrichment was the largest, at 30.84 × 10⁴ t, and accounted for 48.52% of the total residual reserve. The second largest was enrichment in low-permeability areas, with calculated reserves of approximately 14.58 × 10⁴ t. The residual oil reserves of the imperfect well pattern and mismatch between injection and production were the smallest, at 8.61 × 10⁴ t and 9.50 × 10⁴ t, respectively. The distribution of the four types of residual oil reserves is shown in Figure 16.
(1)
Enrichment in interwell
The residual oil of interwell enrichment is mainly located in the middle area of the neighboring extraction wells, where residual oil is enriched due to the restriction of the control radius of a single well and the instability of extraction, which makes it impossible to effectively control the production. The residual oil can be effectively utilized by deploying encrypted wells or adjusting the injection and extraction relationship in the later stage, and the distribution of residual oil enriched between wells is shown in Figure 17a.
(2)
Enrichment in low-permeability areas
For areas with thin reservoirs and relatively poor physical properties, the fluid in the reservoir is prone to flow bypassing, resulting in residual oil enrichment, which seriously affects the overall development effect of the reservoir (Figure 17b). Based on the simulation study, we believe that development methods such as injection–production coupling development and water-driven and polymer water-driven methods can be used to fully improve the utilization effect of this kind of residual oil.
(3)
Imperfect well pattern
Due to the change in formation pressure and our insufficient understanding of the well completion effect, the injection and recovery well network system is not perfect in some areas of the reservoir, and recovery wells are not deployed, so the reservoir utilization effect is not satisfactory, resulting in substantial residual oil enrichment (Figure 17c). To effectively explore the value of residual oil, the utilization degrees of residual-oil-rich areas can be improved by increasing the number of production wells in the later stage.
(4)
Mismatch between injection and production
Due to the noncorrespondence between injection and production wells and the development layer, the crude oil reserves in some areas with injection but not extraction are poorly utilized in the process of water-driven development, resulting in the enrichment of residual oil around production wells. In the later stage, the residual oil can be tapped by filling holes and adjusting the depth of the injection and production relationship. The distribution of residual oil from the mismatch between injection and production is shown in Figure 17d.
Figure 17. Four types of residual oil distribution. (a) Enrichment in interwell. (b) Enrichment in low-permeability. (c) Imperfect well pattern. (d) Mismatch between injection and production.
Energies 17 01505 g017

3.2. Research on the Mechanism by which Injection–Production Coupling Improves the Recovery Rate

In these simulation experiments, numerical models of a conventional water-driven environment and an injection–production coupling method were established. By comparing the differences between the conventional water-driven and injection–production coupling methods in terms of permeability, oil saturation, formation pressure, and well group streamlines, numerical simulation analyses were carried out in combination with the parameters and scenarios set in the mechanism model, and predictions were made for the development effect (over the next 20 years), which assisted in validating, side by side, the feasibility of the injection–production coupling method for enhancing the recovery rate in complex fracture-block oil reservoirs.

3.2.1. Setting Parameters

According to the simulation environment and the practical application effect, we designed a mechanism model with two layers. The thickness of each layer was set to 5 m, and the effective thickness was 3 m. The planar grid step was 10 m, and the vertical grid step was 0.5 m. The direction of the tectonic stratum was a northwest-to-southeast inclination, and the dip angle was 15°. Combined with the actual production dynamics of production wells, pressure, and other data, the model’s original reference formation pressure was set to 9.35 MPa, the porosity was 20%, and the oil saturation was 67%. Taking into account that there were two gradual changes in the permeability model from northwest to southeast, 1000~100 mD (upper layer) and 50~500 mD (lower layer) were set. The PVT parameter settings were consistent with the actual model parameters of Block Bi124. The default injection volume was 20 m3/day, the production volume of production wells was 10 m3/day, the injection–production coupling cycle was 30 days, and the model reserve was 12 × 104 t. The simulation experiment adopted water-driven development and then transferred to injection–production coupling development, and the reservoir water cut at the time of the injection–production coupling development was set to 40%, as shown in Figure 18.

3.2.2. Mechanisms of Enhanced Oil Recovery (EOR)

As shown in Figure 19, an EOR mechanism simulation was carried out for the reservoir, and the following conclusions were reached by analyzing and comparing the simulation effects of conventional water-driven and injection–production coupling development with different experimental parameters (permeability, oil saturation, formation pressure, and streamline field):
(1)
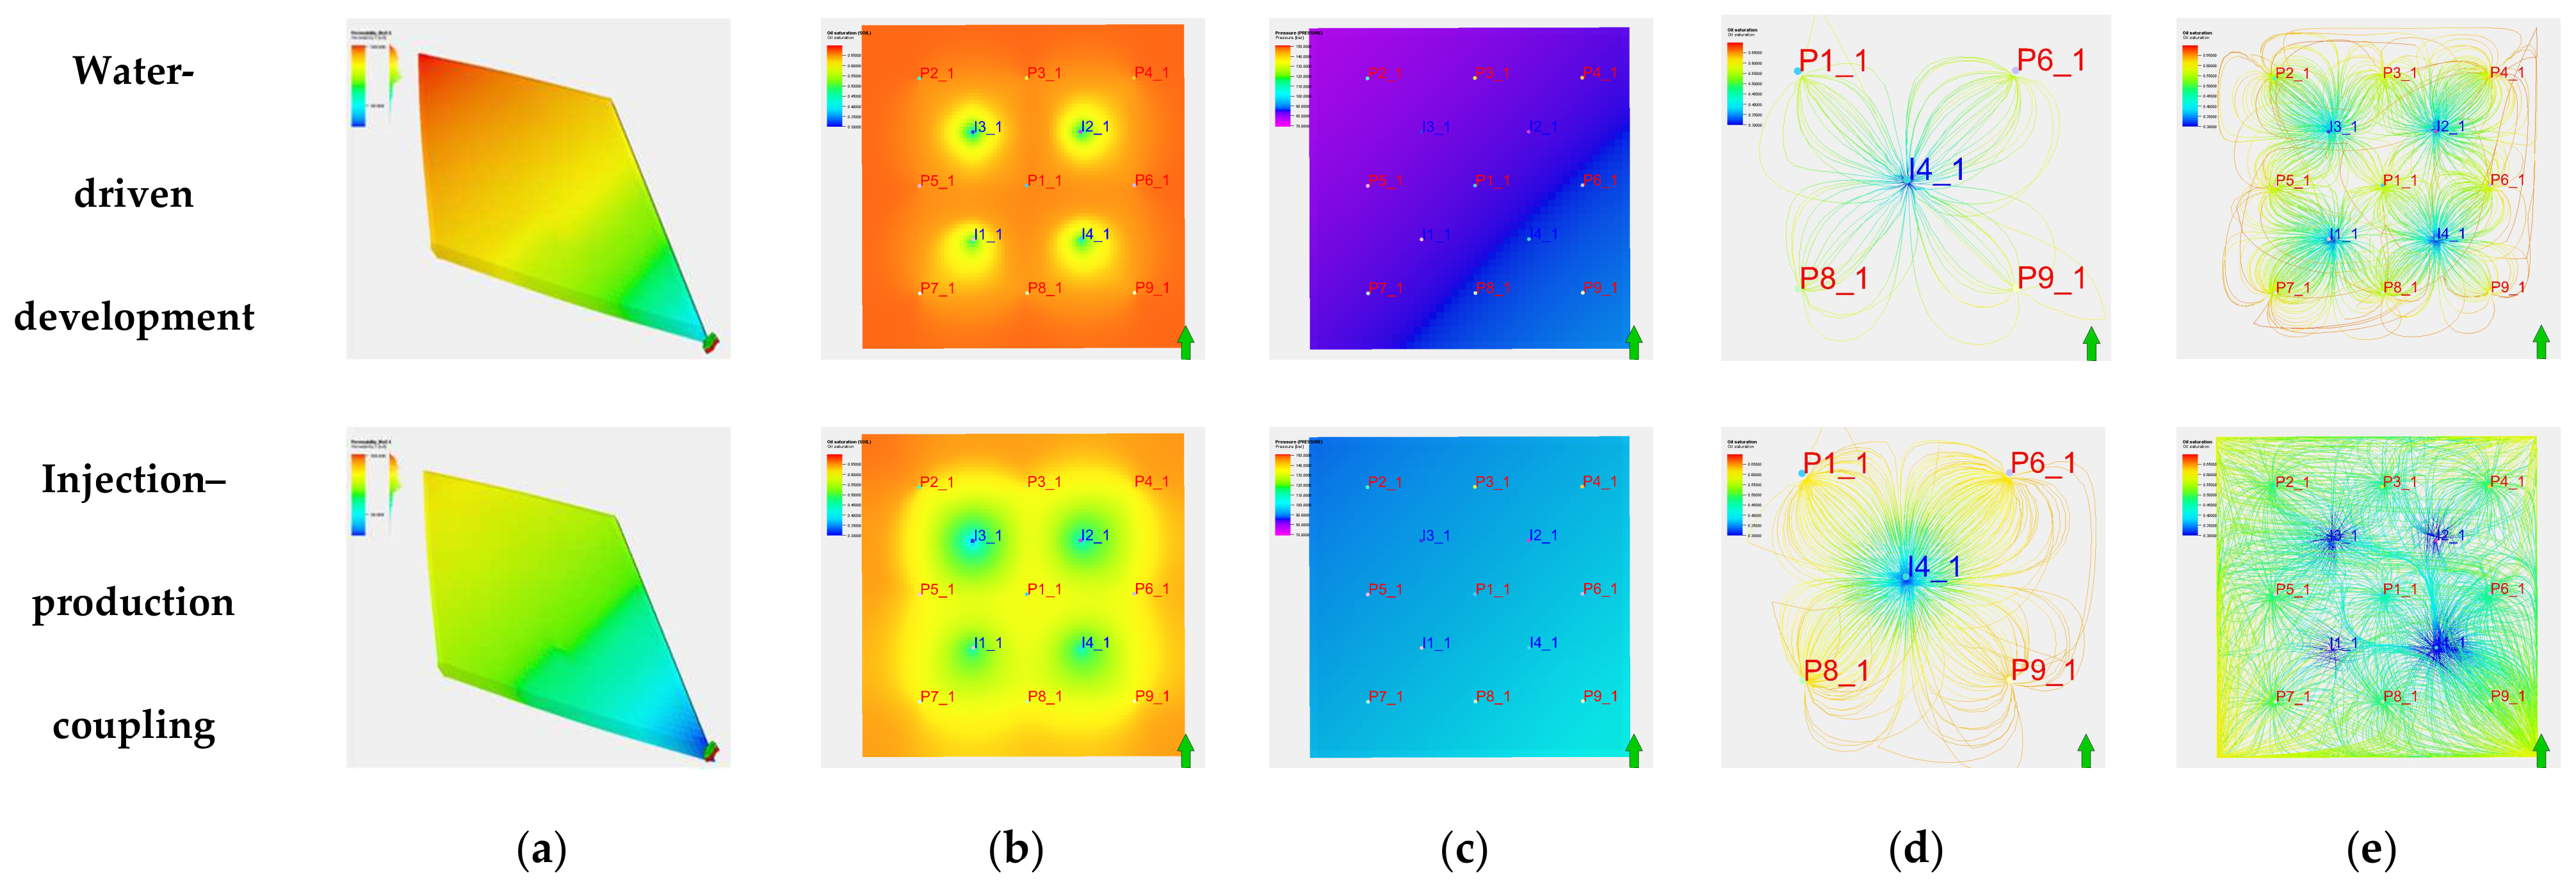
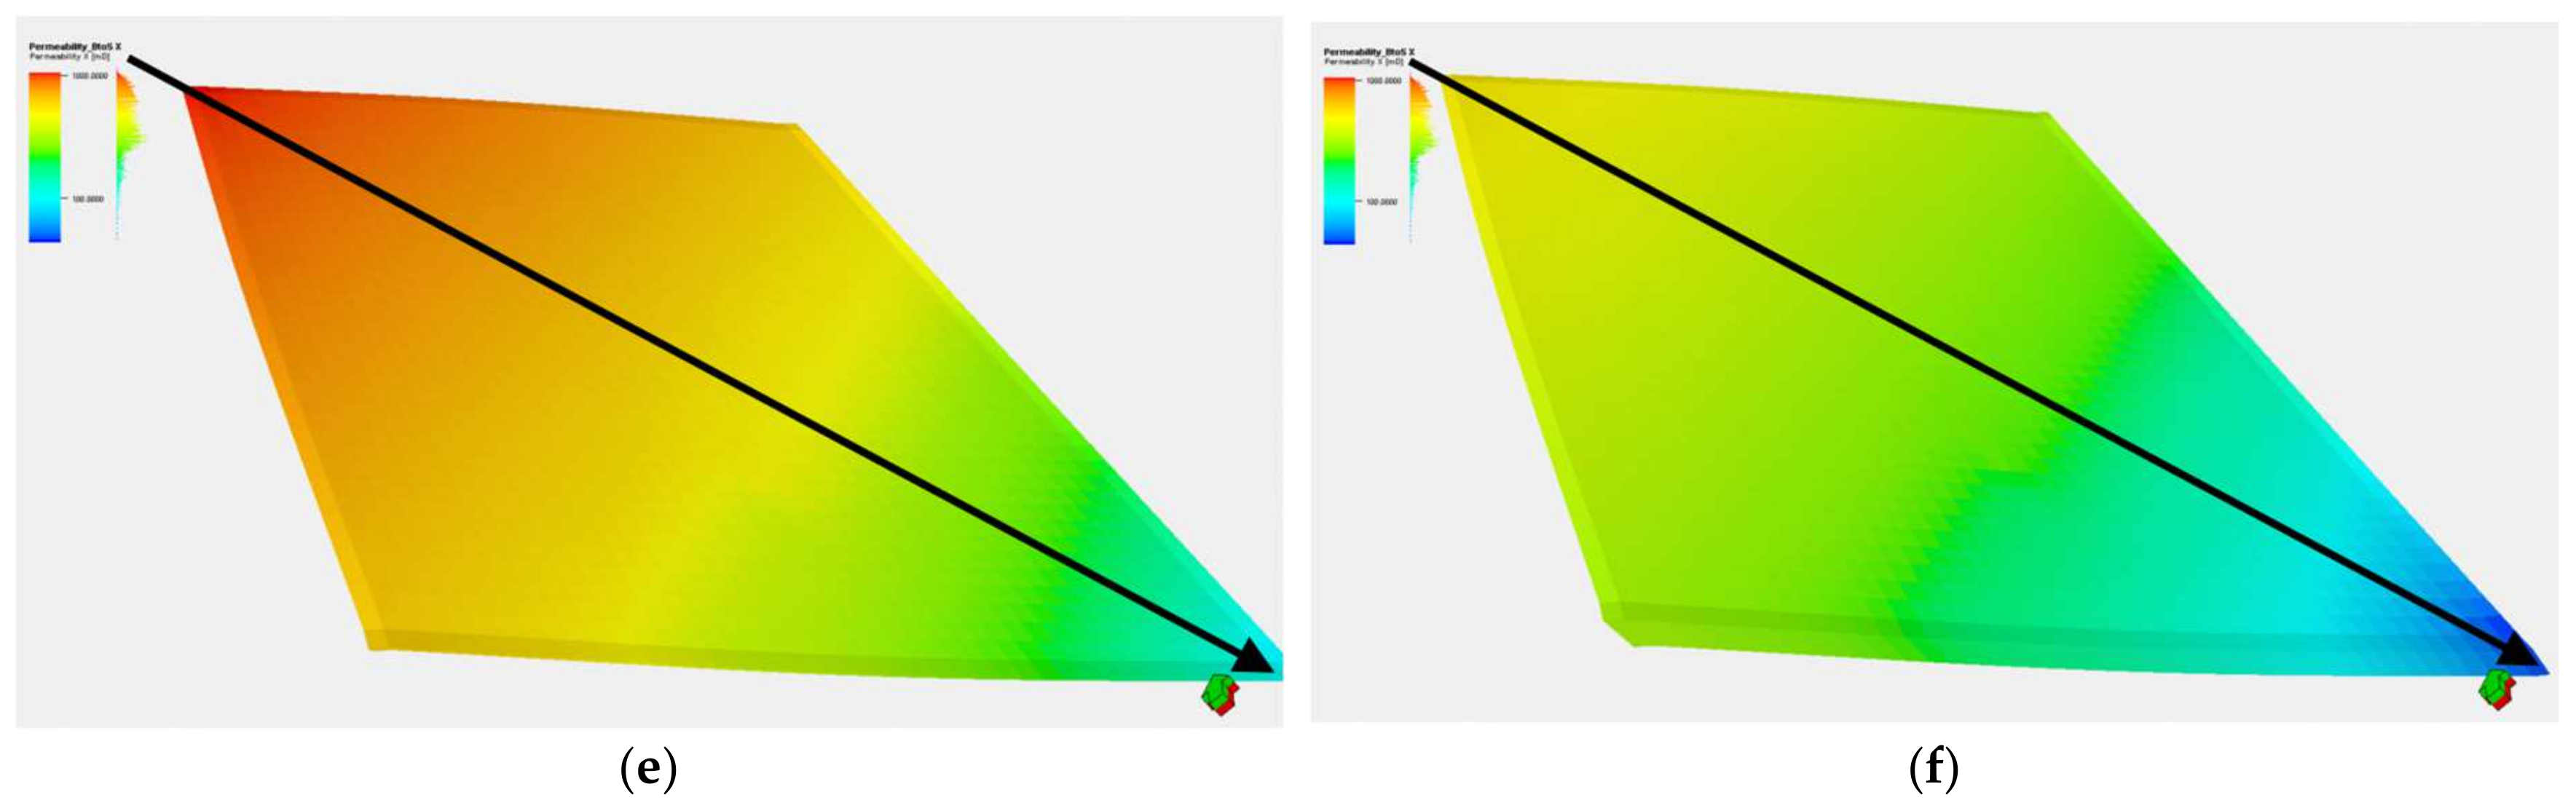
The permeability showed the change rule of gradually becoming smaller from northwest to southeast, the high value point of the permeability of the lower matrix decreased significantly after the development of injection–production coupling, and the fluctuation in the permeability of the reservoir slowed down.
(2)
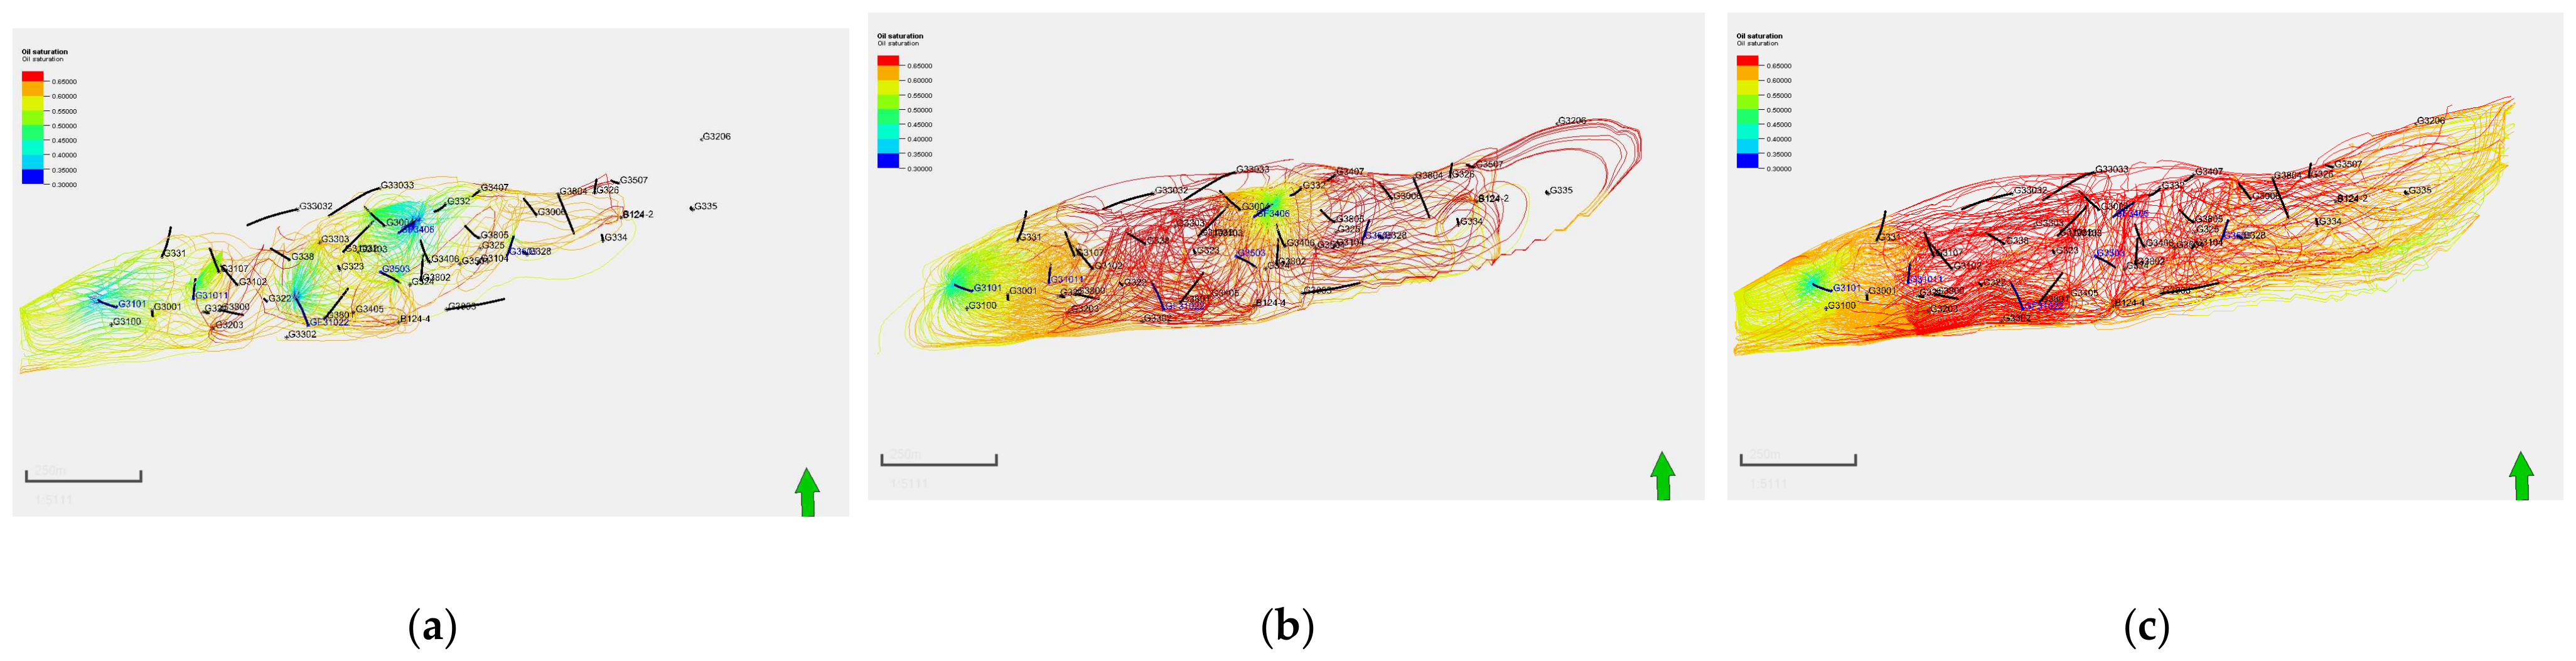
The oil saturation around the production wells was significantly reduced, and effective digging of residual oil was realized around the wells.
(3)
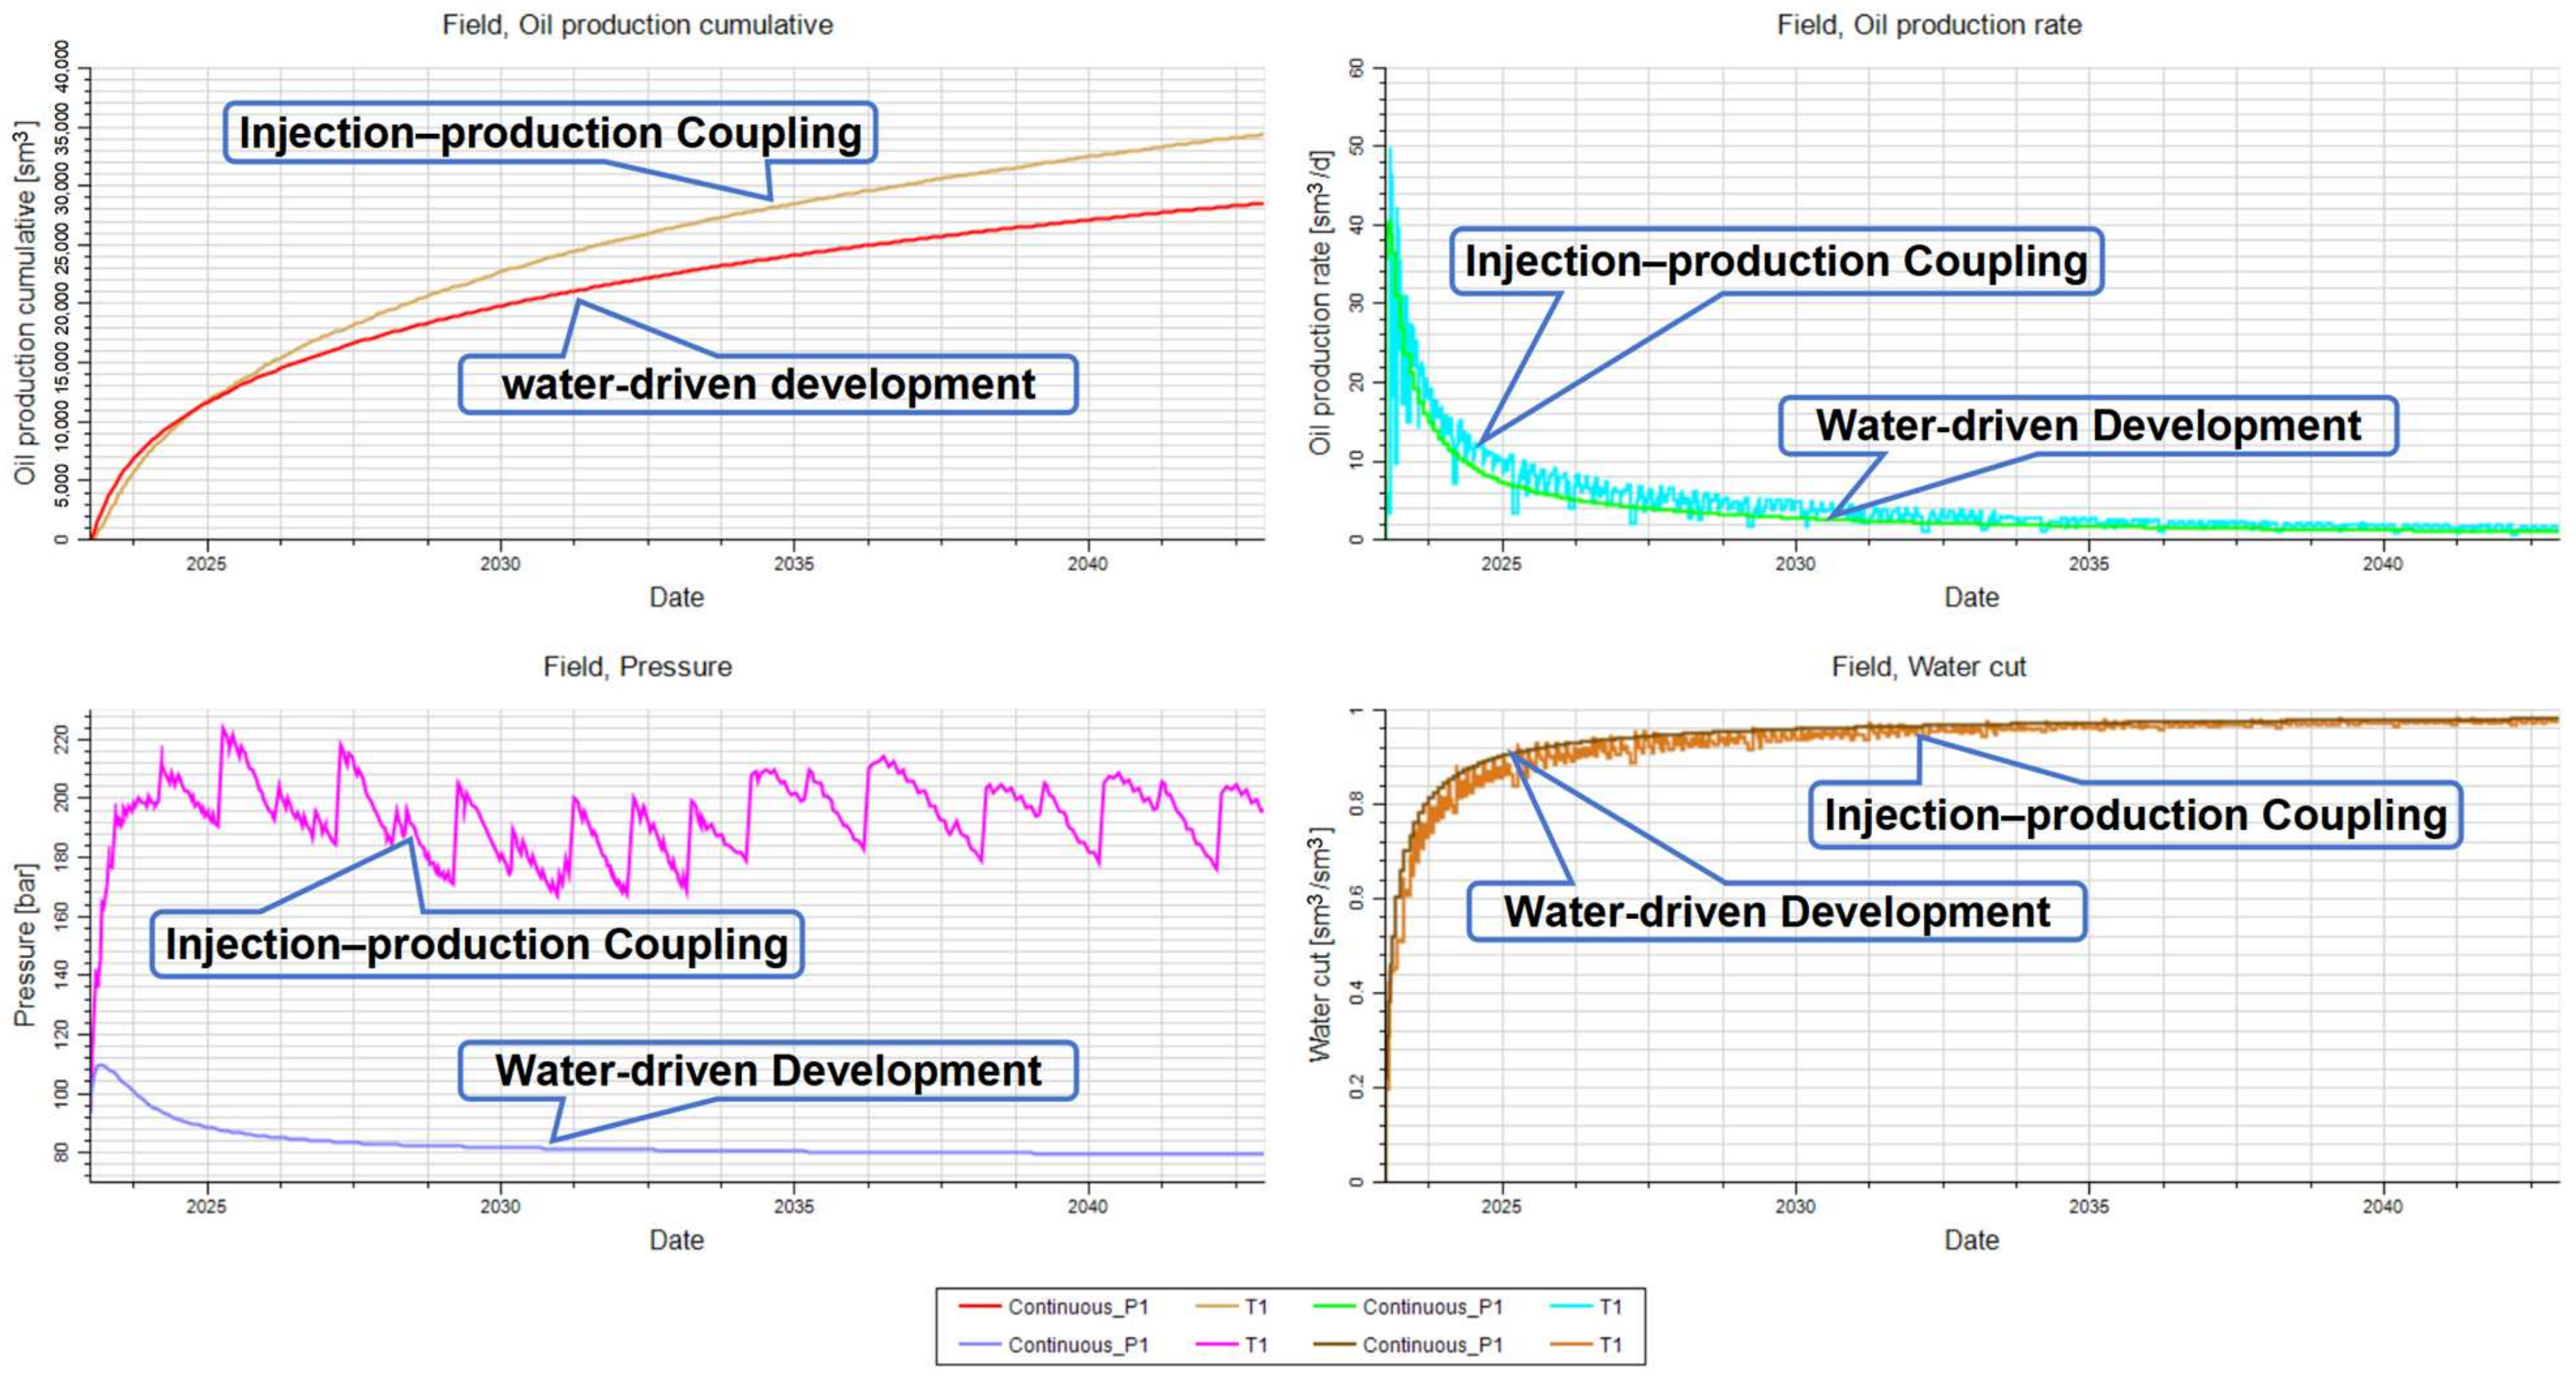
Compared with conventional water-driven development, the injection–production coupling development method disrupted the uniform regional distribution of formation pressure and changed the internal pressure distribution of the reservoir while increasing the formation energy.
(4)
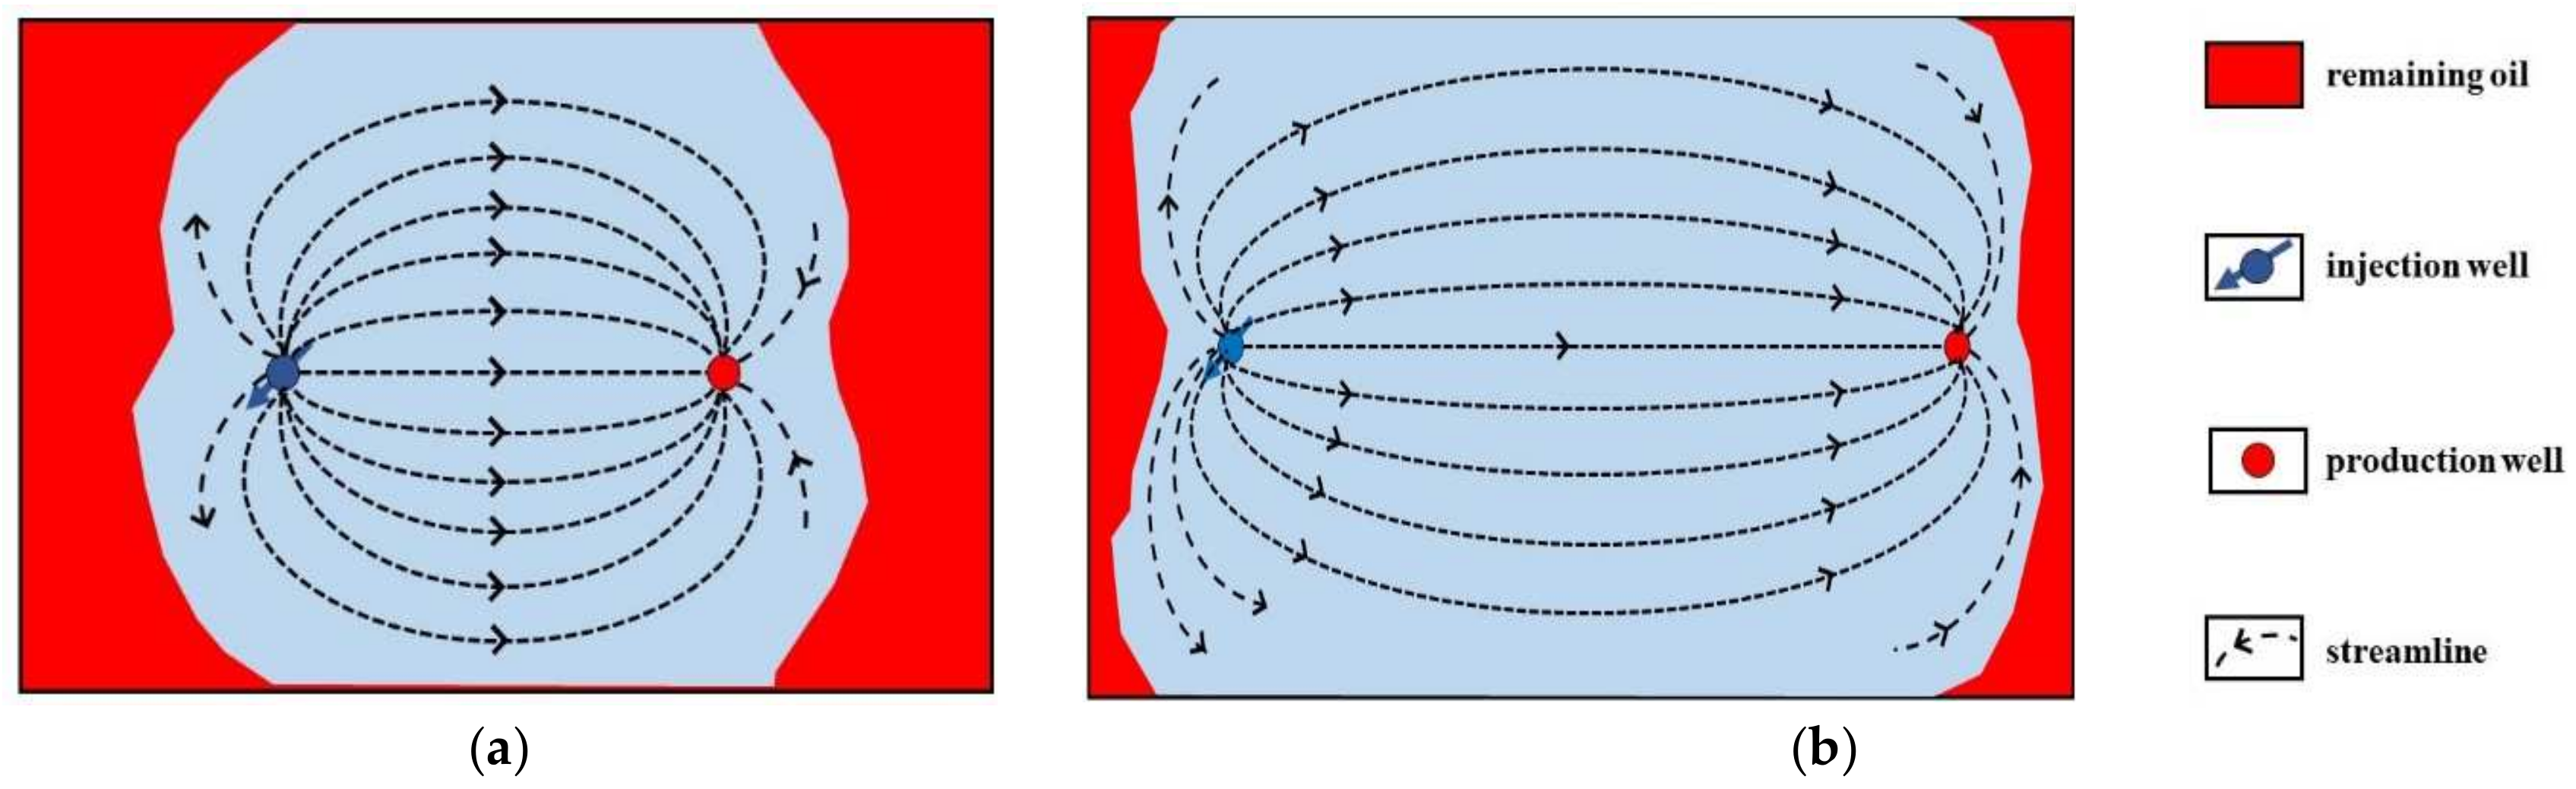
In the simulation of the single-well streamline field, the seepage field under the conventional water-driven flow formed a solid streamline pattern, and the main streamline pattern was very obvious. Even in the simulation of the well group state, there was still a large area of unaffected streamline between different well groups. However, under injection–production coupling development, the pressure propagation range was wider, the water-driven wave range was obviously increased, the dominant channel formed by the main streamline field no longer existed, the stage of injection–production coupling exhibited a relatively continuous flow, and the injection and production were more homogeneous.
Figure 19. Comparison of different development methods. (a) Permeability. (b) Oil saturation. (c) Formation pressure. (d) Streamline with single well. (e) Streamline in multiwell group.
Energies 17 01505 g019
The mechanism model was predicted via numerical simulation, which showed that after 20 years, the production of injection–production coupling development was predicted to increase by 4690.88 t of crude oil compared with that of conventional water-driven development, and the degree of recovery increased by 3.91%. The increase in formation energy was obvious, and the simulation results showed that the injection–production coupling development lowered the water-cut rate of the reservoir in the first 10 years of production (Figure 20).

4. Conclusions

(1)
The main contribution to the recovery rate of the higher-permeability sandpack model came from the conventional water-driven injection method, and the average water-driven recovery rate of a single layer reached 77%. The injection pressure and the number of coupling cycles had a significant impact on the effect of multilayer injection–production coupling, improving the recovery rate of the middle- and low-permeability sandpack models, and with an increase in the injection pressure, the crude oil in the lower-permeability model was effectively utilized after the development of multiple cycles of injection–production coupling.
(2)
For the four main types of residual oil (enrichment in interwell, enrichment in low-permeability areas, imperfect well pattern, and mismatch between injection and production), interwell enrichment residual oil, due to the restriction of the control radius of a single well and the unstable nature of extraction, accounted for 48.52% of the total residual geologic reserves, followed by enrichment in low-permeability areas, which accounted for 22.95%. Residual oil from an imperfect well pattern and mismatch between injection and production accounted for only 14.95% and 13.55%, respectively.
(3)
Compared with conventional water-driven coupling, the development of injection–production coupling had a good effect on the reservoir water cut, oil saturation, formation pressure, injection water circulation, etc. The streamline was more continuous and uniform, and the scope of the water-driven wave was wider.

Author Contributions

Data curation, X.Z. (Xiaolei Zheng) and T.S.; Writing—original draft, Z.Z.; Writing—review & editing, H.G., C.Z., S.J., X.Y., K.Z., X.Z. (Xinyu Zhong), L.Q. and R.Z. All authors have read and agreed to the published version of the manuscript.

Funding

This work has been supported jointly by the Key Research and Development Program of Shaanxi Province (Grant No. 2021KW-10), Shaanxi Province Science and Technology Resources Open Sharing Platform Project Grant No. 2022PT-08).

Data Availability Statement

Data are contained within the article.

Conflicts of Interest

H.G., C.Z., S.J., X.Y. and K.Z. were employed by SINOPEC Henan Oilfield Branch. The remaining authors declare that the research was conducted in the absence of any commercial or financial relationships that could be construed as a potential conflict of interest.

References

  1. Jiao, F.Z. Re-recognition of “unconventional” in unconventional oil and gas. Pet. Explor. Dev. 2019, 46, 803–810. [Google Scholar] [CrossRef]
  2. Zou, C.N.; Pan, S.Q.; Jing, Z.H.; Gao, Z.L.; Yang, Z.; Wu, S.T.; Zhao, Q. Shale oil and gas revolution and its impact. Acta Pet. Sin. 2020, 41, 1. [Google Scholar]
  3. Li, J.Z.; Zheng, M.; Chen, X.M.; Li, D.H.; Wang, S.Y.; Song, T. Connotation analysis, source-reservoir assemblage types and development potential of unconventional hydrocarbon in China. Acta Pet. Sin. 2015, 36, 521–532. [Google Scholar] [CrossRef]
  4. Jia, C.Z.; Pang, X.Q.; Song, Y. The mechanism of unconventional hydrocarbon formation: Hydrocarbon self-containment and intermolecular forces. Pet. Explor. Dev. 2021, 48, 437–452. [Google Scholar] [CrossRef]
  5. Zou, C.N.; Zhu, R.K.; Wu, S.T.; Yang, Z.; Tao, S.Z. Types, characteristics, genesis and prospects of conventional and unconventional hydrocarbon accumulations: Taking tight oil and tight gas in China as an instance. Acta Pet. Sin. 2012, 33, 173–187. [Google Scholar]
  6. Jia, C.Z.; Zheng, M.; Zhang, Y.F. Unconventional hydrocarbon resources in China and the prospect of exploration and development. Pet. Explor. Dev. 2012, 39, 129–136. [Google Scholar] [CrossRef]
  7. Zhu, W.Y.; Yue, M.; Liu, Y.F.; Liu, K.; Song, Z.Y. Research progress on tight oil exploration in China. Chin. J. Eng. 2019, 41, 1103–1114. [Google Scholar]
  8. Gao, H.; Li, H. Determination of movable fluid percentage and movable fluid porosity in ultra-low permeability sandstone using nuclear magnetic resonance (NMR) technique. J. Pet. Sci. Eng. 2015, 133, 258–267. [Google Scholar] [CrossRef]
  9. Wang, L.; Tian, Y.; Yu, X.Y.; Wang, G.; Yao, B.W.; Wang, S.H. Advances in improved/enhanced oil recovery technologies for tight and shale reservoirs. Fuel 2017, 210, 425–445. [Google Scholar] [CrossRef]
  10. Chen, H.; Wang, T.; Liu, R.M.; Tian, M.; Meng, Q.C. Study on optimization of injection and production for improving development effect of heterogeneous reservoirs at high water cut stage. Complex Hydrocarb. Reserv. 2023, 02, 215–219. [Google Scholar]
  11. Yuan, S.Y.; Wang, Q.; Li, J.S.; Hang, H.S. Technology progress and prospects of enhanced oil recovery by gas injection. Acta Pet. Sin. 2020, 41, 1623–1632. [Google Scholar]
  12. Zhu, W.; Zheng, X.; Li, G. Micro-bubbles size, rheological and filtration characteristics of Colloidal Gas Aphron (CGA) drilling fluids for high temperature well: Role of attapulgite. J. Pet. Sci. Eng. 2020, 186, 106683. [Google Scholar] [CrossRef]
  13. Wang, R. Mechanical mechanism of the injection-production coupling technique for complex fault-block oil reservoirs. China Sci. 2020, 15, 60–66. [Google Scholar]
  14. Li, S.O. Study on mechanism of enhanced oil recoveryby injection-production coupling technology. Petrochem. Ind. Technol. 2019, 26, 91–92. [Google Scholar]
  15. Liu, R.J.; Lu, W.M. Mechanism and field practice of injection-production coupling enhanced oil recovery in fault block reservoirs. Lithol. Reserv. 2023, 1–9. [Google Scholar]
  16. Wang, R. Study on both characteristics and applicabilities of dynamic injection-production coupling development and technical policy boundaries. Pet. Geol. Recovery Effic. 2022, 29, 100–108. [Google Scholar]
  17. Sun, Z.G.; Yang, H.B.; Zhang, H.X.; Wang, J.; Wang, R.; Zhang, B. Physical simulation experiment of injection-production coupling. Pet. Geol. Eng. 2021, 43, 144–153. [Google Scholar]
  18. Wang, J. Research on unstable injection-production to improve oil recovery in complicated fault block of Shengli oilfield-case study of fault block oil reservoirs in Linpan oilfield. Pet. Geol. Recovery Effic. 2013, 20, 89–91. [Google Scholar]
  19. Li, Z.Y.; Tan, H.Q.; Li, L.X.; Cao, X.L.; Cui, W.F.; Chen, X.Z.; Wang, Y.F.; Li, W.H. Research and application of injection-production coupling technology for enhancing oil recovery in reservoirs at later stage of polymer water-driven. Pet. Geol. Recovery Effic. 2019, 26, 115–121. [Google Scholar]
  20. Gao, H.; Liu, Y.L.; Zhang, Z.; Niu, B.L.; Li, H.Z. Impact of secondary and tertiary floods on microscopic residual oil distribution in medium-to-high permeability cores with NMR technique. Energy Fuels 2015, 29, 4721–4729. [Google Scholar] [CrossRef]
  21. Chen, Z.H.; Wu, G.Y.; Qian, W.M.; Wang, J.; Ma, T.; Wang, H.M.; Zheng, Y.W.; Xiong, X.Y. EOR technology and application of CO2 injection for small complex fault block reservoirs in Subei Basin. Pet. Geol. Recovery Effic. 2020, 48, 437–452. [Google Scholar]
  22. Zhang, H.Y.; Wang, Y.J.; Lei, Y.; Yang, M.; Liu, W.Z. Evaluation method of water water-driven sweep in fault block reservoirs with infill adjustment based on stream—Tube method. Fault-Block Oil Gas Field 2022, 29, 687–691. [Google Scholar]
  23. Zhao, B.; Han, W.; Ma, T.J.; Gao, G.; Ji, L. Reservoir Quality and Its Control Factors of Complex Fault Block Reservoir in Continental Faulted Basin, Case Study in the Wang Guantun Area, Bohai Bay Basin, China. Energies 2022, 15, 5895. [Google Scholar] [CrossRef]
  24. Liu, S.Y.; Song, Y.C.; Zhao, C.Z.; Zhang, Y.; Lv, P.F.; Jiang, L.L.; Liu, Y.; Zhao, Y.C. The horizontal dispersion properties of CO2 -CH4 in sand packs with CO2 displacing the simulated natural gas. J. Nat. Gas Sci. Eng. 2018, 50, 293–300. [Google Scholar] [CrossRef]
  25. Lv, P.F.; Liu, Y.; Liu, F.; Yang, W.Z.; Liu, H.T.; Zhang, B.; Song, Y.C. Pore-based architecture and representative element volume evaluation in artificial sand packs and natural rock cores. Pet. Sci. 2022, 19, 1473–1482. [Google Scholar] [CrossRef]
Figure 1. Comparison of different development methods. (a) Water-driven development. (b) Injection–production coupling.
Energies 17 01505 g001
Figure 2. Sandpack model.
Energies 17 01505 g002
Figure 5. Single-layer injection–production coupling recovery with different sandpack models.
Energies 17 01505 g005
Figure 6. Comparison of recovery efficiency of sandpack models using different displacement methods.
Energies 17 01505 g006
Figure 7. Comparison of oil recovery rates with different injection pressures. (a) High moisture content. (b) Injection–production coupling.
Energies 17 01505 g007
Figure 8. Oil recovery rates of 3 types of sandpack models with different coupling cycles. (a) 10 MPa. (b) 15 Mpa. (c) 20 Mpa.
Energies 17 01505 g008
Figure 9. Oil recovery efficiency and its contribution to the degree of recovery in the injection and production coupling mode of 3 sandpack models. (a) 10 MPa. (b) 15 MPa. (c) 20 MPa.
Energies 17 01505 g009
Figure 10. Three-dimensional structural model.
Energies 17 01505 g010
Figure 11. Relative permeability curve.
Energies 17 01505 g011
Figure 12. Reservoir history fitting results.
Energies 17 01505 g012
Figure 13. Comparison of pressure in different layers. (a) Layer-V31. (b) Layer-VI11.
Energies 17 01505 g013
Figure 14. Comparison of streamline fields with different development methods. (a) After water-driven development. (b) After polymer water-driven development. (c) After injection–production coupling. (ac) scale bar: 250 m, 1:4136.
Energies 17 01505 g014
Figure 15. Residual oil in selected reservoir profiles.
Energies 17 01505 g015
Figure 16. Distribution of the four types of residual oil reserves.
Energies 17 01505 g016
Figure 18. Mechanistic model. (a) Top surface structure of Layer 1. (b) Top surface structure of Layer 2. (c) Planar meshing. (d) Vertical meshing. (e) 1000~100 mD (upper plane). (f) 50~500 mD (lower plane).
Energies 17 01505 g018aEnergies 17 01505 g018b
Figure 20. Comparison of water-driven and injection–production coupling development.
Energies 17 01505 g020
Table 1. Information on the sandpack model.
No.Inlet Pressure, MPaOutlet Pressure, MPaPorosity, %Permeability,
10−3 μm2
Oil Saturation,%
T10.084022.840.96459.32
T20.081022.440.52386.04
T30.075023.170.28677.36
Table 2. Horizon information and grid parameters.
HorizonGrid NumberHorizonGrid Number
H3V114H3V811
H3V128H3VI115
H3V217H3VI125
H3V225H3VI135
H3V234H3VI216
H3V315H3VI228
H3V327H3VI310
H3V338H3VI416
H3V416H3VI427
H3V429H3VI55
H3V517H3VI615
H3V526H3VI625
H3V69H3VI77
H3V79H3VI814
Table 3. Model parameter setting.
ParametersValue
Porosity25.37%
Permeability0.475 D
Saturation pressure4.15 MPa
GOR12.3 m3/t
API30.21
Disclaimer/Publisher’s Note: The statements, opinions and data contained in all publications are solely those of the individual author(s) and contributor(s) and not of MDPI and/or the editor(s). MDPI and/or the editor(s) disclaim responsibility for any injury to people or property resulting from any ideas, methods, instructions or products referred to in the content.

