
Molecular Dynamics Simulations of Thermal Transport of Carbon Nanotube Interfaces

Faculty of Metallurgical and Energy Engineering, Kunming University of Science and Technology, Kunming 650093, China
*
Authors to whom correspondence should be addressed.
Energies 2024, 17(6), 1506; https://doi.org/10.3390/en17061506
Submission received: 18 February 2024
/
Revised: 15 March 2024
/
Accepted: 18 March 2024
/
Published: 21 March 2024
(This article belongs to the Topic Biomass for Energy, Chemicals and Materials)
Abstract
:In this paper, non-equilibrium molecular dynamics simulations are used to study the interfacial heat exchange capacity of one-dimensional carbon nanotube nested structures. When the radius of the CNT substrate is increased from 1.356 to 2.712 nm, the ITC has a great enhancement from 1.340 to 2.949 nw/k. After this, we investigate the effects of overlap length, CNT length, and van der Waals interaction strength on the thermal resistance of the interface between carbon nanotubes. Firstly, we found that the nesting depth can significantly increase the ITC, and the increase in ITC is more obvious at an overlap length of 40 Å than at 30 Å. After this, the effect of length on the interfacial thermal conductivity is investigated, and the interfacial thermal conductivity is enhanced by 33.8% when the length is increased to 30 nm. Finally, the effect of van der Waals interaction strength was investigated, and the ITC increased from 1.60 nW/K to 2.71 nW/K when the scale factor was increased from 1 to 2.
1. Introduction
Carbon nanotubes are highly desired by many scholars because of their superior electrical [1,2], thermal, and mechanical properties [3,4]. CVD methods [5] are commonly used to prepare carbon nanotubes. Carbon nanotubes are also used in wastewater treatment because of their excellent adsorption properties. Titus et al. [6] investigated the mechanism of carbon nanotube adsorption by studying the adsorption of harmful metals such as Pb [7,8], Mn [9], Zn [10], etc. in a practical manner. The extremely high thermal conductivity of carbon nanotubes (CNTs) makes them the most promising composite nanomaterials for heat transfer [11]. The combination of high thermal conductivity and high mechanical compliance makes carbon nanotube arrays a potential choice for high-performance thermal interface materials (TIMs) [12,13]. However, compared to the ultra-high thermal conductivity of carbon nanotubes alone, it has been found that when carbon nanotubes are integrated into practical device applications, the overall improvement in thermal performance by CNTs is rather limited. For example, experiments have shown that the thermal conductivity of multi-walled carbon nanotube (MWNT)-epoxy composites increases slightly with the increase in CNT filling, while the thermal conductivity of single-walled carbon nanotube (SWNT) composites can be even lower than that of epoxy resin. The performance of carbon nanotube-based TIMs is also lower than expected, with thermal conductivities in the range of 103~105 Wm−2 K−1, which are even lower than those of some conventional TIMs. The mechanism of interfacial heat transport is involved. Since the nature of interfacial heat transport usually requires atomic-level simulations to study this effect, MD simulations have been carried out by many scholars on the interfacial thermal conductivity of CNTs.
Some works focus on the interface between horizontally placed carbon nanotubes and the substrate for example, Ong [14] quantified the Interfacial Thermal Conduction (ITC) between horizontally distributed SWNTs and an amorphous SiO2 substrate by nonequilibrium molecular dynamic (NEMD) simulations. They found that the thermal conductivity, normalized by diameter, is about 106 Wm−2 K−1, which is proportional to the coupling strength of the force field. Simulations of single-walled carbon nanotubes showed that the spacing between carbon nanotubes, the contact angle, and the tube length all have a significant effect on the ITC. Hu et al. [15] investigated the effects of carbon nanotube length, contact area, and air pressure on the thermal conductivity of CNTs. The thermal conductivity increased with the increase in carbon nanotube length. They also considered the effect of the crossing angle and initial carbon nanotube spacing on the thermal conductivity at the SWNT junction. The results showed that the thermal conductivity decreased as the SWNT spacing and crossover angle increased, while the thermal conductivity increased as the spacing increased. Yang et al. [16] measured a thermal conductivity value of about 10−8 W·K−1 at the crossover junctions between two SWNTs with diameters of 74 nm and 121 nm, and a thermal conductivity value of about 10−8 W·K−1 at the crossover junctions between two SWNTs with diameters of 170 and 165–185 nm. In addition, they found a thermal conductivity value of 10−6 W·K−1 at the aligned junction of 2.5 µm in length between two SWNTs with diameters of 170 and 121 nm.
Ying et al. [17] modeled the intertube thermal transport in one-dimensional heterostructures by NEMD simulations. It was found that for the one-dimensional heterostructure with a substrate of (40,40)CNT, the boron nitrogen nanotube (BNNT) coating increased the thermal conductivity inside the system by 36%, while the molybdenum disulfide nanotube (MSNT) coating decreased the thermal conductivity inside the system by 47%. Meanwhile, they found that the nanotube coating changes the thermal conductivity of the system by changing the heat flow as well as the temperature gradient. The nanocoating increases the heat flow, but the MSNT itself has a small thermal conductivity, leading to a larger temperature gradient in the system and thus a reduction in the thermal conductivity of the system. Therefore, it is necessary to study the effect of carbon nanotube coating on interfacial thermal conductivity.
2. Simulation Methods
2.1. Modeling and Molecular Dynamics Simulations
In this study, the effects of carbon nanotube radius, carbon nanotube length overlap length, and interaction strength between carbon nanotubes on the interfacial thermal resistance are considered. In general, the chiral vector r of the carbon nanotube is the linear group of the basis vectors, r is denoted as r = ma1 + ma2 (a1 and a2 are the chiral parameters of the carbon nanotubes), which is also denoted as (m,n)CNT. The CNTs in the present simulation are all armchair-type carbon nanotubes. The radius of the carbon nanotubes was varied by changing the chiral parameters of the CNTs. The CNT coatings have the same chirality as the CNT base. For convenience of description, the nested carbon nanotube structures discussed below are referred to as (m1,n1)@(m2,n2)CNTs, e.g., (45,45)CNT-based nested (50,50)CNT coatings are denoted as (50,50)@(45,45)CNTs. In this simulation, the bond length of the CNTs is set to 1.42 Å. and the thickness to 3.40 Å [18], which is basically consistent with the theoretical values.
The molecular dynamics simulations carried out in this study were implemented using the publicly available simulation code LAMMPS [19], and the standard Newtonian equations of motion were time-integrated using the velocity Verlet algorithm. The time step was set to 1.0 fs. The energy was first minimized for all initial structures. Then, the equilibrium state was obtained by further relaxing the structure along the axial direction at 300 K and 0 GP for 500 ps. Finally, the heat and cold sources were maintained at 325 K and 275 K, respectively, using a Langevin [20] thermostat. For the CNTs’ inner and outer tubes, the interactions between the atoms in a single tube were described by the Tersoff [21,22] potential, which was shown to be a more accurate predictor of the heat transport properties than other classical force fields such as the Stillinger–Weber potential, due to previous studies. For the long interaction between the two tubes, we use the L-J potential to describe it with the expression:
where r is the interatomic distance, ε is the energy parameter, and σ is the van der Waals diameter. The scaling parameter χ is used to adjust the interaction strength between CNTs, which is discussed in detail for the effect of van der Waals interaction strength on thermal conductance.
As shown in Figure 1a, for the NEMD simulation, the whole nanotube is divided into five regions along the axial direction, which includes two fixed regions at both ends, adjacent hot and cold regions (i.e., cold and heat sources), and an intermediate heat flow region. The lengths of both fixed regions were set to 5 Å, and the lengths of the hot and cold regions were set to 10 Å. The temperatures of the cold and hot regions were set to 275 K and 325 K, respectively. The temperature jumps at the interface between the tubes were generated by dividing the whole system into 40 portions along the axial direction, and the time-averaged temperatures of each plate were recorded. Heat transport simulations were performed for 3500 ps, in which a stable temperature distribution was achieved within the first 1500 ps, while the temperature jumps were obtained by averaging the MD simulations over 1000 ps, as shown in Figure 1b, with both CNT@CNT lengths of 10 nm. At the same time, the input power to the cold zone and the output power to the hot zone, as shown in Figure 1c,d, were combined by J = (Qh + Qc)/2Dt and averaged. The corresponding heat flow, J, is recorded, where Qc and Qh are the cumulative energies of the cold and hot zones (i.e., cold source and heat source zones), respectively, during the operation Dt. The parameter, χ, is a scaling factor used to adjust the coupling strength, and in this simulation, the action parameters of the C-C bond are set to ε = 0.002968 eV and σ = 0.3407 [23], respectively.
2.2. Calculation of Interfacial Thermal Conductivity and Vibrational Dynamic Density
The ITC is calculated by employing the NEMD method. In this simulation, we artificially create an interface so that the heat flow J crosses the overlapping interface to produce a large temperature jump dT. The ITC G is calculated by Fourier’s law:
where J is the heat flow, and dT is the temperature jump at the interface.
In this calculation, the heat source with a length of 1 nm is located on the left side of the double-walled carbon nanotubes, the cold source with the same length is located on the right side of the system after the thermal chirp process after 1500 ps, and the temperature of the overlap region in the 1000 ps thereafter is utilized to calculate the temperature difference between inside and outside carbon nanotubes, dT.
The phonon vibrational dynamic density (VODS) can be obtained from the velocity autocorrelation function (VACF) by Fourier transform:
where v denotes the frequency, i is an imaginary unit, γ is the velocity autocorrelation function where v denotes the frequency, is an imaginary unit, and γ is the velocity autocorrelation function, where the expression of () is: , where vi(0) and vi(t) are the velocities of the ith atom at the moment of t and at the initial state, respectively. After the structure reaches the equilibrium stage, the VACF is calculated with a simulation time of 10 ps. In this simulation, the velocity information collected at every 20 time steps is used to calculate the VACF. The expression of γ(t) is: , where vi(0) and vi(t) are the velocities of the ith atom at moment t and initial state, respectively. The VACF is calculated after the structure reaches the equilibrium stage with a simulation time of 30 ps. In this simulation, the velocity information collected every 10 time steps is used to calculate the VACF.
In this NEMD simulation, only the effect of phonon transport on the interfacial thermal conductivity is considered without phonon transport. This is due to the following reasons: first, in carbon nanotubes, its heat carriers are mainly lattice vibrations or phonons. In this case, the contribution of electrons to the thermal transport is negligible. Secondly, it has been demonstrated that the electrical conductivity of carbon nanotubes is around 105 S/m [24]. Therefore, according to the Wiedemann–Franz law, the electrons provide a thermal conductivity of about 1 W/mK to the CNTs [25], which is much smaller than the effect of phonon transport on the thermal conductivity.
3. Results and Discussion
To verify the correctness of the model, we first calculated the thermal conductivity of a single (40,40) CNT. Its radius is 27.12 Å and its length is 20 nm. The thermal conductivity is also calculated using the classical NEMD method. That is, Fourier’s law of thermal conductivity was utilized to calculate the thermal conductivity of carbon nanotubes, K:
where J denotes the heat flow along the axial direction of the nanotube. ∇T = dT/dx is the axial temperature gradient, tx is the temperature coordinate, and x is the axial coordinate. a is the cross-sectional area of the nanotube, A = π(R2out − r2in), where Rout is the outer radius of the carbon nanotube and rin is the thickness of the carbon nanotube assuming that the thickness of the inner and outer nanotubes is equal to the diameter. In this study, the thickness of CNT is assumed to be 0.34 nm. The thermal conductivity of (40,40) CNT is calculated to be 602.65 W/mK, which is consistent with the thermal conductivity calculated based on the NEMD method and ensures the correctness of the simulation [26].
3.1. Effect of CNT Radius and Overlap Length
This simulation refers to Figure 1b. The boundary conditions in all directions are set as periodic boundary conditions. The length of the CNTs is set to 10 nm, and the nesting depth is set to 2 nm while their radii are adjusted by changing different chiralities. Figure 2 represents the variation of CNT@CNT cold and hot source energies and (50,50)CNT@(45,45)CNT temperature distributions for different radii, and it can be seen that there is a very obvious temperature jump between the CNT layers, whereas there is no obvious temperature gradient in both the inner and outer tubes of the CNTs, due to the fact that the thermal conductivity of the CNTs in the axial direction is much larger than that at the interface.
In the case of a larger CNT base radius, the heat flow of the system has to be larger. The heat flow of the (50.50)@(45,45) CNT with the largest heat flow can reach 0.839 ev/ps, while the heat flow of the (25,25)@(20,20) CNT with the smallest heat flow is 0.392 ev/ps. This is related to the cross-sectional area of the CNT. The larger the diameter of the tube of the CNT is, the larger the area that is involved in the heat exchange, and the more the heat flow passes through the interface at the interface. Also, a larger diameter means that more phonons can be transported through the interface. The larger the radius, the more atoms within the cutoff distance of the LJ potential, and the more atoms involved in heat transfer are more favorable for heat dissipation, which means an increase in thermal conductance at the interface. Table 1 gives the specific data for this calculation:
As shown in Table 1, the temperature jump of the carbon nanotube inner and outer coatings is not clearly related to the CNT base. Regarding the interfacial thermal resistance, the maximum ITC of (50,50)@(45,45)CNT is 2.949 nW/K, and the minimum of (25,25)@(20,20)CNT is 1.34 nW/K. The ITC of double-walled carbon nanotubes increases gradually with the increase in the radius of the CNT bases, and there is an almost linear relationship between the two. The interfacial thermal conductivity is affected by the density of phonon states (VDOSs) between different solids, and the VDOSs between CNTs can reflect the nature of thermal transportation between CNTs. The VDOS curves of the three CNT@CNTs as a whole are given in Figure 2c. It can be found that the curves are all very similar, and the VDOS curves have significant peaks near 13 HZ, 25 HZ, and 50 HZ. As the radius increases, it can be observed that the peak of the VDOS curve has been enhanced near 3 HZ, which corresponds to the increase in the number of low-frequency phonons in this frequency band, representing more low-frequency phonons involved in the heat transfer process, which hardens the phonon motion pattern and attenuates the dispersion of the phonons between the CNT tubes and thus makes the ITC higher.
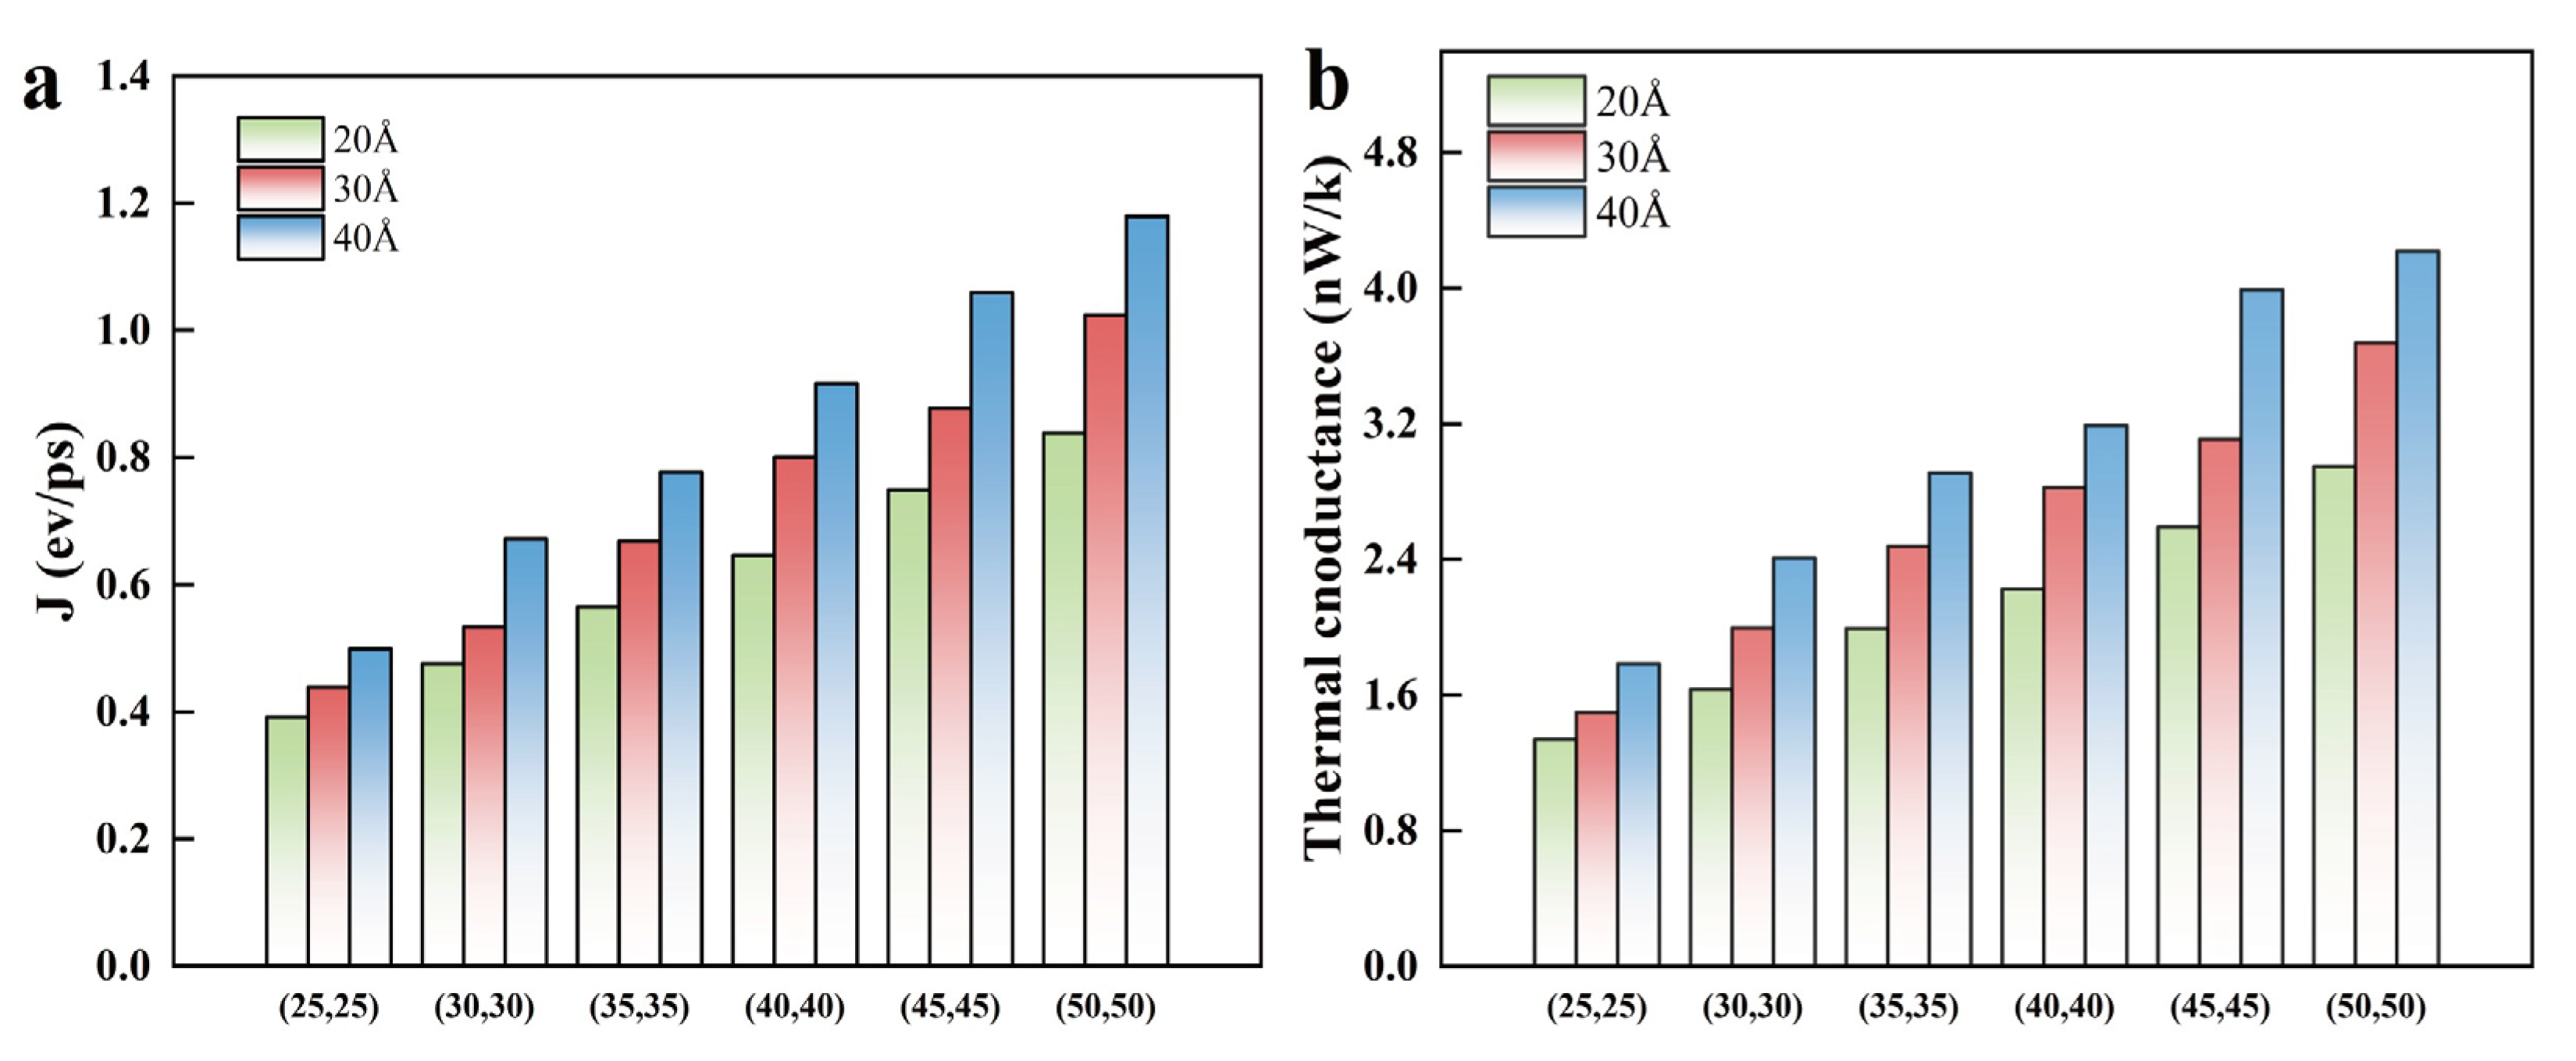
The spatial distribution between CNTs also has a large influence on the interfacial thermal conductivity of the system. Some scholars have studied the effect of CNTs placed horizontally or vertically on the ITC, for example, the effect of overlap length on the heat flux and interfacial thermal conductivity of two CNTs placed in parallel has been studied in the literature of Liao et al. [27]. They found that the heat flux through the interface and the ITC gradually increased with the increase in the overlap length. In this subsequent work, we selected (40,40)@(35,35)CNT and (30.30)@(25,25)CNT to study the ITC between CNTs. The nesting length between CNTs was increased from 20 Å to 30 Å vs. 40 Å in this calculation, and the corresponding interfacial thermal resistivity of the calculated systems is still calculated by Equation (1).
From Figure 3a, we can clearly find that the overlap length increases the ITC by increasing the heat flow through the CNT@CNT interface. For example, the heat flow through the interface is 0.84 ev/ps, 1.02 ev/ps, and 1.18 ev/ps in order for (50,50)@(45,45)CNT, and the ITC is also increased from 2.95 nW/K to 4.22 nW/K, which is consistent with our expected results. As the overlap length Δx increases, more carbon atoms at the overlap participate and promote heat transport through the junction, which directly enhances the ITC. Through Figure 3b, we can find that the enhancement effect on the interfacial thermal conductivity is more obvious when the nesting depth is 40 Å than 30 Å.
3.2. Effect of CNT Length
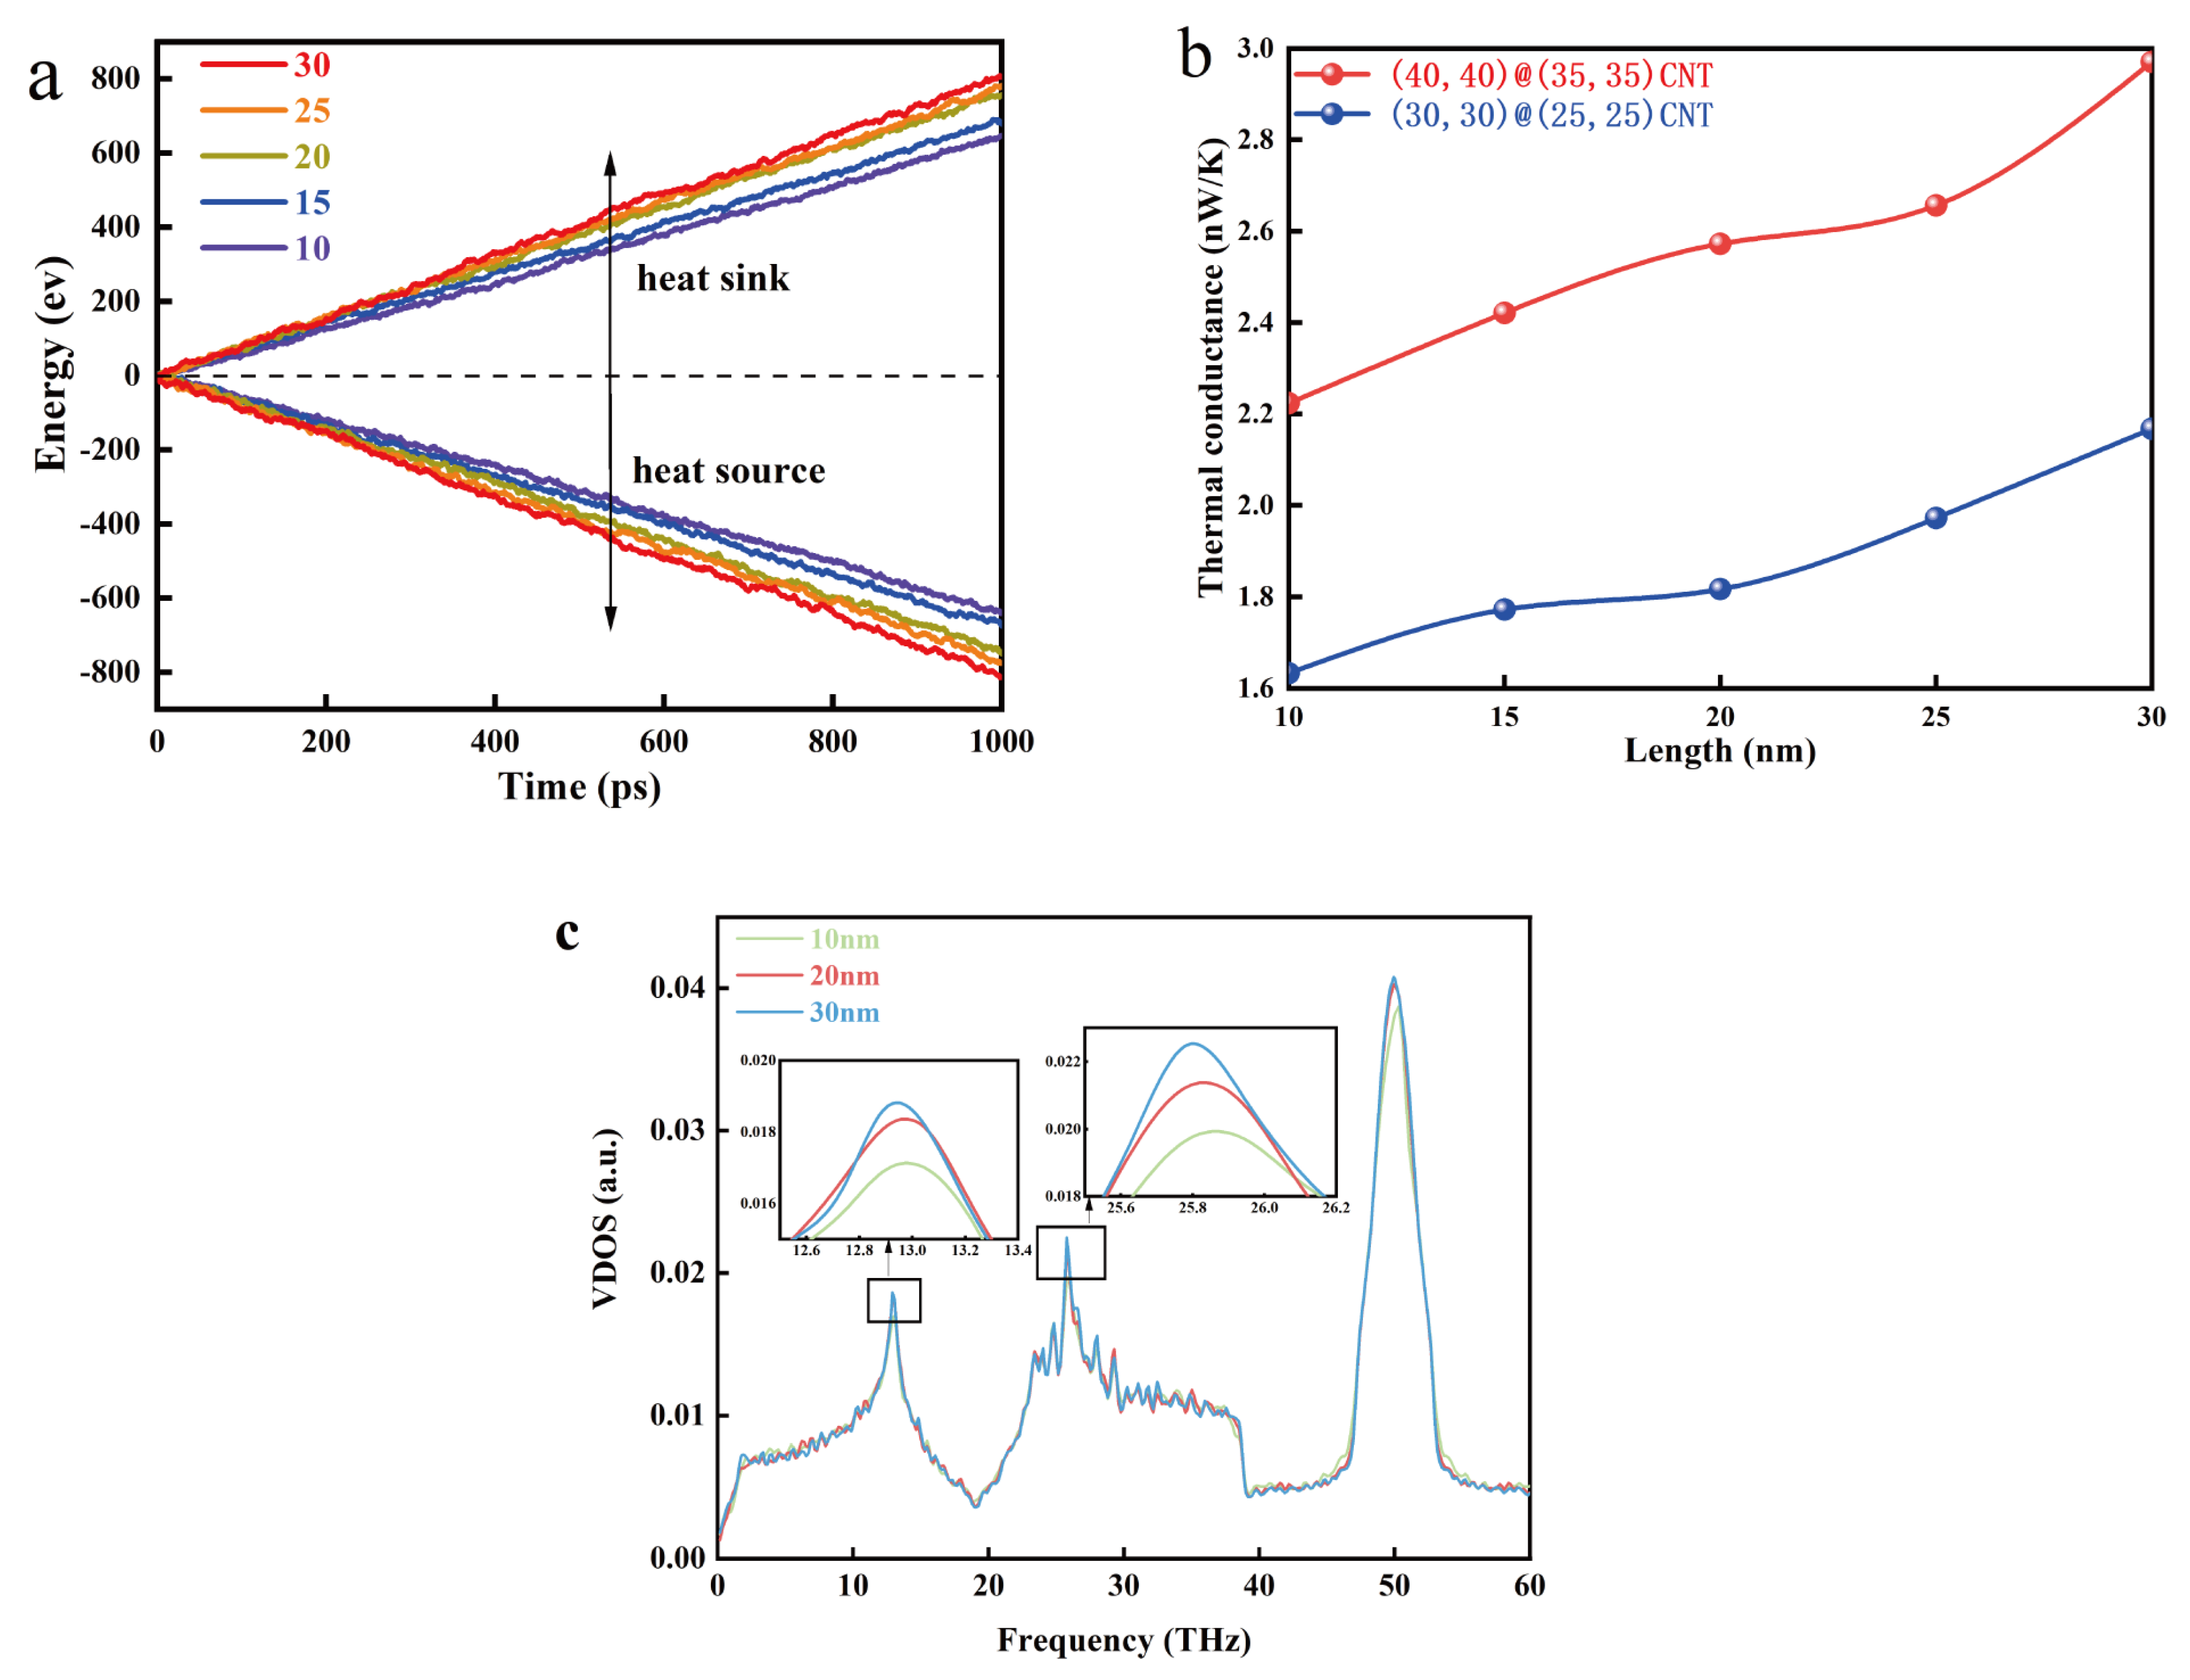
According to previous studies, it was found that the length of CNTs also has an effect on the interfacial thermal conductivity, and most scholars believe that the longer the length of the CNTs, the larger the interfacial thermal conductivity between the tubes. For example, Yang et al. [28] investigated the intertube thermal conductivity between two CNTs and found that the intertube thermal conductivity was 1.46 × 10⁻⁸ W·K−1~1.64 × 10⁻⁸ W·K−1 when the tube length was 24.56~123 nm. In this simulation, (40,40)@(35,35)CNT and (30.30)@(25,25)CNT are selected at a nesting depth of 2 nm, and the length of a single tube is gradually increased from 10 nm to 30 nm to explore the effect of length on thermal conductivity.
Figure 4b delineates the relationship between thermal conductivity and the length of carbon nanotubes (CNTs). For the nested configuration of (40,40)@(35,35) CNTs, the interfacial thermal conductance (ITC) registers at 2.22 nW/K for a length of 10 nm, whereas an increase in the CNT length to 30 nm correlates with an enhanced thermal conductivity of 2.97 nW/K, equating to a 33.8% improvement in ITC. Correspondingly, Figure 4a illustrates a significant augmentation in heat flux across the interface with increased CNT length, potentially attributed to intrinsic modifications in the thermal conductivity of the CNTs themselves. Consistent with Rhicard’s theoretical framework [29], the thermal conductivity of CNTs escalates with length, facilitating a pronounced rise in the heat flux through the interface, thereby bolstering the interfacial thermal conductance. An analogous rate of increase is also discerned within (30,30)@(25,25) CNT configurations. This insight is critical for advancing the ITC in nested CNT structures. Prevailing academic perspectives suggest that an elongation in tube length amplifies the quantity of low-frequency phonons, thereby elevating the ITC. To substantiate this phonon-related hypothesis, the vibrational density of states (VDOSs) for the comprehensive system of (40,40)@(35,35) CNTs was analyzed, as depicted in Figure 4c. The graphical data reveal pronounced peaks in phonon enhancement near 13 Hz and 25 Hz, evidencing that length extension activates low-frequency phonon modes, leading to a subsequent stiffening of these modes and an improvement in interfacial thermal conductivity, aligning with our previously derived conclusions.
3.3. Effect of Van Der Waals Interaction Strength
The van der Waals interaction strength also has a large effect on the ITC. Liao et al. [27] found that the ITC between the CNTs increases as the interaction strength increases. Van der Waals force interaction exists at the junction of two carbon nanotubes. The interaction strength is adjusted by changing the scaling factor χ in Equation (1). The nesting depth between CNTs is set to 20 Å. The rest of the simulation conditions are set up as in Section 3.2.
The influence of the van der Waals interaction strength on the ITC is demonstrated in Figure 5. Specifically, the ITC values for (40,40)@(30,30) carbon nanotubes (CNTs) exhibit an increase from 2.13 nW/K to 3.92 nW/K as the interaction parameter, χ, increases. This enhancement in heat transfer across the interface and the corresponding rise in ITC are consistently observed with the incremental adjustment of χ. This trend is graphically illustrated through the augmentation depicted in Figure 5c,d, which elucidates the variations in ITC with changing χ values. Furthermore, Figure 5c,d presents the vibrational density of states (VDOSs) for the internal and external tubes of the CNTs at χ values of 1.25 and 2, respectively. Analysis of these VDOS curves reveals an increased overlap as χ incrementally rises, indicating enhanced phonon coupling between the concentric carbon nanotubes and thereby augmenting interfacial thermal transport. Consequently, these observations substantiate the hypothesis that the van der Waals interaction strength serves as a pivotal parameter in modulating the interfacial thermal transport within CNT systems.
Although it is difficult to change the ITC by directly changing the scaling factor χ under practical conditions, it can be achieved by applying electron radiation by applying an external force pressure [30], or through electron irradiation [31]. The relationship between the strength of graphene interlayer interactions and the interlayer thermal conductance was investigated in the work of Xu et al. [32]. Taking into account the structural differences between the CNTs as well as the different choices of the energy parameter ε, ε = 4.555 mev in their work, and ε = 2.84 mev in ours. Considering the difference in radius between CNTs, the difference in heat transfer area, and the different arrangement of CNTs, the difference in thermal conductivity at the interface is normal, but the overall trend is consistent.
4. Conclusions
In this paper, the interfacial heat transport behavior between CNTs is investigated by the NEMD simulation method. The interfacial heat transport process between CNTs is simulated under the influence of different radii, lengths, overlap lengths, and van der Waals interaction strengths. We found that the thermal conductivity at the interface of CNT@CNT is much smaller than the axial thermal conductivity of CNT, which creates a large temperature difference at the interface. First, we explored the effect of radius and overlap length on the thermal conductivity at the interface. For increasing the radius and overlap length of CNTs, the heat exchange area of CNTs can be increased, thus increasing the ITC. Analyzing the VODS, it can be found that the larger the radius of CNTs, the larger the peak near 13 HZ, which represents that more low-frequency phonons are involved in the heat transfer process. The increase in the CNT length also makes the VODS curve increase near 25 HZ, which shows that more low-frequency phonons are involved in the heat transfer process on the VDOS, which weakens the phonon scattering between the CNT tubes and thus makes the interfacial thermal conductivity increase. Finally, the effect on the thermal transport between carbon nanotubes was also investigated by tuning the van der Waals interaction scale factor, where increasing the van der Waals interaction strength increases the heat flow through the CNTs interface and thus increases the ITC. From the phonon point of view, the van der Waals interaction strength enhances the phonon coupling between the CNTs and thus enhances the ITC.
Author Contributions
Methodology, X.Z.; Software, X.Z.; Formal analysis, S.Z.; Investigation, S.Q.; Resources, S.Z. and S.Q.; Writing—original draft, S.Z.; Writing—review & editing, S.Z.; Supervision, M.H.; Funding acquisition, H.H. All authors have read and agreed to the published version of the manuscript.
Funding
This research was funded by The National Natural Science Foundation of China (51966005).
Data Availability Statement
Data are contained within the article.
Conflicts of Interest
All authors disclosed no relevant relationships.
References
- Khabushev, E.M.; Krasnikov, D.V.; Kolodiazhnaia, J.V.; Bubis, A.V.; Nasibulin, A.G. Structure-dependent performance of single-walled carbon nanotube films in transparent and conductive applications. Carbon 2020, 161, 712–717. [Google Scholar] [CrossRef]
- Kopylova, D.S.; Satco, D.A.; Khabushev, E.M.; Bubis, A.V.; Krasnikov, D.V.; Kallio, T.; Nasibulin, A.G. Electrochemical enhancement of optoelectronic performance of transparent and conducting single-walled carbon nanotube films. Carbon 2020, 167, 244–248. [Google Scholar] [CrossRef]
- Kaur, S.; Raravikar, N.; Helms, B.A.; Prasher, R.; Ogletree, D.F. Enhanced thermal transport at covalently functionalized carbon nanotube array interfaces. Nat. Commun. 2014, 5, 3082. [Google Scholar] [CrossRef] [PubMed]
- Qazi, U.Y.; Javaid, R. Graphene Utilization for Efficient Energy Storage and Potential Applications: Challenges and Future Implementations. Energies 2023, 16, 2927. [Google Scholar] [CrossRef]
- Novikov, I.V.; Krasnikov, D.V.; Khabushev, E.M.; Shestakova, V.S.; Matyushkin, Y.E.; Nasibulin, A.G. A new method for evaluation of nanotube growth kinetics in aerosol CVD. Carbon 2024, 217, 118589. [Google Scholar] [CrossRef]
- Abdulkareem, A.S.; Hamzat, W.A.; Tijani, J.O.; Egbosiuba, T.C.; Mustapha, S.; Abubakre, O.K.; Okafor, B.O.; Babayemi, A.K. Isotherm, kinetics, thermodynamics and mechanism of metal ions adsorption from electroplating wastewater using treated and functionalized carbon nanotubes. J. Environ. Chem. Eng. 2023, 11, 109180. [Google Scholar] [CrossRef]
- Egbosiuba, T.C.; Egwunyenga, M.C.; Tijani, J.O.; Mustapha, S.; Abdulkareem, A.S.; Kovo, A.S.; Krikstolaityte, V.; Veksha, A.; Wagner, M.; Lisak, G. Activated multi-walled carbon nanotubes decorated with zero valent nickel nanoparticles for arsenic, cadmium and lead adsorption from wastewater in a batch and continuous flow modes. J. Hazard. Mater. 2022, 423, 126993. [Google Scholar] [CrossRef] [PubMed]
- Egbosiuba, T.C.; Abdulkareem, A.S.; Tijani, J.O.; Ani, J.I.; Krikstolaityte, V.; Srinivasan, M.; Veksha, A.; Lisak, G. Taguchi optimization design of diameter-controlled synthesis of multi walled carbon nanotubes for the adsorption of Pb(II) and Ni(II) from chemical industry wastewater. Chemosphere 2020, 266, 128937. [Google Scholar] [CrossRef]
- Egbosiuba, T.C.; Abdulkareem, A.S.; Kovo, A.S.; Afolabi, E.A.; Tijani, J.O.; Roos, W.D. Enhanced adsorption of As(V) and Mn(VII) from industrial wastewater using multi-walled carbon nanotubes and carboxylated multi-walled carbon nanotubes. Chemosphere 2020, 254, 126780. [Google Scholar] [CrossRef]
- Egbosiuba, T.C.; Abdulkareem, A.S. Highly efficient as-synthesized and oxidized multi-walled carbon nanotubes for copper(II) and zinc(II) ion adsorption in a batch and fixed-bed process. J. Mater. Res. Technol. 2021, 15, 2848–2872. [Google Scholar] [CrossRef]
- Nylander, A.; Hansson, J.; Kabiri Samani, M.; Chandra Darmawan, C.; Borta Boyon, A.; Divay, L.; Ye, L.; Fu, Y.; Ziaei, A.; Liu, J. Reliability Investigation of a Carbon Nanotube Array Thermal Interface Material. Energies 2019, 12, 2080. [Google Scholar] [CrossRef]
- Jiang, Y.; Song, S.; Mi, M.; Yu, L.; Xu, L.; Jiang, P.; Wang, Y. Improved Electrical and Thermal Conductivities of Graphene–Carbon Nanotube Composite Film as an Advanced Thermal Interface Material. Energies 2023, 16, 1378. [Google Scholar] [CrossRef]
- Baek, S.; Lee, S.; Sung, Y.; Shin, D.; Kim, J.; Jeong, H. Effect of an Amphoteric Surfactant Concentration on Absorbance, Contact Angle, Surfactant, and Thermal Conductivity of CNT Nanofluids. Energies 2023, 17, 113. [Google Scholar] [CrossRef]
- Ong, Z.-Y.; Pop, E. Molecular dynamics simulation of thermal boundary conductance between carbon nanotubes and SiO2. Phys. Rev. B 2010, 81, 155408. [Google Scholar] [CrossRef]
- Hu, G.-J.; Cao, B.-Y. Thermal resistance between crossed carbon nanotubes: Molecular dynamics simulations and analytical modeling. J. Appl. Phys. 2013, 114, 224308. [Google Scholar] [CrossRef]
- Yang, J.; Waltermire, S.; Chen, Y.; Zinn, A.A.; Xu, T.T.; Li, D. Contact thermal resistance between individual multiwall carbon nanotubes. Appl. Phys. Lett. 2010, 96, 023109. [Google Scholar] [CrossRef]
- Ying, P.; Zhang, J.; Du, Y.; Zhong, Z. Effects of coating layers on the thermal transport in carbon nanotubes-based van der Waals heterostructures. Carbon 2021, 176, 46–457. [Google Scholar] [CrossRef]
- Huang, Y.; Wu, J.; Hwang, K.C. Thickness of graphene and single-wall carbon nanotubes. Phys. Rev. B 2006, 74, 245413. [Google Scholar] [CrossRef]
- Wu, Z.; Li, Y.; Zhang, B.; Yang, W.; Yang, B. Co-pyrolysis behavior of microalgae biomass and low-rank coal: Kinetic analysis of the main volatile products. Bioresour. Technol. 2018, 271, 202–209. [Google Scholar] [CrossRef]
- Schneider, T.; Stoll, E. Molecular-dynamics study of a three-dimensional one-component model for distortive phase transitions. Phys. Rev. B. 1978, 17, 1302–1322. [Google Scholar] [CrossRef]
- Lindsay, L.; Broido, D.A. Optimized Tersoff and Brenner empirical potential parameters for lattice dynamics and phonon thermal transport in carbon nanotubes and graphene. Phys. Rev. B 2010, 81, 205441:1–205441:6. [Google Scholar] [CrossRef]
- Kınacı, A.; Haskins, J.B.; Sevik, C.; Çağın, T. Thermal conductivity of BN-C nanostructures. Phys. Rev. B 2012, 86, 115410. [Google Scholar] [CrossRef]
- Saito, R.; Matsuo, R.; Kimura, T.; Dresselhaus, G.; Dresselhaus, M.S. Anomalous potential barrier of double-wall carbon nanotube. Chem. Phys. Lett. 2001, 384, 187–193. [Google Scholar] [CrossRef]
- Kodama, T.; Ohnishi, M.; Park, W.; Shiga t Park, J.; Shimada, T.; Shinohara, H.; Shiomi, J.; Goodson, K.E. Modulation of thermal and thermoelectric transport in individual carbon nanotubes by fullerene encapsulation. Nat. Mater. 2017, 16, 892–897. [Google Scholar] [CrossRef] [PubMed]
- Dong, H.; Fan, Z.; Qian, P.; Ala-Nissila, T.; Su, Y. Thermal conductivity reduction in carbon nanotube by fullerene encapsulation: A molecular dynamics study. Carbon 2020, 161, 800–808. [Google Scholar] [CrossRef]
- Salaway, R.N.; Zhigilei, L.V. Molecular dynamics simulations of thermal conductivity of carbon nanotubes: Resolving the effects of computational parameters. Int. J. Heat Mass Transf. 2014, 70, 954–964. [Google Scholar] [CrossRef]
- Liao, D.; Chen, W.; Zhang, J.; Yue, Y. Tuning thermal conductance of CNT interface junction via stretching and atomic bonding. J. Phys. D Appl. Phys. 2017, 50, 475302. [Google Scholar] [CrossRef]
- Yang, X.; Chen, D.; Han, Z.; Ma, X.; To, A.C. Effects of welding on thermal conductivity of randomly oriented carbon nanotube networks. Int. J. Heat Mass Transf. 2014, 70, 803–810. [Google Scholar] [CrossRef]
- Salaway, R.N.; Zhigilei, L.V. Thermal conductance of carbon nanotube contacts: Molecular dynamics simulations and general description of the contact conductance. Phys. Rev. B 2016, 94, 014308. [Google Scholar] [CrossRef]
- Schiffres, S.N.; Kim, K.H.; Hu, L.; McGaughey, A.J.; Islam, M.F.; Malen, J.A. Gas Diffusion, Energy Transport, and Thermal Accommodation in Single-Walled Carbon Nanotube Aerogels. Adv. Funct. Mater. 2012, 22, 5251–5258. [Google Scholar] [CrossRef]
- Sun, L.; Banhart, F.; Krasheninnikov, A.V.; Rodriguez-Manzo, J.A.; Terrones, M.; Ajayan, P.M. Carbon Nanotubes as High-Pressure Cylinders and Nanoextruders. Science 2006, 312, 1199–1202. [Google Scholar] [CrossRef] [PubMed]
- Xu, Z.; Buehler, M.J. Nanoengineering heat transfer performance at carbon nanotube interfaces. ACS Nano 2009, 3, 2767–2775. [Google Scholar] [CrossRef] [PubMed]
Figure 1.
(a) (40,40) CNT axial temperature distribution. (b) (45,45) CNT@(40,40) CNT axial temperature distribution, and (c) the corresponding cumulative energy change in the cold and hot zones used in the calculation of the axial thermal conductivity. (c) Temperature distribution along the axial direction of CNT@BNNT and (d) the corresponding cumulative energy change in the cold and hot zones used in the calculation of the interfacial thermal conductivity. The insets in (a,b) illustrate the corresponding simulation setup.

Figure 2.
(a). Temperature distribution of (50,50) CNT@(45,45) CNT. (b). Variation of energy of different CNT-based cold and heat sources. (c). VDOS at different radii.
Figure 2.
(a). Temperature distribution of (50,50) CNT@(45,45) CNT. (b). Variation of energy of different CNT-based cold and heat sources. (c). VDOS at different radii.

Figure 3.
(a). Interfacial thermal conductivity. (b). Interfacial heat flow.

Figure 4.
(a). Variation of energy of CNT hot and cold sources with different lengths. (b). Interfacial thermal conductivity of different lengths. (c). VDOS at different lengths.
Figure 4.
(a). Variation of energy of CNT hot and cold sources with different lengths. (b). Interfacial thermal conductivity of different lengths. (c). VDOS at different lengths.

Figure 5.
(a). Variation of energy of CNT hot and cold sources with different χ. (b). Interfacial thermal conductivity of different χ. (c). VDOS of CNT inner and outer tubes at χ = 1.25. (d). VDOS of CNT inner and outer tubes at χ = 2.0.
Figure 5.
(a). Variation of energy of CNT hot and cold sources with different χ. (b). Interfacial thermal conductivity of different χ. (c). VDOS of CNT inner and outer tubes at χ = 1.25. (d). VDOS of CNT inner and outer tubes at χ = 2.0.


Table 1.
Calculation of interfacial thermal conductivity for different CNT bases.
| CNT-Coating | Rin (Å) | dt (K) | G (nW/K) |
|---|---|---|---|
| (50,50) | 30.51 | 45.568 | 2.949 |
| (45,45) | 27.12 | 46.336 | 2.590 |
| (40,40) | 23.72 | 46.540 | 2.223 |
| (35,35) | 20.34 | 45.379 | 1.994 |
| (30,30) | 16.95 | 46.638 | 1.633 |
| (25,25) | 13.56 | 46.864 | 1.340 |
Disclaimer/Publisher’s Note: The statements, opinions and data contained in all publications are solely those of the individual author(s) and contributor(s) and not of MDPI and/or the editor(s). MDPI and/or the editor(s) disclaim responsibility for any injury to people or property resulting from any ideas, methods, instructions or products referred to in the content. |
© 2024 by the authors. Licensee MDPI, Basel, Switzerland. This article is an open access article distributed under the terms and conditions of the Creative Commons Attribution (CC BY) license (https://creativecommons.org/licenses/by/4.0/).
Share and Cite
MDPI and ACS Style
Zhou, S.; Qing, S.; Zhang, X.; Huang, H.; Hou, M. Molecular Dynamics Simulations of Thermal Transport of Carbon Nanotube Interfaces. Energies 2024, 17, 1506. https://doi.org/10.3390/en17061506
AMA Style
Zhou S, Qing S, Zhang X, Huang H, Hou M. Molecular Dynamics Simulations of Thermal Transport of Carbon Nanotube Interfaces. Energies. 2024; 17(6):1506. https://doi.org/10.3390/en17061506
Chicago/Turabian StyleZhou, Shijun, Shan Qing, Xiaohui Zhang, Haoming Huang, and Menglin Hou. 2024. "Molecular Dynamics Simulations of Thermal Transport of Carbon Nanotube Interfaces" Energies 17, no. 6: 1506. https://doi.org/10.3390/en17061506
Note that from the first issue of 2016, this journal uses article numbers instead of page numbers. See further details here.