Article

Potentials of Mixed-Integer Linear Programming (MILP)-Based Optimization for Low-Carbon Hydrogen Production and Development Pathways in China

College of Energy Environment and Safety Engineering, China Jiliang University, Hangzhou 310018, China
*
Author to whom correspondence should be addressed.
Energies 2024, 17(7), 1694; https://doi.org/10.3390/en17071694
Submission received: 3 March 2024 / Revised: 21 March 2024 / Accepted: 26 March 2024 / Published: 2 April 2024

Abstract

:
Hydrogen (H2) is considered one of the main pillars for transforming the conventional “dark” energy system to a net-zero carbon or “green” energy system. This work reviewed the potential resources for producing low-carbon hydrogen in China, as well as the possible hydrogen production methods based on the available resources. The analysis and comparison of the levelized cost of hydrogen (LCOH) for different hydrogen production pathways, and the optimal technology mixes to produce H2 in China from 2020 to 2050 were obtained using the mixed-integer linear programming (MILP) optimization model. The results were concluded as three major ones: (a) By 2050, the LCOH of solar- and onshore-wind-powered hydrogen will reach around 70–80 $/MWh, which is lower than the current H2 price and the future low-carbon H2 price. (b) Fuel costs (>40%) and capital investments (~20%) of different hydrogen technologies are the major cost components, and also are the major direction to further reduce the hydrogen price. (c) For the optimal hydrogen technology mix under the higher renewable ratio (70%) in 2050, the installed capacities of the renewable-powered electrolysers are all more than 200 GW, and the overall LCOH is 68.46 $/MWh. This value is higher than the LCOH (62.95 $/MWh) of the scenario with higher coal gasification with carbon capture and the storage (CG-CCS) ratio (>50%). Overall, this work is the first time that hydrogen production methods in China has been discussed comprehensively, as well as the acquisition of the optimal H2 production technology mix by the MILP optimization model, which can provide guidance on future hydrogen development pathways and technology development potential in China.

1. Introduction

1.1. Background

The increasing global population and economy have triggered significant energy consumption. By 2018, fossil fuels including coal, oil and natural gas accounted for over 80% of the global total energy supply [1]. The electricity generation mix of different countries by 2020 is shown in Figure 1; it indicated that over 60% of fossil fuels are consumed to provide electricity power worldwide [2]. However, the burning of fossil fuels brings about massive greenhouse gas (GHG) emissions, mainly carbon dioxide (CO2), which has an impact on global warming and other environmental problems that have attracted extensive attention around the world.
The world is expecting an alternative energy source, which should be sufficiently clean and ensure a stable and continuous supply with sufficient security, low cost and a low number of difficulties during production and storage. Power generation from renewables include wind and solar Photovoltaics (PV) which provide a potential pathway and were predicted to provide ~90% of the electricity by 2050, with wind and PV together accounting for nearly 70% [3]. However, such scale of deployment presents huge challenges on the stability and reliability of the conventional power grids due to the intermittency, variability and unpredictability of power from renewables.
Hydrogen (H2) is a secondary energy source, which can be produced from reforming fossil fuels or low-carbon energy sources through electrolysis. It is now considered one of the main pillars for transforming the conventional “dark” energy system to a net-zero carbon or “green” energy system [4]. The hydrogen economy has been growing to replace the hydrocarbon economy based on the consumption of large amounts of fossil fuels. The total global demand for hydrogen by 2018 is about 70 million tonnes (Mt) per year, and at the same time, around 900 Mt of CO2 emissions per year are released into the atmosphere by worldwide hydrogen production at present [5]. The most widely used hydrogen production technologies include natural gas steam reforming (SMR), followed by oil reforming and coal gasification (CG) [1]; the low-carbon hydrogen production was only 0.47 Mt/year by 2020 [2].
As seen from Figure 1, over 60% of electricity generation comes from coal in China, but this percentage is only less than 20% in other countries [2]. China’s economy is heavily dependent on coal, and the energy consumption is still dominated by high-carbon fuels. In order to achieve carbon neutrality by 2060, coal-fired power generation is expected to be phased out by 2050, which will be replaced by wind, solar, hydro, and nuclear energy, etc. [6]. At the same time, other measures, including diversifying energy sources, enhancing energy utilization efficiency, developing a hydrogen economy, and adopting carbon capture and storage (CCS) technologies, etc., are all required to be planned strategically to achieve carbon neutrality by 2060 in China. It is to be stated that the Chinese government report has announced that hydrogen would be a key to solve the future energy crisis, and to construct a low-carbon and secure future energy system, as there are abundant resources available in China to develop a hydrogen economy [7].

1.2. Literature Review

There are a few studies that have been conducted to discuss hydrogen production, costs and functions in economies like in the USA, Germany, UK, China and Australia, etc. Yates et al. [8] applied the Monte Carlo method to discuss different pathways and input parameters to lower the solar hydrogen cost. The results indicated the lowest and highest LCOH occurred in Australia (3.38 $/kg) and Japan (4.72 $/kg). George et al. [9] conducted the extensive cost analysis of blue hydrogen in Germany in 2050. It was found that blue hydrogen (hydrogen produced from a low-CO2-emission source) would be the most viable option for a hydrogen economy, and green hydrogen (hydrogen produced from renewables) would need long-term subsidies to make it competent for the future market. Ji et al. [1] provided a comprehensive review about the different production methods of hydrogen, including fossil fuel or biomass-based hydrogen production, microbial hydrogen production, electrolysis and thermolysis of water and thermochemical cycles. After the cost and life cycle environmental impact assessment, it was concluded that electrolysis and thermochemical cycle methods coupled with new energy sources show considerable potential for development in terms of economics and environmental friendliness. Ajanovic et al. [2] comprehensively discussed the economic and environmental benefits of different hydrogen production pathways. The results concluded two important suggestions: (1) introducing an international market for hydrogen is the key to produce hydrogen at the best conditions at lower costs; (2) the future success of hydrogen is very dependent on technological development and resulting cost reductions, as well as on future priorities and the corresponding policy framework. El-Emam and Ozcan [4] extensively reviewed different clean hydrogen production methods in terms of their technological, economic, and environmental aspects. They concluded that hydrogen cost is determined by electricity cost, which is expected to reduce to a lower level when considering the solar and wind energy conversion.
A report by the Hydrogen Council concluded the major results [10]: (1) The scaling-up of hydrogen production methods will be the biggest driver of cost reduction. (2) The cost of renewable hydrogen will decline by 60% over the next few decades due to the lower cost of renewable electricity. Burmistrz et al. [11] analyzed the carbon footprint of different coal gasification methods to produce hydrogen. The results indicated that the carbon footprint of producing 1 kg of H2 with CO2 sequestration was 5.2 kg of CO2 for subbituminous coal gasification using the technology by Shell and Texaco, and 7.1 kg of CO2 for lignite gasification using Shell technology. Kim et al. [12] developed an MILP-based optimization model to plan the hydrogen production system using onshore and offshore wind energy. The model is capable of determining the system configuration and operation strategies, analyzing the major cost drivers and planning a sustainable hydrogen supply system. Song et al. [13] evaluated the possibility of producing hydrogen by offshore wind in China, and compared different pathways to export it to Japan. The results indicated that the LCOH of offshore wind hydrogen varies between 2 $/kg and 6 $/kg, which is lower than hydrogen from other countries, like Australia and Norway. Yang et al. [14] studied the role of clean hydrogen in reducing the CO2 emissions in “hard-to-abate” sectors in China by using the integrated dynamic least-cost modelling method. The results showed that clean hydrogen can fuel up to 50% of heavy-duty trucks and bus fleets in China by 2060. Meanwhile, the hydrogen scenario can help avoid USD 1.72 trillion of new investment compared to a no-hydrogen scenario. Yue et al. [15] reviewed different hydrogen production technologies, and their techno-economic performance (cost, efficiency and durability). The worldwide projects demonstrated hydrogen applications including energy storage, power-to-gas, co- and tri-generation and transportation.
Overall, based on the literature review above, it is a challenge for China to achieve a carbon peak before 2030 and carbon neutrality before 2060, but there are a few studies paying attention to hydrogen production in China and providing guidance on hydrogen development pathways. Thus, this work evaluated the potential resources for producing low-carbon hydrogen in China, as well as the possible hydrogen production methods based on these resources, including steam methane reforming (SMR) with CCS, CG with CCS, biomass gasification and water electrolysis technologies. The techno-economic performance of different hydrogen production technologies was analyzed and compared based on different cost components and future technology development potential, to obtain the LCOH. Next, a MILP optimization model was conducted to obtain the optimal hydrogen technology mix and their installed capacities by a certain year (e.g., 2050). Finally, the sensitivity analysis reveals the most affected factors of these technologies and their development potential in the future.
The structure of this paper is explained as follows: Section 2 introduced the hydrogen production resources and methods in China. Section 3 presents the input parameters and methodology of the models. Section 4 presents the major results and discussion. Finally, the conclusion is made in Section 5.

2. Hydrogen Production for China

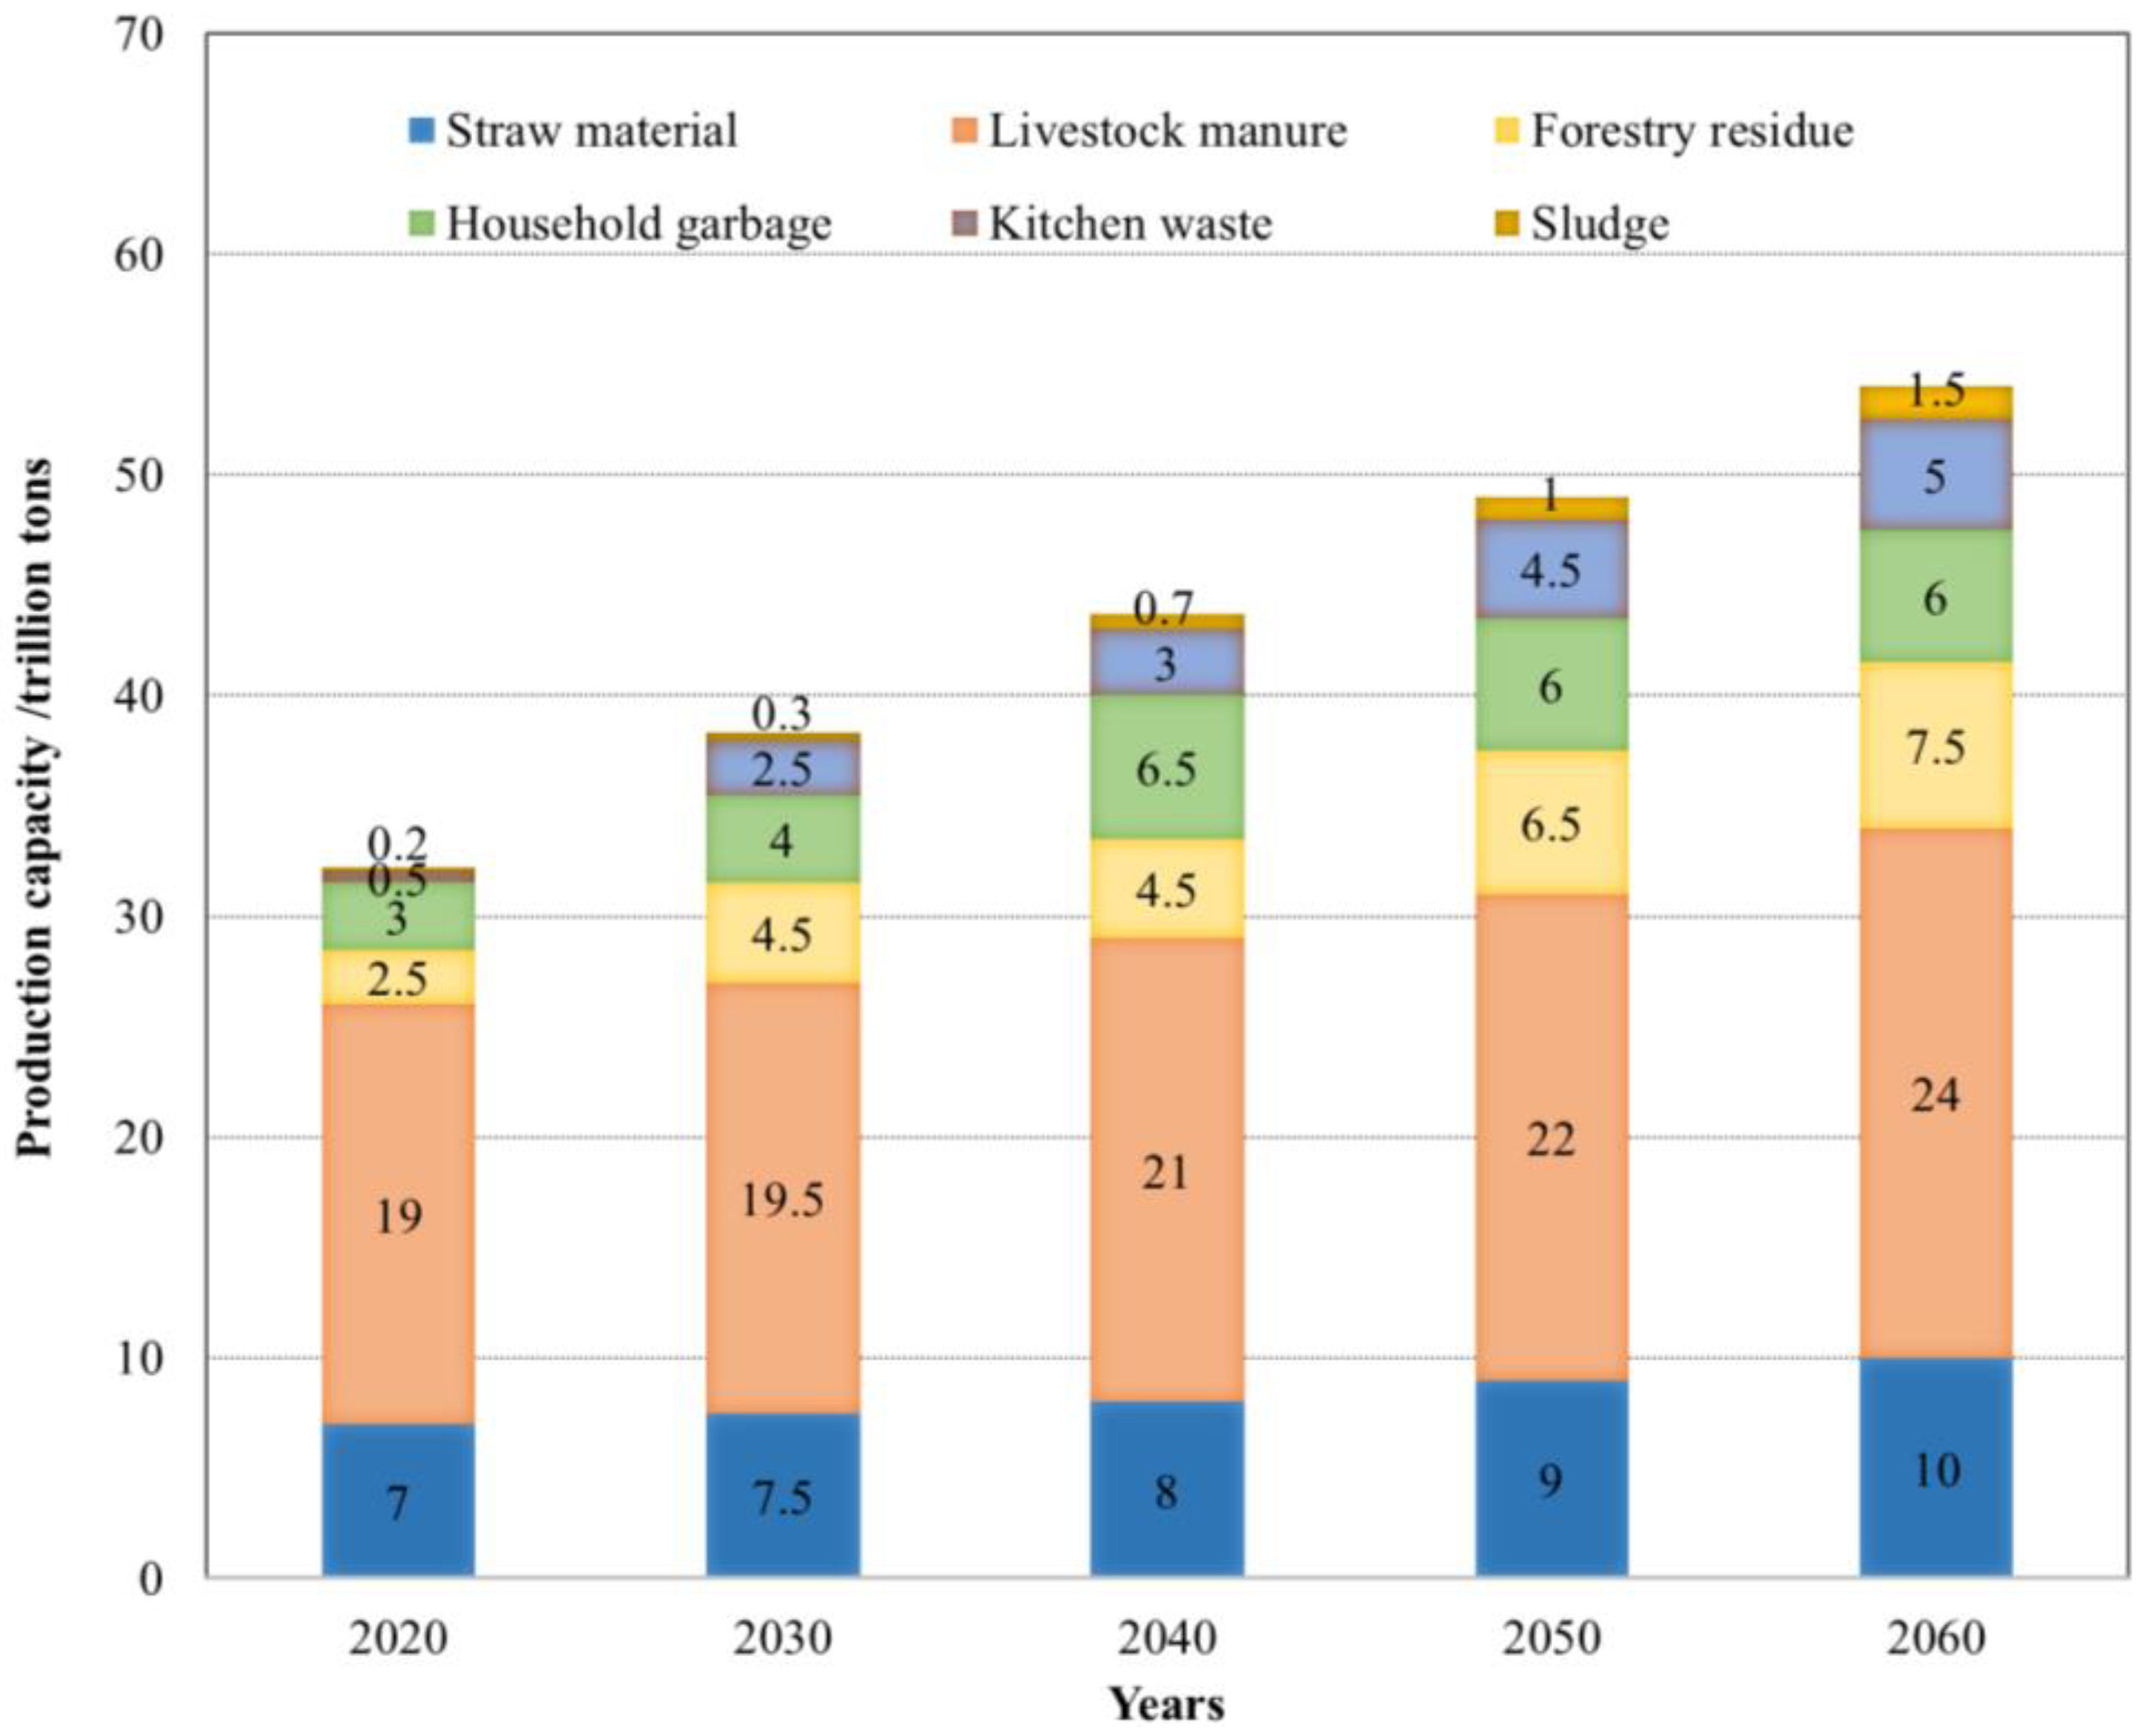
2.1. China’s Resources Distribution

Coal reserve. China has been one of the countries that holds the largest amount of coal resources, ranking third in the world and accounting for 13.3% of the total world coal reserve [16]. The coal resource investigation has revealed that there are about 2.02 trillion tons of coal reserve available, and the part that can be exploited is 215.7 billion tons [17]. The major coal distributions are in Inner Mongolia, Shanxi, Heilongjiang, Shanxi, Guizhou, Yunnan, and Sichuan provinces. Coal is the foundation of China’s energy security; however, increasing the sustainability of coal supply and conversion, like developing a coal-based hydrogen economy, and reducing its environmental impacts are the key to achieving carbon neutrality [18].
Solar energy. Solar energy in China is abundantly developed due to its privileged geographical conditions. Normally, two kinds of technologies are available to capture solar energy; they are concentrated solar thermal energy system and solar PV power system. The installed capacity of the former is about 69% of that of the latter [19]. By 2020, China has the largest cumulative installed capacity of the solar PV power system, reaching around 253 GW, compared with 151 GW in the European Union and 93 GW in the United States; the major provinces that hold large-scale solar power capacity are Hebei, Inner Mongolia, Xinjiang, Zhejiang, Anhui, Henan, Qinghai, Gansu [19,20]. In order to reach carbon neutrality, solar energy percentage is predicted to increase from 2.7% to more than 25% in China by 2050 [17]. The mass-scale development in the solar energy industry in China will significantly promote the cost reduction of this technology, which will be reduced from 0.085 $/kWh to 0.02–0.08 $/kWh by 2030 and 0.01 to 0.05 $/kWh by 2050 [21].
Wind energy. Wind energy is another abundant renewable resource in China. The National Energy Administration has revealed the 2020 data related to wind power [22]; the total installed capacity of onshore wind power reached 281 GW, in which 71.6 GW of the generation capacity was added in 2020; and the major provinces to develop wind power include Inner Mongolia, Jiangsu, Guangdong, Zhejiang, Fujian, Liaoning and Shandong. But in the US, only 14 GW of the newly added capacity in 2020 and 118 GW of the total installed capacity of wind power were reported [17]. The utility-scale offshore wind power capacity in China amounted to 11.13 GW by 2021, in comparison with 10.4 GW of installed capacity of offshore wind power in the UK at the end of 2020 [20], but the offshore wind power still has great potential to increase considering the 18,000 km coastline in China. After 2025, the yearly installed capacity of wind power will be no less than 60 GW, reaching 800 GW of the total installed capacity by 2030 and 3000 GW by 2060 [23]. The levelized cost of electricity (LCOE) of onshore and offshore wind power will be reduced to 0.03–0.05 $/kWh and 0.05–0.09 $/kWh by 2030, which will be decreased further to 0.02–0.03 $/kWh and 0.03–0.07 $/kWh by 2050 [17].
Biomass sources. Biomass comes from a wide range of sources, including wood, grass, agricultural products, crop residues, plant and animal wastes, municipal solid wastes, food scraps and algae, etc. [24]. China has the third largest land area and the largest population in the world, and there is great potential to develop biomass resources. It is predicted to increase by 1.1% annually, and the total amount of biomass resource from 2020 to 2060 is shown in Figure 2, of which the value is 3.795 trillion tons in 2030 and 53.46 trillion tons in 2060. It is estimated that the carbon emission reduction through biomass would be 0.9 billion tons by 2030 and more than 2 billion tons by 2060 in China [25].

2.2. Potential Hydrogen Colors for China

2.2.1. Grey Hydrogen

The grey hydrogen represents hydrogen produced by steam reforming of natural gas (NG) or coal gasification without CCS. It is reported that about 6% of NG and coal are used for producing grey hydrogen [2]. It is the most used and cost-effective way to produce hydrogen, but also to generate significant CO2 emissions during production.
Steam reforming of natural gas (SMR) is a well-established hydrogen production method. It undergoes a pre-treatment of NG: the methane is then split up with heated water into syngas (mixture of CO and H2), followed by a gas shift reaction to convert the syngas into CO2 and H2. The sizes of the SMR plants are usually in the range of 50–1000 MW, and the process efficiency is between 60% and 85% [1].
Coal gasification is another major method to produce hydrogen, especially in China due to its higher NG price and large coal reserve. The reaction and flow diagram are shown in Figure 3 [1]. The dried coal is ground and then treated with O2 and steam in a gasifier, turning it into syngas (mixture of CO and H2). The shift converter turns the syngas into CO2 and H2, which will be purified and separated. The process efficiency is 74–85% [2]. There are four types of coal, namely lignite (low rank), sub-bituminous coal (low rank), bituminous coals (medium rank) and anthracites (high rank), which can be used for CG feedstock. Accordingly, different gasification methods, including fixed bed-, moving bed-, fluidized bed-, entrained flow- and plasma gasification are distinguished with each other, which are all operating at temperatures over 900 °C [26].
One of the obvious disadvantages of CG is the higher global warming potential (GWP), and high carbon emissions and acidification potential (AP), which is related to the higher sulfur content in coal [27]. One of the effective measures to tackle the emission problem is to adopt CCS technologies, the process of which is depicted by Figure 4. The effects of ash agglomeration fluidized-bed gasification with and without CCS have been studied by Li et al. [28]; the results showed that the GHG emissions from CG with CCS have been reduced by 81.72% compared with the process without CCS. Burmistrz et al. [11] investigated the carbon footprint of hydrogen production using subbituminous coal and lignite gasification by GE Energy/Texaco and Shell technologies. After the calculation and comparison, the carbon emissions of the process with the CO2 sequestration were reduced by 69–78%. It is estimated the cost of CCS technologies in China would be 310–770 RNB/ton CO2 in 2030 and 140–410 RNB/ton CO2 in 2060 [17,29], which would promote large-scale production of grey hydrogen by equipping the system with CCS.

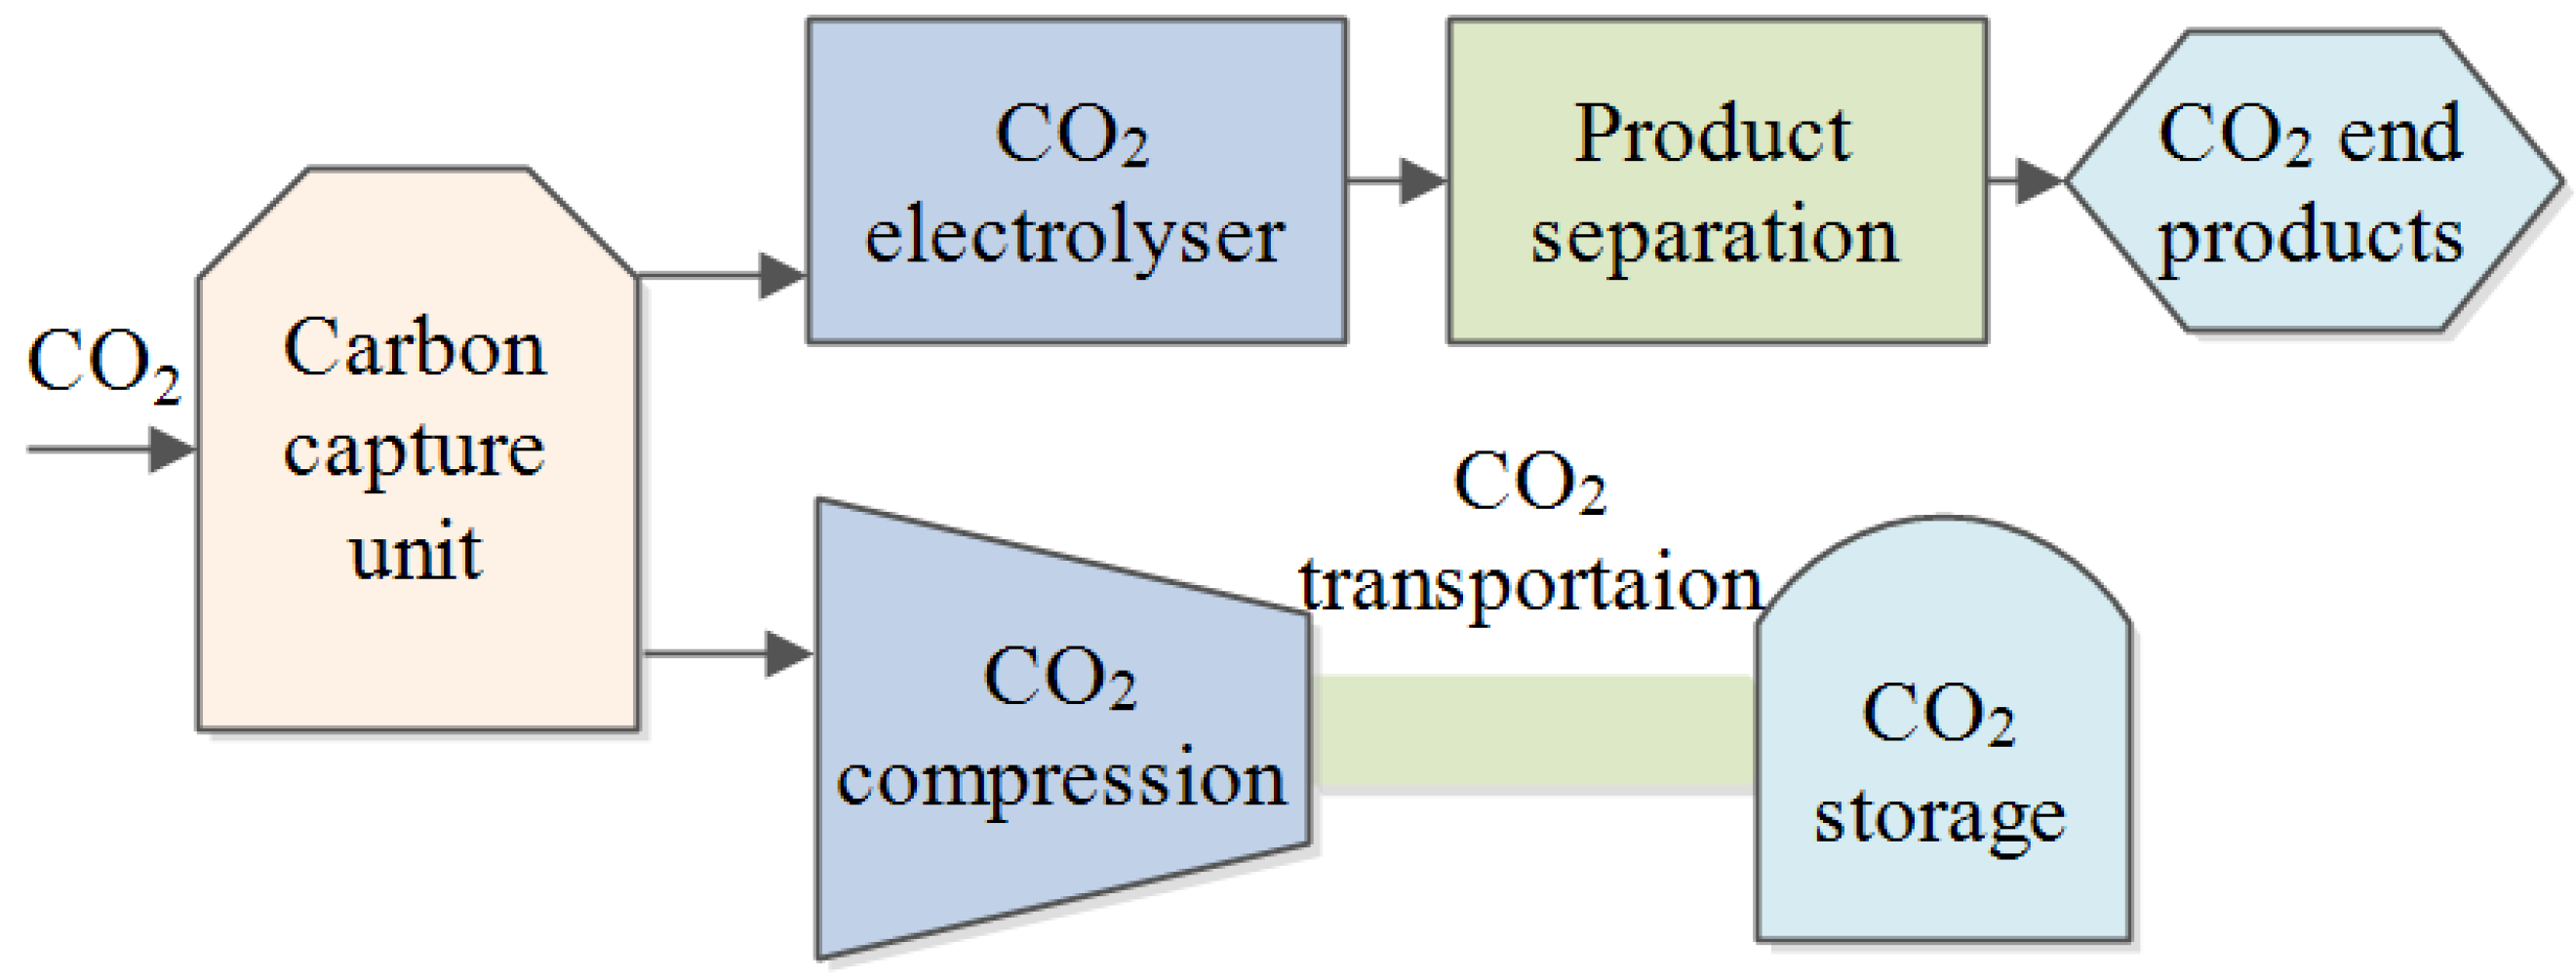
2.2.2. Blue Hydrogen

For producing hydrogen using SMR and CG technologies, if these processes are equipped with CCS, the product is called blue hydrogen, but the combined plants are not reported to be implemented so far due to the technology immaturity [2]. The capture rates of CCS are around 90%, which means the process efficiency of grey hydrogen would be reduced by another 5–14%. It is considered as a transition technology before reaching the green hydrogen economy [30]. Another important issue with blue hydrogen is the potential sites for carbon storage, which would significantly enhance the costs of grey hydrogen [9].
Biomass is considered a carbon-neutral energy source. Biomass gasification (BG) is a mature thermochemical method to produce hydrogen and holds high potential for mass production for the future. The feedstock includes biomass, steam, and oxygen/air. The reaction process is expressed as in Equation (1), occurring in gasifiers with a temperature range around 700–1200 °C [31]. The series reactions include pyrolysis of biomass, methane combustion, tar cracking, dry and steam reforming, and water gas shift (WGS), leaving H2 and CO2 as the final main products. The CO2 emission and environmental impact are less severe than fossil-fuel based methods, but its final product has a high number of impurities due to the complex composition of biomass materials. To solve this problem, several solutions have been proposed. They include the two-region catalytic gasification [32], plasma-assisted biomass gasification [33] and supercritical water gasification [34], but these studies are still in the development stage.
Biomass + H2O → H2 + CH4 + CO + CO2 + Tar + Char

2.2.3. Green Hydrogen

Green hydrogen represents the method that produces hydrogen through water electrolysis by using renewable electricity, like from wind and solar power [1]. Green hydrogen or it is also called clean hydrogen is considered one of the pillars of a future sustainable energy and transport system. Nowadays, there is only 0.04% of global hydrogen produced by green methods [35].
Currently, there are three major electrolysis technologies, including alkaline water electrolysis (ALK), polymer electrolyte membrane (PEM) electrolysis, and solid oxide electrolyzer cell (SOEC), which have been well-studied and developed [4]. ALK is the most mature technology that has reached a commercial scale. It works with two electrodes (cathode and anode) that are immersed in a high-concentrate alkaline solution, typically KOH or NaOH, and the reaction is expressed in Equations (2) and (3) [30]; please refer to the work [36] for more information about the reaction. This technology has some advantages including its high technology maturity, low investment costs and operating temperature, and long lifetime. But the ALK electrolysis process needs to be run continuously to avoid damage so that the variable renewable energy should not be a single source of power [15].
Cathode: 4H2O + 4e → 2H2 + 4OH
Anode: 2H2O → O2 + 4H+ + 4e
PEM electrolysers work similarly to ALK electrolysis. But the electrochemical reaction occurs in an acidic solution [30]. Its advantages include a highly impactful size, rapid response and high current density and efficiency. But it has a shorter lifetime and higher investment cost than AEL technology. SOEC is a future potential technology which works under high temperature (500–1000 °C) [2]. It is not commercially available at present, but the advantages lie in its lower electricity consumption, higher energy efficiency and the estimated lower cost in the future.

3. Methodology and Input Parameters

3.1. Input Parameters

From Section 1, there are abundant resources that are available in China for the production of grey, blue and green hydrogen. From Section 2, the hydrogen colors are determined by different hydrogen production methods. Based on the extensive review of these technologies, their techno-economic and environment performance are listed and compared in Table 1 and Table 2. In Table 1, the grey (SMR, CG), blue (SMR-CCS, CG-CCS, BG) and green hydrogen production methods are all included, the low-carbon-emission hydrogen production methods include SMR-CCS, CG-CCS, BG, and renewable hydrogen. The capital expenditure considered the technology development in the future, thus, C A P E X is reduced to a certain level in 2020, 2030 and 2050, respectively. The total fixed operational expenditure ( O P E X ) costs considered the direct labor, administration/general overheads, insurance, local taxes, and maintenance, etc. The variable O P E X costs include raw material, chemicals and catalysts, etc. [10]. Additionally, the fuel costs, electricity costs, and water consumption costs are all considered for different technologies.
In Table 2, the techno-economic parameters of three electrolysis technologies are listed and compared in detail. Similarly, with the technologies developed, the efficiencies and C A P E X are all changed with time, which are given as different values in 2020, 2030, and 2050. The stack replacement cost was considered as 45% of its C A P E X [8].
Other input parameters are key to the techno-economic analysis, including the H2 demand in China in different years, fuel price (NG, coal and biomass), grid electricity price, renewable (solar, onshore wind and offshore wind power) electricity price, CO2 tax, and they were collected from different resources, of which value in 2020, 2030 and 2050 are given in Table 3.

3.2. Methodology

For the techno-economic analysis in this work, the technical part mainly considered the technology efficiencies, fuel, electricity, and water consumptions, as well as the CO2 emission levels. The economic part considered the C A P E X , the fixed and variable O P E X , as well as the fuel, electricity and water costs, and CO2 emission tax. The economic indicator used is LCOH with units in $/MWh or $/kg H2, which has been widely adopted to assess and compare the production costs of hydrogen. To be noted, LCOH defined in this work is mainly used to compare the production costs of hydrogen, and the transportation and storage costs, etc. are not considered. The LCOH is defined as in Equation (4).
L C O H = t = 1 N ( C A P E X · A m f + ( O P E X f i x + O P E X v a r + C e l e + C w a t e r + C f u e l + C C O 2 ) a n n ) t = 1 N D H 2 , a n n
A m f = I R ( 1 + I R ) N ( 1 + I R ) N 1
where, C A P E X —capital expenditure, O P E X —operational cost, f i x —fixed cost, v a r —variable cost, C e l e —grid electricity cost, C w a t e r —water cost, C f u e l —fuel cost, C C O 2 —CO2 tax penalty, DH2—H2 demand, Amf—amortized factor, N—lifetime, and IR—interest rate.
Except for the techno-economic analysis, based on the resulting LCOH, a MILP optimization model was conducted to determine the optimal technology mix for a certain year, in order to obtain the lowest overall LCOH in that year. The optimization variables are the installed capacities of different hydrogen production methods, the constraints applied include the hydrogen demands, production efficiencies, the introduced renewable hydrogen ratio or low-carbon hydrogen, as well as CO2 emissions. The commercial solver used is Gurobi. The whole process can be described by a flow diagram in Figure 5.

4. Results and Analysis

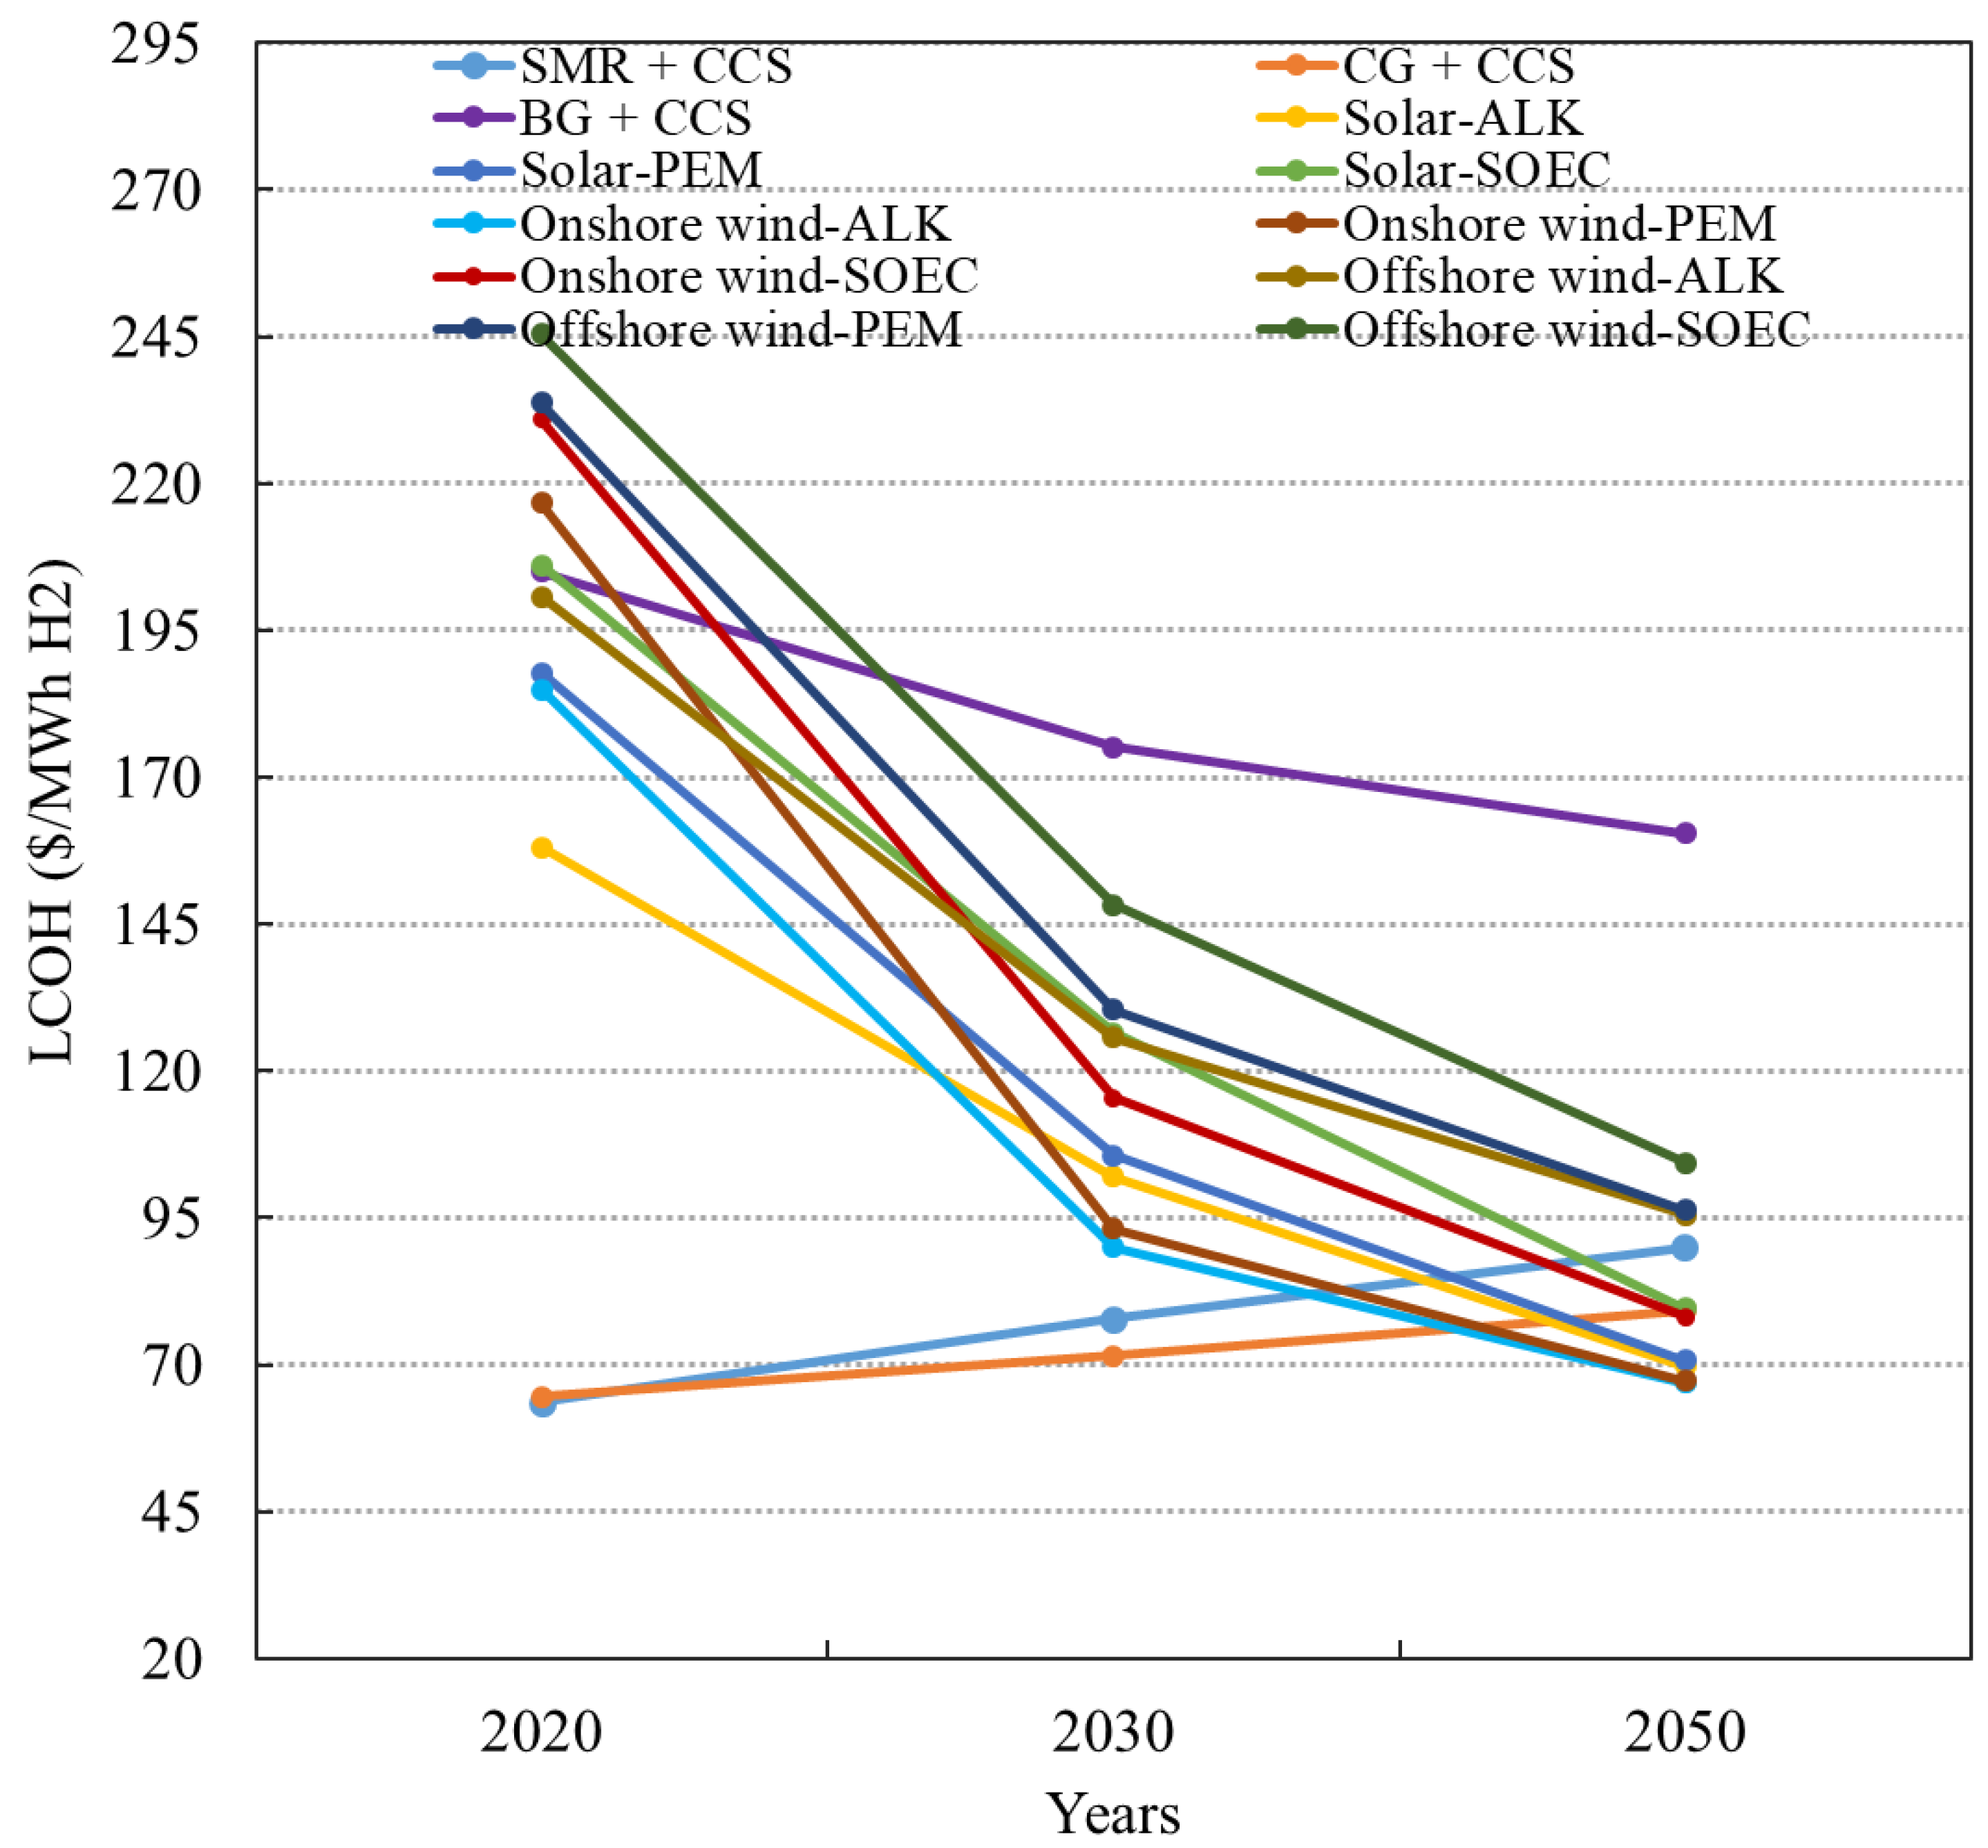
4.1. The Valuation of Levelized Cost of Hydrogen (LCOH)

Based on the techno-economic parameters of different kinds of hydrogen production methods, including low-carbon technologies like SMR-CCS, CG-CCS, BG-CCS, as well as renewable hydrogen technologies like solar and wind energy powered electrolysis methods, the LCOH produced by this work in 2020 are 2.51 $/kg, 2.55 $/kg, 8.08 $/kg for SMR-CCS, CG-CCS and BG-CCS, respectively, and 6.22 $/kg and 7.29 $/kg for solar-based and wind-based electrolysis technologies. These data points are marked as red triangles in Figure 6. Compared with the LCOH data from different resources shown as the yellow bar in Figure 6, the data points are consistent with the data range, which confirms the validity of the techno-economic analysis model used in this work. The reason for the LCOHs of CG-CCS and BG-CCS spilling over the range is that the cost of CCS was considered in this work.
With the efficiencies of technologies increasing and costs decreasing throughout the year, the LCOHs are varying with time as well, shown as in Figure 7. It can be seen only the LCOHs of SMR-CCS and CG-CCS present slight increases over time to 89.81 $/MWh and 79.28 $/MWh, respectively in 2050, which is mainly due to the higher NG and coal prices in the future. The LCOH of BG-CCS decreases by 22% to 160.51 $/MWh, which is the highest among these technologies, which is due to its high fuel consumption and C A P E X per kW triggered by the complex gasification process, but this technology is key to achieving carbon neutrality due to its negative carbon emission. The lowest LCOHs by 2050 belong to the ALK and PEM technologies powered by onshore wind, both reaching around 67 $/MWh, followed by the LCOHs of the ALK and PEM powered by solar power. These four routes have the most potential to produce cost-effective hydrogen by 2050. SOEC electrolysers powered by onshore wind and solar power would be 10 $/MWh higher than those of ALK and PEM electrolysers. The LCOHs of the ALK, PEM and SOEC electrolysers powered by offshore wind would be still quite high due to the relatively high offshore wind electricity price by 2050.

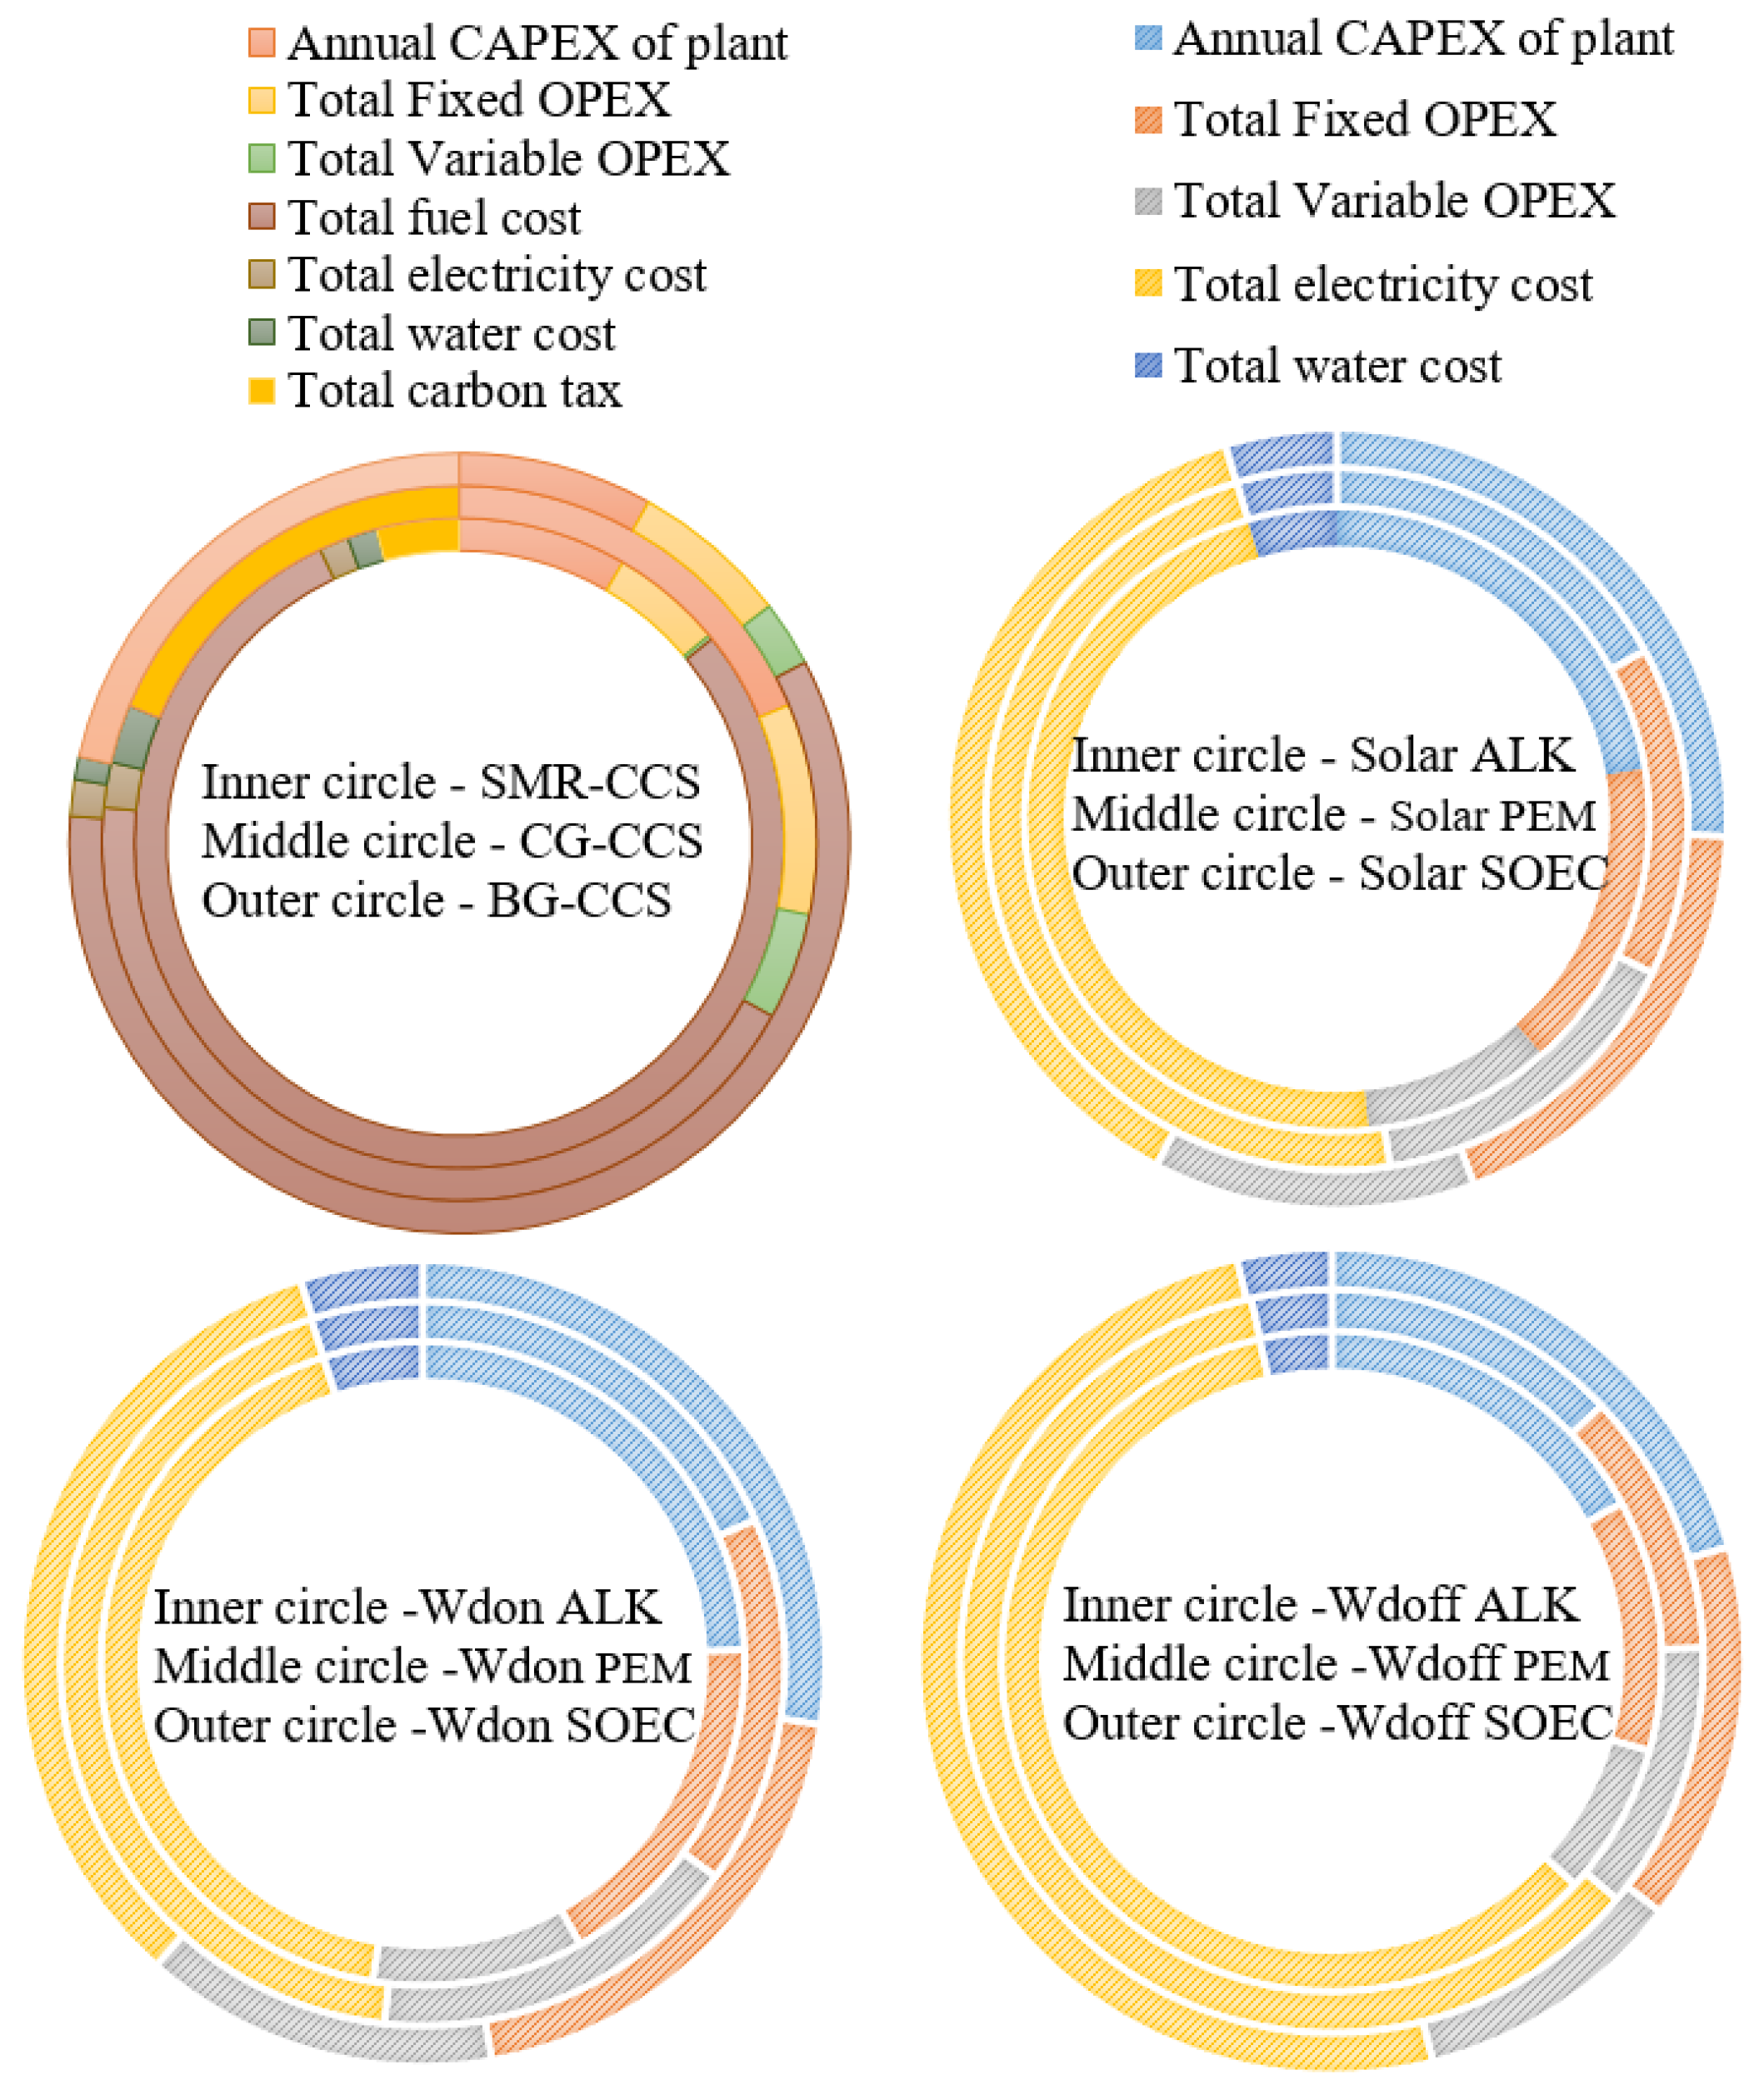
4.2. The Cost Components of Hydrogen Production

The total annual cost of a hydrogen production method includes different cost components. For conventional low-carbon technologies, they hold the same cost component structure, taking CG-CCS method as an example (shown in Figure 8a), its cost components are changing with the technologies being developed. The annual C A P E X of CG-CCS decreases by 10% every ten years, but its fuel cost increases by about 15% from 2020 to 2050 due to the higher NG cost in the future. The CO2 tax augments as well when a higher CO2 tax is applied by 2050. The fixed O P E X , variable O P E X , electricity cost and water cost all decrease with ongoing time. For renewable hydrogen production methods, they have the same cost components structure, here taking the solar-based ALK method as an example (shown in Figure 8b), the renewable electricity cost accounts for the biggest share of the total cost, which declines by ~6% every ten years when the solar electricity price goes lower, the rest cost components’ percentages, including the annual C A P E X , fixed O P E X , variable O P E X , electricity cost and waste cost all increase slightly from 2020 to 2050, which is mainly due to lower electricity costs and higher hydrogen demands in the future.
Take a closer look at the 2050 case; the cost components of different hydrogen production methods are shown in Figure 9. For low-carbon production methods illustrated in the top left circle chart, the biggest cost share comes from fuel cost, accounting for 78.78%, 43.56% and 75% for SMR-CCS, CG-CCS and BG-CCS, respectively. The C A P E X shares of these three technologies are only 8.4%, 18.7% and 14.1%, respectively. Another noticeable cost component for CG-CCS is CO2 tax, indicating the need to improve the efficiency of CCS. For all these electrolysers powered by solar and onshore wind power, the renewable electricity cost accounts for 33–47%, but for electrolysers powered by offshore wind, the renewable electricity cost accounts for 50–60% due to the higher offshore wind electricity price. The C A P E X of the renewable hydrogen plant almost completely accounts for nearly 20% of the total cost. The fixed O P E X of the renewable hydrogen plant accounts for nearly 15%, as the replacement costs of different electrolysers are quite expensive as well. The cost shares of water are only about 4–5%. Thus, for all hydrogen production methods, it is key to improve the efficiencies and reduce the fuel costs or renewable electricity prices, in order to decrease their LCOHs further.

4.3. The Optimal Technology Mix of Hydrogen Production

Based on the H2 production costs of different pathways by 2050, a MILP optimization model was conducted to determine the optimal technology mix and the overall LOCH for China in different years; the results are shown in Figure 10 and Figure 11.
In Figure 10, it is assumed that a large share of CG-CCS (>50%) is applied in China considering its large amounts of coal reserve and low production cost, and thus renewable energy is developed slowly, which provides about 5%, 25%, 35% and 45% of the total hydrogen demands in 2020, 2030, 2040 and 2050, respectively. The technology mix changes with time. By 2050, the total installed capacity of CG-CCS reaches 390.89 GW, followed by the ALK and PEM electrolysers powered by onshore wind, amounting to 272.91 GW and 279.09 GW. The capacity expansions of solar-based ALK and PEM electrolysers are around 204.7 GW and 209.3 GW, respectively. The least installed capacities are offshore-wind-based ALK and PEM electrolysers, which are around 135 GW, respectively. There are no investments in SOEC electrolysers due to its high investment cost, but in this work, the waste heat utilization from SOEC technology was not considered. The overall LCOHs of 2020, 2030, 2040 and 2050 are 56.65, 69.60, 65.67 and 62.95 $/MWh, respectively, based on different technology mixes, which is shown as a blue curve in Figure 10, referring to the right axis.
In Figure 11, it is assumed that there is an ambitious expansion in renewable energy. The renewable hydrogen shares in 2020, 2030, 2040 and 2050 are 5%, 30%, 55% and 70%, respectively. Accordingly, the hydrogen shares from low-carbon technologies including CG-CCS and SMR-CCS both shrink significantly considering the rigid CO2 emission restriction. By 2050, there are only about 80 GW of installed capacities for CG-CCS and BG-CCS, respectively, and no investment in SMR-CCS considering the small reserve NG in China. The installed capacities of ALK and PEM electrolysers powered by onshore wind both expand to around 300 GW, followed by those of ALK and PEM electrolysers powered by solar power, with both reaching around 250 GW. The capacities of offshore-wind-based ALK and PEM electrolysers are around 200 GW. There are small shares of SOEC technologies powered by solar and wind energy, less than 100 GW, as the LCOHs of SOEC pathways are still higher than other technologies by 2050. The technology mixes lead to different LCOHs in 2020, 2030, 2040 and 2050, and they are 56.65, 70.36, 75.13 and 68.46 $/MWh, respectively (shown as a blue curve in Figure 11, referring to the right axis), which are all higher than those in the higher CG-CCS ratio case in Figure 10. It is indicated that the lower the hydrogen production costs, the higher the installed capacities of the corresponding technologies, and also the lower the overall LCOH. The higher renewable hydrogen ratio before 2040 would lead to a 14% higher LCOH than the case with a higher CG-CCS ratio.

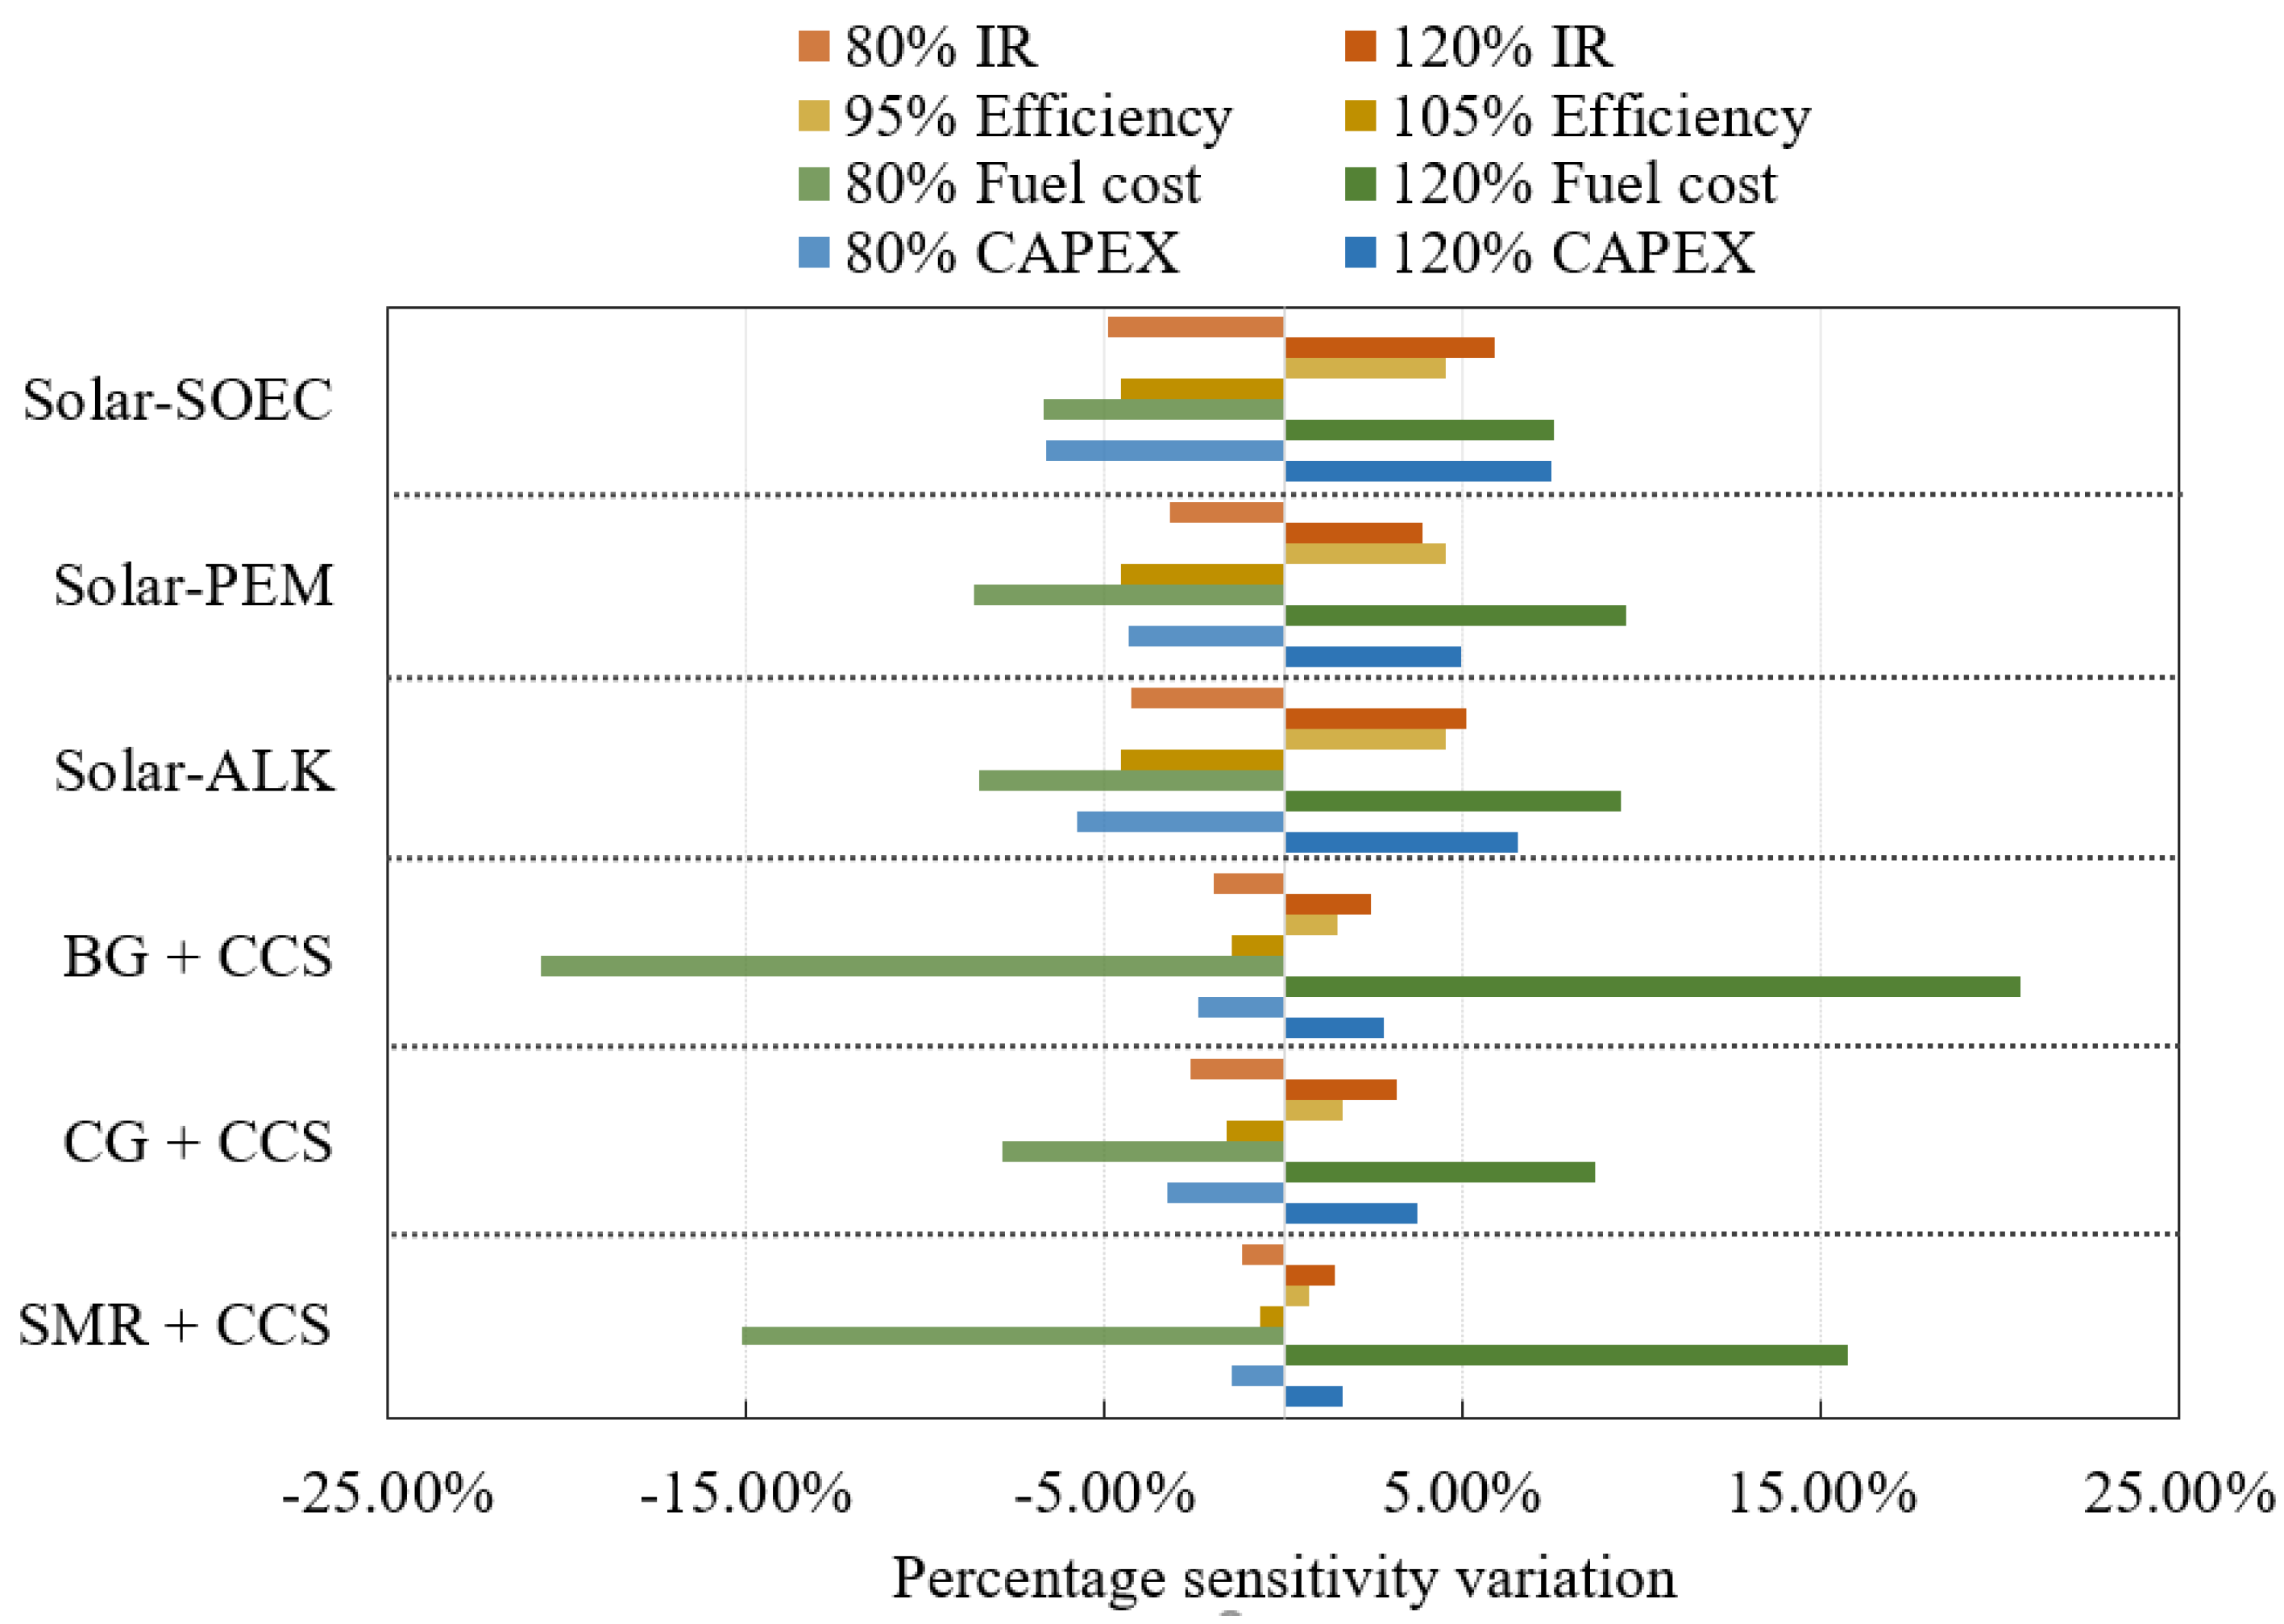
4.4. The Sensitivity Analysis of Hydrogen Production

The results of the sensitivity analysis on conventional low-carbon technologies and electrolysis methods are shown in Figure 12 and Figure 13. From Figure 12, it can be seen that low-carbon technologies are more sensitive to fuel costs, but less sensitive to efficiency and interest rates (IR), as these technologies consume large amounts of fuels every year, but their efficiencies are decently high by 2050. The C A P E X s also do not affect their LCOHs too much due to their small share in the total cost. For solar-powered electrolysis technologies, including solar-ALK, solar-PEM and solar-SOEC, they are more sensitive to the solar electricity price (~8% of variation) than their C A P E X (~6% of variation), although other uncertainties in efficiencies and IR affect the LCOHs to a similar degree, which are all within 5%.
The sensitivity analysis results of onshore-wind-powered electrolysis methods are similar to solar-powered electrolysis methods shown in Figure 13, as the solar and onshore-wind electricity prices are at a similar level, and three kinds of electrolysers also presents similar technical maturity and economic performance by 2050. Similarly, in Figure 13, the three electrolysis routes powered by offshore wind are the most sensitive to the offshore wind electricity price (~10% of variations), as the offshore wind power still bears higher investment and operational cost by 2050. The sensitivity variations of other factors, including the C A P E X and efficiencies of electrolysers and IRs are all limited within 5%.

5. Conclusions

This work reviewed the potential resources for producing low-carbon hydrogen in China, as well as the possible hydrogen production methods based on these resources, including the SMR-CCS, CG-CCS, BG-CCS, and renewable-powered electrolysis methods. Based on the techno-economic performance of different methods, the LCOHs of different production routes and their respective cost components were studied first. Based on the resulting LCOHs, the optimal technology mixes to produce H2 in China from 2020 to 2050 were obtained by the MILP optimization model. Finally, the sensitivity analysis indicated the future technology development potential and improvement direction. The major results were summarized as the followings:
(a) Between 2020 and 2035, conventional H2 production methods with CCS, including SMR-CCS and CG-CCS have more economic advantages over renewable electrolysis methods, and the LCOHs are about 75 $/MWh. After 2035, the LCOHs of solar- and onshore-wind-powered hydrogen decline significantly to around 70–80 $/MWh by 2050, turning into the most potential routes. But the LCOHs of offshore-wind electrolysis and BG-CCS are still high and less competitive, and to be noted, BG-CCS is key to achieving carbon neutrality in China due to its negative carbon emission.
(b) For different hydrogen production methods, the major costs lie in their fuel costs (renewable electricity is the fuel of electrolysis methods), accounting for more than 40% of the total cost. Other large cost components are their C A P E X . Other cost components include the fixed and variable O P E X , as well as water costs which account for small shares. Noticeably, the water consumption of these technologies should be paid more attention due to the possible water crisis in the future.
(c) For the optimal technology mix to produce hydrogen under a higher renewable ratio (70%) in 2050, the installed capacities of renewable-powered electrolysers are all over 200 GW, and the overall LCOH is 68.46 $/MWh. This value is higher than the LCOH (62.95 $/MWh) of the scenario with the higher CG-CCS ratio (>50%), which still results in some CO2 emissions. The practical future hydrogen pathway depends on technology development and national policies.
(d) The sensitivity analysis revealed that the most sensitive factors are fuel costs for SMR-CCS, CG-CCS and BG-CCS production methods, and the renewable electricity costs for renewable hydrogen. The uncertainties in C A P E X are less impactful (< ± 8%). The effects of other factors, including efficiencies, and IR are limited to within 5%.
Overall, this work is the first time that hydrogen production methods in China have been comprehensively discussed as well as the acquisition of the technology mix of hydrogen production through optimization, which can provide guidance on future hydrogen development pathways and future technology development potential. In the future, new methods like DRM and electrolysers powered by nuclear reactor, etc., as well as the transportation and storage costs of hydrogen will be considered to make the new work more comprehensive.

Author Contributions

J.M. and D.Y.; investigation, G.Z. and M.L.; resources, J.M. and Z.L.; writing—original draft, J.M.; supervision, J.X. All authors have read and agreed to the published version of the manuscript.

Funding

This work is supported by “Pioneer” and “Leading Goose” R&D Program of Zhejiang (2023C01124),Zhejiang Province Basic Public Welfare Research Program (LGF21E080011), and the Fundamental Research Funds for the Provincial Universities of Zhejiang (2021YW34).

Data Availability Statement

Data is contained within the article.

Conflicts of Interest

The authors declare no conflicts of interest.

References

  1. Ji, M.; Wang, J. Review and comparison of various hydrogen production methods based on costs and life cycle impact assessment indicators. Int. J. Hydrogen Energy 2021, 46, 38612–38635. [Google Scholar] [CrossRef]
  2. Ajanovic, A.; Sayer, M.; Haas, R. The economics and the environmental benignity of different colors of hydrogen. Int. J. Hydrogen Energy 2022, 47, 24136–24154. [Google Scholar] [CrossRef]
  3. IEA. Net Zero by 2050: A Roadmap for the Global Energy Sector; International Energy Agency: Paris, France, 2021; p. 224. [Google Scholar]
  4. El-Emam, R.S.; Özcan, H. Comprehensive review on the techno-economics of sustainable large-scale clean hydrogen production. J. Clean Prod. 2019, 220, 593–609. [Google Scholar] [CrossRef]
  5. International Energy Agency. The Future of Hydrogen: Seizing Today’s Opportunities; IEA: Paris, France, 2019; p. 203. [Google Scholar]
  6. Liu, Z.; Deng, Z.; He, G.; Wang, H.; Zhang, X.; Lin, J.; Qi, Y.; Liang, X. Challenges and opportunities for carbon neutrality in China. Nat. Rev. Earth Environ. 2022, 3, 141–155. [Google Scholar] [CrossRef]
  7. Yang, Y. Hydrogen, the Keyword for Constructing a Mordern Energy System (in Chinese); National Energy Administration: Beijing, China, 2022. Available online: http://www.nea.gov.cn/2022-05/07/c_1310587396.htm (accessed on 20 January 2023).
  8. Yates, J.; Daiyan, R.; Patterson, R.; Egan, R.; Amal, R.; Ho-Baille, A.; Chang, N.L. Techno-economic Analysis of Hydrogen Electrolysis from Off-Grid Stand-Alone Photovoltaics Incorporating Uncertainty Analysis. Cell Rep. Phys. Sci. 2020, 1, 100209. [Google Scholar] [CrossRef]
  9. George, J.F.; Müller, V.P.; Winkler, J.; Ragwitz, M. Is blue hydrogen a bridging technology? -The limits of a CO2 price and the role of state-induced price components for green hydrogen production in Germany. Energy Policy 2022, 167, 113072. [Google Scholar] [CrossRef]
  10. Hydrogen Council. Path to Hydrogen Competitiveness: A Cost Perspective. 2020. Available online: https://hydrogencouncil.com/wp-content/uploads/2020/01/Path-to-Hydrogen-Competitiveness_Full-Study-1.pdf (accessed on 10 March 2023).
  11. Burmistrz, P.; Chmielniak, T.; Czepirski, L.; Gazda-Grzywacz, M. Carbon footprint of the hydrogen production process utilizing subbituminous coal and lignite gasification. J. Clean Prod. 2016, 139, 858–865. [Google Scholar] [CrossRef]
  12. Kim, M.; Kim, J. An integrated decision support model for design and operation of a wind-based hydrogen supply system. Int. J. Hydrog. Energy 2017, 42, 3899–3915. [Google Scholar] [CrossRef]
  13. Song, S.; Lin, H.; Sherman, P.; Yang, X.; Nielsen, C.P.; Chen, X.; McElroy, M.B. Production of hydrogen from offshore wind in China and cost-competitive supply to Japan. Nat. Commun. 2021, 12, 10–17. [Google Scholar] [CrossRef]
  14. Yang, X.; Nielsen, C.P.; Song, S.; McElroy, M.B. Breaking the hard-to-abate bottleneck in China’s path to carbon neutrality with clean hydrogen. Nat. Energy 2022, 7, 955–965. [Google Scholar] [CrossRef]
  15. Yue, M.; Lambert, H.; Pahon, E.; Roche, R.; Jemei, S.; Hissel, D. Hydrogen energy systems: A critical review of technologies, applications, trends and challenges. Renew Sustain. Energy Rev. 2021, 146, 111180. [Google Scholar] [CrossRef]
  16. IEA. Oil, Gas and Coal Reserves and Resources in China; IEA: Paris, France, 2022; Available online: https://www.iea.org/data-and-statistics/charts/oil-gas-and-coal-reserves-and-resources-in-china (accessed on 10 March 2023).
  17. IRENA. Future of Wind: Deployment, Investment, Technology, Grid Integration and Socio-Economic Aspects. 2019. Available online: https://www.irena.org/-/media/files/irena/agency/publication/2019/oct/irena_future_of_wind_2019.pdf (accessed on 1 March 2023).
  18. Li, P.; Yu, H.; Zhang, J.; Du, M.; Xiong, J. Coal Supply Sustainability in China: A New Comprehensive Evaluation Methodology. Front. Energy Res. 2021, 9, 1–19. [Google Scholar] [CrossRef]
  19. Administration, N.E. Grid-Connected Operation of PV Power Generation in the 1st Half of 2020. Available online: http://www.nea.gov.cn/2020-07/31/c_139254346.htm (accessed on 20 March 2023). (In Chinese)
  20. IEA. World Energy Outlook 2021. Available online: https://www.iea.org/reports/world-energy-outlook-2021 (accessed on 1 March 2023).
  21. Asmelash, E.; Prakash, G.; Kadir, M. Wind and Solar PV–What We Need by 2050. Available online: https://www.irena.org/-/media/Files/IRENA/Agency/Webinars/07012020_INSIGHTS_webinar_Wind-and-Solar.pdf? (accessed on 1 May 2023).
  22. The Installed Capacity of Grid-Connected Wind Power in China; National Energy Administration: Beijing, China, 2021.
  23. Zhang, S.J.; Jing, W.; Chen, X.; Zhao, Y.H. China in global wind power development: Role, status and impact. Renew. Sustain. Energy Rev. 2020, 127, 109881. [Google Scholar] [CrossRef]
  24. Binder, M.; Kraussler, M.; Kuba, M.; Luisser, M. Hydrogen from Biomass Gasification; IEA Bioenergy: Paris, France, 2018; Available online: https://task33.ieabioenergy.com/wp-content/uploads/sites/33/2022/07/Wasserstoffstudie_IEA-final.pdf (accessed on 10 January 2023).
  25. Zhang, D.; Liu, H.; Wang, Y. 3060 Blue Book on Development Potential of Zero Carbon Biomass Energy. 2021. Available online: https://www.xdyanbao.com/doc/xg5ohtm23x?bd_vid=17514962402993766590 (accessed on 15 January 2023). (In Chinese).
  26. Midilli, A.; Kucuk, H.; Topal, M.E.; Akbulut, U.; Dincer, I. A comprehensive review on hydrogen production from coal gasification: Challenges and Opportunities. Int. J. Hydrogen Energy 2021, 46, 25385–25412. [Google Scholar] [CrossRef]
  27. Mehmeti, A.; Angelis-Dimakis, A.; Arampatzis, G.; McPhail, S.J.; Ulgiati, S. Life cycle assessment and water footprint of hydrogen production methods: From conventional to emerging technologies. Environments 2018, 5, 24. [Google Scholar] [CrossRef]
  28. Li, G.; Zhang, K.; Yang, B.; Liu, F.; Weng, Y.; Liu, Z.; Fang, Y. Life cycle analysis of a coal to hydrogen process based on ash agglomerating fluidized bed gasification. Energy 2019, 174, 638–646. [Google Scholar] [CrossRef]
  29. Yu, M.; Wang, K.; Vredenburg, H. Insights into low-carbon hydrogen production methods: Green, blue and aqua hydrogen. Int. J. Hydrogen Energy 2021, 41, 21261–21273. [Google Scholar] [CrossRef]
  30. Al-Qahtani, A.; Parkinson, B.; Hellgardt, K.; Shah, N.; Guillen-Gosalbez, G. Uncovering the true cost of hydrogen production routes using life cycle monetisation. Appl. Energy 2021, 281, 115958. [Google Scholar] [CrossRef]
  31. Guan, Y.; Luo, S.; Liu, S.; Xiao, B.; Cai, L. Steam catalytic gasification of municipal solid waste for producing tar-free fuel gas. Int. J. Hydrogen Energy 2009, 34, 9341–9346. [Google Scholar] [CrossRef]
  32. Munir, M.T.; Mardon, I.; Al-Zuhair, S.; Shawabkeh, A.; Saqib, N.U. Plasma gasification of municipal solid waste for waste-to-value processing. Renew Sustain. Energy Rev. 2019, 116, 109461. [Google Scholar] [CrossRef]
  33. Reddy, S.N.; Nanda, S.; Dalai, A.K.; Kozinski, J.A. Supercritical water gasification of biomass for hydrogen production. Int. J. Hydrogen Energy 2014, 39, 6912–6926. [Google Scholar] [CrossRef]
  34. Schmidt, O.; Gambhir, A.; Staffell, I.; Hawkes, A.; Nelson, J.; Few, S. Future cost and performance of water electrolysis: An expert elicitation study. Int. J. Hydrogen Energy 2017, 42, 30470–30492. [Google Scholar] [CrossRef]
  35. Department for Business, Energy & Industrial Strategy. Hydrogen Production Costs 2021. Available online: https://assets.publishing.service.gov.uk/media/611b710e8fa8f53dc994e59d/Hydrogen_Production_Costs_2021.pdf (accessed on 1 March 2023).
  36. Simoes, S.G.; Catarino, J.; Picado, A.; Lopes, T.F.; di Berardino, S.; Amorim, F.; Gírio, F.; Rangel, C.; de Leão, T.P. Water availability and water usage solutions for electrolysis in hydrogen production. J. Clean Prod. 2021, 315, 128124. [Google Scholar] [CrossRef]
  37. Li, H.; Huang, X.; Zhou, D.; Cao, A.; Su, M.; Wang, Y.; Guo, L. Forecasting Carbon Price in China: A Multimodel Comparison. Int. J. Environ. Res. Public Health 2022, 19, 6217. [Google Scholar] [CrossRef] [PubMed]
  38. Kaplan, R.; Kopacz, M. Economic conditions for developing hydrogen production based on coal gasification with carbon capture and storage in Poland. Energies 2020, 13, 5074. [Google Scholar] [CrossRef]
  39. Nasser, M.; Megahed, T.F.; Ookawara, S.; Hassan, H. A review of water electrolysis–based systems for hydrogen production using hybrid/solar/wind energy systems. Environ. Sci Pollut. Res. 2022, 29, 86994–87018. [Google Scholar] [CrossRef]
  40. IEA. Opportunities for Hydrogen Production with CCUS in China n.d.; IEA Bioenergy: Paris, France, 2022. [Google Scholar]
  41. Junfeng, L.; Wan, Y.H.; Ohi, J.M. Renewable energy development in China: Resource assessment, technology status, and greenhouse gas mitigation potential. Appl. Energy 1997, 56, 381–394. [Google Scholar] [CrossRef]
  42. Fang, C. The future analysis and prospects of wind power development in China. Res. Approach 2007, 29, 12. [Google Scholar]
  43. Pöyry. Wholesale Electricity Price Projections for China. 2014. Available online: https://aim.afry.com/download/18.2274a4ff17b29107f856ac9d/1629106621434/AIMRFlyer_China_2020_v100.pdf (accessed on 15 March 2023).
  44. Li, Z.; Ito, K.; Komiyama, R. Energy Demand and Supply Outlook in China for 2030 and A Northeast Asian Energy Community—The automobile strategy and nuclear power strategy of China. Jpn. Inst Energy Econ. August 2005, 31, 1–31. [Google Scholar]
  45. Duić, N.; Štefanić, N.; Lulić, Z.; Krajačić, G.; Pukšec, T.; Novosel, T. EU28 Fuel Prices 2015, 2030 and 2050. Heat Roadmap Eur 2050. 2017. Available online: https://heatroadmap.eu/wp-content/uploads/2020/01/HRE4_D6.1-Future-fuel-price-review.pdf (accessed on 15 March 2023).
  46. Qin, Y.; Wagner, F.; Scovronick, N.; Peng, W.; Yang, J.; Zhu, T.; Smith, J.R.; Mauzerall, D.L. Air quality, health, and climate implications of China’s synthetic natural gas development. Proc. Natl. Acad. Sci. USA 2017, 114, 4887–4892. [Google Scholar] [CrossRef]
Figure 1. Electricity generation mix of different countries in 2020 [2].
Energies 17 01694 g001
Figure 2. The biomass production capacity in China in different year [25].
Energies 17 01694 g002
Figure 3. The hydrogen production process through coal gasification.
Energies 17 01694 g003
Figure 4. Carbon capture and storage procedure.
Energies 17 01694 g004
Figure 5. The process diagram of work analysis.
Energies 17 01694 g005
Figure 6. The levelized cost of hydrogen (red triangles represent the LCOH of hydrogen produced by this work) [4].
Energies 17 01694 g006
Figure 7. The evolution of LCOH of different production methods from 2020 to 2050.
Energies 17 01694 g007
Figure 8. The variation of cost components: (a) CG-CCS; (b) solar-based ALK.
Energies 17 01694 g008
Figure 9. Cost components of different H2 production methods in 2050.
Energies 17 01694 g009
Figure 10. The optimal technology mix of hydrogen production by 2050 with higher CG-CCS ratio.
Energies 17 01694 g010
Figure 11. The optimal technology mix of hydrogen production by 2050 with higher renewable ratio.
Energies 17 01694 g011
Figure 12. The sensitivity analysis on low-carbon H2 production methods and solar-based electrolysis. Notes: 1. ‘Solar-SOEC/BG + CCS’ means the pathway to produce hydrogen, Solar-SOEC means input electricity of SOEC electrolyser is from solar PV, applied to other bar caption. 2. Fuel cost in Figure 12 for solar-powered electrolysers actually means the electricity prices produced by solar PV.
Energies 17 01694 g012
Figure 13. The sensitivity analysis on electrolysers powered by onshore and offshore wind power. Notes: 1. ‘Onshore wind-ALK’ means the pathway to produce hydrogen, representing the input electricity of ALK electrolyser is from onshore wind. Other bar caption is same as ‘Onshore wind-ALK’; 2. Fuel cost in Figure 13 for wind-powered electrolysers actually means the electricity prices produced by wind turbines.
Energies 17 01694 g013
Table 1. The techno-economic performance of different hydrogen production methods [1,2,5,26,29,31,37,38,39].
Embodied InputsUnitSMRSMR + CCSCGCG + CCSBGBG + CCSSolar PVWind
Fuel\Natural GasNatural
Gas
CoalCoalBiomassBiomassSolar energyWind energy
Fuel consumptionkg3.363.768.5110.3936.2836.34--
Electricity consumptionkWh0.311.11-1.36-3.5854.254.2
Water consumptionkg21.923.711.2840.1147.4847.9613.513.5
CO2 emissionskg9.261.0320.984.1332.8416.77\\
CH4 emissionskg\\2.66 × 10−23.22 × 10−2\\\\
N2O emissionskg\\6.97 × 10−61.87 × 10−5\\\\
NO2 emissionskg\\\\0.017.74 × 10−3\\
C A P E X [2020, 2030, 2050]$/kW\[530, 466, 361]\[1200, 900, 750]\[1370, 1250, 1100]\\
Fixed O P E X [2020]$/kW.year\25.38\41.68\95\\
Variable O P E X $/kWh H2\0.00013\0.0026\0.005\\
Load factor%\90%\90%\90%\\
Notes: 1. The data in Table 1 were obtained when 1 kg H2 was produced. 2. C A P E X —capital expenditure, O P E X —operational expenditure. 3. [2020, 2030, 2050] means the C A P E X in year 2020, 2030, and 2050, respectively.
Table 2. The techno-economic performance comparison of different electrolysis technologies [1,2,8,9,10,15,30,40].
ComparisonAEKPEMSOEC
ElectrolyteNaOH/KOH(aq)Polymer(s)YSZ(s)
Charge carriersOHH+O2
Electrode materialNi and Ni alloysPlatinum group metalsCermet and doped metal composites
Temperature60–90 °C50–90 °C500–1000 °C
Pressure [2020]2–10 bar15–30 barless than 30 bar
Cell voltage [2020]1.8–2.4 V1.8–2.2 V0.95–1.3 V
Current density [2020]0.2–0.5 A/cm21–2 A/cm20.3–1 A/cm2
Efficiency [2020]62-82%67–84%81–86%
System lifetime20-30 years10–20 years\
Hydrogen production (maximum)760 Nm3/h30 Nm3/h\
Annual degradation2–4%2–4%17%
Electricity consumption kWh/kg H2 [2020, 2030, 2050][51, 48, 46][55, 50, 47][39, 37, 35]
Heat energy consumption kWh/kg H2 [2020, 2030, 2050]\\[32, 31, 30]
C A P E X £/kW (electricity input) [2020, 2030, 2050][600, 500, 455][790, 400, 340] [1600, 1000, 650]
Fixed O P E X M£/kW.year13.6 and replacement16.5 and replacement19.5 and replacement
Variable O P E X £/kWh.year0.0020.00770.0085
Load factor50%50%50%
1. C A P E X —capital expenditure, O P E X —operational expenditure. 2. [2020, 2030, 2050] means the C A P E X /electricity consumption in year 2020, 2030, and 2050, respectively. 3. The fixed O P E X of the technology also includes the stack replacement cost except for the labor, administration and insurance costs, it is assumed that ALK, PEM and SOEC will be replaced every 11, 9 and 7 years over the lifetime [37].
Table 3. Other key input parameters [34,41,42,43,44,45,46].
Year202020302050
H2 demand in China/Mt3339.6130
NG price $/MWh30.141.351.1
Coal price $/MWh9.61416.8
Biomass price $/MWh31.232.937.9
Water cost 1 $/t222
Water cost 2 $/t888
Grid electricity price $/MWh80.952.946.9
Solar electricity price $/MWh8348.829.3
Onshore wind electricity price $/MWh103.73924.4
Offshore wind electricity price $/MWh115.968.348.8
CO2 tax $/ton4973.2141.5
Notes: 1. Water cost 1 is the cost for low-carbon hydrogen production methods, including SMR-CCS, CG-CCS, and BG-CCS. 2. Water cost 2 is the cost for renewable hydrogen production methods, and the cost is higher as it considered the water pre-treatment and desalination process [34]. 3. The difference between water cost 1 and water cost 2 is that they are used in different hydrogen production technologies, because electrolysers need higher water purity, thus, sea water has to be pre-treated and desalinated, and it is assumed that water will not affect the hydrogen production efficiency, but affect the hydrogen production costs.
Disclaimer/Publisher’s Note: The statements, opinions and data contained in all publications are solely those of the individual author(s) and contributor(s) and not of MDPI and/or the editor(s). MDPI and/or the editor(s) disclaim responsibility for any injury to people or property resulting from any ideas, methods, instructions or products referred to in the content.

