Article

Analysis of the Influence of Insulation Moisture during Long-Term Exploitation of Transformers on Their Reliability as Determined by Alternating Current Electrical Parameters

1
Department of Economics, Vincent Pol University in Lublin, 2, Choiny Str., 20-816 Lublin, Poland
2
Department of Electrical Devices and High Voltage Technology, Lublin University of Technology, 38d, Nadbystrzycka Str., 20-618 Lublin, Poland
3
Department of High Voltage and Power Engineering, West Pomeranian University of Technology, 37, Sikorskiego Str., 70-313 Szczecin, Poland
4
Nynas AB Raffinaderivagen, 21, 149 82 Nynashamn, Sweden
5
Energo-Complex Sp. z o.o., 9, Lotników Str., 41-949 Piekary Slaskie, Poland
*
Author to whom correspondence should be addressed.
Energies 2024, 17(8), 1952; https://doi.org/10.3390/en17081952
Submission received: 26 March 2024 / Revised: 12 April 2024 / Accepted: 16 April 2024 / Published: 19 April 2024
(This article belongs to the Collection Featured Papers in Electrical Power and Energy System)

Abstract

:
This paper presents the results of the study of the direct current (DC) and alternating current (AC) electrical properties of an electrical pressboard–bio-insulating oil–water composite in a wide range of water content and temperatures used in electric power transformers. These parameters allow the level of insulation reliability to be determined after many years of operation of power transformers. To analyse the experimental results, a model of the DC and AC conductivities of nanocomposites based on the quantum-mechanical phenomenon of electron tunnelling was used. It was found that in a low-frequency region, the conductivities of AC and DC and their activation energy are equal. The relaxation times of AC conductivity and permittivity are also equal. It was found that the dependence of the DC conductivity on the distance between water molecules is an exponential function. On the basis of the model of conductivity by electron tunnelling between potential wells, the average number of water molecules in a nanodroplet, located in a composite of electrical pressboard–bio-insulating oil–moisture was determined to be (126 ± 20). It was found that the measured dependencies of DC and AC conductivity, permeability and dielectric relaxation times are consistent with the results of computer simulations performed on the basis of the model. This study showed that the composite of pressboard impregnated with bio-oil spontaneously transforms through water absorption into a pressboard–bio-oil–water nanocomposite. These will serve as the basis for the application of actual conductivity and dielectric relaxation mechanisms to improve the accuracy of moisture estimation in the solid component of power transformer insulation carried out on the basis of measurements of DC and AC properties. This will improve the operational safety of the transformers, minimise the occurrence of transformer failure and the associated environmental pollution.

1. Introduction

High-voltage power transformers have been manufactured with liquid–solid insulation for over a century. The production processes of transformers are briefly presented as follows. The copper windings of a power transformer are insulated with cellulose materials, such as winding paper and pressboard. The moisture content of the cellulose by weight can reach 8% or more [1,2,3]. Such high levels of moisture exclude the possibility of exploiting the transformer and its reliability is zero. Once the components are fabricated, the transformer is assembled in a hermetic tank. Vacuum drying of the insulation is then performed, which reduces the moisture content of the cellulose to approximately (0.8–1.0) wt.% [4,5]. Then, also under vacuum, the transformer’s tank is filled with insulating oil at a temperature above 60 °C, which has been previously vacuum-treated [6,7]. An impregnation process takes place, during which the oil fills the capillaries in the cellulose insulation.
Moisture gradually enters the transformer over the decades of operation and dissolves in the oil; then, the water molecules in the oil are delivered to the cellulose materials. Water is absorbed because the solubility of water in oil-impregnated cellulose is approximately 1000 times higher than that of oil [8]. Over a period of 20 years or more, the moisture content of the oil-impregnated cellulose by weight can increase to approximately 5%, which is a critical value. Moisture above this value reduces the reliability of the transformer to practically zero, which can result in the catastrophic failure of the transformer [9,10,11]. To determine whether the amount of moisture dissolved in oil approaches the critical value, the moisture level in the cellulose is periodically measured. It should also be remembered that the distribution of moisture in a transformer is always irregular [12]. For this purpose, electrical non-destructive methods are used. Each of these methods is based on the measurement of relevant electrical parameters of the insulation; the values of these parameters depend on the level of cellulose moisture. This requires the determination of so-called model characteristics (also called reference characteristics), on the basis of which the insulation condition of transformers is diagnosed. In order to obtain benchmark relationships, laboratory tests are carried out on an amalgam of paper and pressboard dried, moistened and then impregnated with insulating oil [13,14,15,16]. In the return voltage measurement (RVM) method [17,18,19], the dielectric relaxation time and its dependence on water content are determined. In the polarisation depolarisation current (PDC) method [20,21,22], the dependence of the DC conductance on the moisture content of the insulation is measured. The frequency domain spectroscopy (FDS) method [23,24,25,26] uses alternating current parameters such as loss angle tangent, permittivity and conductivity measured in the frequency range from sonic to ultra-low.
The most commonly used method for the diagnostics of insulation condition is the FDS method. Here, the frequency–temperature dependence of the loss angle tangent of the transformer insulation is analysed [27]. Modern FDS meters also provide an estimate of the moisture status of the cellulose insulation using their built-in software. Several factors influence the accuracy of the FDS moisture content measurements. Firstly, a precise determination of the so-called model characteristics—the frequency–temperature dependencies of the oil-impregnated pressboard moistened to a given water content—must be carried out. In a previous study [28], model characteristics were determined for water contents ranging from 1 wt.% to 4 wt.% while model characteristics were determined for a critical content of 5 wt.% in the papers [29,30,31,32]. Secondly, transformer insulation measurements should be carried out under conditions of thermodynamic equilibrium between the pressboard, insulation oil and water [5,33]. Under conditions of thermodynamic equilibrium between the moisture in the oil and the pressboard, the moisture content of the oil is several orders of magnitude lower than that of the pressboard. The relationship between the moisture content of the pressboard and oil at equilibrium conditions is described in the paper at [5]. As the temperature of the insulation increases, moisture diffuses from the cellulose into the oil and its moisture content increases. When the temperature is lowered, the process proceeds in the opposite direction. This means that making measurements in the absence of equilibrium can lead to false results. Thirdly, models should be used to analyse the measurement results, correctly describing the conductivity and dielectric relaxation in the cellulose–oil–moisture system.
The research shows that the models used in the FDS meter software (Primary Test Manager ver. 4.8) do not take into account the actual dielectric relaxation phenomena occurring in moisture insulation. This is evidenced, for example, by the paper found at [34]. It showed that the moisture value reported by the meter does not coincide with the real value. This means that determining the insulation reliability status of transformers based on software dedicated to FDS meters does not accurately detect the risk of failure. In [31], it was found that in order to match the frequency dependence of the loss angle tangent simulated by the meter to the waveform obtained by measurement, a temperature, greater than the actual measurement temperature, must be entered into the software. Even after manual temperature correction, the result given by the meter is overestimated by approximately 1 wt.% in relation to the actual moisture content. Studies of a series-parallel XY system consisting of cellulose and insulating oil were performed in [32]. It was found that matching simulated waveforms to experimental waveforms results in rapid (by several orders of magnitude) changes in the estimated oil conductivity with small changes in temperature. In doing so, the meter overestimated the ratio of cellulose volume to oil volume several times and the moisture content readings were inconsistent with its actual value. This means that such significant discrepancies between simulation and measurement results are due to the use of incorrect conductivity, polarization and dielectric relaxation models in the meter software. To the present, models have been used for this purpose in the following studies: Debye [35], Cole-Cole [36,37], Davidson-Cole [38,39] or Havriliak and Nagami [40]. Model analysis [35,36,37,38,39,40] has indicated that when the frequency reaches zero (DC voltage), the conductivity must also be zero. It is clear from the scientific literature that in the low-frequency region, the values of DC and AC conductivity are the same. For example, as reported in [29], in the ultralow-frequency region, DC conductivity was established to be equal to the AC conductivity of a moist oil-impregnated insulating pressboard. The studies, presented in the publications [29,31,32,34], show that the models used to date in the FDS meter software have resulted in large errors in the determination of the water content of the cellulose component of transformer insulation, the oil conductivity and the cellulose–oil volume ratio. This means that in order to estimate moisture correctly, a real model of conductivity and polarization found in composites should be developed and used in FDS meter software.
As reported in [41], DC conductivity studies have established that the value of conductivity in the ternary composite cellulose–insulating oil–moisture is determined by the presence of water. Conductivity in the composite is mediated by the quantum mechanical phenomenon of electron tunnelling between water molecules.
DC and AC conductivity studies of composites [42] have shown that water in moisture pressboard impregnated by insulating oil can be in the form of nanodrops, containing about 200 water molecules each. As a result of electron tunnelling from one nanodrop to another, a dipole is formed, resulting in the additional polarization of the material [43]. The value of the relaxation time for tunnelling depends on the distance between the nanodrops, the dielectric permittivity of the medium in which the nanodrops are located and the temperature [42].
Recently, it has been reported [44] that the DC conductivity of the composite was caused by the presence of liquid water containing high concentrations of inorganic salt ions.
In order to correctly select the mechanisms of conduction and dielectric relaxation occurring in the ternary composites of cellulose–insulating oil–moisture, a comparative analysis of the electrical parameters of the composite and constituent substances was completed. The changes in these parameters as a function of temperature should also be determined. From this, it is possible to determine which mechanism of current conduction—via liquid water containing ions of inorganic salts or the quantum mechanical mechanism of electron tunnelling—occurs in oil-impregnated moist cellulose.
To date, the most commonly used insulating oil is petroleum-based mineral oil. Nowadays, mineral oil has gradually been replaced with more environmentally friendly insulating fluids (such as Midel 7131 synthetic esters) and natural ester oils (such as Midel eN 1204) [45,46,47]. In recent years, alternatives to esters have emerged; these are bio-oils that use raw materials of plant origin. The use of bio-oils reduces the carbon footprint in the manufacture of power transformers. An excellent example of these oils is Nynas NYTRO BIO 300X [48]. The production technology for this oil and mineral oil is the same; however, the raw materials of the former are vegetable oils. Moreover, both types of oil have the same electrical strength [49]. The best insulating oil in terms of thermal capacity among those used in transformers thus far is Nynas NYTRO BIO 300X. In addition, its high biodegradability renders it environmentally friendly.
The aim of this study was to measure the DC and AC electrical properties of a ternary composite of electrical pressboard–insulating oil Nynas NYTRO BIO 300X–water over a wide temperature and water content range. A comparative analysis was completed of the electrical properties of the composite and determination of the structure and state in which moisture was present in the bio-oil-impregnated pressboard. This will serve as the basis for establishing the actual physical mechanisms of conductivity and dielectric relaxation occurring in the composite containing the bio-oil, thereby improving the determination of reliability by increasing the accuracy of the estimation of the moisture content of the solid component of power transformer insulation performed on the basis of measurements of the DC and AC properties (FDS measurements).

2. Materials and Methods

The test samples were made of a Weidman pressboard exclusively used for insulating power transformers. The pressboard samples were dried in a vacuum with a pressure value of 1 hPa at a temperature value of approximately 80 °C; the drying time was approximately 72 h. The weight of the pressboard sample after drying was determined. Then, the mass of the sample after humidification was calculated. The moistening process in which the pressboard absorbed water was conducted in atmospheric air. Once the calculated mass was reached, the sample was immersed in insulating oil for impregnation. The impregnation process in mineral oil can last from one week [50] to approximately six months [28,51], depending on the temperature and pressboard thickness. Previous studies [30] have shown that the time required for the complete impregnation of 2 mm thick samples in mineral oil was approximately 40 d at room temperature. The impregnation time was proportional to the viscosity of the oil and the square of the sample thickness. The viscosity of NYNAS NYTRO BIO 300X oil is more than twice that of mineral oil [48]. To accelerate impregnation, 1 mm thick samples were used. Temperature increase can rapidly reduce oil viscosity [52]. Therefore, the impregnation process was performed in a climate chamber at 45 °C, further reducing the impregnation duration to about 5 days. At the end of the impregnation process, thermodynamic equilibrium between the pressboard, oil and moisture was achieved. To this end, the time for the samples to stand in oil was extended to two weeks. In this way, a series of samples with water contents ranging from 1.0 wt.% to 5.0 wt.% was produced with step 1.0 wt.%. The uncertainty in determining the moisture content was approximately ±4%.
A schematic of the system for measuring the DC and AC parameters of the electrical pressboard–insulating oil–water composite is presented in detail in [30,53,54]. A three-electrode system was used as the main component of the stand. Measuring and voltage electrodes were used to obtain the volume current. A protective electrode was used to discharge the surface current to the ground. The moistened and impregnated pressboard was placed in a three-electrode measurement capacitor between the voltage and measurement electrodes.
The measuring capacitor with the pressboard sample was placed in a hermetic vessel full of insulating oil, and the vessel with the capacitor was then placed in the thermostat. The volume of oil should not exceed 10 times that of the pressboard. The time required for the measuring system to reach the set temperature was approximately 5 h due to the large mass of the system (approximately 12 kg). The uncertainty in temperature maintenance over a long period of time was ±0.05 °C.
DC and AC measurements were conducted using a DIRANA FDS–PDC dielectric response analyser (OMICRON Energy Solutions GmbH, Berlin, Germany). In frequency ranges of 1 × 10⁻³–5000 Hz and 1 × 10⁻⁴–1 × 10⁻³ Hz, 10 and 6 measurement points per decade were obtained, respectively. The measurements were performed at six temperature values, from 20 °C to 70 °C at steps of 10 °C.
The first measurements were performed at 20 °C. After stabilization, DC voltage was supplied to the measuring capacitor. Then, the polarization current was recorded every second during the PDC measurement; the measurements lasted 7200 s. During this period, the volume current value reached a steady state. The current value at this state was calculated as the average of the last 50 measurements. The power supply was then disconnected and the voltage and measuring electrodes were shorted. This resulted in the gradual discharge of the capacitor, which lasted for another 7200 s. After the capacitor was discharged, AC measurements were started at 5000 Hz. The subsequent measurement frequencies were set to 0.0001 Hz. The next temperature was set, and further DC and AC measurements were performed.
The current flow in materials is described by Maxwell’s second equation [55], as follows:
Δ × H = j R + j C ,
where H is the magnetic field strength vector; j R is the conduction current density and j C is the displacement (capacitive) current density. In the AC measurements, a sinusoidal forcing electric field is used as follows:
E = E 0 sin ( ω t ) ,
where E is the electric field strength vector; E 0 is the electric field amplitude vector; ω = 2πf is the circular frequency; f is frequency and t is time.
The conduction current density in Equation (1) is as follows [55]:
j R ( ω ) = σ ( ω ) E = σ ( ω ) E 0 sin ( ω t ) ,
where σ(ω) is conductivity and t is time.
The displacement current density (capacitive) [55] is as follows:
j C ( ω ) = ω ε ω ε 0 E 0 sin ω t π 2 ,
where ε′(ω) is the dielectric permittivity of material and ε0 is the dielectric permittivity of the vacuum.
The ability of an insulating material to conduct electric current, whether direct or alternating, is described by its conductivity. In contrast, dielectric permittivity characterises the polarisation of the insulating material.
In the parallel equivalent diagram, the DIRANA meter [56] provides the values of the following parameters: f (measurement frequency); CP (real component of complex capacitance); CP (imaginary component of complex capacitance); RP (resistance); Z (impedance); tgδ (tangent of loss angle) and PF = cosφ (power factor).
Using the values of RP and CP′, and considering the surface area, S, of the measuring electrode and the thickness, d, of the pressboard computed using known formulas [57], the DC and AC conductivity values and the real component of permittivity were calculated as follows:
σ = d R p S ,
ε = C P d ε 0 S .
These values were used in this work to analyse the conductivity and relaxation mechanisms occurring in the ternary cellulose–insulating oil–moisture composites.

3. Measurements of the DC Conductivity and Dielectric Permittivity of Pressboard–Oil–Water Composite and Their Comparison with the Properties of Water

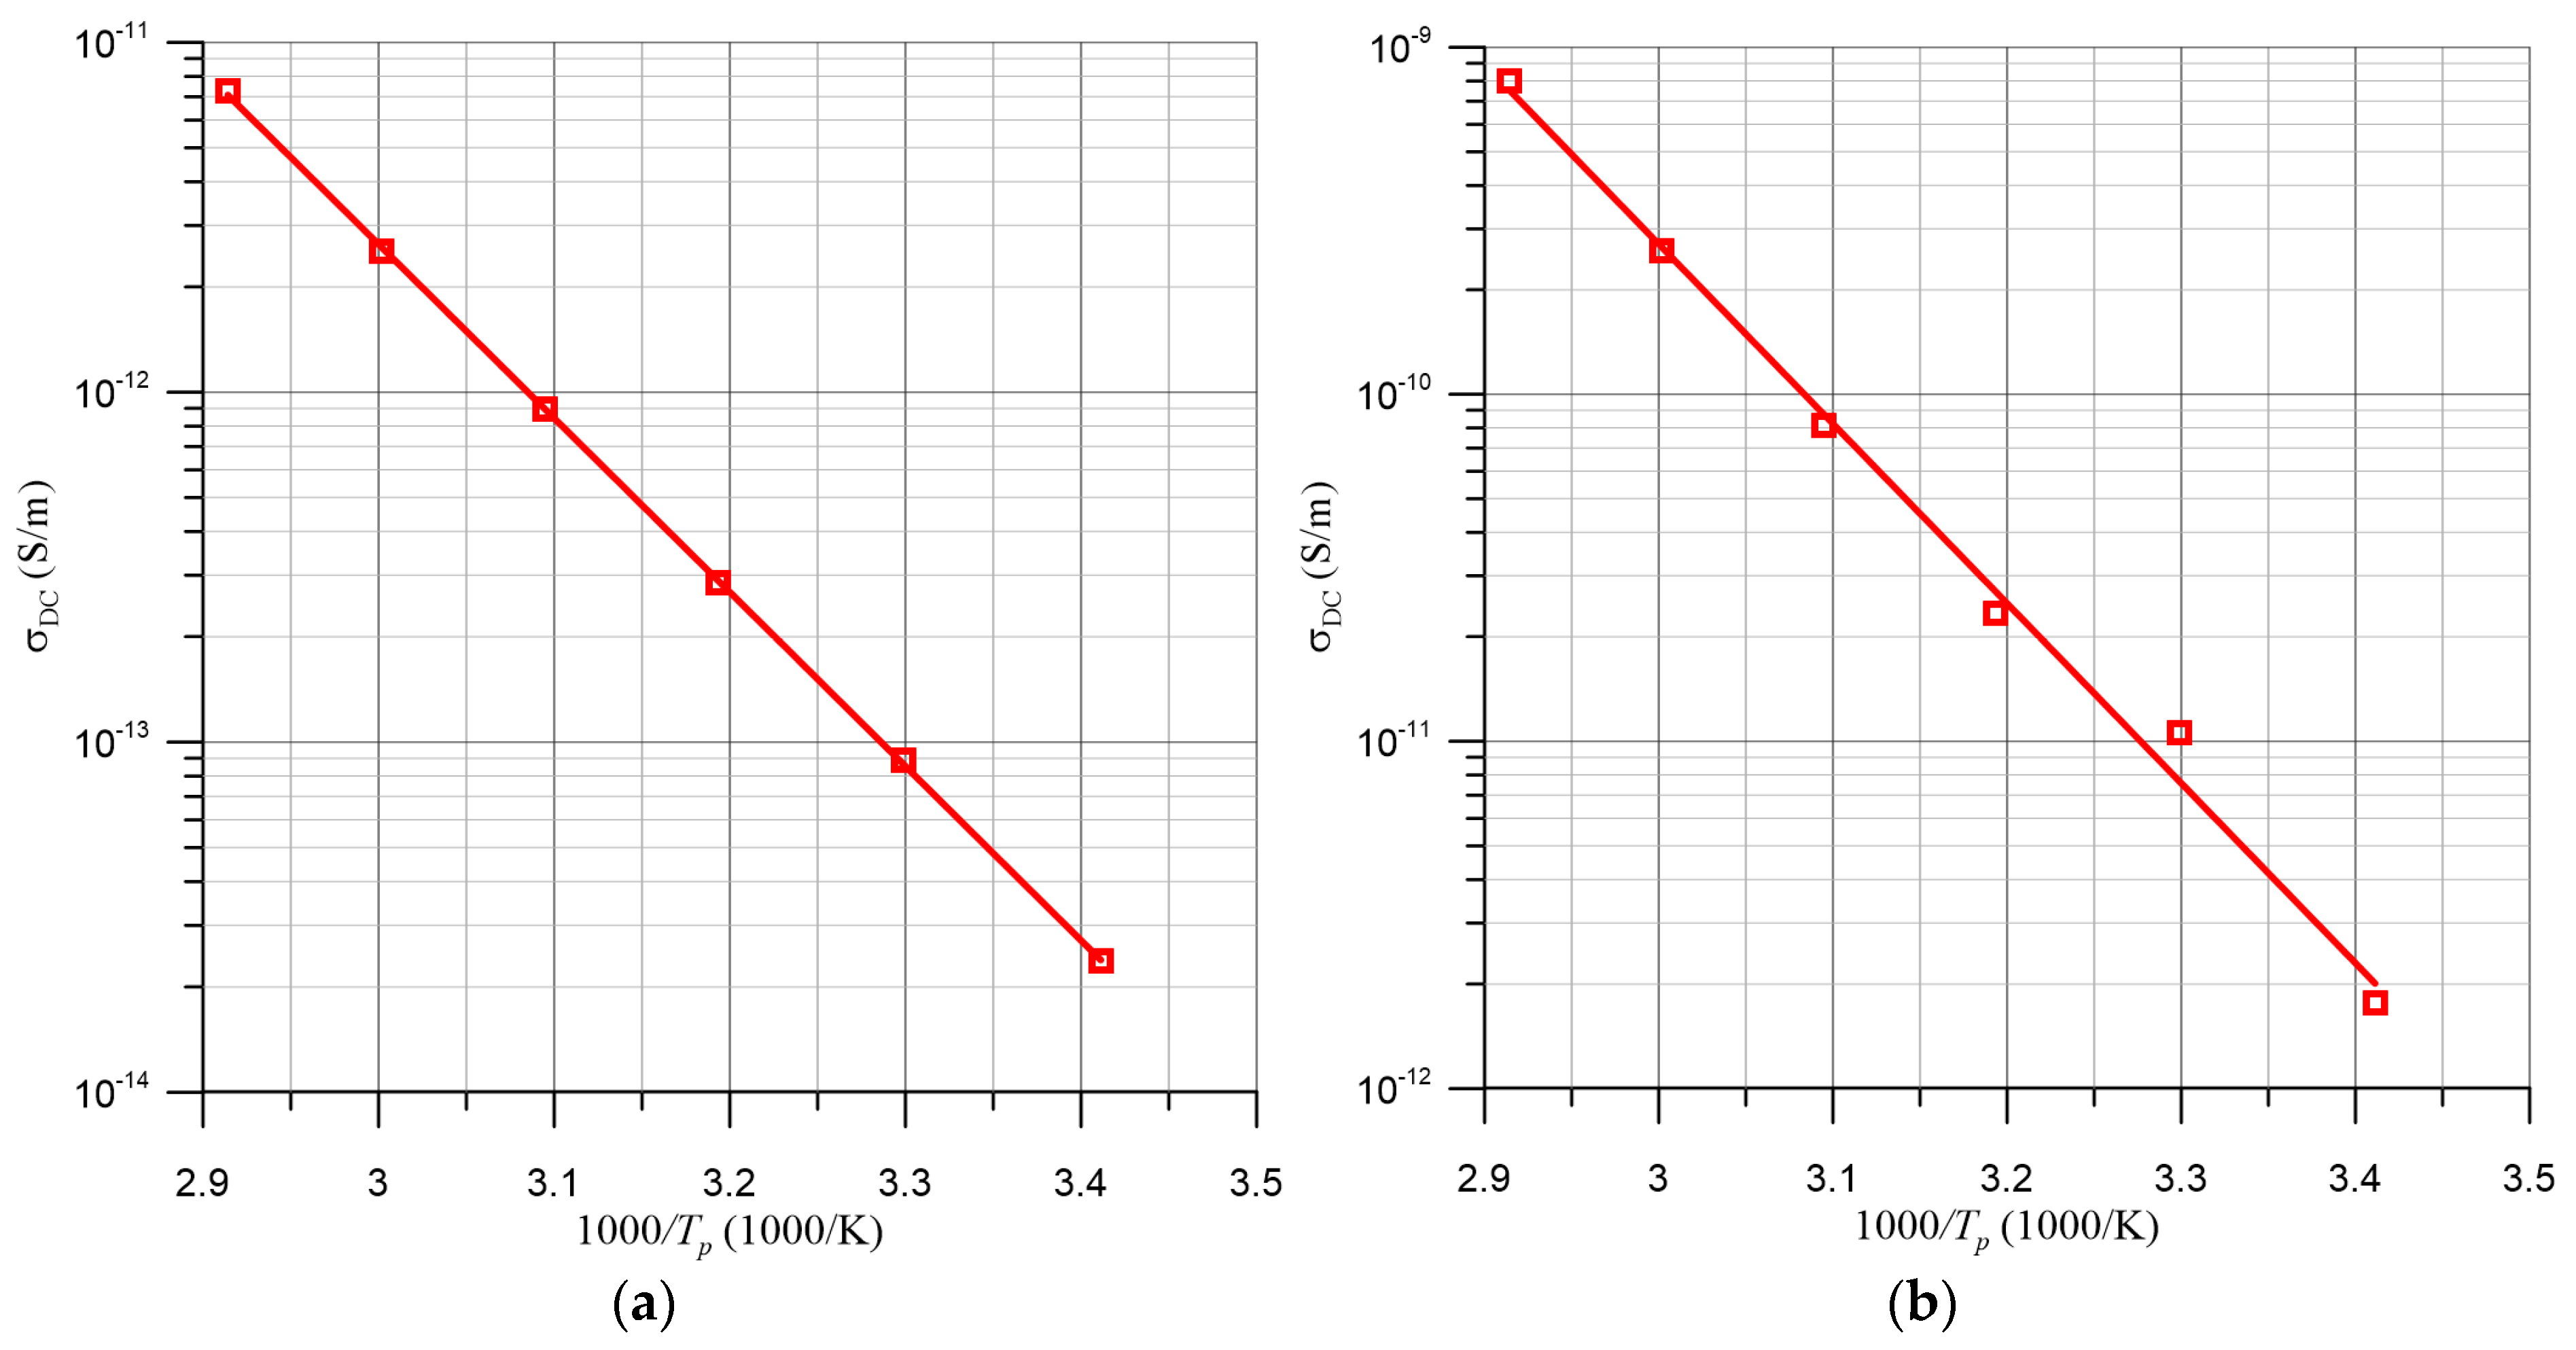
3.1. DC Properties of Moist NYTRO BIO 300X Insulating Oil-Impregnated Pressboard and Water

For the tests, two samples of the pressboard impregnated with NYTRO BIO 300X insulating oil with moisture contents of 1.0 and 5 wt.% were selected. The 1.0 wt.% moisture content is a characteristic value of the initial period of exploitation of transformers. With some approximation, this sample can be considered impregnated with almost dry oil. The 5 wt.% water content is a critical value; when exceeded, a catastrophic failure of the transformer may result [9,10,11]. Figure 1a,b, show the time dependence of the DC current of the samples with moisture contents of 1.0 and 5 wt.%, respectively.
As shown in Figure 1, the current intensity decreases over time and stabilises over long durations. Based on the current intensity, supply voltage, surface area of measuring electrode and thickness of pressboard, the conductivity values were calculated using the following formula:
σ = i d U S ,
where σ is the DC conductivity of the composite; i is the steady-state value of the current; U is the voltage that forces current flow; d is the pressboard thickness and S is the area of the measuring electrode.
When the moisture content is increased from 1 to 5 wt.% (i.e., a five-fold increase), the steady-state current also increases. As a result, conductivity increases by approximately 70 times at a temperature of 20 °C. This means that the steady-state conductivity of the composite was determined by the presence of water. As the temperature increased, rapid rates of increase in the steady-state current and associated conductivity were observed. When the activation energy of conductivity (∆E) is constant, the temperature dependence of conductivity is described by the following formula:
σ = σ 0 exp Δ E k T .
The logarithm of Equation (8) is as follows:
ln σ = ln σ 0 Δ E k T .
Reverse temperature is given as follows:
x = 1000 k T .
By substituting x (Equation (10)) into Equation (9), the following is derived:
ln σ = ln σ 0 1000 Δ E k x .
The dependence of the logarithm of conductivity on the inverse temperature is called the Arrhenius plot. Based on Equation (11), for a constant value of activation energy, the Arrhenius plot is a straight line; the slope depends on the activation energy.
Figure 2 shows the Arrhenius plots of samples with moisture contents of 1 and 5 wt.%.
To determine the quality of linear approximations, the coefficient of determination (R2) values were derived. When the moisture contents are 1 and 5 wt.%, R2 = 0.9999 and 0.9939, respectively. In both cases, the R2 values are very close to unity, proving the activation energy is constant in the temperature range investigated. Based on the Arrhenius diagrams, the thermal activation energy of conductivity was calculated using Equation (11). When the moisture contents are 1 and 5 wt.%, ∆E ≈ 0.987 and 1.027 eV, respectively. The average value of ∆E and the uncertainty in determining the activation energy are approximately 1.007 ± 0.020 eV and ±1.99%, respectively.
Water is widely used in virtually all areas of human life and in many industries. Accordingly, highly accurate values of DC properties are specified in many articles, such as [58], and in international standards, such as those presented in [59,60,61,62]. Moreover, the quality control of water, especially PW and ultra-pure water (UPW) [60,61,62,63,64], is based on DC measurements. Therefore, in this work, the analysis of water properties was performed based on the research results reported in virtually literature.
In materials with high resistivity, low conductivity is thermally activated and determined by the activation energy. Based on the conductivity values of UPW and UPW with 1 mg/L of dissolved NaCl salt presented in tabular form in publication [59], the Arrhenius diagrams shown in Figure 3 are developed.
As reported in [65], thermally activated auto-dissociation occurs in UPW, resulting in an increase in the number of H+ and OH eigen-ions with temperature. The figure also shows an Arrhenius plot for the ionic content of UPW (3) versus inverse temperature (right scale and developed from data presented in [65]). The coefficients of determination (R2) for all the three curves determined from the plots are 0.9993 (UPW), 0.9993 (UPW + NaCL) and 0.9991 (ion concentration in UPW), respectively. The R2 values approaching unity prove that the activation energy for each of the curves does not depend on temperature. The activation energy of conductivity is known to be the sum of two values [66,67,68] as follows: dissociation energy (which determines the concentration of free ions) and the activation energy of ion migration. The activation energy of the UPW conductivity determined from curve 1 in Figure 3 is 0.377 eV. In the case of UPW, the ion concentration is determined by the auto-dissociation energy, whose value is 0.276 eV, as determined from curve 3 shown in Figure 3. The activation energy of the migration of eigen-ions in UPW is 0.101 eV, which is equal to the difference between the two values above. The activation energy of DC conductivity for UPW + 1 mg/L NaCl is obtained from curve 2 shown in Figure 3. Its value is approximately 0.147 eV, which is approximately 2.5 times smaller than the activation energy of the UPW conductivity. NaCl and other water-soluble inorganic salts undergo spontaneous dissociation after dissolution that does not require thermal activation. In this case, the activation energy of conductivity is equal to that of the migration of Na+ and Cl ions. Its value is slightly higher than the activation energy of the migration of eigen-ions in UPW. In both cases, this may be related to the different values of ion mobility.
Based on the activation energies of UPW and UPW + 1 mg/L NaCl shown in Figure 3, these values are several times lower (by 2.67 and 6.85 times, respectively) than the activation energy (∆E ≈ 1.007 ± 0.020 eV (Figure 3) of the DC conductivity of a pressboard–insulating oil–water composite.
The variations in the activation energies of the DC conductivity of the pressboard–insulating oil–water composite with the values for UPW and with UPW+ NaCl exclude the possibility of conductivity through liquid water containing high contents of inorganic salt ions in the composite, a model of which was proposed in [44].

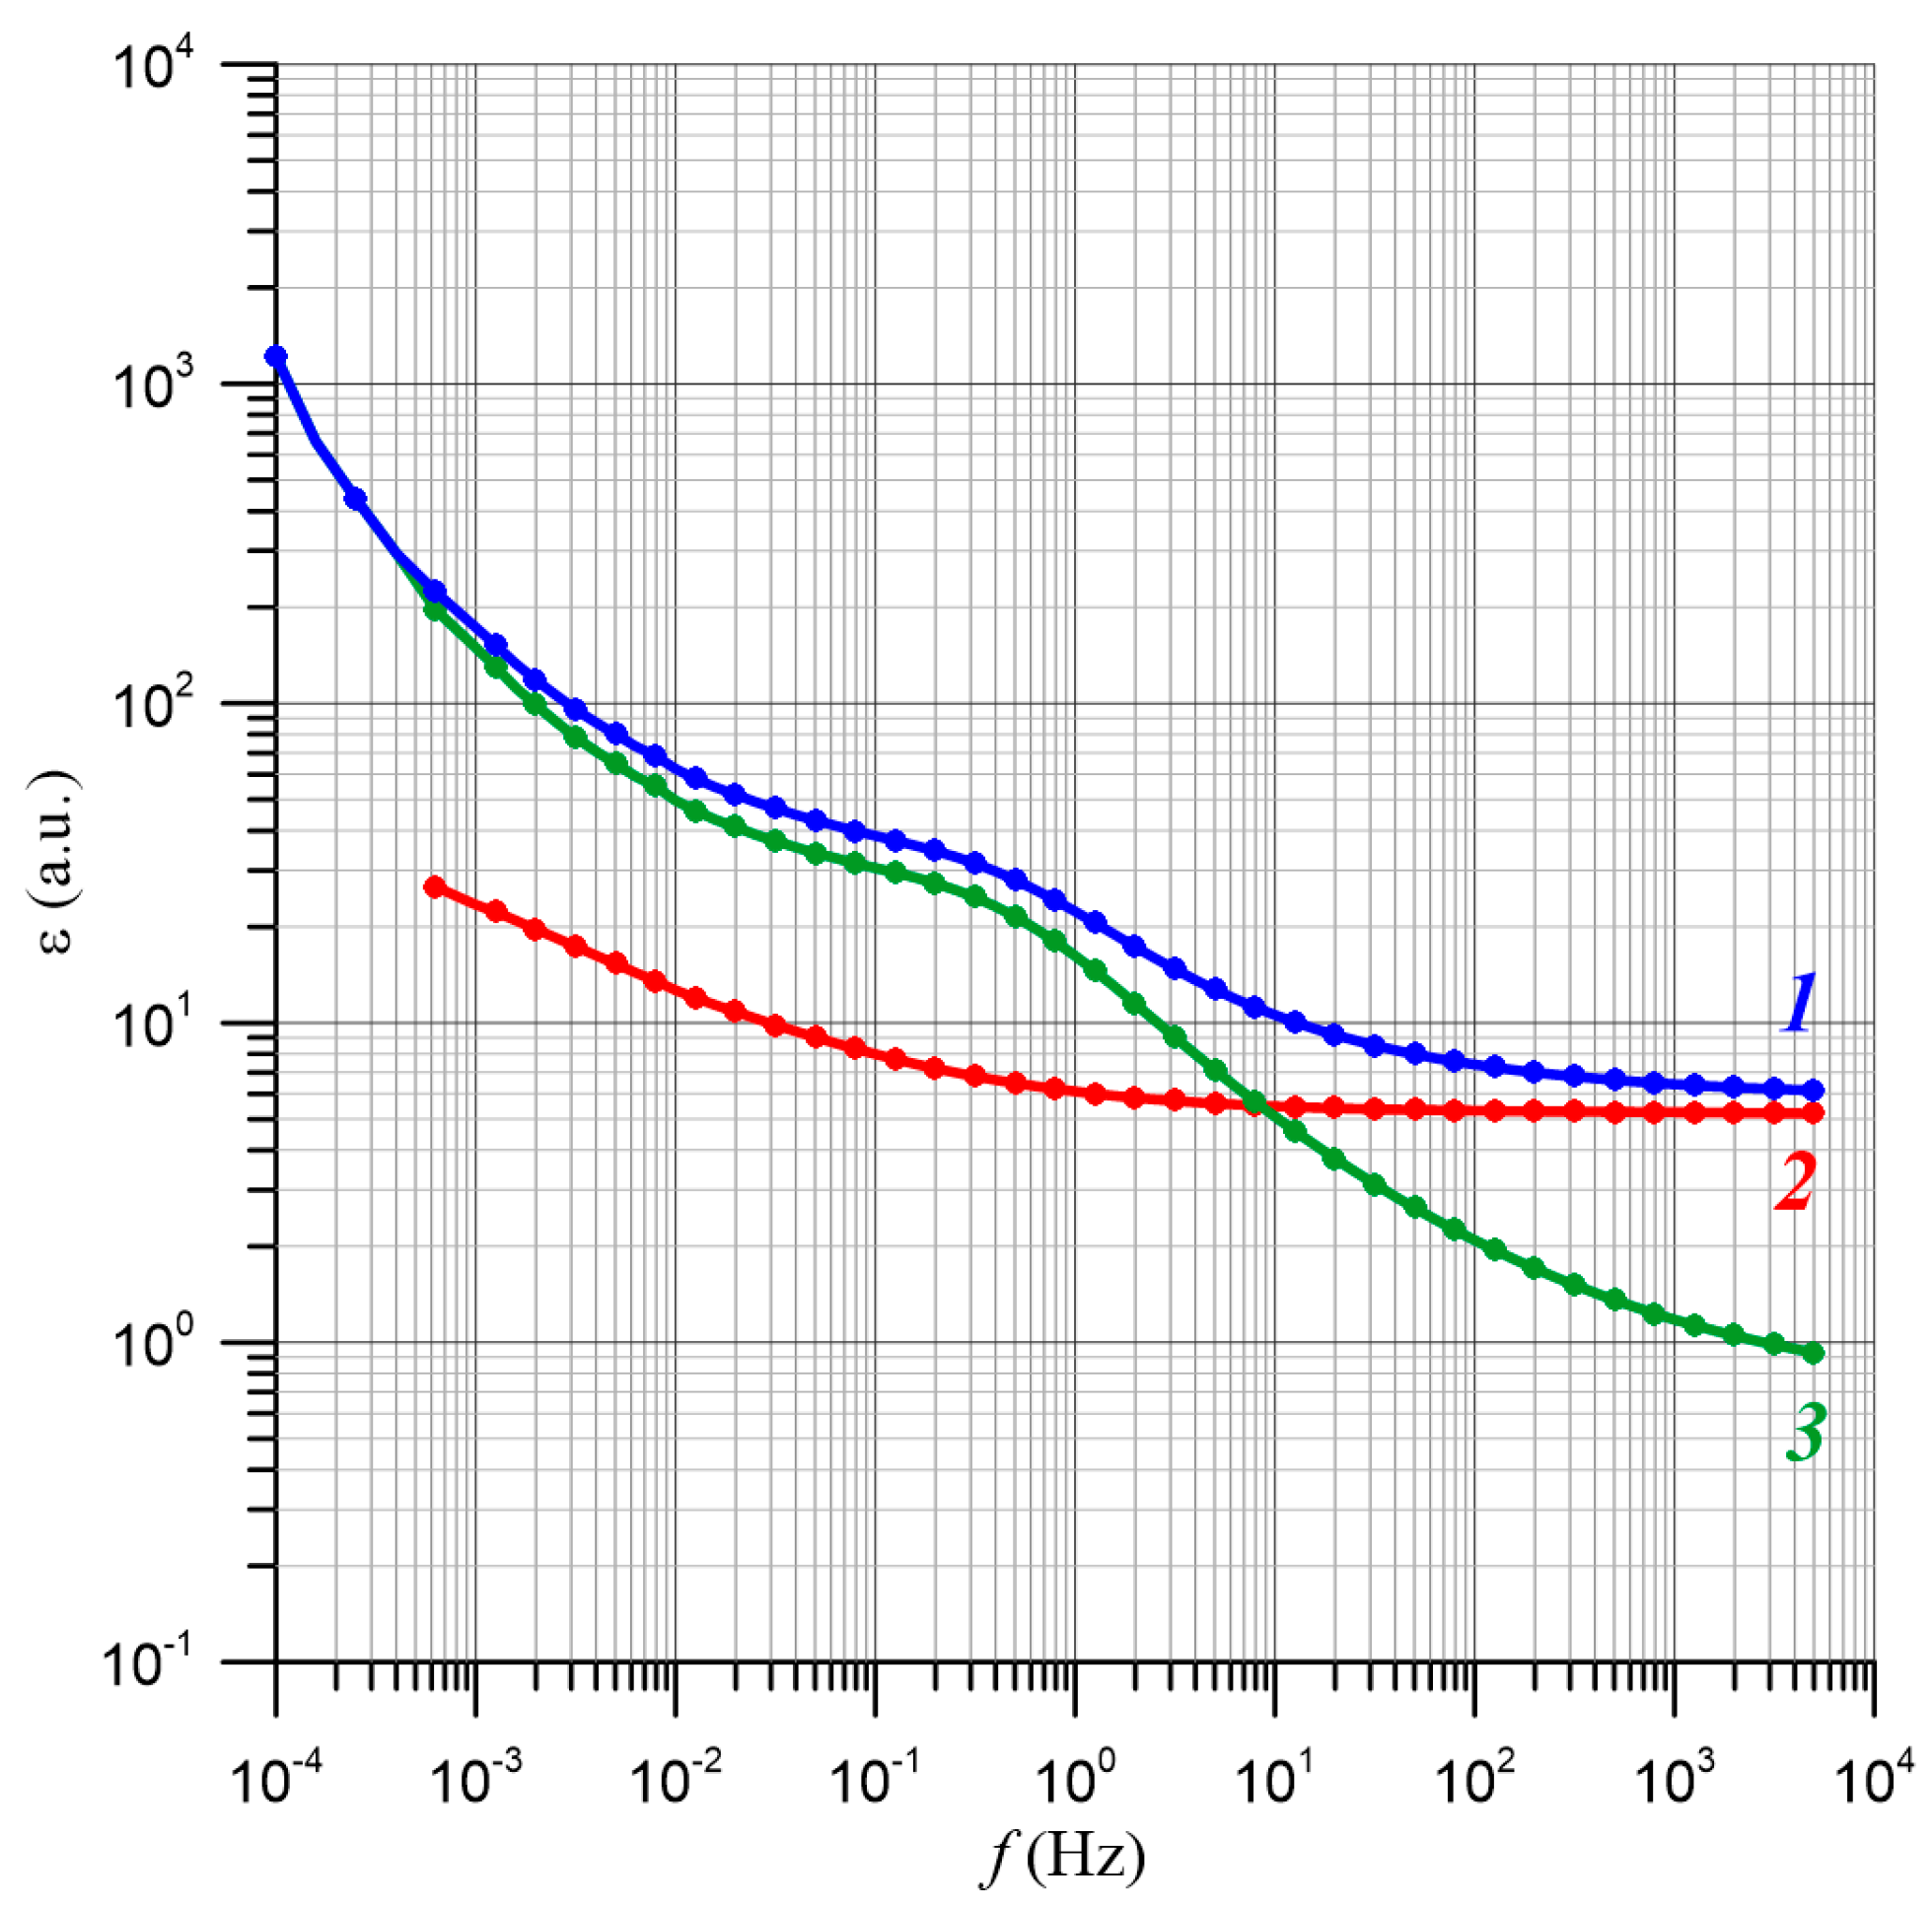
3.2. Dielectric Permittivity and Dielectric Relaxation of Moist Pressboard Impregnated with Insulating Oil

Figure 4 shows the dependence of permittivity on the frequency of a pressboard impregnated with insulating oil with water contents of 1 and 5 wt.% at 70 °C. The figure also shows the difference between the two water contents.
A comparison of the waveforms shown in Figure 4 indicates that an increase in water content from 1 wt.% to 5 wt.% also results in an increase in permittivity from approximately 6 to 30 in the frequency region at approximately 0.3 Hz (static permittivity). This is clearly related to the increase in the water content of the pressboard.
Such an increase in capacitance and permittivity can occur with the parallel connection of the impregnated pressboard and the water-filled channels connecting the electrodes.
In this case, the capacitance values of the pressboard and channels are added, as follows:
C a w = C P R + C W .
The capacitance values inputted into Equation (12) are obtained using the following:
C P R = ε P R ε 0 S S K d = ε P R ε 0 S d ε P R ε 0 S K d ,
C W = ε W ε 0 S K d ,
where S is the surface area of the measuring electrode; SK is the cross-sectional area of the channels connecting the electrodes filled with water; εPR is the dielectric permittivity of the dry pressboard impregnated with insulating oil; εW is water permittivity and εaw is the equivalent permittivity.
The capacitance values inputted into Equation (12) are obtained using the following:
C = ε P R ε 0 S d ε P R ε 0 S K d + ε W ε 0 S K d = ε a w ε 0 S d .
From Equation (15), we calculate the ratio of the cross-sectional area of the channels SK to the cross-sectional area of the measuring electrode S, and the ratio of the volume of water to the volume of the pressboard, as follows:
S K S = ε a w ε P R ε W ε P R = V W V .
The static permittivity of the water at 70 °C is approximately 60 [67]. By substituting the permittivity of dry pressboard εPR, the permittivity of pressboard with a moisture content of 5 wt.% εaw and water permittivity εw ≈ 60 into the equation, S K S = V W V 0.44 or about 44 wt.% is calculated. Accordingly, εaw, which is determined experimentally, can be obtained if the water content exceeds the actual value (5 wt.%) by approximately 8.8 times. This water content excludes the possibility that the electrodes may be connected by the water in the channels.
One of the important parameters of a composite is its dielectric relaxation time. As reported in [35,36,37], the permittivity relaxation time is determined by the frequency at which the permittivity value at a given stage is reduced by half, as follows:
τ = 1 2 π f 1 / 2 .
Figure 4 shows that at 70 °C, the frequency is f1/2 ≈ 3 Hz.
By substituting f1/2 into Equation (17), the relaxation time of approximately 0.05 s was calculated. The relaxation time for macroscopic volumes of liquid water is approximately 10−11 s [65]. This means that the relaxation time of water contradicts the values determined experimentally for the moist pressboard impregnated with insulating oil. This excludes the possibility of water in the composite as channels connected the electrodes.
The constant current conductivity model proposed in [44] assumes that the conductivity of the pressboard–insulating oil–water composite is determined by that of liquid water with high concentrations of inorganic salt ions. Hence, the model completely contradicts the experimental results of conductivity, permittivity and dielectric relaxation of the composite.

4. Analysis of AC Conductivity of Electrical Pressboard–NYTRO BIO 300X Insulating Oil–Moisture Component Using Quantum Mechanical Electron Tunnelling Phenomenon

4.1. Quantum Mechanical Electron Tunnelling Phenomenon and Associated DC Conductivity

In materials with low conductivity, so-called hopping conductivity can occur, caused by the quantum phenomenon of electron tunnelling. The condition for its occurrence is the presence of nanometre-sized potential wells in the material. The distances between the wells should also be nanometres. The role of the wells can include atoms or molecules of admixtures or impurities and second-phase nanoparticles. The occurrence of the quantum phenomenon of electron tunnelling among potential wells is based on the wave function of a valence electron extending outwards from a nanometre-sized potential well. The probability of finding a valence electron at distance r outside a three-dimensional potential well created by a nanoparticle is given by the following formula [68]:
Ψ 2 exp 2 r R B ,
where Ψ is the wave function of the electron; r is the distance from the potential well in which the electron is located and RB is the radius of the location of the tunnelling electron (also called the Bohr radius).
When large concentrations of potential wells exist in a material, finding an electron originating from the first well inside the second well has a non-zero probability.
In the absence of an external electric field, the directions of electron tunnelling from well to well are random. When an electric field is applied, the partial ordering of electron jumps related to the Debye factor occurs [68], as follows:
exp ± e r E k T ,
where e is the electron charge; r is the distance between the well from which the electron is tunnelling and the well into which it is tunnelling; E is the electric field strength; k is the Boltzmann constant and T is the temperature.
As shown in Equation (19), in an electric field, fewer electrons tunnel in the direction of the external electric field than in the opposite direction. This difference indicates the occurrence of a steady electric current.
In the case of strong electron localisation, high temperature electron tunnelling occurs between the two nearest neighbouring potential wells [11].
The formula for the probability of tunnelling per unit volume per unit time was derived in the paper [69], as follows:
P r , T = P 0 exp 2 R B r Δ E k T ,
where P0 is the numerical factor; r is the average distance between two potential wells; RB is the radius of the location of the electron in the well of the potential (i.e., Bohr radius); ΔE is the activation energy; k is Boltzmann’s constant and T is temperature.
Using Equation (20), it is possible to derive the DC conductivity formula for the case of tunnelling between nearest neighbours [68,70], as follows:
σ = σ 0 exp 2 R B r Δ E k T ,
where r is the mean distance between the two potential wells; RB is the radius of location of the electron in the well of potential, the so-called Bohr radius; ΔE is the activation energy; k is Boltzmann’s constant and T is the temperature.
A model of hopping conductivity by electron tunnelling between two nearest neighbour potential wells describes the DC conductivity well. Because conductivity measurements are also implemented with AC voltage, models are developed to describe these processes. The Mott model is one of the basic models [68]. In this case, the AC conductivity dependence is described by the following:
σ f   ~   f S .
The comparison of Equation (22) with the DC conductivity described in Equation (21) shows that the DC and AC conductivities (described by Equation (22)) are inconsistent when the frequency approaches zero. From the Mott model (i.e., Equation (22)), it follows that as the frequency decreases to zero (i.e., constant current conductivity), the conductivity also decreases to zero (i.e., infinite resistivity). Mott’s model of AC conductivity does not take into account the relaxation time of the conductivity. After tunnelling, the electrons cannot immediately proceed to tunnelling another well. They remain in the well of the potential into which they tunnel for some time; this is called relaxation time. This is because the probability of tunnelling per unit volume per unit time is less than unity, see Formula (20). From the formula, it follows that the relaxation time is as follows:
τ = 1 P N = 1 P 0 N 2 r R B + Δ E k T
where N is the concentration of potential wells per unit volume.
The relaxation time was first considered in the DC–AC hopping conduction model reported in [71].
In previous studies [42,72], a model was developed to analyse the impedance of nanocomposites in which conductivity occurs by electron tunnelling among nanoparticles of the conductive phase; the model was subsequently verified experimentally. The model assumes that nanometre-sized potential wells exist in the material where the electrons are located (Figure 5). In each well, the valence electron was located in the highest occupied state. According to the Pauli principle, this electron cannot directly tunnel into a neighbouring well because the valence electron state in each well is occupied.
Tunnelling can only occur in the lowest unoccupied state. In this case, the valence electron must be excited to absorb the thermal energy, ∆E, which is equal to the energy difference between the highest occupied and lowest unoccupied states (Figure 5).
Under the influence of this field (Figure 5), tunnelling between the left and centre potential wells generates current density, given by the following:
j 1 = σ E = σ E 0 sin ω t ,
where ω is the circular frequency; E0 is the amplitude of the electric field strength and σ is conductivity.
Tunnelling also results in an electric dipole because the left well becomes positively charged and the centre well becomes negatively charged. This results in further polarisation of the material. In a previous study [43], the additional static permittivity of the material resulting from the tunnelling phenomenon was analysed and verified experimentally.
After tunnelling to the central well, the electron remains there over the relaxation time, τ. Thereafter, two variants in tunnelling are possible. In the first case, the electron with probability p tunnels from the central well to the right well in a direction opposite to the electric field vector (Figure 5). This results in the second component of current density, as follows:
j 2 = σ E 0 p sin ω ( t τ ) .
In the second variant, after the relaxation time, τ, the electron tunnels back from the middle well to the left well (Figure 5) with probability (1 − p), which results in the appearance of the third component of current density, as follows:
j 3 = σ E 0 ( 1 p ) sin ω ( t τ ) .
The driving force behind this tunnelling is the attraction of electrons from the middle well by the positive charge of the left well.
We will now extract from Equations (24)–(26) the actual component of conductivity due to tunnelling, as follows:
j R = σ E 0 1 1 2 p cos ω τ .
It follows from Equation (27) that the values of DC conductivity, σDC, and low-frequency conductivity, σL, are equal in the case of hopping conductivity (tunnelling), as follows:
σ D C = σ A C L = 2 p σ 0 ,
However, in a high-frequency area,
σ A C H = σ 0 .
In the transition region, ωτ ≤ 1, indicating the frequency dependence of conductivity, which is described by Mott [70] using the following:
j r   ~   f α ( f ) ,
where α = α(f) is the frequency factor.
Different from the Mott model, coefficient α(f) is a function of frequency. In [43], the relaxation time was considered dependent on the distance between two potential wells. Because the distribution of wells in the material is random, the probability distribution of the expected value of relaxation time is τm. The probability distribution of time τ must only be determined for positive values. Negative values mean that the electron returns from the second well to the first well even before it has tunnelled out of the first one. The condition for defining time τ only for positive values corresponds to the Landau distribution in the Moyala approximation [74]. This distribution can be described using the following:
F L ( τ ) = 1 σ m 2 π exp τ τ m 2 σ m 1 2 exp τ τ m σ m ,
where σm is the standard deviation and τm is the expected value.
By considering the Landau distribution, Equation (27) for conductivity will be written in the following form:
σ r ω = τ F L τ σ E 0 1 1 2 p cos ω τ d τ .
To calculate the conductivity according to Equation (32), numerical methods were used. Further, to eliminate the influence of relaxation time on the waveforms, calculations were performed for the values of the argument, m. Calculations were also performed for probability values (p) ranging from 1 × 10⁻⁶ to 0.5 with an extremely small step. As an example, Figure 6 shows the calculated relationship, σ(m), for probability values p = 0.01, 0.001 and 0.0001.
Figure 6a shows that in the low-frequency region, conductivity does not depend on frequency, is equal to the constant current value and determined by Equation (28). However, if the frequency is increased, conductivity increases. In the high-frequency region, the conductivity value is stabilised at a level higher than the constant current conductivity value determined by Equation (29).
For the same probability values, the frequency dependence of coefficient α(f) is determined from Equation (30). Some example dependencies of α values are shown in Figure 6b, which shows that as the probability of jumping (p) decreases, the maximum value of the frequency factor αmax, increases and its position on the x-axis shifts to the low-frequency region.
As shown in Figure 6a,b, the parameters that fully characterize the waveforms, σ(f), are the jump probability (p), the expected value of relaxation time (τm) and the conductivity value in the high-frequency region (σ0). Based on these values, and using Equation (32), the waveforms, σ(f) and α(f), can be calculated.

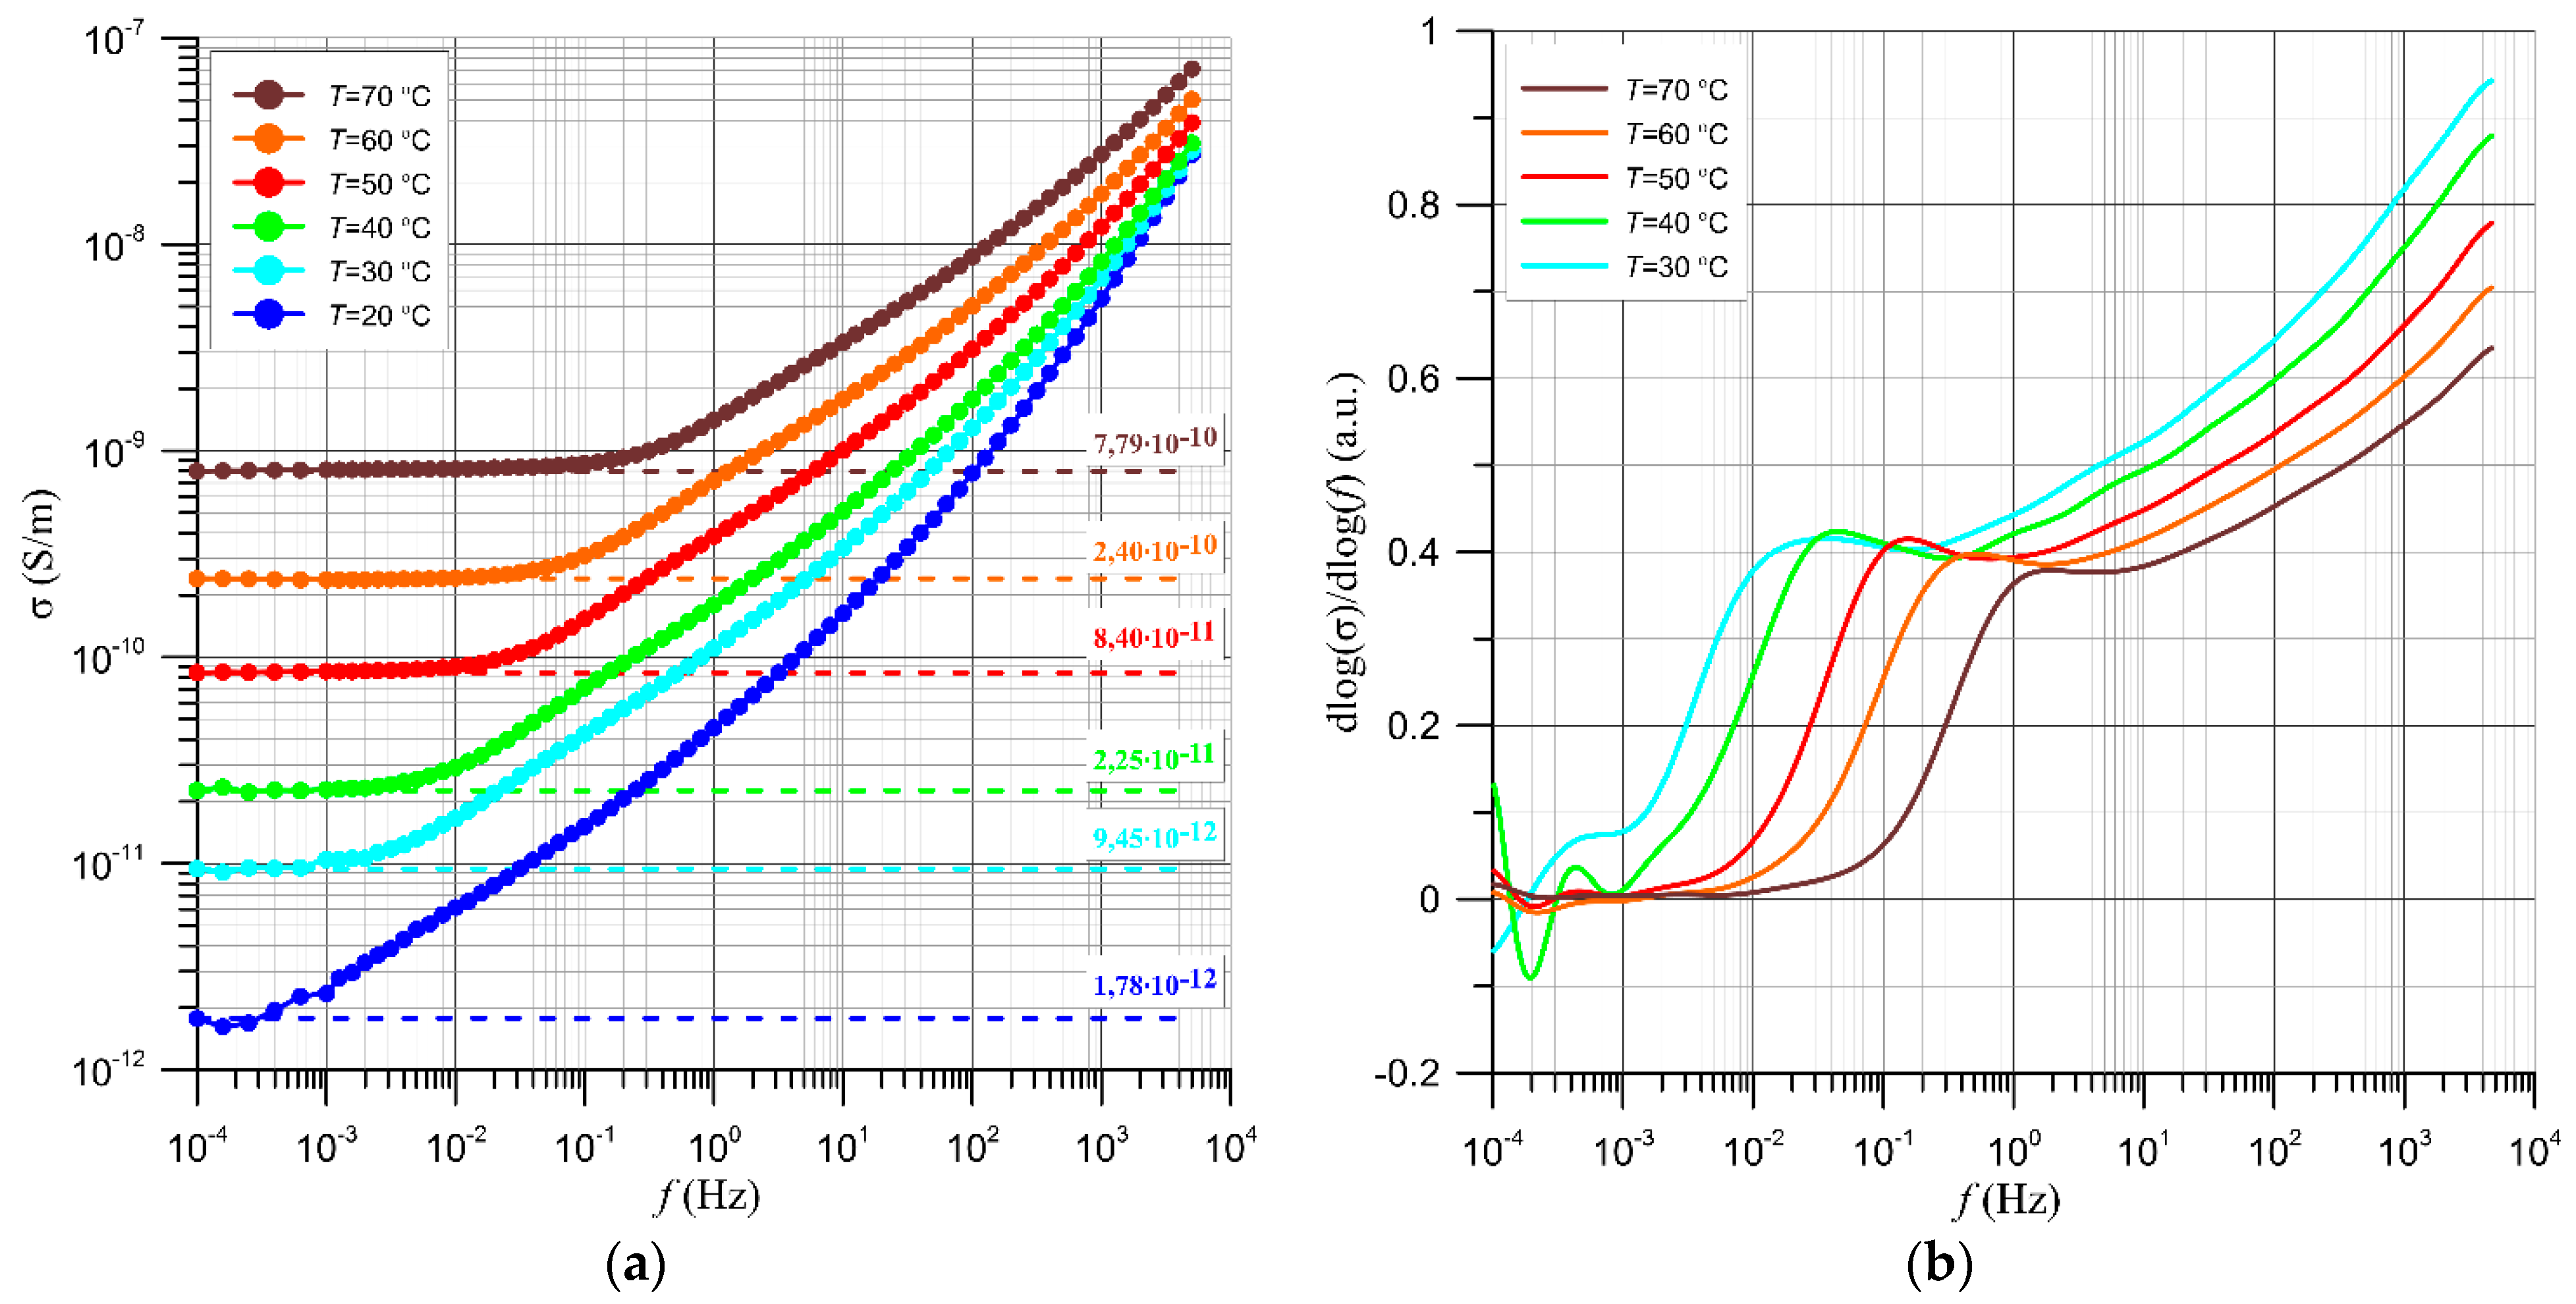
4.2. Results of Studies on AC Conductivity of Nanocomposites and Their Analysis Based on Quantum Mechanical Electron Tunnelling Phenomenon

Figure 7 shows the frequency dependence of the conductivity of the electrical pressboard–NYTRO BIO 300X insulating oil composite with a 5 wt.% moisture content for measurement temperatures in the range 20–70 °C. The figure also represents the DC conductivity values as dashed horizontal lines. Similar waveforms were obtained for composites with moisture contents of 1, 2, 3 and 4 wt.%. The experimental values shown in Figure 7 are compared with the computer simulation results for the model of DC and AC electron tunnelling conductivity of nanocomposites shown in Section 4.1.
The waveforms shown in Figure 7a show that in the low-frequency region, the AC conductivity is equal to the DC conductivity over the entire measurement temperature range. These agree with the calculation in (Equation (28)) and the simulation results in Figure 7a. As the frequency increased, the AC conductivity also started to increase rapidly.
Figure 7b shows the frequency dependence of α(f). The rate of increase in conductivity with increasing frequency is given by Equation (30). Figure 7b distinctly indicates maximum values of approximately 0.02–2 Hz in the frequency region. Their positions depend on the measurement temperature. A shift in the maximum position is associated with the decrease in the expected relaxation time, as defined by the relationship (23).
As the frequency further increased, the value of α(f) reached a minimum and then started to increase rapidly. The comparison between the waveforms in Figure 7b and the simulation results in Figure 6b indicate that two types of tunnelling occur in the composite. The first occurs in the frequency region (less than 5 Hz) corresponding to the maximum value shown in Figure 7b. This type of tunnelling is characterised by the coefficient of determination, R2, because the linear approximation of experimental results is 0.9464. This indicates that the activation energy of the relaxation times of AC conductivity is constant during the first growth stage; its value is ΔEC = 0.923 eV. Figure 8 also shows the values of dielectric permittivity relaxation times due to the presence of water in the composite as obtained by Equation (17). The coefficient of determination for the dielectric relaxation time curve was R2 = 0.997, and the relaxation time activation energy value was ΔED = 0.983 eV. The variation between the two activation energies (approximately 0.037 or 3.7%) is small. This could be due to the inaccuracy in determining the frequency, f1/2 (Equation (17)), because the measurements were performed for 10 frequency values per decade. The equality of the AC conductivity and dielectric permittivity (within the uncertainty limits of their relaxation times and activation energies) based on studies agrees perfectly with the model of the DC and AC conductivities by electron tunnelling. As shown in Figure 5, tunnelling from one neutral well to an adjacent neutral well results in current flow and dipole formation. After the relaxation time (τ), the electric dipoles disappear. However, the value of AC conductivity is also determined by the same value of relaxation time, as given by Equations (27) and (32). The same value of the activation energy of the relaxation times of conductivity and permittivity results from tunnelling in one direction, Figure 5, and tunnelling under the same states of electrons in the potential wells, Figure 5.
It follows from Equation (21) that when T = constant, the DC conductivity depends exponentially on the distance between two potential wells. Water in a composite can exist as single molecules [75] or nanodroplets [42], forming potential wells. The distances among the water molecules are calculated using the following:
r N 1 3 = X ρ 100 u M H 2 O 1 3 ,
where r is the mean distance between potential wells; N is the concentration of water molecules; ρ is the mass density of the impregnated pressboard; MH2O = 18 is the molecular weight of water; u = 1.67 × 10⁻²⁷ kg is the atomic unit of mass and X is the moisture content in percent by weight.
As shown in Figure 9, the dependence of the logarithm of the DC conductivity on the distance between the water molecules σ(r) is derived using Equations (21) and (33) at moisture contents of 1–5 wt.% for each of the measurement temperatures.
Figure 9 shows that the dependence of the conductivity on the distance between water molecules is an exponential function. In [76], it was proven that the observation of an exponential dependence of the conductivity on the distance between the potential wells is a sufficient condition for establishing the presence of electron tunnelling in the material under study. This means that electron tunnelling between water molecules located in the wells of potential occurs in the pressboard–NYTRO BIO 300X insulating oil–moisture composite.
Based on these approximations, the values of the 2/RB coefficients from Equation (21) and those of the coefficient of determination (R2) for different measurement temperatures are obtained, as summarised in Table 1.
Table 1 shows that as the temperature increases, the coefficient of determination R2 becomes progressively closer to unity, which means that the accuracy of determining the 2/RBD ratio from Equation (21) increases. This means that given the R2 values, the most reliable results were obtained for a temperature of 70 °C. Therefore, the value of 2/RBD ≈ 8.4717 will be used in the following analysis. The experimental value of the Bohr radius in this case is RBD ≈ 0.236 nm.
When water molecules are present in the composite, electron tunnelling must occur from the doubly negative-charged oxygen ions. As reported in [77], the Bohr radius for these ions in compounds was determined using X-ray methods. Its value is RBO = 0.135 nm. This means that the Bohr radius (RBO) of the double negative oxygen ion is 1.749 times smaller than the experimental value of RBD. Such a considerable difference occurs possibly because the water in the composite is in the form of nanodrops (each containing n water molecules) and not as single molecules. This causes the distance among the nanodrops to increase to the value given by the following:
r n X ρ 100 u M H 2 O 1 3 = r n 3 ,
where rn is the average distance between nanodroplets, each containing n water molecules; n is the average number of molecules in a nanodrop and r is the average distance among water molecules (Equation (33)).
The ionic radius for chemical compounds in which one of the dominant elements is oxygen was reported in [77]. In the case of the pressboard–NYTRO BIO 300X insulating oil composite with a water content of 5 wt.%, the water nanodrops behave as dopants. Their concentration for an average number of molecules per nanodrop (i.e., approximately 200) [42] is approximately 0.025%; these values characterize, e.g., dopants in semiconductors. To determine the ionization energies of B, P, Sb and other dopants in semiconductors, the analogy between a hydrogen atom in the Bohr model and dopants was used [78]. According to the Bohr model, the electron is in the lowest state with a principal quantum number, n = 1; states with n > 1 are unoccupied. The energy required to move the electron from state n = 1 to state k > 1 is given by the following [57]:
h v n , k = E n E k = e 4 m e 8 ε 0 2 ε r 2 h 2 1 n 2 1 k 2 ,
where me is the electron mass; e is the electron charge; ε0 is the dielectric permittivity of vacuum; εr is the relative dielectric permittivity of the material; h is Planck’s constant; εr = 1 for vacuum and εr > 1 in the dielectric medium.
Ionization occurs in the Bohr model when an electron passes from the state with n = 1 to that with k = ꝏ; the ionization energy of the hydrogen atom is 13.595 eV.
The ionization energy of doped phosphorus atoms in Si is described by the energy state equation (i.e., Equation (35)) of the hydrogen atom [78]. The first ionization energy of the phosphorus atom is E1 = 10.49 eV [79]. The dielectric permittivity of silicon is 12.5 [78]. From Equation (35), the ionization energy of the phosphorus atom in silicon must be 0.067 eV, whereas the experimental value is 0.045 eV [78]. The difference between the two is less than 1.5 times, which is a satisfactory result. The difference in energy values is possibly due, firstly, to the fact that the ionization energy of the phosphorus atom is lower than that of the hydrogen atom by about 22.8%. Secondly, polarization of Si in the vicinity of P atoms slightly differs from that occurring in the lattice of ideal Si atoms owing to their influence on surrounding Si atoms. To harmonize the experimental and calculated results of the ionization energy of phosphorus atom, the permittivity within the atom’s vicinity must be approximately 10.5 (i.e., lower than that of pure silicon, which is about 12, by only 16%).
The first ionization energy of a water molecule is approximately 12.6 eV [80,81,82] and approximates the ionization energy of the hydrogen atom (13.595 eV). The difference between these values is only 7.3% and is three times smaller than the ionization energy of the phosphorus atom.
Such close values of ionization energy indicate that the structure of the energy state of the valence electron of the water molecule is more similar to that of the hydrogen atom than to that of the phosphorus atom. The activation energy of the conductivity by tunnelling from the water molecule located in the potential well can be calculated using the hydrogen-like dopant model in Equation (35). This energy corresponds to the transition from the state with n = 1 to the state k = 2 (Figure 5). By transforming Equation (35) and considering that n = 1 and k = 2, the dielectric permittivity of the composite in which the water molecule is located can be calculated as follows:
ε r = e 2 h ε 0 3 m e 32 Δ E .
By substituting the activation energy of the DC conductivity, ΔE = (1.007 ± 0.020) eV, of the composite into Equation (36), the high-frequency dielectric permittivity in the environment of water molecules (from which and to which the electrons tunnel) can be calculated. The permittivity value of the composite with 5 wt.% water content is εr ≈ 5.76. The experimentally determined values of the static permittivity of the pressboard–NYTRO BIO 300X insulating oil composite with 5 wt.% water content is close to this value (Figure 9), and is approximately 6. The theoretical radius of Bohr’s orbit in the model of the hydrogen-like dopant for a water molecule from which an electron is tunnelling is given by the following [57]:
R B T = ε 0 ε r n 2 h 2 π e 2 m e .
By substituting the constant values and high-frequency permittivity of the composite calculated by Equation (36) into Equation (37), a computational Bohr radius value of RBT ≈ 1.184 nm is obtained. The most reliable experimental ratio 2/RBD ≈ 8.47 nm−1 was obtained at 70 °C (Table 1), and the calculated value is 2/RBT ≈ 1.689 nm−1. Hence,
r n r = n 1 3 = 2 R R D 2 R R T = 5.017 ,
or the average number of molecules per nanodrop is
n = r n r 3 = R B T R B D 3 .
From Equations (38) and (39), the average number of water molecules in a nanodrop in the electrical pressboard–NYTRO BIO 300X insulating oil–moisture composite is n ≈ (126 ± 20). The results of similar tests implemented on an electrical pressboard impregnated with mineral insulating oil are presented in [40]. For this composite, the average number of water molecules in a nanodrop was slightly larger, approximately 200. This is because the NYTRO BIO 300X insulating oil has a viscosity that is approximately twice as low as that of mineral oil [83,84]. Hence, the diffusion of water molecules is facilitated.
In pressboard impregnated with the insulating oil NYTRO BIO 300X, conductivity and polarization occur via the quantum mechanical phenomenon of electron tunnelling between water nanodrops. A similar situation occurs with the impregnation of the pressboard with mineral oil. This means that the conductivity, polarization and dielectric relaxation processes caused by quantum mechanical electron tunnelling phenomena should be taken into account in the software of FDS meters estimating the moisture content of the cellulose component of transformer insulation.

5. Conclusions

In this work, the DC and AC electrical properties (conductivity and permittivity) of a ternary composite of electrical pressboard–bio-oil–water in a water content range of 1 wt.% to 5 wt.% in the temperature range from 20 °C to 70 °C were measured. An environmentally friendly bio-insulating oil, Nynas NYTRO BIO 300X, made from plant raw materials was used to impregnate the pressboard manufactured by Weidman.
The model of DC conductivity of the pressboard–NYTRO BIO 300X bio-insulating oil–moisture composite was found to be based on the conductivity of water containing high concentrations of inorganic salt ions. This observation completely contradicts the experimental results of the activation energy, conductivity, permittivity and dielectric relaxation time of the composite.
The AC conductivity was found to be equal to the DC conductivity over the entire measurement temperature range in the low-frequency region, at which the conductivity maintains a practically constant value. The equilibrium of their activation energies and relaxation times (determined from the studies on AC conductivity and dielectric permittivity) considerably agrees with the model of DC and AC conductivities of nanocomposites by electron tunnelling between two potential wells.
Using the model of conductivity by electron tunnelling, the average number of water molecules in a nanodrops located in the electrical pressboard–NYTRO BIO 300X bio-insulating oil–moisture composite was determined to be n ≈ (126 ± 20).
The conductivity, permittivity and dielectric relaxation were found to be highly accurate when the model of DC and AC conductivities of nanocomposites considering the quantum mechanical phenomenon of electron tunnelling was used.
The mechanism of conductivity, polarization and dielectric relaxation—taking into account the quantum mechanical phenomenon of electron tunnelling between potential wells-nanodrops of water—should be applied to the FDS meter software for analysing the insulation state of power transformers.
Its application will improve the estimation accuracy of the moisture levels in the solid components of the power transformer insulation. This will improve the operational safety of power transformers and minimise the occurrence of their failures and associated environmental pollution. This will serve as a basis for describing the actual physical mechanisms of conductivity and dielectric relaxation occurring in a composite containing bio-oil and thus contribute to improving the reliability determination by increasing the accuracy of estimating the moisture content of the solid components of power transformer insulation from measurements of DC and AC properties.

Author Contributions

Conceptualization, P.Z. and K.K.; methodology, P.Z., K.K., P.R., V.B., M.Z., R.P., M.S., P.M. and T.N.K.; software, K.K., P.R. and M.Z.; validation, P.Z., M.Z. and M.S.; formal analysis, P.Z., K.K., P.R., V.B., M.Z., R.P., M.S., P.M. and T.N.K.; investigation, K.K., P.R., V.B., M.Z. and P.M.; resources, K.K. and T.N.K.; data curation, K.K., P.R., V.B., M.Z., R.P., M.S. and T.N.K.; writing—original draft preparation, P.Z. and K.K.; writing—review and editing, T.N.K.; visualization, K.K. and T.N.K.; supervision, P.Z. and T.N.K.; project administration, T.N.K.; funding acquisition, K.K., P.R., V.B. and T.N.K. All authors have read and agreed to the published version of the manuscript.

Funding

This research was supported from the state budget within the programme of the Ministry of Education and Science entitled ‘Science for Society II’ project no. NdS-II/SP/0173/2024/01 total project value PLN 1,462,590.80.

Data Availability Statement

The original contributions presented in the study are included in the article, further inquiries can be directed to the corresponding author.

Conflicts of Interest

Author Rafal Pajak was employed by the company Nynas AB Raffinaderivagen. Authors Marek Szrot and Pawel Molenda were employed by the company Energo-Complex Sp. z o.o. The remaining authors declare that the research was conducted in the absence of any commercial or financial relationships that could be construed as a potential conflict of interest.

References

  1. Graczkowski, A.; Gielniak, J. Influence of impregnating liquids on dielectric response of impregnated cellulose insulation. In Proceedings of the IEEE International Conference on Solid Dielectrics-ICSD, Potsdam, Germany, 4–9 July 2010; pp. 513–516. [Google Scholar]
  2. Wei, Y.; Han, W.; Li, G.; Liang, X.; Gu, Z.; Hu, K. Aging Characteristics of Transformer Oil-Impregnated Insulation Paper Based on Trap Parameters. Polymers 2021, 13, 1364. [Google Scholar] [CrossRef] [PubMed]
  3. Qi, B.; Dai, Q.; Li, C.; Zeng, Z.; Fu, M.; Zhuo, R. The Mechanism and Diagnosis of Insulation Deterioration Caused by Moisture Ingress into Oil-Impregnated Paper Bushing. Energies 2018, 11, 1496. [Google Scholar] [CrossRef]
  4. Lundgaard, L.E.; Hansen, W.; Linhjell, D.; Painter, T.J. Aging of Oil-Impregnated Paper in Power Transformers. IEEE Trans. Power Deliv. 2004, 19, 230–239. [Google Scholar] [CrossRef]
  5. Oommen, T.V.; Prevost, T.A. Cellulose insulation in oil-filled power transformers: Part II—maintaining insulation integrity and life. IEEE Electr. Insul. Mag. 2006, 22, 5–14. [Google Scholar] [CrossRef]
  6. Fabre, J.; Pichon, A. Deteriorating processes and products of paper in oil application to transformers. In Proceedings of the International Conference on Large High Voltage electric Systems (CIGRE), Paris, France, 15–25 June 1960; p. 137. [Google Scholar]
  7. Liu, J.; Zhang, H.; Geng, C.; Fan, X.; Zhang, Y. Aging assessment model of transformer insulation based on furfural indicator under different oil/pressboard ratios and oil change. IEEE Trans. Dielectr. Electr. Insul. 2021, 28, 1061–1069. [Google Scholar] [CrossRef]
  8. Oommen, T.V. Moisture equilibrium in paper oil systems. In Proceedings of the 16th Electrical/Electronics Insulation Conference, Chicago, IL, USA, 3–6 October 1983; pp. 162–166. [Google Scholar]
  9. Rahman, M.F.; Nirgude, P. Partial discharge behaviour due to irregular-shaped copper particles in transformer oil with a different moisture content of pressboard barrier under uniform field. IET Gener. Transm. Distrib. 2019, 13, 5550–5560. [Google Scholar] [CrossRef]
  10. Hill, J.; Wang, Z.; Liu, Q.; Krause, C.; Wilson, G. Analysing the power transformer temperature limitation for avoidance of bubble formation. High Volt. 2019, 4, 210–216. [Google Scholar] [CrossRef]
  11. Garcia, B.; Villarroel, R.; Garcia, D. A Multiphysical model to study moisture dynamics in transformers. IEEE Trans. Power Deliv. 2019, 34, 1365–1373. [Google Scholar] [CrossRef]
  12. Zhou, J.; Wu, Z.; Zhang, Q.; Zhang, R.; Guo, C.; Guo, W. Effect of Moisture Distribution on Surface Flashover of Oil–Paper Insulation: Fundamental Phenomena, Statistical Behavior. IEEE Trans. Dielectr. Electr. Insul. 2023, 30, 202–209. [Google Scholar] [CrossRef]
  13. Setayeshmehr, A.; Fofana, I.; Eichler, C.; Akbari, A.; Borsi, H.; Gockenbach, E. Dielectric spectroscopic measurements on transformer oil-paper insulation under controlled laboratory conditions. IEEE Trans. Dielectr. Electr. Insul. 2008, 15, 1100–1111. [Google Scholar] [CrossRef]
  14. Koch, M.; Prevost, T. Analysis of dielectric response measurements for condition assessment of oil-paper transformer insulation. IEEE Trans. Dielectr. Electr. Insul. 2012, 19, 1908–1915. [Google Scholar] [CrossRef]
  15. Blennow, J.; Ekanayake, C.; Walczak, K.; García, B.; Gubanski, S.M. Field experiences with measurements of dielectric response in frequency domain for power transformer diagnostics. IEEE Trans. Power Deliv. 2006, 21, 681–688. [Google Scholar] [CrossRef]
  16. Adekunle, A.A.; Oparanti, S.O.; Hamzat, A.; Abdelmalik, A.A. Dielectric response of vegetable oil-based nanofluid and impregnated Kraft paper for high voltage transformer insulation. J. Mol. Liq. 2023, 391, 123391. [Google Scholar] [CrossRef]
  17. Martínez, M.; Pleite, J. Improvement of RVM test interpretation using a Debye equivalent circuit. Energies 2020, 13, 323. [Google Scholar] [CrossRef]
  18. Islam, M.M.; Lee, G.; Hettiwatte, S.N. A review of condition monitoring techniques and diagnostic tests for lifetime estimation of power transformers. Electr. Eng. 2018, 100, 581–605. [Google Scholar] [CrossRef]
  19. Fofana, I.; Hadjadj, Y. Electrical-Based Diagnostic Techniques for Assessing Insulation Condition in Aged Transformers. Energies 2016, 9, 679. [Google Scholar] [CrossRef]
  20. Sarkar, S.; Sharma, T.; Baral, A.; Chatterjee, B.; Dey, D.; Chakravorti, S. An expert system approach for transformer insulation diagnosis combining conventional diagnostic tests and PDC, RVM data. IEEE Trans. Dielectr. Electr. Insul. 2014, 21, 882–891. [Google Scholar] [CrossRef]
  21. Zheng, H.; Liu, J.; Zhang, Y.; Ma, Y.; Shen, Y.; Zhen, X.; Chen, Z. Effectiveness analysis and temperature effect mechanism on chemical and electrical-based transformer insulation diagnostic parameters obtained from PDC data. Energies 2018, 11, 146. [Google Scholar] [CrossRef]
  22. Mishra, D.; Haque, N.; Baral, A.; Chakravorti, S. Assessment of interfacial charge accumulation in oil-paper interface in transformer insulation from polarization-depolarization current measurements. IEEE Trans. Dielectr. Electr. Insul. 2017, 24, 1665–1673. [Google Scholar] [CrossRef]
  23. Zhang, Y.; Liu, J.; Zheng, H.; Wang, K. Feasibility of a universal approach for temperature correction in frequency domain spectroscopy of transformer insulation. IEEE Trans. Dielectr. Electr. Insul. 2018, 25, 1766–1773. [Google Scholar] [CrossRef]
  24. Liu, J.; Fan, X.; Zhang, Y.; Zhang, C.; Wang, Z. Aging evaluation and moisture prediction of oil-immersed cellulose insulation in field transformer using frequency domain spectroscopy and aging kinetics model. Cellulose 2020, 27, 7175–7189. [Google Scholar] [CrossRef]
  25. Yang, L.; Chen, J.; Gao, J.; Zheng, H.; Li, Y. Accelerating frequency domain dielectric spectroscopy measurements on insulation of transformers through system identification. IET Sci. Meas. Technol. 2018, 12, 247–254. [Google Scholar] [CrossRef]
  26. Zhang, T.; Shi, G.; Zhang, N.; Wu, Q.; Zhang, P.; Liu, H.; Liu, Z. Study on temperature normalization of frequency-domain dielectric spectroscopy of oil–paper insulation. Electr. Eng. 2024. [Google Scholar] [CrossRef]
  27. Zhang, M.Z.; Yu, M.H.; Zhou, W.; Liang, Y.L.; Lei, S.J.; Shi, Y.B.; Qu, L.M. Research on the variation of dielectric properties of oil-paper insulation for power equipment over a wide temperature range. High Volt. 2024. [Google Scholar] [CrossRef]
  28. Ekanayake, C.; Gubanski, S.M.; Graczkowski, A.; Walczak, K. Frequency Response of Oil Impregnated Pressboard and Paper Samples for Estimating Moisture in Transformer Insulation. IEEE Trans. Power Deliv. 2006, 21, 1309–1317. [Google Scholar] [CrossRef]
  29. Zukowski, P.; Rogalski, P.; Koltunowicz, T.N.; Kierczynski, K.; Bondariev, V. Precise measurements of the temperature-frequency dependence of the conductivity of cellulose—insulating oil—water nanoparticles composite. Energies 2020, 14, 32. [Google Scholar] [CrossRef]
  30. Zukowski, P.; Kierczynski, K.; Koltunowicz, T.N.; Rogalski, P.; Subocz, J.; Korenciak, D. AC conductivity measurements of liquid-solid insulation of power transformers with high water content. Measurement 2020, 165, 108194. [Google Scholar] [CrossRef]
  31. Kołtunowicz, T.N.; Kierczynski, K.; Okal, P.; Patryn, A.; Gutten, M. Diagnostics on the Basis of the Frequency-Temperature Dependences of the Loss Angle Tangent of Heavily Moistured Oil-Impregnated Pressboard. Energies 2022, 15, 2924. [Google Scholar] [CrossRef]
  32. Zukowski, P.; Rogalski, P.; Bondariev, V.; Sebok, M. Diagnostics of High Water Content Paper-Oil Transformer Insulation Based on the Temperature and Frequency Dependencies of the Loss Tangent. Energies 2022, 15, 2813. [Google Scholar] [CrossRef]
  33. Yuan, H.; Li, Y.; Zhou, K.; Zhou, H. Moisture Transfer Characteristics in Silicone Oil–Silicone Rubber Insulation System Considering Swelling Effect. IEEE Trans. Dielectr. Electr. Insul. 2023, 30, 2025–2032. [Google Scholar] [CrossRef]
  34. RVM 5462—Advanced Automatic Recovery Voltage Meter for Diagnosis of Oil Paper Insulation, HAEFELY (n.d.). Available online: http://mldt.pl/files/rvm.PDF (accessed on 20 March 2024).
  35. Jonscher, A.K. Dielectric Relaxation in Solids; Chelsea Dielectrics Pres: London, UK, 1983. [Google Scholar]
  36. Cole, K.S.; Cole, R.H. Dispersion and Absorption in Dielectrics II. Direct Current Characteristics. J. Chem. Phys. 1942, 10, 98–105. [Google Scholar] [CrossRef]
  37. Cole, K.S.; Cole, R.H. Dispersion and Absorption in Dielectrics I. Alternating Current Characteristics. J. Chem. Phys. 1941, 9, 341–351. [Google Scholar] [CrossRef]
  38. Davidson, D.W.; Cole, R.H. Dielectric relaxation in glycerol, propylene glycol, and n-propanol. J. Chem. Phys. 1951, 19, 1484–1490. [Google Scholar] [CrossRef]
  39. Davidson, D.W. Dielectric relaxation in liquids: I. The representation of relaxation behavior. Can. J. Chem. 1961, 39, 571–594. [Google Scholar] [CrossRef]
  40. Havriliak, S.J.; Havriliak, S.J. Dielectric and Mechanical Relaxation in Materials. Analysis, Interpretation and Application to Polymers; Hanser Publisher: Munich, Germany, 1997. [Google Scholar]
  41. Zukowski, P.; Kołtunowicz, T.N.; Kierczyński, K.; Subocz, J.; Szrot, M.; Gutten, M. Assessment of water content in an impregnated pressboard based on DC conductivity measurements theoretical assumptions. IEEE Trans. Dielectr. Electr. Insul. 2014, 21, 1268–1275. [Google Scholar] [CrossRef]
  42. Żukowski, P.; Kierczyński, K.; Kołtunowicz, T.N.; Rogalski, P.; Subocz, J. Application of elements of quantum mechanics in analysing AC conductivity and determining the dimensions of water nanodrops in the composite of cellulose and mineral oil. Cellulose 2019, 26, 2969–2985. [Google Scholar] [CrossRef]
  43. Zukowski, P.W.; Rodzik, A.; Shostak, Y.A.A. Dielectric constant and ac conductivity of semi-insulating Cd1-xMnxTe semiconductors. Semiconductors 1997, 31, 610–614. [Google Scholar] [CrossRef]
  44. Kosmulski, M. There are no nanodroplets of water in wet oil-impregnated pressboard. Cellulose 2021, 28, 5991–5992. [Google Scholar] [CrossRef]
  45. Fernández, I.; Ortiz, A.; Delgado, F.; Renedo, C.; Pérez, S. Comparative evaluation of alternative fluids for power transformers. Electr. Power Syst. Res. 2013, 98, 58–69. [Google Scholar] [CrossRef]
  46. MIDEL 7131. Increased Fire Safety; MIDEL: Manchester, UK, 2016. [Google Scholar]
  47. Liu, Q.; Wang, Z. Streamer characteristic and breakdown in synthetic and natural ester transformer liquids with pressboard interface under lightning impulse voltage. IEEE Trans. Dielectr. Electr. Insul. 2011, 18, 1908–1917. [Google Scholar] [CrossRef]
  48. Wolmarans, C.P.; Abrahams, R.; Pahlavanpour, B. Biodegradable electroinsulating fluids based on low viscosity hydrocarbons. Energetyka 2021, 9, 649–652. [Google Scholar]
  49. NYTRO® BIO 300X–The new bio-based alternative from Nynas. Transform. Technol. Mag. 2020, 46–51. Available online: https://www.powersystems.technology/community-hub/in-focus/nytro-bio-300x-the-new-bio-based-alternative-from-nynas.html (accessed on 22 March 2024).
  50. Fofana, I.; Hemmatjou, H.; Meghnefi, F.; Farzaneh, M.; Setayeshmehr, A.; Borsi, H.; Gockenbach, E. On the frequency domain dielectric response of oil-paper insulation at low temperatures. IEEE Trans. Dielectr. Electr. Insul. 2010, 17, 799–807. [Google Scholar] [CrossRef]
  51. Walczak, K.; Graczkowski, A.; Gielniak, J.; Morańda, H.; Mościcka-Grzesiak, H.; Ekanayake, C.; Gubański, S. Dielectric frequency response of cellulose samples with various degree of moisture content and aging. Prz. Elektrotechniczny 2006, 1, 264–267. [Google Scholar]
  52. Rouabeh, J.; M’barki, L.; Hammami, A.; Jallouli, I.; Driss, A. Studies of different types of insulating oils and their mixtures as an alternative to mineral oil for cooling power transformers. Heliyon 2019, 5, e01159. [Google Scholar] [CrossRef] [PubMed]
  53. Zukowski, P.; Rogalski, P.; Koltunowicz, T.N.; Kierczynski, K.; Subocz, J.; Sebok, M. Influence of temperature on phase shift angle and admittance of moistened composite of cellulose and insulating oil. Measurement 2021, 185, 110041. [Google Scholar] [CrossRef]
  54. Zukowski, P.; Rogalski, P.; Koltunowicz, T.N.; Kierczynski, K.; Subocz, J.; Zenker, M. Cellulose Ester Insulation of Power Transformers: Researching the Influence of Moisture on the Phase Shift Angle and Admittance. Energies 2020, 13, 5511. [Google Scholar] [CrossRef]
  55. Landau, L.D.; Lifshitz, E.M.; Pitaevskii, L.P. Electrodynamics of Continuous Media; Butterworth-Heinemann: Oxford, UK, 1984. [Google Scholar]
  56. DIRANA PTM User Manual ENU; Omicron Electronics Gmbh: Wien, Austria, 2017; Available online: https://www.scribd.com/document/469939247/DIRANA-PTM-User-Manual-ENU (accessed on 20 March 2024).
  57. Halliday, D.; Resnick, R. Physics, Part II; John Wiley & Sons: New York, NY, USA, 1978. [Google Scholar]
  58. Smirnov, S.A.; Shutov, D.A.; Bobkova, E.S.; Rybkin, V.V. Chemical Composition, Physical Properties and Populating Mechanism of Some O(I) States for a DC Discharge in Oxygen with Water Cathode. Plasma Chem. Plasma Process. 2016, 36, 415–436. [Google Scholar] [CrossRef]
  59. ASTM D1125-95 2005; Standard Test Methods for Electrical Conductivity and Resistivity of Water. ASTM International: West Conshohocken, PA, USA, 2016.
  60. Light, T.S.; Licht, S.; Bevilacqua, A.C.; Morash, K.R. The fundamental conductivity and resistivity of water. Electrochem. Solid-State Lett. 2005, 8, E16. [Google Scholar] [CrossRef]
  61. Kendall, J. The specific conductivity of pure water in equilibrium with atmospheric carbon dioxide. J. Am. Chem. Soc. 2002, 38, 1480–1497. [Google Scholar] [CrossRef]
  62. Rodger, J.W. The electric conductivity of pure water. Nature 1894, 51, 42–43. [Google Scholar] [CrossRef]
  63. Wang, Q.; Cha, C.S.; Lu, J.; Zhuang, L. Ionic Conductivity of Pure Water in Charged Porous Matrix. ChemPhysChem 2012, 13, 514–519. [Google Scholar] [CrossRef]
  64. Melnik, L.A.; Krysenko, D.A. Ultrapure Water: Properties, Production, and Use. J. Water Chem. Technol. 2019, 41, 143–150. [Google Scholar] [CrossRef]
  65. Stillinger, F.H. Proton Transfer Reactions and Kinetics in Water. Theor. Chem. 1978, 3, 177–234. [Google Scholar]
  66. Mott, N.F.; Gurney, R.W. Electronic Processes in Ionic Crystals; Clarendon Press: Oxford, UK, 1950. [Google Scholar]
  67. Chelkowski, A. Fizyka Dielektryków; Panstwowe Wydawnictwo Naukowe: Warszawa, Poland, 1979. (In Polish) [Google Scholar]
  68. Mott, N.F.; Davis, E.A. Electronic Processes in Non-Crystalline Materials, 2nd ed.; Clarendon Press: Oxford, UK; New York, NY, USA, 1979. [Google Scholar]
  69. Stuke, J.; Brenig, W. Amorphous and liquid semiconductors. In Proceedings of the International Conference on Amorphous and Liquid Semiconductors, Garmisch-Partenkirchen, Germany, 3–8 September 1973; Taylor & Francis: Garmisch-Partenkirchen, Germany, 1974; pp. 183–191. [Google Scholar]
  70. Ravich, Y.I.; Nemov, S.A. Hopping conduction via strongly localized impurity states of indium in PbTe and its solid solutions. Semiconductors 2002, 36, 1–20. [Google Scholar] [CrossRef]
  71. Żukowski, P.; Kołtunowicz, T.; Partyka, J.; Węgierek, P.; Komarov, F.F.; Mironov, A.M.; Butkievith, N.; Freik, D. Dielectric properties and model of hopping conductivity of GaAs irradiated by H+ ions. Vacuum 2007, 81, 1137–1140. [Google Scholar] [CrossRef]
  72. Koltunowicz, T.N.; Zukowski, P.; Bondariev, V.; Czarnacka, K.; Boiko, O.; Fedotova, J.A.; Kasiuk, J.V. Study of dielectric function of (FeCoZr)x(CaF2)(100−x) nanocomposites produced with a beam of argon ions. J. Alloys Compd. 2015, 650, 262–267. [Google Scholar] [CrossRef]
  73. Żukowski, P.; Gałaszkiewicz, P.; Bondariev, V.; Okal, P.; Pogrebnjak, A.; Kupchishin, A.; Ruban, A.; Pogorielov, M.; Kołtunowicz, T.N. Comparative measurements and analysis of the electrical properties of nanocomposites TixZr1-xC+α-Cy (0.0 ≤ x ≤ 1.0). Materials 2022, 15, 7908. [Google Scholar] [CrossRef] [PubMed]
  74. Moyal, J.E. Theory of ionization fluctuations. Philos. Mag. 1955, 46, 263–280. [Google Scholar] [CrossRef]
  75. Landau, L.D.; Lifshitz, E.M. Quantum Mechanics (Third Edition, Revised and Enlarged); Pergamon Press: Oxford, UK, 1977; Available online: http://triton.itep.ru/ions/Physics/ALICE/Landau/LANDAULIFSHITZVOL.3QUANTUMMECHANICSNON-RELATIVISTICTHEORY_English.pdf (accessed on 20 March 2024).
  76. Shklovskii, B.I.; Efros, A.L. Electronic Properties of Doped Semiconductors; Springer: Berlin/Heidelberg, Germany, 1984. [Google Scholar]
  77. Van Vlack, L.H. Materials Science for Engineers; Addison-Wesley Publishing Company: Boston, MA, USA, 1970. [Google Scholar]
  78. Milnes, A.G.; Arthur, G. Deep Impurities in Semiconductors; Wiley: New York, NY, USA, 1973. [Google Scholar]
  79. Granovsky, V.V.L.; Musin, A.K.; Golubev, V.S.; Solnsev, G.S. Electric Current in Gas. Steady-State Current; Science: Moscow, Russia, 1971. [Google Scholar]
  80. Linstrom, P.J.; Mallard, W.G. NIST Chemistry Webbook, NIST Standard Reference Database Number 69, Volume 20899; National Institute of Standards and Technology: Gaithersburg, MD, USA, 1998. [Google Scholar]
  81. Zavilopulo, A.N.; Chipev, F.F.; Shpenik, O.B. Ionization of Nitrogen, Oxygen, Water, and Carbon Dioxide Molecules by Near-Threshold Electron Impact. Tech. Phys. 2005, 50, 402. [Google Scholar] [CrossRef]
  82. Kovtun, Y.V. Mean energy of water molecule ionization by electron impact. Tech. Phys. 2015, 60, 1110–1118. [Google Scholar] [CrossRef]
  83. Wolmarans, C.P.; Fairholm, R. A New Sustainable, Readily Biodegradable and High-Performance Insulating Liquid for Power Transformers. In Proceedings of the 26th International Conference and Exhibition on Electricity Distribution—CIRED 2021, Online Conference, 20–23 September 2021. [Google Scholar] [CrossRef]
  84. Wolmarans, C.; Gamil, A.; Al-Abadi, A.; Milone, M.; Jornaan, J.; Hellberg, R. Type Testing of 80 MVA Power Transformer with a new Bio-based, Biodegradable and Low Viscosity Insulating liquid. In Proceedings of the Conference: CIGRE Session, Paris, France, 28 August–2 September 2022; Volume A2–PS2, p. 11125. [Google Scholar]
Figure 1. Time dependence of DC intensity of sample impregnated with NYTRO BIO 300X insulating oil with moisture contents of (a) 1.0 and (b) 5 wt.%. At 5 wt.% water content, measuring temperatures are 1: 20 °C; 2: 30 °C; 3: 40 °C; 4: 50 °C; 5: 60 °C; and 6: 70 °C.
Energies 17 01952 g001
Figure 2. Arrhenius diagrams for samples impregnated with NYTRO BIO 300X insulating oil with moisture contents of (a) 1.0 and (b) 5 wt.%.
Energies 17 01952 g002
Figure 3. Arrhenius plots for 1: UPW; 2: UPW with dissolved 1 mg/L NaCl salt; 3: ion concentration in UPW. Compiled based on data presented in [59,65].
Energies 17 01952 g003
Figure 4. Frequency dependence of composite permittivity for various moisture contents; 1: 5 wt.%; 2: 1 wt.%; 3: difference between 1 and 5 wt.%.
Energies 17 01952 g004
Figure 5. Potential wells [73]: A represents excitation of the electron from the highest occupied state to the lowest unoccupied state; 1 is tunnelling of the electron from the left well to the middle well; 2 is tunnelling from the middle well to the right well; 3 is return tunnelling from the middle well to the left well; ∆E is distance between occupied and unoccupied states or activation energy of tunnelling and r is distance between wells of potential.
Energies 17 01952 g005
Figure 6. Dependences of conductivity (a) and frequency factor α (b) as function of product of frequency value f and time τm for materials with hopping-like charge exchange. Computer simulation for p; 1: 0.01; 2: 0.001; 3: 0.0001.
Energies 17 01952 g006
Figure 7. Frequency dependence of conductivity (a) and coefficient α(f) (b) of composite of electrical pressboard–NYTRO BIO 300X insulating oil with 5 wt.% moisture content at measurement temperatures ranging from 20 to 70 °C. Horizontal dashed lines represent DC conductivity values—(a).
Energies 17 01952 g007
Figure 8. Arrhenius plot for relaxation times of conductivity in first stage (1) and dielectric permittivity due to presence of water for electrical pressboard–NYTRO BIO 300X insulating oil–moisture component with 5 wt.% water content (2).
Energies 17 01952 g008
Figure 9. Experimental dependence of DC conductivity of pressboard–NYTRO BIO 300X insulating oil composite with water contents ranging from 1 wt.% to 5 wt.% with distance among water molecules at obtained at measurement temperatures of 1: 20 °C; 2: 30 °C; 3: 40 °C; 4: 50 °C; 5: 60 °C and 6: 70 °C.
Energies 17 01952 g009
Table 1. Values of coefficient 2/RBD from Equation (21), coefficient of determination (R2) at measurement temperatures from 20 to 70 °C.
TK, K2/RBD, nm−1R2
293.157.36410.869
303.157.93240.861
313.157.60940.902
323.157.81580.928
333.158.07080.952
343.158.47170.953
Average7.880.911
Deviation0.3490.0366
Disclaimer/Publisher’s Note: The statements, opinions and data contained in all publications are solely those of the individual author(s) and contributor(s) and not of MDPI and/or the editor(s). MDPI and/or the editor(s) disclaim responsibility for any injury to people or property resulting from any ideas, methods, instructions or products referred to in the content.

