
Controllable Meshing of Distribution Grids through a Multi-Leg Smart Charging Infrastructure (MLSCI)


Department of Industrial Engineering, University of Padova, Via Giovanni Gradenigo 6/A, 35131 Padua, Italy
*
Author to whom correspondence should be addressed.
Energies 2024, 17(8), 1960; https://doi.org/10.3390/en17081960
Submission received: 25 March 2024
/
Revised: 9 April 2024
/
Accepted: 18 April 2024
/
Published: 20 April 2024
(This article belongs to the Special Issue Modeling, Optimization, and Control in Smart Grids)
Abstract
:The paper provides a novel approach for controllably meshing traditional medium-voltage networks by means of a fast-charging parking station with multiple points of delivery connected to different radial feeders. Regulating power flows at each point of delivery while the charging service is being provided, which means actively controlling power exchanges between radial distribution feeders can significantly increase the hosting capacity of the power system. Remarkable benefits are expected when the distribution networks to which the charging infrastructure is connected differ in terms of main characteristics, e.g., rated voltage level, end-user type and operating profiles, and the number and type of renewable plants. The paper focuses on technical targets, such as loss reduction and power quality in terms of admitted voltage deviation from the rated value. The power exchanges between distribution feeders are made possible by a controlled DC link, where bi-directional DC/DC converters are connected so as to charge or discharge vehicles according to the Vehicle-To-Grid approach. A multiplexer topology in which several vehicles can be alternatively connected to the same DC/DC converter is modeled. The proposed concept can contribute to network flexibility by controllably meshing distribution feeders and, jointly, by modulating charging processes according to assigned charging constraints.
1. Introduction
Fast-charging stations are required to reduce range anxiety and narrow the gap between Electric Vehicles (EVs) and traditional thermal ones, which have the advantage of refueling in a few minutes [1]. In general, vehicles can be recharged with an AC or DC supply [2]. However, the AC supply is limited by the rated power of the vehicle’s on-board charger according to cost, weight, and volume constraints [3]. To overcome this limitation, high-power DC charging stations, where the AC/DC power converter is located outside the vehicle, are spreading rapidly. This could increase the impact of charging stations on the network, particularly in urban areas, if the charging process is required immediately at maximum power to limit the time the EV is connected to the charging infrastructure. As far as the distribution network is concerned, the presence of DC charging stations causes short-duration power peaks, particularly when EVs are connected during high-demand hours (e.g., the evening in urban areas) according to citizens’ typical habits [4]. The consequential increase in line currents involves the deterioration of voltage profiles, possible branch congestion, network reliability issues, and higher distribution losses [5,6].
By adopting a proper control logic [7], EVs could increase the performance, efficiency, and power quality of the electrical system during the recharging process. Vehicles could operate as controlled loads by managing the charging profile according to the permitted recharging time duration (mode Grid-To-Vehicle, G2V, [8]). Additionally, EVs could feed power to the utility grid by discharging their batteries following a Vehicle-To-Grid (V2G) approach [9]. The Vehicle-To-Vehicle (V2V) mode is another alternative, where EVs connected to the same charging station can share the energy stored in their batteries [10,11]. Implementing such approaches requires an appropriate infrastructure, which, in the V2G and the V2V modes, is required to manage bi-directional power exchanges between the charging station and EVs [3,12]. The common structure of a DC off-board charger is composed of an AC/DC converter and a series-connected DC/DC converter to control the charging voltage and current [6]. For a fast-charging station with several charging sockets, there are economic advantages in sharing the DC link between DC/DC chargers while using a limited number of AC/DC converters. This could increase both the overall efficiency of the station and the flexibility of the system [13,14].
In the method proposed in this paper, AC/DC converters are connected to different radial distribution feeders through dedicated points of delivery (PODs) to create the Multi-Leg Smart Charging Infrastructure (MLSCI) as depicted in Figure 1.
The application of this architecture seems feasible, especially in urban contexts, where several distribution lines (e.g., supplied by different primary substations) may converge close to the same point. Considering the charging constraints, the proposed scheme makes it possible to accurately regulate the active power exchanged between medium-voltage (MV) feeders which are usually independent from the others, since they are radially operated [15]. Additionally, the MLSCI has the ability to independently regulate reactive power exchanges at each POD. Distribution System Operators (DSOs) would consequently be able to operate networks as controllably meshed (which is not easily achieved with traditional meshing), and, therefore, the MLSCI could be a resource to both mitigate line congestion and support network voltage regulation [16]. Since at least one AC/DC converter is interposed between the PODs, no relevant variations in network short circuit currents are expected, requiring no special adaptations to the existing protection systems, which would preserve the same operational effectiveness.
The proposed approach can subsequently supply several vehicles downstream from the same DC/DC charger, as better described and modeled in the following section. Disconnectors added along the DC connections between DC/DC chargers and vehicles avoid the parallel connection of vehicle batteries. With this scheme, each EV can remain connected to the charging socket for longer, with the following benefits for both end users and network regulation:
- From the end-user perspective, EVs are no longer required to be immediately disconnected once the charging process is concluded (with logistic benefits and increased comfort for vehicle users);
- From the charging infrastructure point of view, additional sockets do not imply an associated cost increase, and this approach can coordinately manage the charging process of the entire park within the considered time window.
The paper aims to develop a complete model of the MLSCI, to implement the control strategies on a daily basis, and to demonstrate the advantages of the proposed architecture with respect to a traditional approach with single POD. Network operative constraints, EV requirements, conversion efficiencies, and battery charging/discharging efficiencies are considered. Section 2 details the peculiar characteristics of the novel MLSCI scheme, and Section 3 explains the constraints involved and defines the optimization function. Section 4 introduces a case study, and achieved results are presented and discussed in Section 5. The main conclusions are summarized in Section 6.
2. Charging Infrastructure
The developed MLSCI has two peculiar characteristics: it is connected to several PODs and takes advantage of the concept of the Single-Charger, Multiple-Socket (SCMS) [17] scheme to increase the number of parking places equipped with charging sockets without linearly increasing the number of DC chargers. Figure 1 shows the layout of the charging infrastructure. It is made up of the following components:
- MV PODs and corresponding bi-directional AC/DC inverters;
- EV fast chargers (DC/DC converters);
- sockets for the fast charger;
- The overall number of fast-charging sockets is thus equal to .
Each charging outlet has a corresponding disconnector to avoid any uncontrolled power exchange between EVs simultaneously connected to sockets downstream from the same DC/DC converter. Consequently, the V2V mode can be applied only between different DC/DC converters in a controlled manner. Considering that costs related to a DC fast charger seem to be mainly related to converters, increasing the number of cables and disconnectors pertaining to a DC charger is expected to have a minor impact on the final cost. Compared to a traditional charging station where the number of DC chargers is equal to the number of parking places, this approach leads to an increase in the utilization factor of each DC/DC converter, reducing the amount of time that converters are unused or are operating at partial load [18]. At the same time, end-user comfort in using the charging infrastructure is enhanced, since connected EVs do not have to be immediately removed when their charging process ends (currently, leaving the EV connected when it reaches the fully charged status usually involves a cost for users).
The SCMS approach requires a coordinated charging procedure because only one vehicle connected to the charger can exchange power at the same time, i.e., at most one disconnector for each DC/DC converter is closed at a time. The optimization algorithm defines the closed disconnectors automatically. Since DC/DC converters actively control power exchanges with EVs, the opening and closing of disconnectors are no-load operations, so specific breaking capacity seems unnecessary.
On the AC side, the shared DC bus is interfaced with the PODs by using at least converters. When POD power increases or redundancies are required, multiple parallel-connected AC/DC converters could be considered for each POD. The internal current control loop installed in AC/DC converters is generally able to rapidly limit the flowing current to preserve the reliability of power electronic components, resulting in fast limitation of short circuit current flowing between different distribution feeders. Taking advantage of this, the MLSCI is not expected to remarkably alter the network’s short circuit levels, with negligible impacts on the effectiveness of network protections.
The AC/DC converters are series-connected with step-down transformers, at least one for each POD. Transformers adapt the network voltage level to the rated voltage of AC/DC converters so that the MLSCI can be connected to feeders operating at different voltage levels. Additionally, transformers provide the galvanic insulation between the DC section of the charging infrastructure and each distribution feeder. In the proposed scheme, both AC/DC converters and DC/DC converters are considered bi-directional. Consequently, the MLSCI can operate in G2V, V2G, and V2V mode and can regulate both the active power flow between distribution feeders and the reactive power exchanges independently at each POD.
3. Model Definition
The main goal of the proposed algorithm is to reduce network losses in the MV feeders connected to the MLSCI, while modeling as problem constraints the following: (i) the resolution of network congestion, (ii) the permitted network voltage deviation, (iii) the charging requirements in terms of final State Of Charge (SOC) for connected EVs, and (iv) the rated power of MLSCI components.
The optimization problem is structured into four groups of constraints as summarized in Figure 2. Two main blocks (black dotted lines) are defined: the charging infrastructure block and the distribution network block. The first includes three groups representing constraints on EVs, on chargers (DC/DC converters), and on inverters (AC/DC converters). In the latter block, all the network constraints are included in the Optimal Power Flow (OPF) problem.
Additional sets of constraints, called linking constraints, are required to coordinate adjacent groups of constraints in the first block, whereas boundary constraints allow the charging infrastructure to correctly interface with PODs. The following subsections describe in detail each group of constraints depicted in Figure 2. Please note that, without any specification, the following constraints are intended to be set for each time step of the simulation.
3.1. EV Constraints
Both the V2G and the V2V modes are considered in the proposed MLSCI; thus, EVs can be charged or discharged. For the socket of the DC/DC converter, Figure 3 shows the meaning of both the charging power , and the discharging power, . The block CHECK is introduced to avoid the simultaneous connection of more EVs downstream from the same DC/DC converter. Both quantities and are positive and constrained within zero and the rated power of the corresponding EV, , as represented in (1) and (2). The binary variables, and , are added to (1) and (2) and constrained in (3) to prevent the possibility of the charge power and the discharge power being simultaneously different from zero at the same time for the same vehicle.
The last set of expressions reported in this subsection is required to model each battery and introduces the power–energy relation. In detail, the energy stored in each vehicle is related to its charging/discharging power. It is assumed that the power exchange between the DC/DC converter and the EV is constant during the time step, . Relation (4) computes , which is the energy stored in the EV battery at the end of the time step as a consequence of the charging or discharging power in the time interval and considering the amount computed in the previous time step as the initial value. The battery round-trip efficiency is represented, decreasing the charged energy by the charging efficiency, , and increasing the discharged energy by the inverse of the discharging efficiency, . To preserve the generality of the approach, the charging efficiency and discharging efficiency may differ.
The SOC of each EV battery, defined as the ratio between and the corresponding battery rated energy , must remain constrained between a minimum value, , and a maximum value, , as represented in (5), to prevent accelerated aging or damage of batteries. Other technical constraints define the conditions of the EV batteries before and after the time periods when they are connected to the MLSCI. For a generic vehicle, equality (6) sets the energy stored in the battery at the time the EV is connected to the charging infrastructure (time ), computed as the initial SOC, , multiplied by . Equation (7) imposes the charging target (generally chosen by the EV owner) in terms of stored energy when the EV is disconnected from the MLSCI socket (time ), computed as the target SOC, , multiplied by . Conditions and must be verified.
3.2. Charger Constraints
Constraints related to chargers compose the second group of MLSCI constraints. The first four relations deal with the powers that flow through each charger, represented in Figure 4. The last three relations represent the set of linking constraints needed to connect EVs to chargers. Firstly, for the DC/DC converter, inequalities (8) and (9) ensure that the power flowing from or to EVs ( and ) is lower than the rated power of the DC/DC converter, . In general, these constraints are required as the nominal EV charging power might be greater than the rated power of the converter.
Relations (10) and (11) take into account the efficiency of the converters in obtaining and , which are the powers absorbed and injected into the DC bus, respectively. Equations (12) and (13) link the charging and discharging powers of each converter with the powers of downstream connected EVs. Inequality (14) imposes that only one vehicle per charger can exchange power during each . This is the typical constraint of a SCMS approach and represents the CHECK box in Figure 3. Relation (14) constrains the binary values, , and the binary values, , (defined in Section 3.1) associated with the sockets connected to the charger, so that only one can be other than zero.
3.3. Inverter Constraints
The following constraints model the inverters that connect the DC bus of the MLSCI to the corresponding PODs. The sign convention for powers exchanged by inverters is described in Figure 5. The AC side of the converter is characterized by a circular-shaped capability described by relation (15) to allow the bi-directional power exchange of both active and reactive power while limiting the apparent AC power of the converter within the nominal value . Inequalities (16) and (17) introduce binary variables and , which, in combination with (18), for each inverter, can be different from zero only one of the active powers (absorbed from the network) or (injected into the network). In relations (16), (17) and (19), the binary activation variables, , and , are introduced to quickly enable or disable the inverter functions in terms of active power absorption, active power injection, and reactive power exchange, respectively. It should be noted that these three constraints include the presence of to use binary variables with higher computational simplicity, whereas the inverter capability constraint is represented by (15).
For each inverter, in per-unit representation, a resistance, , in series with the ideal AC/DC converter, models the converter’s internal losses, as defined in (20). This parameter depends on the inverter efficiency, , whereas is the AC rated voltage of the converter. The resistance is put in series with the per-unit short circuit impedance of the MV/LV transformer that interfaces the MLSCI to the MV POD.
Finally, Equation (21) links the operating conditions of the downstream DC/DC chargers to the active powers flowing trough the inverters. This is performed by imposing the DC power balance at the common bus. It is remarkable to note that (21) does not prohibit power exchanges between EVs connected to different DC/DC chargers, whereas power exchanges between EVs downstream from the same DC/DC charger are inhibited by Equation (3). Therefore, V2V mode implementation is allowed.
3.4. Branch Flow Model (BFM) Relations and Constraints
This step concludes the scheme introduced in Figure 2. Lines, loads, generators, transformers, and inverter equivalent resistance are represented in the AC Optimal Power Flow (ACOPF) by using the Branch Flow Model (BFM) according to [19]. The problem is then written in the form of Second-Order Cone Programming (SOCP) as proposed in [20]. To clearly explain the following equations, Figure 6 represents a simplified three-node radial distribution network. Please note that and are the square magnitude of the voltage at node m and the square magnitude of the current flowing in the line connecting nodes m and n, respectively. Parameters and are the real and the imaginary components of the branch impedance.
In (22) and (23), the active and reactive powers flowing from m to n are computed according to (i) the active losses and the reactive consumption of the line branch; (ii) the total power absorbed by loads connected to the ending node n ( and ); (iii) the overall active and reactive generation connected at the ending node n ( and ); and (iv) the active and reactive powers flowing in the line departing from the ending node n (in the case of multiple branches departing from node n, it becomes the sum of powers flowing in those branches). Equation (24) defines the correlation between voltages at consecutive nodes, while (25) describes a second-order rotated cone constraint that allows the problem to become an SOCP.
The voltage at the generic node is constrained by (26) to remain within the permitted range bounded by and for all the network nodes. Similarly, the current flowing from the generic node to the generic the node is limited by (27) according to the branch ampacity () for all the network branches.
The last two equations represent boundary constraints able to coherently interface the MLSCI with the BFM formulation. Equation (28) computes the active power absorbed by the inverter as the load power withdrawn at the network node, given that the network node is the POD of the leg of the MLSCI. The load convention is adopted (a negative value represents an injection of power into the grid). In this way, the MLSCI is treated by the ACOPF as an end user capable of absorbing both positive and negative active power at all its PODs, according to the internal power constraints described in the previous subsections. The same concept is applied for the reactive power in (29).
3.5. Objective Function
All the above-defined powers refer to a generic time instant t and are supposed to be constant for the entire time step duration . Since integral parameters are introduced in the problem formulation, such as the stored energy in EVs, the optimization must consider a global time interval composed of time steps of duration . For each time instant t, the overall system losses, L, defined in (30), include the energy losses of the entire system, which means in EV batteries, in the MLSCI (DC/DC chargers, AC/DC converters and MV/LV transformers), and in the distribution network (network branches and HV/MV transformers). In detail, for each time instant t:
- represents the energy losses in the EV connected to the charger, as a consequence of the charging and discharging efficiencies of its battery, as described in Equation (31);
- represents the energy losses in the charger due to the DC/DC converter efficiency, as in (32);
- represents the energy losses in the AC/DC converter, as in (33), where is the current flowing on its AC side;
- stands for the distribution network losses, including all the feeder branches and the transformers (both HV/MV and MV/LV machines).
Finally, the objective function to be minimized, , corresponds to the overall system losses in the global time interval ( time steps), as represented in Equation (34).
4. Case Study
The case study, implemented to test features and potentials of the proposed MLSCI, is described in this section in terms of the distribution network, charging infrastructure data and charging scenarios. The case study was assessed in MATLAB R2023b, using YALMIP R20230622 [21] and GUROBI 11.0 as a solver, on a PC equipped with an Intel(R) Core(TM) i7-10700 CPU and 32 GB RAM. Results will be presented and discussed in the following section.
4.1. Network Data
The Cigrè Medium-Voltage Distribution Network Benchmark, European Configuration (Section 6.2 of [22]), is considered to be the reference distribution system to which the MLSCI is connected. The network consists of two MV feeders with a rated voltage of 20 kV. The left one is mainly realized with Overhead Lines (OHLs), with a high reactance/resistance ratio as a consequence, whereas the right feeder uses cables. In [22], the network topology can be modified by acting on disconnectors. In this paper, the standard radial asset of the benchmark network is considered, as graphically simplified in Figure 7. The MLSCI (with = 2) permits controllable interconnection of the feeder ends (consequently, switch S1 is considered open in all the following analyses).
Equivalent parameters of lines and HV/MV transformers, as well as network topology and power profiles of both generators and loads, are unchanged with respect to [22]. To emphasize the MLSCI operation and correlated advantages in the proposed case study, the changes made, depicted in gray in Figure 7, are as follows:
- Nomenclature of network nodes (from 1.2 to 1.13 for the left feeder, named as Feeder 1, and from 2.1 to 2.5 for the Feeder 2);
- Only PV and wind generators are considered, while batteries, fuel cells, and Co-Generators of Heat and Power (CHPs) are put out of service;
- The rated power of the wind generator connected to node 1.9 is doubled (from 1.5 MW to 3.0 MW);
- Two PV units, 7.0 MW each, are added at node 2.4;
- The rated power of the equivalent residential load supplied by node 2.4 is increased to 2.58 MW.
Additional specifications in terms of line ampacity are introduced to complete the network description. Reference [22] defines the line type for each network branch without reporting the line ampacity. The following assumption are considered:
- For Feeder 1, ref. [22] specifies cable lines, type NA2XS2Y, aluminum cross-sectional area of 120 mm2, and underground installation. Considering a touching trefoil layout, 0.7 m laying depth, solid bonding of cable screens, ground temperature of 20 °C, and soil thermal resistivity of 1.0 K·m/W for wet soil and 2.5 K·m/W for dry soil, a rated ampacity of 285 A is considered (in accordance with data-sheets of real cables);
- For Feeder 2, ref. [22] considers OHLs with an aluminum cross-sectional area of 63 mm2, then a rated ampacity of 200 A is assumed, taking into account the exposure to direct solar radiation.
For safety reasons, in the following case study, the admitted current in each network branch is limited to 80% of the corresponding rated ampacity.
4.2. Charging Infrastructure
The MLSCI is connected to nodes 1.10 and 2.5, which are added along the 2 km line connecting nodes 1.8 and 2.4 in [22]. It is supposed that the MLSCI is 200 m from node 1.8. As a consequence, the considered MLSCI has two PODs, each equipped with an MV/LV transformer and a bi-directional inverter ( = 2). The transformers’ rated power is 1.6 MVA, and active losses are considered in accordance to Table a of Section 4 of [23]. A rated power of 1.5 MVA and an efficiency of 0.98 characterize both the AC/DC converters.
On the car side, the implemented algorithm allows each DC/DC charger to be independently configured in terms of the number of sockets, rated power, and efficiency. However, for a clearer presentation of results, in this case study, all chargers have the same technical characteristics. The considered MLSCI is equipped with 40 parking places, each with a fast-charging socket. The number of DC/DC chargers is equal to 10, and each DC/DC charger can alternatively supply one of the four downstream sockets according to the control scheme detailed in Section 3.2. Finally, Table 1 gives the main characteristics of the implemented MLSCI.
4.3. Charging Scenarios
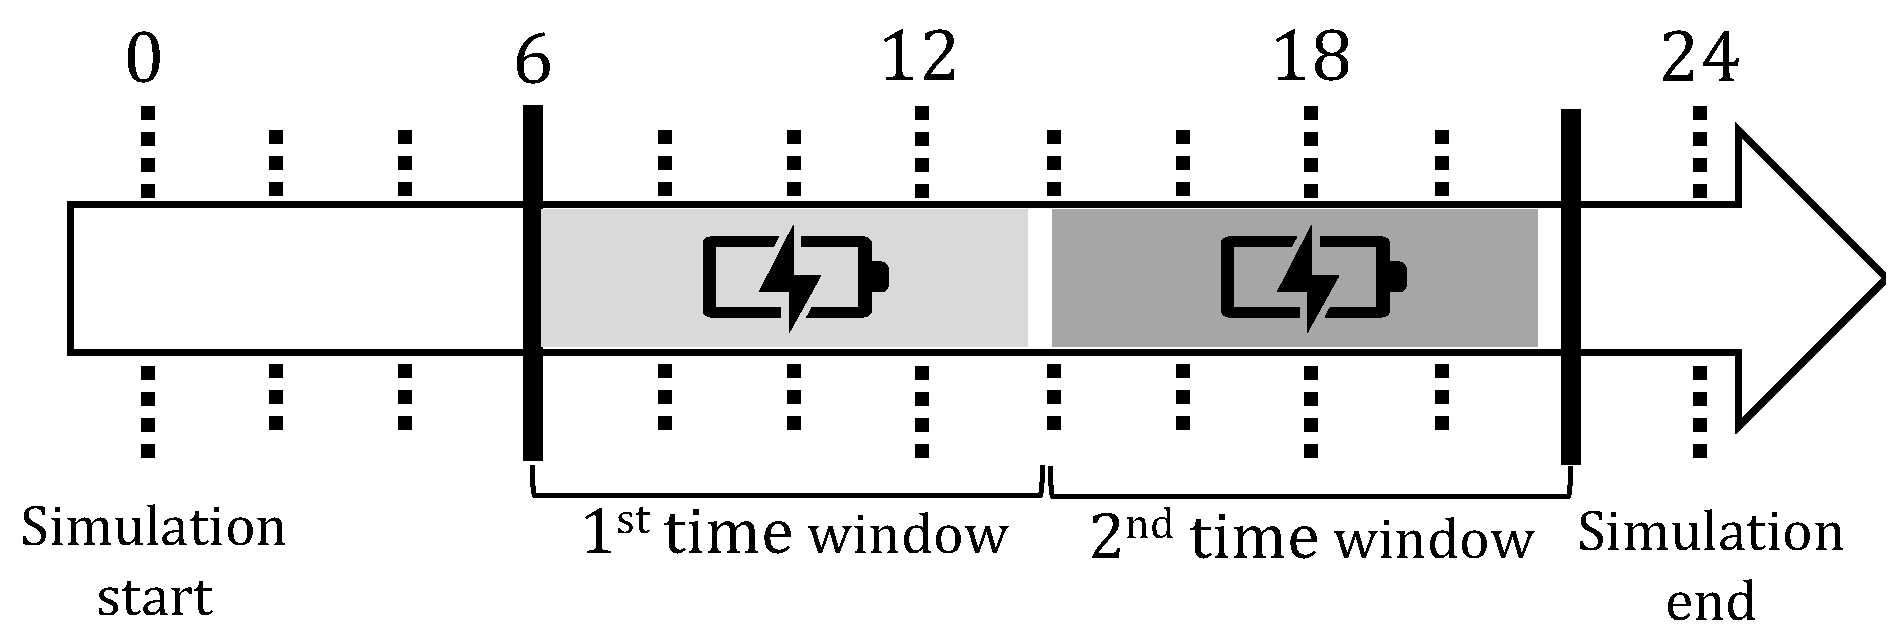
A daily simulation (24 h) is considered, subdivided into 96 time intervals of 15 min ( h). The modeled MLSCI recharges a total of 80 EVs during the day in two consecutive time windows of 7 h and 45 min, as depicted in Figure 8 (e.g., the case study models two working shifts).
With the aim of facilitating the interpretation of results, all the EVs have the same data in terms of:
- Battery capacity;
- Admitted power (in charge and in discharge);
- Charging energy requirement, i.e., all the EVs have the same starting SOC when the charging time window starts () and the same target SOC to be reached within the charging time window end ().
However, in a general application, the proposed approach is able to consider EVs with different values of and if they are included in the admitted range constrained by (5). Table 2 provides the parameters of EVs recharged in the two time windows. Please note that s and e on the label of the parameters refer to start and to end of the corresponding time window, respectively.
5. Discussion of Results
The proposed concept of the MLSCI permits the operation of the charging infrastructure according to different configurations. Table 3 identifies the seven configurations tested to prove and validate the performance of the MLSCI and its possible positive interactions with network regulation. The details of the configurations are as follows:
- Configurations A to D are single-leg topologies, since the charging infrastructure is alternatively supplied by Feeder 1 (configurations A and B, with SW1 closed and SW2 open) or by Feeder 2 (configurations C and D). Therefore, no power exchanges between the distribution feeders are possible. In configurations A and C, the charging power can be modulated, but DC/DC converters operate unidirectionally, and, therefore, EVs cannot be discharged (V1G mode). Oppositely, in configurations B and D, DC/DC converters are bi-directional machines, and EVs are able to operate in V2G mode.
- Configurations E to G consider the MLSCI connected to both PODs (SW1 and SW2 both closed). In configuration E, the PODs jointly provide the required charging power, but each inverter operates unidirectionally since it is not enabled to inject active power into the network. Consequently, no active power can be transferred between the distribution feeders. In configuration F, active meshing is activated since the AC/DC converters operate in a bi-directional way. Consequently, a controlled amount of active power can be exchanged between feeders through the MLSCI internal DC bus, independently from the charging power delivered to EVs while respecting the operating constraints detailed in Section 3. Finally, configuration G includes the bi-directional operation of DC/DC converters; therefore, the V2G mode is combined with the active meshing of feeders to maximize the MLSCI’s ability to contribute to network regulation while charging EVs.
The charging infrastructure is designed and controlled to optimally manage the charging schedule according to EV constraints, and at the same time, to attempt to solve voltage violations and grid congestion while minimizing overall system losses. In all of the defined configurations, AC/DC converters can exchange reactive power through the corresponding POD to provide voltage support within the inverter capability constraint.
Figure 9 summarizes the overall achieved results. For all of the studied configurations, several admitted deviations of network voltage have been considered. For each simulation, Figure 9 reports the following:
- In histogram form, the compliance to network constraints during daily simulation for both feeders: voltage compliance ( and ) and ampacity compliance ( and ). If the corresponding rectangle is green, the network constraint is satisfied for the specific simulation (in terms of MLSCI configuration and admitted voltage deviation, as reported on the horizontal axis).
- In the gray line, referring to the right vertical axis, the daily overall system losses in [MWh], which is the objective function of the optimization problem defined by (34). In case the information is absent for a specific MLSCI configuration and an admitted voltage deviation, the problem may not be solved due to the network constraints in the distribution feeder to which the charging infrastructure is connected. In this case, the entire column of the histogram describing the compliance to network constraints becomes white.
In the first four configurations, with the single-leg connection, the optimized schedule of charging makes it possible to contain network voltage deviation and solve contingencies in the feeder to which the charging infrastructure is connected. This is achieved by (i) modulating the charging process, (ii) exchanging reactive power at the POD, and (iii) enabling the V2G mode (only in configurations B and D). Enabling the V2G mode, the permitted voltage deviation can be reduced by up to 3.35% of the rated value in the feeder that supplies the charging infrastructure. No impacts on the other feeder are possible (e.g., in configurations A and B, SW2 is open and thus no interactions are possible between the charging infrastructure and Feeder 2). Contributing to network regulation generally results in increased overall losses due to (i) increased current flowing trough the AC/DC converter in use due to the reactive power exchange and (ii) increased losses in DC/DC converters and EVs when the V2G mode is enabled.
Considering the network constraints applied to both feeders, the MLSCI in configurations E and F is not able to satisfy a voltage deviation lower than 4%. This is caused by the high evening load peak in Feeder 1, which cannot be supplied by the other feeder through the MLSCI without causing voltage violations in Feeder 2. However, in comparison with the single-leg configurations A to D, two benefits clearly appear: (i) the voltage deviation can be maintained within 4% in the entire network (not only in the feeder hosting the charging infrastructure), and (ii) losses are remarkably reduced by sharing the charging energy requirement between PODs. Configuration G maximizes the benefits achievable through an MLSCI approach with bi-directional AC/DC converters, combined with the V2G mode. In this case, the charging infrastructure is able to reduce the voltage deviations in the entire network by up to 3.35% of the rated value while avoiding network congestion in both feeders. This is the only configuration able to reach this result since enabling V2G allows EVs to share the energy stored in their batteries to mitigate the effects of evening load peak. A worthwhile reduction in overall losses is confirmed in comparison with single-leg configurations.
The influence of MLSCI management in terms of overall losses is shown in Figure 10 for configurations E to G as a function of the admitted network voltage deviation. In all of the depicted simulations, the decrease in the permitted voltage deviation does not increase network losses in either of the feeders (Feeder1 losses, in gray, and Feeder2 losses, in black). The power transfer between PODs, obtained by enabling AC/DC converters to inject active power (configurations F and G) remarkably reduces network losses. Focusing on the MLSCI, its losses are divided in two parts: (i) losses in MLSCI electrical components, i.e., DC/DC converters, inverters, and transformers, named MLSCI losses (w/o EV), in orange, and (ii) losses in the EVs’ batteries due to charging and discharging efficiencies (EV losses, in blue).
The trend of MLSCI losses depending on permitted network voltage deviation clearly shows the role of power converters in satisfying network constraints, with increased currents and losses, while decreasing the admitted network voltage deviation. With the most stringent constraints (permitted voltage deviation lower than 4%), only the V2G mode makes it possible to respect network constraints. This causes an increase in losses both in MLSCI components and in EV batteries, since generally the energy provided by EVs must be restored in EV batteries to reach the target SOC at the end of the charging time window.
Figure 11 shows how the MLSCI control algorithm manages internal power flows in the simulation depicted with the black dot in Figure 9, i.e., MLSCI with the bi-directional AC/DC converter, with the V2G mode enabled and a network permitted voltage deviation of 3.5%. The gray dotted vertical lines are the boundaries of the charging time windows when the two fleets of EVs are connected. The bars represent the DC powers exchanged by AC/DC converters with the DC bus (in red the converter connected to POD1, in blue the other). The power is positive if the converter supplies the DC bus. This means that, for example, in the first hours (when no EVs are connected to the MLSCI), Feeder 1 supplies Feeder 2 through the MLSCI to reduce network losses while respecting network constraints.
The black line represents the total net power delivered to DC/DC chargers, i.e., the second summation in (21). Since the charging process is planned to minimize the objective function while respecting imposed constraints on the concerned network, MLSCI operation, and EV recharge, it tends to be scheduled when a power surplus caused by high renewable generation with respect to supplied load might involve network criticalities. The role of the V2G is clear in the time steps after 6 p.m., when EVs contribute in supporting grid voltages by injecting active power to both feeders during the evening load peak. The SOC of the batteries is later restored to the target value before the end of the second charging time window.
For the same simulation described in Figure 11, Figure 12 shows the daily behavior of bi-directional AC/DC converters in terms of active and reactive power exchange on the AC side. The load sign convention is used for both the active power and the inductive reactive power, whereas the color legend is the same introduced for Figure 12. Markers depict the complex power of each time step, whereas the black circle represents the rated power of converters introduced by (15). During the day, AC/DC converters typically support network voltage by behaving as capacitors to compensate for inductive absorption of loads (as defined in [22]), which makes it possible to increase the power factor along distribution feeders and consequently to reduce line currents and losses.
Referring to the same simulation, Figure 13 and Figure 14 show how the SCMS logic operates. The behavior of the DC/DC charger number 8 during the afternoon charging time window is reported in Figure 13. Positive values with green background represent the charging power delivered to the EVs connected downstream from the charger (EV29 to EV32), while negative values representing an EV discharge have a brown background. The intensity of the cell colour is proportional to the modulus of the reported value.
In Figure 14, the SOCs of vehicles EV29 to EV32 are reported for the same time period. It is confirmed that, in each time interval, only one EV exchanges power with the DC/DC converter. Vehicles EV29, EV32, and EV31 participate in providing power to the network in a V2G approach after 6 p.m. The SOCs of EV29 and EV32 are later restored to the corresponding target value in the last time intervals of the charging time window (after 9 p.m.), when network load decreases while wind production slightly increases, as reported in [22]. In contrast, EV31 is not recharged after being discharged. This is admitted in accordance with (5) to (7) since the target SOC at the end of the charging time window () is lower than the maximum SOC tolerated by the EV battery during the charging phase (). Differences in the power profiles between EVs connected to the same DC/DC charger are caused by the nature of the problem, considering that: (i) a purely technical optimization is performed; (ii) no prioritization criteria are applied; and (iii) in this case study, all the EVs have the same characteristics in terms of both technical data and charging demand.
6. Conclusions
The article introduces the novel MLSCI concept based on multiple connections with the distribution network. This, combined with an SCMS scheme, makes ancillary services available to support the DSO in regulating voltage and solving line congestion, with an estimated cost burden that is limited when compared to traditional charging stations. Through the internal DC link of the MLSCI, traditional radial distribution feeders can be controllably meshed, which means that active power exchange between feeders is actively regulated by AC/DC converters while provide recharge of vehicles.
Considering traditional charging infrastructures connected to the network through a single POD as the present benchmark, the MLSCI permits both a relevant containment of network losses and a remarkable improvement in network quality of supply in terms of admitted voltage deviation and congestion management. It is confirmed that the most significant benefits are achieved by combining the MLSCI, equipped with bi-directional AC/DC converters, with the V2G mode.
Future work will be focused on translating the technical purposes implemented in this paper into an economic domain in order to include both energy costs, the economic value of aging EV batteries, and charging tariffs specifically developed to encourage EVs to be available in supporting network operation, quality of supply, and stability.
Author Contributions
Conceptualization, F.B.; methodology, F.B. and L.M.; software, L.M.; validation, F.B. and L.M.; writing—original draft preparation, L.M.; writing—review and editing, F.B.; supervision, F.B. All authors have read and agreed to the published version of the manuscript.
Funding
This research received no external funding.
Data Availability Statement
Restrictions apply to the availability of these data. Data were obtained from [22] and are available at https://www.e-cigre.org/ (accessed on 13 November 2023).
Conflicts of Interest
The authors declare no conflicts of interest.
Abbreviations
The following abbreviations are used in this manuscript:
| AC | Alternate Current |
| ACOPF | AC Optimal Power Flow |
| BFM | Branch Flow Model |
| CHP | Co-Generator of Heat and Power |
| DC | Direct Current |
| DSO | Distribution System Operator |
| EV | Electric Vehicle |
| G2V | Grid-To-Vehicle |
| MLSCI | Multi-Leg Smart Charging Infrastructure |
| MV | Medium voltage |
| OHL | Overhead Line |
| OPF | Optimal Power Flow |
| POD | Point of delivery |
| SCMS | Single-Charger, Multiple-Socket |
| SOC | State Of Charge |
| SOCP | Second-Order Cone Programming |
| V2G | Vehicle-To-Grid |
| V2V | Vehicle-To-Vehicle |
References
- Keyser, M.; Pesaran, A.; Li, Q.; Santhanagopalan, S.; Smith, K.; Wood, E.; Ahmed, S.; Bloom, I.; Dufek, E.; Shirk, M.; et al. Enabling fast charging—Battery thermal considerations. J. Power Sources 2017, 367, 228–236. [Google Scholar] [CrossRef]
- BS EN 61851-1:2011; Electric Vehicle Conductive Charging System—General Requirements. BSI: London, UK, 2011.
- Yilmaz, M.; Krein, P.T. Review of Battery Charger Topologies, Charging Power Levels, and Infrastructure for Plug-In Electric and Hybrid Vehicles. IEEE Trans. Power Electron. 2013, 28, 2151–2169. [Google Scholar] [CrossRef]
- Wang, L.; Qin, Z.; Slangen, T.; Bauer, P.; van Wijk, T. Grid Impact of Electric Vehicle Fast Charging Stations: Trends, Standards, Issues and Mitigation Measures—An Overview. IEEE Open J. Power Electron. 2021, 2, 56–74. [Google Scholar] [CrossRef]
- Yong, J.Y.; Ramachandaramurthy, V.K.; Tan, K.M.; Mithulananthan, N. A review on the state-of-the-art technologies of electric vehicle, its impacts and prospects. Renew. Sustain. Energy Rev. 2015, 49, 365–385. [Google Scholar] [CrossRef]
- Khalid, M.R.; Khan, I.A.; Hameed, S.; Asghar, M.S.J.; Ro, J.S. A Comprehensive Review on Structural Topologies, Power Levels, Energy Storage Systems, and Standards for Electric Vehicle Charging Stations and Their Impacts on Grid. IEEE Access 2021, 9, 128069–128094. [Google Scholar] [CrossRef]
- Mwasilu, F.; Justo, J.J.; Kim, E.K.; Do, T.D.; Jung, J.W. Electric vehicles and smart grid interaction: A review on vehicle to grid and renewable energy sources integration. Renew. Sustain. Energy Rev. 2014, 34, 501–516. [Google Scholar] [CrossRef]
- You, P.; Yang, Z. Efficient optimal scheduling of charging station with multiple electric vehicles via V2V. In Proceedings of the 2014 IEEE International Conference on Smart Grid Communications (SmartGridComm), Venice, Italy, 3–6 November 2014; pp. 716–721. [Google Scholar] [CrossRef]
- Tan, K.M.; Ramachandaramurthy, V.K.; Yong, J.Y. Integration of electric vehicles in smart grid: A review on vehicle to grid technologies and optimization techniques. Renew. Sustain. Energy Rev. 2016, 53, 720–732. [Google Scholar] [CrossRef]
- Sehimi, Y.; Almaksour, K.; Suomalainen, E.; Robyns, B. Mitigating the impact of fast charging on distribution grids using vehicle-to-vehicle power transfer: A Paris city case study. IET Electr. Syst. Transp. 2023, 13, e12051. [Google Scholar] [CrossRef]
- Liu, C.; Chau, K.T.; Wu, D.; Gao, S. Opportunities and challenges of vehicle-to-home, vehicle-to-vehicle, and vehicle-to-grid technologies. Proc. IEEE 2013, 101, 2409–2427. [Google Scholar] [CrossRef]
- Ucer, E.; Buckreus, R.; Haque, M.E.; Kisacikoglu, M.; Sozer, Y.; Harasis, S.; Guven, M.; Giubbolini, L. Analysis, Design, and Comparison of V2V Chargers for Flexible Grid Integration. IEEE Trans. Ind. Appl. 2021, 57, 4143–4154. [Google Scholar] [CrossRef]
- Safayatullah, M.; Elrais, M.T.; Ghosh, S.; Rezaii, R.; Batarseh, I. A Comprehensive Review of Power Converter Topologies and Control Methods for Electric Vehicle Fast Charging Applications. IEEE Access 2022, 10, 40753–40793. [Google Scholar] [CrossRef]
- Bai, S.; Lukic, S.M. Unified Active Filter and Energy Storage System for an MW Electric Vehicle Charging Station. IEEE Trans. Power Electron. 2013, 28, 5793–5803. [Google Scholar] [CrossRef]
- Coffey, S.; Timmers, V.; Li, R.; Wu, G.; Egea-Àlvarez, A. Review of MVDC Applications, Technologies, and Future Prospects. Energies 2021, 14, 8294. [Google Scholar] [CrossRef]
- Bernacchi, R. MVDC and Grid Interties: Enabling new features in distribution, sub-transmission and industrial networks. White Pap. 2019, 20. [Google Scholar]
- Zhang, H.; Hu, Z.; Xu, Z.; Song, Y. Optimal Planning of PEV Charging Station with Single Output Multiple Cables Charging Spots. IEEE Trans. Smart Grid 2017, 8, 2119–2128. [Google Scholar] [CrossRef]
- Chen, H.; Hu, Z.; Luo, H.; Qin, J.; Rajagopal, R.; Zhang, H. Design and Planning of a Multiple-Charger Multiple-Port Charging System for PEV Charging Station. IEEE Trans. Smart Grid 2019, 10, 173–183. [Google Scholar] [CrossRef]
- Farivar, M.; Low, S.H. Branch Flow Model: Relaxations and Convexification—Part I. IEEE Trans. Power Syst. 2013, 28, 2554–2564. [Google Scholar] [CrossRef]
- Cervi, A.; Coppo, M.; Agostini, M.; Turri, R. Optimal management of islanded distribution networks including multi-energy storage units. In Proceedings of the 2020 IEEE 20th Mediterranean Electrotechnical Conference (MELECON), Palermo, Italy, 16–18 June 2020; pp. 464–469. [Google Scholar] [CrossRef]
- Löfberg, J. YALMIP: A toolbox for modeling and optimization in MATLAB. In Proceedings of the CACSD Conference, Taipei, Taiwan, 2–4 September 2004. [Google Scholar]
- Cigré. Benchmark Systems for Network Integration of Renewable and Distributed Energy Resources; Cigré: Paris, France, 2014. [Google Scholar]
- EU Requirements for Transformers: Ecodesign Directive from the European Commission Tier 2; Technical report; Siemens: Munich, Germany, 2021.
Figure 1.
Single line scheme of the novel MLSCI.

Figure 2.
Classification of the MLSCI constraints.

Figure 3.
Powers exchanged by EVs: sign convention and nomenclature.

Figure 4.
Powers flowing trough DC/DC chargers: sign convention and nomenclature.
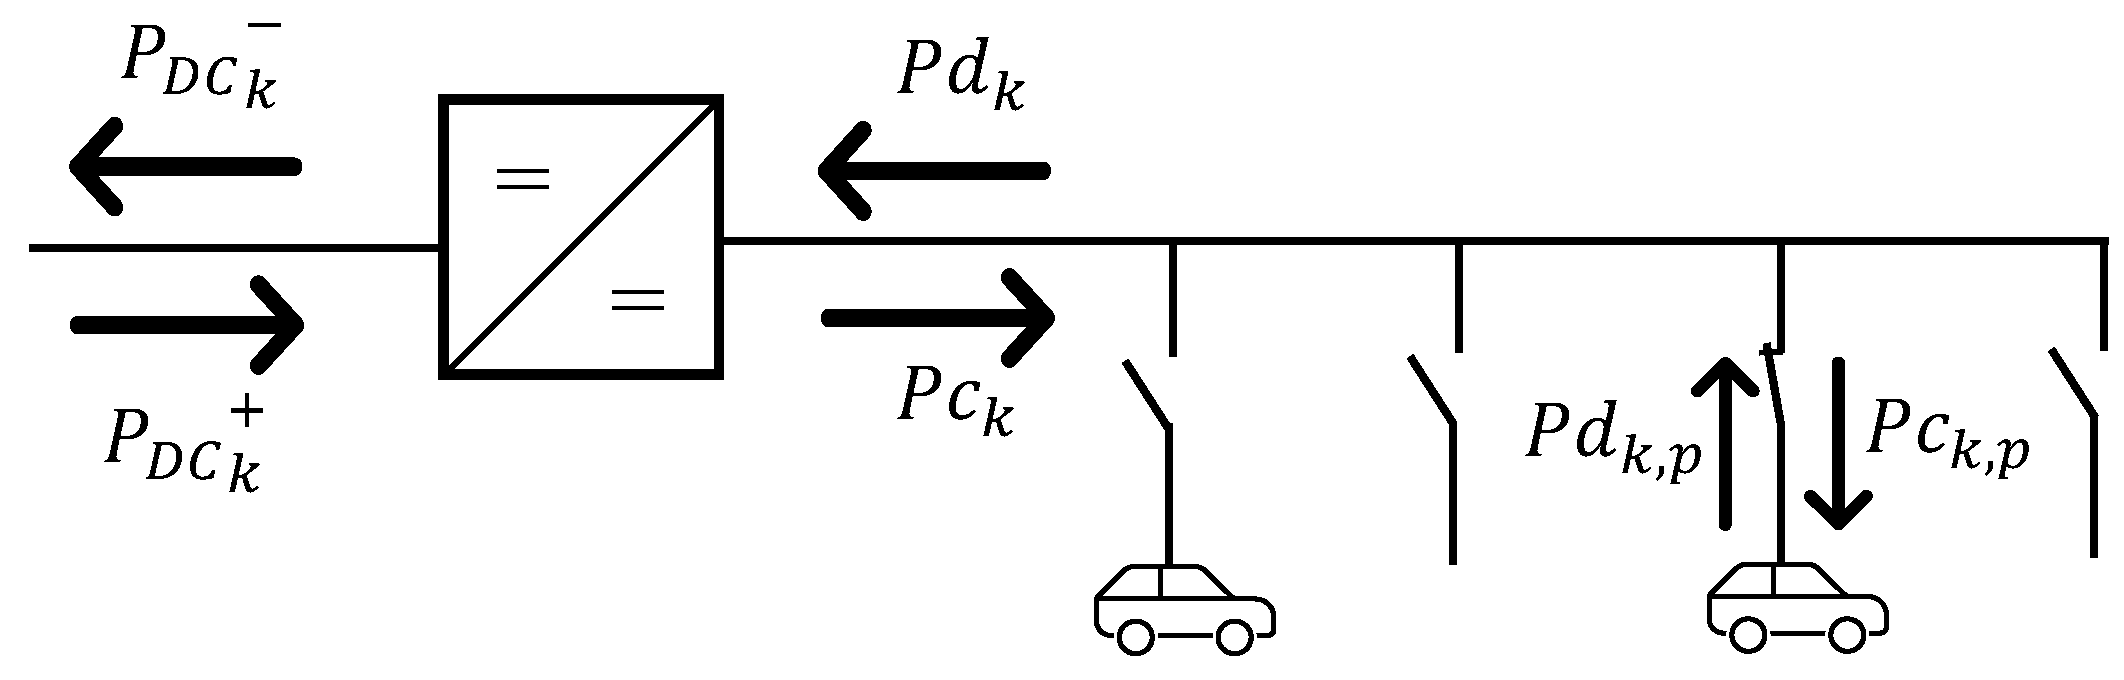
Figure 5.
Powers flowing trough AC/DC inverters: sign convention and nomenclature.

Figure 6.
General representation of the BFM model.

Figure 7.
Cigrè benchmark network scheme including the proposed MLSCI.

Figure 8.
Identification of the two time windows for charging.

Figure 9.
Loss and constraint compliance in all the analyzed configurations.
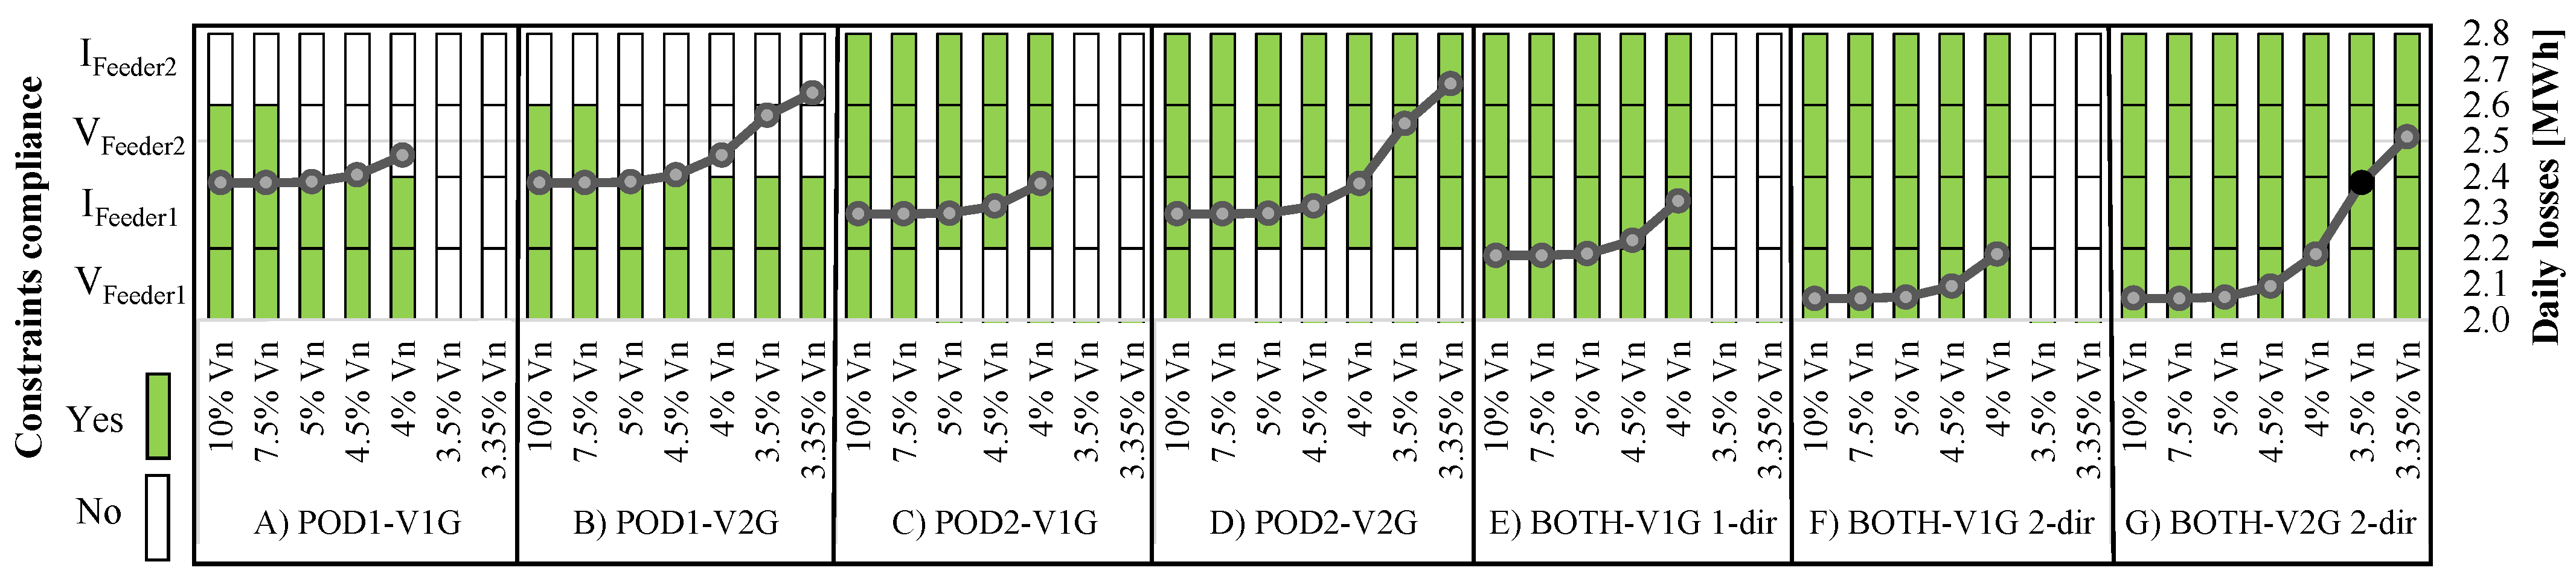
Figure 10.
Loss share between distribution network, MLSCI, and EVs in configurations (E–G).

Figure 11.
Power flows at DC bus in configuration G with admitted voltage deviation of 3.5%.
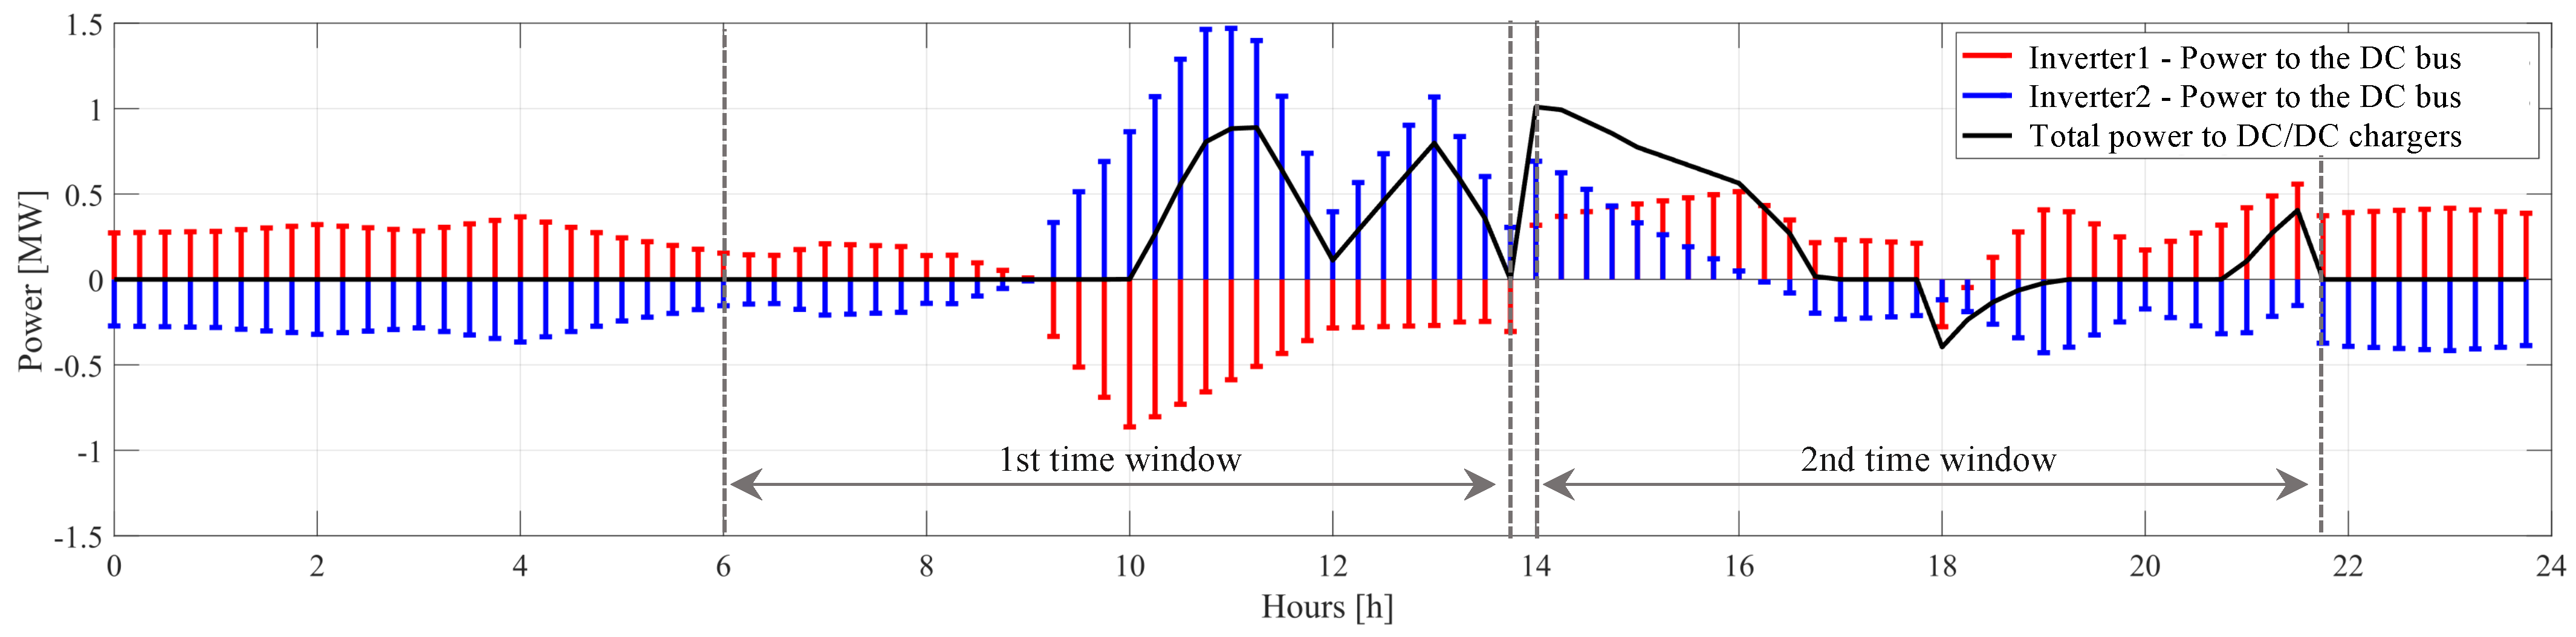
Figure 12.
Working conditions of AC/DC inverters and corresponding capability curves in configuration G with a permitted voltage deviation of 3.5%.
Figure 12.
Working conditions of AC/DC inverters and corresponding capability curves in configuration G with a permitted voltage deviation of 3.5%.
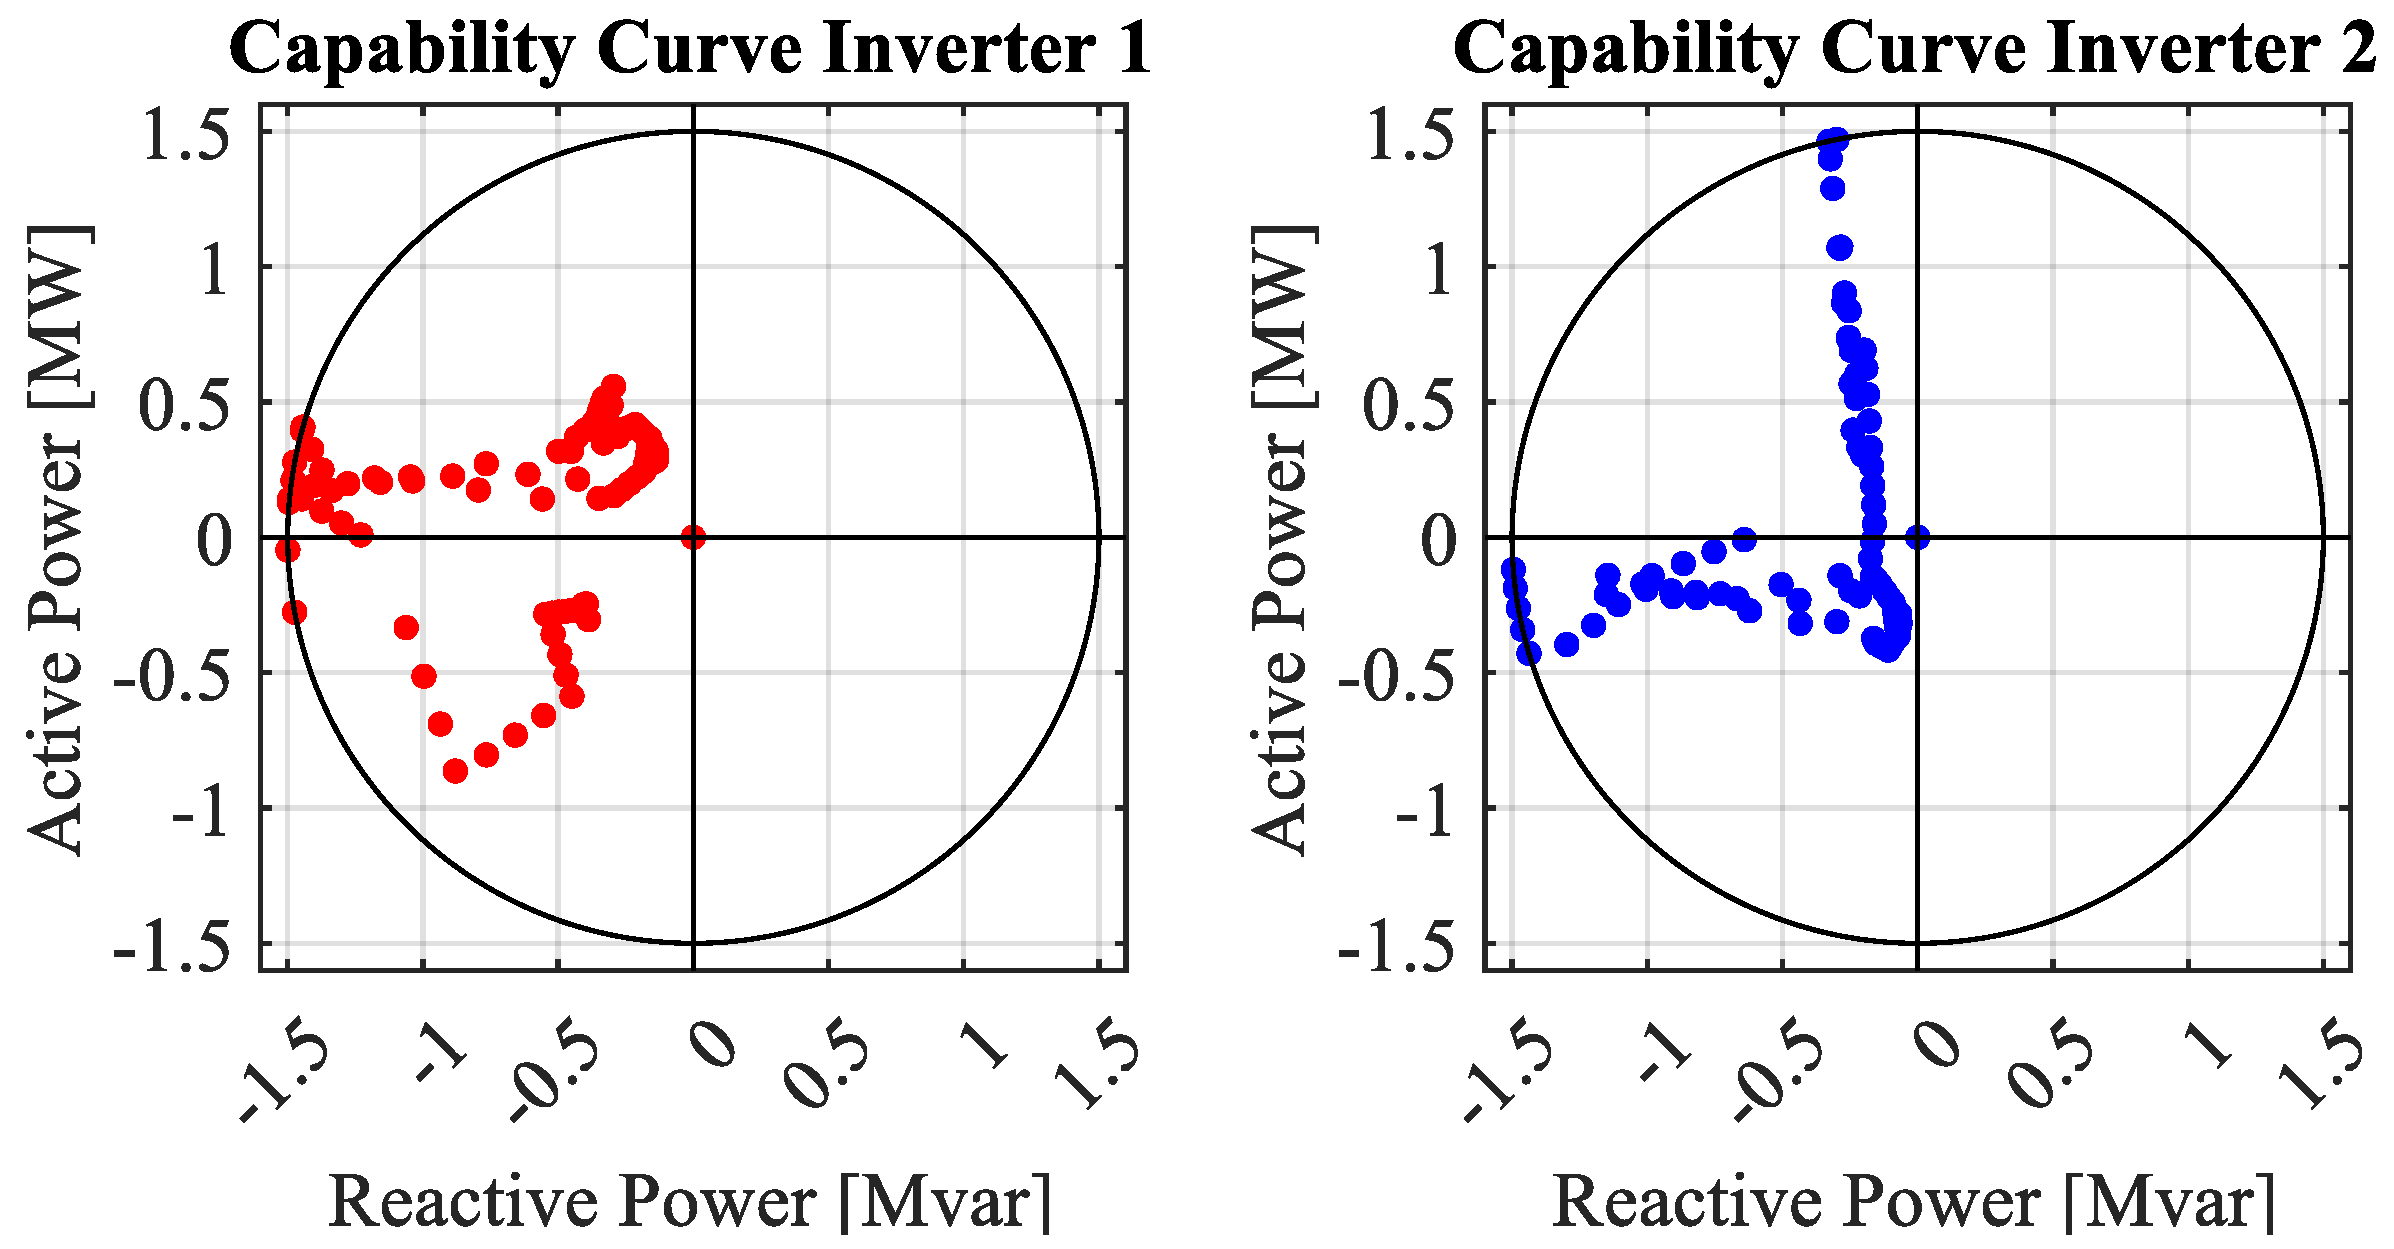
Figure 13.
Charging management strategy of charger 8 during the second time window in configuration G with a permitted voltage deviation of 3.5%.
Figure 13.
Charging management strategy of charger 8 during the second time window in configuration G with a permitted voltage deviation of 3.5%.
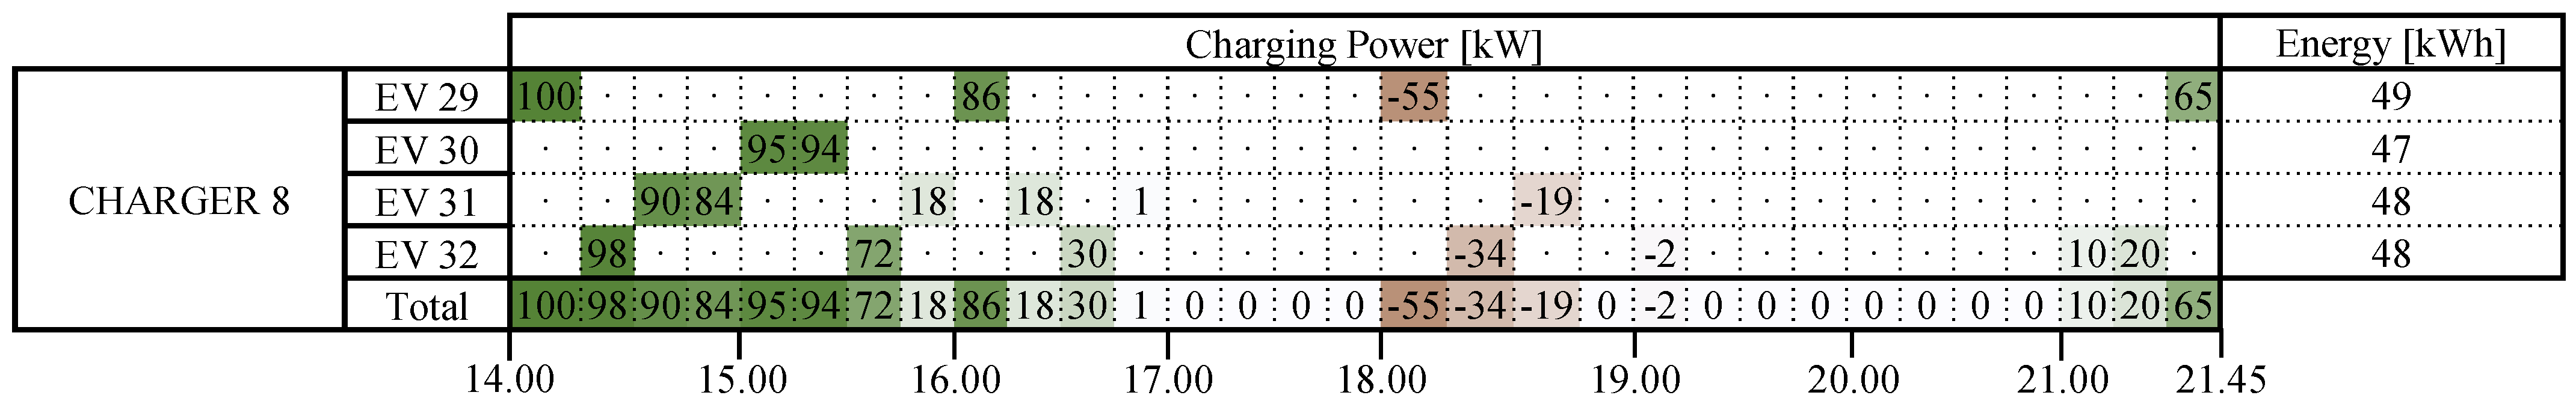
Figure 14.
SOCs of vehicles connected to charger 8 during the second time window in configuration G with a permitted voltage deviation of 3.5%.
Figure 14.
SOCs of vehicles connected to charger 8 during the second time window in configuration G with a permitted voltage deviation of 3.5%.


Table 1.
Main parameters of inverters and chargers.
| Parameter | Value |
|---|---|
| 2 | |
| 10 | |
Table 2.
EV parameters.
| Parameter | (1st Time Window) | (2nd Time Window) |
|---|---|---|
| 100 kW | 100 kW | |
| 90 kWh | 90 kW | |
| 6 | 14 | |
Table 3.
Analyzed configuration of the MLSCI.
| Configuration | POD | V1G/V2G | Meshing | SW1 | SW2 |
|---|---|---|---|---|---|
| A | POD 1 | V1G | none | closed | open |
| B | POD 1 | V2G | none | closed | open |
| C | POD 2 | V1G | none | open | closed |
| D | POD 2 | V2G | none | open | closed |
| E | BOTH | V1G | 1 dir | closed | closed |
| F | BOTH | V1G | 2 dir | closed | closed |
| G | BOTH | V2G | 2 dir | closed | closed |
Disclaimer/Publisher’s Note: The statements, opinions and data contained in all publications are solely those of the individual author(s) and contributor(s) and not of MDPI and/or the editor(s). MDPI and/or the editor(s) disclaim responsibility for any injury to people or property resulting from any ideas, methods, instructions or products referred to in the content. |
© 2024 by the authors. Licensee MDPI, Basel, Switzerland. This article is an open access article distributed under the terms and conditions of the Creative Commons Attribution (CC BY) license (https://creativecommons.org/licenses/by/4.0/).
Share and Cite
MDPI and ACS Style
Bignucolo, F.; Mantese, L. Controllable Meshing of Distribution Grids through a Multi-Leg Smart Charging Infrastructure (MLSCI). Energies 2024, 17, 1960. https://doi.org/10.3390/en17081960
AMA Style
Bignucolo F, Mantese L. Controllable Meshing of Distribution Grids through a Multi-Leg Smart Charging Infrastructure (MLSCI). Energies. 2024; 17(8):1960. https://doi.org/10.3390/en17081960
Chicago/Turabian StyleBignucolo, Fabio, and Luca Mantese. 2024. "Controllable Meshing of Distribution Grids through a Multi-Leg Smart Charging Infrastructure (MLSCI)" Energies 17, no. 8: 1960. https://doi.org/10.3390/en17081960
Note that from the first issue of 2016, this journal uses article numbers instead of page numbers. See further details here.