Article

Formation Rate and Energy Efficiency of Ice Plug in Pipelines Driven by the Cascade Utilization of Cold Energy

1
China Nuclear Power Operation Management Co., Ltd., Haiyan 314300, China
2
School of Materials Science and Engineering, University of Science and Technology Beijing, Beijing 100083, China
3
School of Energy and Power Engineering, Jiangsu University, Zhenjiang 212013, China
*
Author to whom correspondence should be addressed.
Energies 2024, 17(9), 1994; https://doi.org/10.3390/en17091994
Submission received: 22 January 2024 / Revised: 22 February 2024 / Accepted: 2 March 2024 / Published: 23 April 2024
(This article belongs to the Section B4: Nuclear Energy)

Abstract

:
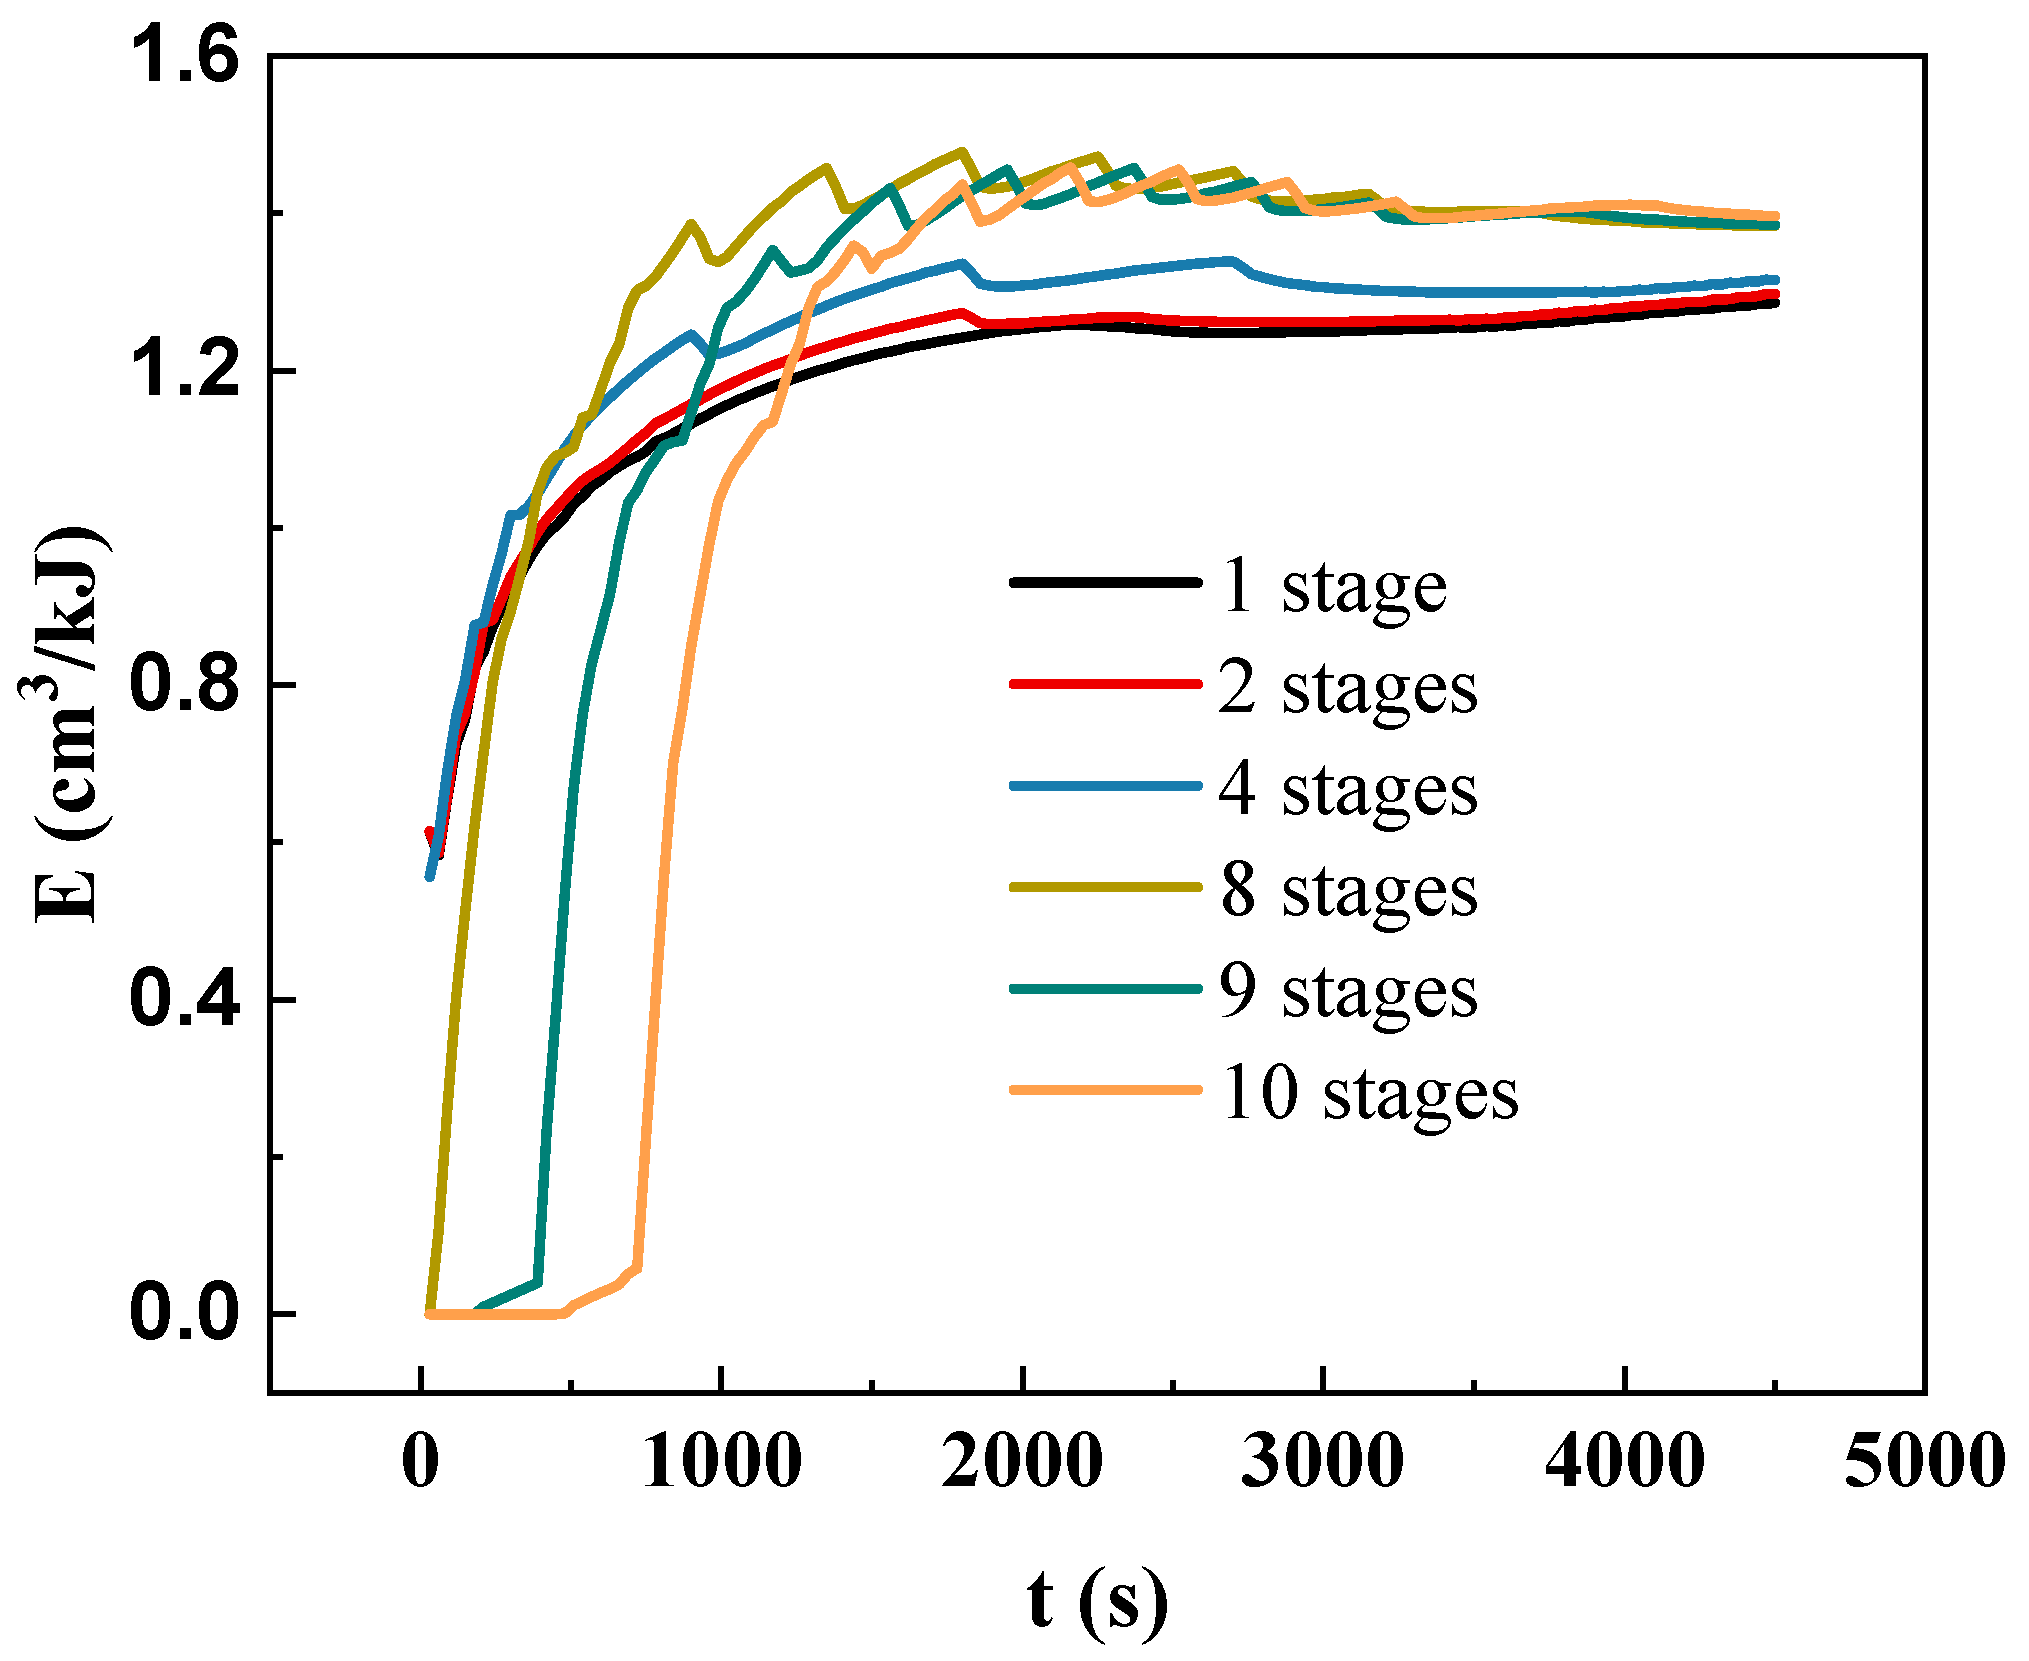
Ice plug technology is an effective method for isolating the pipeline system, which are promising methods utilized in the nuclear, chemical, and power industries. To reduce the cold energy consumption and temperature stress, the multi-stage (1–10) of time-dependent thermal boundary conditions was proposed for the formation of ice plug, while the gradient cooling wall temperature of multi-stage was applied. A numerical model considering the liquid–solid phase change, heat transfer, and time-dependent thermal boundary condition has been established. The effects of the ratio of length and diameter of the cooling wall lc/d (1–9) on the formation rate and heat flux of ice plug in the pipe has been investigated. The fastest formation rate of ice plug with 800 mm in the axial direction (7.47 cm3/s) was observed in the pipe with the lc/d of 5. The formation rate of ice plug and the ice formation volume under unit energy consumption VE under various stages (1–10) of cooling wall temperature have been compared. The VE of eight temperature stages (1.45 cm3/kJ) was 1.16 times than the VE of one temperature stage, which satisfied the freezing rate at the same time. This investigation provides insight for proposing an energy-saving system for the formation of ice plug.

1. Introduction

The transportation of liquids by pipeline is occurs often in the nuclear, chemical, and power industries [1,2,3]. A large number of pipelines are settled with relevant large-scale processing equipment, and require conventional or major maintenance [4]. To avoid a large leak of liquid medium and a system outage, an efficient and reliable pipeline isolation technology is necessary [3]. Freezing plug technology is an effectively method to isolate the pipeline system, which directly utilizes the solid–liquid phase change of liquid medium. Recently, ice plug technology has been gradually promoted in nuclear power and oil and chemical industries [3,5]. However, the large energy consumption for the formation of reliable ice plug limits its application.
Cooling condition acts as a key influence factor on the formation of ice plug, including energy consumption, ice formation rate, and freezing induced stress [6,7]. During the formation of ice plug in pipelines, a heat transfer jacket is installed outside the isolation point of the pipeline [8]. The refrigerant continuously flows through the heat transfer jacket, cooling the liquid and inducing the formation of ice plug in pipeline [9]. To grow and maintain a reliable ice plug under a certain pressure, a cold source with a low temperature is required. Dry ice and liquid nitrogen are regarded as the ideal cooling medium for the formation of ice plug in pipeline [6], which have phase change temperatures of −78.5 °C and −196.56 °C, respectively.
Large temperature differences of ice plug systems are induced by refrigerants with low phase transition temperature, causing large stress on the pipelines and rapid dissipation of energy. Akyurt et al. [10] indicated that the structural stress and thermal stress of the pipelines were induced by the temperature gradient. It is worth noting, however, that the volume of water increased during the freezing process [11]. Zhang et al. [12] investigated the effects of the cooling rate on the maximum internal pressure and the stress of the pipe. For example, the stress of the pipe increased from 164 MPa to 253 MPa with a cooling rate of 0.1795 to 0.7158 °C/min. Therefore, several cooling methods were proposed to reduce the stress of the pipeline with ice plug. Takefuj et al. [6] created a double-ice-plug freezing method, and explained that the stability of double-ice-plug is roughly four times that of single-ice-plug. In this situation, double-ice-plug freezing requires less liquid nitrogen and temperature difference than the single-ice-plug in the pipeline [13]. Although the improvement approaches reduced the stress induced by ice plug, the large temperature difference between the liquid nitrogen and initial liquid medium still produces stress. Moreover, the energy consumption of the liquid nitrogen cooling system must be optimized.
According to the ice plug freezing system with large temperature difference between ice plug and cold source, cold sources with multi-stage temperature are required to be applied on the ice plug freezing system. To promote the of the thermal efficiency of the heat exchange system, Xu et al. established a cascaded latent cold storage with multi-stage heat engine model [14]. The COP of the cascaded cold storage increased from 0.54 to 0.68. Chiu and Martin [15] indicated the thermal efficiency of a three-stage cold storage system is 1.4 times than that of a single-stage system. Tian and Zhao [16] reported the study on metal-foam enhanced thermal storage and found that the metal foam can improve the heat transfer rate by up to 30%. Mosaffa et al. [17,18] investigated the coefficient of performance COP of two-stage refrigeration for the purpose of free cooling, and the optimal COP (7.0) was better than single-stage refrigeration. Along with that, the application of cascade utilization of cold energy is also able to reduce the stress of pipes by reducing the temperature difference [19,20]. However, the adjusting method of the multi-stage temperature of cold resource has not been applied in the ice plug freezing system. The heat transfer performance and cold energy conversion rate has not been investigated.
In this study, the ice plug freezing systems with various temperature stages (1–10) were established to optimize the efficiency of cold energy utilization. The numerical models of ice plug freezing in a pipe under cooling wall with multi-stage constant temperature were established. The effects of the cooling length of the pipe L on the freezing rate R (m3/s), heat transfer rate Q (W), ice formation volume under unit energy consumption (m3/kWh), and temperature variation rate (°C/s) have been investigated in single-stage cooling temperature and multi-stage cooling temperature (1–10). This numerical investigation provided guidance on designing and applying the cascade utilization of the cold energy system of the ice plug system.

2. Numerical Simulations

2.1. Physical Model

This study aims to simulate the variation of temperature filed, formation of ice plug, and ice formation volume under unit energy consumption. Ice plug is a kind of pipeline isolation technology which utilizes refrigerants to quickly refrigerate and freeze the liquid medium in the pipeline. During the ice plug formation process in the pipeline, the water is firstly charged into the pipe. Then, a cooling jacket with a certain axial length Lc is wrapped around the outer wall of the pipe. The heat of the water in the pipe is transferred to the pipe wall where it is cooled by the cooling jacket. As the temperature of the water goes below the melting point, the ice plug is formed in the pipe until the strength of the ice plug can support the pressure of the water in pipe.
Based on the cylindrical region (water and ice plug in pipe) of simulation, a two-dimensional model has been established in Figure 1. The pipe diameter D was selected as 150 mm, while the pipe length of the calculation area was set to 2400 mm. The axial length lc of the cooling wall was set as 150, 450, 750, 1050, and 1350 mm, while the corresponding ratio of cooling wall length and pipe diameter lc/D was 1, 3, 5, 7, and 9, respectively. The initial temperature of the water in the pipe was set at 300 K. As the ice plug pipe was cooled by liquid nitrogen, the temperature of the cooling wall could be adjusted by the flow rate of the liquid nitrogen. In this regard, a cooling wall with multi-stage temperature could be applied during ice plug formation, the temperature range of the cooling wall was the phase-transition temperature of liquid nitrogen (77 K) and the temperature of initial water (300 K). On this basis, the temperature of the cooling wall with different stages (n = 1, 2, 3, 4, 5, 6, 7, 8, 9, and 10) have been proposed. The relationship between the wall temperature and cooling time of the stage number of 1, 2, 4, and n was listed as follows:
T t = 150 Κ 0 t 3600 s
T t = 165 Κ 0 t 1800 s 150 Κ 1800 < t 3600 s
T t = 195 Κ 0 t 900 s 180 Κ 900 < t 1800 s 165 Κ 1800 < t 2700 s 150 Κ 2700 < t 3600 s
T t = 150 + 15 n i Κ 3600 i 1 / n < t 3600 i / n   s i = 1 150 + 15 n i Κ 3600 i 1 / n < t 3600 i / n   s i = n 1 150 Κ 3600 i 1 / n < t 3600 i / n   s i = n
where i represents the step of the time-dependent thermal boundary condition.

2.2. Mathematical Model

To predict the temperature variation and the formation of ice plug in the pipe, an energy equation was established. In the numerical model, both the flow of water and gravity were ignored. The heat capacity of liquid nitrogen was enough to guarantee consistency in the temperature of the cooling wall. In this situation, the governing equation of the ice plug medium in the pipe was established:
t ρ H = λ T
where ρ is the density of the water (1000 kg/m3), H is the enthalpy (kJ·kg−1), T is the temperature, and λ is the heat conductivity (W·m−1·K−1).
The enthalpy of the freezing of water concludes sensible heat enthalpy h and latent heat enthalpy of phase transition:
H = h + Δ h
Sensible heat enthalpy h is determined as follows:
h = h r e f + T r e f T c p d T
where href is the reference enthalpy (kJ·kg−1) and cp is the specific heat capacity (kJ·kg−1·K−1).
The latent heat enthalpy of phase transformation ∆h is calculated using the following formula:
Δ h = β L
where L is the latent heat of freezing (kJ·kg−1) and β is the ratio of liquid phase in the water ice plug system:
β = 0 T < T s β = T T s T l T s T s < T < T l β = 1 T > T l
where Ts is the freezing point of water (268 K) and Tl is the melting temperature of ice (268 K).
The temperature boundary wall at the axial direction of z = 0 mm and 2400 mm was set as the heat insulated wall. At the axial position r = 75 mm, the cooling wall with the length of cooling wall lc was applied in the center of the pipe wall, and other wall was set as the heat insulated wall. The thermal conductivity, density, and specific heat capacity of the water and ice in this study was set as Table 1.

2.3. Numerical Method

A cylindrical two-dimensional model was established to simulate the formation of ice plug in pipe under unsteady condition. The simulated region was divided by the computational domain. At the axial position of 0 mm and 2400 mm, insulated wall were set. Besides, insulated wall and cooling wall were set on the tube wall. The partial mesh of the cylindrical two-dimensional model of the plain tube was shown in Figure 2. To guarantee the gradient of temperature kept in a suitable range near the tube wall, six boundary layers were set on the pipe wall. The radial thickness of the first boundary layer was 0.1 mm, while the increase ratio of thickness between layers was 1.2 mm, responding to the white lines.
The ice formation volume V (cm3) and ice formation volume under unit energy consumption VE (m3/kWh) have been compared under the same model with three meshes (30,000, 66,640, and 75,040) as can be seen in Table 2, along with the detailed line grids. Comparing the V of No.1 and No.3 to No.2, the V errors were 16.6% and 3.5%, respectively. Comparing the VE of No.1 and No.3 to No.2, the V errors were 39.5% and 13.7%, respectively. Thus, the model with 66,640 grids was selected in this simulation.
Finite volume method (FVM) was utilized to simulate the governing equation in the software of ANSYS FLUENT 2020 R1 [21]. The central differencing schemes were used to approximate the thermal conduction in water, ice plug, or the mixture of water and ice plug. The time step of the simulation was set at 30 s. The convergence criterion of the energy equation was set at 10−6.
The ice plug V (m3) was obtained as follows:
V = α V total
where Vtotal (m3) is the total volume of the pipe of the calculated model and α is the volume ratio of the ice plug in pipe.
The formation rate R (m3/s) of the ice plug was determined as follows:
R = V / t
where t (s) is the time of the cooling process and tm (s) is the finish time of the cooling process.
The ice formation volume under unit energy consumption (m3/kJ) was defined as follows:
VE = V / Q
where Q (kJ) is the heat transfer rate of the cooling process:
Q = 0 t m q d t
where q (kW) is the heat flux of the cooling wall.

3. Results

3.1. Effects of the Ratio of Length and Diameter lc/d on the Formation of Ice Plug

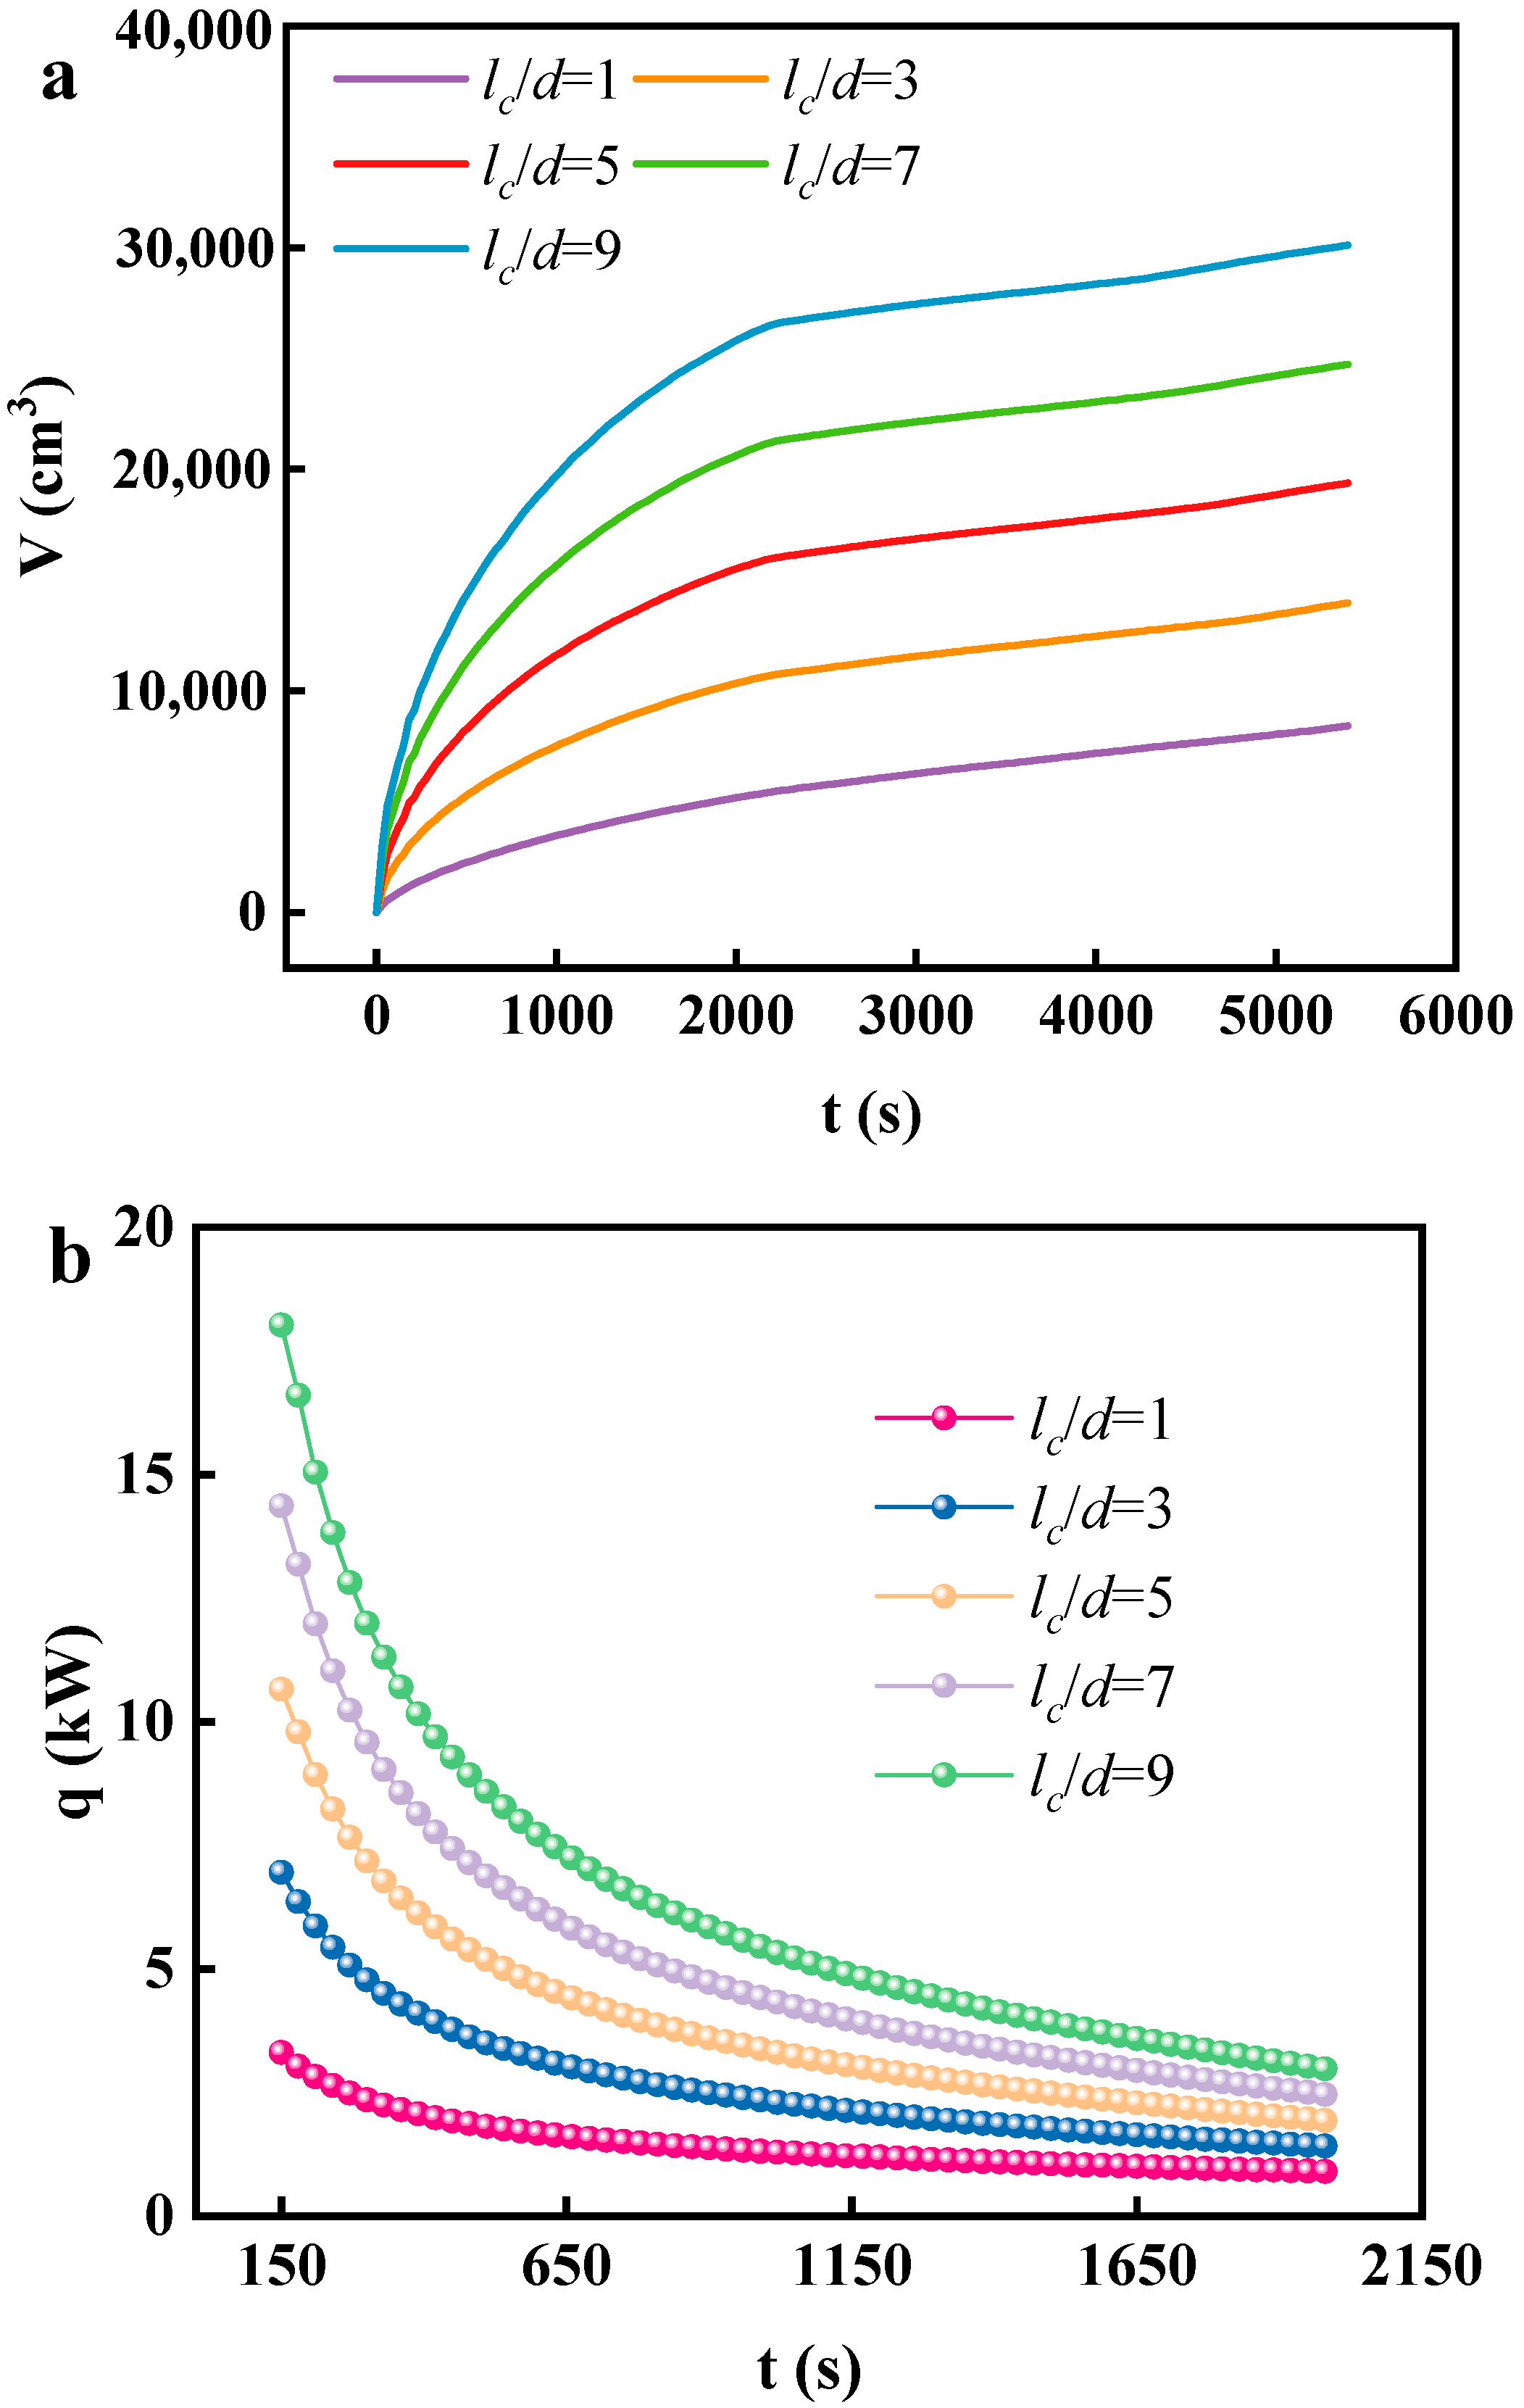
Figure 3a shows the variation of volume of the ice plug in the pipe with cooling time. The volume of ice plug in the pipe increased with the increasing cooling time. Particularly, the volume of the ice plug significantly increased with the cooling time from 0 s to 2100 s, and then a relatively slow increase from 0 s to 2100 s. Meanwhile, the formation rate of the ice plug in the pipe increased with the lc/d at the same cooling time. For instance, the volume of the ice plug was 19,000 cm3 at the lc/d of 9, which was 6.33, 2.79, 1.72, and 1.27 times more than the lc/d of 1, 3, 5, 7, respectively. The volume of the ice plug was 25,000 cm3 at the lc/d of 9, which was 5.55, 2.5, 1.66, and 1.25 time more than the lc/d of 1, 3, 5, and 7, respectively. This phenomenon revealed that the heat transfer rate increased with the increased length of cooling wall, promoting the formation rate of the ice plug in the pipe.
Figure 3b shows the variation of the heat transfer rate on the cooling wall with cooling time. It can be observed that the heat transfer rate from ice plug to the cooling wall significantly decreased with the increase in cooling time. For instance, the heat transfer rate was 18 kW at 150 s, but was reduced below 5 kW at 2000 s. During the cooling process, the temperature difference between the ice plug and cooling wall decreased with the cooling time, leading to the heat transfer rate decreasing. The heat transfer rate of the cooling wall increased with the lc/d at the same cooling time. The heat transfer rate at the lc/d of 9 was more than three times that of the lc/d at the cooling time of 150 s. In addition, the reducing rate of the heat flux decreased with the increased cooling time. This phenomenon was attributed to the fact that the cooling wall with the larger lc/d has a larger heat transfer area, and the reduction of temperature caused the higher effect on the heat transfer rate of the cooling wall.
Figure 4 shows the effect of the ratio of length and diameter lc/d on the formation time of ice plug. The formation time of ice plug was determined at the axial thickness of the ice plug when it reached 800 mm. It can be observed that the formation times of ice plug in the pipe of lc/d = 1, 3, 5, 7, and 9 were 5000, 2500, 2150, 2200, and 2230 s, respectively. At the lc/d of 1, the formation time of ice plug was higher than that of other pipes with different lc/d. This indicates that the length of the cooling wall was too short for effective heat transfer, wasting cold energy. Pipes with the lc/d of 3, 5, 7, and 9 had similar ice plug formation times, and the lc/d of 5 had the shortest ice plug formation time (7.47 cm3/s). Thus, an optimal length that caused the shortest freezing time of a pipe with certain diameter was found. For instance, the length of the cooling wall between three and seven was the ideal size for ice plug formation in a six-inch pipe.

3.2. Effects of the Multi-Stage Temperature of Cooling Wall on Formation Rate

The formation of ice plug in six-inch pipe with the lc/d of five under different temperature stages of cooling wall have been studied, while the formation rate of ice plug under various temperature stages have been compared. Figure 5 shows the variation of the volume of the ice plug in pipes on the cooling wall with cooling time under various temperature stages (i = 1–10). It can be observed that the ice volume increased with the cooling time. Particularly, the formation rate of the ice plug in pipes decreased with the increasing cooling time. At a cooling time of 1000 s, the ice volume cooled by one temperature stage was 5500 cm3, however, the ice volume cooled by ten temperature stages was 800 cm3, which is seven times less than one temperature stage. This phenomenon was attributed to the fact that the temperature of the cooling wall with multiple stages at the initial stage was lower than single stage, and reduced the formation rate of the ice plug in the pipe. Also, the gap of the ice plug volume among several temperature stages decreased with the increasing cooling time. It was determined that the temperature of the cooling wall was decreased in a stage model with the cooling time. The gradually decreasing temperature of the cooling wall gradually accelerated the formation rate and the temperature decreasing rate of the ice plug. As the gap of ice volume under different temperature stages was significantly reduced at the cooling time after 4000 s, the application of the multi-stage temperature of the cooling wall was able to satisfy the icing rate.
Figure 6 shows the variation of the formation time at which the ice plug reached 800 mm at axial direction with the number of temperature stages. It can be observed that the formation time of the ice plug in the pipe increased with the increasing temperature stages of the cooling wall. The freezing time were 3280 s and 5050 s at the temperature stage number of 1 and 10, respectively. The freezing time was mainly proportional to the temperature stage number. Therefore, the appropriate temperature stages of cooling wall set in the formation process of the ice plug was to satisfy the freezing rate, which can also reduce the temperature stress and cold energy consumption.

3.3. Effects of the Multi-Stage Temperature on Cold Energy Consumption

The application of multi-stage temperature cooling wall based on the cooling time was aimed to realize the cascade utilization of cold energy. Figure 7 shows the variation of the heat flux on the cooling wall with cooling time under multi-stage temperature cooling wall. It can be observed that the heat flux on the cooling wall appeared to decrease with the increase in the cooling wall. The phenomenon was attributed to the decreasing temperature difference between the ice plug and cooling wall. Among the heat flux under various temperature stages, the maximum heat flux of each stage was in the range of 3.3–4.76 kW and the peak value of level four is the maximum at approximately 4.76 kW. The obvious peak of heat flux appeared at each point of the contiguous temperature stages under multi-stage temperature supporting. As the wall temperature decreased by 15 K, the temperature difference between the ice plug and cooling wall was increased, leading to the rapid increase of heat flux. Then, the heat flux tended to subsequent decreasing until the next temperature drop.
The stability of the heat flux with the cooling time was also improved with the increasing temperature stage number of cooling wall. As shown in Figure 7, the heat flux was continuously decreased with the increasing cooling time under the temperature stage number from one to six. As the temperature stage number was higher than six, the heat flux was kept in a certain range at every temperature stage. This phenomenon revealed that the cold boundary condition of multi-temperature stage was similar to the temperature-reducing rate of ice plug, causing the temperature difference and heat flux to maintain a stable condition.
To evaluate the cold energy consumption during the formation of ice plug in pipe, the ice formation volume under unit energy consumption VE was proposed. Figure 8 shows the effect of the multi-stage temperature on the VE. It can be observed that the VE of single temperature stage was higher than that of multiple temperature stages on the cooling wall. For instance, the VE decreased with the increased number of temperature stages at cooling times before 1000 s. It was contributed to the fast cooling of the water and ice plug under the single temperature stage. Also, the VE of multiple temperature stages was higher than single stages in the subsequent cooling time. For instance, the VE of eight temperature stages was 1.45 cm3/kJ, which was 1.16 times than the VE of one temperature stage (1.25 cm3/kJ). Therefore, the cascade utilization of cold energy is beneficial for energy saving.

4. Conclusions

In this study, the ice plug freezing systems with various temperature stages (1–10) were established to optimize the efficiency of cold energy utilization. A numerical model considering the liquid–solid phase change, heat transfer, and time-dependent thermal boundary condition has been established. At the ice plug pipe with an lc/d of five, the shortest time for the formation of ice plug with 800 mm in the axial direction has been observed. The appropriate temperature stages of cooling wall set in the formation process of ice plug satisfied the freezing rate, which can also reduce the cold energy consumption. The VE of eight temperature stages (1.45 cm3/kJ) was 1.16 times than the VE of one temperature stage. Therefore, the cascade utilization of cold energy is beneficial for energy saving.

Author Contributions

M.H.: Writing—original draft, investigation; W.Z.: data curation; K.X.: visualization, formal analysis; Z.Y.: validation, writing—review and editing; L.W.: funding acquisition, methodology; Y.F.: conceptualization, methodology; H.C.: supervision, resources, writing—review and editing. All authors have read and agreed to the published version of the manuscript.

Funding

This research received no external funding.

Data Availability Statement

The data presented in this study are available on request from the corresponding author. The data are not publicly available due to privacy.

Conflicts of Interest

Authors Minglei Hu, Wei Zhang and Ke Xu were employed by the company China Nuclear Power Operation Management Co., Ltd. The remaining authors declare that the research was conducted in the absence of any commercial or financial relationships that could be construed as a potential conflict of interest.

References

  1. Meng, N.; Li, T.; Gao, X.; Liu, Q.; Li, X.; Gao, H. Thermodynamic and techno-economic performance comparison of two-stage series organic Rankine cycle and organic Rankine flash cycle for geothermal power generation from hot dry rock. Appl. Therm. Eng. 2022, 200, 117715. [Google Scholar] [CrossRef]
  2. Messelier-Gouze, C.; Brézillon, C.; Tubiana, A.; Rousseau, G. Justification of the Use of Liquid Nitrogen to Make Ice-Plugs in Carbon-Manganese Steel Pipes for Maintenance Purposes in Nuclear Plants. In Proceedings of the ASME 2002 Pressure Vessels and Piping Conference, Vancouver, BC, Canada, 5–9 August 2002. [Google Scholar]
  3. Zhang, X.; Zhang, Y.; Wang, J. Evaluation and selection of dry and isentropic working fluids based on their pump performance in small-scale organic Rankine cycle. Appl. Therm. Eng. 2021, 191, 116919. [Google Scholar] [CrossRef]
  4. Khater, A.M.; Soliman, A.; Ahmed, T.S.; Ismail, I.M. Power generation in white cement plants from waste heat recovery using steam-organic combined Rankine cycle. Case Stud. Chem. Environ. Eng. 2021, 4, 100138. [Google Scholar] [CrossRef]
  5. Xu, H.; Bbosa, B.; Pereyra, E.; Volk, M.; Mannan, M.S. Oil transportation in pipelines with the existence of ice. J. Loss Prev. Process Ind. 2018, 56, 137–146. [Google Scholar] [CrossRef]
  6. Takefuj, Y.; Okubo, T. Double-ice-plug freezing using liquid nitrogen for water pipe repairs. Urban Water J. 2018, 15, 97–99. [Google Scholar] [CrossRef]
  7. Jain, A.; Miglani, A.; Huang, Y.; Weibel, J.A.; Garimella, S.V. Ice formation modes during flow freezing in a small cylindrical channel. Int. J. Heat Mass Transf. 2018, 128, 836–848. [Google Scholar] [CrossRef]
  8. Corbescu, B.; Puiu, D.; Gyongyosi, T.; Panaitescu, V. Forming an ice plug inside a high diameter pipeline in stationary water using a nitrogen vapour exhaust restriction. J. Phys. Conf. Ser. 2018, 2018, 012002. [Google Scholar] [CrossRef]
  9. Dong, W.; Ding, J.; Zhou, Z.X. Experimental Study on the Ice Freezing Adhesive Characteristics of Metal Surfaces. J. Aircr. 2014, 51, 719–726. [Google Scholar] [CrossRef]
  10. Cruz, J.; Davis, B.; Gramann, P. A Study of the Freezing Phenomena in PVC and CPVC Pipe Systems. In Proceedings of the Annual Technical Conference of the Society of Plastics Engineers 2010, Orlando, FL, USA, 16–20 May 2010; pp. 201–206. [Google Scholar]
  11. Bowen, R.J. An Experimental Study of Ice Formation in Pipes. Ph.D. Thesis, University of Southampton, Southampton, UK, 2000. [Google Scholar]
  12. Xie, L.; Wang, C.; Zhang, W.; Shen, X.; Hu, M.; Bian, C.; Xu, Y. Stress Distribution and Safety Evaluation of Pipeline in Ice Plug of Nuclear Power. Nucl. Sci. Eng. 2021, 196, 221–233. [Google Scholar] [CrossRef]
  13. Lyu, Y.; Bergseth, E.; Olofsson, U. Open System Tribology and Influence of Weather Condition. Sci. Rep. 2016, 6, 32455. [Google Scholar] [CrossRef] [PubMed]
  14. Xu, H.J.; Zhao, C.Y. Thermal efficiency analysis of the cascaded latent heat/cold storage with multi-stage heat engine model. Renew. Energy 2016, 86, 228–237. [Google Scholar] [CrossRef]
  15. Chiu, J.N.W.; Martin, V. Multistage latent heat cold thermal energy storage design analysis. Appl. Energy 2013, 112, 1438–1445. [Google Scholar] [CrossRef]
  16. Tian, Y.; Zhao, C.Y. Thermal and exergetic analysis of Metal Foam-enhanced Cascaded Thermal Energy Storage (MF-CTES). Int. J. Heat Mass Transf. 2013, 58, 86–96. [Google Scholar] [CrossRef]
  17. Mosaffa, A.H.; Ferreira, C.A.I.; Talati, F.; Rosen, M.A. Thermal performance of a multiple PCM thermal storage unit for free cooling. Energy Convers. Manag. 2013, 67, 1–7. [Google Scholar] [CrossRef]
  18. Mosaffa, A.H.; Garousi Farshi, L.; Infante Ferreira, C.A.; Rosen, M.A. Energy and exergy evaluation of a multiple-PCM thermal storage unit for free cooling applications. Renew. Energy 2014, 68, 452–458. [Google Scholar] [CrossRef]
  19. Al-Shehri, S.A. Cooling Computer Chips with Cascaded and Non-Cascaded Thermoelectric Devices. Arab. J. Sci. Eng. 2019, 44, 9105–9126. [Google Scholar] [CrossRef]
  20. Saber, H.H.; AlShehri, S.A.; Maref, W. Performance optimization of cascaded and non-cascaded thermoelectric devices for cooling computer chips. Energy Convers. Manag. 2019, 191, 174–192. [Google Scholar] [CrossRef]
  21. Mahian, O.; Kolsi, L.; Amani, M.; Estellé, P.; Ahmadi, G.; Kleinstreuer, C.; Marshall, J.S.; Taylor, R.A.; Abu-Nada, E.; Rashidi, S.; et al. Recent advances in modeling and simulation of nanofluid flows—Part II: Applications. Phys. Rep. 2019, 791, 1–59. [Google Scholar] [CrossRef]
Figure 1. Schematic of formation of ice plug in pipe with two-dimension model.
Energies 17 01994 g001
Figure 2. Partial mesh of cylindrical two-dimensional model of ice plug water region in pipe.
Energies 17 01994 g002
Figure 3. Variation of volume of the ice plug V in pipe (a) and heat flux q (b) on the cooling wall with cooling time t.
Energies 17 01994 g003
Figure 4. Effect of the ratio of length and diameter lc/d on ice plug formation time.
Energies 17 01994 g004
Figure 5. Variation of volume of ice plug V in pipe on the cooling wall with cooling time t under multi-stage temperature of cooling wall.
Energies 17 01994 g005
Figure 6. Variation of formation time of ice plug reached 800 mm at axial direction with the number of temperature stages.
Energies 17 01994 g006
Figure 7. Variation of heat flux q on the cooling wall with cooling time t under multi-stage temperature of cooling wall.
Energies 17 01994 g007
Figure 8. Effect of multi-stage temperature on ice formation volume under unit energy consumption E.
Energies 17 01994 g008
Table 1. Schematic of formation of ice plug in pipe with two-dimension model.
MediumThermal Conductivity
W·m−1·K−1
Density
kg·m−3
Specific Heat Capacity
J·kg−1·K−1
Water0.6110004200
Ice0.619002100
Table 2. Grid independence checking.
NumderGrid NumberV
(cm3)
V Error
(%)
VE (m3/kWh)VE Error (%)
No.130,00026.616.6%147.5939.5%
No.266,64022.8Baseline105.82Baseline
No.375,04022.03.5%91.3713.7%
Disclaimer/Publisher’s Note: The statements, opinions and data contained in all publications are solely those of the individual author(s) and contributor(s) and not of MDPI and/or the editor(s). MDPI and/or the editor(s) disclaim responsibility for any injury to people or property resulting from any ideas, methods, instructions or products referred to in the content.