
Adaptive Comfort Potential in Different Climate Zones of Ecuador Considering Global Warming
by
 , , and
Evelyn Delgado-Gutierrez
1 ,
,
Jacinto Canivell
1 ,
,
David Bienvenido-Huertas
2,* and
and
Francisco M. Hidalgo-Sánchez
1
1
Departamento de Construcciones Arquitectónicas II, Escuela Técnica Superior de Ingeniería de Edificación, Universidad de Sevilla, 41012 Seville, Spain
2
Department of Building Construction, University of Granada, 18071 Granada, Spain
*
Author to whom correspondence should be addressed.
Energies 2024, 17(9), 2017; https://doi.org/10.3390/en17092017
Submission received: 20 February 2024
/
Revised: 7 April 2024
/
Accepted: 18 April 2024
/
Published: 24 April 2024
(This article belongs to the Special Issue Thermal Comfort and Energy Performance in Building)
Abstract
:Ecuador is a country with several climate zones. However, their behaviour is similar throughout the year, with no peaks of extreme temperatures in the various seasons. This paper is a first approach to study the adaptive comfort behaviour in several areas and populations of the country. Considering the ASHRAE 55-2020 model, energy simulation programmes are applied not just to the current climate scenario but also to the climate change scenarios of 2050 and 2100. The results of locations are analysed and compared to determine their performance. Thanks to their climate characteristics, adaptive comfort models could be applied as a passive strategy, using natural ventilation for building indoor comfort improvement, particularly social dwellings. According to previous studies, some prototypes have not considered the climate determinants in each region. Given the geographic situation of the study areas, the adaptive comfort model could be applied in all cases. Percentages of application of natural ventilation and heating and cooling degree hours have similar behaviours according to the climatic region, with a variation greater than 30% among them.
1. Introduction
Ecuador is geographically divided into three continental regions (the Coast, the Sierra, and the Amazon) and one island region (the Galapagos Islands). Moreover, the country is territorially organised into regions, provinces, cantons, and parishes. A minimum of 10,000 inhabitants is required to constitute a parish, which is in the lowest level of the country’s organisation used to classify statistical data [1]. According to the official data of the National Institute of Statistics and Censuses of Ecuador [2], the Ecuadorian population increased to 17,510,643 inhabitants in 2020, with 64% living in urban areas and the remaining 6.3 million in rural areas.
Likewise, Ecuador has eight climate zones according to the Köppen–Geiger classification [3]. Its territory is therefore characterised by a complex variety of climates that are the result of several significant factors, including its location in the Ecuadorian line, the Andes Mountains that go through the country from north to south, the interactions of winds from both hemispheres, the junction of cold and hot currents, the high and constant radiation presented by its latitude, and the influence of Pacific and Atlantic oceans. All these factors result in obtaining different temperatures in the various areas [4]. Rain and wind distribution is also different in the territory, and only two periods are distinguished, i.e., wet or rainy and dry periods, unlike the countries located in other latitudes and with four seasons [5].
In Latin America, there is a worrying increase in housing deficit. There is not just a quantitative deficit, but also a big gap among constructive technologies, materials, and technical and healthiness criteria among dwellings, with more than 50% of Latin American family units under inappropriate conditions [6,7]. In Ecuador, 45% of family units represented that housing deficit in 2015, of which 36% corresponded to family units living in an inappropriate dwelling [8]. One of the main problems is family units’ energy poverty as they cannot live in a comfortable dwelling because of both high energy costs and buildings’ poor conditions [9].
Global warming is widely studied [10,11] as temperatures have increased all over the planet, resulting in changing rainfall patterns, melting glaciers, and the changing ecosystem and its consequences [12]. More than 40% of global emissions come from the building sector, which is responsible for both two tons of raw material per square meter and all the elements involved [13]. In this context, the European Union building sector is responsible for 39% of energy-related CO2 emissions [14].
In Latin America, 11% of global emissions came from this region in 2010 [15]. According to data from 2011, an average of 2.1 kg of CO2 was emitted per inhabitant yearly in comparison with 4.9 kg of CO2 of the world average yearly [16]. In 2010, Latin America represented 6% of energy consumption, with Brazil, Mexico, Argentina, Colombia, and Venezuela consuming 80% of it [17]. In a study carried out between 2000 and 2015, seven countries (Mexico, Brazil, Argentina, Chile, Peru, Ecuador, and Colombia) produced 76% of Latin American emissions [18]. In 2020, the of energy-related CO2 emissions in Latin American countries had an average of 2 tons per capita [19].
Ecuador only emitted 0.16% of the global greenhouse gas (GHG) emissions in 2018 [20]. In this country, GHG emissions from the production sector of raw materials and materials was 3.2% in 2018, whereas energy was responsible for 51% of emissions in the same year, with the building sector being within this category with a total of 2529.58 Gg CO2-eq in comparison with the 75,326.87 Gg CO2-eq generated by all categories in that year [21]. Consequently, the Ecuadorian territory is also affected by global warming, following the global trend of rising temperatures, demands and, therefore, greenhouse gas emissions [22]. Given its climate diversity, it is interesting to study how it affects parishes so as to obtain more detailed results of the consequences. According to several studies, climate change has led to floor erosion, with sub-Saharan Africa, South America, and Southeast Asia being the most affected areas between 2001 and 2012 [23]. Ecuador has acquired a commitment as part of both the United Nations Framework Convention on Climate Change (UNFCCC) and the Paris Agreement, as well as the recognition of a shared responsibility to protect the climate as a common good of humankind. In addition, since 2016, the National Energy Agenda was published, which seeks to decarbonize the country’s electricity sector with the use of hydroelectric plants [24].
Obviously, there is a constant stimulus to achieve favourable habitability conditions with the lowest emission level. Adaptive comfort models have been studied all over the world [25,26,27,28,29], but not in Latin America, except in Chile and Mexico [30,31,32]. However, some research studies are related to thermal comfort and passive strategies in the region [33,34,35].
People adapt to the various climate conditions to find thermal comfort and interact with the environment in several ways [36]. This is one of the premises of adaptive comfort models. The ISO 7730–2005 defines thermal comfort as “that condition of the mind in which the satisfaction with the thermal environment is expressed” [37]. Steady-state thermal balance models indicate that thermal feeling is related to the thermal load on the thermoregulatory mechanisms of human beings, so an indoor environment could be designed by considering parameters such as air temperature, speed, and moisture, thus by calculating heating and cooling loads. Adaptive comfort models are not new. Some studies published before 1970 mentioned these conditions, and in 2021, more than 2000 authors had already studied it, mainly in China, the United Kingdom, and the United States [38].
Considering that there are several authors who mention the relationship of climate adaptability and improvements in terms of thermal comfort, this paper aimed to study the possibility of applying adaptive comfort models in 38 locations in Ecuador, while also measuring the percentage of application of natural ventilation and the hours of heating and cooling that the localities present in the current climate scenario, as well as in the climate projections to 2050 and 2100.
Demand is usually measured in heating and cooling degree days (or degree hours). With this analysis, it is possible to know the relationship of the outdoor temperature with the demand for indoor space conditioning. In this paper, the heating and cooling demand of different areas of Ecuador is analysed, measured in heating degree days (HDDs) and cooling degree days (CDDs) [39,40,41] and subsequently transformed and represented in hourly values, as described in the methodology section. The results obtained are based on data on outdoor temperatures of the study areas, but not on the energy analysis of a particular building. This document serves as a basis for future studies in which passive strategies are applied to improve thermal comfort in buildings in Ecuador and its surroundings.
This paper seeks to address the following research questions (RQs):
RQ1: Is the Ecuadorian territory suitable for applying adaptive comfort models, and in what percentage, according to the ASHRAE 55 standard?
RQ2: Is it feasible to use natural ventilation systems to improve comfort in different areas of Ecuador?
RQ3: What is the demand for heating and cooling in different areas of the country when applying the ASHRAE 55 adaptive comfort model?
RQ4: How is the application of natural ventilation systems as well as the demand for heating and cooling influenced by the projection of global warming?
RQ5: How does the applicability of natural ventilation, heating, and cooling demands vary according to three different climate projection scenarios?
To address these questions, simulations were conducted in 38 cantons in Ecuador. The following section details the methodology and data that were applied to this research.
The main objective of this paper is to know the potential of application of the ASHRAE adaptive comfort model in Ecuadorian territories. The specific objectives are as follows:
To know the percentage of natural ventilation that can be used to improve thermal comfort in different locations.
To obtain the heating and cooling demands of the study areas.
To perform a climate projection to know the development of the localities in terms of natural ventilation and heating and cooling demands.
2. Materials and Methods
2.1. Adaptive Thermal Comfort Model from ASHRAE 55-2020
Today, there are many adaptive comfort models which consider building’s occupants as active agents to achieve thermal comfort [42], thus changing the idea that occupants are simple passive recipients of an indoor climate [43]. The standardisation firstly published in 2004 by ASHRAE [44] is the most used model. The last updated version, i.e., ASHRAE 55-2020, took place in 2020 [45] and has since been applied to various places all over the world [46,47,48]. For this reason, it has been decided to use the ASHRAE standard as opposed to the EN-16798 standard [49], which has similar considerations.
ASHRAE 55-2020 sets two typologies of adaptive comfort models according to the percentage of acceptability, 80% and 90%, whose upper and lower limits are related to the prevailing mean outdoor air temperature () (Equation (1)). The temperature applied corresponds to the value of the weighted average of daily temperatures () in a period between 7 and 30 days, according to value, which is 0.9 in this paper because the study area presents temperatures with less variability, corresponding to the tropics. Equations (2) and (3) were used to calculate the limits of the model according to the 80% acceptability rate, whereas the ranges of the were between 10 and 33.5 °C (Figure 1).
After applying the model, if temperatures are out of the limits, heating, ventilation, and air conditioning, HVAC systems are used so that the indoor conditions of the dwelling are comfortable. The 80% acceptability has been selected for this study. Its comfort limits are wider than those of the 90% acceptability, so there is greater energy saving by considering that users would have lower thermal expectations, which also corresponds to the low thermal variability of the locations studied [50].
Likewise, two adaptive strategies have been considered: the use of natural ventilation when the outdoor temperature is within the limits, and the refurbishment of buildings by using HVAC systems with adaptive setpoint temperatures when buildings cannot be naturally ventilated (Figure 1) [51,52]. The criteria used to measure applicability are described in more detail in Section 2.3, “Analysis Process”.
2.2. Obtaining Climate Data
This study analyses 38 locations of the country (Figure 2). These locations have been selected according to statistical data: parishes with more than 50,000 inhabitants in the 24 provinces of the country, according to the population census from 2010 [2]. The most populated locations have been selected, including Guayaquil, Quito, and Cuenca. The climate data of each location (current and projections) were obtained by using METEONORM Version 8, a widely used software that contains a database from several thousands of weather stations at a global level, that allows for obtaining specific climate data by extrapolating data from existing stations and the geographical coordinates of the study areas. The weather file of each location was obtained for the current climate scenario, as well as for the 2050 and 2100 scenarios in Representative Concentration Pathways RCP 2.6, RCP 4.5, and RCP 8.5 [53], whose application has been guaranteed [10,11,52]. The RCPs are selected as standard scenarios for the IPCC Fifth Assessment Report [54]. The RCPs include projections based on emissions and concentrations of greenhouse gas and land use/land cover issues [55,56,57,58]. The differences among these scenarios depend on both the increasing estimates of locations and temperature rise.
As aforementioned, 38 locations were selected according to the population indicated in the last census of the country [2]. Table 1 shows the distribution of the parishes according to province, area, population, and climate zone, and Figure 3 shows that all the parishes presented a similar climate range between maximum and minimum values, always between 10 and 33.5 °C, thus maintaining similarities among the locations in a same climate zone according to the Köppen–Geiger classification [3].
The classification developed in 1900 by Wladimir Köppen and revised and updated by Rudolf Geiger between 1954 and 1961 is still the most widely used by the scientific community. This classification considers temperature, precipitation and, to a lesser extent, atmospheric pressure. Table 1 shows the main characteristics of the climatic zones [59,60,61,62].
2.3. Analysis Process
The possibility of applying strategies according to the adaptive comfort model was assessed. Likewise, their effectiveness was analysed. The application of the model and the possibility of applying natural ventilation and adaptive setpoint temperatures for heating and cooling were separately assessed.
To determine the percentage of days of the year when the adaptive comfort model could be applied, the criterion used was that to be applied when is within the limits (between 10 °C and 33.5 °C), as indicated by ASHRAE 55-2020. The outdoor mean temperature was calculated by using data from the previous 15 days and with a value of α of 0.9 (which was determined by the geographic situation of the study areas). With the values of the previous 15 days, based on the climatic files used, the running mean value of the outside temperature has been obtained.
In this case, (Equation (4)) corresponds to the percentage of the total days in which the adaptive comfort model could be applied, and is the value given to each day of the year studied. When the weighted mean temperature is greater than 35 °C or lower than 10 °C, the value of 0 is given, and when it is within the limits, the value of 1 is given. Adaptive strategies were analysed hourly. As for natural ventilation and optimal natural ventilation, the number of hours of the year within the comfort limits of the model in the 80% acceptability was considered, although data are shown in Section 3 in percentages for a better understanding. An equation like Equation (5) was used, replacing the value of the 365 days of the year with the 8760 h:
where is the percentage of the total hours in which the comfort model could be applied, and is the value given to each hour of the year studied. When the weighted mean temperature is greater than 35 °C or lower than 10 °C, the value of 0 is given, and when it is within the limits, the value of 1 is given.
Adaptive setpoint temperatures could be used according to the greater number of hourly degrees in case of cooling demand, and the lower number of hourly degrees in case of heating demand. Adaptive setpoint temperatures were calculated according to the limits obtained by the 80% acceptability (Equations (2) and (3)). To configure static setpoint temperatures, 2 temperatures were chosen for cooling (25 °C and 26 °C) and 2 for heating (20 °C and 21 °C), according to other research studies [52]:
where is the hourly value of the adaptive heating setpoint temperature obtained in hourly degrees [°C]; is the hourly value of the adaptive cooling setpoint temperature obtained in degree hours [°C]; (6) is the annual sum of the difference in hourly degrees between the adaptive cooling setpoints [°C] and the outdoor temperature; is the hourly value of the degrees of the outdoor temperature [°C]; (7) is the annual sum of the difference in hourly degrees between the adaptive heating setpoints [°C] and the outdoor temperature; and and are logical values that are given as 1 when the condition indicated by equations is met, and 0 when the condition is not met. Finally, and in accordance with Equation (5), the results have been analysed based on hourly values, which show more specific data than the daily results.
This paper includes tables and graphs, but also maps with a colour code. For this purpose, data interpolation between the locations studied and those not studied was used, considering that the values were influenced by the closest points.
3. Results and Discussion
This section includes the results obtained by the simulations performed for 38 locations in 10 climate scenarios: current and future scenarios (2050 and 2100) in RCP 2.6, RCP 4.5, and RCP 8.5. In addition, readers are recommended to consult the figures at the end of this section to obtain greater spatial information about the variations of the adaptive thermal comfort models in the different climate change scenarios. In this regard, all figures related to 2022, 2050, and 2100 are represented in such items.
3.1. Application of the Adaptive Thermal Comfort Model
The possibility of applying the adaptive comfort model to locations according to ASHRAE 55-2020 was analysed. For this purpose, the value of should be between 10 °C and 33.5 °C. Consequently, the analyses of the 38 locations in Ecuador determined that the model could be applied to current, 2050, and 2100 scenarios because 100% of the case studies had temperatures within the range, as Figure 2 shows. This result squared with other studies that indicated that in latitudes close to the equatorial line, the model could be applied to 90% of case studies [50], unlike cases such as in Spain, with an average of 70% [63] and Japan, where only 0.92% of the territory obtained an applicability greater than 90% [52].
Application of Natural Ventilation Strategies
The possibility of adapting thermally indoor spaces in buildings was also studied by using natural ventilation. For this purpose, the hours of the year when the outdoor temperature was within the ranges set in Section 2.3, i.e., between the lower and upper limit of the adaptive model, were observed in each climate scenario.
Climate conditions in Ecuador makes the application of this model possible, particularly with natural ventilation. In the current climate scenario, approximately 63% of locations obtained a percentage of the application of natural ventilation greater than 40% (Figure 3). The lowest percentages of application were obtained in the Sierra, with the parishes located in the Andes Mountains (which belong to the Cfb climate zone according to the Köppen–Geiger classification). On the other hand, some of the most populated locations located in the Coast presented percentages of application greater than 75% of the days of the year, including the most populated conurbation of the country (Guayaquil—Samborondón—Durán), with approximately 80% for the current scenario, whereas the Metropolitan District of Quito presented 9%.
The comfort model indicated that natural ventilation could be applied at least 80% of the year in 32% of the locations studied in the current climate scenario. On the other hand, 37% of the parishes corresponding to the Cfb zone obtained values to apply natural ventilation less than 35% of the time.
As for future scenarios, climate change would affect some locations and benefit others. Generally, values were similar for 2050 regarding the percentage of parishes where the model could be applied more than 75%, whereas the locations where the model could be applied more than 80% went from 12 to 9. There was also a significant change with the increase in the percentage of application of natural ventilation in Cfb zones, such as the Metropolitan District of Quito, which obtained 12.14%, 13.89%, and 15.59% in RCP 2.6, RCP 4.5, and RCP 8.5, respectively. However, in the conurbation of Guayaquil—Samborondón—Durán, it was reduced on average by one percentage point in the future scenarios in contrast to the current scenario results (Figure 4).
The situation was the same for the 2100 climate scenario, although the locations that would apply natural ventilation strategies was significantly reduced greater than 80%, since only 6 parishes maintained this percentage in RCP 2.6 and RCP 4.5, whereas no population obtained more than 80% in RCP 8.5. Thus, the Metropolitan District of Quito would reach 20 points in the percentage of application, whereas the conurbation of Guayaquil—Samborondon—Durán would reduce its percentage to 75%.
On the other hand, the values of optimal ventilation were calculated among the 38 locations in the current climate scenario. The optimal temperature values are much more restrictive than those previously described in the 80% category, as they correspond to those moments, in hourly values, when the temperature is right in the middle of the range. That value was averaged around 17% within the ranges; it is clear by considering that the values for optimal ventilation were lower than those with the 80% acceptability. Only 55% obtained ranges between 25% and 30% of application, whereas 32% reached at least 10% (Figure 5).
As for the 2050 scenario, 55% of locations in RCP 2.6 averaged more than 25% within the ranges established for the adaptive comfort model for the optimal ventilation, whereas this percentage increased to 58% in RCP 4.5 and RCP 8.5, with only two locations being over 35%: Portoviejo and Manta, with 36.71% and 35.79%, respectively.
As for the 2100 scenario, 37% of locations obtained in RCP 2.6 and RCP 4.5 less than 5% within the range of optimal ventilation, whereas this percentage was reduced to 8% in RCP 8.5. At least 21 parishes exceeded 25% in RCP 2.6, 23% in RCP 4.5, and 24% in RCP 8.5. Moreover, in the last scenario, three locations reached more than 40%: Manta, Montecristi, and Portoviejo, with 41.76%, 42.80%, and 40.92%, respectively.
3.2. Heating and Cooling Demands
3.2.1. Heating Degrees
Given the climate conditions of Ecuador, heating degrees of the 80% acceptability were clearly different in the climate zones. For the current climate scenario (Figure 5), 14 locations (37%) obtained less than 1000 heating degree hours, whereas 11 parishes obtained more than 40,000 hourly degrees; in total, 18% demanded between 1000 and 2000 units. Latacunga, Riobamba, and Ambato obtained the greatest heating demand: 44,556.0, 43,996.2, and 43,551.6 hourly degrees, respectively. Guayaquil—Samborondón—Eloy Alfaro (Durán), which are the most populated areas, averaged 917 units for the current climate scenario, whereas the Metropolitan District of Quito reached 40,539.
As for the 2050 scenario, 50% of locations required less than 1000 heating degree hours in RCP 2.6 and RCP 4.5, where there were 4 and 14 parishes, respectively, with requirements of less than 500 hourly degrees, in comparison with the 18 parishes of RCP 8.5, in which at least 34% of locations required more than 30,000 units. The average of the Metropolitan District of Quito for 2050 was 34,351.7, whereas the conurbation of Guayaquil—Samborondón—Eloy Alfaro (Durán) required 399.5 hourly degrees.
The 2100 climate change scenario obtained the same result (Figure 6). The percentage of locations that required less than 1000 heating degree hours was the same as in 2050 in RCP 2.6, whereas it increased to 55% and 61% in RCP 4.5 and RCP 8.5, respectively. Moreover, no location required more than 25,000 units in RCP 8.5. Likewise, five parishes (Daule, Eloy Alfaro (Durán), Manta, Montecristi, and Portoviejo) presented a null result of hourly degrees according to the model. The conurbation of Guayaquil—Samborondón—Durán averaged 248.5 hourly degrees, and the Metropolitan District of Quito averaged 28,663.5 hourly degrees.
3.2.2. Cooling Degrees
As for cooling degree hours, there was a greater differentiation among the areas according to the 80% acceptability. For the current climate scenario, 14 parishes had no cooling demand according to the adaptive comfort model, with 18 locations demanding less than 200 cooling degree hours, i.e., 47% of the case studies. Likewise, 11 locations required more than 800 units, and only three locations obtained more than 1000 cooling degree hours: Machala, Pasaje, and Santa Rosa, with 1483.1, 1437.1, and 1408.5 units, respectively. The conurbation Guayaquil—Samborondón—Eloy Alfaro (Durán) averaged 879 units for the current climate scenario, whereas the Metropolitan District of Quito did not present any demand.
The same tendency took place for 2050, where 27% of the locations did not require cooling degree hours, i.e., the same amount than in the current climate scenario. In RCP 2.6, a total of 16 locations required less than 200 degree hours, in comparison with the 17 locations in RCP 4.5 and RCP 8.5, where the number of parishes requiring more than 800 units increased to 18. The number of locations that required more than 2000 cooling degree hours increased to four: Santa Rosa, Machala, Pasaje, and Milagro, with 2823.1, 2778.8, 2745.3, and 2045.3, respectively. Equally, the Metropolitan District of Quito did not present any demand, and the conurbation of Guayaquil—Samborondón—Eloy Alfaro (Durán) averaged 1611.8 units.
For the 2100 scenario, 42% of parishes in RCP 2.6, 53% in RCP 4.5 and 63% in RCP 8.5 required more than 800 cooling degree hours, and 2, 14, and 23 locations obtained a demand greater than 2000 in each scenario, respectively. Thus, 37% of locations did not require cooling units in RCP 2.6 and RCP 4.5, whereas this percentage was reduced to 18% in RCP 8.5. In the most unfavourable scenario, i.e., RCP 8.5, there was an average demand of 0.50 cooling degree hours for the Metropolitan District of Quito, whereas the conurbation of Guayaquil—Samborondón—Eloy Alfaro (Durán) averaged 3164.2 units among the three scenarios, i.e., an increase of 96.31% in comparison with 2050, as Figure 7 shows.
Given its geographic situation, Ecuador has many climates, as the 38 locations selected for this study have shown, so results were very different among areas. Some papers have studied climate behaviours in various regions of the country, but no adaptive comfort model was used. The behaviours of the various regions of Ecuador were studied, and the results were presented in tables and maps for better understanding. The main conclusion was that the location provided the country with a climate diversity, and this condition allowed the adaptive comfort model to be applied in all the locations studied. The reason was that temperatures in the parishes slightly varied during the seasons because, as aforementioned, there was no significant difference among seasons in Ecuador, only distinguishing more rainy periods. Likewise, the results showed a similar tendency according to the geographic location of parishes, distinguishing three main regions: the Coast, the Sierra, and the Amazon.
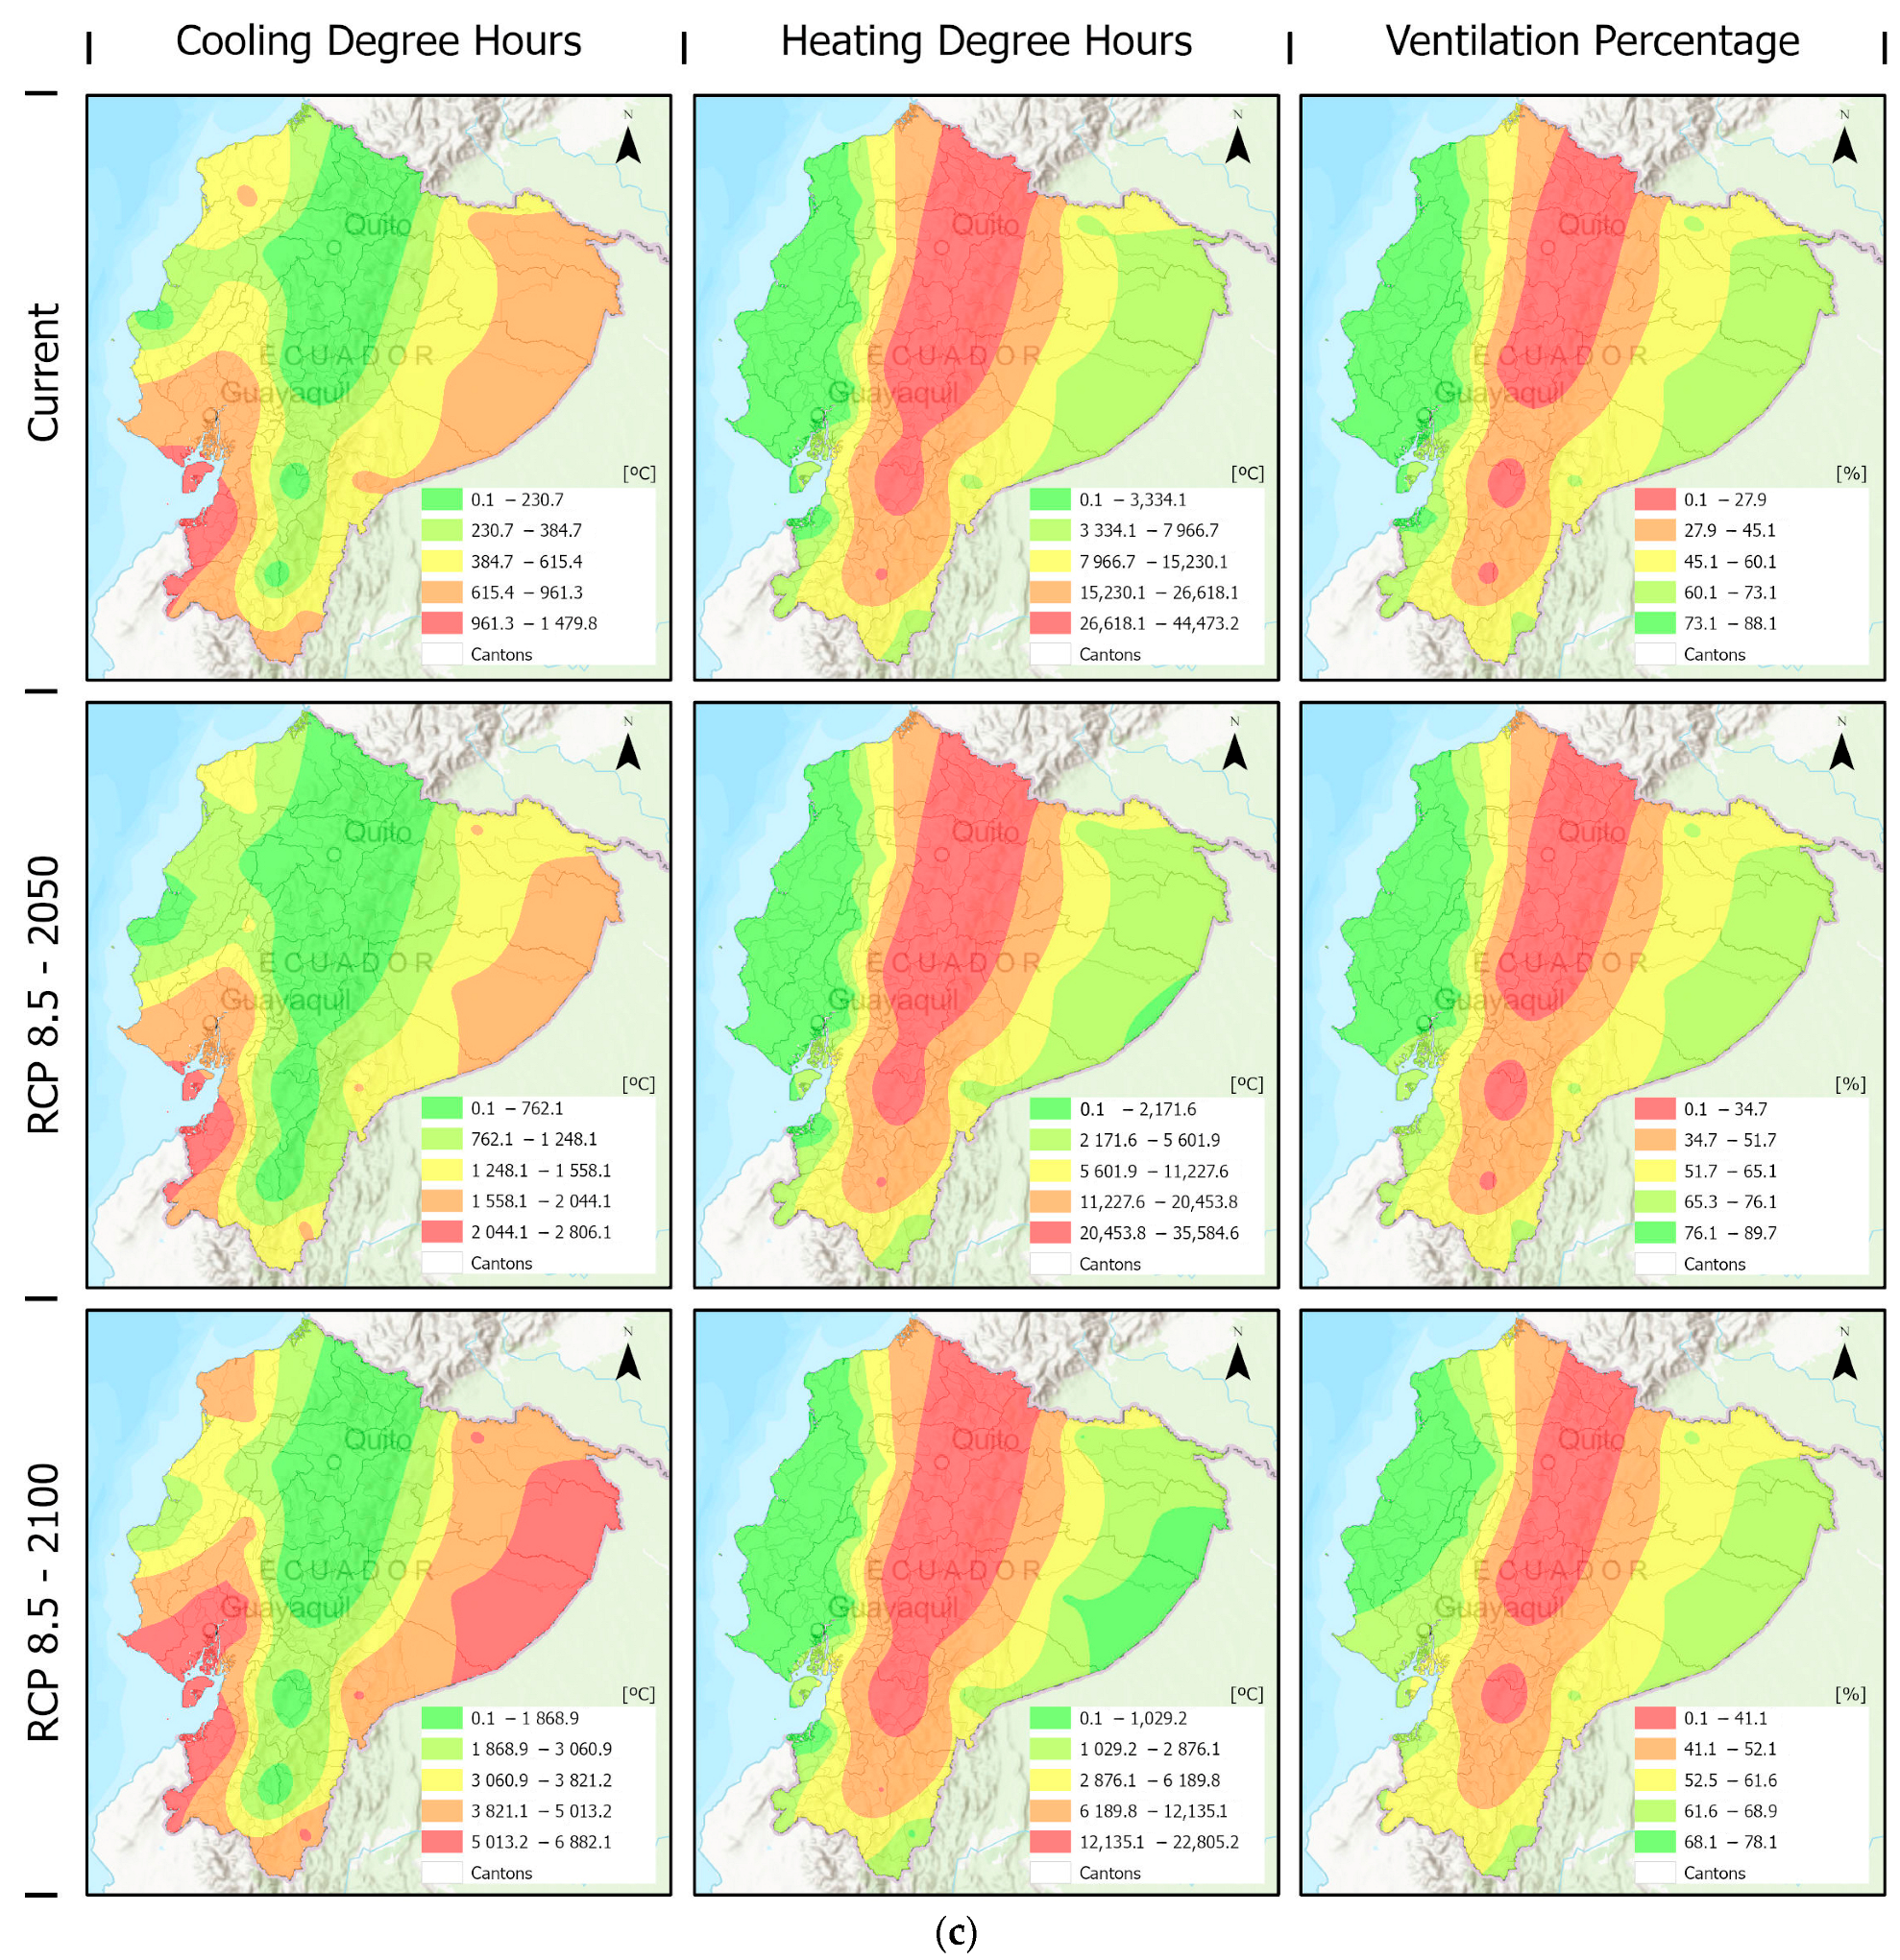
Figure 8 includes the result of the current climate scenario: the areas with greater cooling demand did not obtain significant heating demand, but high percentages of natural ventilation, such as Machala, Pasaje, and Santa Rosa, which are very close to each other. Manta, Montecristi, and Portoviejo were also stressed because these parishes presented the most favourable conditions: their percentages of application of natural ventilation were greater than 80%, and they presented the lowest cooling and heating demands.
Figure 8 shows a tendency that was repeated in the locations according to each area, so the parishes on the coast had similar results as their percentage of application of natural ventilation was greater in the climate scenarios. According to RCP 8.5, the most unfavourable area for natural ventilation, i.e., the inter-Andean region, increased the percentage progressively in 2050 and 2100 (Figure 8).
Figure 8 also shows that, apart from improving the percentage of natural ventilation with the climate change scenarios in the inter-Andean area, heating degree hours were also improved by reducing that consumption, with the Coast and the Amazon obtaining low values in all the scenarios. On the other hand, cooling degree hours increased as time passed, so the critical points were mainly observed in the Gulf of Guayaquil and in the Amazon. This graph shows that conditions vary according to the altitude and the location of parishes, with the conditions of each region of the country being distinguished and observing the marked difference between the Coast, the Sierra, and the Amazon.
In the case of natural ventilation, it can be observed that the climatic variability of the studied territory means that there are lower ranges of ventilation percentages throughout the country, unlike other cases such as Japan, where the percentages of applicability are much more varied [52]. On the other hand, there are studies such as the one carried out in the south of Chile, where it is observed that comfort ranges are established at lower temperatures, which supports the ability of people to adapt according to the case [32]. There are studies on the ability to adapt to temperature changes in spaces intended for various uses, as in a study conducted in Taiwan. In this case, the results are related to the perception of the users where it is observed that the sensation can be regulated by adding or decreasing layers of clothing according to the season [64].
Likewise, regarding the study of climate change, there are other authors who agree that the trend is a decrease in HHDs and an increase in CHDs, as in the case of the USA, Canada, and all over Europe [65,66,67].
These data could be the premise for further studies in which passive strategies are used to improve indoor comfort in dwellings at a regional level.
3.3. Implications for Practice and Future Research
This research has implications in the revision of the climate zoning of Ecuador’s construction guidelines and regulations. It also serves as a basis for future research by the authors with a comparison between RCPs and Shared Socioeconomic Pathways (SSPs), as well as the evaluation of building performance applying adaptive comfort models. It is important to note that this document has limitations because the results have been obtained with climate projections, and different results may be obtained according to the constant changes in the lifestyle of the population.
4. Conclusions
Ecuador, due to its geographical location and climatic characteristics, has a 100% applicability of adaptive comfort models in accordance with the ASHRAE 55 standard, since the areas studied have average temperatures that do not fall below 10 °C nor exceed 33.5 °C.
This study aimed to show the effectiveness of applying the natural ventilation model, as well as cooling and heating demands in degree hours. It is intended to be the premise for further works on passive strategies to improve building indoor comfort in the region.
Significant percentages of application of natural ventilation were shown in most locations, obtaining a clear difference between the locations on the Coast and in the Amazon in contrast to the locations in the Sierra: these locations obtained the lowest percentage of application of natural ventilation as lower temperatures were recorded throughout the year. These data were complemented when the results showed heating demands in all locations, with those in the Oceanic climate, i.e., Cfb, obtaining a demand greater than 30 times in comparison with the other regions. On the other hand, cooling demand was low because 18 locations reported low or null cooling demands.
There are heating demands in all the study areas, highlighting the marked difference between the values obtained in the Highland areas, which in all cases require more than 40,000 degrees per hour. In the case of cooling demand, it is observed that it is not required in all localities, but only in the Coastal and Amazon areas, in which case they never exceed 2500 degrees per hour of annual demand.
Climate change in 2050 and 2100 will not negatively affect all locations because it is expected to increase the percentages of application of natural ventilation and reduce heating degree hours in all parishes. When temperatures increase, the number of cooling degree hours also increases, but this does not mean a greater discomfort level in the locations requiring it because the increase is lower in comparison with heating reduction. Even in the most unfavourable climate scenario (2100), 40% of the locations are not expected to record cooling degree hours for the adaptive comfort model, i.e., with the 80% acceptability.
Future analyses should be performed because climate scenarios have been accepted and disseminated by the scientific community, but population movements could change these approaches that today indicate that all the Ecuadorian territory has a high potential of application of adaptive comfort models.
It has been observed that energy demands vary over the years in all cases, especially in cooling demands, since in the projections to 2100, all localities will demand cooling consumption, unlike the values obtained in the current climatic situation. However, heating demands are always higher in all locations.
After showing that the low thermal amplitude of Ecuador was also maintained in climate change projections, there was also a great potential in the country to apply various improvement strategies, according to the regions also stressed by the areas in maps. In the Sierra, the characteristics of the envelope should be paid more attention because there was high cooling demand, thus preventing from taking advantage of natural ventilation. On the other hand, natural ventilation could be used on the Coast to improve comfort and reduce cooling demand. The Amazon did not show the same potential of application of natural ventilation as the Coast, but there were similar tendencies regarding cooling and heating demands.
These results can set a precedent for a future study in which a new climate classification in the country can be proposed according to both the data obtained and the similarity presented by several locations regarding the use of adaptive comfort model and heating and cooling consumption.
This paper has been developed as part of a broader research on the behaviour of climatic zones in Ecuador to be used to improve thermal comfort. Thus, with the data obtained, a starting line can be established for future applications in buildings in the region. Although the degrees of heating and cooling are usually used for the establishment of climatic zones, degree hours have been used so that the results can later be used in decision-making when applying passive strategies for the improvement of thermal comfort, which, as has been seen in this document, Ecuador’s climatic characteristics and low temperature variability mean that the application of this type of model has benefits over active HVAC systems.
Author Contributions
Conceptualisation, E.D.-G.; methodology, E.D.-G. and D.B.-H.; software, E.D.-G. and D.B.-H.; validation, E.D.-G.; formal analysis, J.C.; investigation, E.D.-G.; writing—original draft preparation, E.D.-G.; writing—review and editing, J.C.; visualisation, F.M.H.-S.; supervision, J.C. All authors have read and agreed to the published version of the manuscript.
Funding
This research received no external funding.
Data Availability Statement
Data are contained within the article.
Acknowledgments
Evelyn Delgado-Gutierrez wishes to thank the support of the Ministerio de Ciencia, Innovación y Universidades of Spain under an FPU grant. The authors also gratefully acknowledge the financial support of the University of Seville via a pre-doctorate contract granted to Francisco M. Hidalgo-Sánchez (VIPPIT-2020-IV-3). This study has been supported by the Spanish Ministry of Science and Innovation, under the research project PID2021-122437OA-I00 “Positive Energy Buildings Potential for Climate Change Adaptation and Energy Poverty Mitigation (+ENERPOT)”.
Conflicts of Interest
The authors declare no conflicts of interest.
References
- Asamblea Nacional de la Repúbica del Ecuador. Código Orgánico de Organización Territorial, Autonomía y Descentralización, COOTAD; Asamblea Nacional de la Repúbica del Ecuador: Quito, Ecuador, 2019.
- Instituto Nacional de Estadísticas y Censos Censo de Población y Vivienda—Ecuador 2010. Available online: https://www.ecuadorencifras.gob.ec/censo-de-poblacion-y-vivienda/ (accessed on 27 September 2022).
- Peel, M.C.; Finlayson, B.L.; McMahon, T.A. Updated World Map of the Köppen-Geiger Climate Classification. Hydrol. Earth Syst. Sci. 2007, 11, 1633–1644. [Google Scholar] [CrossRef]
- Chimborazo, O.; Vuille, M. Present-Day Climate and Projected Future Temperature and Precipitation Changes in Ecuador. Theor. Appl. Climatol. 2021, 143, 1581–1597. [Google Scholar] [CrossRef]
- Delgado, D.; Sadaoui, M.; Ludwig, W.; Méndez, W. Spatio-Temporal Assessment of Rainfall Erosivity in Ecuador Based on RUSLE Using Satellite-Based High Frequency GPM-IMERG Precipitation Data. Catena 2022, 219, 106597. [Google Scholar] [CrossRef]
- ONU HABITAT. Déficit Habitacional En América Latina y El Caribe; UN-Habitat: Nairobi, Kenya, 2015; ISBN 978-92-1-132648-2. [Google Scholar]
- Desarrollo, B.I. de Estudio Del BID: América Latina y El Caribe Encaran Creciente Déficit de Vivienda. Available online: https://www.iadb.org/es/noticias/estudio-del-bid-america-latina-y-el-caribe-encaran-creciente-deficit-de-vivienda#getNews(9969,’’)%23 (accessed on 21 March 2021).
- Ministerio de Desarrollo Urbano y Vivienda. Proyecto de Vivienda Casa Para Todos-CPT. Proyecto de Vivienda Casa Para Todos-CPT; Ministerio de Desarrollo Urbano y Vivienda República del Ecuador: Quito, Ecuador, 2018.
- García, R. Pobreza Energética En América Latina. Com. Económica Para América Lat. y el Caribe 2014, 36. Available online: https://repositorio.cepal.org/items/30533fbd-4fb1-425a-8745-a3f03532e872 (accessed on 27 September 2022).
- Fan, Z.; Bai, R.; Yue, T. Scenarios of Land Cover in Eurasia under Climate Change. J. Geogr. Sci. 2020, 30, 3–17. [Google Scholar] [CrossRef]
- Leng, G. Keeping Global Warming within 1.5 °C Reduces Future Risk of Yield Loss in the United States: A Probabilistic Modeling Approach. Sci. Total Environ. 2018, 644, 52–59. [Google Scholar] [CrossRef] [PubMed]
- Vuille, M. Climate Change and Water Resources in the Tropical Andes; Inter-American Development Bank: Washington, DC, USA, 2013. [Google Scholar]
- García-Ochoa, J.; Quito-Rodríguez, J.; Perdomo Moreno, J.A. Análisis de La Huella de Carbono En La Construcción y Su Impacto Sobre El Ambiente; Villavicencio Universidad Cooperativa de Colombia: Bogota, Colombia, 2020; Volume 22. [Google Scholar]
- Alonso, A.; Calama-González, C.M.; Suárez, R.; León-Rodríguez, Á.L.; Hernández-Valencia, M. Improving Comfort Conditions as an Energy Upgrade Tool for Housing Stock: Analysis of a House Prototype. Energy Sustain. Dev. 2022, 66, 209–221. [Google Scholar] [CrossRef]
- Vergara, W.; Rios, A.R.; Galindo, L.M.; Gutman, P.; Isbell, P.; Suding, P.H.; Samaniego, J. The Climate and Development Challenge for Latin America and the Caribbean: Options for Climate-Resilient, Low-Carbon Development; Inter-American Development Bank: Washington, DC, USA, 2013; ISBN 978-1-59782-165-0. [Google Scholar]
- Moutinho, V.; Fuinhas, J.A.; Marques, A.C.; Santiago, R. Assessing Eco-Efficiency through the DEA Analysis and Decoupling Index in the Latin America Countries. J. Clean. Prod. 2018, 205, 512–524. [Google Scholar] [CrossRef]
- Sheinbaum, C.; Ruíz, B.J.; Ozawa, L. Energy Consumption and Related CO2 Emissions in Five Latin American Countries: Changes from 1990 to 2006 and Perspectives. Energy 2011, 36, 3629–3638. [Google Scholar] [CrossRef]
- Van der Borght, R.; Pallares Barbera, M. How Urban Spatial Expansion Influences CO2 Emissions in Latin American Countries. Cities 2023, 139, 104389. [Google Scholar] [CrossRef]
- OECD. OECD Environment at a Glance in Latin America and the Caribbean; OECD: Paris, France, 2023; ISBN 9789264995925. [Google Scholar]
- The World Bank. World Development Indicators; The World Bank: Washington, DC, USA, 2023. [Google Scholar]
- MAATE. Cuarta Comunicación Nacional y Segundo Informe Bienal de Actualización del Ecuador a la Convención Marco de las Naciones Unidas Sobre El Cambio Climático. Programa de las Naciones Unidas Para El Desarrollo; Quito. 2022. Available online: https://www.undp.org/es/ecuador/publicaciones/cuarta-comunicacion-nacional-y-segundo-informe-bienal-de-actualizacion-del-ecuador-la-convencion-marco-de-las-naciones-unidas (accessed on 27 March 2023).
- Bassi, A.M.; Baer, A.E. Quantifying Cross-Sectoral Impacts of Investments in Climate Change Mitigation in Ecuador. Energy Sustain. Dev. 2009, 13, 116–123. [Google Scholar] [CrossRef]
- Delgado, D.; Sadaoui, M.; Pacheco, H.; Méndez, W.; Ludwig, W. Interrelations Between Soil Erosion Conditioning Factors in Basins of Ecuador: Contributions to the Spatial Model Construction. In Proceedings of the International Conference on Water Energy Food and Sustainability, Leiria, Portugal, 10–12 May 2021; pp. 892–903. [Google Scholar] [CrossRef]
- Jakob, M. Ecuador’s Climate Targets: A Credible Entry Point to a Low-Carbon Economy? Energy Sustain. Dev. 2017, 39, 91–100. [Google Scholar] [CrossRef]
- Osman, M.M.; Sevinc, H. Adaptation of Climate-Responsive Building Design Strategies and Resilience to Climate Change in the Hot/Arid Region of Khartoum, Sudan. Sustain. Cities Soc. 2019, 47, 101429. [Google Scholar] [CrossRef]
- Rijal, H.B.; Humphreys, M.A.; Nicol, J.F. Adaptive Model and the Adaptive Mechanisms for Thermal Comfort in Japanese Dwellings. Energy Build. 2019, 202, 109371. [Google Scholar] [CrossRef]
- Talukdar, M.S.J.; Talukdar, T.H.; Singh, M.K.; Baten, M.A.; Hossen, M.S. Status of Thermal Comfort in Naturally Ventilated University Classrooms of Bangladesh in Hot and Humid Summer Season. J. Build. Eng. 2020, 32, 101700. [Google Scholar] [CrossRef]
- Kumar, S.; Singh, M.K.; Kukreja, R.; Chaurasiya, S.K.; Gupta, V.K. Comparative Study of Thermal Comfort and Adaptive Actions for Modern and Traditional Multi-Storey Naturally Ventilated Hostel Buildings during Monsoon Season in India. J. Build. Eng. 2019, 23, 90–106. [Google Scholar] [CrossRef]
- Nguyen, A.T.; Singh, M.K.; Reiter, S. An Adaptive Thermal Comfort Model for Hot Humid South-East Asia. Build. Environ. 2012, 56, 291–300. [Google Scholar] [CrossRef]
- López-Pérez, L.A.; Flores-Prieto, J.J.; Ríos-Rojas, C. Adaptive Thermal Comfort Model for Educational Buildings in a Hot-Humid Climate. Build. Environ. 2019, 150, 181–194. [Google Scholar] [CrossRef]
- Rubio-Bellido, C.; Pérez-Fargallo, A.; Pulido-Arcas, J.A.; Trebilcock, M. Application of Adaptive Comfort Behaviors in Chilean Social Housing Standards under the Influence of Climate Change. Build. Simul. 2017, 10, 933–947. [Google Scholar] [CrossRef]
- Pérez-Fargallo, A.; Pulido-Arcas, J.A.; Rubio-Bellido, C.; Trebilcock, M.; Piderit, B.; Attia, S. Development of a New Adaptive Comfort Model for Low Income Housing in the Central-South of Chile. Energy Build. 2018, 178, 94–106. [Google Scholar] [CrossRef]
- Torres-Quezada, J.; Torres Avilés, A.; Isalgue, A.; Pages-Ramon, A. The Evolution of Embodied Energy in Andean Residential Buildings. Methodology Applied to Cuenca-Ecuador. Energy Build. 2022, 259, 111858. [Google Scholar] [CrossRef]
- Balter, J.; Barea, G.; Ganem, C. Improvements in the Energy Performance of Buildings in Summer, through the Integration of Ventilated Envelopes on North-Facing Facades and Roofs. The Case of Mendoza, Argentina. Habitat Sustentable 2020, 10, 94–105. [Google Scholar] [CrossRef]
- Chavez-Rodriguez, M.F.; Carvajal, P.E.; Martinez Jaramillo, J.E.; Egüez, A.; Mahecha, R.E.G.; Schaeffer, R.; Szklo, A.; Lucena, A.F.P.; Arango Aramburo, S. Fuel Saving Strategies in the Andes: Long-Term Impacts for Peru, Colombia and Ecuador. Energy Strateg. Rev. 2018, 20, 35–48. [Google Scholar] [CrossRef]
- Diz-Mellado, E.; López-Cabeza, V.P.; Rivera-Gómez, C.; Galán-Marín, C.; Rojas-Fernández, J.; Nikolopoulou, M. Extending the Adaptive Thermal Comfort Models for Courtyards. Build. Environ. 2021, 203, 108094. [Google Scholar] [CrossRef]
- AC08024865; Ergonomics of the Thermal Environment Analytical Determination and Interpretation of Thermal Comfort Using Calculation of the PMV and PPD Indices and Local Thermal Comfort Criteria. ISO: Geneva, Switzerland, 2005.
- Yao, R.; Zhang, S.; Du, C.; Schweiker, M.; Hodder, S.; Olesen, B.W.; Toftum, J.; Romana d’Ambrosio, F.; Gebhardt, H.; Zhou, S.; et al. Evolution and Performance Analysis of Adaptive Thermal Comfort Models—A Comprehensive Literature Review. Build. Environ. 2022, 217, 109020. [Google Scholar] [CrossRef]
- Sarihi, S.; Mehdizadeh Saradj, F.; Faizi, M. A Critical Review of Façade Retrofit Measures for Minimizing Heating and Cooling Demand in Existing Buildings. Sustain. Cities Soc. 2021, 64, 102525. [Google Scholar] [CrossRef]
- Chang, M.; Thellufsen, J.Z.; Zakeri, B.; Pickering, B.; Pfenninger, S.; Lund, H.; Østergaard, P.A. Trends in Tools and Approaches for Modelling the Energy Transition. Appl. Energy 2021, 290, 116731. [Google Scholar] [CrossRef]
- Ramon, D.; Allacker, K.; De Troyer, F.; Wouters, H.; van Lipzig, N.P.M. Future Heating and Cooling Degree Days for Belgium under a High-End Climate Change Scenario. Energy Build. 2020, 216, 109935. [Google Scholar] [CrossRef]
- Rupp, R.F.; Parkinson, T.; Kim, J.; Toftum, J.; de Dear, R. The Impact of Occupant’s Thermal Sensitivity on Adaptive Thermal Comfort Model. Build. Environ. 2022, 207, 108517. [Google Scholar] [CrossRef]
- Parkinson, T.; de Dear, R.; Brager, G. Nudging the Adaptive Thermal Comfort Model. Energy Build. 2020, 206, 109559. [Google Scholar] [CrossRef]
- The American Society of Heating, Refrigerating and Air-Conditioning Engineers. Thermal Environmental Conditions for Human Occupancy 55-2004; American Society of Heating, Refrigerating and Air-Conditioning Engineers: Atlanta, GA, USA, 2004; pp. 1–34. [Google Scholar]
- The American Society of Heating, Refrigerating and Air-Conditioning Engineers. Standard 55—Thermal Environmental Conditions for Human Occupancy. 2023. Available online: https://www.ashrae.org/technical-resources/bookstore/standard-55-thermal-environmental-conditions-for-human-occupancy (accessed on 28 January 2023).
- Luisa, M.; Hoz-torres, D.; Aguilar, A.J.; Ruiz, D.P.; Martínez-aires, D. An Investigation of Indoor Thermal Environments and Thermal Comfort in Naturally Ventilated Educational Buildings. J. Build. Eng. 2024, 84, 108677. [Google Scholar] [CrossRef]
- Sánchez-García, D.; Bienvenido-Huertas, D.; Pulido-Arcas, J.A.; Rubio-Bellido, C. Extending the Use of Adaptive Thermal Comfort to Air-Conditioning: The Case Study of a Local Japanese Comfort Model in Present and Future Scenarios. Energy Build. 2023, 285, 112901. [Google Scholar] [CrossRef]
- Albatayneh, A.; Jaradat, M.; Alkhatib, M.B.; Abdallah, R.; Juaidi, A.; Manzano-Agugliaro, F. The Significance of the Adaptive Thermal Comfort Practice over the Structure Retrofits to Sustain Indoor Thermal Comfort. Energies 2021, 14, 2946. [Google Scholar] [CrossRef]
- UNE-EN 16798-1; Eficiencia Energética de Los Edificios. Ventilación de Los Edificios. Parte 1: Parámetros Del Ambiente Interior a Considerar Para El Diseño y La Evaluación de La Eficiencia Energética de Edificios Incluyendo La Calidad Del Aire Interior, Condiciones Térmi. Asociación Española de Normalización: Madrid, Spain, 2020.
- Bienvenido-Huertas, D.; Rubio-Bellido, C.; Pérez-Fargallo, A.; Pulido-Arcas, J.A. Energy Saving Potential in Current and Future World Built Environments Based on the Adaptive Comfort Approach. J. Clean. Prod. 2020, 249, 119306. [Google Scholar] [CrossRef]
- Sánchez-García, D.; Bienvenido-Huertas, D.; Tristancho-Carvajal, M.; Rubio-Bellido, C. Adaptive Comfort Control Implemented Model (ACCIM) for Energy Consumption Predictions in Dwellings under Current and Future Climate Conditions: A Case Study Located in Spain. Energies 2019, 12, 1498. [Google Scholar] [CrossRef]
- Bienvenido-Huertas, D.; Pulido-Arcas, J.A.; Rubio-Bellido, C.; Pérez-Fargallo, A. Influence of Future Climate Changes Scenarios on the Feasibility of the Adaptive Comfort Model in Japan. Sustain. Cities Soc. 2020, 61, 102303. [Google Scholar] [CrossRef]
- Emori, S.; Taylor, K.; Hewitson, B.; Zermoglio, F.; Juckes, M.; Lautenschlager, M.; Stockhause, M. CMIP5 Data Provided at the IPCC Data Distribution Centre; IPCC: Geneva, Switzerland, 2016. [Google Scholar]
- IPCC. Contribution of Working Groups I, II and III to the Fifth Assessment Report of the Intergovernmental Panel on Climate Change. In Climate Change 2014 Synthesis Report; Core Writing Team, Ed.; IPCC: Geneva, Switzerland, 2015; Volume 34, 151p, ISBN 9789291691432. [Google Scholar]
- Lee, H.; Calvin, K.; Dasgupta, D.; Krinner, G.; Mukherji, A.; Thorne, P.; Trisos, C.; Romero, J.; Aldunce, P.; Barrett, K.; et al. IPCC Sixth Assessment Report—Synthesis Report; IPCC: Geneva, Switzerland, 2022; ISBN 9789291691647. [Google Scholar]
- Baek, H.J.; Lee, J.; Lee, H.S.; Hyun, Y.K.; Cho, C.; Kwon, W.T.; Marzin, C.; Gan, S.Y.; Kim, M.J.; Choi, D.H.; et al. Climate Change in the 21st Century Simulated by HadGEM2-AO under Representative Concentration Pathways. Asia-Pac. J. Atmos. Sci. 2013, 49, 603–618. [Google Scholar] [CrossRef]
- Ascione, F.; Bianco, N.; Mauro, G.M.; Napolitano, D.F. Effects of Global Warming on Energy Retrofit Planning of Neighborhoods under Stochastic Human Behavior. Energy Build. 2021, 250, 111306. [Google Scholar] [CrossRef]
- Sun, T.; Zanocco, C.; Flora, J.; Johnson, S.; Soto, H.J.; Rajagopal, R. Cooling-Related Electricity Consumption Patterns for Small and Medium Businesses in California: Current Impacts and Future Projections under Climate Change. Energy Build. 2023, 295, 113301. [Google Scholar] [CrossRef]
- Beck, H.E.; Zimmermann, N.E.; McVicar, T.R.; Vergopolan, N.; Berg, A.; Wood, E.F. Present and Future Köppen-Geiger Climate Classification Maps at 1-Km Resolution. Sci. Data 2018, 5, 180214. [Google Scholar] [CrossRef]
- Carver, S.; Mikkelsen, N.; Woodward, J. Long-Term Rates of Mass Wasting in Mesters Vig, Northeast Greenland: Notes on a Re-Survey. Permafr. Periglac. Process. 2002, 13, 243–249. [Google Scholar] [CrossRef]
- Kottek, M.; Grieser, J.; Beck, C.; Rudolf, B.; Rubel, F. World Map of the Köppen-Geiger Climate Classification Updated. Meteorol. Z. 2006, 15, 259–263. [Google Scholar] [CrossRef] [PubMed]
- Cui, D.; Liang, S.; Wang, D. Observed and Projected Changes in Global Climate Zones Based on Köppen Climate Classification. Wiley Interdiscip. Rev. Clim. Chang. 2021, 12, e701. [Google Scholar] [CrossRef]
- Bienvenido-Huertas, D.; Rubio-Bellido, C. Application of Adaptive Thermal Comfort Models for Energy Saving in Buildings. In Adaptive Thermal Comfort of Indoor Environment for Residential Buildings; Springer: Berlin/Heidelberg, Germany, 2021; pp. 35–50. [Google Scholar]
- Hwang, R.L.; Lin, T.P.; Chen, C.P.; Kuo, N.J. Investigating the Adaptive Model of Thermal Comfort for Naturally Ventilated School Buildings in Taiwan. Int. J. Biometeorol. 2009, 53, 189–200. [Google Scholar] [CrossRef] [PubMed]
- Larsen, M.A.D.; Petrović, S.; Radoszynski, A.M.; McKenna, R.; Balyk, O. Climate Change Impacts on Trends and Extremes in Future Heating and Cooling Demands over Europe. Energy Build. 2020, 226, 110397. [Google Scholar] [CrossRef]
- Jafarpur, P.; Berardi, U. Effects of Climate Changes on Building Energy Demand and Thermal Comfort in Canadian Office Buildings Adopting Different Temperature Setpoints. J. Build. Eng. 2021, 42, 102725. [Google Scholar] [CrossRef]
- Petri, Y.; Caldeira, K. Impacts of Global Warming on Residential Heating and Cooling Degree-Days in the United States. Sci. Rep. 2015, 5, 12427. [Google Scholar] [CrossRef]
Figure 1.
Upper and lower limits considered in the adaptive comfort model with the 80% acceptability.
Figure 1.
Upper and lower limits considered in the adaptive comfort model with the 80% acceptability.

Figure 2.
The regions of Ecuador and location of the 38 points used in this study.

Figure 3.
(a) Population density of locations according to the climatic distribution. (b) Average current annual temperature of locations.
Figure 3.
(a) Population density of locations according to the climatic distribution. (b) Average current annual temperature of locations.

Figure 4.
Percentage of days of the year to apply the adaptive thermal comfort model by natural ventilation using the 80% category in Ecuador. Comparison between current climate scenario, 2050, and 2100 in each global warming scenario.
Figure 4.
Percentage of days of the year to apply the adaptive thermal comfort model by natural ventilation using the 80% category in Ecuador. Comparison between current climate scenario, 2050, and 2100 in each global warming scenario.

Figure 5.
Percentage of days of the year to apply the adaptive thermal comfort by natural ventilation in accordance with the optimal temperature in Ecuador. Comparison between current climate scenario, 2050, and 2100 in each global warming scenario.
Figure 5.
Percentage of days of the year to apply the adaptive thermal comfort by natural ventilation in accordance with the optimal temperature in Ecuador. Comparison between current climate scenario, 2050, and 2100 in each global warming scenario.

Figure 6.
Hourly degrees with heating demand according to the 80% acceptability in Ecuador. Comparison between current climate scenario, 2050, and 2100 in each global warming scenario.
Figure 6.
Hourly degrees with heating demand according to the 80% acceptability in Ecuador. Comparison between current climate scenario, 2050, and 2100 in each global warming scenario.

Figure 7.
Degree hours with cooling demand according to the 80% acceptability in Ecuador. Comparison between current climate scenario, 2050, and 2100 in each global warming scenario.
Figure 7.
Degree hours with cooling demand according to the 80% acceptability in Ecuador. Comparison between current climate scenario, 2050, and 2100 in each global warming scenario.

Figure 8.
Comparison between degree hours [°C] with heating and cooling demand and the percentage of days of the year [%] with the possibility of using natural ventilation strategies of the 80% category in Ecuador in current and future climate change scenarios in 2050 and 2100: (a) RCP 2.6 comparison; (b) RCP 4.5 comparison; (c) RCP 8.5 comparison.


Table 1.
Description of locations, population, area, and type of climate.
| Province | Location | Population | Köppen Distribution | Characteristics | |
|---|---|---|---|---|---|
| Tungurahua | Ambato | 178,538 | Cfb | Oceanic climate | Cold or mild winters and cool summers. Rainfall is well distributed throughout the year. Lush forests |
| Pichincha | Calderon (Carapungo) | 152,242 | Cfb | ||
| Pichincha | Cayambe | 50,829 | Cfb | ||
| Pichincha | Conocoto | 82,072 | Cfb | ||
| Azuay | Cuenca | 331,888 | Cfb | ||
| Cotopaxi | Latacunga | 98,355 | Cfb | ||
| Loja | Loja | 180,617 | Cfb | ||
| Imbabura | Otavalo | 52,753 | Cfb | ||
| Pichincha | Quito | 1,619,146 | Cfb | ||
| Chimborazo | Riobamba | 156,723 | Cfb | ||
| Imbabura | San Miguel de Ibarra | 139,721 | Cfb | ||
| Pichincha | Sangolqui | 81,140 | Cfb | ||
| Carchi | Tulcan | 60,403 | Cfb | ||
| Los Rios | Babahoyo | 96,956 | Aw | Tropical Savanna climate | Warm all year round, with dry season |
| Guayas | Balzar | 53,937 | Aw | ||
| Manabi | Chone | 74,906 | Aw | ||
| Guayas | Daule | 87,508 | Aw | ||
| Guayas | Eloy Alfaro (Durán) | 235,769 | Aw | ||
| Esmeraldas | Esmeraldas | 161,868 | Aw | ||
| Guayas | Guayaquil | 2,291,158 | Aw | ||
| Guayas | Milagro | 145,025 | Aw | ||
| El Oro | Pasaje | 53,485 | Aw | ||
| Los Rios | Quevedo | 158,694 | Aw | ||
| Guayas | Samborondon | 51,634 | Aw | ||
| Los Rios | Vinces | 55,443 | Aw | ||
| Manabi | El Carmen | 77,743 | Am | Tropical monsoon climate | Warm all year round, with a short dry season followed by a wet season with heavy rainfall. Monsoon forests |
| Esmeraldas | Rosa Zarate (Quininde) | 67,259 | Am | ||
| Los Rios | San Jacinto De Buena Fe | 50,870 | Am | ||
| Santo Domingo | Santo Domingo De Los Colorados | 305,632 | Am | ||
| Bolivar | Guaranda | 55,374 | Cwb | Temperate with dry winters | Cold or mild winters and cool summers. Summers are rainy and winters are dry |
| Santa Elena | La Libertad | 95,942 | BWh | Hot Desert | Winters are mild, although inland temperatures can approach zero degrees at night. Summers are either warm or very hot |
| Manabi | Manta | 221,122 | BWh | ||
| Manabi | Montecristi | 67,842 | BWh | ||
| Santa Elena | Santa Elena | 53,174 | BWh | ||
| El Oro | Machala | 241,606 | BSh | Semi-arid hot | Winters are mild and summers are warm or very warm. Rainfall is scarce. The natural vegetation is steppe |
| Manabi | Portoviejo | 223,086 | BSh | ||
| El Oro | Santa Rosa | 52,863 | BSh | ||
| Sucumbios | Nueva Loja | 57,727 | Af | Tropical equatorial climate | Warm and rainy all year, with no seasons. Rainforest climate |
Disclaimer/Publisher’s Note: The statements, opinions and data contained in all publications are solely those of the individual author(s) and contributor(s) and not of MDPI and/or the editor(s). MDPI and/or the editor(s) disclaim responsibility for any injury to people or property resulting from any ideas, methods, instructions or products referred to in the content. |
© 2024 by the authors. Licensee MDPI, Basel, Switzerland. This article is an open access article distributed under the terms and conditions of the Creative Commons Attribution (CC BY) license (https://creativecommons.org/licenses/by/4.0/).
Share and Cite
MDPI and ACS Style
Delgado-Gutierrez, E.; Canivell, J.; Bienvenido-Huertas, D.; Hidalgo-Sánchez, F.M. Adaptive Comfort Potential in Different Climate Zones of Ecuador Considering Global Warming. Energies 2024, 17, 2017. https://doi.org/10.3390/en17092017
AMA Style
Delgado-Gutierrez E, Canivell J, Bienvenido-Huertas D, Hidalgo-Sánchez FM. Adaptive Comfort Potential in Different Climate Zones of Ecuador Considering Global Warming. Energies. 2024; 17(9):2017. https://doi.org/10.3390/en17092017
Chicago/Turabian StyleDelgado-Gutierrez, Evelyn, Jacinto Canivell, David Bienvenido-Huertas, and Francisco M. Hidalgo-Sánchez. 2024. "Adaptive Comfort Potential in Different Climate Zones of Ecuador Considering Global Warming" Energies 17, no. 9: 2017. https://doi.org/10.3390/en17092017
Note that from the first issue of 2016, this journal uses article numbers instead of page numbers. See further details here.