

Assessing the Costs of Commercialising Tidal Energy in the UK

School of Engineering, Institute for Energy Systems, The University of Edinburgh, Edinburgh EH9 3DW, UK
*
Author to whom correspondence should be addressed.
Energies 2024, 17(9), 2085; https://doi.org/10.3390/en17092085
Submission received: 10 March 2024
/
Revised: 4 April 2024
/
Accepted: 23 April 2024
/
Published: 26 April 2024
(This article belongs to the Section C: Energy Economics and Policy)
Abstract
:There is a need for increased renewable energy to meet net-zero targets and decarbonise the economy. Harnessing the predictable power of the tides with tidal stream turbines can contribute to this. Tidal energy is a nascent technology with higher costs at present. However, cost reductions have been observed with an increased deployment in other renewable energy technologies that have received financial support, and it is postulated that similar will happen with tidal energy. The first tidal stream projects have been awarded market support in the UK through the Contracts for Difference (CfD) scheme, with almost 100 MW expected to be commissioned by 2028. This work uses learning rates to investigate how much investment in ongoing market support might be needed to achieve cost reductions through subsidised deployment alongside research and innovation. Using a range of informed ‘what if?’ scenarios, it shows sensitivity to key inputs. The results show that the support needed is most sensitive to the learning rate, reducing it from 15% to 12.5% or 10% doubles or more than quadruples the investment required, respectively. The support is also highly dependent on the starting cost from which learning occurs, taken as the CfD Strike Price in 2025. Varying this between 156 and 220 GBP/MWh results in total investment of GBP 6.7 and 22.3 bn, respectively. Most importantly, a balance is needed between subsidising deployment to drive down costs through learning and funding innovation to maintain a high learning rate.
1. Introduction
In 2019, the UK government committed to a legally binding 100% reduction in greenhouse gas emissions by 2050, compared to a baseline of 1990 levels [1], becoming the first G7 nation to do so. Thus, the UK established itself as a leading nation internationally with regards to climate action. In the intervening years, the UK has been increasingly urged to place the deployment of renewable energy technologies at the centre of its plans for national development [2]. It is becoming increasingly clear that the ongoing energy transition represents a significant opportunity for economic growth, the provision of jobs that fulfil a just transition, energy security and, above all, the ability to significantly respond to the climate crisis.
Achieving these ambitious targets will not be simple, and as outlined by the UK’s Net Zero Strategy (Build Back Greener) [3], the UK Government’s primary climate change policy document, it will require nothing less than the transformation of every sector of the economy. With the electricity and fuel supply sectors collectively contributing more than 18% of UK emissions in 2022 [4], the mass deployment of a range of renewable energy energy sources is a key step towards achieving Net Zero. While the role of wind as the backbone of the future UK energy system is well understood [5], there are a number of more nascent technologies that, given the right support, have an important role to play.
In addition to plentiful wind resources, the UK has a significant tidal resource which, unlike other variable renewable energy technologies, is predictable years in advance, albeit with a cyclical nature [6]. Tidal power can be captured using barrages/lagoons that impound the rising and falling tides (tidal range) or using free-stream turbines that capture the movement of the tides (tidal stream), the latter of which is considered in this work. Recent studies suggest that there could be around 11 GW of exploitable tidal stream energy around the UK coast [6,7]. For context, this is about 3.0–3.9% of the total installed capacity projected by the National Grid Electricity System Operator in 2050 accounting for increased electrification of heating and transport, etc. [5]. The projected future electricity mix for 2030–2050 is shown in Table 1. In addition to being predictable, the tidal resource is also temporally offset from other renewable resources, thus offering potential system benefits as part of a diverse generation mix (e.g., [8,9,10,11,12,13]).
The UK is a global leader in both developing tidal stream technology and the pipeline of future projects, but several other countries are also developing technologies and projects or have ambitions to [15,16]. The IRENA ocean energy database has 2.45 GW of future projects in 15 countries and notes that other countries are actively developing tidal stream technologies [15]. Of the 22 member countries in the International Energy Agency’s technology collaboration programme on Ocean Energy Systems (OES), almost all have some form of national strategy for ocean energy, and 14 of these have one or more market incentives [17]. Globally, OES reports that 12.6 MW of the tidal stream is currently operational in member countries, with 81 MW awarded and under construction [17].
Many different devices have been developed and tested to harness tidal stream energy; the European Marine Energy Centre alone lists 15 tidal clients in its 20 years of operation, the majority of whom have developed multiple iterations of their technology [18]. Various types of tidal energy technologies have been developed, including horizontal and vertical axis turbines, tidal kites, and Archimedes screws, with technology readiness levels (TRLs) of 5–8 [15]. The first tidal stream arrays were installed in the UK in 2016/17 and have been operating since the MeyGen project in the Pentland Firth and Nova Innovation’s Shetland Tidal Array [19] (p. 130). A ringfence for tidal stream projects was introduced in the UK’s Contracts for Difference (CfD) market support mechanism for allocation round 4 in 2022, which resulted in four contracts totalling 40.8 MW being awarded [20]. The following year, a further 11 contracts totalling 53 MW were awarded [21], giving a pipeline for around 100 MW of tidal stream energy to be operational in the UK by 2028.
Despite significant progress in recent decades, tidal stream is still a nascent technology with a relatively high cost of energy at present; although, this is predicted to reduce over time. Cost reductions can occur through learning by doing, incrementally improving a technology as more are developed; they can also result from focused research and innovation. Many studies over the years have modelled cost reduction trajectories for tidal stream or for ocean energy more broadly; however, only a few have calculated the costs of supporting this. Key studies are summarised below with further background in Section 2.
A study by the Carbon Trust [22] as part of the Marine Energy Accelerator looked at potential cost reductions based on input from innovators and consultants. It considered different subsystem improvements to develop cost reduction pathways for wave and tidal stream to 2050. A related study estimating the UK resources by Black & Veatch Ltd. [23] used learning rates for tidal energy of 8–16% together with a step-change cost reduction for second generation technologies. The ORE Catapult [24] used an approach based on learning rates for capital and operational costs (CAPEX and OPEX), plus reductions in the cost of capital as the sector matures. This was updated within the TIGER (Tidal Stream Industry Energiser) project; Frost [25] developed a cost reduction pathway of tidal stream energy in the UK and France that used industry input to forecast deployments and a range of levelised cost of electricity (LCOE) from 2023 to 2035. However, none of these studies calculated the total amount of subsidy required to support these deployments and cost reductions.
An earlier study by the Carbon Trust [26] did consider the amount and cost of subsidised deployment required; however, the methodology used to calculate this is not stated, and the assumptions used are now slightly dated. A sensitivity analysis of the ‘learning investment’ (analogous to the subsidy required) was presented by MacGillivray et al. [27]; although, this only considered CAPEX, given the uncertainty in the project lifetime considerations required to calculate LCOE. Kerr et al. [28] focused on the impact step-change cost reductions from radical innovation could have on the costs of commercialising a technology such as wave energy, showing that high starting costs and low learning rates may lead to an infeasibly large investment required to drive costs down through learning by doing alone. A wider range of scenarios and other considerations were included in related work within the DTOceanPlus (Advanced Design Tools for Ocean Energy Systems Innovation, Development and Deployment) project [29].
Our current work builds on these with the following novelty. It focuses in on an individual country, considering the detailed policies and market funding mechanisms of the UK renewable electricity market. For this, it uses real data from industry auctions to show what the cost to the UK Treasury might be in supporting commercialisation and cost-reduction of tidal stream energy in the UK. Results are presented as total amounts but also highlight how the annual investment required may vary over time. It includes scenarios to quantify recent supply chain cost increases experienced across the wider renewable energy sector, and what this might mean for the investment required for tidal energy. While a case study of tidal stream energy in the UK is presented, the methodology developed and used could also be applied to other countries/markets or technologies, and the overall findings are more widely applicable to these.
The remainder of this article is structured as follows: Relevant background is presented in Section 2, followed by the methodology and model inputs in Section 3. Section 4 presents the results and sensitivities to the input parameters, together with a discussion of what these mean. Finally, conclusions are offered in Section 5.
2. Background
Before introducing the methodology used in this work, requisite background is presented on four areas. Firstly, the historical growth in deployment observed for renewable technologies and what this might mean for tidal stream in the UK. Then, further background on modelling technology cost reductions and learning investment using learning rates is presented, followed by historical learning rates observed for other technologies. Finally, details are given on UK electricity market subsidy.
2.1. Growth in Renewable Energy Deployment
As discussed by Hansen et al. [30], the temporal change in many systems can be described by a logistic or sigmoidal function, characterised by exponential growth up to a limiting factor then the rate of growth slows as capacity asymptotically approaches a limit. They show that this can also describe the deployment of renewable energy technologies.
This exponential growth in deployed capacity has been observed in renewable energy technologies. Both onshore and offshore wind expanded from 10 MW–10 GW over a period of around 20 years in Europe, as shown in Figure 1. A similar pattern could happen with the tidal stream, when considering historical deployments and planned projects [25], together with industry targets [31,32]. Solar PV experienced even faster growth in deployment between 2000 and 2012, but as discussed in Section 2.3, this may not be a good proxy for marine energy, given that billions of individual small-scale solar panels were installed. Other renewable energy technologies have not shown such sustained rapid growth.
2.2. Modelling Cost Reductions and Learning Investment Using Learning Rates
Cost reductions with increasing production have been observed in many sectors, and these can be characterised by experience/learning curves and learning rates, as outlined by many studies (e.g., [38,39,40,41]). Following the approach of Ferioli et al. [38], a mathematical relationship can be developed linking costs C and cumulative production x, Equation (1)
where b is a positive learning parameter, is the cumulative production and the corresponding cost at time t, and are the cost and cumulative production, respectively, at some arbitrary starting point, often taken as the current level. The learning rate , which is the relative (percentage) cost reduction after each doubling in cumulative production, is then given by Equation (2)
where may sometimes be referred to as the ‘Progress Ratio’.
The ‘learning investment’ can be defined as the additional cost required above that of a cheaper incumbent technology (or an average market price), which is proportional to the area between the two learning curves, shown in Figure 2.
In renewable energy applications, learning curves can be established between parameters such as cumulative experience, production (units, MW), deployment (MW), or generation (MWh), and costs expressed as total or CAPEX (GBP, GBP/MW) or as LCOE (GBP/MWh). When calculating learning investment, care must be taken that the units are consistent, noting that the market subsidy is usually paid on energy generated (in GBP/MWh).
Where historical data are available a trend can be fitted and a learning rate determined from this, as discussed in the following Section 2.3; however, it may require several doublings in capacity to accurately determine these.
It is noted that the single factor learning rate used in the modelling is a proxy for multiple sources of cost reduction that may occur alongside increased deployment, as set out in [28]; these include
- Learning by searching—improvements through research and development;
- Learning by doing and learning by using—improvements in product manufacturing mechanisms, labour efficiency, etc.;
- Learning by interacting—improvements in network interactions between research institutes, industry, end users, policy makers, etc., that improve knowledge diffusion;
- Upsizing/downsizing—changing the technology scale may reduce specific costs;
- Economies of scale—product standardisation and upscaling of production facilities.
2.3. Historical Learning Rates for Other Renewable Energy Technologies
Historical cost reduction depends significantly on the scope of the assessment, the timing, technology status, and the supporting policies in place. A selection of learning rates from different sources is shown here to give context to the values used in this work. While these cannot be used to predict what will happen in future, they have been used to guide reasonable assumptions of what could happen with suitable support policies.
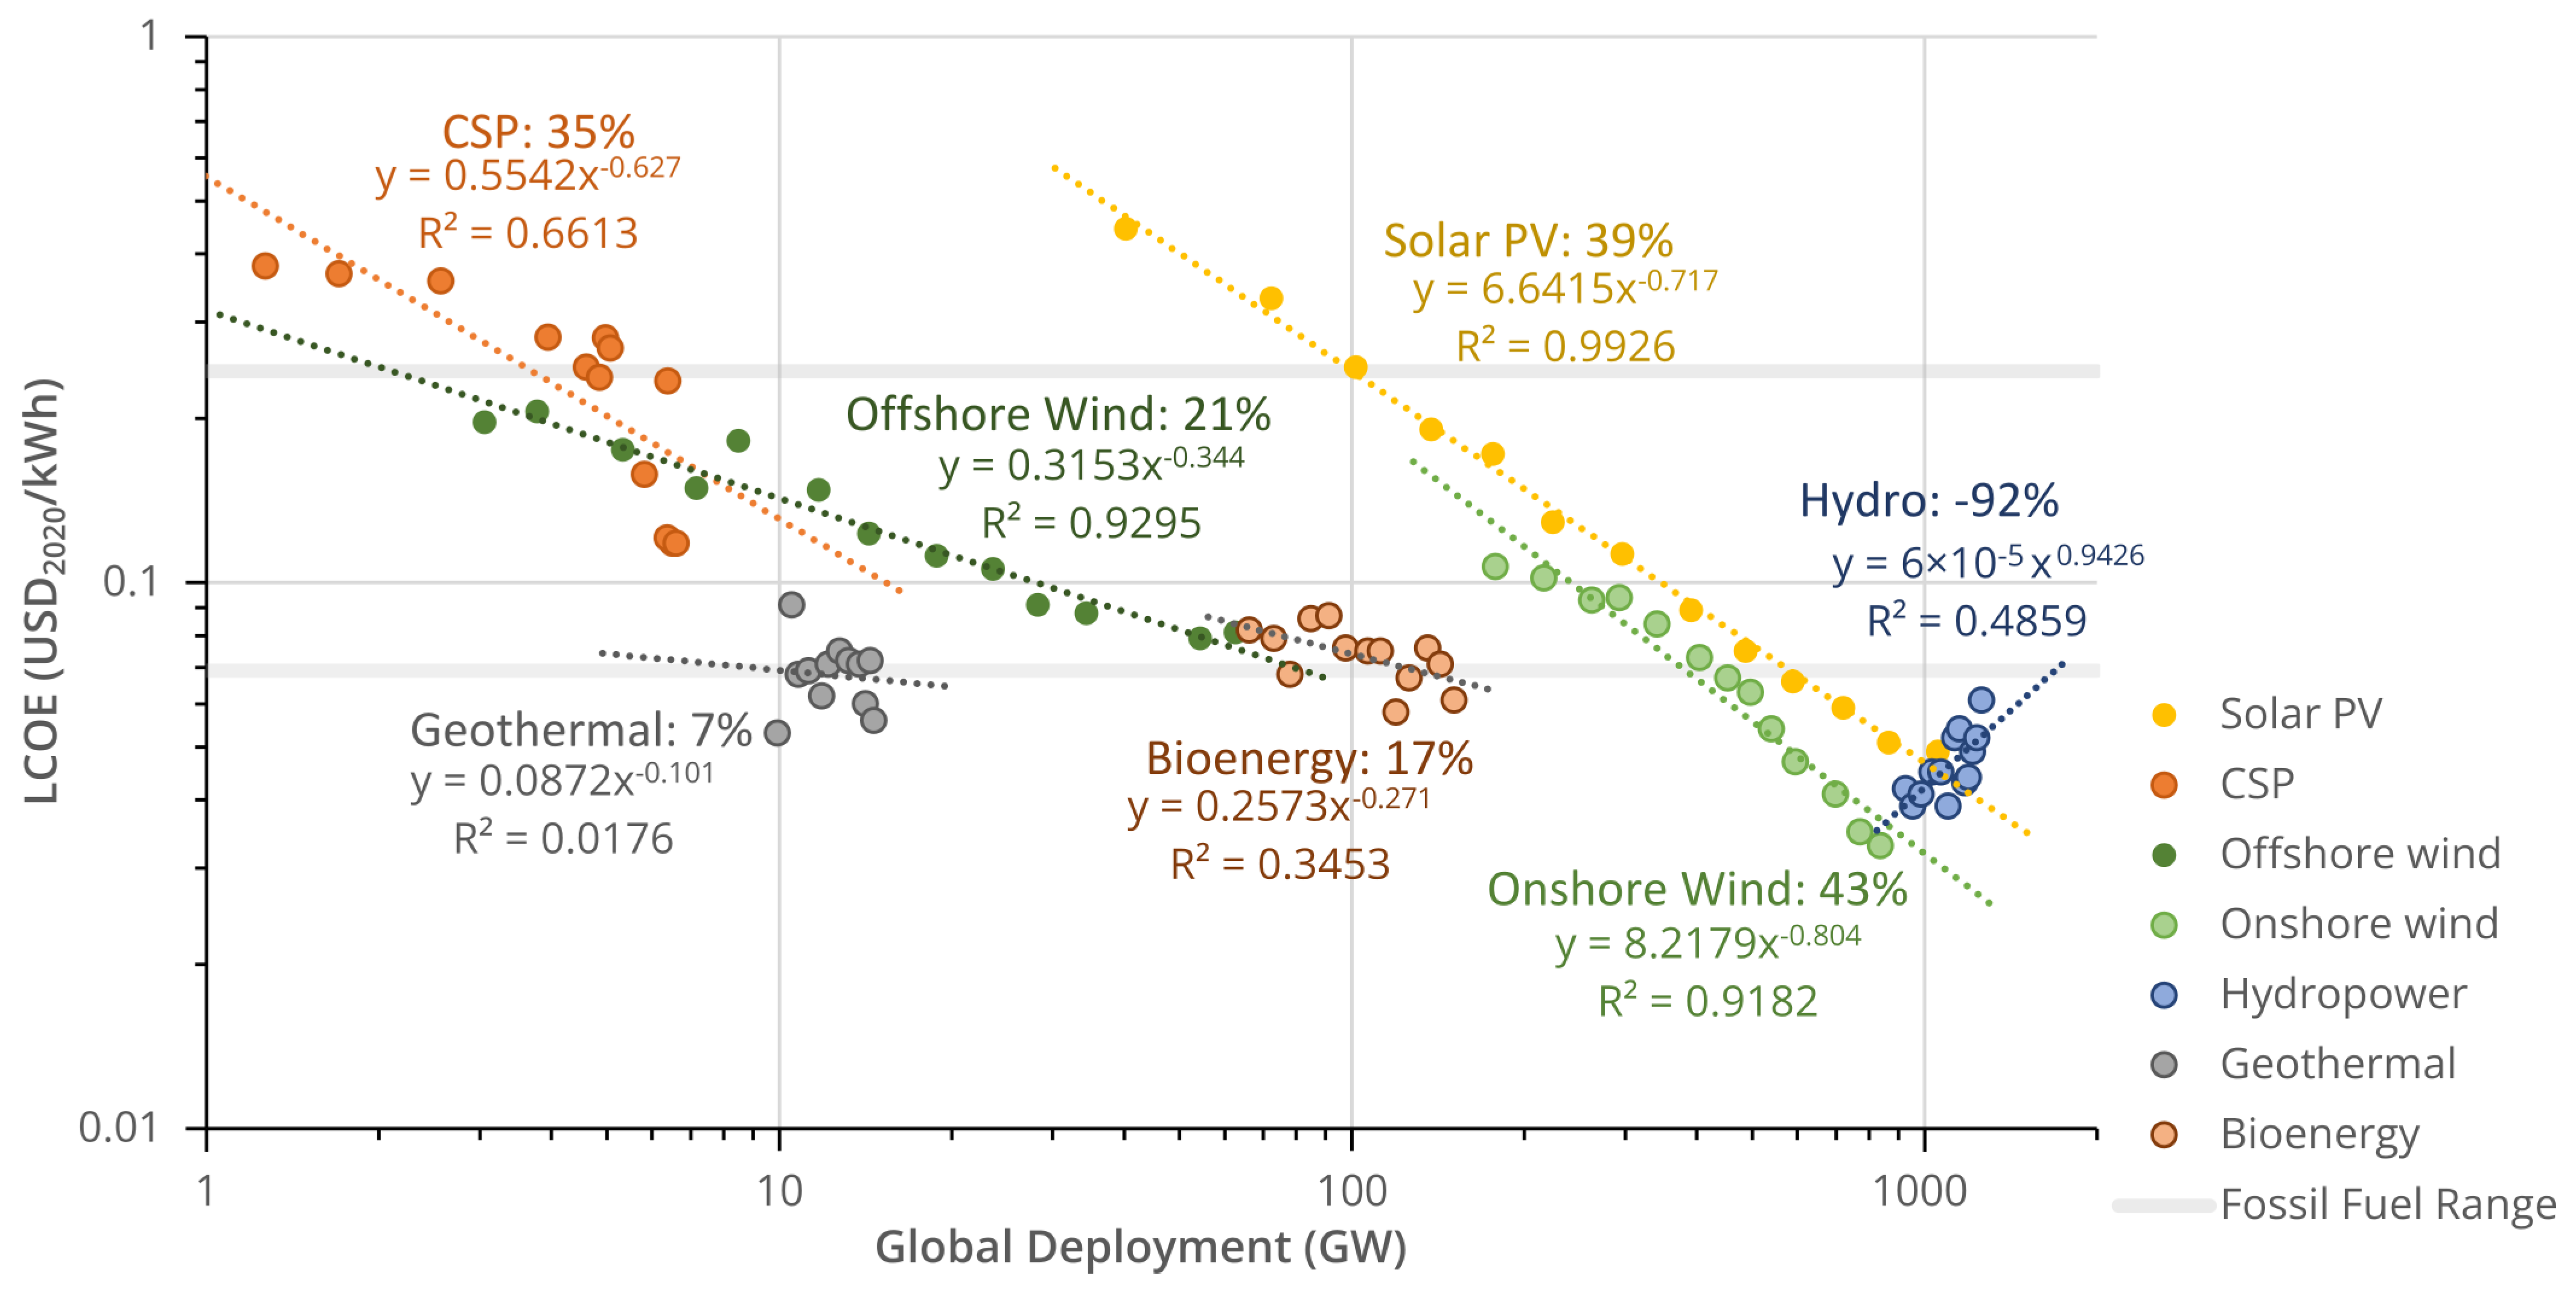
The learning rate can be for unit capital expenditure (i.e., CAPEX, GBP/MW), or for generation cost (i.e., cost of energy, GBP/MWh). CAPEX-based LR are typically lower, as they do not include learning over the lifetime of the projects, e.g., on operations and maintenance (O&M). Global LCOE learning rates for renewable generation have been calculated from IRENA data [42,43] for two time periods, 2010–2019 and 2010–2022. The latter period is shown in Figure 3, with learning rates of 7–43%, although noting that costs for hydropower (a mature technology) actually increased over this period giving a negative LR. Some technologies, such as solar photovoltaic (PV), show a clear trend illustrated by a high coefficient of determination, whereas others like geothermal are less clear.
It is important to note that a wide range of learning rates has been observed for various technologies, in a range of countries and timescales, and that suitable innovation funding must be available to achieve these higher learning rates. An influential review paper by Rubin et al. [44], on learning rates for electricity supply technologies, summarised single factor learning rates for various technologies. These have varying temporal and geographic scope (mostly Europe and North America); some of the reported studies are CAPEX-based LR. The ranges of LR found are listed in Table 2, along with specific cases from that paper and other studies.
A more recent review paper from 2020 focused on CAPEX-based LR for various low-carbon technologies [45]. These were classified into three types by degree of design complexity (simple, design-intensive, complex) and need for customisation (standardised, mass-customised, customised), with wind turbines and concentrating solar power in the middle of both classifications. Tidal stream and wave energy would also fit into this ‘type 2’ class. Furthermore, in type 2, rooftop solar PV balance of supply is considered simpler, while electric vehicles are more standardised. Type 1, mass-produced products such as solar PV modules may not be a good reference case for tidal, nor would more complex type-3 technologies, such as gas and nuclear power plants. The ranges of learning rates from this review paper for types 1 and 2 are shown in Figure 4.

Table 2.
Range of single factor learning rates from various studies.
| Technology | Years | Scope | LR | Source |
|---|---|---|---|---|
| Onshore wind | 1979–2010 | All studies reviewed, various metrics | −11–32% | Rubin et al. [44] |
| 1980–1995 | Europe, cost of electricity vs. cumulative production | 18% | IEA [41] | |
| 1983–2015 | US project cost vs. global installed capacity | 6% | Samadi [46] | |
| 2010–2019 | Global, LCOE vs. Installed capacity | 24% | IRENA [42] | |
| 2010–2022 | Global, LCOE vs. Installed capacity | 43% | IRENA [43] | |
| Offshore wind | 1985–2001 | Both studies reviewed, various | 5–19% | Rubin et al. [44] |
| 2010–2019 | Global, LCOE vs. installed capacity | 10% | IRENA [42] | |
| 2010–2022 | Global, LCOE vs. installed capacity | 21% | IRENA [43] | |
| Solar PV | 1959–2011 | All studies reviewed, various metrics | 10–47% | Rubin et al. [44] |
| 1975–2015 | Global, module price vs. Installed capacity | 22% | Samadi [46] | |
| 2010–2019 | Global, LCOE vs. installed capacity | 36% | IRENA [42] | |
| 2010–2022 | Global, LCOE vs. installed capacity | 39% | IRENA [43] | |
| Biomass † | 1976–2005 | All studies reviewed, various metrics | 0–24% | Rubin et al. [44] |
| Bioenergy | 2010–2022 | Global, LCOE vs. installed capacity | 17% | IRENA [43] |
| Gas turbine | 1958–1990 | All studies reviewed, various metrics | 10–22% | Rubin et al. [44] |
| Concentrating solar power | 2010–2019 | Global, LCOE vs. installed capacity | 23% | IRENA [42] |
| 2010–2022 | Global, LCOE vs. installed capacity | 35% | IRENA [43] | |
| Geothermal | 2010–2022 | Global, LCOE vs. installed capacity | 7% | IRENA [43] |
† For power generation, includes combined heat and power and biodigesters.
2.4. UK Electricity Market Subsidy
There are many types of market support mechanisms used to support renewable and low-carbon energy. These include production subsidies such as feed-in tariffs, portfolio standards such as the Renewable Obligation used in the UK from 2002 to 2017, and emissions trading schemes such as the EU ETS.
In the UK, the main incentive for new low carbon electricity is the Contracts for Difference (CfD) scheme. This aims to drive down costs using a reverse auction process amongst competing developers. The CfD scheme also aims to protect developers from fluctuating wholesale market prices by offering them a set price for electricity supplied over a 15-year contract period. This offers longer term clarity for renewable generation technologies that have higher up-front costs but no ongoing fuel costs.
Successful developers are paid a fixed ‘Strike Price’ for the electricity they generate, receiving a top-up when the market price is below this. However, if the market price is higher they are expected to repay the difference, to avoid undue burden on the consumer. Note that for the UK CfD scheme, all strike prices are stated in 2012 prices (/MWh) for consistency with previous years, but developers receive an inflation-adjusted amount linked to the Consumer Prices Index (CPI).
There have been five auctions, or allocation rounds (AR) to date, with the sixth (AR6) being conducted in 2024. In total, this has seen over 25 GW of contracts awarded, with nearly 17 GW of offshore wind plus 4 GW each of onshore wind and solar PV. The first auctions were held approximately two years apart, but since AR4, they have been being held annually.
In AR4 and AR5, ringfenced budgets of 20 and 10 m were set specifically for tidal stream, allowing developers to bid a higher cost than for other technologies.
For each technology, a maximum bid amount is set before the auction, called the ‘Administrative Strike Price’ (ASP). In AR5, there were no successful bids for offshore wind projects. Analysis by Regen [47] suggests that the ASP for offshore wind should have been increased to account for commodity prices and the cost of capital rising above the CPI, which the industry warned about beforehand.
3. Methodology
This work uses a series of informed ‘what if?’ scenarios to illustrate what the cost to the UK Treasury might be in supporting the commercialisation and cost reduction of tidal stream energy in the UK. The scenario analysis investigates key parameters (with credible ranges of model inputs) to show what most influences the overall investment required (the model output).
The projected reduction in costs of tidal stream technology is modelled using the CfD Strike Price for each annual auction, as a proxy for LCOE which is more difficult to quantify. This is modelled using a single-factor learning rate, with an assumed percentage cost-reduction for every doubling in deployed capacity. It is postulated that the CfD Strike Price reduces by the learning rate in AR8 and beyond (i.e., after 2025). Strike Prices for AR4–AR7 are thus inputs to the model. The total CfD subsidy required is then the difference between the Strike Price and the electricity wholesale market price for the total tidal power generated over the 15-year lifetime of the support mechanism.
All electricity costs—i.e., the wholesale market price, Strike Prices, and LCOE—are presented throughout in 2012 values (/MWh), as per the CfD. The AR4 and AR5 Strike Prices are as published in /MWh. The wholesale market price is deflated from the source /MWh to /MWh using published ONS GDP data [48], as per note 8 in the source guidance [49]. The annual and total subsidy calculated is inflated to current day (m or bn), using the latest ONS CPI data available during the analysis (to Oct. 2023) [50].
The following sections set out in more detail the model inputs and assumptions including the deployment trajectory and then the calculation of cost reductions and total market support.
3.1. Model Inputs and Assumptions
3.1.1. Deployment Trajectory
There is the potential in the UK to deploy at least 6 GW each of tidal stream and wave energy by 2050, according to results from an Energy Systems Modelling Environment (ESME) run by the Energy Systems Catapult (ESC) [51]. The 2050 ESME results present an energy mix for the GB grid, based on the ESC 96% Further Ambition (FA96) scenario, which in turn is aligned to the Committee on Climate Change (CCC) Further Ambition position defined in their Net Zero technical report [52] and used in the ESC’s Innovating to Net Zero analysis [53]. Within this, it is assumed that wave and tidal stream meet the 2030 SET Plan LCOE targets [54].
We assume that a similar rapid growth is observed for tidal stream in the UK as has been observed in onshore and offshore wind in Europe, see Section 2.1. This is not a prediction of what will happen, but an ambitious scenario of what could happen to estimate the funding required to enable this. Changing the deployment rate does not have a significant impact on the total investment required, since the cost reduction is based on learning from cumulative deployment. A slower deployment rate will obviously take longer to get to cost parity and thus will not contribute as much to decarbonisation and net-zero targets. It will have a reduced annual investment, but the investment is spread over a longer period.
A deployment trajectory was developed for this work assuming a compound annual growth rate (CAGR) in each allocation round auction to meet three defined points:
- A total of 10 MW in 2023, representing the existing deployment of tidal-stream energy in UK waters [25].
- A total of 0.9 GW in 2035, based on the UK Marine Energy Council’s ask for a target of 1 GW of ocean energy by 2035, assuming the majority of this will be from tidal stream, with the remainder coming from wave energy deployments.
- Around 6.2 GW in 2050, based on ESME modelling by ESC summarised above with further detail in [51].
The trajectory is included as Table S1 and reaches 0.840 GW in 2035 and 1.055 GW by 2036.
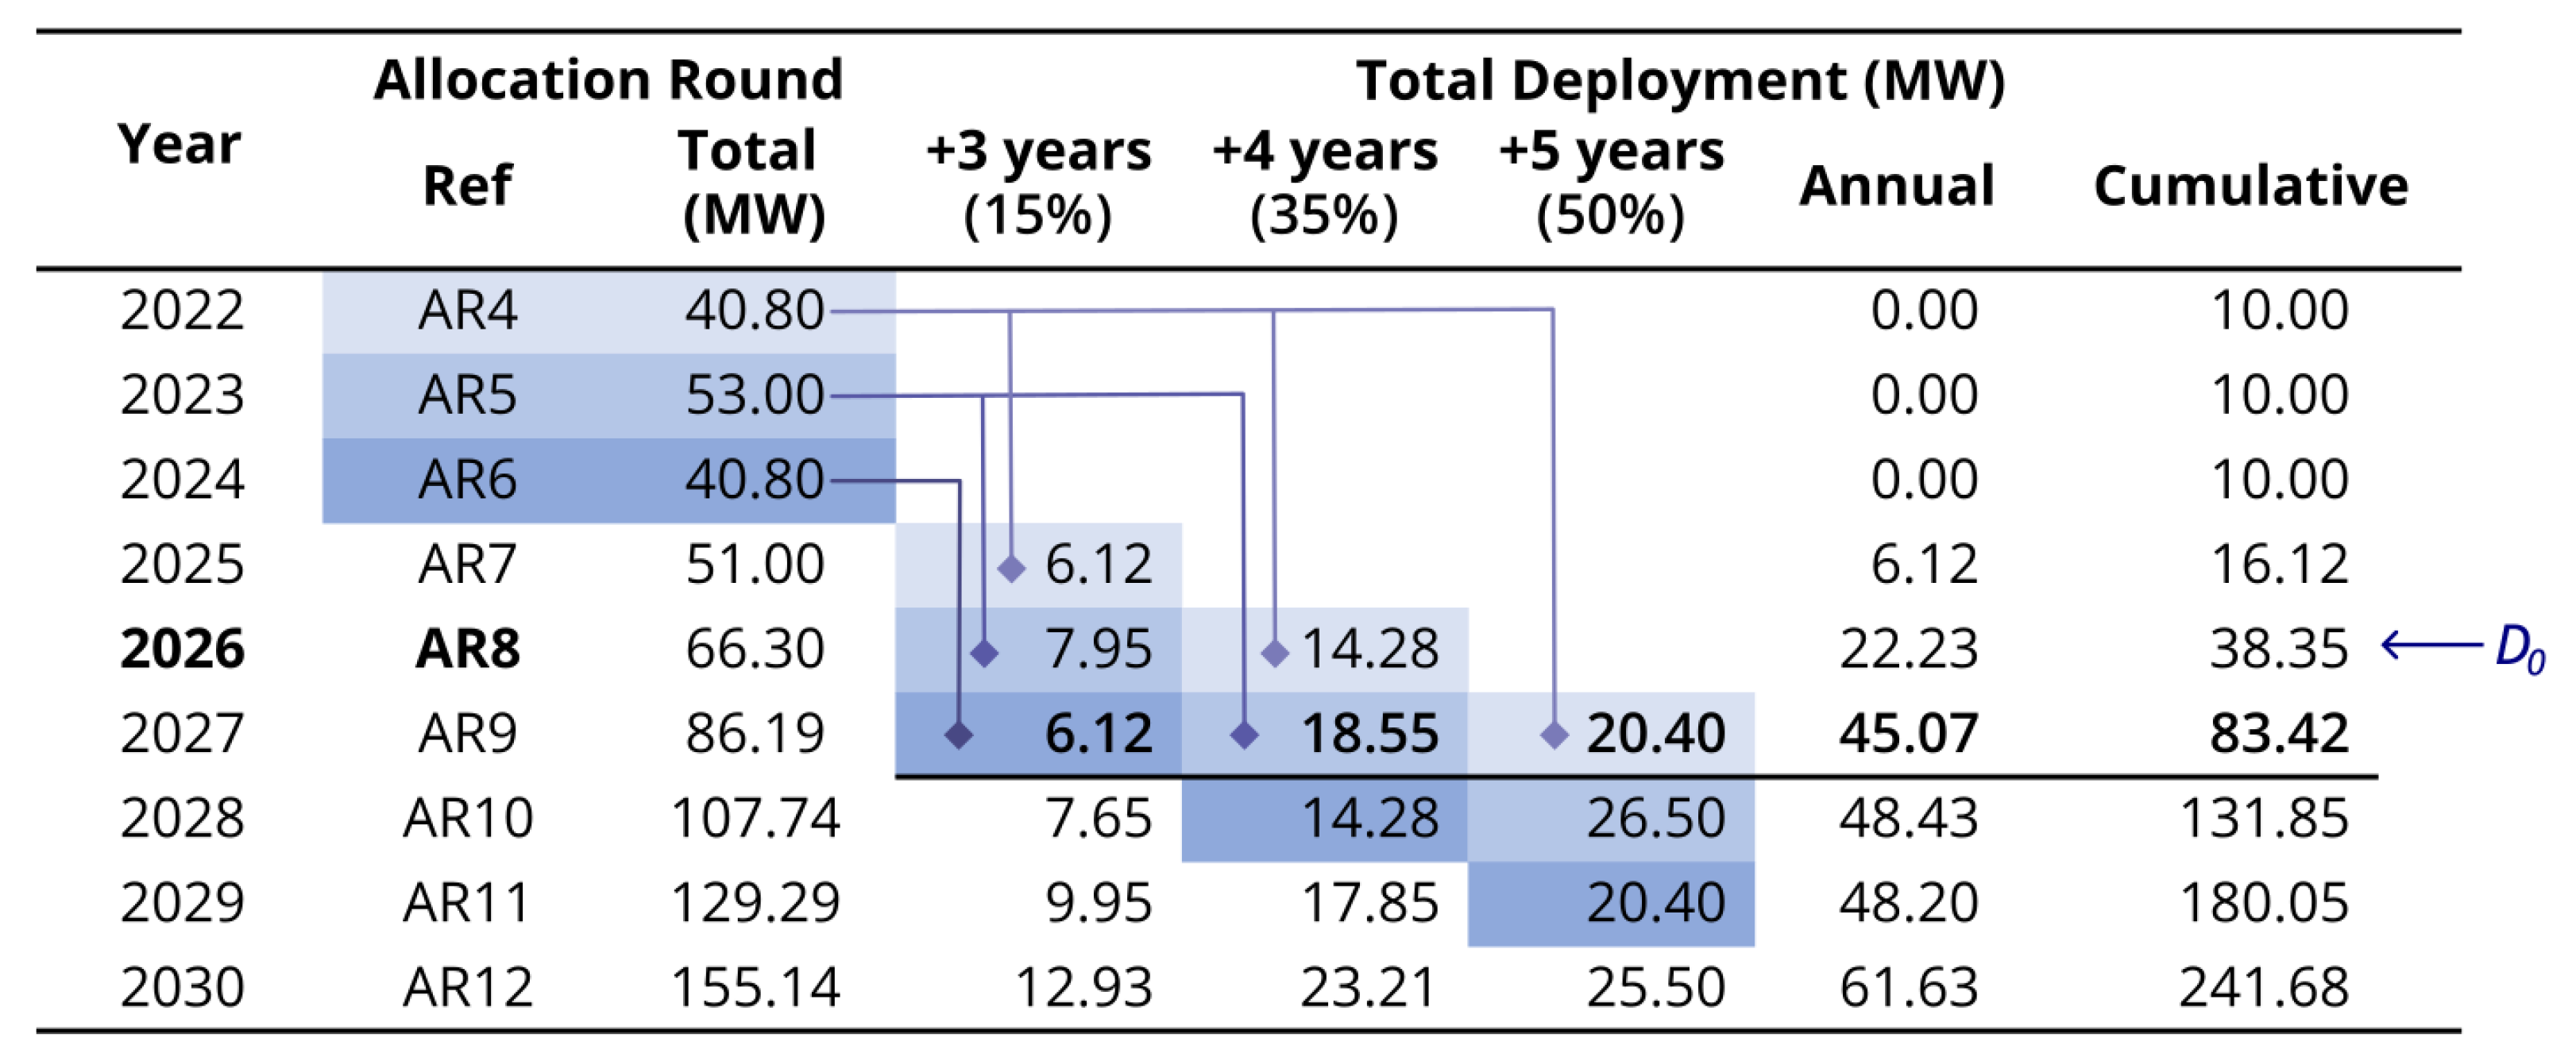
The deployment is assumed to occur in a phased manner, 3–5 years after the AR auction. This is based on the AR4 auction in 2022 resulting in deployments scheduled for 2025/2026 and 2026/2027. It is likely that deployments will be towards the end of this period, so our modelling assumes the following split: 15% in year 3, 35% in year 4, and the remaining 50% in year 5.
The high initial growth rate is from the deployment of projects awarded in AR4 and AR5, after a period of limited deployment and no previous CfD awards. The deployment trajectory used in this work is also consistent with the UK deployment forecast in the recent TIGER project cost reduction study [25]. Continued CAGR of 5% after 2050 was assumed for consistency, even though for some scenarios, this resulted in >11 GW of deployment, which may exceed the technically/economically viable resource in the UK.
3.1.2. Cost Reduction Inputs, Baseline Assumptions, and Sensitivity Ranges
A range of plausible input values have been used in the modelling as discussed in this section. These include the CfD Strike Prices for the first four years, the learning rates, and the electricity wholesale market price.
As noted above, the Strike Prices for AR4–AR7 are inputs to the model, values considered are shown in Table 3. The total amount (MW) of contracts awarded in AR6 was assumed to be the same as AR4, with growth in subsequent auctions to meet the deployment trajectory in Section 3.1.1. For AR6, the Strike Price is limited by the ASP, with a lower bound of the AR4 value considered. The lower bound for AR7 was based on an ambitious cost reduction from AR4, assuming AR5 was a blip. The upper bound of AR7 reflects the limit to which cost reductions at the learning rates used are possible within the UK tidal stream resource, as discussed further in the results.
Three main learning rates are used in the analysis, with intermediate values also used in some cases. These are consistent with other similar studies and historically observed in other related technologies.
- 10%—a sub-optimal learning rate;
- 15%—a preferred and realistic learning rate;
- 20%—an ambitious learning rate.
The electricity wholesale market price (WMP) for each year has been taken from DESNZ ‘2023 Energy and emissions projections 2022–2040’ [49], using the baseload electricity price. This was extended beyond 2040 using a constant 2040 price in the absence of other data. Sensitivity to future price rises was explored by a +5% per decade scenario, see Appendix A. The WMP used is shown in Figure 5.
3.2. Calculation of Cost Reductions and Total Market Support
Because the CfD allocation round auctions in the UK happen several years ahead of the deployment, a ‘what if?’ assumption has been made in the modelling, that developers can predict future cost reductions that are expected to occur through learning from development. Each future AR Strike Price is therefore set at the LCOE expected at the end of the following year, assuming perfect knowledge. This will have reduced as a result of learning from the deployments until that point, e.g., the Strike Price for AR8 in mid-2026 includes the cost reductions from deployments until the end of 2027, i.e., all of the AR4 contracts, some of AR5, and a little of AR6, as shown in Figure 6.
The reduction in Strike Price as a function of cumulative deployment D is modelled as Equation (3), where is the learning rate, and subscripts R and 0 refer to the allocation round and base year, respectively.
This is equivalent to Equations (1) and (2).
The amount of subsidy required is calculated discretely in the model for each AR separately. This is paid on the total energy generated for all the deployments in that round , calculated as Equation (4), where f is a constant load factor of 38.9% as in the CfD Valuation Formula [55], and h the average number of hours per year, 8766.
The subsidy for each round is calculated using Equation (5), where is the average electricity wholesale market price (WMP) over the 15-year subsidy period p. Because of the staggered deployments assumed, is a function of the split per year and the WMP over the period 3–20 years after the AR auction. The total subsidy required to reach cost parity with the WMP is simply the total for all rounds, Equation (6).
4. Results and Discussion
This section presents the modelling results and explores sensitivities to key parameters. It should be stressed that these are not predictions of what will happen, but scenarios of what could happen if appropriate policies are put in place. The results first show the sensitivity to learning rates, then the annual investment required for each round over time. This is followed by sensitivity to Strike Prices in AR6/AR7 and finally a combined sensitivity to both AR6/AR7 Strike Price and learning rate.
4.1. Sensitivity to Learning Rate
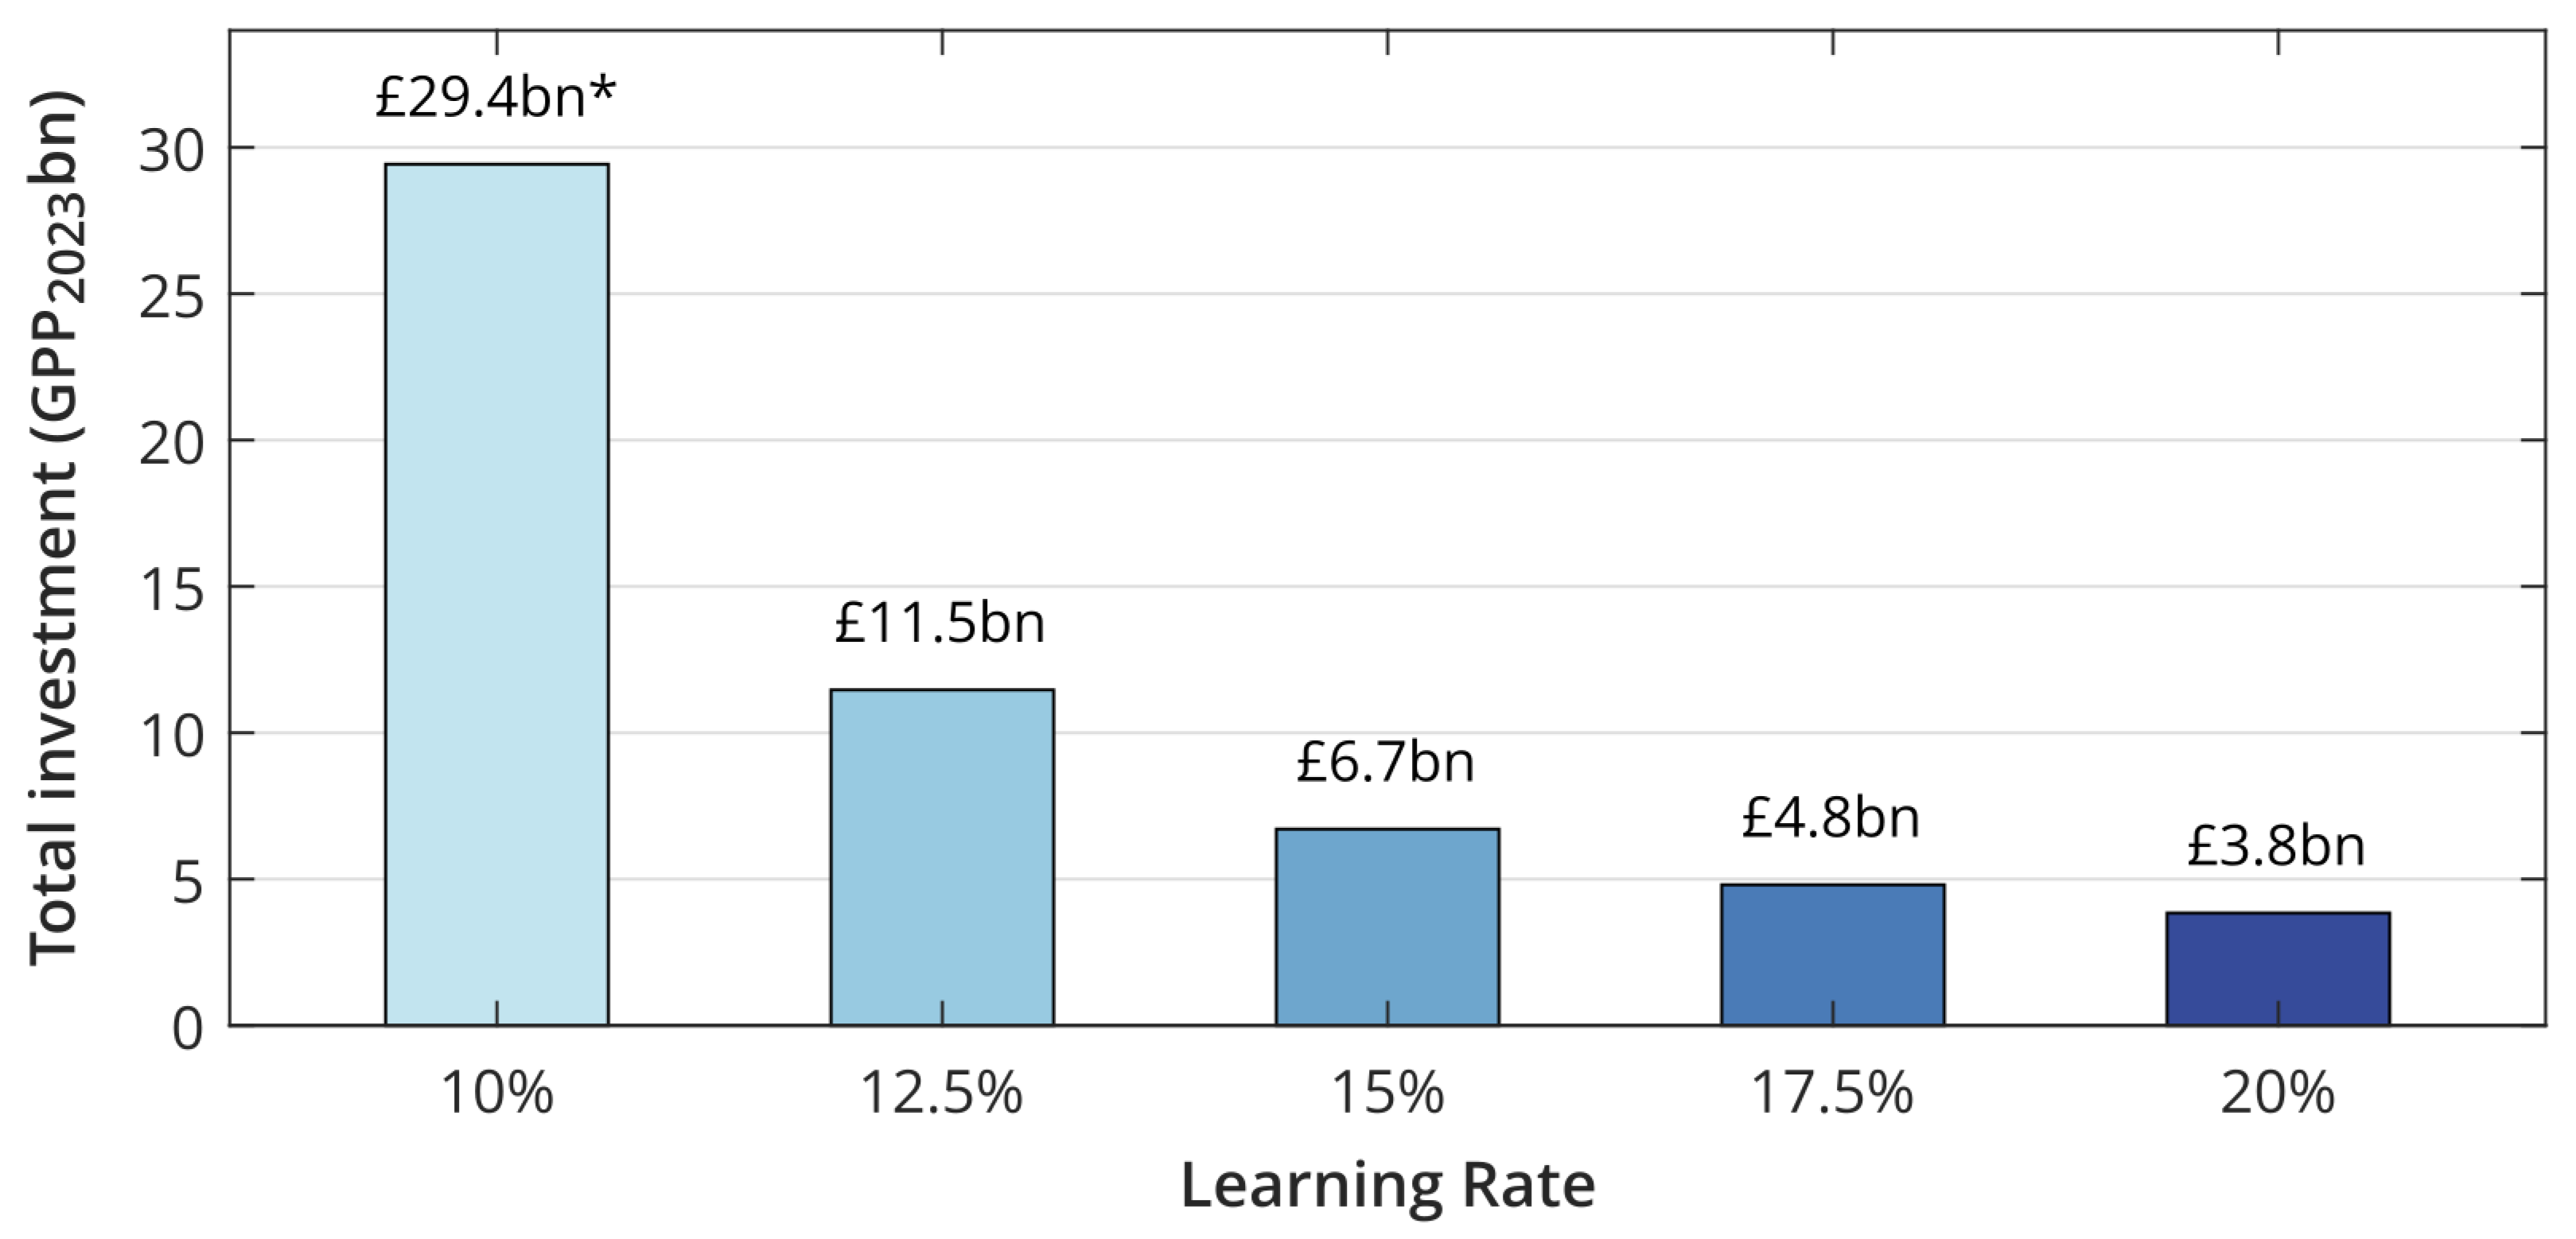
The impact of the assumed learning rate (LR) on the total investment required is shown in Figure 7. Reducing the LR from the 15% central case to 12.5% almost doubles the investment required; reducing it from 15% to just 10% more than quadruples the investment, highlighting the non-linear impact. Indeed, for this case, with only 10% LR, there may be insufficient UK tidal resources to deploy enough devices to reach cost parity, and this would be well after 2050. Increasing the LR to 20% from 15% cuts the investment nearly by half.
4.2. Annual Investment/Cfd Ringfence Required Per Round
This example also uses a baseline scenario where AR6 is a similar price to AR4 at 178.54 /MWh, and prices then reduce with learning in AR7 and onwards; see Section 4.3 for other AR6 and AR7 price scenarios. Assuming the preferred and realistic learning rate of 15%, the annual investment is around 20–30 m per AR for around 10 years, as shown in Figure 8. This then decreases almost linearly over the following decade, with the final AR around 2041. For the more ambitious 20% LR, the costs and timescales are reduced, with a maximum annual investment of around 25 m and the final AR of around 2034. However, if the LR is sub-optimal at only 10%, annual costs could rise to around 50 m by the late 2030s and remain unpalatably high for several decades, not reaching cost parity until around 2070; there may be insufficient UK resources to achieve this cost reduction through learning from deployment at this low rate.
4.3. Sensitivity to Ar6/Ar7 Strike Price
In this section, a series of scenarios (a–j) are considered with varying Strike Prices for AR6 and AR7. Prices are then assumed to reduce with learning at 15% from deployment in AR8 onwards. Results are shown in Figure 9 and Table 4.
- The first two scenarios (a) and (b) assume that AR5 was a blip and that AR6 will be like AR4 at GBP 178.54/MWh, with a reduction in AR7 to (a) GBP 156/MWh or (b) GBP 160/MWh, resulting in total investment of GBP 6.7bn or GBP 7.3bn, respectively.
- Scenario (c) assumes that AR6 is mid-way between AR4 and AR5 at GBP 188.27/MWh, and AR7 is GBP 170/MWh, resulting in a total investment of GBP 8.9bn.
- Scenarios (d)–(f) then assume that AR6 is like AR5 at GBP 198.00/MWh, with AR7 reducing to (d) GBP 180/MWh, (e) GBP 190/MWh, or remaining at GBP 198/MWh in (f). The latter costs about double scenarios (a) or (b).
- Scenario (g) assumes that AR6 takes the Administrative Strike Price of GBP 261/MWh, but AR7 returns to GBP 198/MWh with prices reducing thereafter. Scenario (j) is a less extreme example of this with AR6 at GBP 220/MWh.
- Scenarios (h) and (i) assume higher Strike Prices in AR6 and AR7 before cost reductions occur. These require around three times the base case investment and do not meet cost parity by 2050.
The modelling shows that the total investment is most sensitive to the Strike Price in AR7, as this sets the price for all subsequent rounds accounting for learning from deployment. This can be seen by the minimal difference in total investment between scenarios (f), (j) and (g) all with AR7 at 198, but have AR6 at 198, 220 and 261 GBP/MWh, giving a total investment of GBP 15.09bn, GBP 15.16bn and GBP 15.27bn, respectively. If the AR7 Strike Price is around GBP 220/MWh or higher, costs would need to fall faster than a 15% learning rate to achieve parity with the wholesale electricity market price within the estimated UK tidal stream resource of around 11 GW. In summary, if AR6 and AR7 are like AR5 at around GBP 198/MWh, the total investment would be double the baseline assumption of AR6 having a similar price to AR4. If the Strike Price for AR6 and AR7 increase further to around GBP 220/MWh and we do not see a rapid reduction soon after, the total investment could be three times the baseline assumptions.
4.4. Annual Investment/Cfd Ringfence Required for Selected Ar6/Ar7 Strike Prices
The timeseries of annual investment required for selected scenarios (a, c, f, g and i) is shown in Figure 10, all assuming the baseline 15% learning rate beyond AR7. This also illustrates the difference between scenarios (f) and (g) which only differ in AR6, but which have the same annual investment in AR7 onwards.
4.5. Sensitivity to Learning Rate and Ar6/Ar7 Strike Price
The sensitivity to the learning rate for selected scenarios of AR6 and AR7 Strike Prices is shown in Figure 11 and Table 5. The 10% LR is not shown for (f)–(i) as this would be too extreme. As shown in Table 5, some of the examples shown do not meet cost parity by 2050, and some exceed the estimated UK tidal stream resource, so it would not be possible to fully reduce costs at those learning rates through deployment alone. Again, the important point from this sensitivity analysis is that the learning rate has a more significant impact on the total investment than the Strike Prices in AR6 and AR7. Therefore sustained innovation funding is required alongside market subsidy to achieve high learning rates and faster cost reductions.
4.6. Other Considerations and Limitations
As with all such modelling and analysis, some simplifications and generalisations are needed, which are discussed here.
It is important to note that this modelling only considers subsidy and deployments in the UK; however, we live in a global market. Therefore, an implicit assumption is that tidal stream technology is following a similar cost reduction pathway in the rest of the world.
There is a fixed deployment rate for all scenarios, which is not influenced by the cost reduction achieved. In reality, the rate of cost reduction will drive the amount of deployment, based on the quantity of contracts awarded in the CfD auctions. However, modelling the cost-reduction using a learning rate approach uses the cumulative deployment as an input.
A single factor learning rate that is constant over time has been used. Approaches using multi-factor learning rates have been used, but this would significantly complicate the analysis and results. The focus of this study was instead to explore at a high level the main factors influencing the total market support needed.
Finally, the CfD scheme is assumed in this work to continue over the next 30–40 years. The UK Government announced in 2022 a Review of Electricity Market Arrangements (REMA), which “includes consulting on both the continued evolution and expansion of existing schemes, such as … Contracts for Difference” [56]. However, it is beyond the scope of this analysis to consider potential future tweaks and changes to the market support mechanisms in the UK.
While it is not possible to guarantee that innovation and cost reductions will result from implementing support policies, not having these policies would definitely lead to lower innovation. Similarly, uncertainty in these policies will limit their effectiveness. As shown in this work, lower innovation (expressed as a learning rate) leads to significantly increased investment required and may also delay the deployment of much needed renewable energy.
5. Conclusions
This work sets out several plausible and informed scenarios of future cost reductions in UK tidal stream projects, and the corresponding support required through the CfD mechanism. The amount of ‘market pull’ policy support through subsidising deployment has been calculated, but in order to achieve the cost reductions suitable ‘technology push’ policies must also be established to facilitate research and innovation.
A UK tidal stream deployment trajectory has been used in the modelling, consistent with other work. It starts from 10 MW in 2023, reaching 1 GW around 2036, and 6.2 GW by 2050. Changing this rate does not significantly impact the total subsidy, as the cost-reduction is based on learning from cumulative deployment. Slower deployment may have a reduced annual investment but spread over a longer period. It will also not contribute as much to decarbonisation and net-zero targets.
A baseline learning rate of 15% is used, consistent with other studies and historical observations from other similar technologies. It is important to note that a very wide range of learning has been observed in other similar technologies, over differing geographical temporal scopes, depending on the policies in place. Sensitivity of reducing the LR to 12.5% or 10% doubles or more than quadruples the investment required, respectively.
Assuming AR6 in 2024 is similar to AR4, in terms of capacity and Strike Price, then costs reduce through learning at 15% in AR7 onwards, the annual investment for each allocation round is between 20 and 30 m per year over the next decade, then dropping almost linearly to zero by around 2041. If AR6 and AR7 are both similar to AR5 at around 198 /MWh before costs reduce at a 15% LR, then the total investment would double relative to the base case above. Similarly, with 15% LR and AR6 and AR7 both around 220 /MWh, the investment would triple relative to the base case. The impact of one or two AR with higher Strike Prices is limited, providing that costs then reduce significantly.
The results are sensitive to the future electricity wholesale market price (WMP), as this is directly removed from the total investment calculated. Higher WMP would directly reduce the CfD subsidy required, but this cost would just be transferred to the consumer.
The total subsidy is most affected by the cost reduction pathway which is determined by the learning rate. A short-term blip in Strike Prices in the next allocation rounds is OK, provided that costs return to lower levels by AR7 or AR8. A balance is also needed between subsidising the deployment to drive down costs through learning, and funding innovation to maintain a high learning rate.
Supplementary Materials
The following supporting information can be downloaded at: https://www.mdpi.com/article/10.3390/en17092085/s1; Table S1: UK tidal energy deployment trajectory.
Author Contributions
Conceptualization, D.R.N. and H.J.; methodology, D.R.N.; data curation, D.R.N.; writing—original draft preparation, D.R.N.; writing—review and editing, D.R.N., K.G. and H.J.; visualization, D.R.N.; funding acquisition, H.J. All authors have read and agreed to the published version of the manuscript.
Funding
This work has been funded by the Engineering and Physical Sciences Research Council (EPSRC) Supergen ORE Impact Hub 2023, EP/Y016297/1.
Institutional Review Board Statement
Not applicable.
Data Availability Statement
The UK tidal energy deployment trajectory developed for this work is included as Supplementary Material. The other data inputs are as described or referenced in the text.
Acknowledgments
The authors would like to acknowledge the constructive input from Kasia Junyent and Joseph Connolly at DESNZ during the development of this analysis. They would also like to acknowledge the work by Pui Wah Wong that this analysis builds on. For the purpose of open access, the author has applied a Creative Commons Attribution (CC BY) licence to any Author Accepted Manuscript version arising from this submission.
Conflicts of Interest
The authors declare no conflicts of interest. The funders had no role in the design of the study; in the collection, analyses, or interpretation of data; in the writing of the manuscript; or in the decision to publish the results.
Abbreviations
The following abbreviations are used in this manuscript:
| AR | Allocation Round |
| ASP | Administrative Strike Price |
| CAGR | Compound Annual Growth Rate |
| CAPEX | Capital Expenditure |
| CfD | Contract for Difference |
| CPI | Consumer Prices Index |
| CSP | Concentrating Solar Power |
| DESNZ | [UK Government] Department for Energy Security and Net Zero |
| ESC | Energy Systems Catapult |
| ESME | Energy Systems Modelling Environment |
| GDP | Gross Domestic Product |
| IRENA | International Renewable Energy Agency |
| LCOE | Levelised Cost of Energy |
| LR | Learning Rate |
| ONS | Office for National Statistics |
| OPEX | Operational Expenditure |
| ORE | Offshore Renewable Energy |
| PV | Photovoltaic |
| WMP | [Electricity] Wholesale Market Price |
Appendix A. Sensitivity to Future Electricity Prices
The modelling is sensitive to future electricity prices; however, it is beyond the scope of this analysis to consider this in detail, and there is considerable uncertainty especially in the long term. It is important to remember that the CfD subsidy is for a period of 15 years, and the deployment is assumed to occur 3–5 years after the auction, therefore the total subsidy is based on the average electricity price over the period 3–20 years following the allocation round (AR).
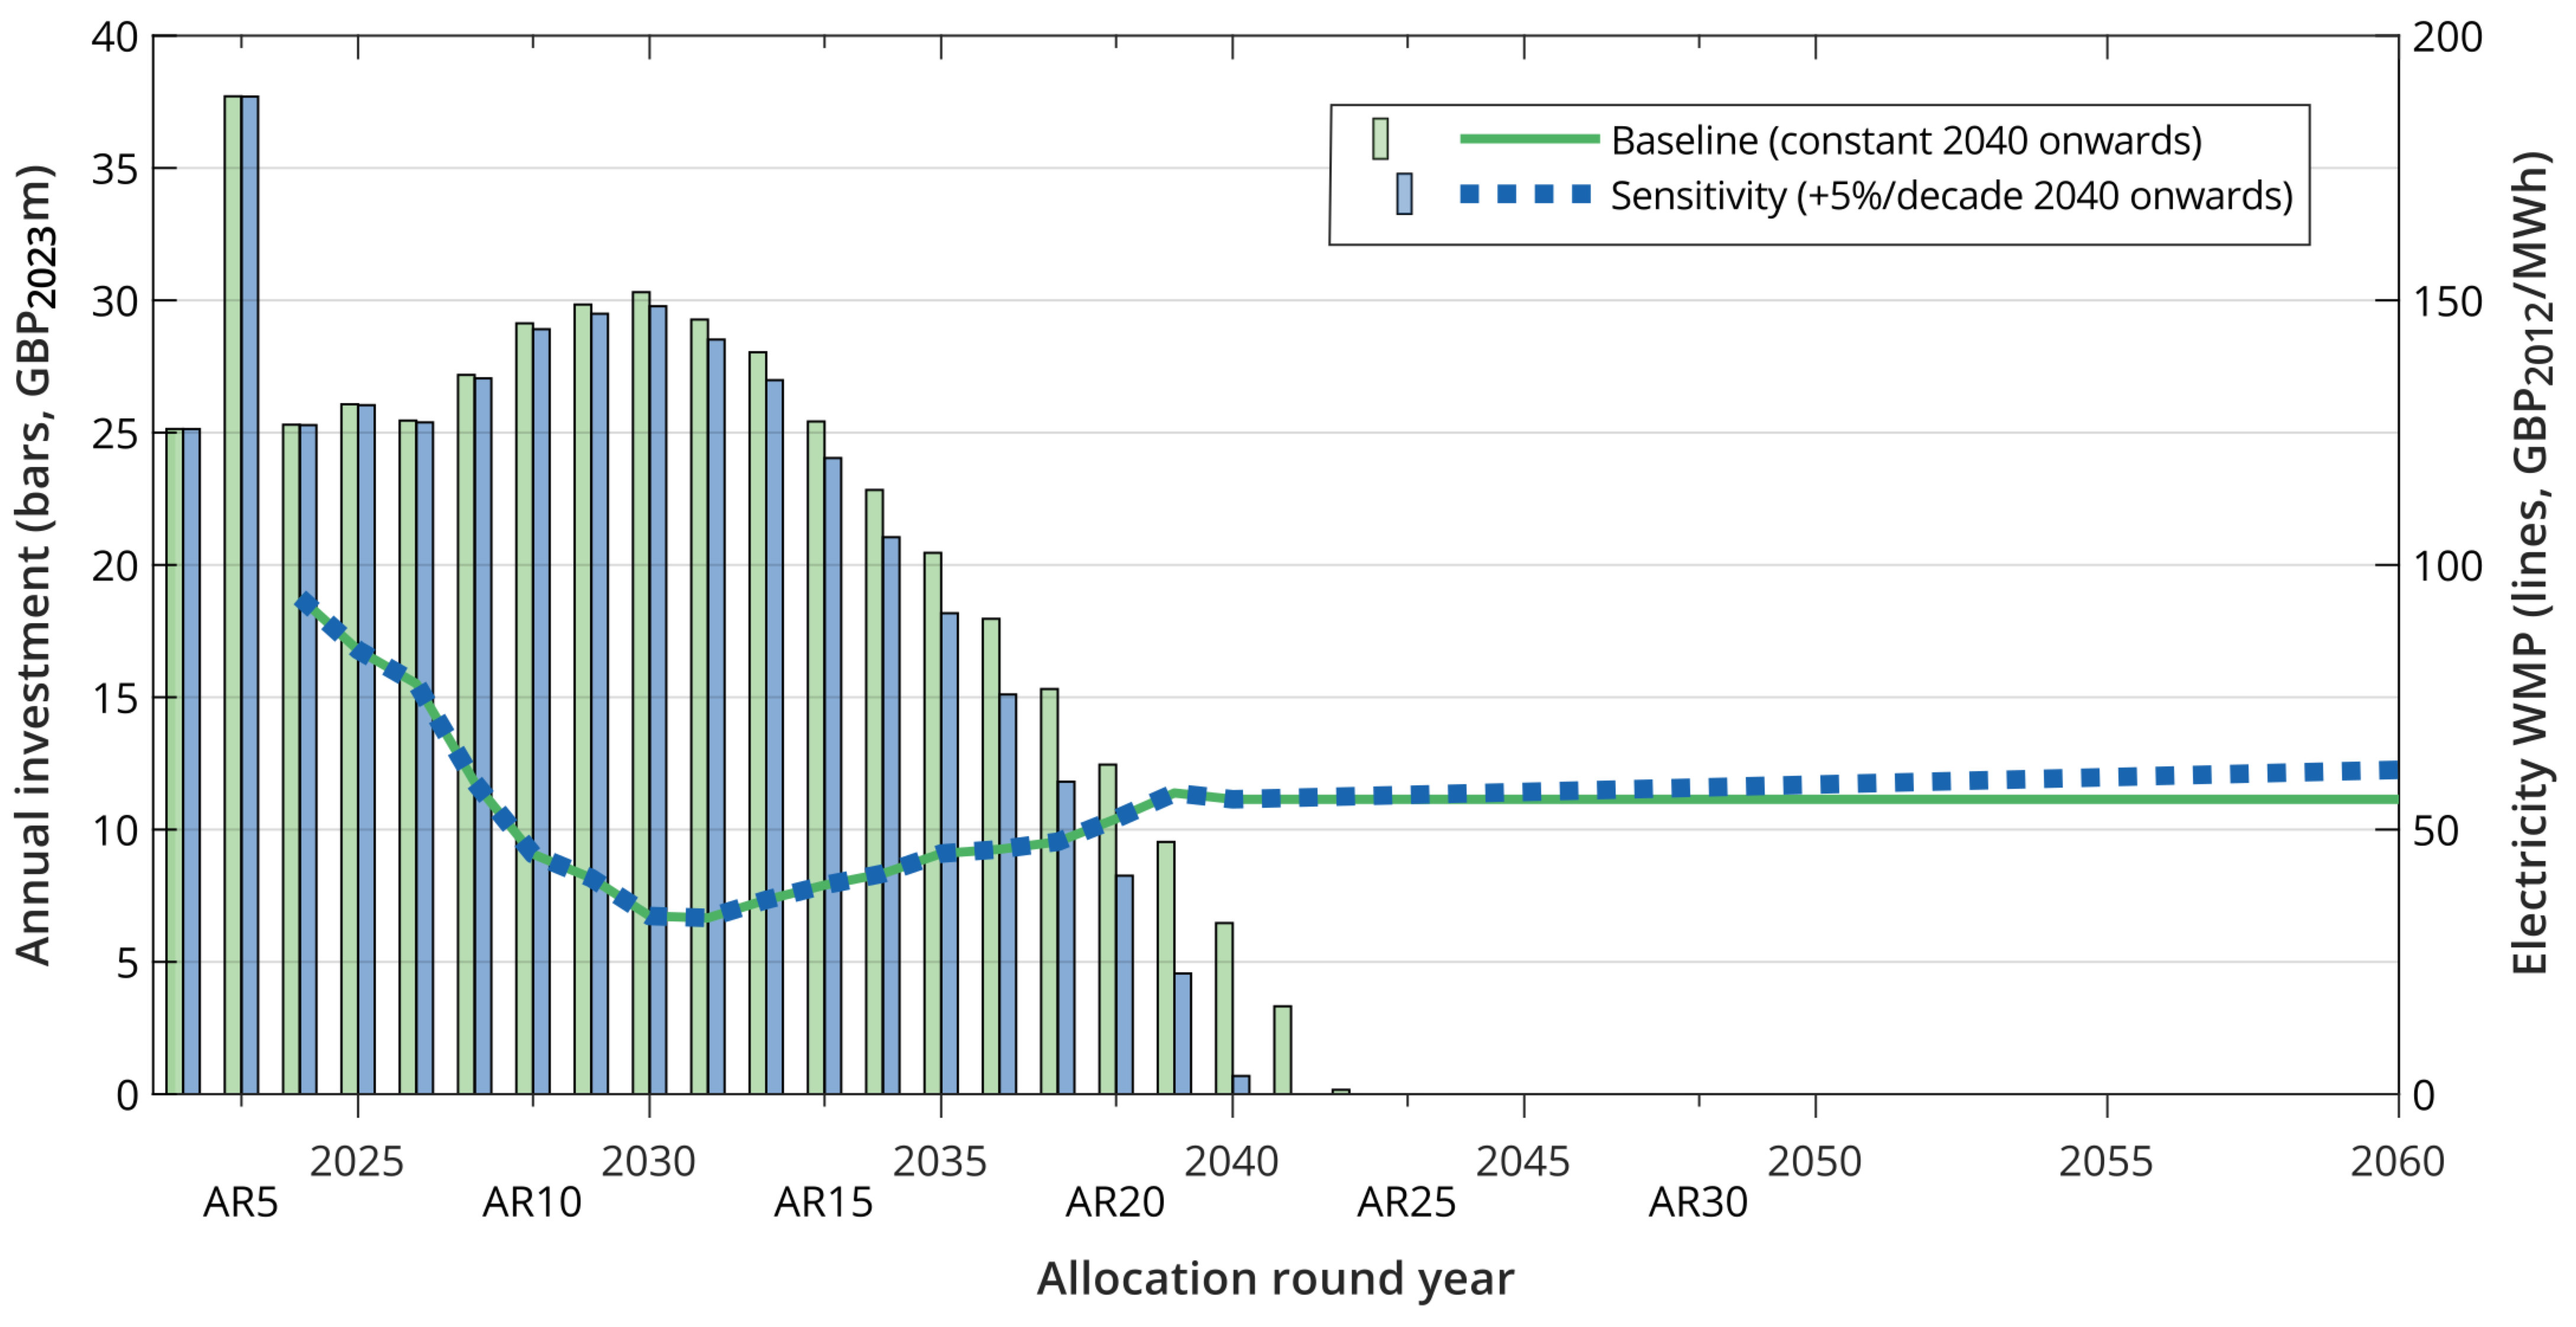
As noted in Section 3.1.2, the electricity wholesale market price for each year is from DESNZ projections out to 2040. Beyond this, two assumptions have been used: a baseline of a constant price—scenario (a) in the results—and a sensitivity of a linear 5% increase per decade.
A shown in Figure A1, the baseline assumption with a constant electricity price results in a total subsidy of GBP 6.72bn required. However, if electricity prices were to increase at 5%, the total subsidy would reduce to GBP 6.22bn (7.5% lower). The difference in cost would be borne by the electricity-bill payers instead.
For scenarios where the AR7 price is higher, and thus the cost reduction takes longer, the impact of future electricity prices will be more significant. However, the AR7 Strike Price and particularly the learning rates beyond have a more significant impact on the total subsidy required.
Figure A1.
Sensitivity to future electricity wholesale market price (WMP), showing bars of annual investment on left axis, lines of WMP on right axis. First deployments expected to happen in 2025, last subsidy is 20 years after final AR auction before cost parity is met.
Figure A1.
Sensitivity to future electricity wholesale market price (WMP), showing bars of annual investment on left axis, lines of WMP on right axis. First deployments expected to happen in 2025, last subsidy is 20 years after final AR auction before cost parity is met.
References
- The Climate Change Act 2008 (2050 Target Amendment) Order 2019. Available online: https://www.legislation.gov.uk/uksi/2019/1056/made (accessed on 4 March 2024).
- Skidmore, C. Mission Zero—Independent Review of Net Zero. Technical Report, HM Government. 2023. Available online: https://www.gov.uk/government/publications/review-of-net-zero (accessed on 4 March 2024).
- Net Zero Strategy. Build Back Greener; Technical Report; HM Government: London, UK, 2021; ISBN 978-1-5286-2938-6.
- Climate Change Committee. Progress in Reducing Emissions 2023 Progress Report to Parliament; Technical Report; Climate Change Committee: London, UK, 2023. [Google Scholar]
- National Grid ESO. Future Energy Scenarios; Technical Report; National Grid ESO: London, UK, 2023. [Google Scholar]
- Coles, D.; Angeloudis, A.; Greaves, D.; Hastie, G.; Lewis, M.; Mackie, L.; McNaughton, J.; Miles, J.; Neill, S.; Piggott, M.; et al. A review of the UK and British Channel Islands practical tidal stream energy resource. Proc. R. Soc. A 2021, 477, 20210469. [Google Scholar] [CrossRef] [PubMed]
- EVOLVE Consortium. A Review of Practical Deployment Locations for European Ocean Energy Projects. EVOLVE Technical Note: RADMApp Modelling Study. Technical Report. Available online: https://evolveenergy.eu/project-outputs/ (accessed on 18 August 2023).
- Grubb, M. The integration of renewable electricity sources. Energy Policy 1991, 19, 670–688. [Google Scholar] [CrossRef]
- Lamy, J.V.; Azevedo, I.L. Do tidal stream energy projects offer more value than offshore wind farms? A case study in the United Kingdom. Energy Policy 2018, 113, 28–40. [Google Scholar] [CrossRef]
- Pearre, N.; Adye, K.; Swan, L. Proportioning wind, solar, and in-stream tidal electricity generating capacity to co-optimize multiple grid integration metrics. Appl. Energy 2019, 242, 69–77. [Google Scholar] [CrossRef]
- Pennock, S.; Coles, D.; Angeloudis, A.; Bhattacharya, S.; Jeffrey, H. Temporal complementarity of marine renewables with wind and solar generation: Implications for GB system benefits. Appl. Energy 2022, 319, 119276. [Google Scholar] [CrossRef]
- Coles, D.; Wray, B.; Stevens, R.; Crawford, S.; Pennock, S.; Miles, J. Impacts of tidal stream power on energy system security: An Isle of Wight case study. Appl. Energy 2023, 334, 120686. [Google Scholar] [CrossRef]
- Pudjianto, D.; Frost, C.; Coles, D.; Angeloudis, A.; Smart, G.; Strbac, G. UK studies on the wider energy system benefits of tidal stream. Energy Adv. 2023, 2, 789–796. [Google Scholar] [CrossRef]
- National Grid ESO. Future Energy Scenarios 2023 Data Workbook; Dataset; National Grid ESO: London, UK, 2023. [Google Scholar]
- IRENA. Innovation Outlook: Ocean Energy Technologies; Technical Report; International Renewable Energy Agency: Abu Dhabi, United Arab Emirates, 2020. [Google Scholar]
- Serin, E.; Andres, P.; Martin, R.; Shah, A.; Valero, A. Seizing Sustainable Growth Opportunities from Tidal Stream Energy in the UK; Policy Report; London School of Economics and Political Science: London, UK, 2023. [Google Scholar]
- IEA-OES. Annual Report: An Overview of Ocean Energy Activities in 2023; Technical Report; The Executive Committee of Ocean Energy Systems: Lisbon, Portugal, 2024. [Google Scholar]
- EMEC. Tidal Clients. Available online: https://www.emec.org.uk/about-us/our-tidal-clients/ (accessed on 19 February 2024).
- IEA-OES. Annual Report, An Overview of Activities in 2017; Technical Report; The Executive Committee of Ocean Energy Systems: Lisbon, Portugal, 2018. [Google Scholar]
- Contracts for Difference (CfD) Allocation Round 4: Results. Available online: https://www.gov.uk/government/publications/contracts-for-difference-cfd-allocation-round-4-results (accessed on 1 November 2023).
- Contracts for Difference (CfD) Allocation Round 5: Results. Available online: https://www.gov.uk/government/publications/contracts-for-difference-cfd-allocation-round-5-results (accessed on 1 November 2023).
- Carbon Trust. Accelerating Marine Energy. The Potential for Cost Reduction—Insights from the Carbon Trust Marine Energy Accelerator; Technical Report CTC797; Carbon Trust: London, UK, 2011. [Google Scholar]
- Black & Veatch Ltd. UK Tidal Current Resource & Economics; Technical Report; Black & Veatch Ltd.: London, UK, 2011. [Google Scholar]
- Smart, G.; Noonan, M. Tidal Stream and Wave Energy Cost Reduction and Industrial Benefit; Technical Report; Offshore Renewable Energy Catapult: Blyth, UK, 2018. [Google Scholar]
- Frost, C. Cost Reduction Pathway of Tidal Stream Energy in the UK and France; Technical Report; Offshore Renewable Energy Catapult/TIGER Project: Blyth, UK, 2022. [Google Scholar]
- Callaghan, J.; Boud, R. Future Marine Energy. Results of the Marine Energy Challenge: Cost Competitiveness and Growth of Wave and Tidal Stream Energy; Technical Report CTC601; Carbon Trust: London, UK, 2006. [Google Scholar]
- MacGillivray, A.; Jeffrey, H.; Winskel, M.; Bryden, I. Innovation and cost reduction for marine renewable energy: A learning investment sensitivity analysis. Technol. Forecast. Soc. Chang. 2014, 87, 108–124. [Google Scholar] [CrossRef]
- Kerr, P.; Noble, D.R.; Hodges, J.; Jeffrey, H. Implementing Radical Innovation in Renewable Energy Experience Curves. Energies 2021, 14, 2364. [Google Scholar] [CrossRef]
- Vanegas Cantarero, M.; Avellaneda Domene, G.; Noble, D.R.; Pennock, S.; Jeffrey, H.; Ruiz Minguela, P.; Tunga, I.; Morrison, N.; Apolonia, M.; Luxcey, N.; et al. DTOceanPlus D8.1 Potential Markets for Ocean Energy; Technical Report; DTOceanPlus Consortium: Edinburgh, UK, 2020. [Google Scholar]
- Hansen, J.P.; Narbel, P.A.; Aksnes, D.L. Limits to growth in the renewable energy sector. Renew. Sustain. Energy Rev. 2017, 70, 769–774. [Google Scholar] [CrossRef]
- European Commission. An EU Strategy to Harness the Potential of Offshore Renewable Energy for a Climate Neutral Future; Technical Report COM/2020/741 final; European Commission: Brussels, Belgium, 2020.
- Noble, D.R. D3.3 Report on Infrastructural and Industrial Production Requirements; Technical Report; ETIP Ocean: Brussels, Belgium; Available online: https://www.etipocean.eu/knowledge_hub/report-on-infrastructural-and-industrial-production-requirements/ (accessed on 14 April 2024).
- Earth Policy Institute. Data Centre: Climate, Energy, and Transportation—Cumulative Installed Wind Power Capacity in Denmark, 1980–2014. Dataset. Available online: http://www.earth-policy.org/datacenter/xls/book_tgt_wind_7.xlsx (accessed on 24 November 2022).
- Earth Policy Institute. Data Centre: Climate, Energy, and Transportation—Cumulative Installed Wind Power Capacity in Top Ten Countries and the World, 1980–2014. Dataset. Available online: http://www.earth-policy.org/datacenter/xls/book_tgt_wind_2.xlsx (accessed on 24 November 2022).
- Bilgili, M.; Yasar, A.; Simsek, E. Offshore wind power development in Europe and its comparison with onshore counterpart. Renew. Sustain. Energy Rev. 2011, 15, 905–915. [Google Scholar] [CrossRef]
- IRENA. IRENASTAT Online Data Query Tool. Dataset. Installed Electricity Capacity by Country/Area (MW) by Country/Area, Technology, Grid Connection and Year. Available online: https://pxweb.irena.org/pxweb/en/ (accessed on 26 July 2023).
- WindEurope. Wind Energy in Europe 2022 Statistics and the Outlook for 2023–2027. Technical Report. Available online: https://windeurope.org/intelligence-platform/product/wind-energy-in-europe-2022-statistics-and-the-outlook-for-2023-2027/ (accessed on 1 March 2023).
- Ferioli, F.; Schoots, K.; van der Zwaan, B.C. Use and limitations of learning curves for energy technology policy: A component-learning hypothesis. Energy Policy 2009, 37, 2525–2535. [Google Scholar] [CrossRef]
- Jamasb, T. Technical Change Theory and Learning Curves: Patterns of Progress in Electricity Generation Technologies. Energy J. 2007, 28, 51–72. [Google Scholar] [CrossRef]
- Junginger, M.; Faaij, A.; Turkenburg, W.C. Global experience curves for wind farms. Energy Policy 2005, 33, 133–150. [Google Scholar] [CrossRef]
- International Energy Agency. Experience Curves for Energy Technology Policy; OECD: Paris, France, 2000. [Google Scholar] [CrossRef]
- IRENA. Renewable Power Generation Costs in 2019. Dataset. ISBN 978-92-9260-244-4. Available online: https://www.irena.org/publications/2020/Jun/Renewable-Power-Costs-in-2019 (accessed on 4 December 2023).
- IRENA. Renewable Power Generation Costs in 2022. Dataset. ISBN 978-92-9260-544-5. Available online: https://www.irena.org/Publications/2023/Aug/Renewable-power-generation-costs-in-2022 (accessed on 4 December 2023).
- Rubin, E.S.; Azevedo, I.M.L.; Jaramillo, P.; Yeh, S. A review of learning rates for electricity supply technologies. Energy Policy 2015, 86, 198–218. [Google Scholar] [CrossRef]
- Malhotra, A.; Schmidt, T.S. Accelerating Low-Carbon Innovation. Joule 2020, 4, 2259–2267. [Google Scholar] [CrossRef]
- Samadi, S. The experience curve theory and its application in the field of electricity generation technologies—A literature review. Renew. Sustain. Energy Rev. 2018, 82, 2346–2364. [Google Scholar] [CrossRef]
- Millman, G. AR5: Urgent Government Response Needed to Rebuild Leadership in UK Offshore Wind—Regen. Available online: https://www.regen.co.uk/ar5-urgent-government-response-needed-to-rebuild-leadership-in-uk-offshore-wind/ (accessed on 20 February 2024).
- Office for National Statistics. Gross Domestic Product at Market Prices: Implied Deflator:SA. Dataset. Available online: https://www.ons.gov.uk/economy/grossdomesticproductgdp/timeseries/ybgb/qna/ (accessed on 13 November 2023).
- Department for Energy Security and Net Zero. Energy and Emissions Projections: 2022 to 2040—Annex M: Growth Assumptions and Prices. Dataset. Available online: https://www.gov.uk/government/publications/energy-and-emissions-projections-2022-to-2040 (accessed on 13 November 2023).
- Office for National Statistics. Consumer Price Inflation Tables. Dataset. Available online: https://www.ons.gov.uk/economy/inflationandpriceindices/datasets/consumerpriceinflation (accessed on 12 December 2023).
- Grattan, K.; Jeffrey, H. Delivering Net Zero: Forecasting Wave and Tidal Stream Deployment in UK Waters by 2050. Technical Report. Available online: https://www.policyandinnovationedinburgh.org/policymakers-toolkit.html (accessed on 21 November 2023).
- Committee on Climate Change. Net Zero Technical Report. Available online: https://www.theccc.org.uk/publication/net-zero-technical-report/ (accessed on 4 March 2024).
- Energy Systems Catapult. Innovating to Net Zero; Technical Report; Energy Systems Catapult: Birmingham, UK, 2020. [Google Scholar]
- European Commission. SET-Plan Ocean Energy—Implementation Plan; European Commission: Brussels, Belgium, 2021.
- Contracts for Difference (CfD) Allocation Round 6: Administrative Strike Prices Methodology Note. Available online: https://www.gov.uk/government/publications/contracts-for-difference-cfd-allocation-round-6-administrative-strike-prices-methodology-note (accessed on 14 February 2024).
- UK launches Biggest Electricity Market Reform in a Generation. Available online: https://www.gov.uk/government/news/uk-launches-biggest-electricity-market-reform-in-a-generation (accessed on 27 February 2024).
Figure 1.
Historical growth and future estimates of European deployment of renewable technologies (EU27+UK), solar PV, onshore and offshore wind data [33,34,35,36,37]. Tidal stream shows historical deployments and known projects [25], plus a plausible growth scenario reaching 20–40 GW by 2050 [32]. Figure adapted from [32].

Figure 2.
Graphical illustration of the learning investment required to reach a breakeven cost level . Shown on log–log axis. Adapted from [38].
Figure 2.
Graphical illustration of the learning investment required to reach a breakeven cost level . Shown on log–log axis. Adapted from [38].
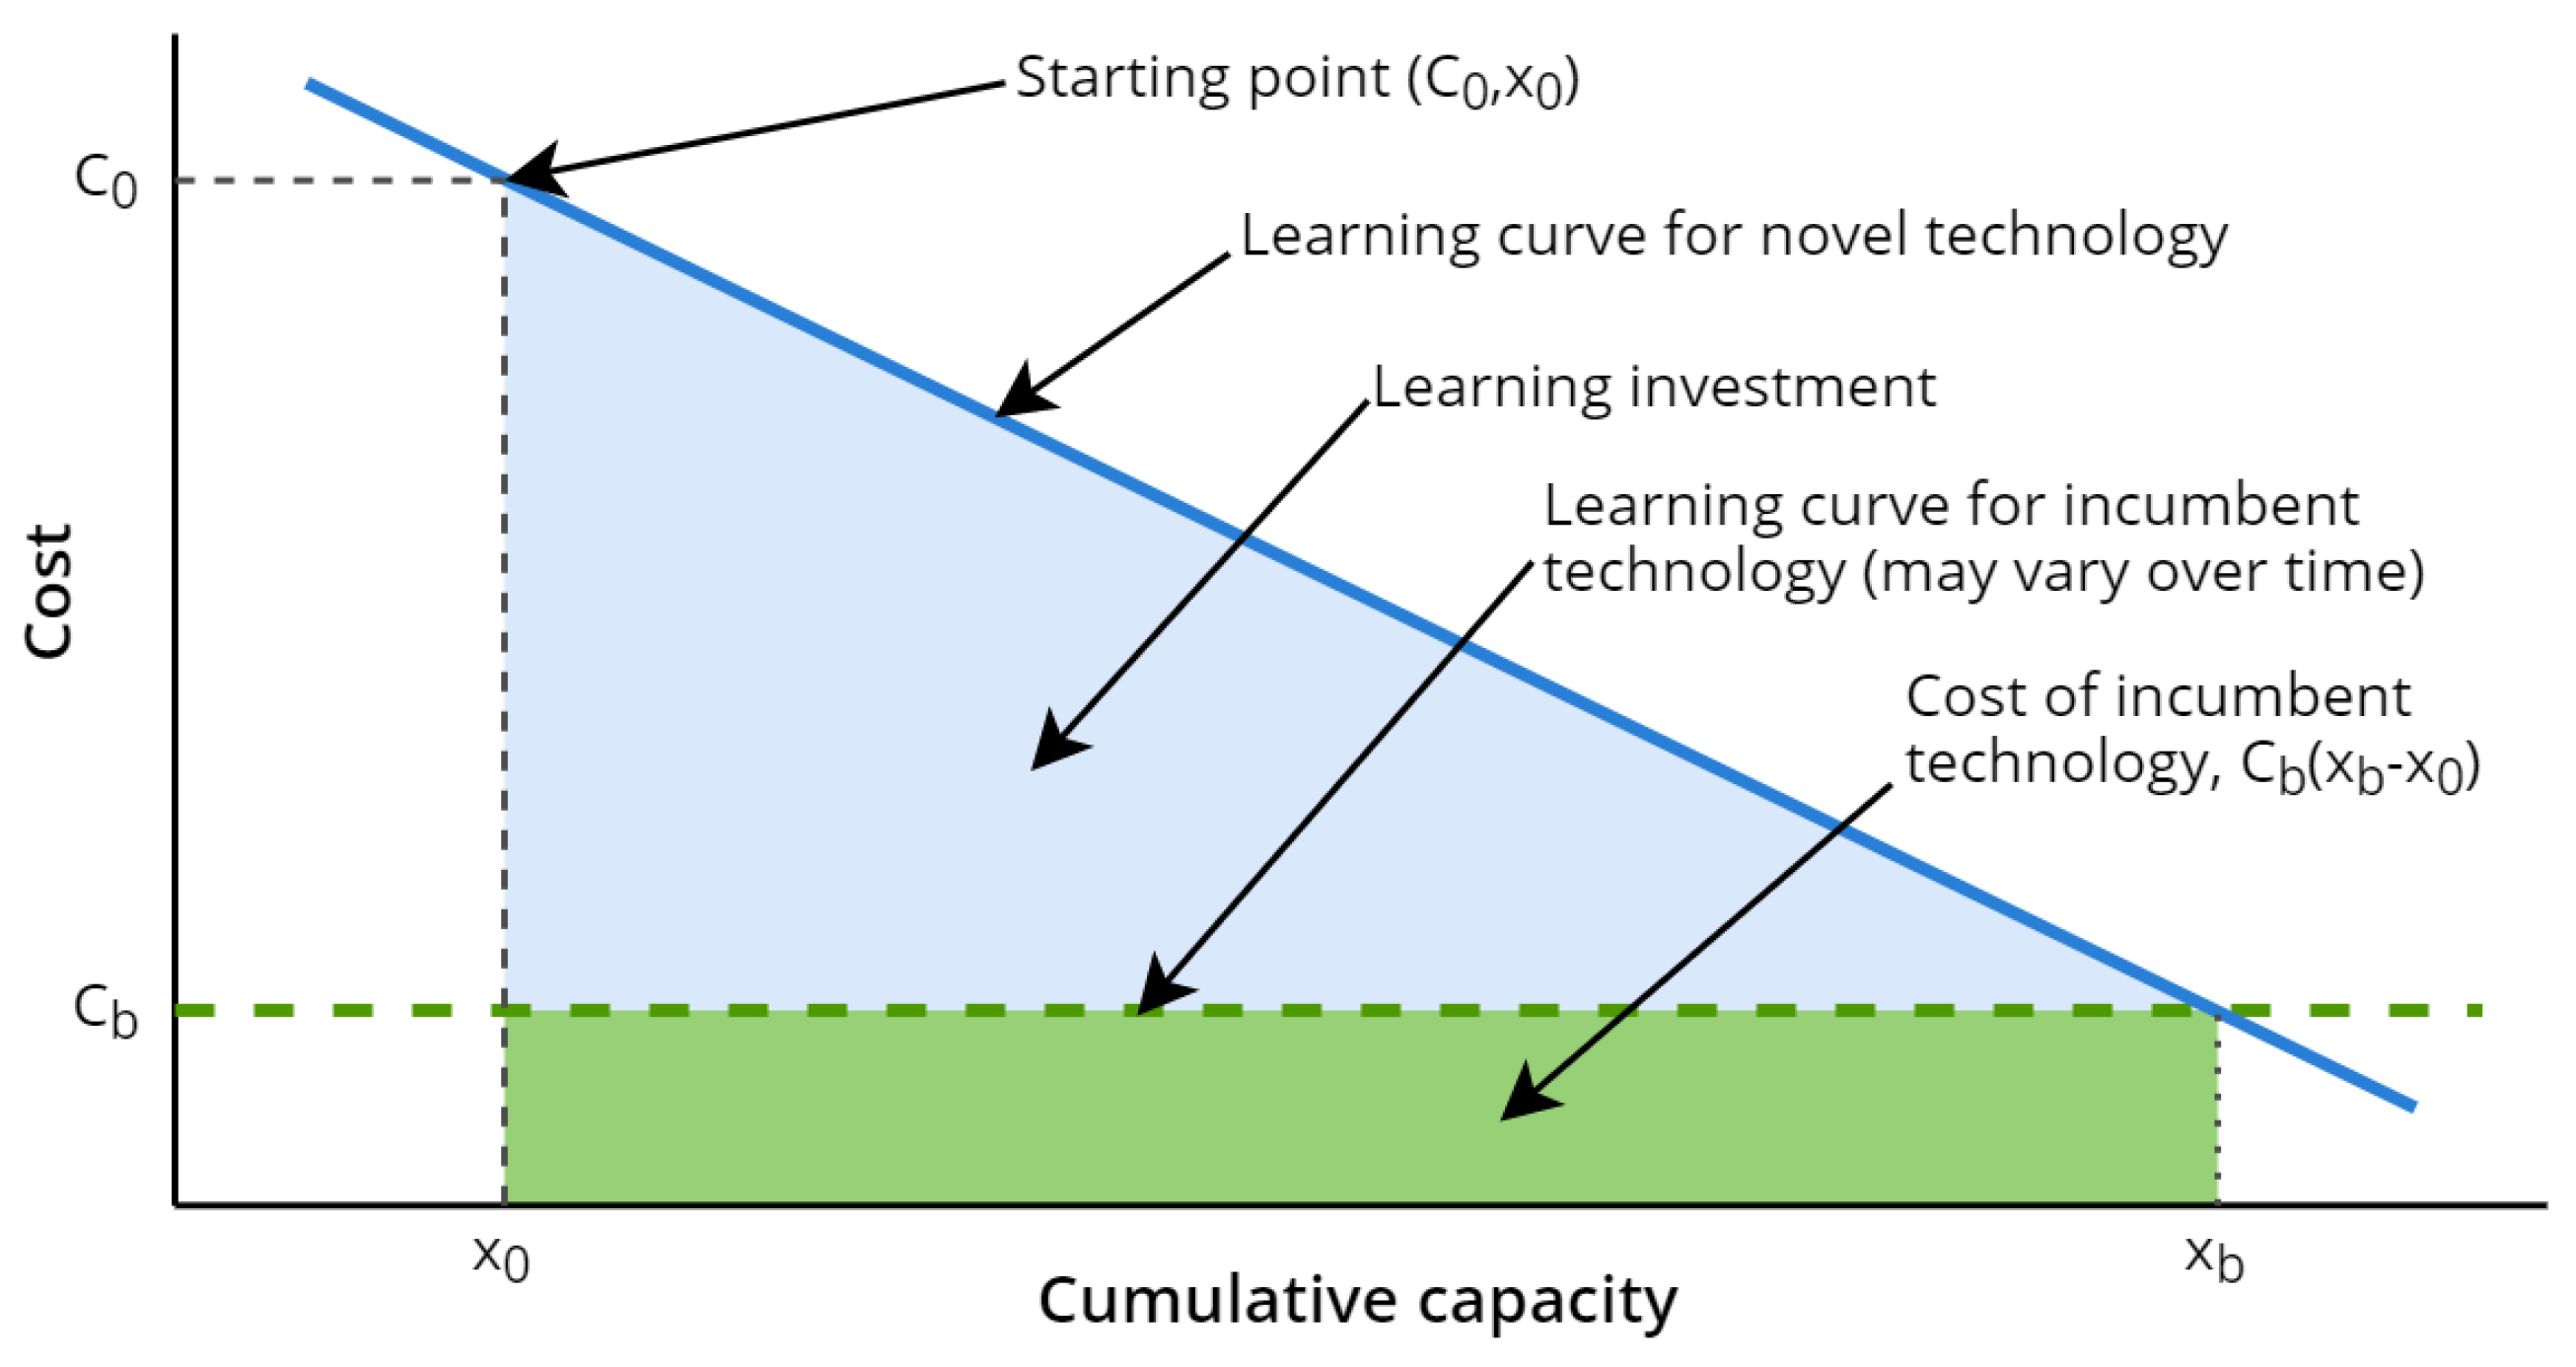
Figure 3.
Estimated global learning rates (%), trend equations and coefficient of determination () for selected renewable technologies. Data from IRENA [43]. CSP: Concentrating solar power.
Figure 3.
Estimated global learning rates (%), trend equations and coefficient of determination () for selected renewable technologies. Data from IRENA [43]. CSP: Concentrating solar power.

Figure 4.
Range of estimated CAPEX learning rates for different technologies. For each box, the quartiles and whiskers cover the full range of values. Individual studies shown by markers: green circles represent a global scope, purple crosses for country/regional scope. Adapted from [45].
Figure 4.
Range of estimated CAPEX learning rates for different technologies. For each box, the quartiles and whiskers cover the full range of values. Individual studies shown by markers: green circles represent a global scope, purple crosses for country/regional scope. Adapted from [45].
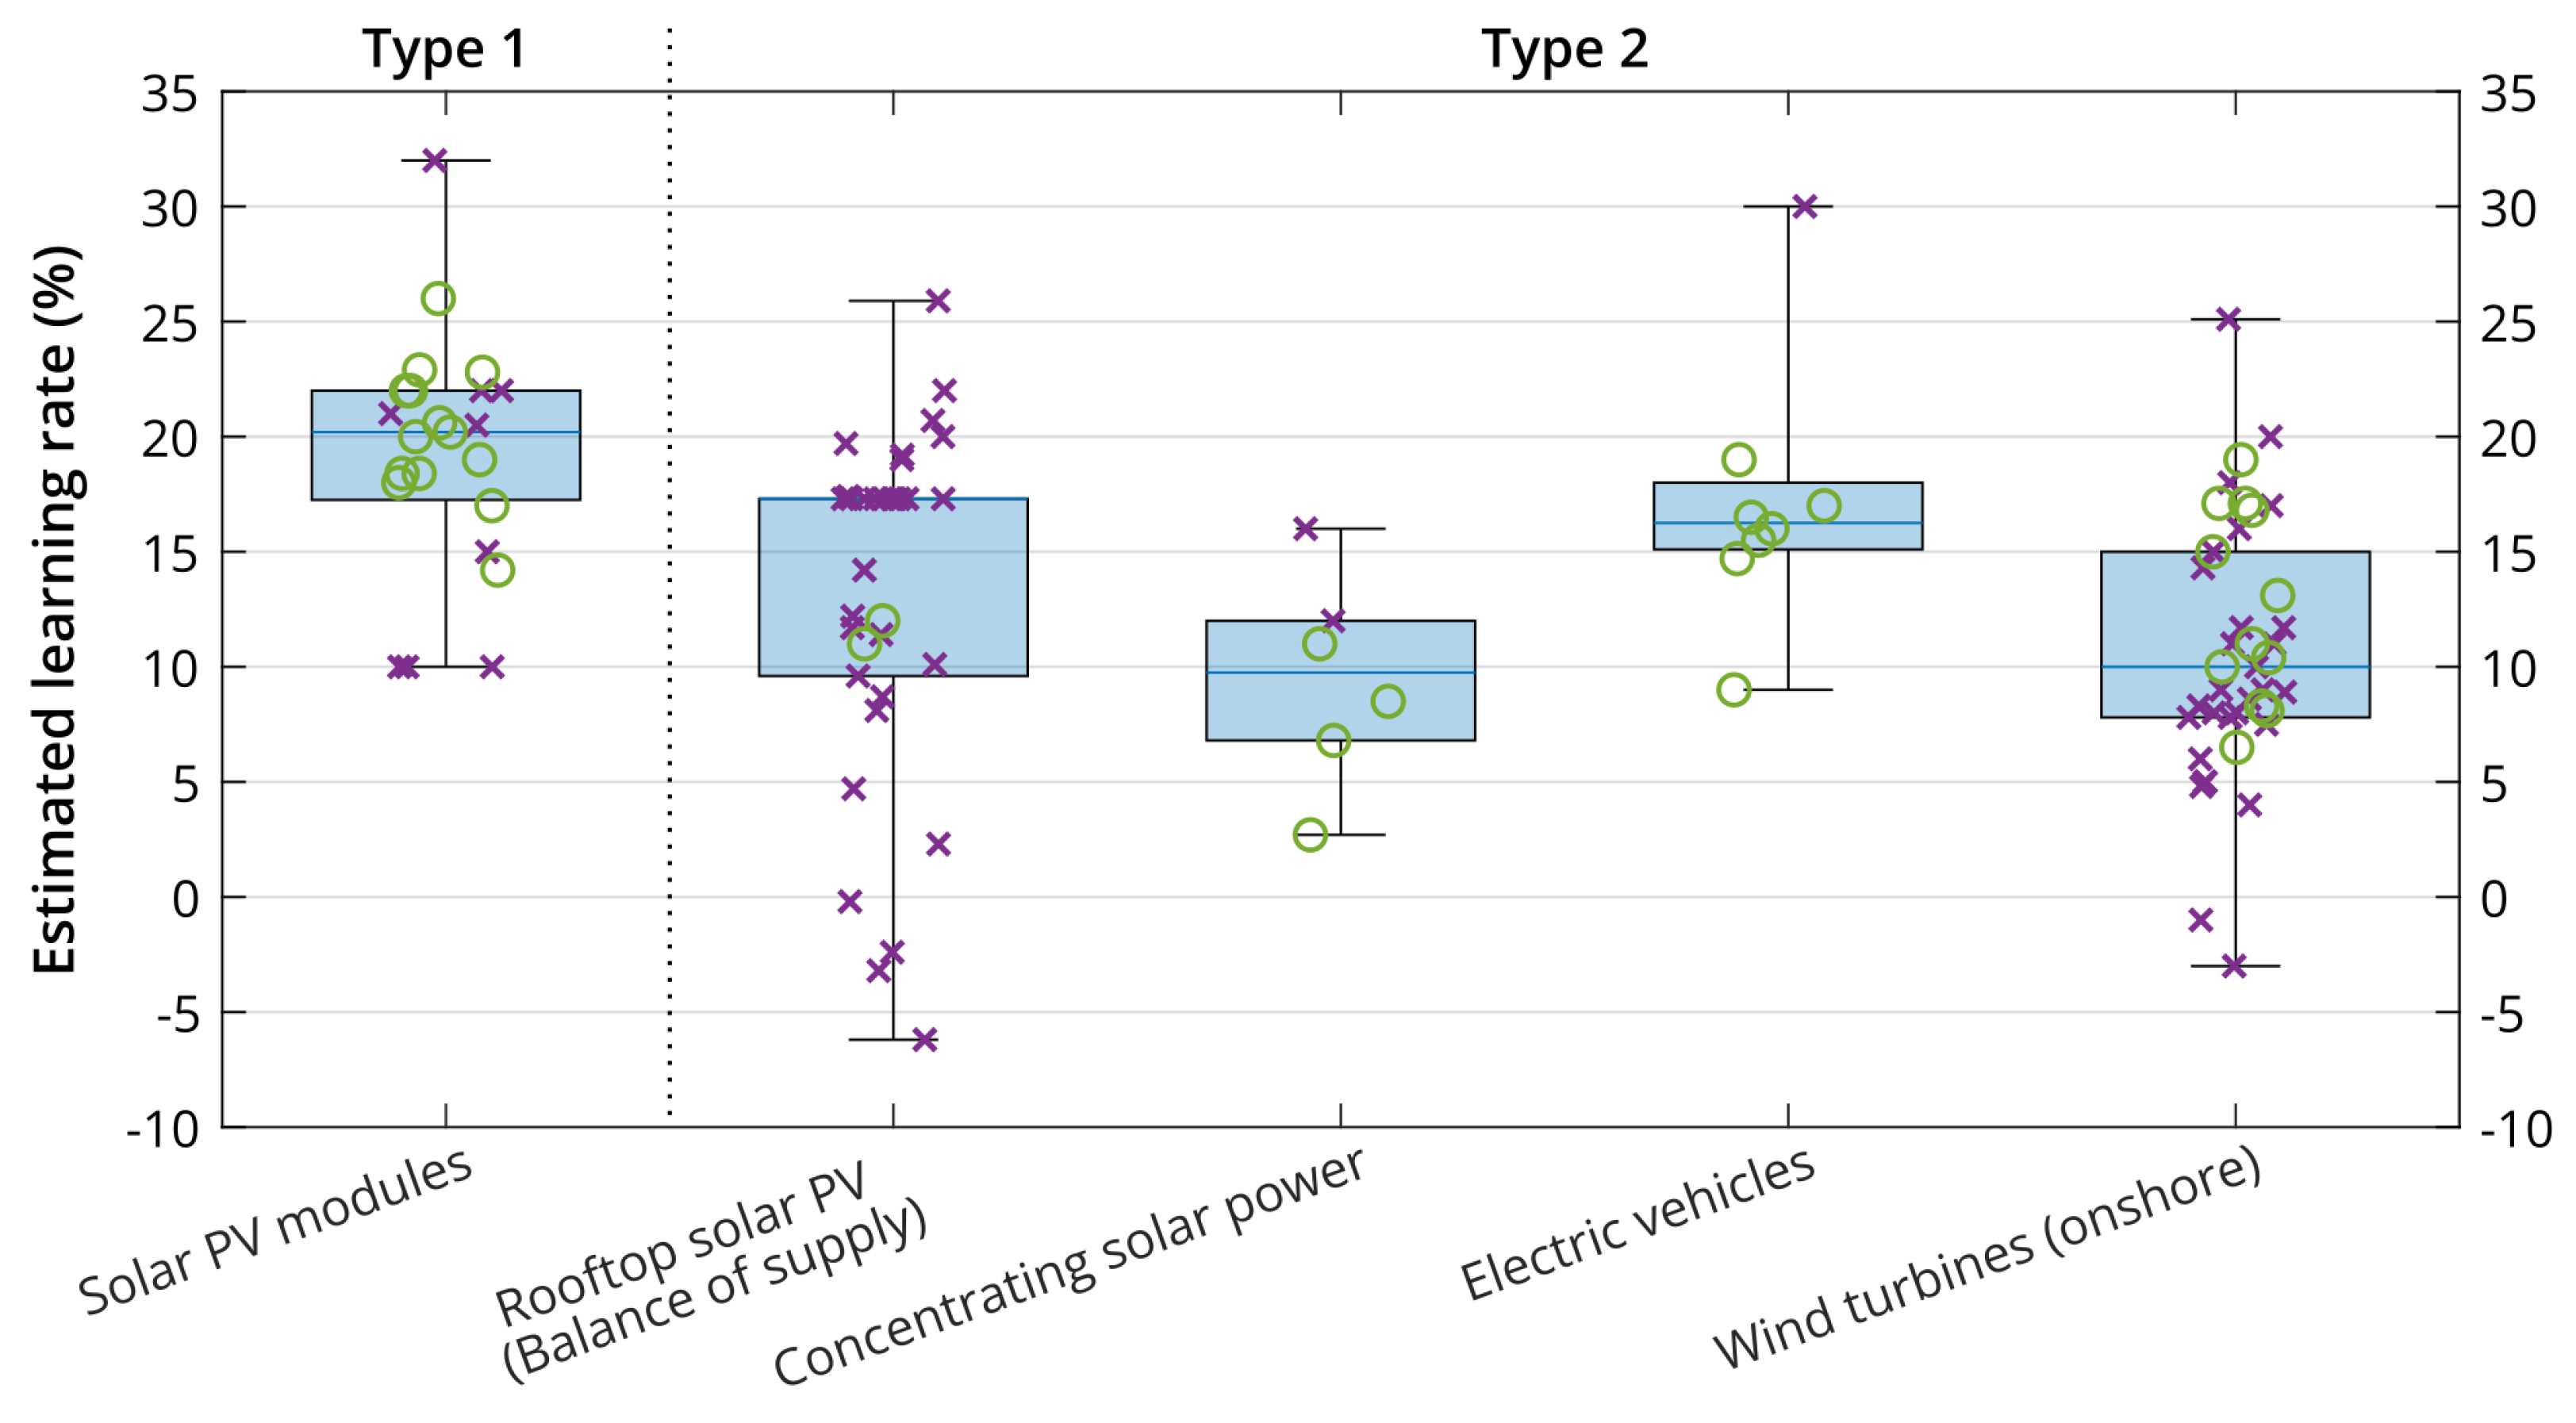
Figure 5.
DESNZ 2023 Energy and emissions projections: electricity wholesale market price deflated to /MWh, with scenarios for 2040 onwards.
Figure 5.
DESNZ 2023 Energy and emissions projections: electricity wholesale market price deflated to /MWh, with scenarios for 2040 onwards.
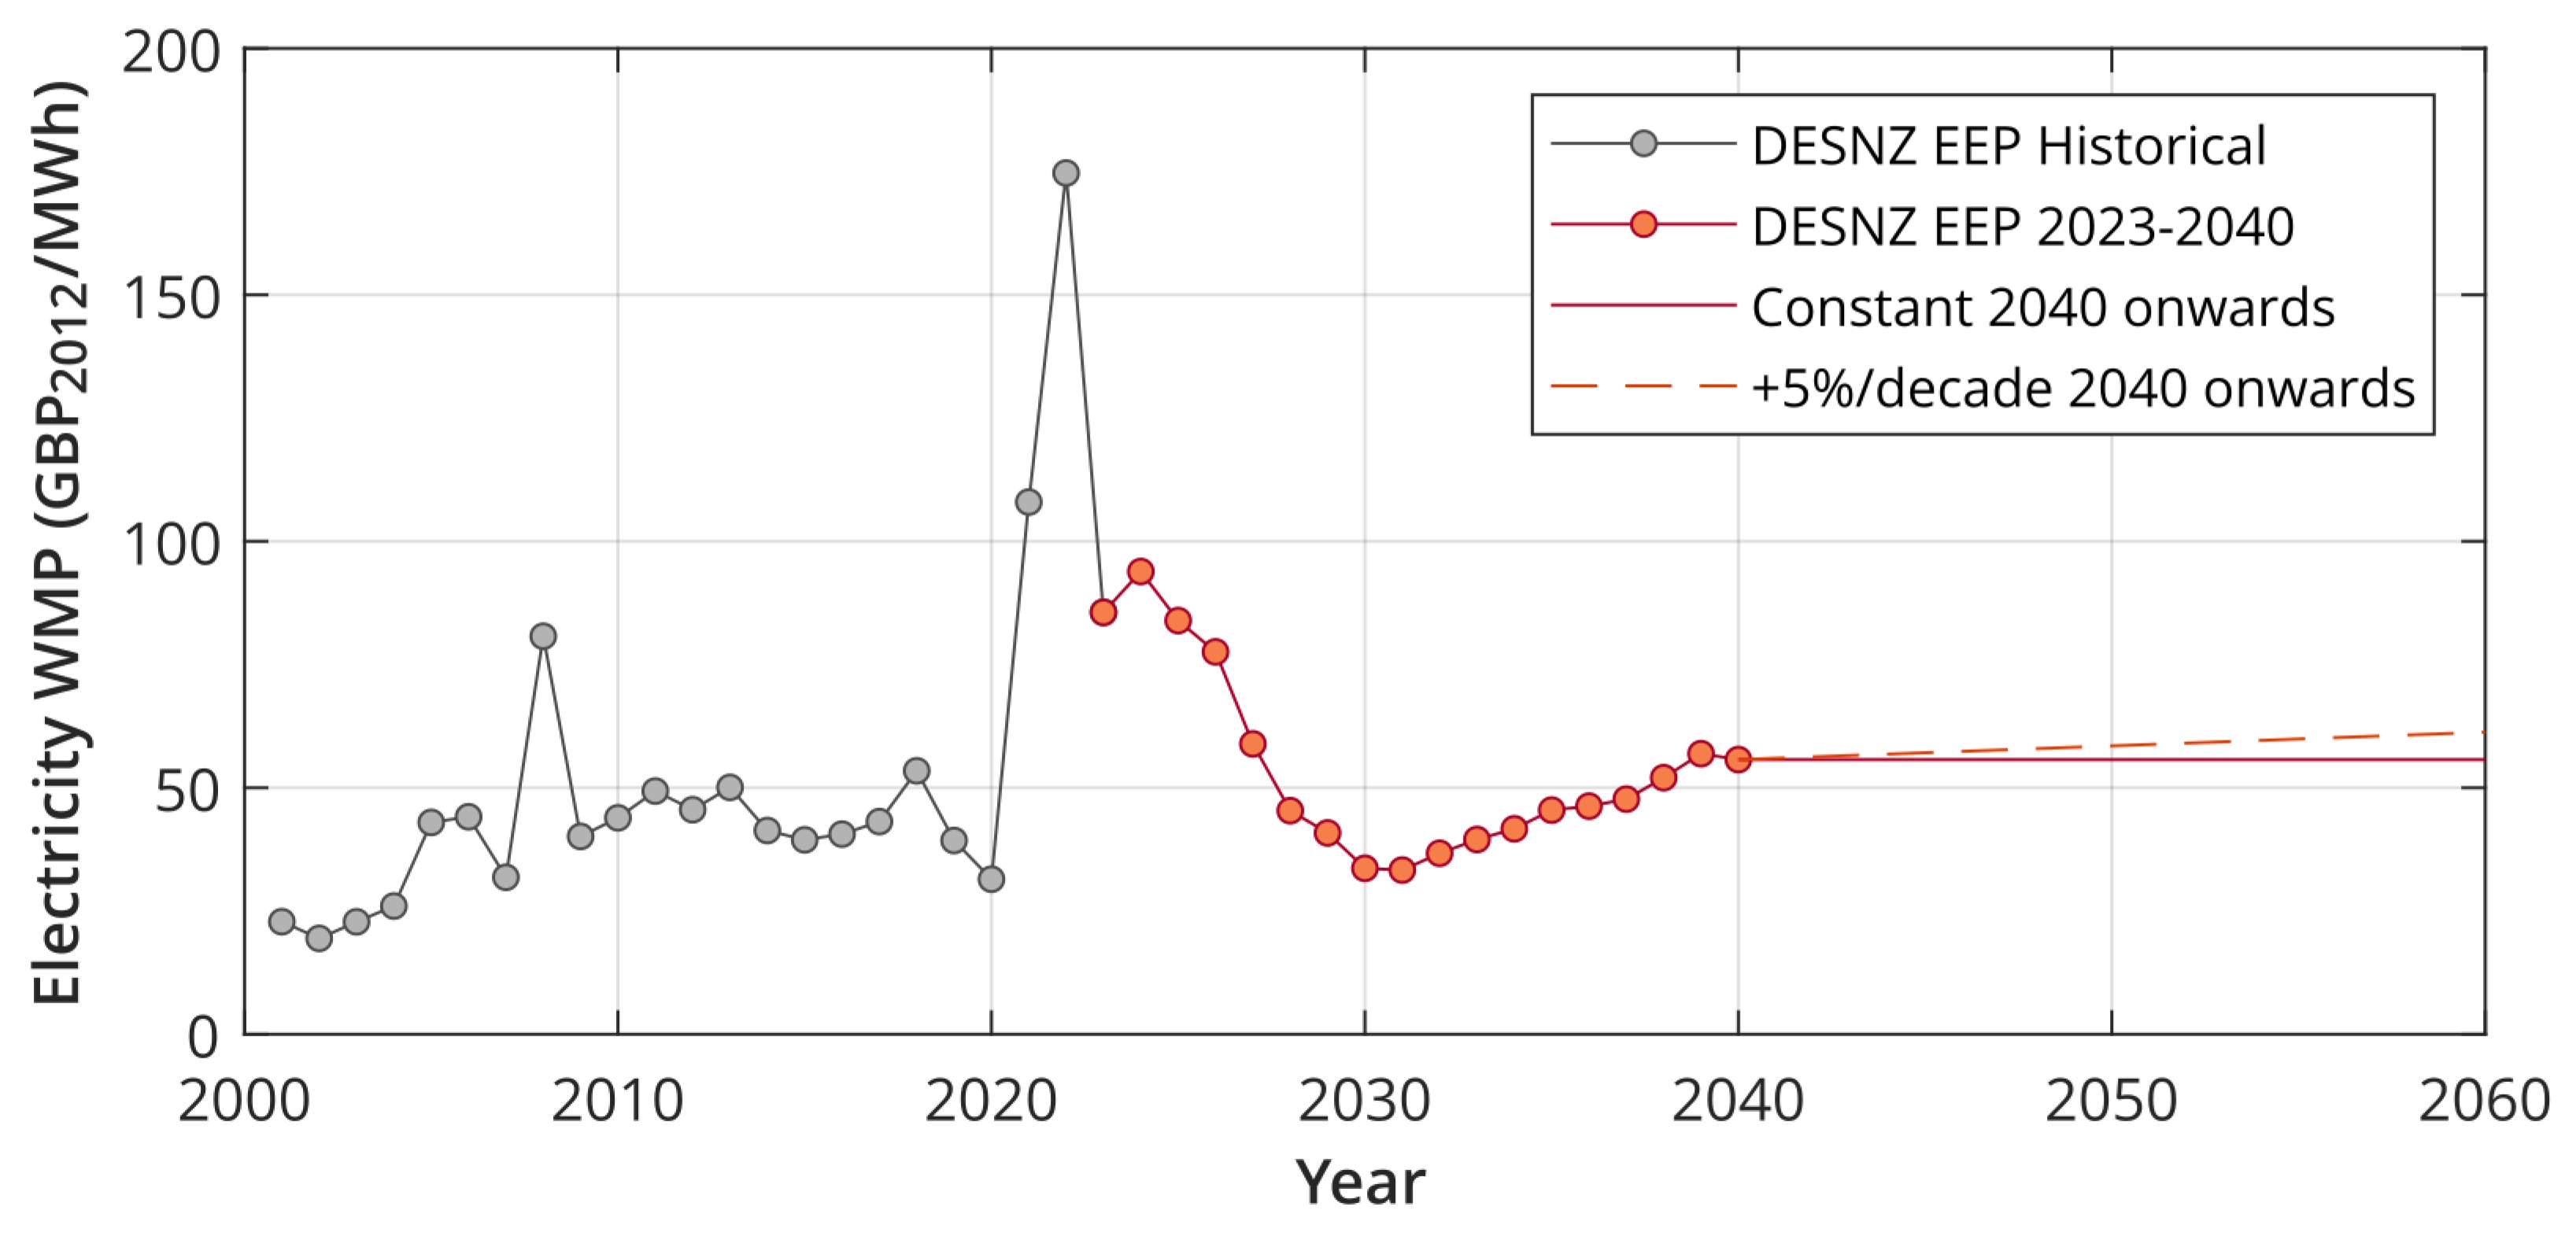
Figure 6.
Illustration of phased deployment 3–5 years after auction with rounds AR4–6 highlighted in blue shading. Deployments until end of 2027 underlined, which AR8 ‘learns’ from. AR7 baseline deployment also marked.
Figure 6.
Illustration of phased deployment 3–5 years after auction with rounds AR4–6 highlighted in blue shading. Deployments until end of 2027 underlined, which AR8 ‘learns’ from. AR7 baseline deployment also marked.

Figure 7.
Sensitivity of total investment to learning rate. * insufficient UK resources and cost parity after 2050.
Figure 7.
Sensitivity of total investment to learning rate. * insufficient UK resources and cost parity after 2050.

Figure 8.
Annual investment distribution and sensitivity to learning rate. * insufficient UK resources and cost parity after 2050.
Figure 8.
Annual investment distribution and sensitivity to learning rate. * insufficient UK resources and cost parity after 2050.
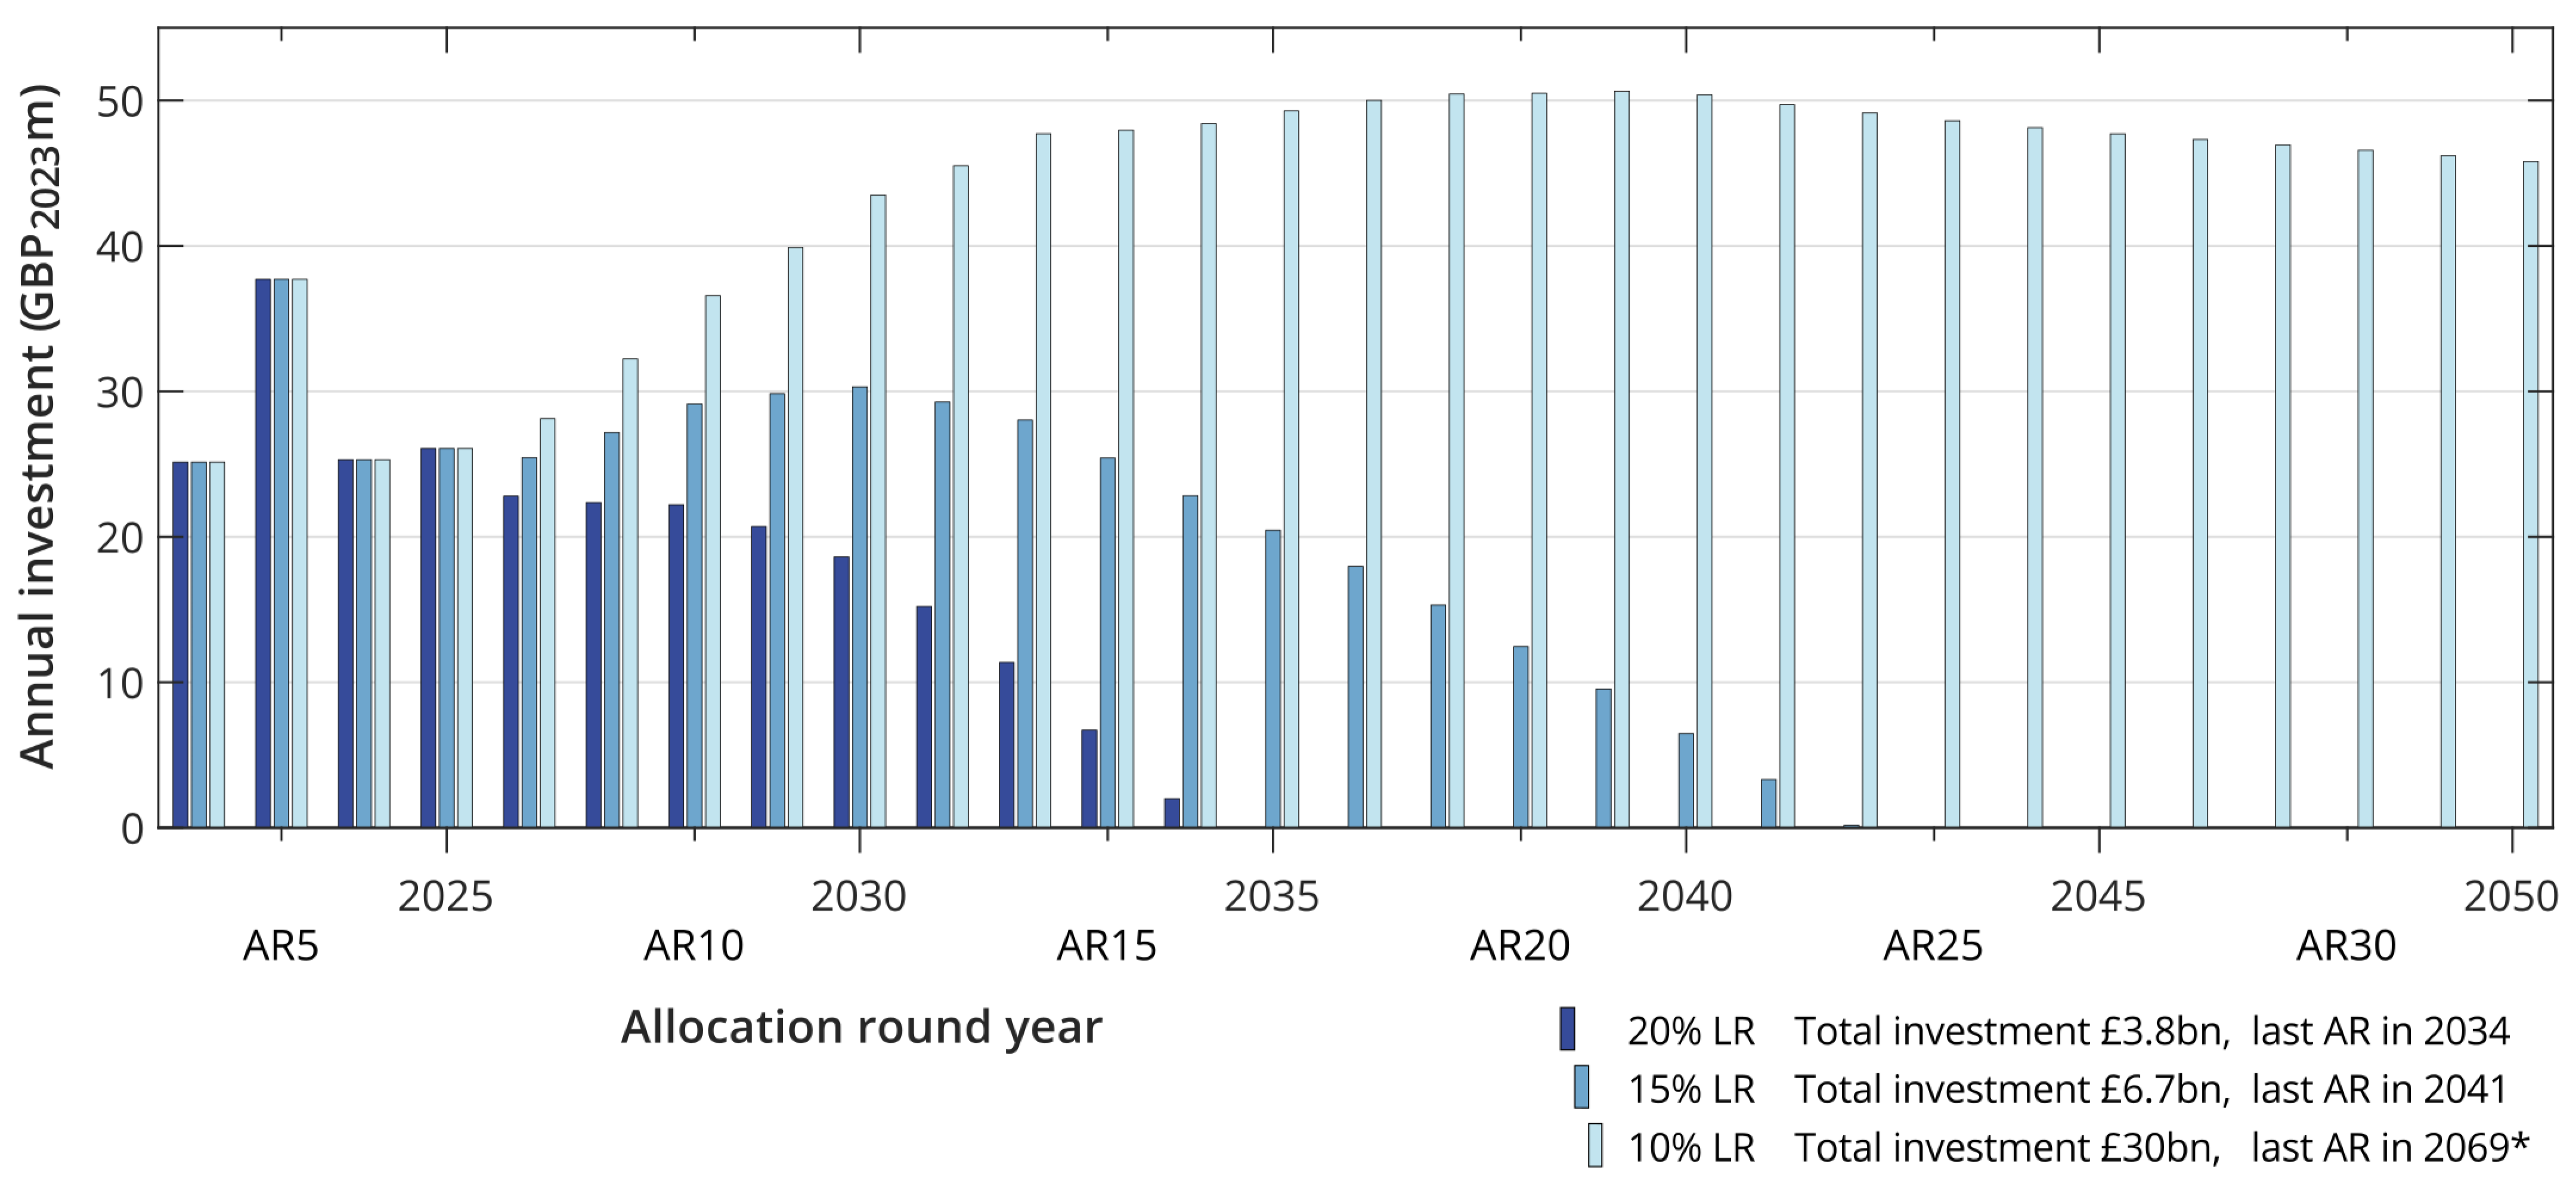
Figure 9.
Scenarios (a)–(j) showing sensitivity to AR6 and AR7 Strike Prices, see text for details. Colours reflect AR6 value. * Does not meet cost parity by 2050, ‡ Insufficient UK resources.
Figure 9.
Scenarios (a)–(j) showing sensitivity to AR6 and AR7 Strike Prices, see text for details. Colours reflect AR6 value. * Does not meet cost parity by 2050, ‡ Insufficient UK resources.

Figure 10.
Annual investment distribution showing sensitivity to AR6 and AR7 Strike Prices for selected scenarios; see Table 4 for scenario details. Colours reflect AR6 value.
Figure 10.
Annual investment distribution showing sensitivity to AR6 and AR7 Strike Prices for selected scenarios; see Table 4 for scenario details. Colours reflect AR6 value.

Figure 11.
Sensitivity to learning rate (LR) and AR6/AR7 Strike Prices, multiplier for other LR relative to 15% baseline. Colours reflect AR6 Strike Price, grouped bars show LR in 2.5% increments from 20% (darker) to 10% (lighter). 10% not shown for (f), (g) and (i) as too extreme.
Figure 11.
Sensitivity to learning rate (LR) and AR6/AR7 Strike Prices, multiplier for other LR relative to 15% baseline. Colours reflect AR6 Strike Price, grouped bars show LR in 2.5% increments from 20% (darker) to 10% (lighter). 10% not shown for (f), (g) and (i) as too extreme.

Table 1.
Projected installed capacity for different generation technologies in Great Britain [14].
Table 1.
Projected installed capacity for different generation technologies in Great Britain [14].
| 2022 | 2030 | 2040 | 2050 | |
|---|---|---|---|---|
| Interconnectors | 7.4 | 11.7–17.5 | 15.9–25.4 | 15.9–26.8 |
| Biomass | 4.4 | 3.5–4.8 | 0.8–3.4 | 0.2–4.0 |
| Bioenergy with Carbon Capture and Storage | 0.0 | 0.0–0.6 | 2.2–8.8 | 2.2–8.8 |
| Nuclear | 6.1 | 4.6–4.6 | 9.1–11.4 | 9.8–15.9 |
| Hydrogen | 0.0 | 0.0–1.4 | 0.0–16.0 | 4.2–22.6 |
| Fossil fuel | 42.3 | 23.0–47.9 | 0.0–42.6 | 0.0–37.8 |
| Gas with Carbon Capture and Storage | 0.0 | 0.0–1.8 | 3.3–13.2 | 3.3–21.3 |
| Solar | 14.0 | 18.7–41.4 | 30.7–71.3 | 42.7–91.2 |
| Offshore Wind | 13.4 | 31.5–48.4 | 64.3–96.8 | 77.6–115.0 |
| Onshore Wind | 13.6 | 20.0–28.8 | 26.8–38.7 | 28.3–44.4 |
| Other Renewables † | 5.2 | 5.9–6.4 | 5.6–6.9 | 6.1–12.8 |
| Storage | 5.3 | 13.4–29.0 | 18.1–45.6 | 21.7–52.1 |
| Total Installed capacity | 111.7 | 158.7–206.7 | 231.2–320.5 | 280.8–369.3 |
| Peak System Demand | 57.7 | 62.8–68.5 | 62.8–68.5 | 97.5–114.2 |
† other renewables includes the tidal stream; however this projection by the National Grid assumes a lower installed capacity than in the rest of this paper.
Table 3.
Model inputs for CfD allocation rounds 4–7.
| Year | Round | Amount | Strike Price(s) | Notes |
|---|---|---|---|---|
| (MW) | (/MWh) | |||
| 2022 | AR4 | 40.8 | 178.54 | From 2022 auction results [20] |
| 2023 | AR5 | 53.0 | 198.00 | From 2023 auction results [21] |
| 2024 | AR6 | 40.8 | 178.54–261.00 | Deployment amount as per AR4, SP range of AR4 SP to AR6 ASP [55] |
| 2025 | AR7 | 51.0 | 156.00–220.00 | Assumed growth in deployment to meet trajectory, and wide range of SP considered |
Table 4.
Scenarios (a)–(j) showing sensitivity to AR6 and AR7 Strike Prices, see text for details, with total investment required and last allocation round before cost parity met. Colours reflect AR6 value. * Does not meet cost parity by 2050, ‡ Insufficient UK resources.
Table 4.
Scenarios (a)–(j) showing sensitivity to AR6 and AR7 Strike Prices, see text for details, with total investment required and last allocation round before cost parity met. Colours reflect AR6 value. * Does not meet cost parity by 2050, ‡ Insufficient UK resources.
| Scenario | AR6 | AR7 | Total Investment | Last AR |
|---|---|---|---|---|
| (/MWh) | (/MWh) | (bn) | and Year | |
| (a) | 178.54 | 156.00 | 6.711 | AR24, 2042 |
| (b) | 178.54 | 160.00 | 7.273 | AR24, 2042 |
| (c) | 188.27 | 170.00 | 8.898 | AR27, 2045 |
| (d) | 198.00 | 180.00 | 10.811 | AR30, 2048 |
| (e) | 198.00 | 190.00 | 13.041 | AR32, 2050 |
| (f) | 198.00 | 198.00 | 15.092 | AR35, 2053 * |
| (g) | 261.00 | 198.00 | 15.272 | AR35, 2053 * |
| (h) | 210.00 | 210.00 | 18.723 | AR38, 2056 * |
| (i) | 220.00 | 220.00 | 22.268 | AR41, 2059 *‡ |
| (j) | 220.00 | 198.00 | 15.155 | AR35, 2053 * |
Table 5.
Selected scenarios showing sensitivity to learning rate and AR6/AR7 Strike Prices. Colours reflect AR6 value.
Table 5.
Selected scenarios showing sensitivity to learning rate and AR6/AR7 Strike Prices. Colours reflect AR6 value.
| Scenario | AR6 | AR7 | Total Investment (bn) | ||||
|---|---|---|---|---|---|---|---|
| (/MWh) | (/MWh) | 20% LR | 17.5% LR | 15% LR | 12.5% LR | 10% LR | |
| (a) | 178.54 | 156.00 | 3.843 | 4.808 | 6.711 | 11.466 * | 29.427 *‡ |
| (c) | 188.27 | 170.00 | 4.638 | 6.033 | 8.898 | 16.644 *‡ | 42.135 *‡ |
| (f) | 198.00 | 198.00 | 6.610 | 9.225 | 15.092 * | 33.383 *‡ | — |
| (g) | 261.00 | 198.00 | 6.790 | 9.405 | 15.272 * | 33.563 *‡ | — |
| (i) | 220.00 | 220.00 | 8.603 | 12.605 | 22.268 *‡ | 49.578 *‡ | — |
* Does not meet cost parity by 2050, ‡ Insufficient UK resources.
Disclaimer/Publisher’s Note: The statements, opinions and data contained in all publications are solely those of the individual author(s) and contributor(s) and not of MDPI and/or the editor(s). MDPI and/or the editor(s) disclaim responsibility for any injury to people or property resulting from any ideas, methods, instructions or products referred to in the content. |
© 2024 by the authors. Licensee MDPI, Basel, Switzerland. This article is an open access article distributed under the terms and conditions of the Creative Commons Attribution (CC BY) license (https://creativecommons.org/licenses/by/4.0/).
Share and Cite
MDPI and ACS Style
Noble, D.R.; Grattan, K.; Jeffrey, H. Assessing the Costs of Commercialising Tidal Energy in the UK. Energies 2024, 17, 2085. https://doi.org/10.3390/en17092085
AMA Style
Noble DR, Grattan K, Jeffrey H. Assessing the Costs of Commercialising Tidal Energy in the UK. Energies. 2024; 17(9):2085. https://doi.org/10.3390/en17092085
Chicago/Turabian StyleNoble, Donald R., Kristofer Grattan, and Henry Jeffrey. 2024. "Assessing the Costs of Commercialising Tidal Energy in the UK" Energies 17, no. 9: 2085. https://doi.org/10.3390/en17092085
Note that from the first issue of 2016, this journal uses article numbers instead of page numbers. See further details here.