Electricity Consumption and GHG Emissions in GCC Countries

Applied Studies College, University of Bahrain, P.O. Box 32038, Kingdom of Bahrain
Energies 2009, 2(4), 1201-1213; https://doi.org/10.3390/en20401201
Submission received: 23 October 2009
/
Accepted: 21 November 2009
/
Published: 16 December 2009
Abstract
:CO2, N2O, and CH4 are the three most widespread Greenhouse Gases (GHGs). Electricity consumption and the related CO2-equivalent gas emissions resulting from oil and gas combustion for the six countries that comprise the Cooperation Council for the Arab States of the Gulf [Kingdom of Saudi Arabia (KSA), Kuwait, Bahrain, Oman, United Arab Emirates (UAE) and Qatar; also referred to as the Gulf Cooperation Council, GCC)] have been compared. The analysis of the relevant data shows that GCC countries contribute significantly to the global CO2 emissions, and that the majority of their emissions are concentrated in the energy extraction and conversion sectors, mainly from oil drilling and electricity production. Some analysis is offered as to the reasons behind the excessive increase in the electrical demand that is obviously linked to a non-rational pattern of electricity consumption.
1. Introduction
There are four factors affecting Climate change and GHG emissions worldwide: economic growth, population growth, increased transportation use, and industrialization. These are interconnected elements, whereby economic growth encourages industrialization and demand for new goods and services by improving consumers’ purchasing power, which leads in turn to increased logistics and transportation as well. Economic growth also improves life standards, therefore improving population age, fertility and leading to population growth. The tendency to increase the electrical penetration (percentage of final uses served by electrical appliances and devices) causes a more-than-linear increase of the global electricity consumption with the population growth.
Electricity generation as part of the energy sector is studied in this paper. Demand for electricity is increasing worldwide as populations’ consumption of electricity is rising constantly, as people are increasingly having the willingness and the ability to add more electrically powered devices that are highly used in their daily activities than before.
There are many sources for generating electricity, but the most common and cheap technology at the moment is the combustion of fossil fuels to convert thermal energy into mechanical motion and finally into electricity; this conversion accounts for about 71% of the worldwide electricity generation. The most common and cheap source of thermal energy for electricity generation in the world is coal (51.5%), followed by gas (16%), and oil (3%) [1], whereas if all uses are considered, the ranking are reversed: oil (37%) is the major source, followed then by coal (25%) and gas (23%) [2]. These are average world data: we shall see in the following that in the six GCC countries, for obvious reasons, these allocations are quite different.
It should be noted that the combustion of fossil fuel is generally agreed to be the most significant source of atmospheric CO2. Other GHGs (CH4, N2O, O3) contribute to climate change through the so-called Global Warming effect, but their cumulative effect is estimated to be at least one order of magnitude lower than that of CO2.
It is well known today that the GHG gases, and in particular CO2, trap the heat inside the Earth’s atmosphere by absorbing a substantial portion of the natural red-back scattering from the plant’s surface, thus causing the atmosphere to increase its temperature. Any subsequent increase in the Earth’s temperature—however small—(simulations have been run for warming levels of 1.5 through 4.5 °C [3]) is likely to cause extended and significant disruptions in the eco-system, from instant melting polar ice caps and rising global sea levels, floods and hurricanes around the world due to shifting patterns in the atmospheric and oceanic circulation.
The energy sector and especially electricity generation is the main source of this gas worldwide. As mentioned above, coal is the biggest source for electricity generation and a significant source for carbon emissions [4]. Natural gas is more available in the GCC region than coal [4], and it is considered a less harmful fossil fuel, yet, burning equivalent amounts of natural gas and coal in modern thermoelectric plants results in only a marginal decrease in the rate of CO2 emissions [1].
2. GCC Countries’ CO2 GHG Emission and Electricity Generation
Although electricity demand has increased all over the world, the GCC countries’ demand for electricity has increased at thrice the global average over the last few years [6]; there are different reasons for this anomalous behavior, the main ones being the higher-than-average economic growth rate (reflected in the significant increase of the GCC countries’ GDPs), and the policy of encouraging huge development projects in the domestic, service and infrastructure sectors, especially the UAE and KSA.
The geo-climatic conditions of course also play an important role in the increase of the electrical penetration and in the increase in the demand, because of the growing acceptance of air-conditioning devices as “necessary” home-and office appliances, and to the lack of a serious alternative to electrical air-conditioners.
Yet another factor that encourages electrical penetration is the government policy of subsidizing electricity and energy in general through State-imposed tariffs and tax-free regulations, in fact, for domestic use, Kuwait and Qatar offer electricity for free to their citizens, while KSA, Bahrain and Oman subsidize its cost to maintain relatively very low prices. UAE has more energy-conscious pricing policies that differ from one UAE state to another, but in general electricity and energy prices are double those offered in Bahrain and Oman.
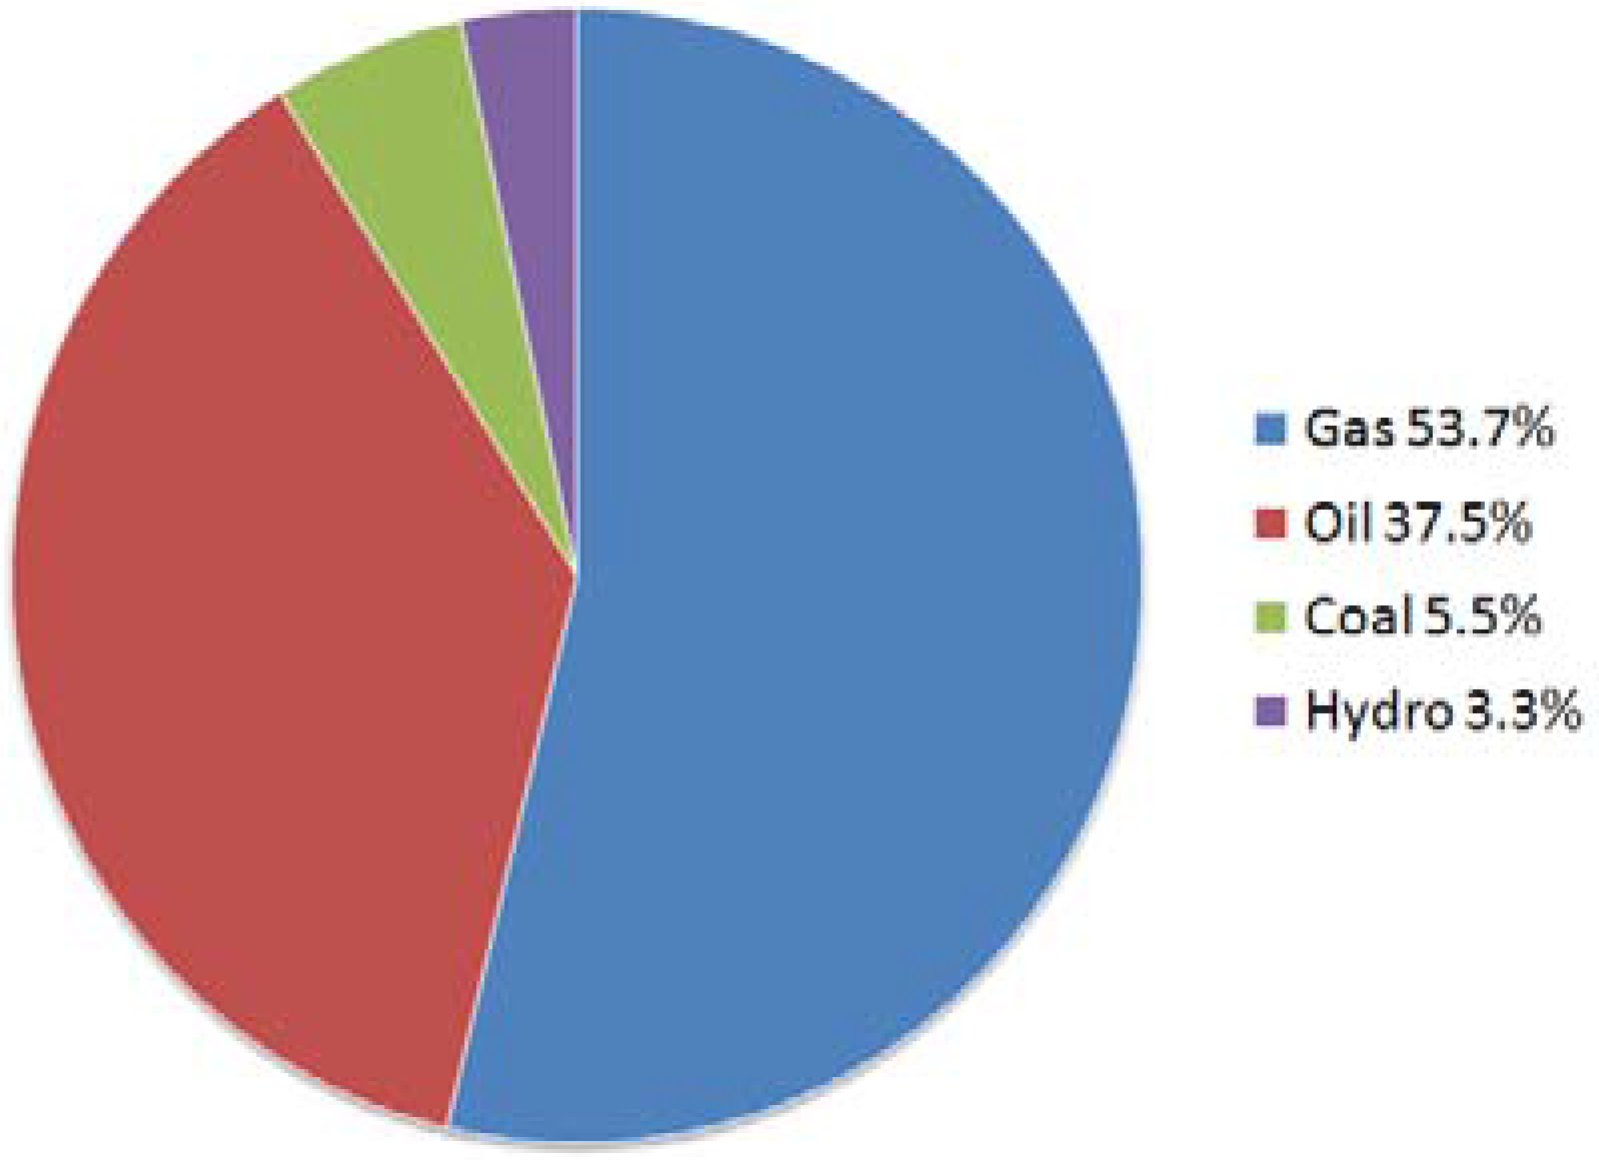
In general, the increase in the electricity demand is considered a worldwide trend for the next 20–30 years [2], but the future demand for electricity in the GCC countries is anticipated to be 80% higher in year 2015 than the currently installed capacity [7]. In 2005 the Middle East region as a whole generated 639,982 GWh of electricity/heat, the major source of electricity generation in GCC countries still being the combustion of fossil fuel, of which gas prevails over oil. Figure 1 shows the percentage of electricity generation per source in the Middle East [8]: it is apparent that the relative importance of the three major sources (oil, gas, and coal) are very different than the world’s average values.
Figure 1.
Energy sources diversity in electricity generation in the Middle East.

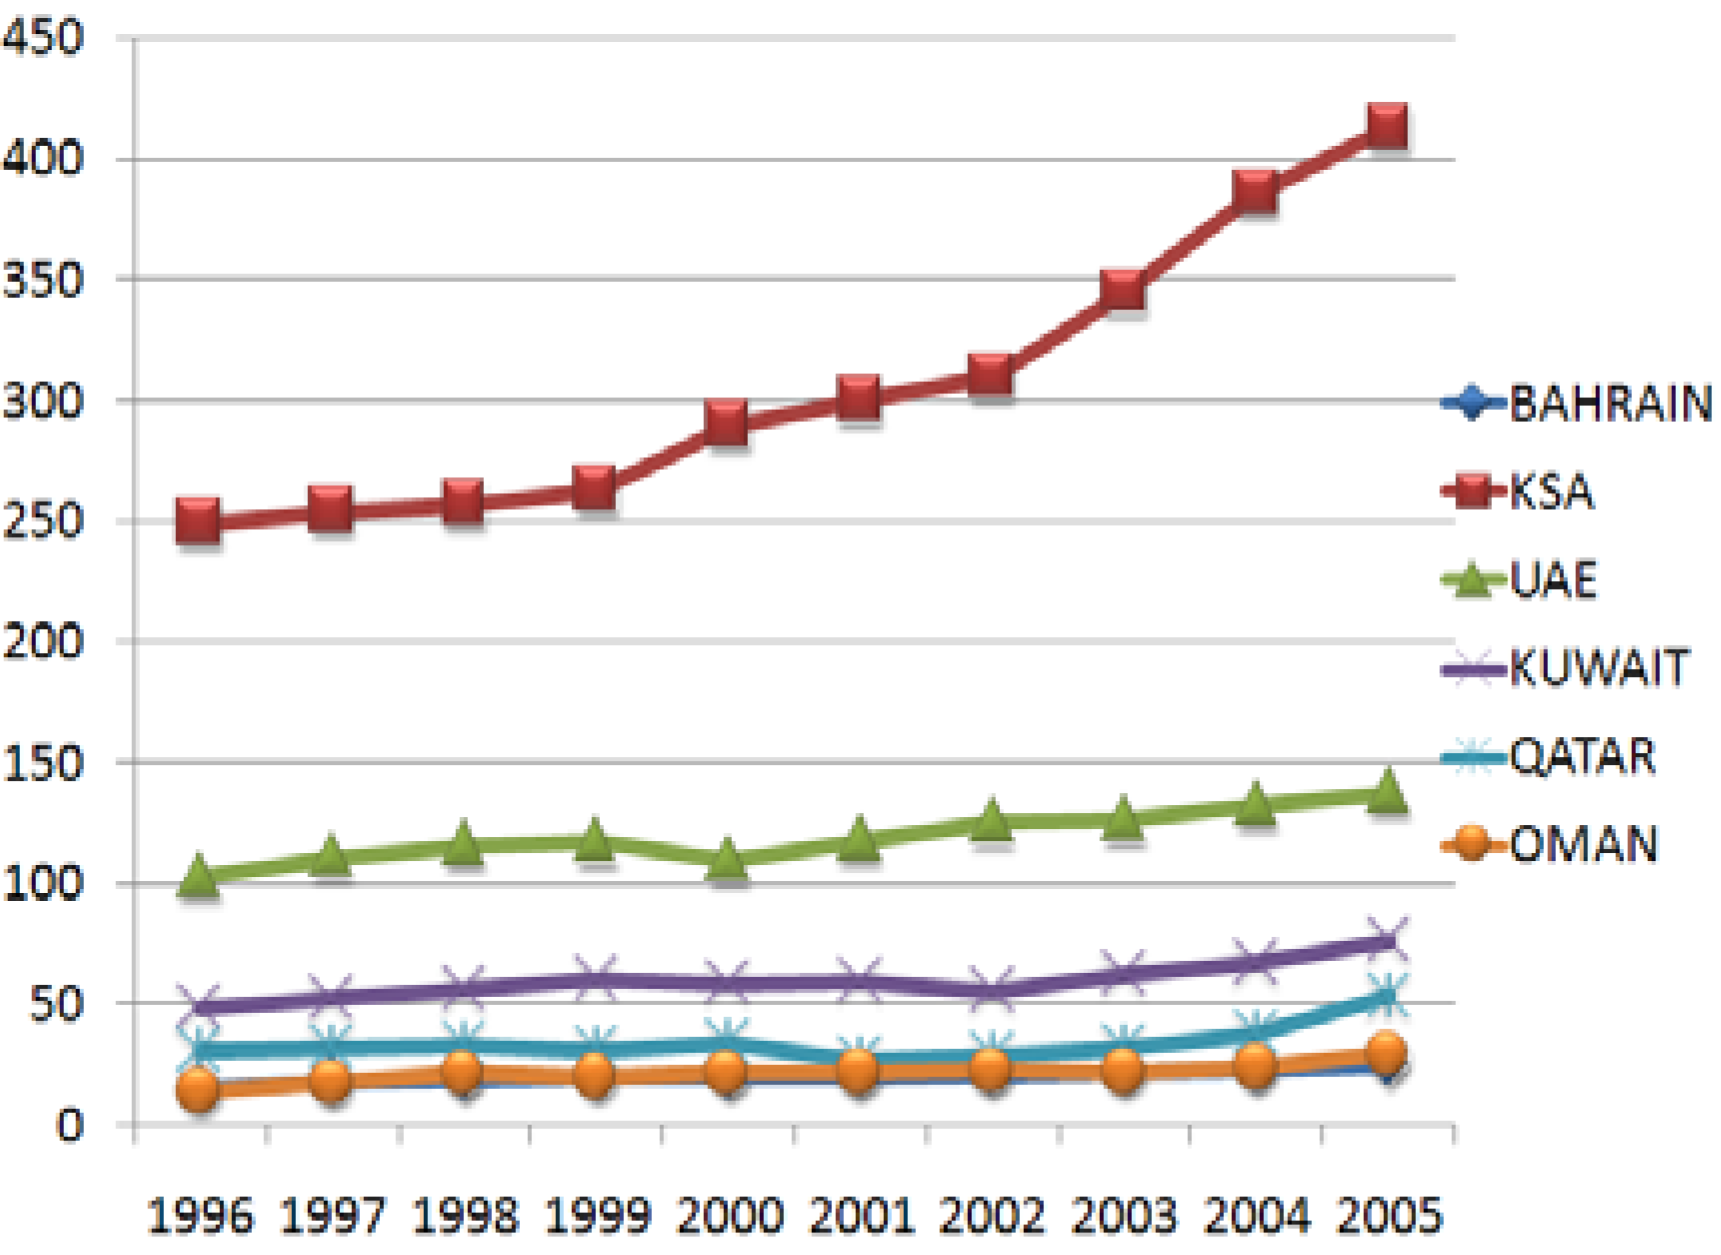
The United Nations Environmental program identified three of the GCC countries as those with the highest per capita energy consumption in the world, and furthermore concluded that the six GCC countries contribute approximately to 45%–50% of the cumulative Arab countries’ CO2 emissions [9]: this result is illustrated in Figure 2.
Figure 2.
CO2 total emissions from consumption of fossil fuel for GCC countries.

The data in Figure 2 shows KSA leading the six GCC countries in its CO2 emission contribution, followed by UAE, Kuwait, Qatar, Oman and Bahrain. All the countries show growth in their CO2 GHG emissions, but the graph clearly shows the rapid rise in emissions by KSA (where the emission for year 2005 was 412.35 million metric tons of CO2) compared to the other GCC countries in the period 2001–2005. Thus rapid rise in CO2 emissions by Saudi Arabia is related to its industrial and civic development during these years, and the need for electricity generation to supply the continuing development of domestic, tertiary and industrial establishments that continue to emerge till now. The rising international oil demand, and the consequent increase in prices, is another factor for this rapid rise of CO2 emission in KSA, which is one of the leading oil producers worldwide. Qatar, which has witnessed significant economic growth during the last few years shows a similar but less steep growth in CO2 emissions. Oman and Bahrain also show almost matching emission rates for all the period, in spite of the population and land size differences between the two countries, whereby Qatar emitted a higher rate of CO2 than Bahrain while they have similar land size and population. The recent discovery of natural gas fields in Qatar has shifted its position as a leading producer for gas and oil as well.
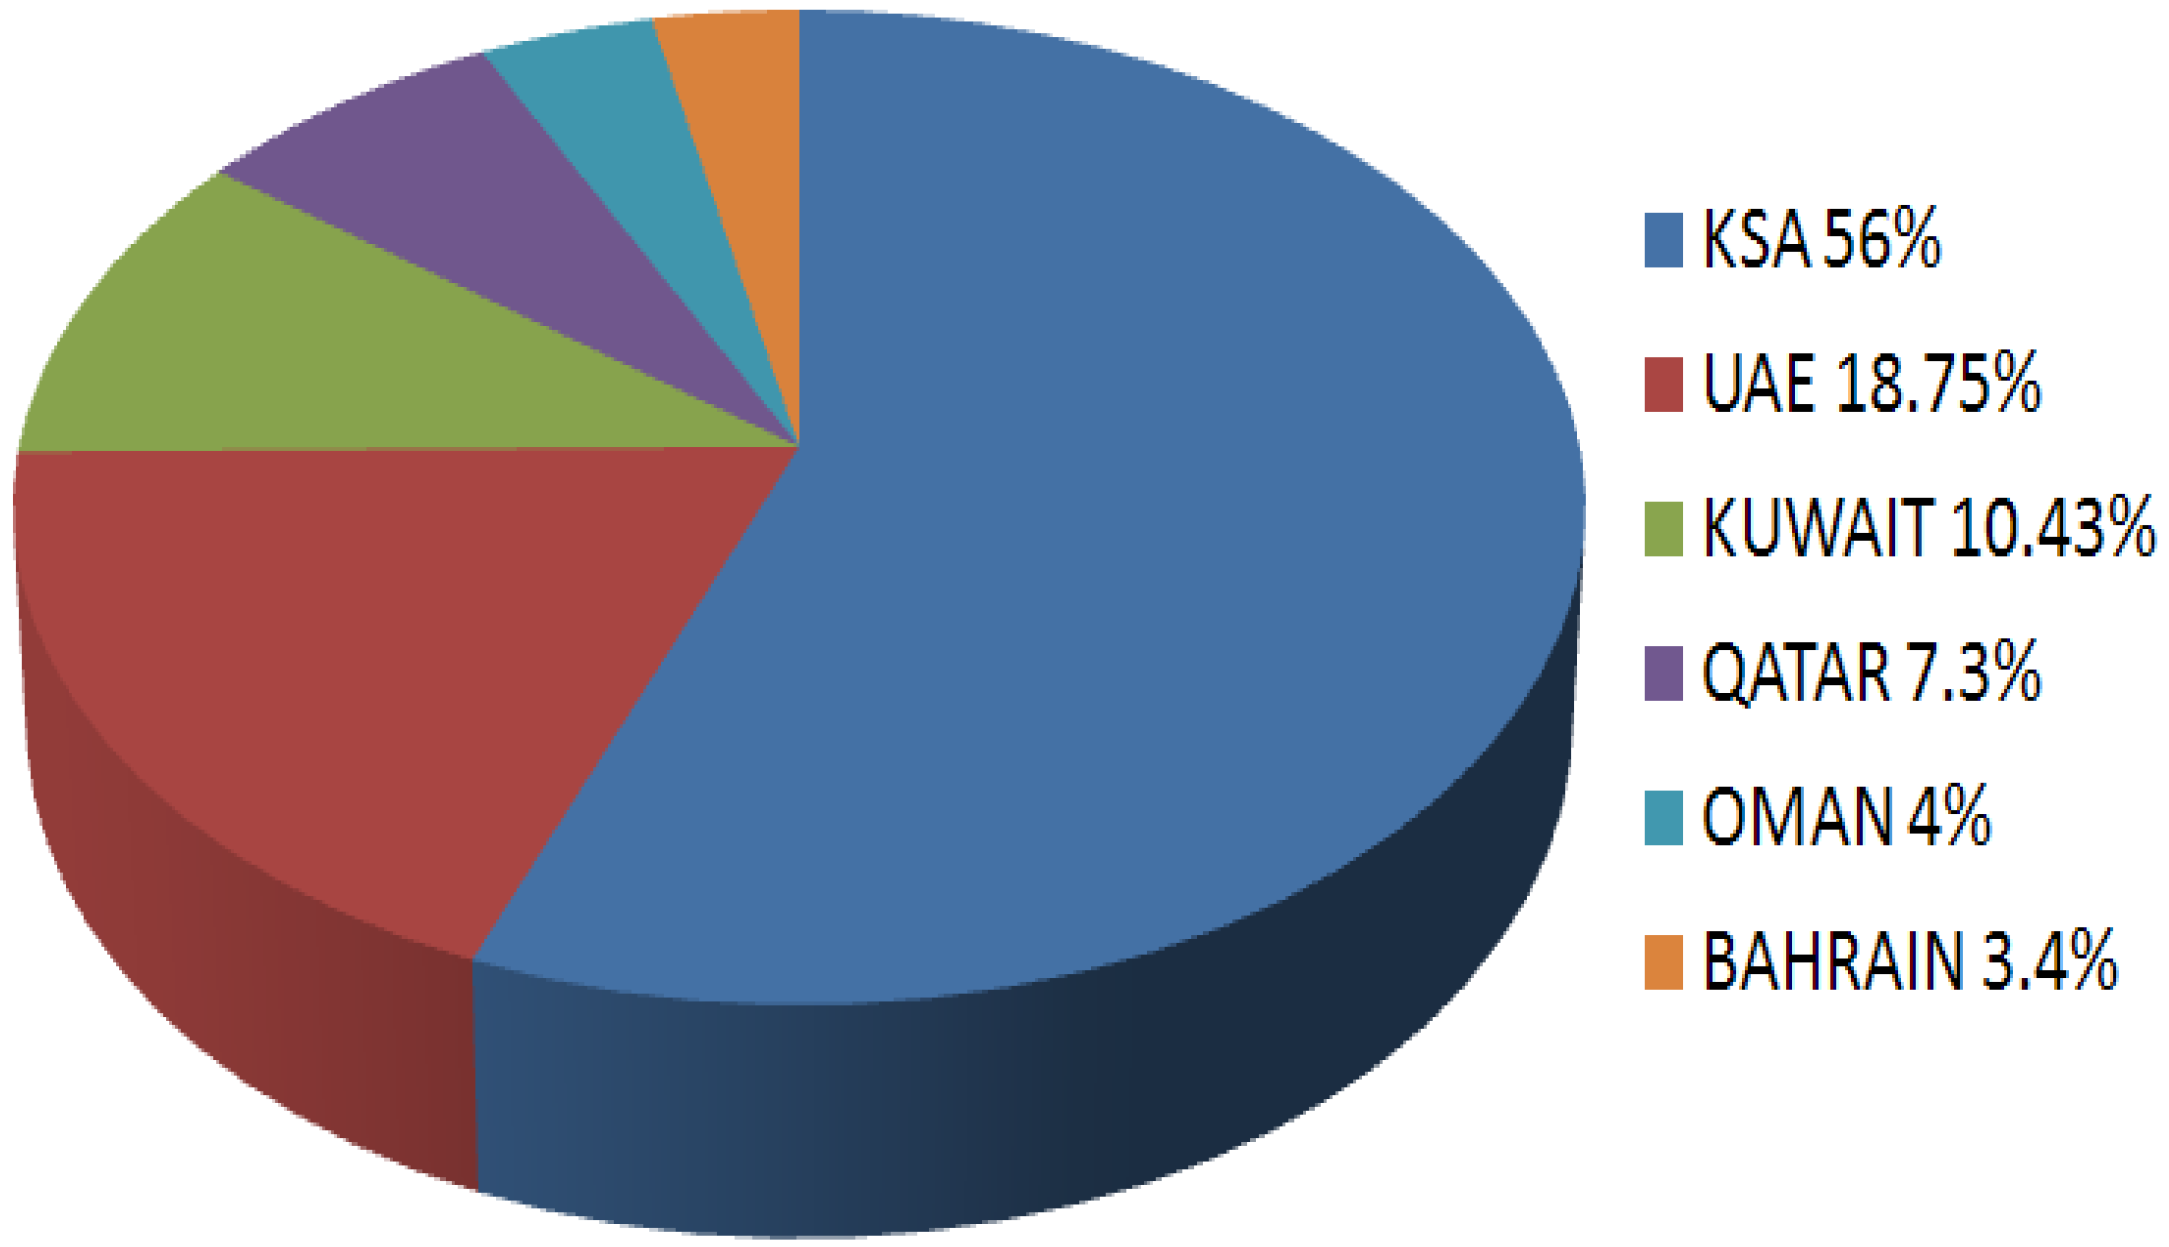
Figure 3.
Year 2005 CO2 GHG emission contribution percentage from the total six countries’ emissions (735.21 million metric tons of CO2).
Figure 3.
Year 2005 CO2 GHG emission contribution percentage from the total six countries’ emissions (735.21 million metric tons of CO2).

Figure 3 shows a pie graph for year 2005 CO2 GHG emission contribution percentage for the total six countries emissions. It is clear that KSA tops the remaining countries with its total share of 56% of CO2, followed by UAE (18.5%) and Kuwait (10.43%). The CO2 GHG emissions for 10 years in the six GCC countries are summarized in Table 1 [5].

| Year | BAHRAIN | KSA | UAE | KUWAIT | QATAR | OMAN |
|---|---|---|---|---|---|---|
| 1996 | 15.6 | 248.97 | 103 | 49.11 | 30.87 | 14.52 |
| 1997 | 18.38 | 254.05 | 111.34 | 52.6 | 32.49 | 17.86 |
| 1998 | 19.33 | 256.82 | 116.09 | 56.54 | 33.25 | 21.71 |
| 1999 | 20.17 | 262.68 | 117.62 | 60.66 | 31.7 | 20.46 |
| 2000 | 20.18 | 289.33 | 109.65 | 59.21 | 34.54 | 21.68 |
| 2001 | 20.7 | 299.89 | 118.13 | 60.08 | 27.44 | 22.09 |
| 2002 | 21.62 | 309.62 | 125.55 | 55.83 | 29.13 | 22.87 |
| 2003 | 22.35 | 344.78 | 126.38 | 63.02 | 32.35 | 22.35 |
| 2004 | 23.05 | 385.76 | 132.76 | 67.39 | 38.48 | 24.22 |
| 2005 | 25.18 | 412.35 | 137.82 | 76.69 | 53.54 | 29.72 |
3. Electricity Consumption in GCC Countries
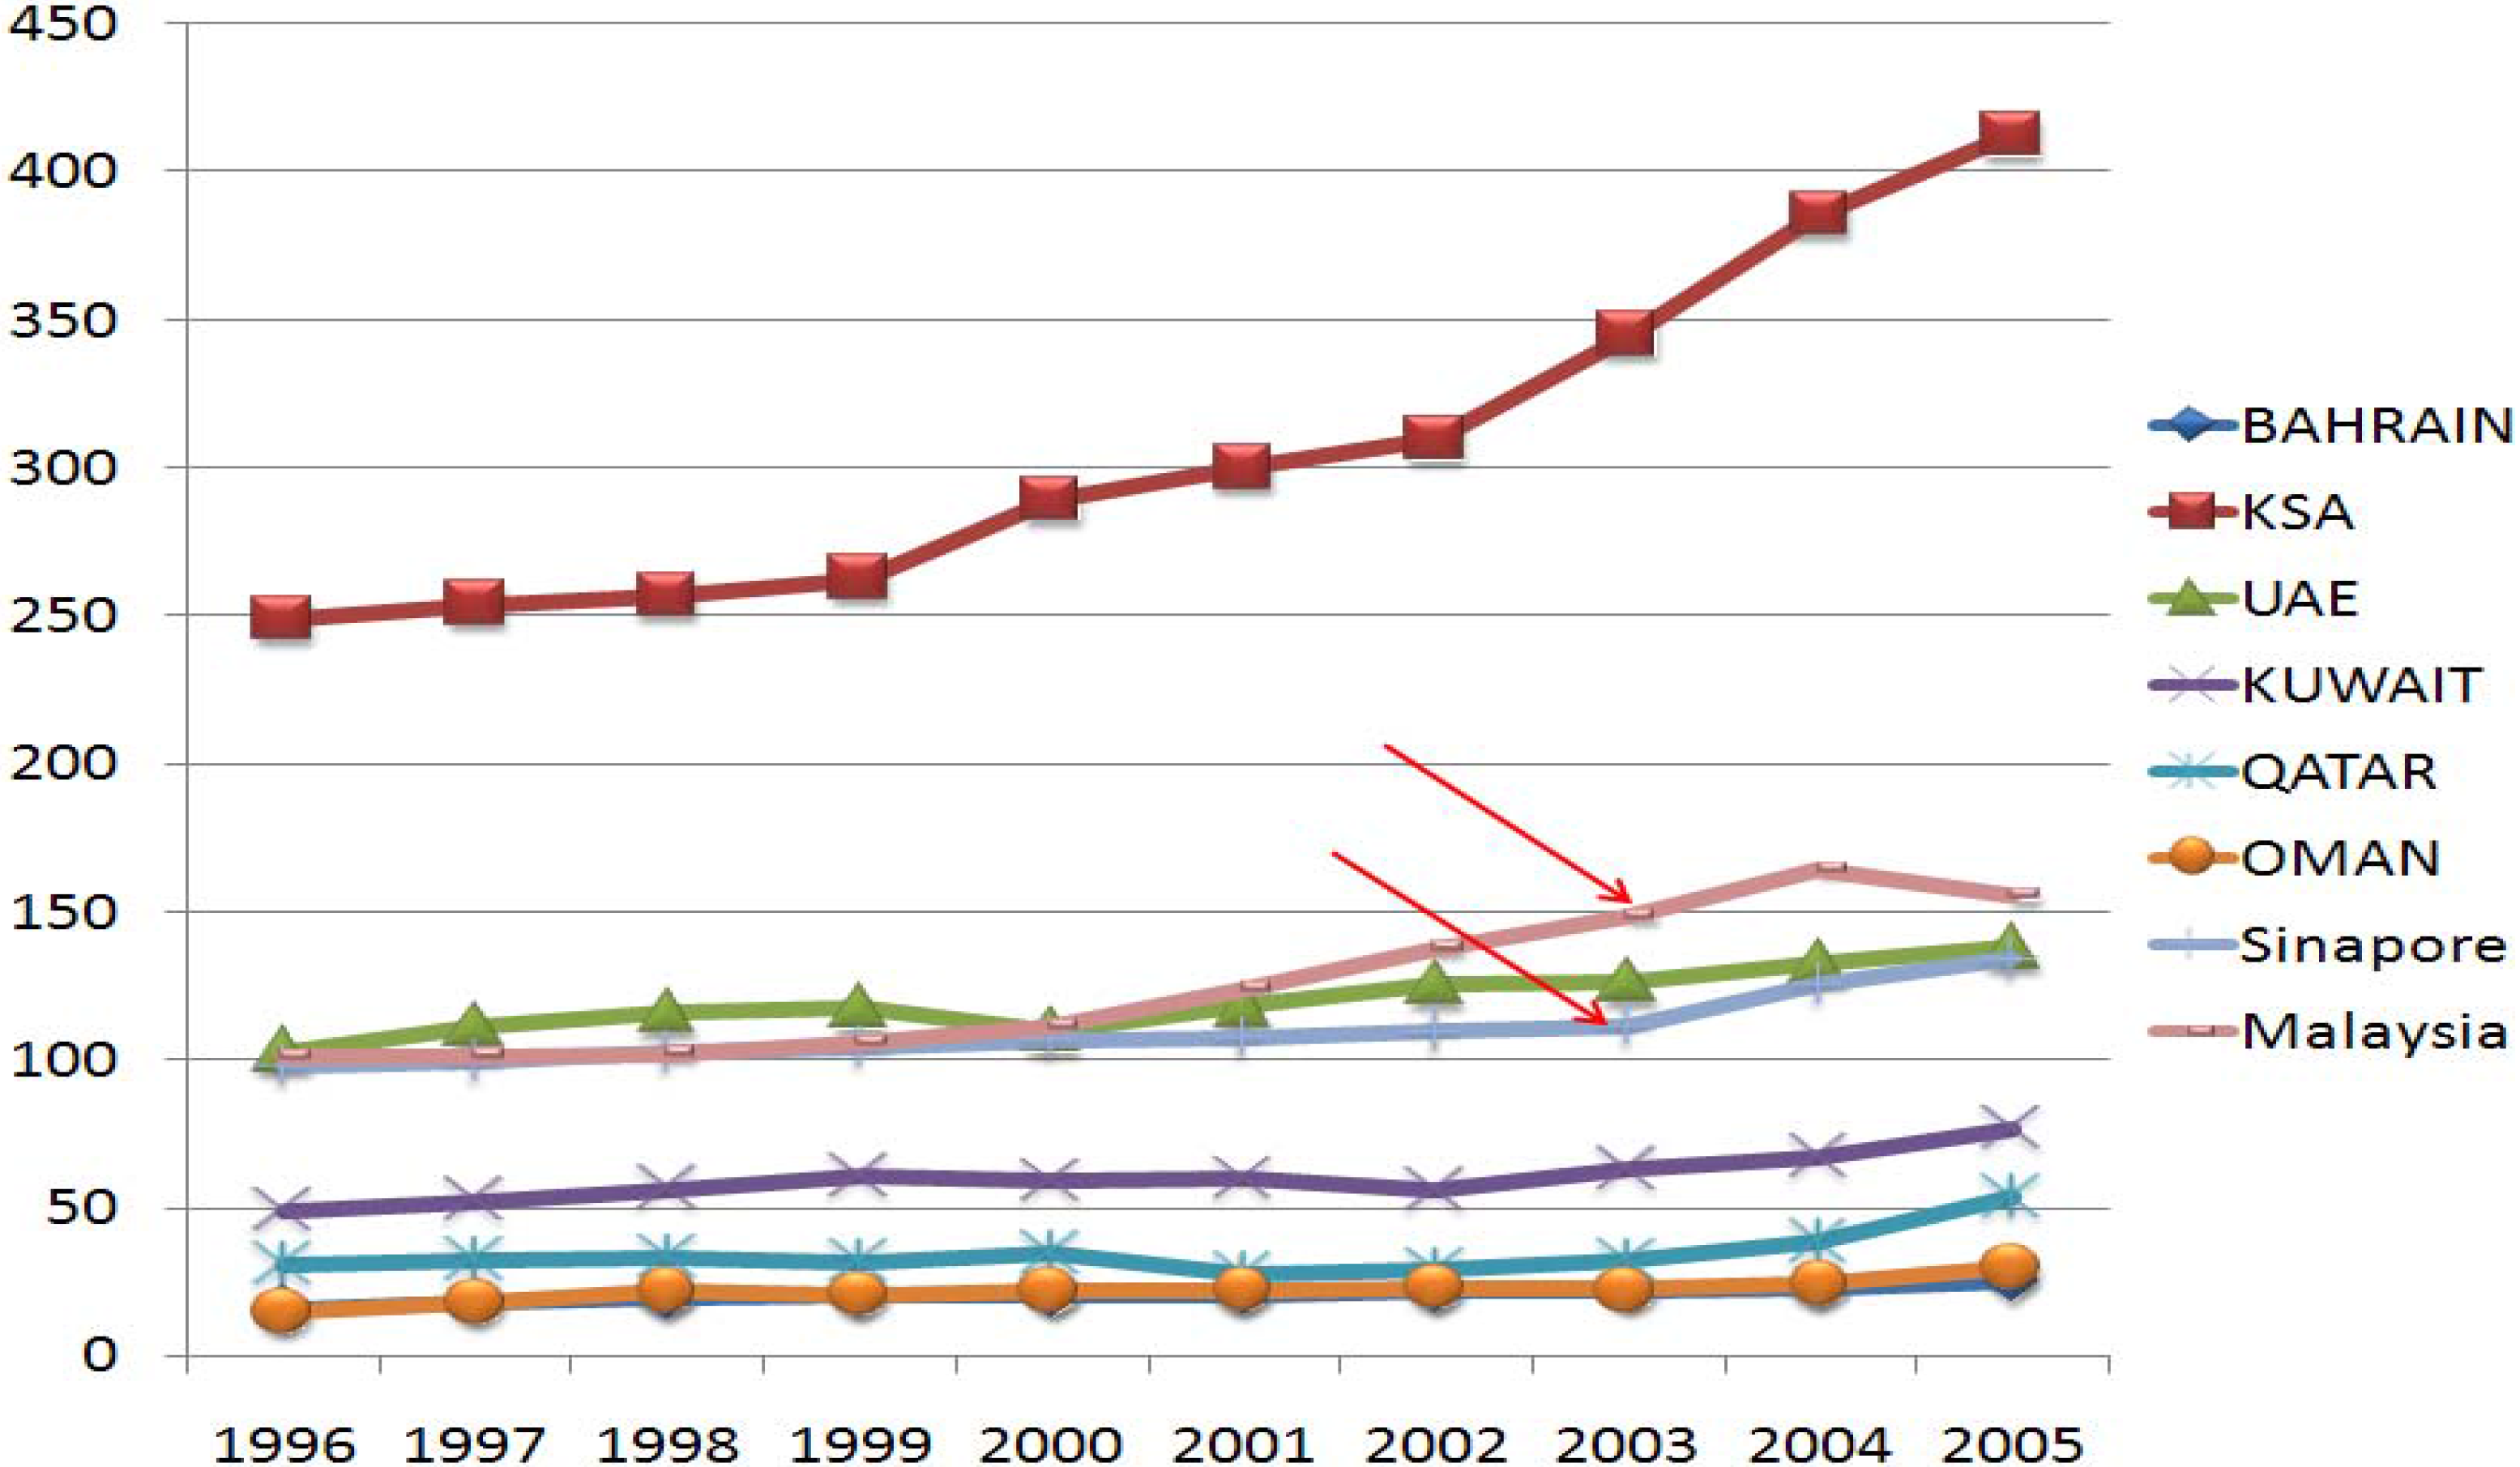
Similar rapid growth in electricity generation is noticed in KSA, UAE and Qatar, in parallel with the above reported rapid rise in CO2 GHG emission in these countries; this is shown in Figure 4 below, Again KSA ranked the first in electricity consumption, followed by UAE, Kuwait, Qatar, Oman, with Bahrain bringing up the rear.
Figure 4.
Electricity generation comarison for the six GCC countries.

Table 2 shows the electricity consumption for 10 years in the six GCC countries from year 1996 to 2005 [4].
| Year | Bahrain | Oman | Qatar | Kuwait | UAE | KSA |
|---|---|---|---|---|---|---|
| 1996 | 4.7 | 6.4 | 6.2 | 23.9 | 25 | 101.1 |
| 1997 | 4.7 | 6.9 | 6.5 | 25.1 | 26.8 | 107.5 |
| 1998 | 5.4 | 7.7 | 7.6 | 28.2 | 31.4 | 114.6 |
| 1999 | 5.6 | 7.9 | 8.4 | 29.7 | 34.9 | 112.8 |
| 2000 | 5.9 | 8.6 | 8.6 | 30.9 | 37.5 | 118.6 |
| 2001 | 6.4 | 9.2 | 9.4 | 32.7 | 40.6 | 125.7 |
| 2002 | 6.8 | 9.7 | 10.3 | 34.7 | 43.8 | 133.2 |
| 2003 | 7.3 | 10.1 | 11.3 | 37.4 | 46.6 | 143.8 |
| 2004 | 7.9 | 10.8 | 12.4 | 38.8 | 49.3 | 150.3 |
| 2005 | 8.2 | 11.9 | 13.5 | 41.1 | 57.1 | 165.6 |
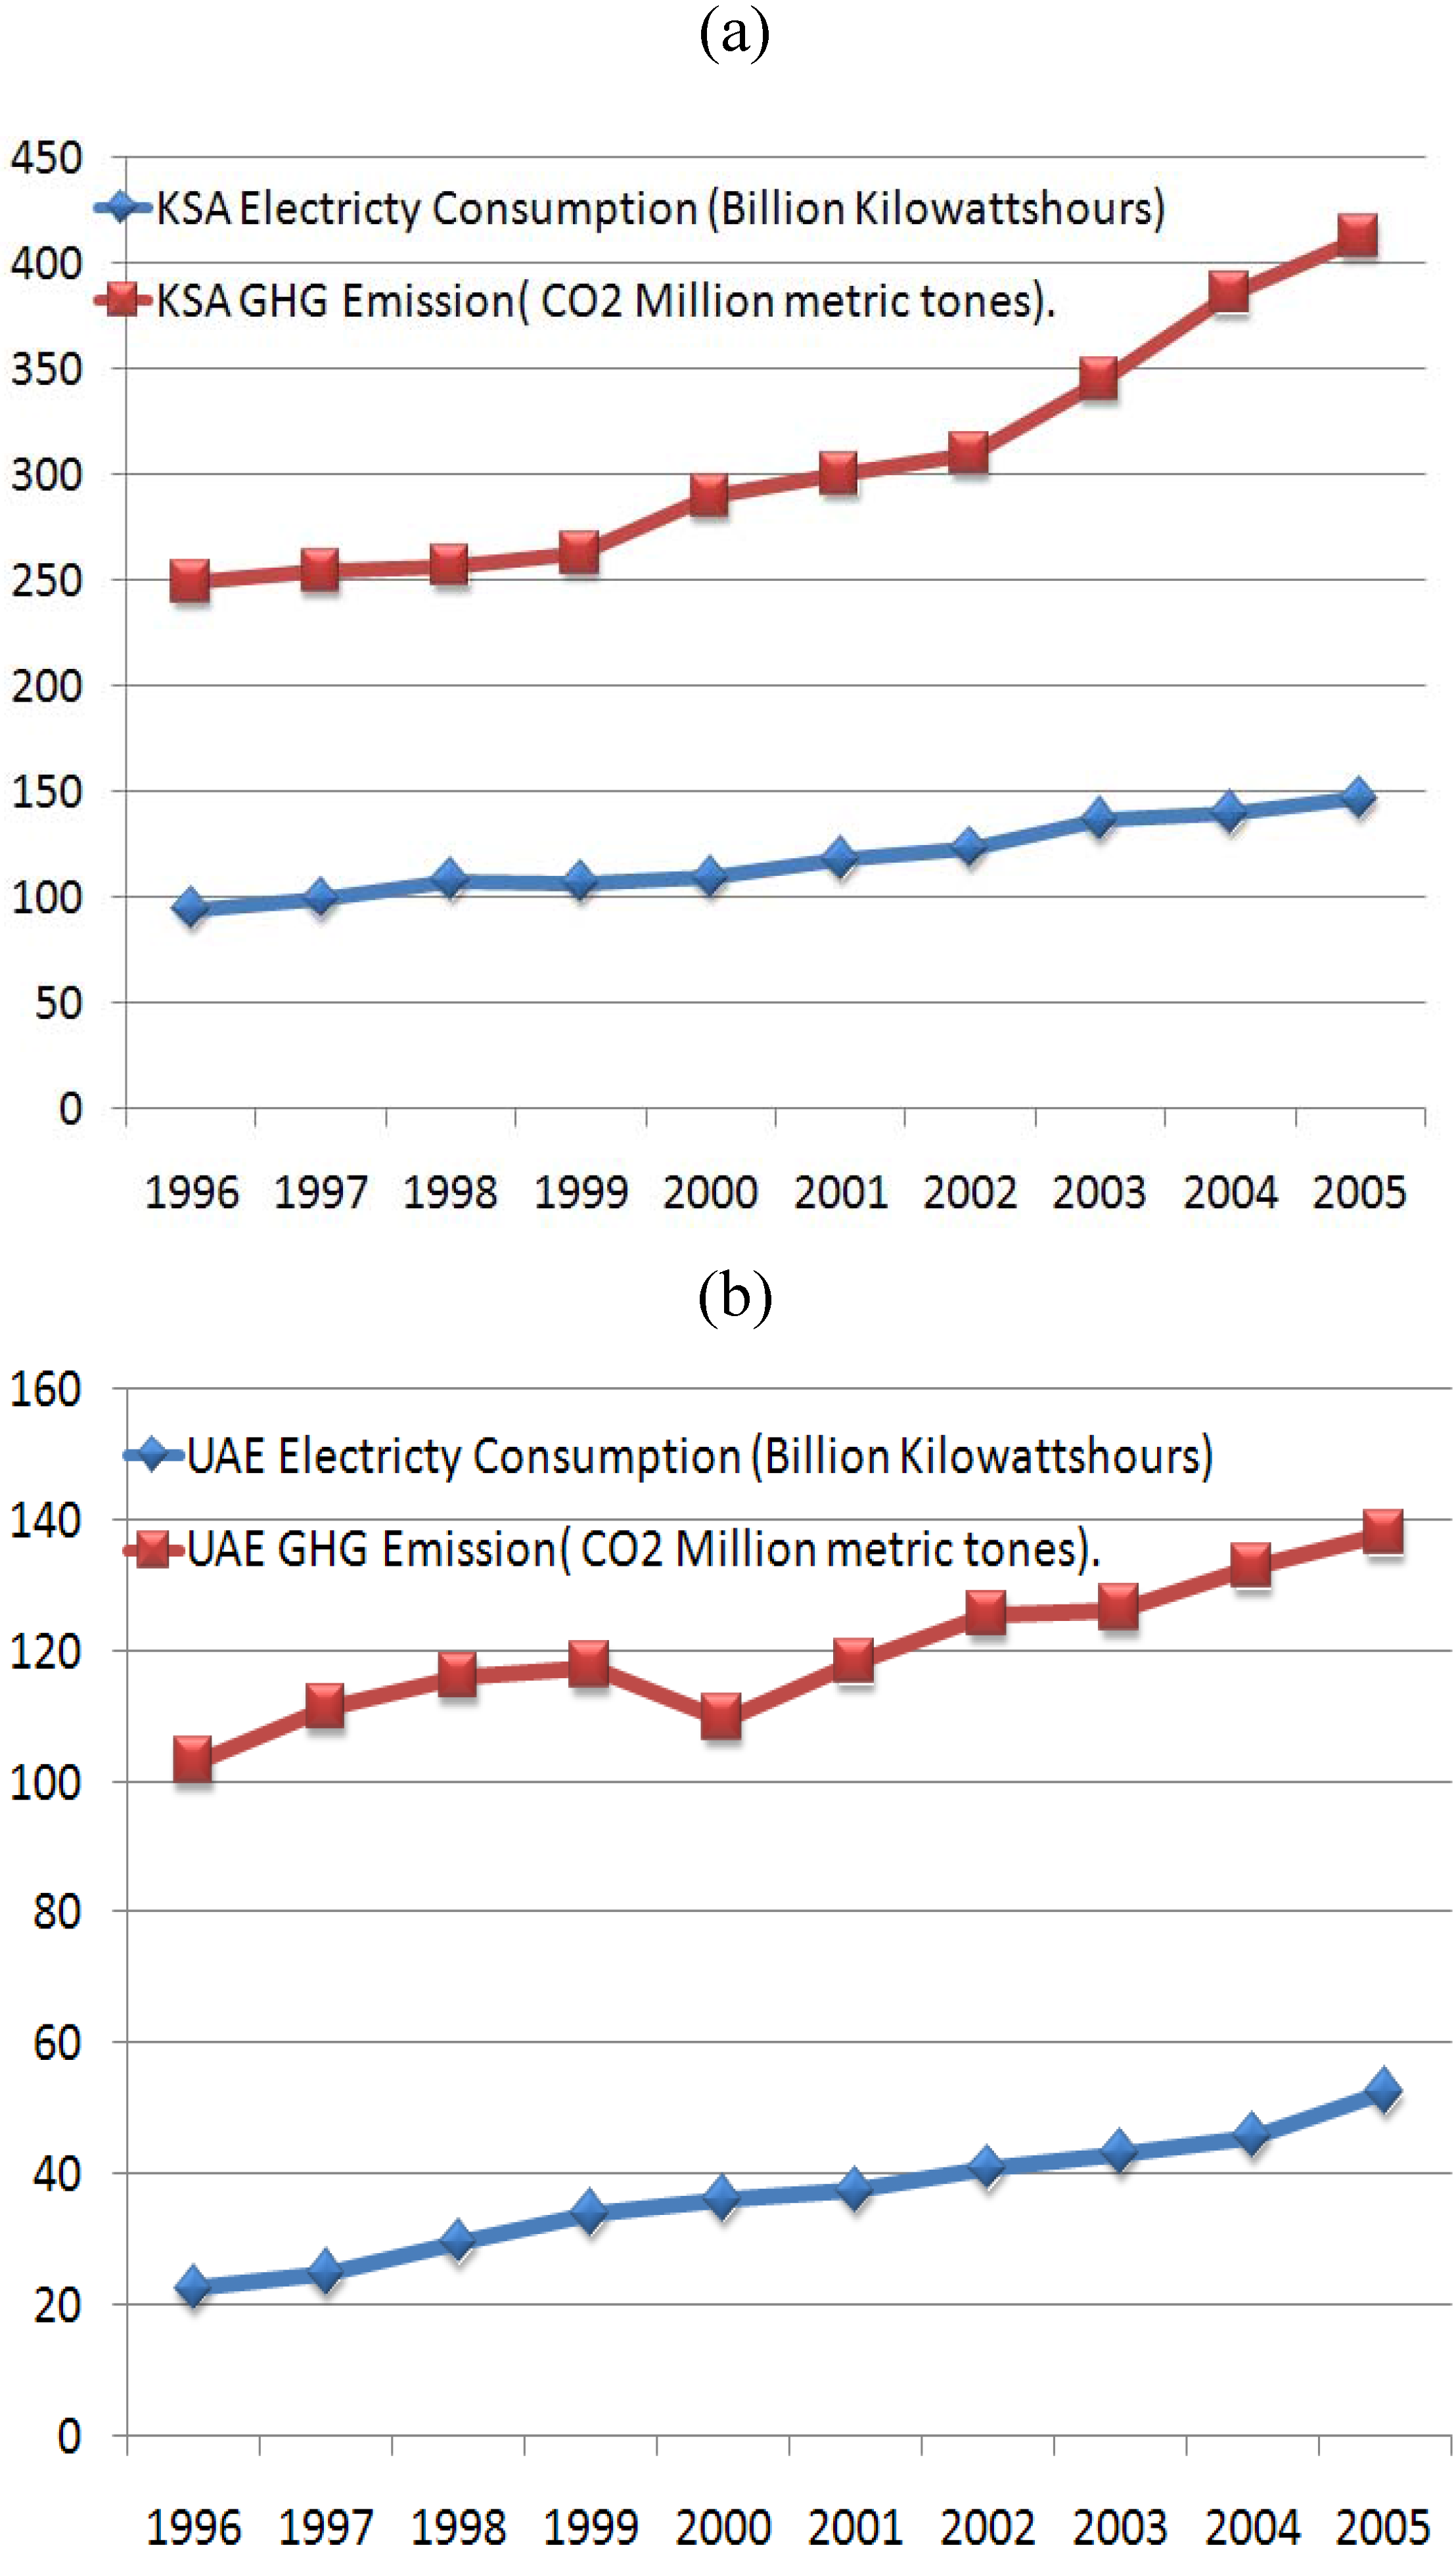
Figure 5a,b provides a closer look at the CO2 GHG emissions and electricity consumptions for KSA and UAE, the two top GCC countries in these areas. Both countries are the leading GCC countries in economic development and oil production, with huge construction projects both built and planned, and its corresponding huge need for electricity supply, not to mention the need for desalinated water too. KSA requirements are 15,000 MW and about 1,000 million of desalinated water g/d [6]. Whereas the total GCC estimate is 60,000 MW of new capacity to be required by year 2015 (a typical large gas fired power generator plant can supply 400 to max 1,200 MW) and this represent 80% of the current installed capacity.
Figure 5.
(a). UAE CO2 Emission and electricity consumptions; (b). KSA CO2 Emission and electricity consumptions.
Figure 5.
(a). UAE CO2 Emission and electricity consumptions; (b). KSA CO2 Emission and electricity consumptions.

As for the United Arab Emirates, in just four years, the UAE’s electrical capacity needs to increase by 60% to 26,000 megawatts [7], and Abu Dhabi’s electricity demand is expected to double in between 2008–2013. Dubai (as one of the UAE states) has the greatest demand potential and is growing by 12%–14% per year, so it is forecast that Dubai’s capacity will triple in a size to 16,000 MW and water desalination of 800 million g/d by 2015 [6].
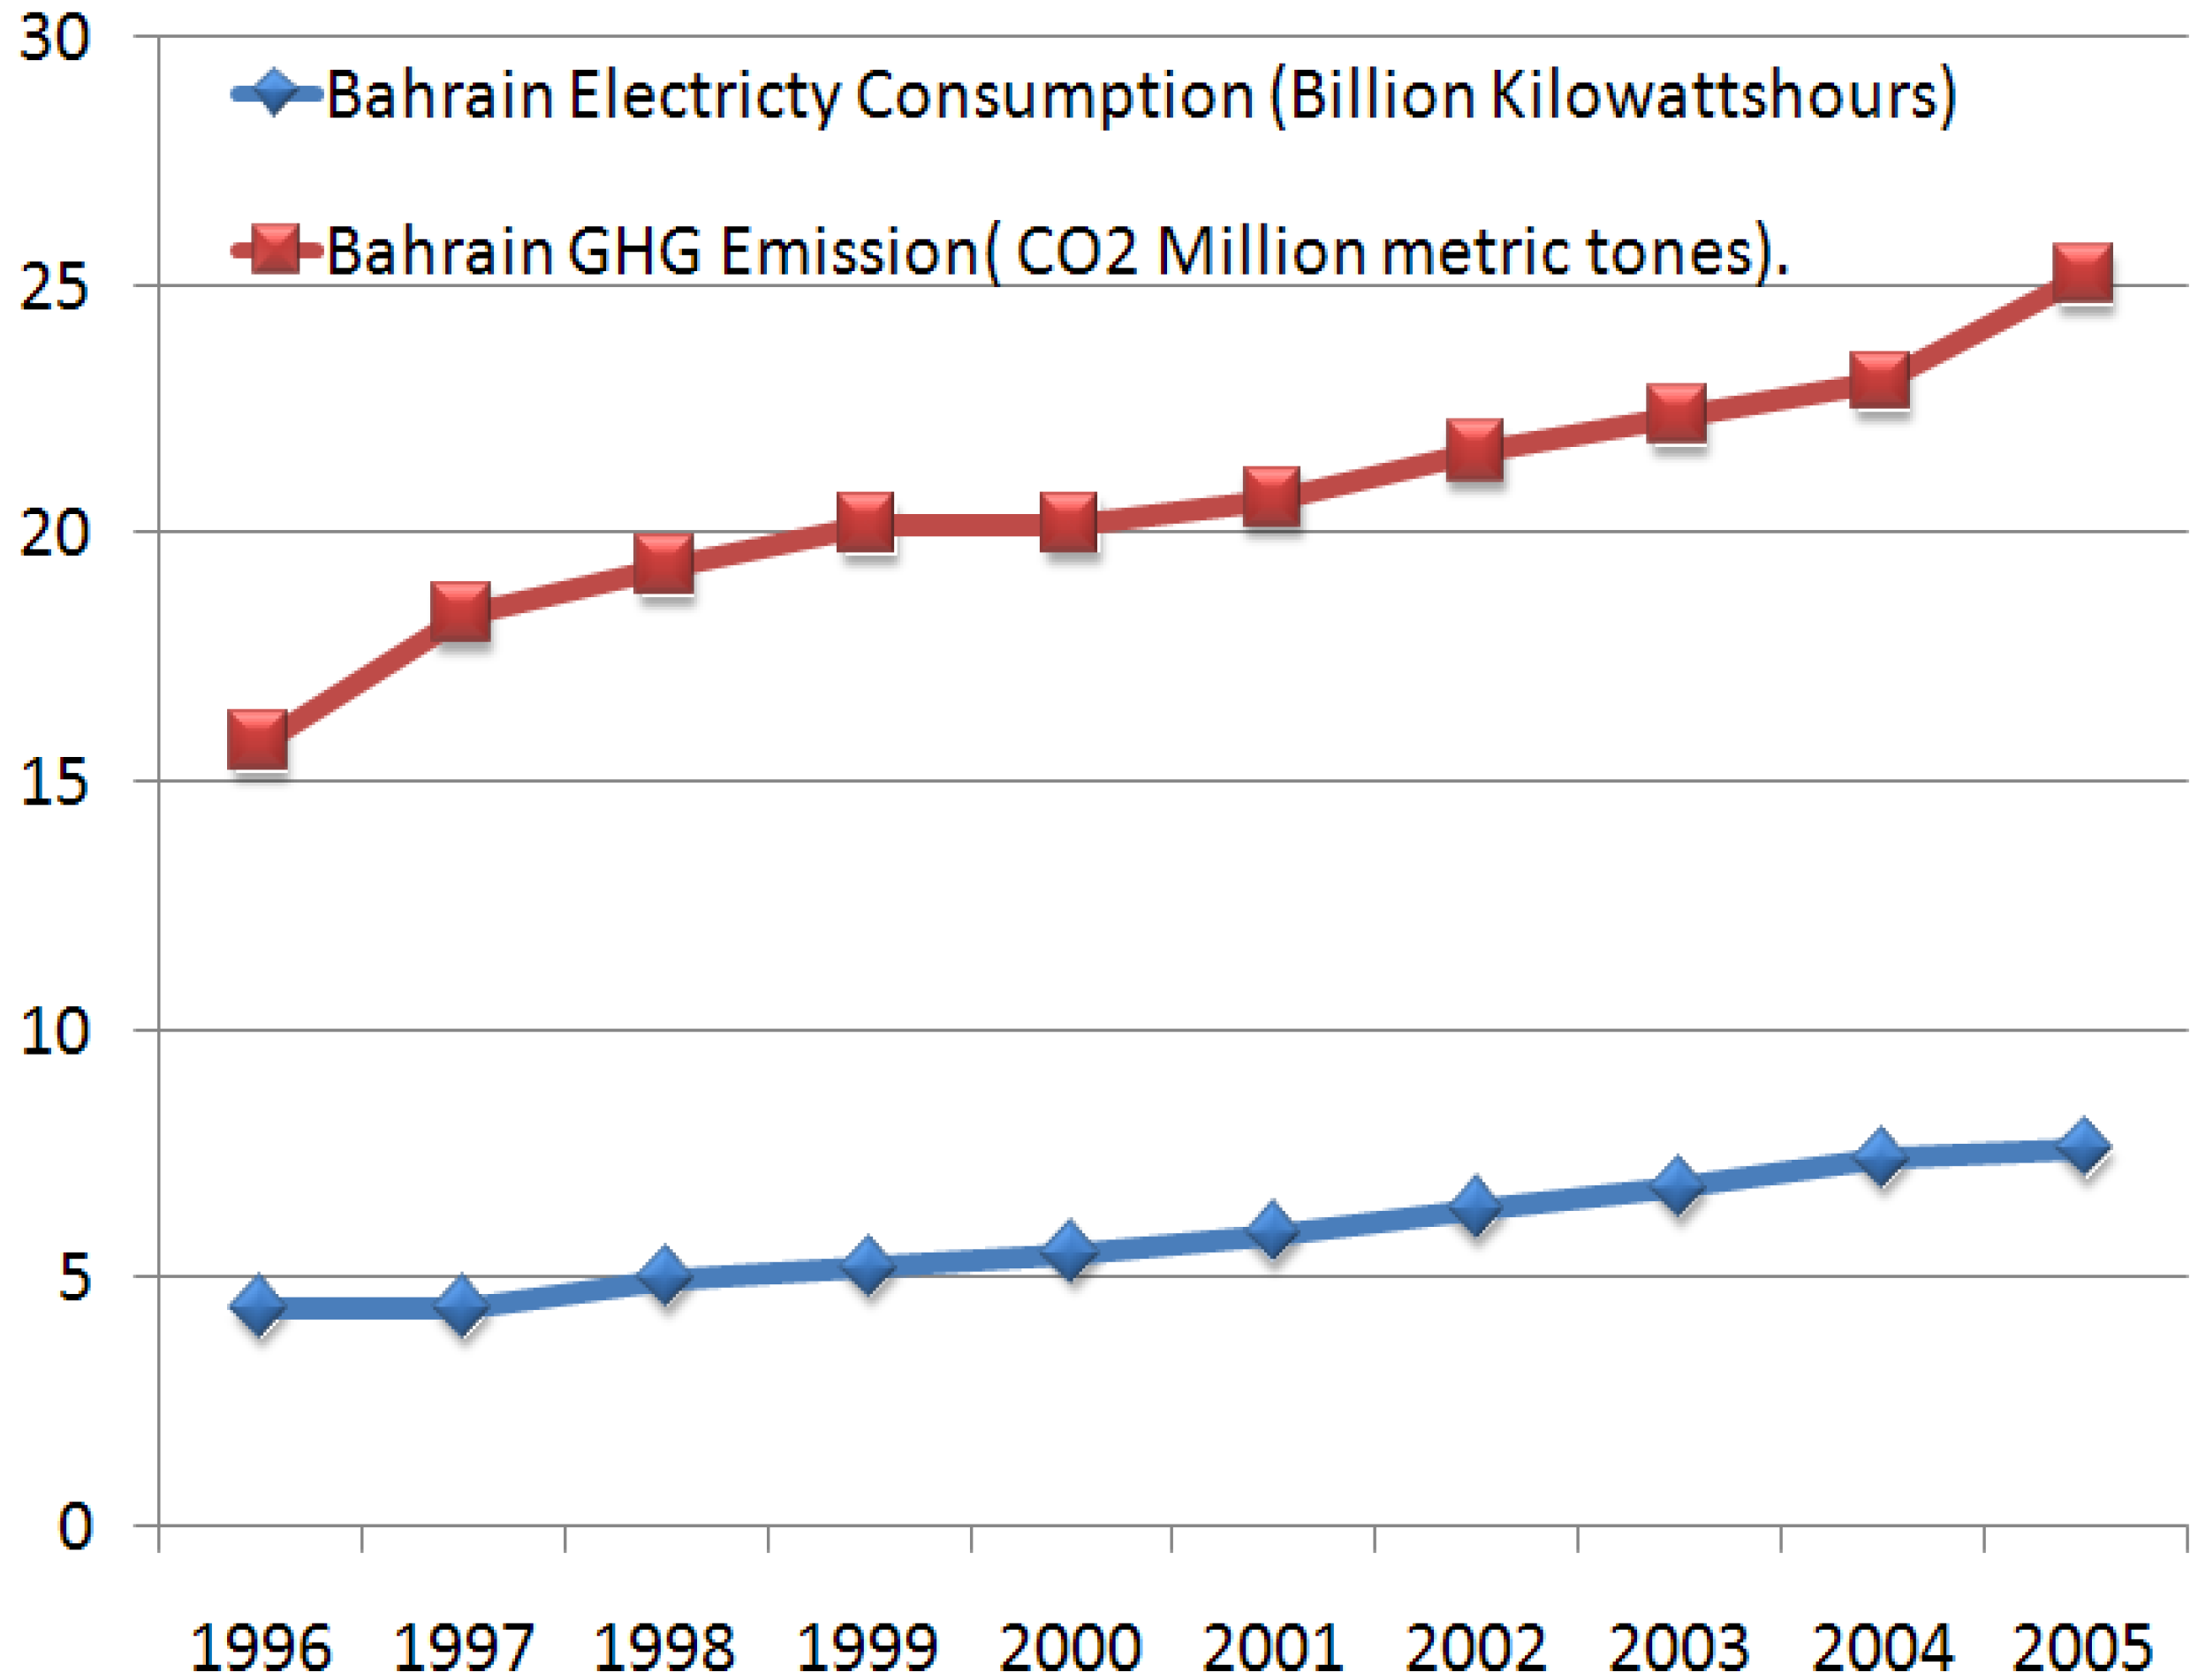
Figure 6 shows Bahrain’s CO2 total emission from consumption of fossil fuel, which has witnessed similar growth but at a lower scale. Electricity generation in Bahrain mainly uses gas-fired power generators, and some electricity supply blackouts happen in selected areas in Bahrain due to a shortage of electricity supply during peak consumption hours. The energy sector in general is responsible of 75% of CO2 emission in Bahrain (as shown in Table 3). The current five power station capacity will not cover the increasing demand in the kingdom [12,13,14,15]. Increasing gas prices and supply shortages might lead to outsourcing other alternative electricity generation, such as oil, which would increase the CO2 GHG contribution, or sourcing advanced nuclear power which might be less “air” polluting and more efficient.
Figure 6.
Bahrain’s electrecity consumption and CO2 emission.

| Sector | G. Gram CO2 | % |
|---|---|---|
| Energy | 17,428 | 75% |
| Waste | 2,327 | 10.1 |
| Industrial Process | 1,895 | 8.2 |
| Transport | 1,300 | 5.7 |
| Others | 46 | 0.2 |
| Total | 22,996 | 100 |
4. CO2 GHG Emission and Electricity Consumption Pro-capite in the GCC
Although KSA as a country showed a higher percentage in its share of CO2 GHG emission, if we consider the population size and growth, we find consumption of electricity and consequent CO2 emission for each country per person (pro-capite) is much different, and KSA’s pro-capite emission stands in the fifth position, This shown in Table 4 below [5,10].
Table 3 summarizes pro-capite CO2 and electricity data, where Qatar comes first in CO2 emission of with its 68.15 tonnes of CO2 pro-capite, a level even higher than that of some leading developed countries such as Australia. The reason for that high CO2 emission and consumption of electricity are likely to be the same mentioned in the introduction: a high rate of economic growth, the free pricing of electricity for domestic use, the especially harsh geoclimatic conditions in Qatar (the average humidity may reach values of 80% in that country), the cultural inclination to use more and more decentralized air-conditioning devices that are necessarily electrically powered, rather than air cooler systems which are widely in use in other dry climate countries such as Syria and Iraq, or centralized air conditioning units of the absorption type, which are fed by more readily available heat rather than electricity.
| Year 2005 | GHG Emission tonnes of CO2 pro-capite | Electricity Consumption KWh pro-capite |
|---|---|---|
| KSA | 15.62 | 5563.55 |
| UAE | 33.72 | 12870.08 |
| KUWAIT | 32.83 | 15539.38 |
| OMAN | 9.90 | 2897.10 |
| QATAR | 68.15 | 15910.05 |
| BAHRAIN | 36.58 | 11040.98 |
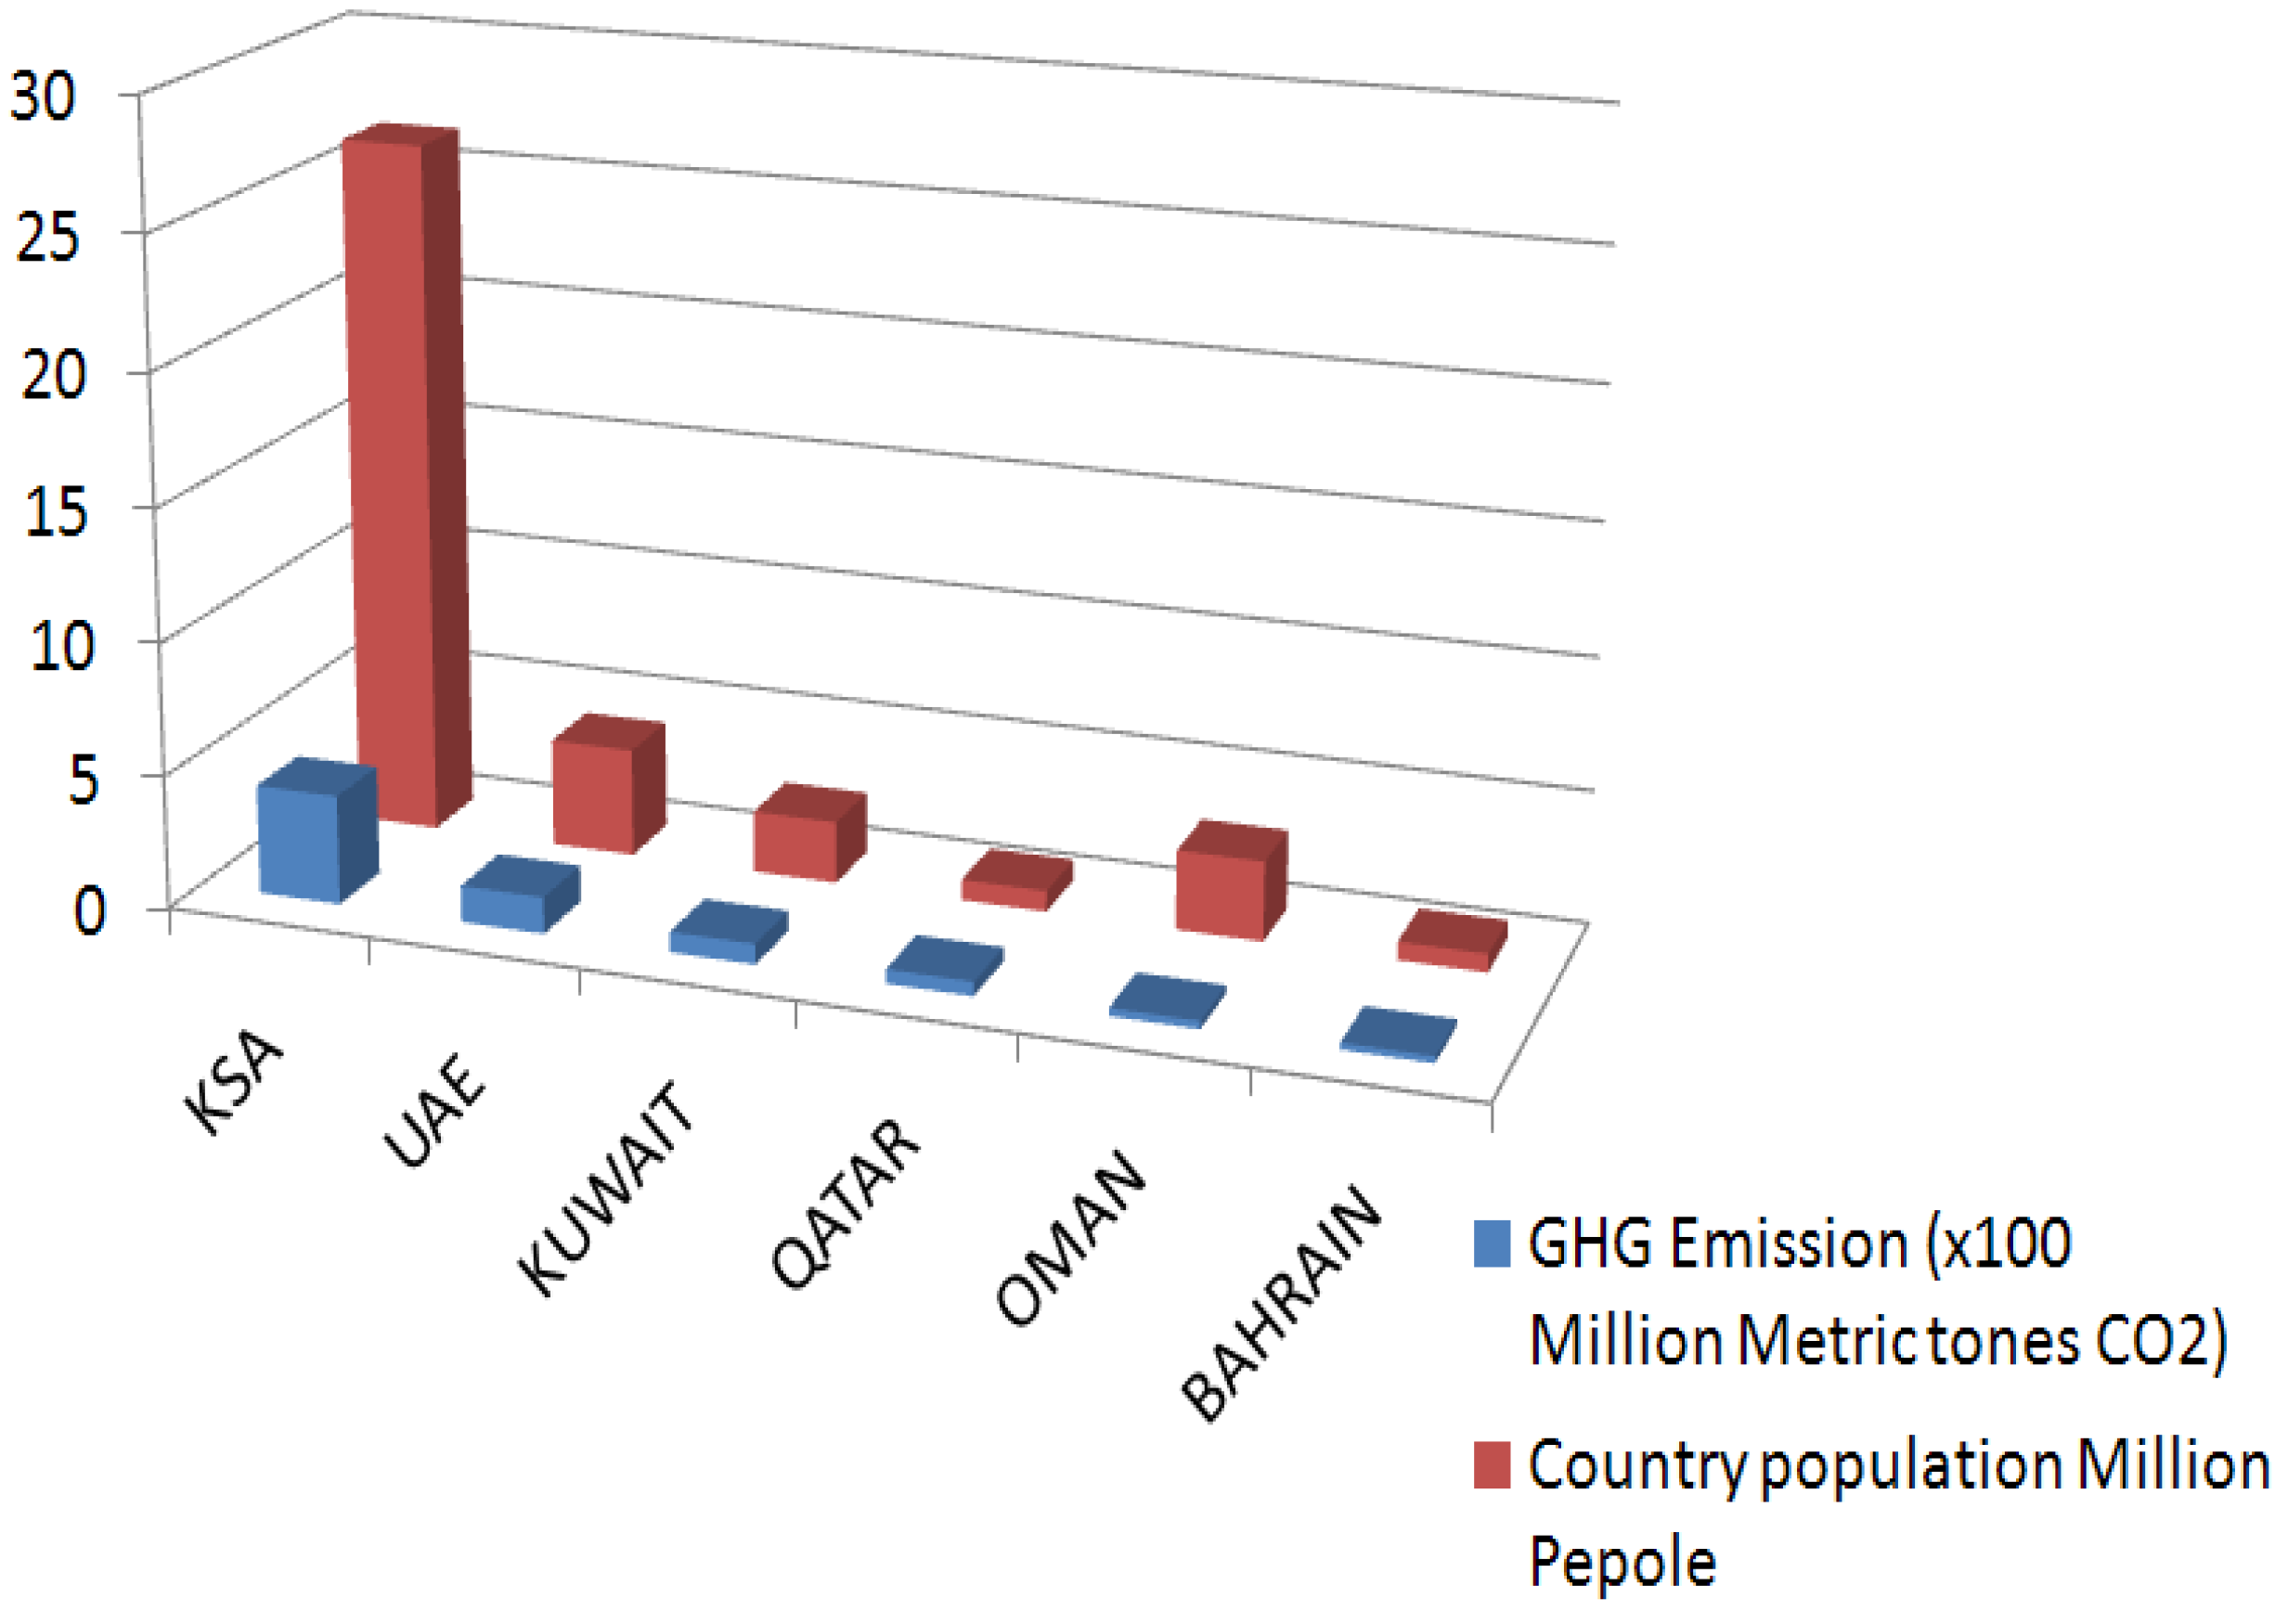
The next highest polluter as for CO2 emissions is Bahrain with its 36.58 tonnes pro-capite. Figure 7 shows as well the correlation between pro-capite electricity consumption and CO2 emissions in the GCC countries. Qatar comes in first (15,910 KWh pro-capite), followed by Kuwait (15,539 KWh pro-capite), and Bahrain comes in at the fourth position in electricity consumption, with 11,041 KWh pro-capite.
Figure 7.
Pro-capite Electricity consumption and GHG emission.

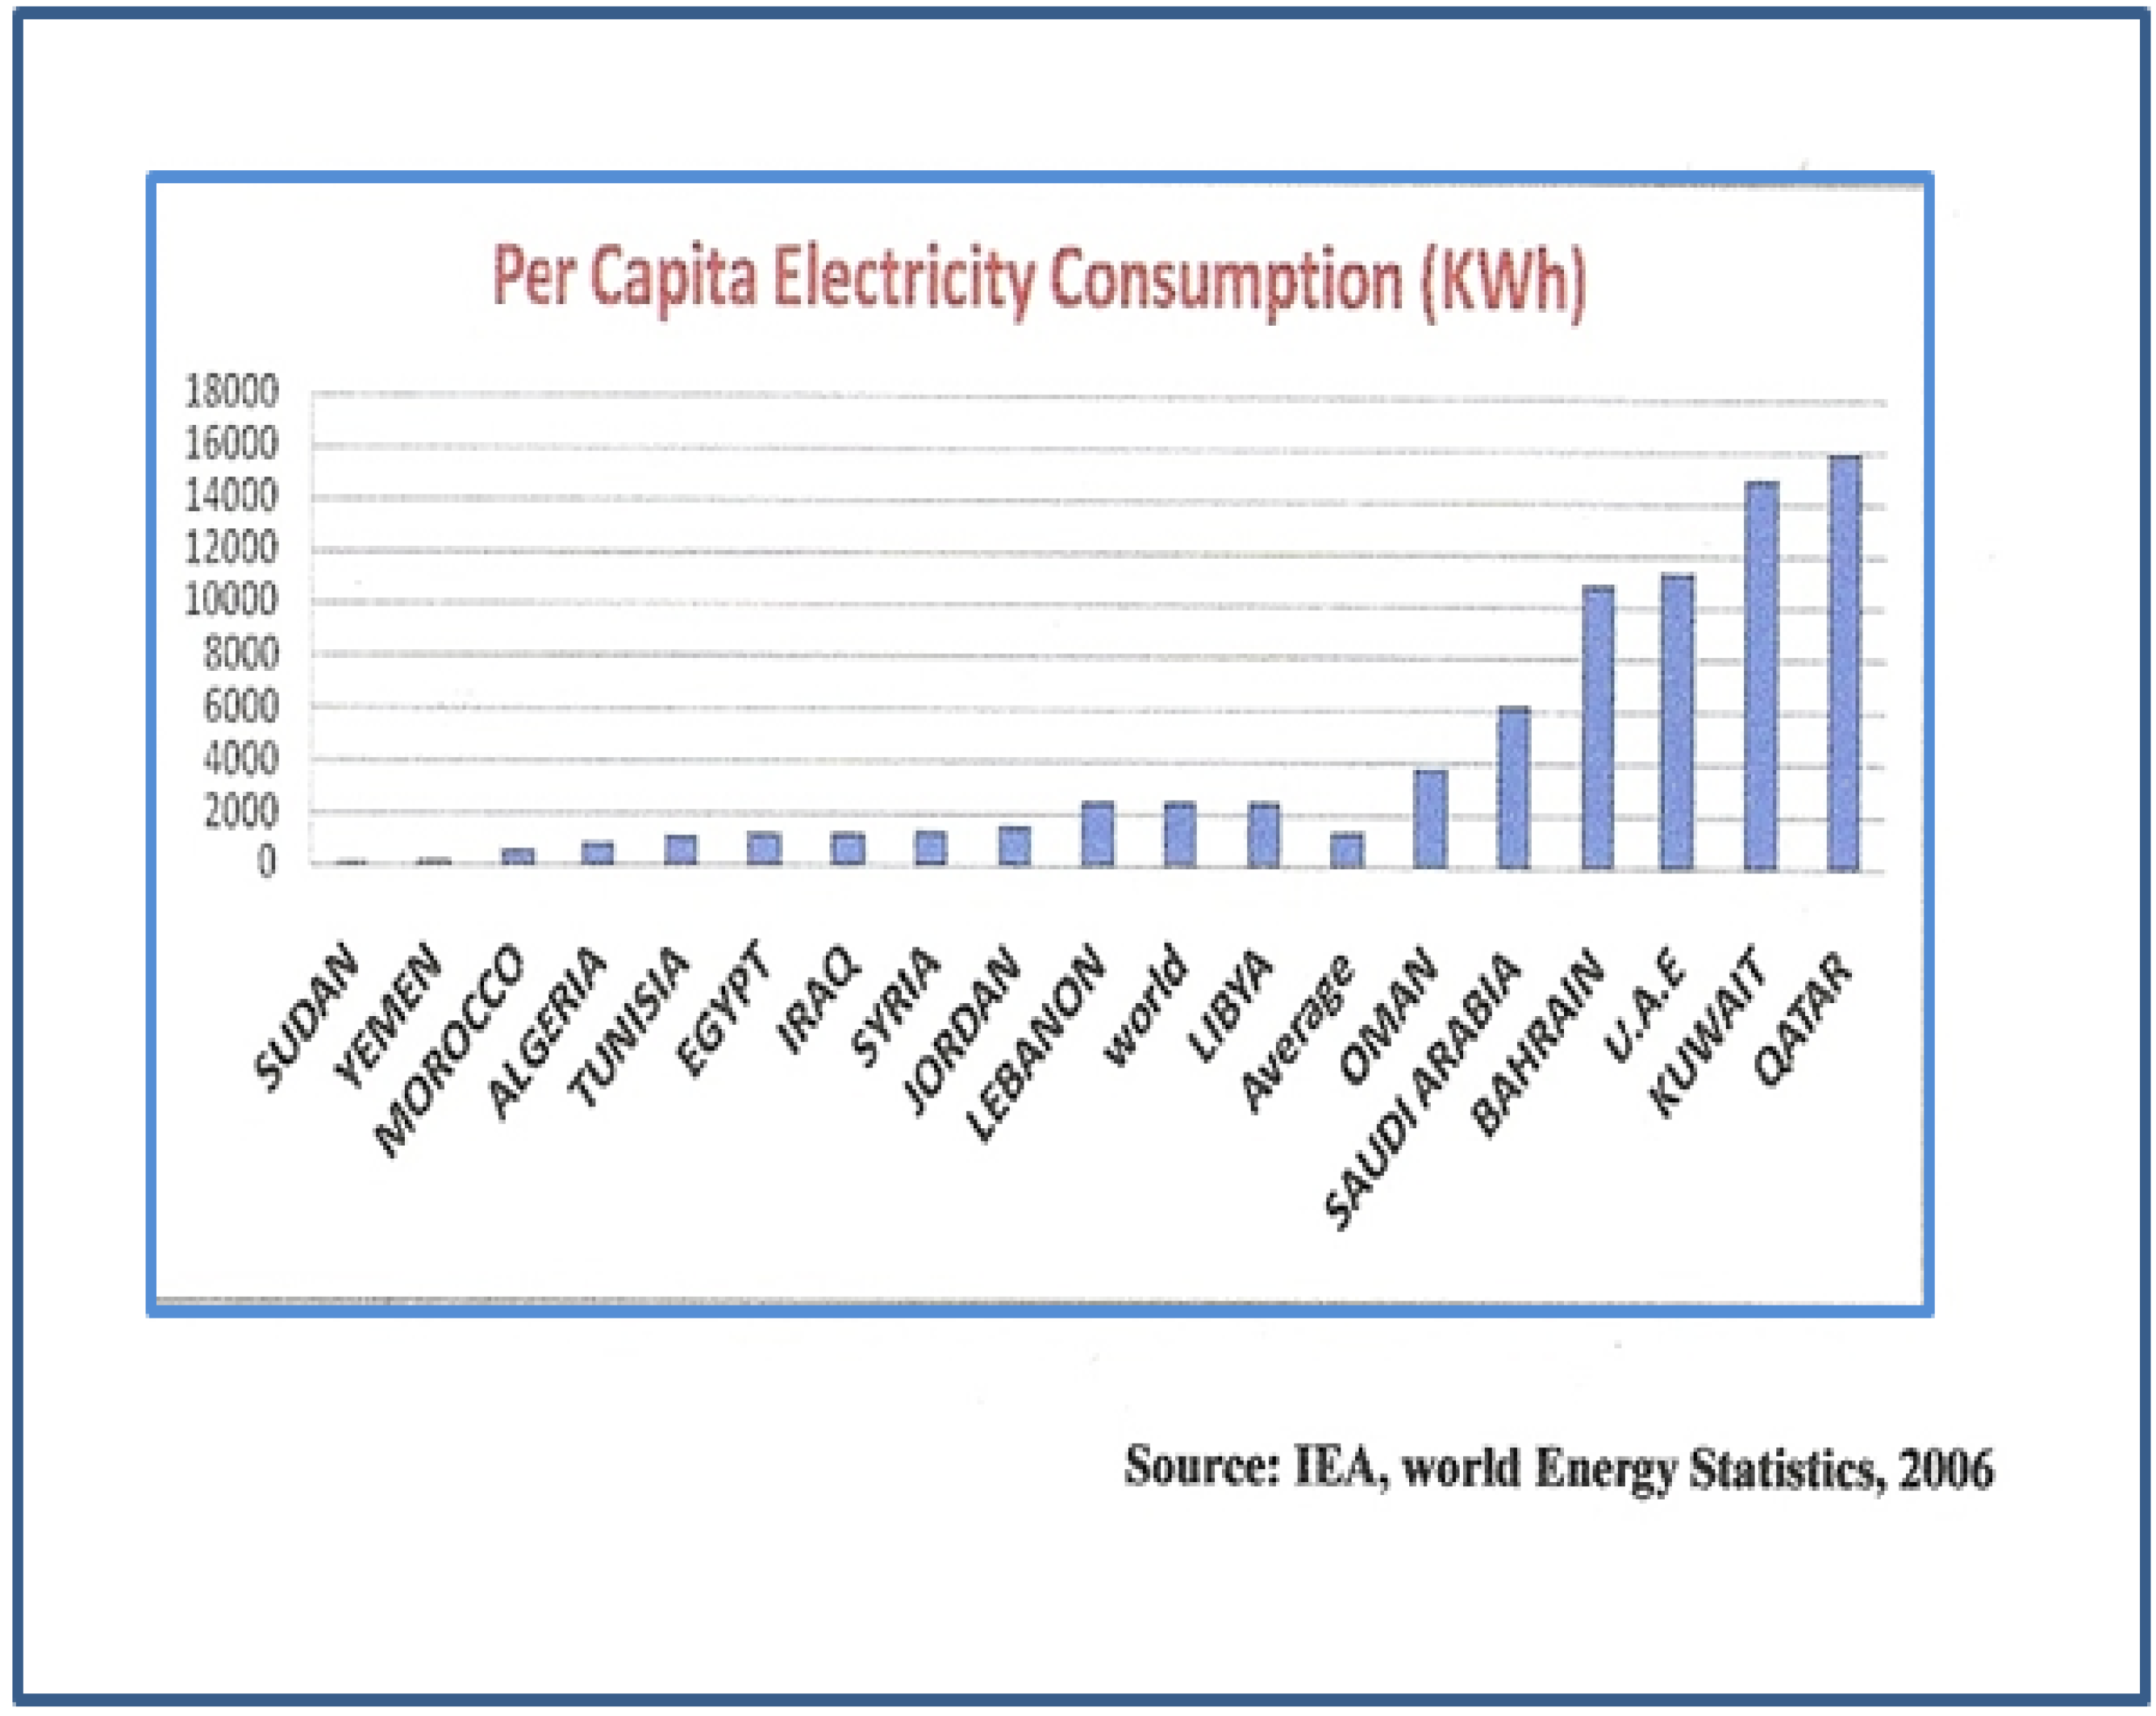
The reason for the retarding position of Bahrain from the second country for its CO2 emission to the fourth as electricity consumption pro-capite might be justified to the increased transportation and its related CO2 emissions in this country, which considered the second major source for CO2 emission after the energy sector in Bahrain. However, compared to other Arab countries (as shown in Figure 8) it can be clearly seen that Bahrain and the GCC countries relatively are still the leading countries in electricity consumption, according to the United Nations’ Environmental Program year 2006 collected information, shown in Figure 8 [9] It can be noticed again that Bahrain electricity consumption pro-capite is still considered one of the highest among the Arab and the GCC countries.
Figure 8.
Pro-capite consumption of electricity for Arab countries [9].
Figure 8.
Pro-capite consumption of electricity for Arab countries [9].

5. Comparison of Top GCC Countries to Other Industrialized Developing Countries
Malaysia and Singapore are developing countries with similar economic growth to KSA and UAE of the GCC countries. Figure 9 shows their CO2 GHG emissions compared to the GCC countries. As shown in the Figure, both Malaysia and Singapore have shown a relative increase in their CO2 emissions related to their increase in electricity and energy consumption.
Figure 9.
CO2 total emissions for GCC contraries, Malaysia and Singapore.

Comparing Malaysia with its population of 23 million to the KSA population of 26 million (according to the 2005 census), Saudi Arabia had significantly higher CO2 emissions—2.5 times the amount emitted by Malaysia in year 2005 (according to year 2005 KSA emission of 412 million metric tons, while Malaysia’s emissions were 155 million metric tons). On the other hand KSA shows very steep rise in its growth of CO2 emission too, while Malaysia is showing decline in its emissions after the year 2004. This could be due to the increased oil production and the total energy sector boost in KSA.
Comparing UAE with its 4 million population, similar to Singapore with 4.4 million population (according to year 2005 census), the UAE shows a relatively higher emission rate (but not as large as the Malaysia to KSA difference). The reason for that again could be the increased consumption of electricity in UAE and the energy sector as whole. The complete data for the two countries’ CO2 emissions are listed in Table 5 [5]:
| Year | KSA | UAE | Singapore | Malaysia |
|---|---|---|---|---|
| 1996 | 248.97 | 103 | 97.83 | 101.13 |
| 1997 | 254.05 | 111.34 | 99.46 | 101.52 |
| 1998 | 256.82 | 116.09 | 102.17 | 102.16 |
| 1999 | 262.68 | 117.62 | 104.05 | 105.85 |
| 2000 | 289.33 | 109.65 | 106.81 | 111.31 |
| 2001 | 299.89 | 118.13 | 107.6 | 124.16 |
| 2002 | 309.62 | 125.55 | 109.37 | 137.66 |
| 2003 | 344.78 | 126.38 | 111.54 | 148.68 |
| 2004 | 385.76 | 132.76 | 125.4 | 164.43 |
| 2005 | 412.35 | 137.82 | 133.88 | 155.51 |
6. Electricity Consumption Pro-capite for Singapore, Malaysia, and Japan
Table 6 below lists the GCC countries’ electricity consumption/CO2 GHG emission pro-capite compared with Singapore, Malaysia and also a highly industrialized country Japan [5,10,11].
| Year 2005 | GHG Emission tonnes of CO2 pro-capite | Electricity Consumption MWh pro-capite |
|---|---|---|
| KSA | 15.62 | 5.56 |
| UAE | 33.72 | 12.87 |
| KUWAIT | 32.83 | 15.54 |
| OMAN | 9.90 | 2.90 |
| QATAR | 68.15 | 15.91 |
| BAHRAIN | 36.58 | 11.04 |
| SINGAPORE | 30.2 | 7.7 |
| MALAYSIA | 6.5 | 3.3 |
| JAPAN | 9.6 | 7.6 |
As clarified in Figure 10 below, pro-capite Malaysia and Japan had lower CO2 emissions than any of the GCC countries, Singapore had relatively higher emissions, but it is still lower than the emissions of the UAE with its similar population size. A surprising finding in this case is Japan with its 127 million population and its high industrialization, still managed to reduce its pro-capite electricity consumption to 7.6 MWh, and CO2 emission of 9.6 tonnes pro-capite. This could be explained by the advanced policy of Japan for reducing emissions. Malaysia showed the highest efficiency of 6.5 tonnes of CO2 related to a minimized electricity consumption of 3.3 MWh pro-capite. In all, pro-capite, the GCC countries showed high consumption rates of electricity and CO2 emissions compared to other Asian developed countries like Malaysia, Singapore, and Japan; Qatar comes at the top of the list, with CO2 emissions seven times higher than Japan’s per capita emission.
Figure 10.
Year 2005–GCC–pro-capite Electricity Consumption and GHG emission.

7. Conclusions
GCC countries emit considerable amounts of CO2 from the combustion of fossil fuels, the main source for that emission being the energy sector, which includes the energy extraction and the energy conversion sectors: only the later has been considered in this study, because it is by far the most polluting and because it poses an important challenge for these countries. Electricity is generated in the GCC countries mostly by fossil-fueled (oil or gas) power plants. Global CO2–equivalent GHG emissions are rising rapidly in the GCC countries, especially in KSA and Qatar; at the same time, consumption and demand of electricity are rising rapidly as well. The forecast for the electrical demand in GCC countries by 2015 shows an excess of 80% with respect to the current installed base of generators, and this creates the challenge of finding new renewable or cleaner sources of power generation, because, in the “business as usual” scenario, in which the same sources of electricity generation are used, the global CO2 emissions would also increase by about 80%.
Current rates of electricity consumption and related CO2 emissions in GCC countries are higher than other developed countries of similar population but lower economical and technological development.
The high pro-capite consumption has several concurrent causes, like the high rate economic growth, the substantial rate of population growth, the relatively low cost (in some instances, free) electricity and energy prices in these countries, the hot climate, and the high number of degrees-day of cooling.
The governments in each of the GCC countries are striving to limit the increases in future electricity demand. Measures are being enacted or have been announced to reduce the current daily consumption, either by searching for alternative sources, like for instance the planned “Raas Al Khaimah” solar village in UAE, or investigating the possibility of shifting a portion of the electrical generation to nuclear sources, a policy that has been said to be considered in Bahrain and UAE.
Governmental tax and pricing policies with regard to electrical consumption and the related CO2 emissions vary significantly from one GCC country to the other. While some, such as Qatar and Kuwait, still offer electricity to their citizens free of charge for domestic use, and have launched an educational campaign towards energy fitness, others like Bahrain, KSA, and Oman offer strongly subsidized electricity prices for domestic use.
On the basis of the analysis presented in this paper, the following conclusions may be reached.
Domestic final uses are responsible for a high amount of electricity consumption in most of the GCC countries: at present, the only measures taken to curb energy consumption in general consist in government-sponsored campaigns advising consumers to reduce their electricity consumption. This is not sufficient, as the example of industrialized countries clearly demonstrates that a combined taxation-and-subsidies policy is necessary to attain significant amounts of saving in the domestic sector.
The other highly intensive sector is the tertiary one, which includes service-and governmental buildings, infrastructure, banks, schools & universities, shopping malls, etc. Here, it seems that consumption is actually encouraged rather than monitored! While it is unthinkable to limit such developments, it is very possible to limit their specific energy consumption (in kWh/m3, for example) by mandating stricter building standards and by encouraging the installation of centralized trigeneration systems. nevertheless it is important to mention here that electricity pricing for this sector is not subsidized by most of the GCC governments, but, however, the pricing is still relatively lower than most of other developed countries.
A related issue, namely the electrical consumption in water desalination, can be solved in a similar way, by giving priority to the somewhat neglected “thermal” technologies (MSF, MED) especially when arranged as bottomers for thermoelectric plants, or by encouraging the development of highly de-centralized solar-fed small RO plants. And at the moment many GCC universities and researchers are striving to find economical solutions in this field.
In short, it is by structurally imposed conversation measures rather than from technological quantum jumps that the GCC CO2 emissions can be curbed without impairing the countries’ development−this becomes of course a political issue rather than an engineering one, and must be tackled at governmental levels, preferably in a concerted fashion among the countries, to better exploit the possibility of exploiting synergies in the generation, distribution of both electricity and cold; A step which has already been started by building the GCC wide electrical distribution grid, but yet to be perfected by integrating power generation among the GCC countries.
References
- Page, D.; Nemzer, M. Energy for Keeps: Electricity from Renewable Energy; Carter, A., Ed.; Educators for the Environment: Tiburon, CA, USA, 2005; Chapter 3; pp. 20–25. [Google Scholar]
- Ruhl, C. BP Statistical Review of World Energy. Available online: http://www.bp.com/statisticalreview (accessed on 1 December 2009).
- Johnson, T.M. China: Issues and Options in Green House Gas Emission Control; Li, J., Jiang, Z., Taylor, R.P., Eds.; The World Bank: Washington, DC, USA, 1996; pp. 1–84. [Google Scholar]
- Cooper, D.C.; Alley, F.C. Air Pollution Control: A Design Approach, 3rd ed.; Waveland Press: Long Grove, IL, USA, 2002; pp. 20–23. [Google Scholar]
- Energy Information Administration. International, Electricity, consumption. Available online: http://www.eia.doe.gov/ (accessed on 25 September 2008).
- Meed. In Power and Water in the GCC: the Struggle to Keep Supplies Ahead of Demand Report; Research and Markets: Taylors lane, Dublin, Ireland, March 2008; pp. 1–79.
- Laura, W. Power and Water in the GCC Provides a Comprehensive Overview of Recent Developments; Research and Markets: Dublin, Ireland, 2008. [Google Scholar]
- International Energy Agency. Statistics, Electricity, Electricity/Heat Data. Available online: http://www.iea.org (accessed 20 September 2008).
- UNEP-Regional Office for West Asia (ROWA). Environment impacts of the arab oil and gas sector. In Proceedings of the Arab Regional Conference on Energy for Sustainable Development, Cairo, Egypt, September 10–12, 2005.
- U.S. Census Bureau. International Data Base (IDB). Available online: http://www.census.gov (accessed on 15 September 2008).
- Australia Official Government Statistics. Australia’s population, Australia’s Demographic Statistics. Available online: http://www.abs.gov.au/AUSSTATS (accessed on 28 August 2008).
- Bahrain Ministry of Electricity. Projects, Tenders. Available online: http://www.mew.gov.bh (accessed on 15, September 2008).
- Miller, P.; Patterson, Z.; Vaughan, S. Estimating Future Air Pollution from New Electric Power Generation. In Proceedings of the Environmental Challenges and Opportunities of the Evolving North American Electricity Market Symposium, Montréal, Québec, Canada, November, 2001.
- AlKuwari, Z.M. Bahrain First National Communication Report for the UNFCC; UNEP Coordination Office in Kenya: Nairobi, Kenya, March 2005. [Google Scholar]
- GCC Power 09. The Gulf Region Offers Massive Business Potential for Companies Involved in Electrical Generation. Available online: http://www.gcc-cigre-power.com/the_gcc_market.asp (accessed on 6 October 2009).
© 2009 by the authors; licensee Molecular Diversity Preservation International, Basel, Switzerland. This article is an open-access article distributed under the terms and conditions of the Creative Commons Attribution license (http://creativecommons.org/licenses/by/3.0/).
Share and Cite
MDPI and ACS Style
Qader, M.R. Electricity Consumption and GHG Emissions in GCC Countries. Energies 2009, 2, 1201-1213. https://doi.org/10.3390/en20401201
AMA Style
Qader MR. Electricity Consumption and GHG Emissions in GCC Countries. Energies. 2009; 2(4):1201-1213. https://doi.org/10.3390/en20401201
Chicago/Turabian StyleQader, Mohammed Redha. 2009. "Electricity Consumption and GHG Emissions in GCC Countries" Energies 2, no. 4: 1201-1213. https://doi.org/10.3390/en20401201