Article

Scenario Analyses of Road Transport Energy Demand: A Case Study of Ethanol as a Diesel Substitute in Thailand

by
Nuwong Chollacoop
1,*,
Peerawat Saisirirat
2,
Tuenjai Fukuda
3,4 and
Atsushi Fukuda
3,4
1
Bioenergy Laboratory, National Metal and Materials Technology Center (MTEC), Pathumthani 12120, Thailand
2
Department of Mechanical Engineering, King Mongkut’s University of Technology Thonburi (KMUTT), Bangkok 10140, Thailand
3
Asian Transportation Research Society (ATRANS), Bangkok 10110, Thailand
4
Department of Transportation Engineering and Socio-Technology, College of Science and Technology, Nihon University, Chiba 274-8501, Japan
*
Author to whom correspondence should be addressed.
Energies 2011, 4(1), 108-125; https://doi.org/10.3390/en4010108
Submission received: 15 October 2010 / Revised: 12 December 2010 / Accepted: 20 December 2010 / Published: 12 January 2011
(This article belongs to the Special Issue Energy-Friendly Transportation)

Abstract

:
Ethanol is conventionally used as a blend with gasoline due to its similar properties, especially the octane number. However, ethanol has also been explored and used as a diesel substitute. While a low-blend of ethanol with diesel is possible with use of an emulsifier additive, a high-blend of ethanol with diesel may require major adjustment of compression-ignition (CI) diesel engines. Since dedicated CI engines are commercially available for a high-blend ethanol in diesel (ED95), a fuel mixture comprised of 95% ethanol and 5% additive, this technology offers an option for an oil-importing country like Thailand to reduce its fossil import by use of its own indigenous bio-ethanol fuel. Among many strong campaigns on ethanol utilization in the transportation sector under Thailand’s Alternative Energy Strategic Plan (2008–2022), the Thai Ministry of Energy has, for the first time, conducted a demonstration project with ethanol (ED95) buses on the Thai road system. The current investigation thus aims to assess and quantify the impact of using this ED95 technology to reduce fossil diesel consumption by adjusting the commercially available energy demand model called the Long range Energy Alternatives Planning system (LEAP). For this purpose, first, the necessary statistical data in the Thai transportation sector were gathered and analyzed to construct the predicative energy demand model. Then, scenario analyses were conducted to assess the benefit of ED95 technology on the basis of energy efficiency and greenhouse gas emission reduction.

1. Introduction

Among many oil-importing countries, Thailand has spent over one trillion baht in fossil fuel import, just to meet with energy demands within the country [1]. Over the past five years, a majority of the energy import lies in crude oil. In particular, the recent oil crisis in 2007 has made crude oil more expensive than the electricity. Thailand’s ultimate energy consumption over the past decade has been dominated by the two economic sectors, namely transportation and industry, accounting for about one-third each [1]. When considering consumption per sector’s gross domestic product (GDP) value, transportation has consumed about 3–4 times that of industry. Hence, the transportation sector has long been the target of energy consumption reduction.
Within the transportation sector, three-quarters of energy consumption is dominated by land transportation, with twice the amount of diesel consumption than that of gasoline [1], as shown in Figure 1. Table 1 shows the breakdown of the number of vehicles using each type of fuel in Thailand in 2008, with pick-up trucks, buses and trucks as the major consumers of diesel fuel [2]. Hence, diesel has been a core energy source for the country’s transportation and logistics. Various policies have been initiated and implemented in order to reduce diesel consumption, partly to justify the unbalance of gasoline/diesel consumption in order to reduce crude oil import. Despite the fact that natural gas for vehicles (NGV) and biodiesel have been promoted to reduce diesel consumption in the National Alternative Energy Strategic Plan (2008–2022), as shown in Figure 2 [3], it has barely been noticed that ethanol, which is deemed with higher production capacity under National Alternative Energy Strategic Plan, can be used as diesel substitute.
Figure 1. History of Thailand’s energy consumption in the transportation sector by fuel type.
Energies 04 00108 g001
Table 1. List of the number of vehicles using each type of fuel in Thailand in 2008.
TypeTotalGasolineDieselLPGLPG + GasolineLPG + DieselCNGCNG + GasolineCNG + DieselElectricOthers
Motorcycle16,425,26216,417691-------742015.1
Passenger Cars4,273,0772,606,7731,105,3781692461,219159826372,7395941322,808
Pick-up Truck4,552,284230,3514,237,868233944,87530301733201988829,451
Bus134,2256924113,24262244931414482366239045224
Truck771,554627640,6436351628917,98231227926118,278
Other290,9519154228,82914,382499141600197-21792
ALL26,417,35319,271,5206,325,96019,670515,740566414,50079,83042517514172,704
Figure 2. The Thailand Alternative Energy Strategic Plan (2008–2022).
Energies 04 00108 g002
Ethanol has been technically proven as a diesel substitute in compression-ignition (CI) engines in two ways. First is by using a low-blend of ethanol in diesel with emulsifier to be used in conventional CI engines. Secondly, a high-blend of ethanol can be used in a modified CI engine, as has been continuously developed by Scania Company until their current third-generation commercially available CI ethanol engine, as shown in Figure 3. The present study aims to assess the possibility of using ethanol as a diesel substitute by reworking the energy demand model for the Thai transportation sector.
Figure 3. Scania 3rd-generation CI ethanol engine, showing the necessary modification from the conventional CI engine to allow a high-blend of ethanol to be used.
Energies 04 00108 g003

2. Methodology

In order to analyze energy use patterns in the transportation sector with capability to predict energy demand, a bottom-up approach was undertaken due to its capability to account for the flow of energy based on simple engineering relationships, such as traveling demand, fuel consumption and vehicle numbers. Among many others, the Long-range Energy Alternatives Planning (LEAP) system, which has been widely used around the world, is utilized to construct the energy demand model in this study [4].
The energy demand function in the transportation sector can be modeled as described in Equation (1):
EDij = NVij × VKTj × FEij
In other words, the energy demand in the transportation sector can be determined by integrating the results over every fuel type “i” and vehicle type “j”. Despite the simple looking relationship shown in Equation (1), technicalities involved in model construction go beyond merely data collection since, unlike typical developed countries, developing countries like Thailand still lack many necessary time-series transportation data. The existing data is sometimes only available in Thai language and not in open literature. Only a few publications with detailed energy demand modeling of the Thai transportation sector are available in open literature [5,6], while others have focused on other energy consumption sectors [7,8,9,10]. In addition to difficulty in data collection, some assumptions are necessary to predict the future energy demand because the involved variables are varied with time. Firstly, the number of registered vehicle (NV) is predicted from records from the Transport Statistics Sub-Division, Department of Land Transport (DLT). The data can be fitted with economic and population growth by recourse to prior works [6,11,12]. However, when some necessary data like Vehicle Kilometer of Travel (VKT) is not sufficiently available, some detailed assumptions must be applied. Other data, like Fuel Economy (FE), can be extrapolated as the function of engine size, engine technology and fuel used, which are dependent on vehicle type and fuel proportion of the vehicle owner. Finally, the validation of the energy demand model with the historic supply record will be calibrated before scenario analyses are conducted.
Business-as-usual (BAU) assumptions were formulated from previous studies and related governmental transportation policies [11,13] between 2010 and 2030. Ethanol promotion policy measures in both gasoline and diesel sectors were taken into account in order to estimate various fuels needed by different vehicle categories, especially in the diesel sector. The ethanol consumption target set in Figure 2 was benchmarked in order to rationalize further assumptions. Various scenario analyses were then conducted with the typically s-curve market penetration behavior for this new technology (ED95) in various vehicle categories [14]. Benefits were highlighted in terms of energy efficiency and GHG emission reduction when NGV buses were substituted by ED95 buses.

3. Energy Demand Model

As mentioned in Equation (1), energy demand function in the transportation sector can be constructed from knowledge of vehicle stock, vehicle kilometer of travel and fuel economy. A brief summary of the energy model construction is discussed here, and more details can be found elsewhere [15].

3.1. Model Setup

Vehicle types can be re-categorized from DLT classification for the purpose of LEAP calculation, as shown in Table 2. Note that the agriculture vehicle, utility vehicle and automobile trailer are not considered in this work because they consume a small fraction of energy. For each vehicle category, three general vehicle population models were used as follows:
  • Exponential function [5];
  • Logistic Regression function [11,16,17,18];
  • Combined function of the above two.
where detailed functional fitting and graphs can be seen elsewhere [15]. Table 3 shows vehicle population models (with R2 fitting parameter) for all vehicle types in Bangkok and provincial regions.
Table 2. Vehicle re-classification in LEAP model from DLT data.
A. Total vehicle under motor vehicle actB. Total vehicle under land transport act
 MV.1 Not more than 7 passengersPC01
passenger car
 Bus
 MV.2 Microbus & Passenger van  - Fixed Route BusBus01
 MV.3 Van & PickupPC02  - Non Fixed Route BusBus02
 MV.4 Motor tri-cyclePC03
motor tri-cycle
  - Private BusBus03
 MV.7 Fixed Route Taxi (Subaru) Small Rural BussBus04
 MV.8 Motor tri-cycle Taxi (Tuk Tuk) Truck
 MV.6 Urban TaxiPC04
taxi
  - Non Fixed Route TruckTruck01
 MV.5 Interprovincial TaxiPC05
Commercial rent car
  - Private TruckTruck02
 MV.9 Hotel Taxi
 MV.10 Tour Taxi
 MV.11 Car for Hire
 MV.12 MotorcyclePC06
Motor cycle
 MV.17 Public Motorcycle
 MV.13 Tractor-
 MV.14 Road Roller
 MV.15 Farm Vehicle
 MV.16 Automobile Trailer
Table 3. Vehicle population models for all vehicle types in (a) Bangkok and (b) provincial regions.
(a)N_vehicle Bangkok (GDPpCap)R2
PC01
Private passenger car
ln ( V O 0.812 V O ) = 1.3273 ln G D P p C a p 17.8210 0.8632
PC02
Pickup
ln ( V O 0.5 V O ) = 2.2175 ln G D P p C a p 28.005 0.7992
PC03
Motor tri-cycle
N V = 16686.9                            y r 2001 N V = R a n d . ( y r )                  2002 y r 2004 N V = 1265.6 ln ( y r τ ) + 12527     ;    τ = 2004                                                  y r 2005 0.9681 (2005–2008)
PC04
Taxi
ln V O = 2.6119 ln G D P p C a p 35.373 0.7811
PC05
Commercial rent car
N V = 178.6 ln ( y r τ ) + 2399.4 ;   ;   τ = 1988 0.4052 (1989–1998)
PC06
Motor cycle
ln ( V O 0.6 V O ) = 1.5731 ln G D P p C a p 20.2060 0.7642
Bus01
Fixed route bus
N V = 13970                                     y r 1998 N V = 3585.8 ln ( y r τ ) + 14061    ;   τ = 1998                                                        y r 1999 0.9584
Bus02
Non fixed route bus
N V = ( 1 - 0.5071 e - 0.0323 * ( y r τ ) ) ( 1786.9 ln ( y r τ ) + 6724.6 ) τ = 1988          0.9057
Bus03
Private bus
N V = ( 0.5071 e - 0.0323 * ( y r τ ) ) ( 1786.9 ln ( y r τ ) + 6724.6 ) τ = 1988       0.7376
sBus04
Small rural bus
--
Truck01
Non fixed route truck
N V = ( 1 0.7868 e - 0.0155 * ( y r τ ) ) ( 20577 ln ( y r τ ) + 56314 ) τ = 1988        0.9136
Truck02
Private truck
N V = ( 0.7868 e - 0.0155 * ( y r τ ) ) ( 20577 ln ( y r τ ) + 56314 ) τ = 1988       0.5143
(b)N_vehicle Provincial (GDPpCap)R2
PC01
Private passenger car
ln ( V O 0.812 V O ) = 2.5007 ln G D P p C a p 31.025 0.8842
PC02
Pickup
ln ( V O 0.5 V O ) = 2.5491 ln G D P p C a p 30.388 0.8244
PC03
Motor tri-cycle
V O = 0.0005188 -
PC04
Taxi
ln ( V O ) = 2.2974 ln G D P p C a p + 14.4340 0.5965
PC05
Commercial rent car
ln ( V O ) = 1.8111 ln G D P p C a p 31.1840 0.6464
PC06
Motor cycle
ln ( V O 0.6 V O ) = 2.3609 ln G D P p C a p 26.678 0.7021
Bus01
Fixed route bus
ln ( V O ) = 0.2530 ln G D P p C a p 9.7824 0.8181
Bus02
Non fixed route bus
ln ( V O ) = 1.6778 ln G D P p C a p 26.689 0.9533
Bus03
Private bus
ln ( V O ) = 0.0659 ( y r τ ) 10.422 τ = 1988 0.9620
Bus04
Small bus
ln ( V O ) = 0.0049   ( y r τ ) 2 + 0.0604   ( y r τ ) 7.9501 τ = 1988 0.8942
Truck01
Non fixed route truck
ln ( V O ) = 0.0787 ( y r τ ) 8.1426 τ = 1988 0.9842
Truck02
Private truck
ln ( V O ) = 0.3046 ln ( y r τ ) 5.6463 τ = 1988 0.9574
Next, the vehicle kilometer of travel (VKT) is a parameter to reflect how heavily the considered vehicle is used. Hence, this parameter varies depending on the vehicle type and its driven area. Moreover, it should be noted that the VKT is not constant with time because the gross road distance and/or traffic conditions changes. Unfortunately, the VKT data in Thailand is not recorded on a regular basis, and the statistics survey works are not frequently conducted. To the best of the authors’ knowledge, there are only two rather complete survey results, from 1997 [19] and 2008 [20]. Extrapolation and averaging from these two data sources were conducted in the LEAP model [15].
Last, fuel economy (FE) is defined as the quantity of energy consumed in a unit of driven distance, which depends on the vehicle size, vehicle type, vehicle’s powertrain technology (engine type) and fuel type used. The engine type can be classified into the spark ignition (SI, gasoline) and compression ignition (CI, diesel) engine. The distributed fuel types can also be categorized into gasoline, gasohol E10, gasohol E20, Diesel, Diesel B5, liquid petroleum gas (LPG) and compressed natural gas (CNG). Clearly, many parameters can affect FE, and certain assumptions must be applied for the energy demand model. A parameter, called Device Share (DS), was introduced to specify the fuel sharing when two fuel types are used, such as gasohol (gasoline and ethanol), bi-fueled CNG (gasoline and CNG) and diesel dual fuel (DDF: diesel and CNG). When CNG is used in certain vehicle types, the FE was approximated from [21,22]. Table 4 shows approximated fuel sharing percentage data from DLT records in Bangkok and provincial regions, where a small fraction was estimated to zero for simplicity of the calculation. On the other hand, Table 5 shows FE of each vehicle type in th LEAP model for Bangkok and provincial regions.
Table 4. Approximated fuel sharing in (a) Bangkok and (b) provincial regions.
(a) BangkokLiquid Fueled EngineLiquid/Gas Fueled EngineDedicated Gas
SI Engine *Diesel*Bi-fuel SI LPG *Bi-fuel SI CNG *DDF LPG *DDF CNG *LPG dedic. *CNG dedic. *
Gasoline **E10 **E20 **
PC0178.16%20.38%1.46%0.00%0.00%0.00%0.00%0.00%
42.86%56.57%0.57%
PC025.25%94.75%0.00%0.00%0.00%0.00%0.00%0.00%
67.95%32.05%0.00%
PC0342.46%0.00%17.84%0.00%0.00%0.00%37.48%2.22%
79.58%20.42%0.00%
PC0414.01%0.00%77.00%7.62%0.00%0.00%1.37%0.00%
42.86%56.57%0.57%
PC0569.73%26.92%3.35%0.00%0.00%0.00%0.00%0.00%
42.86%56.57%0.57%
PC06100.00%0.00%0.00%0.00%0.00%0.00%0.00%0.00%
65.57%34.43%0.00%
Bus071.24%94.77%2.39%0.00%0.00%0.00%0.00%1.60%
100.00%0.00%0.00%
Bus080.39%99.61%0.00%0.00%0.00%0.00%0.00%0.00%
100.00%0.00%0.00%
Bus090.80%99.20%0.00%0.00%0.00%0.00%0.00%0.00%
100.00%0.00%0.00%
sBus04
Truck100.00%99.30%0.00%0.00%0.22%0.48%0.00%0.00%
100.00%0.00%0.00%
Truck110.39%99.61%0.00%0.00%0.00%0.00%0.00%0.00%
100.00%0.00%0.00%
(b) ProvinceLiquid Fueled EngineLiquid/Gas Fuel EngineDedicated Gas
SI Engine*Diesel *Bi-fuel SI LPG *Bi-fuel SI CNG *DDF LPG *DDF CNG *LPG dedic. *CNG dedic. *
Gasoline**E10**E20**
PC0168.83%30.31%0.86%0.00%0.00%0.00%0.00%0.00%
49.83%50.17%0.00%
PC027.17%92.83%0.00%0.00%0.00%0.00%0.00%0.00%
67.95%32.05%0.00%
PC0347.60%0.00%0.00%0.00%0.00%0.00%52.40%0.00%
79.58%20.42%0.00%
PC0468.61%19.13%12.26%0.00%0.00%0.00%0.00%0.00%
49.83%50.17%0.00%
PC0584.01%10.18%5.81%0.00%0.00%0.00%0.00%0.00%
49.83%50.17%0.00%
PC06100.00%0.00%0.00%0.00%0.00%0.00%0.00%0.00%
74.56%25.44%0.00%
Bus073.71%96.29%0.00%0.00%0.00%0.00%0.00%0.01%
100.00%0.00%0.00%
Bus0824.15 %75.85%0.00%0.00%0.00%0.00%0.00%0.00%
100.00%0.00%0.00%
Bus090.00%100.00%0.00%0.00%0.00%0.00%0.00%0.00%
100.00%0.00%0.00%
sBus0413.32%86.68%0.00%0.00%0.00%0.00%0.00%0.00%
100.00%0.00%0.00%
Truck100.00%100.00%0.00%0.00%0.00%0.00%0.00%0.00%
100.00%0.00%0.00%
Truck110.00%100.00%0.00%0.00%0.01%0.00%0.00%0.00%
100.00%0.00%0.00%
Table 5. Approximated FE of all vehicle types in (a) Bangkok and (b) provincial regions.
(a) Bangkok km/litre and km/kg for CNGSingle Fuel EngineDedicative Gas Engine
Spark ignition engineDiesel engineLPGCNG
GasolineE10E20
PC0110.62 *11.30 *9.85 **11.44 *9.87 *10.85 *
PC0210.00 *9.64 **9.28 **11.21 *11.57 *11.33 *
PC0310.92 **10.52 **10.13 **12.00 **9.71 *9.29 *
PC0410.58 **10.20 **9.82 **11.63 **9.83 **10.81 **
PC0511.83 **11.40 **10.97 **13.00 **10.99 **12.08 **
PC0632.77*29.24 *----
Bus012.18 **2.10 **2.03 **2.40 *2.03 **1.86 *
Bus022.09 **2.01 **1.94 **2.30 **1.94 **2.13 **
Bus032.09 **2.02 **1.95 **2.31 **1.95 **2.14 **
sBus04------
Truck012.57 **2.48 **2.38 **2.83 *2.39 **2.63 **
Truck022.22 **2.14 **2.06 **2.44 **2.07 **2.27 **
(b) Province km/litre and km/kg for CNGSingle Fuel EngineDedicative Gas Engine
Spark ignition engineDiesel engineLPGCNG
GasolineE10E20
PC0112.28 *12.43 *11.40 **11.96 *11.03 *10.04 *
PC0211.88 *12.07 *11.02 **12.04 *11.00 *12.42 *
PC0316.16 *15.57 *15.00 **16.06 **12.18 *9.29 **
PC0412.09 **11.66 **11.22 **12.02 **11.03 **11.26 **
PC0510.82 **10.43 **10.04 **10.75 **9.87 **10.08 **
PC0625.75 *25.92 *----
Bus014.18 **4.03 **3.88 **4.15 *3.81 **3.12 *
Bus024.37 **4.21 **4.06 **4.34 **3.99 **4.07 **
Bus034.35 **4.19 **4.04 **4.32 **3.97 **4.05 **
sBus044.71 **4.54 **4.37 **4.68 **4.29 **4.38 **
Truck014.05 **3.90 **3.76 **4.02 *3.69 **2.01 *
Truck024.68 **4.51 **4.34 **4.65 **4.27 **4.36 **
* from [20], ** extrapolated from [19] using engine size/technology assumptions.

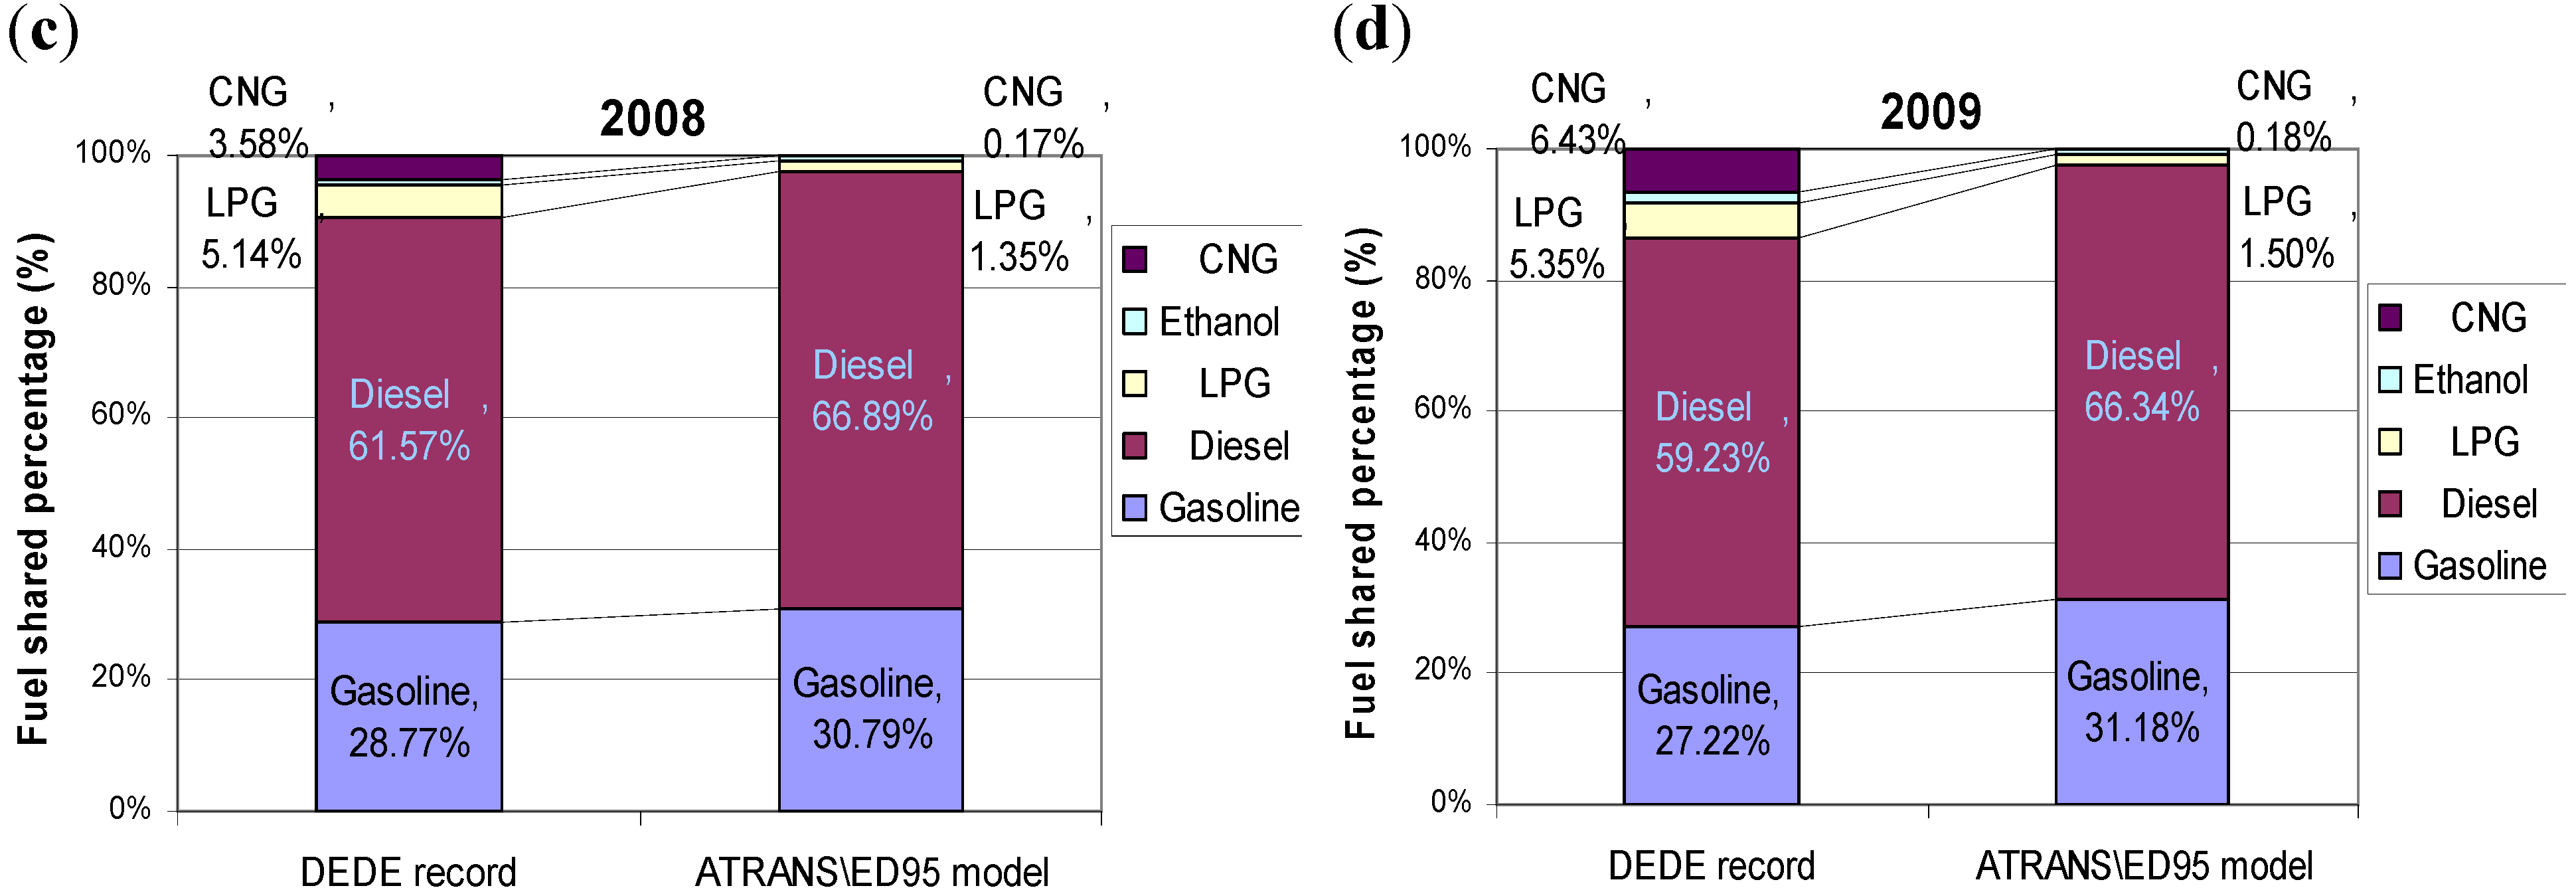
3.2. Model Calibration

With all the model setup, assumptions and correction factor on the recent fuel price hike taken into account, the validation of the model capability for the base year and other years against the fuel sale record from DEDE [1] can be shown in Figure 4.
Figure 4. Validation of the energy demand model for fuel consumption in the years 2006–2009 for (a) all fuel types, (b) gasoline and (c) diesel fuels.
Energies 04 00108 g004
Despite the absolute difference between the model prediction and fuel sale record shown in Figure 4, Figure 5 reveals that the deviation of predicted results mainly comes from the gas fractions (LPG and CNG) due to fuel switching behavior because LPG and CNG are subsidized in Thailand. In addition, the registration of gas-conversion vehicles was mandated after the base year of calculation so there were some errors in the number of vehicles using LPG/CNG. However, this minor impact is beyond the scope of this work, and it is not possible to incorporate into the LEAP application [4].
Figure 5. Validation of the energy demand model with % fuel fraction in the year (a) 2006, (b) 2007, (c) 2008, and (d) 2009.
Energies 04 00108 g005aEnergies 04 00108 g005b

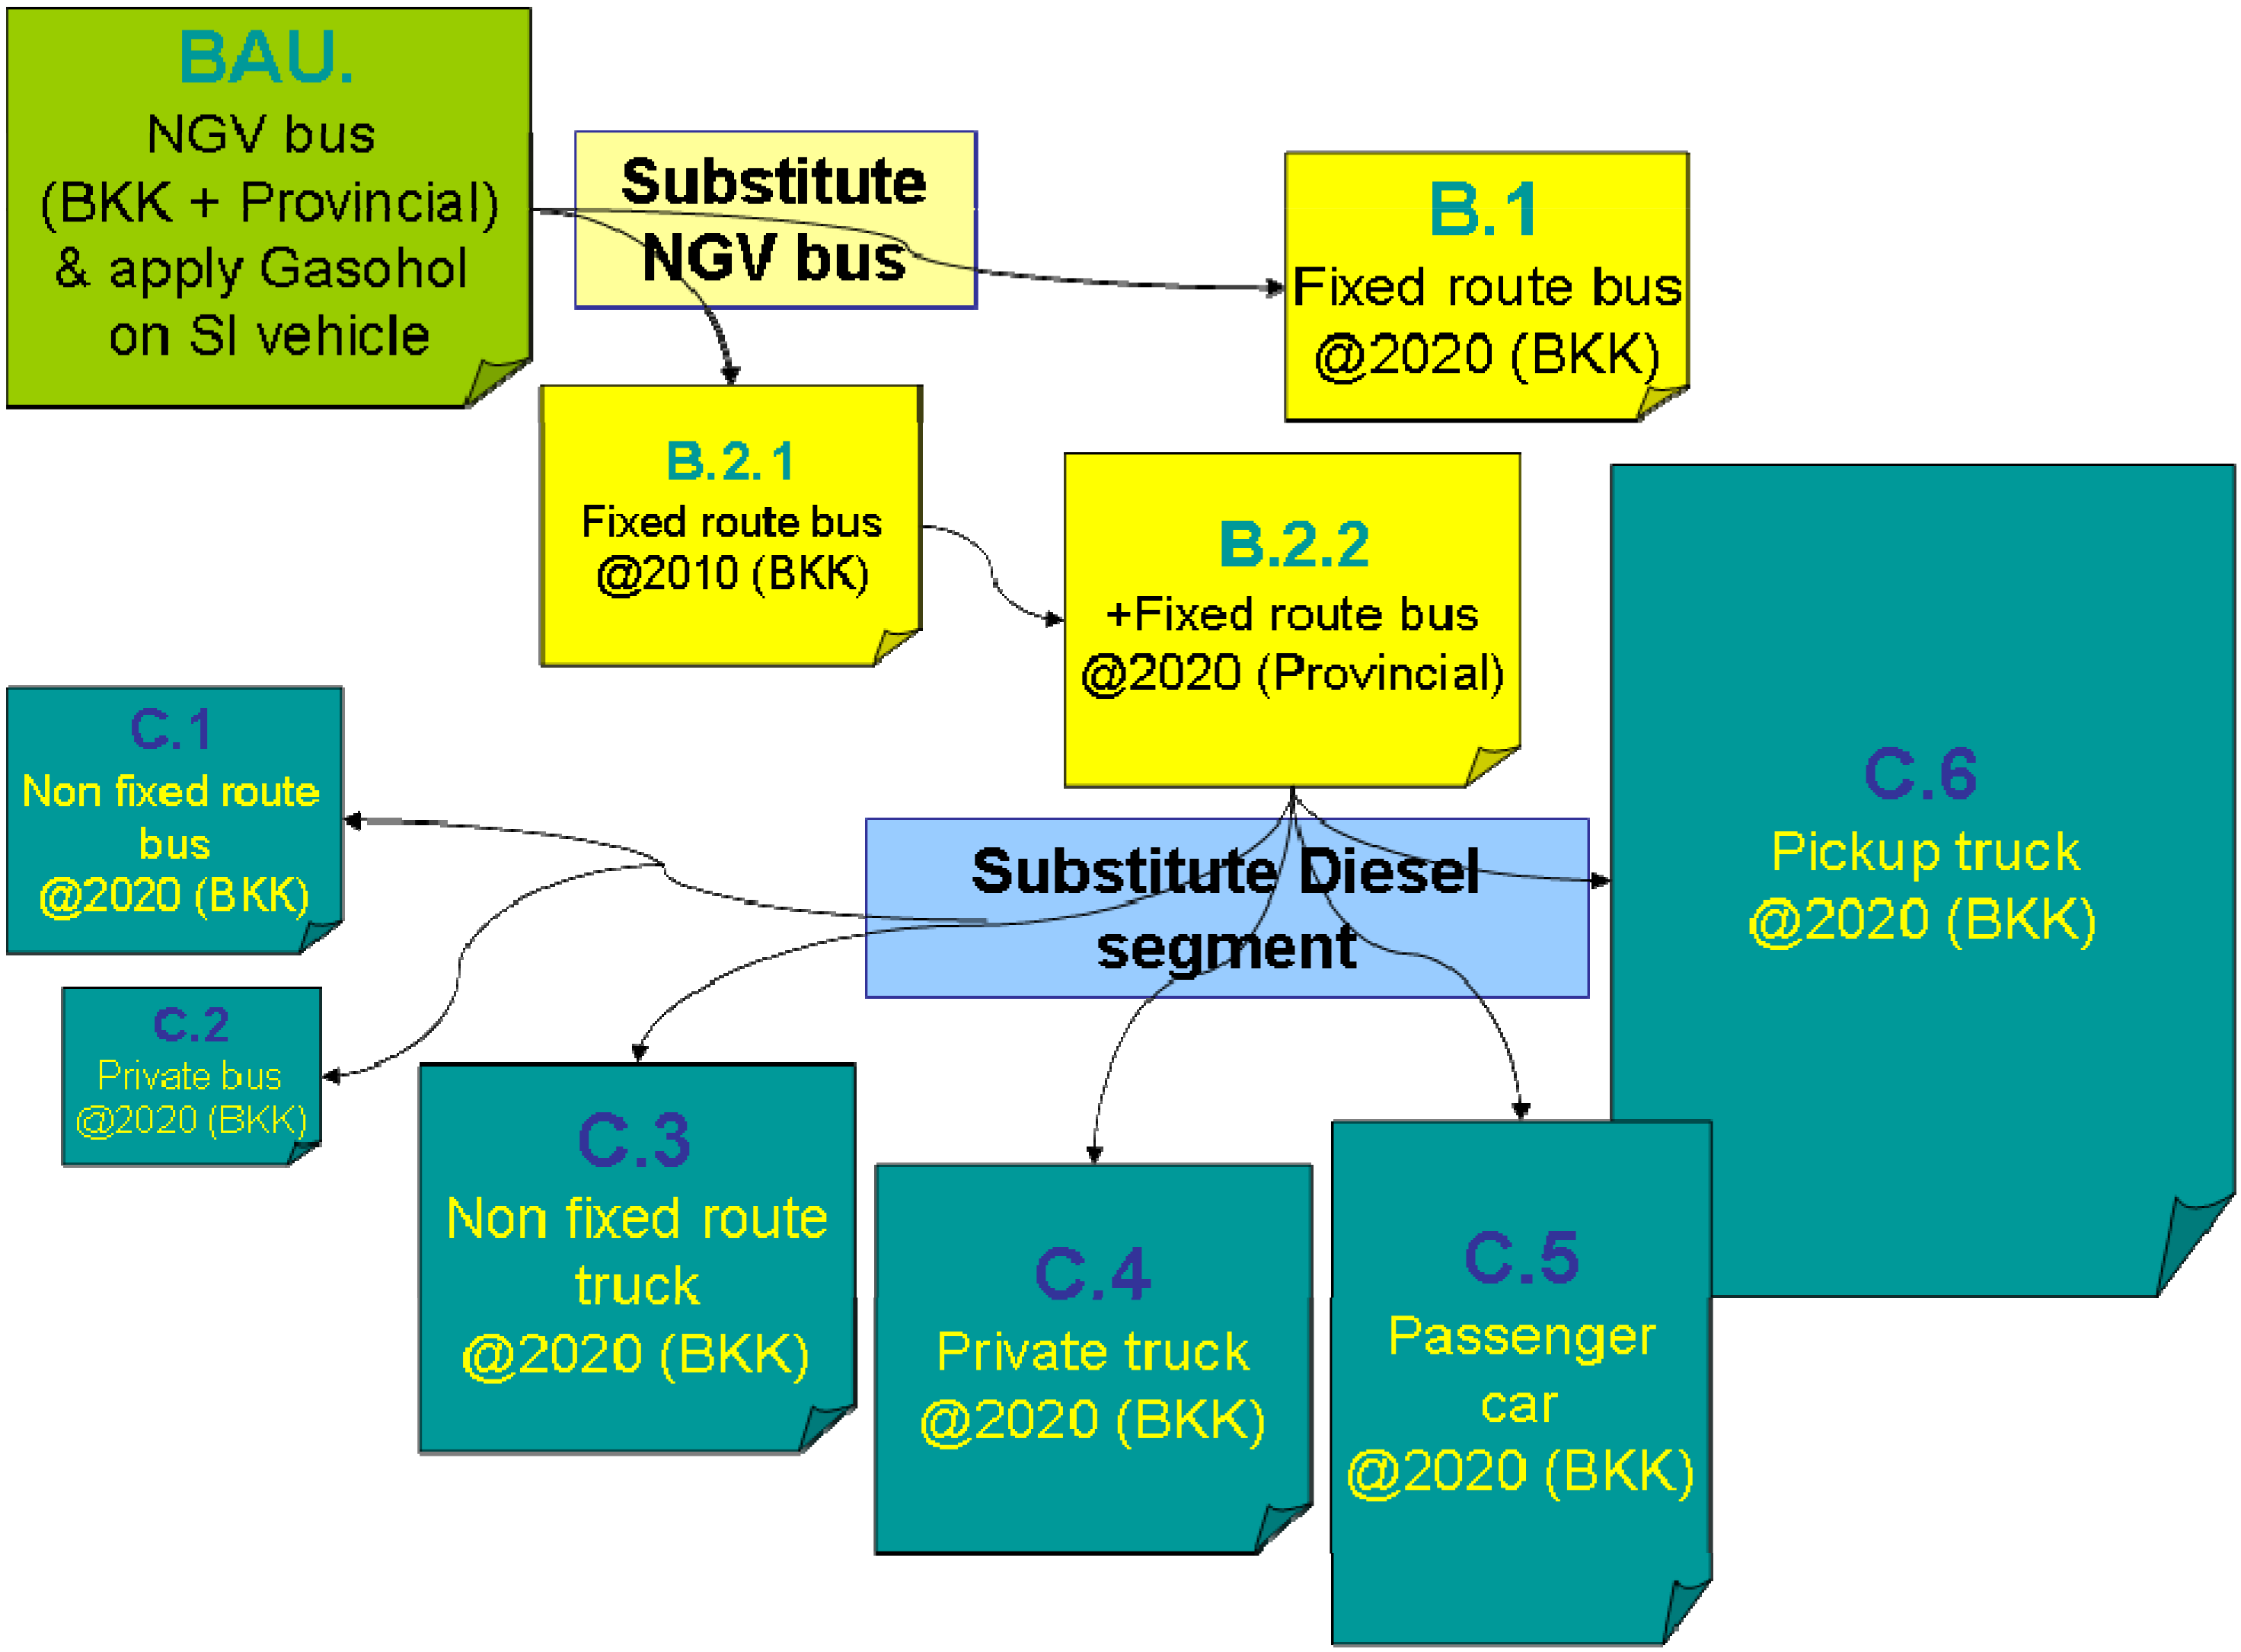
3.3. Business-As-Usual (BAU) and Scenario Analyses

As previously mentioned, Business-As-Usual (BAU) energy demand model was established from the following assumptions beginning from 2010. The energy demand was then predicted for the period from 2010 to 2030. Note that the typical S-curve for market penetration of new technology was applied to all assumptions in the BAU and scenario analyses:
New SI vehicles will switch to E20 (20% ethanol blended in gasoline) within 10 years [11];
New SI motorcycles will switch to E10 (10% ethanol blended in gasoline) within 10 years [11];
New fixed route buses will switch to NGV within 10 years [13].
For scenario analyses, the investigation was first focused on substitution of NGV by ED95 fuel in the fixed route bus sector. In addition, various assumptions were applied to investigate diesel substitution by ED95 fuel in other sectors such as truck, private bus and passenger car. All cases considered can be summarized in Table 6 and Figure 6.
Table 6. Summary of various assumptions on BAU and scenario analyses.
CasesBased AssumptionNGV Substitute (Fixed Route Bus)Diesel Substitute @2020
BAU
New SI vehicle will switch to E20 within 10 years
New SI motorcycle will switch to E10 within 10 years
New fixed route bus will switch to NGV within 10 years
B1BKK @2020
B2.1BKK @2010
B2.2BKK @2010, Provincial @2020
C1BKK @2010, Provincial @2020Non Fixed Route Bus BKK
C2BKK @2010, Provincial @2020Private Bus BKK
C3BKK @2010, Provincial @2020Non Fixed Route Truck BKK
C4BKK @2010, Provincial @2020Private Truck BKK
C5BKK @2010, Provincial @2020Passenger Car BKK
C6BKK @2010, Provincial @2020Pick-Up Truck BKK
Figure 6. Summary of various assumptions applied to BAU and scenario analyses.
Energies 04 00108 g006

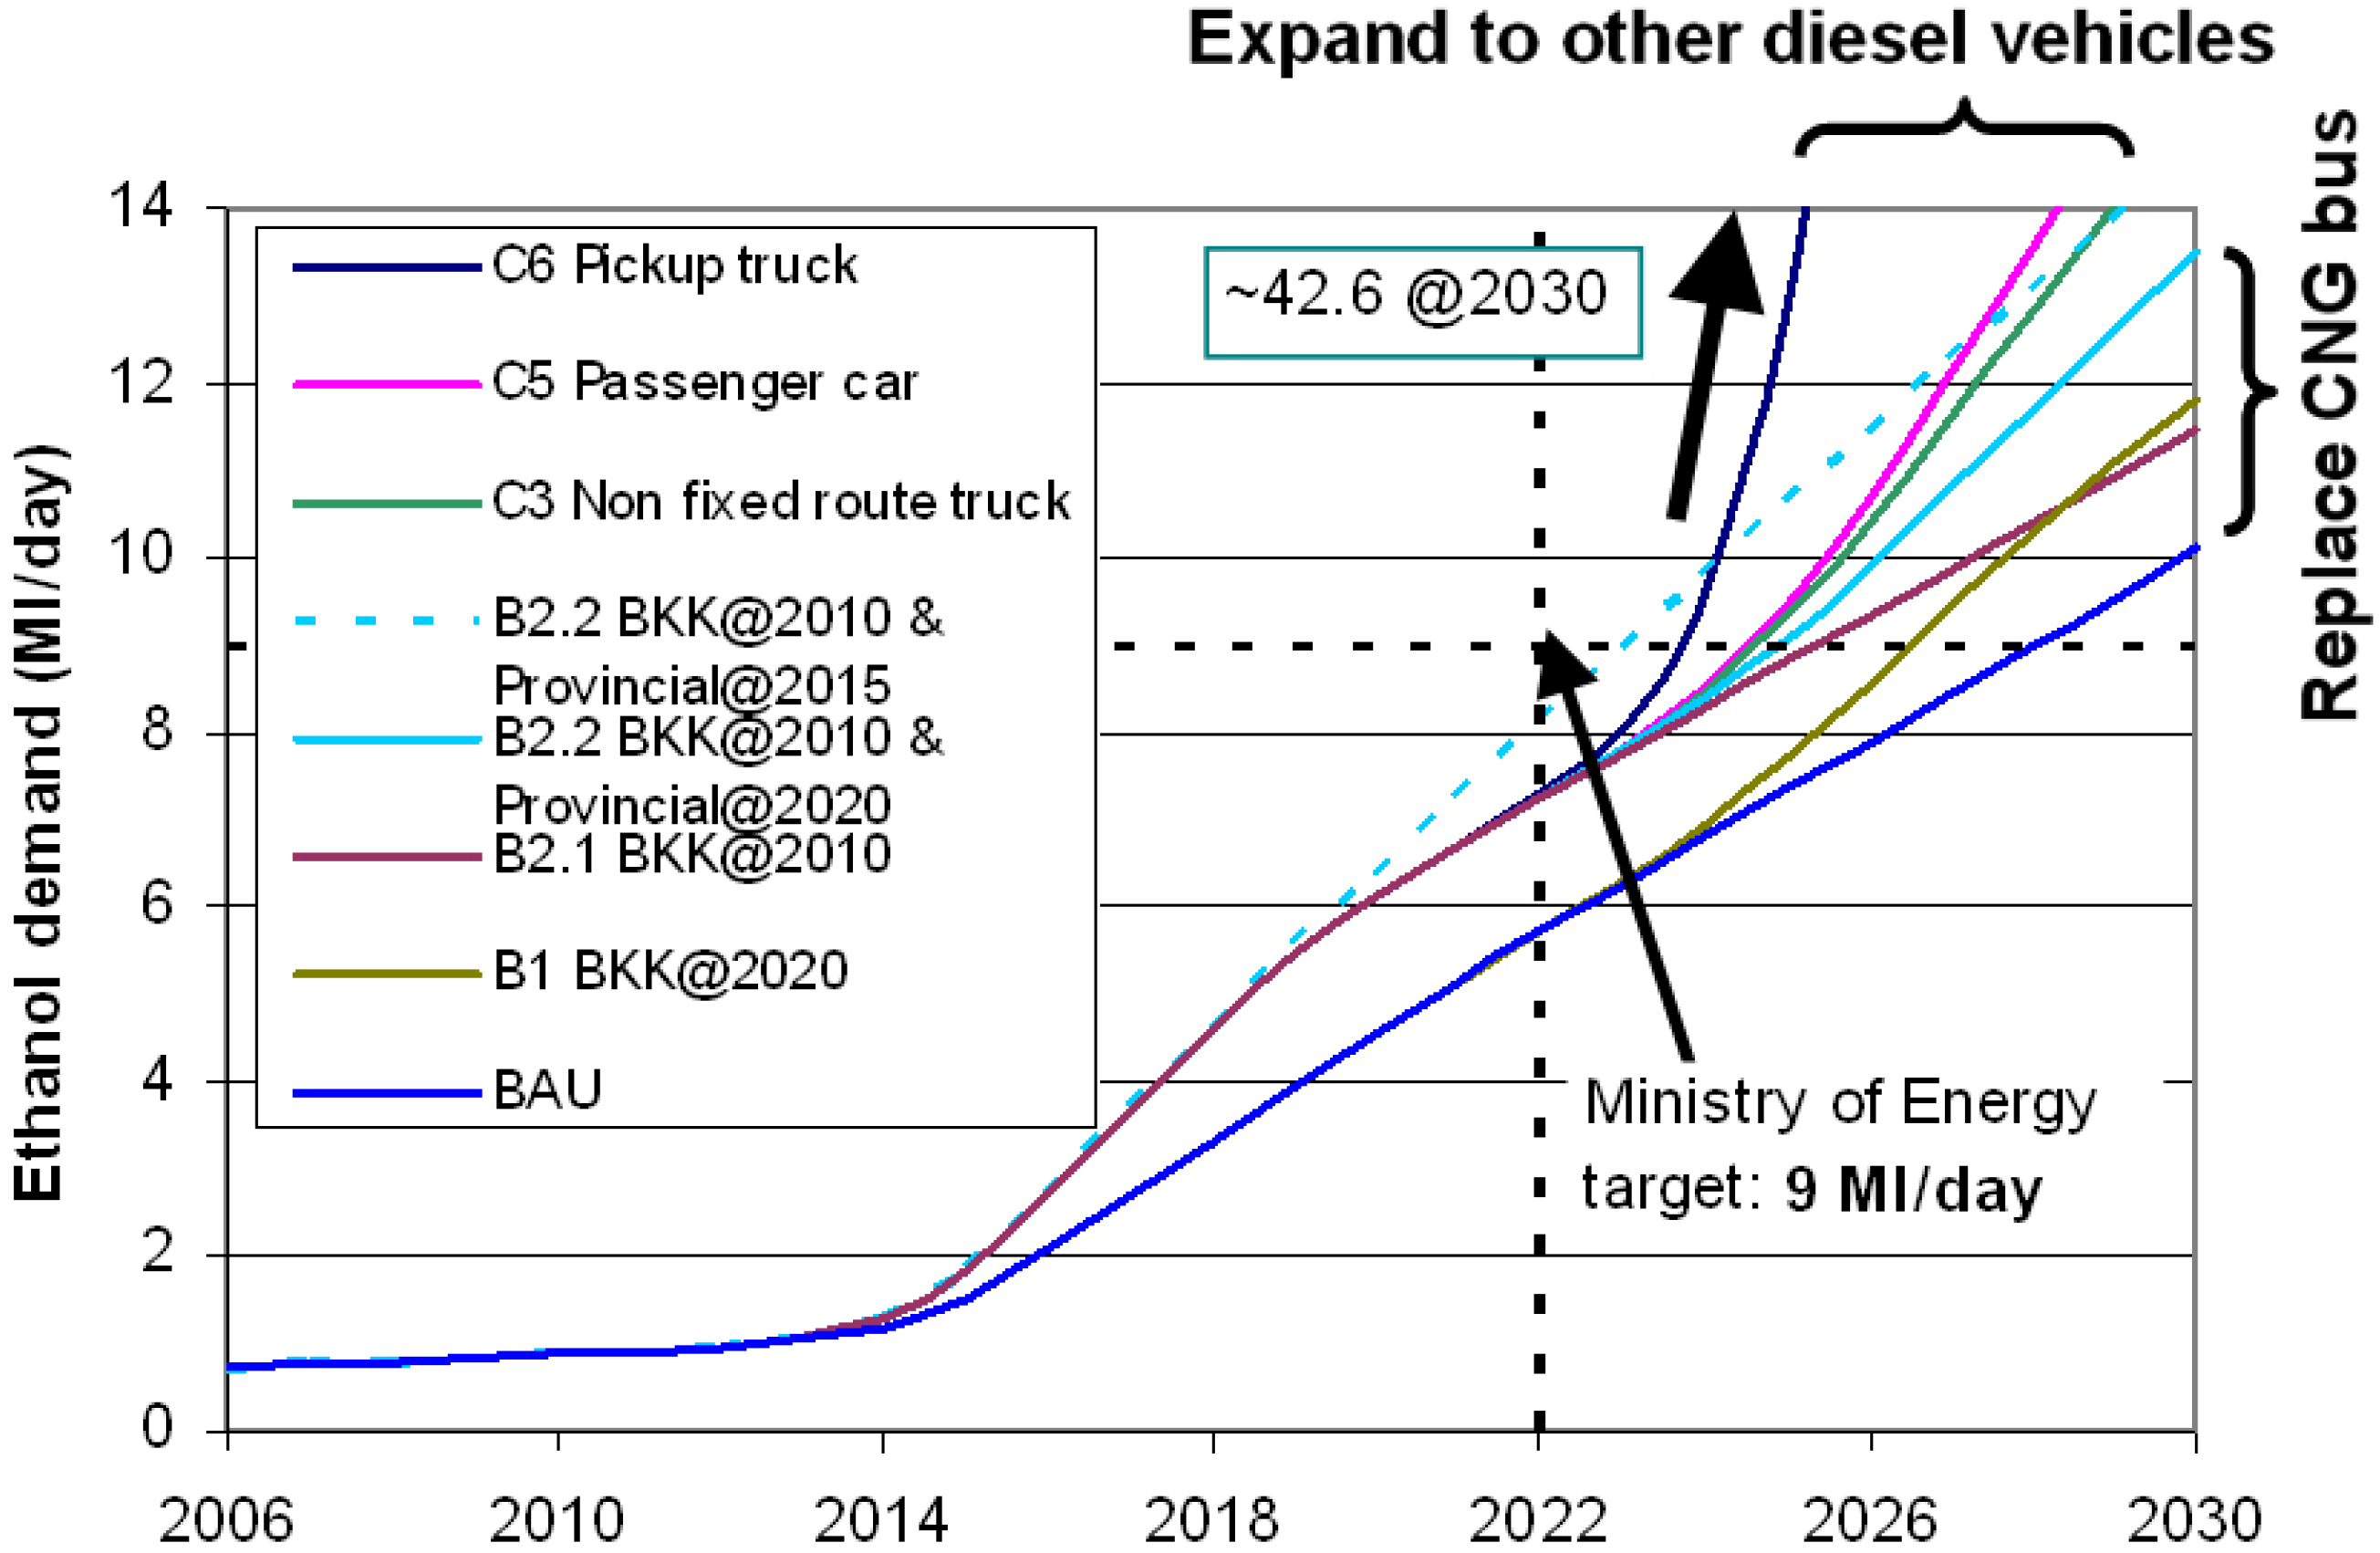
4. Results and Discussion

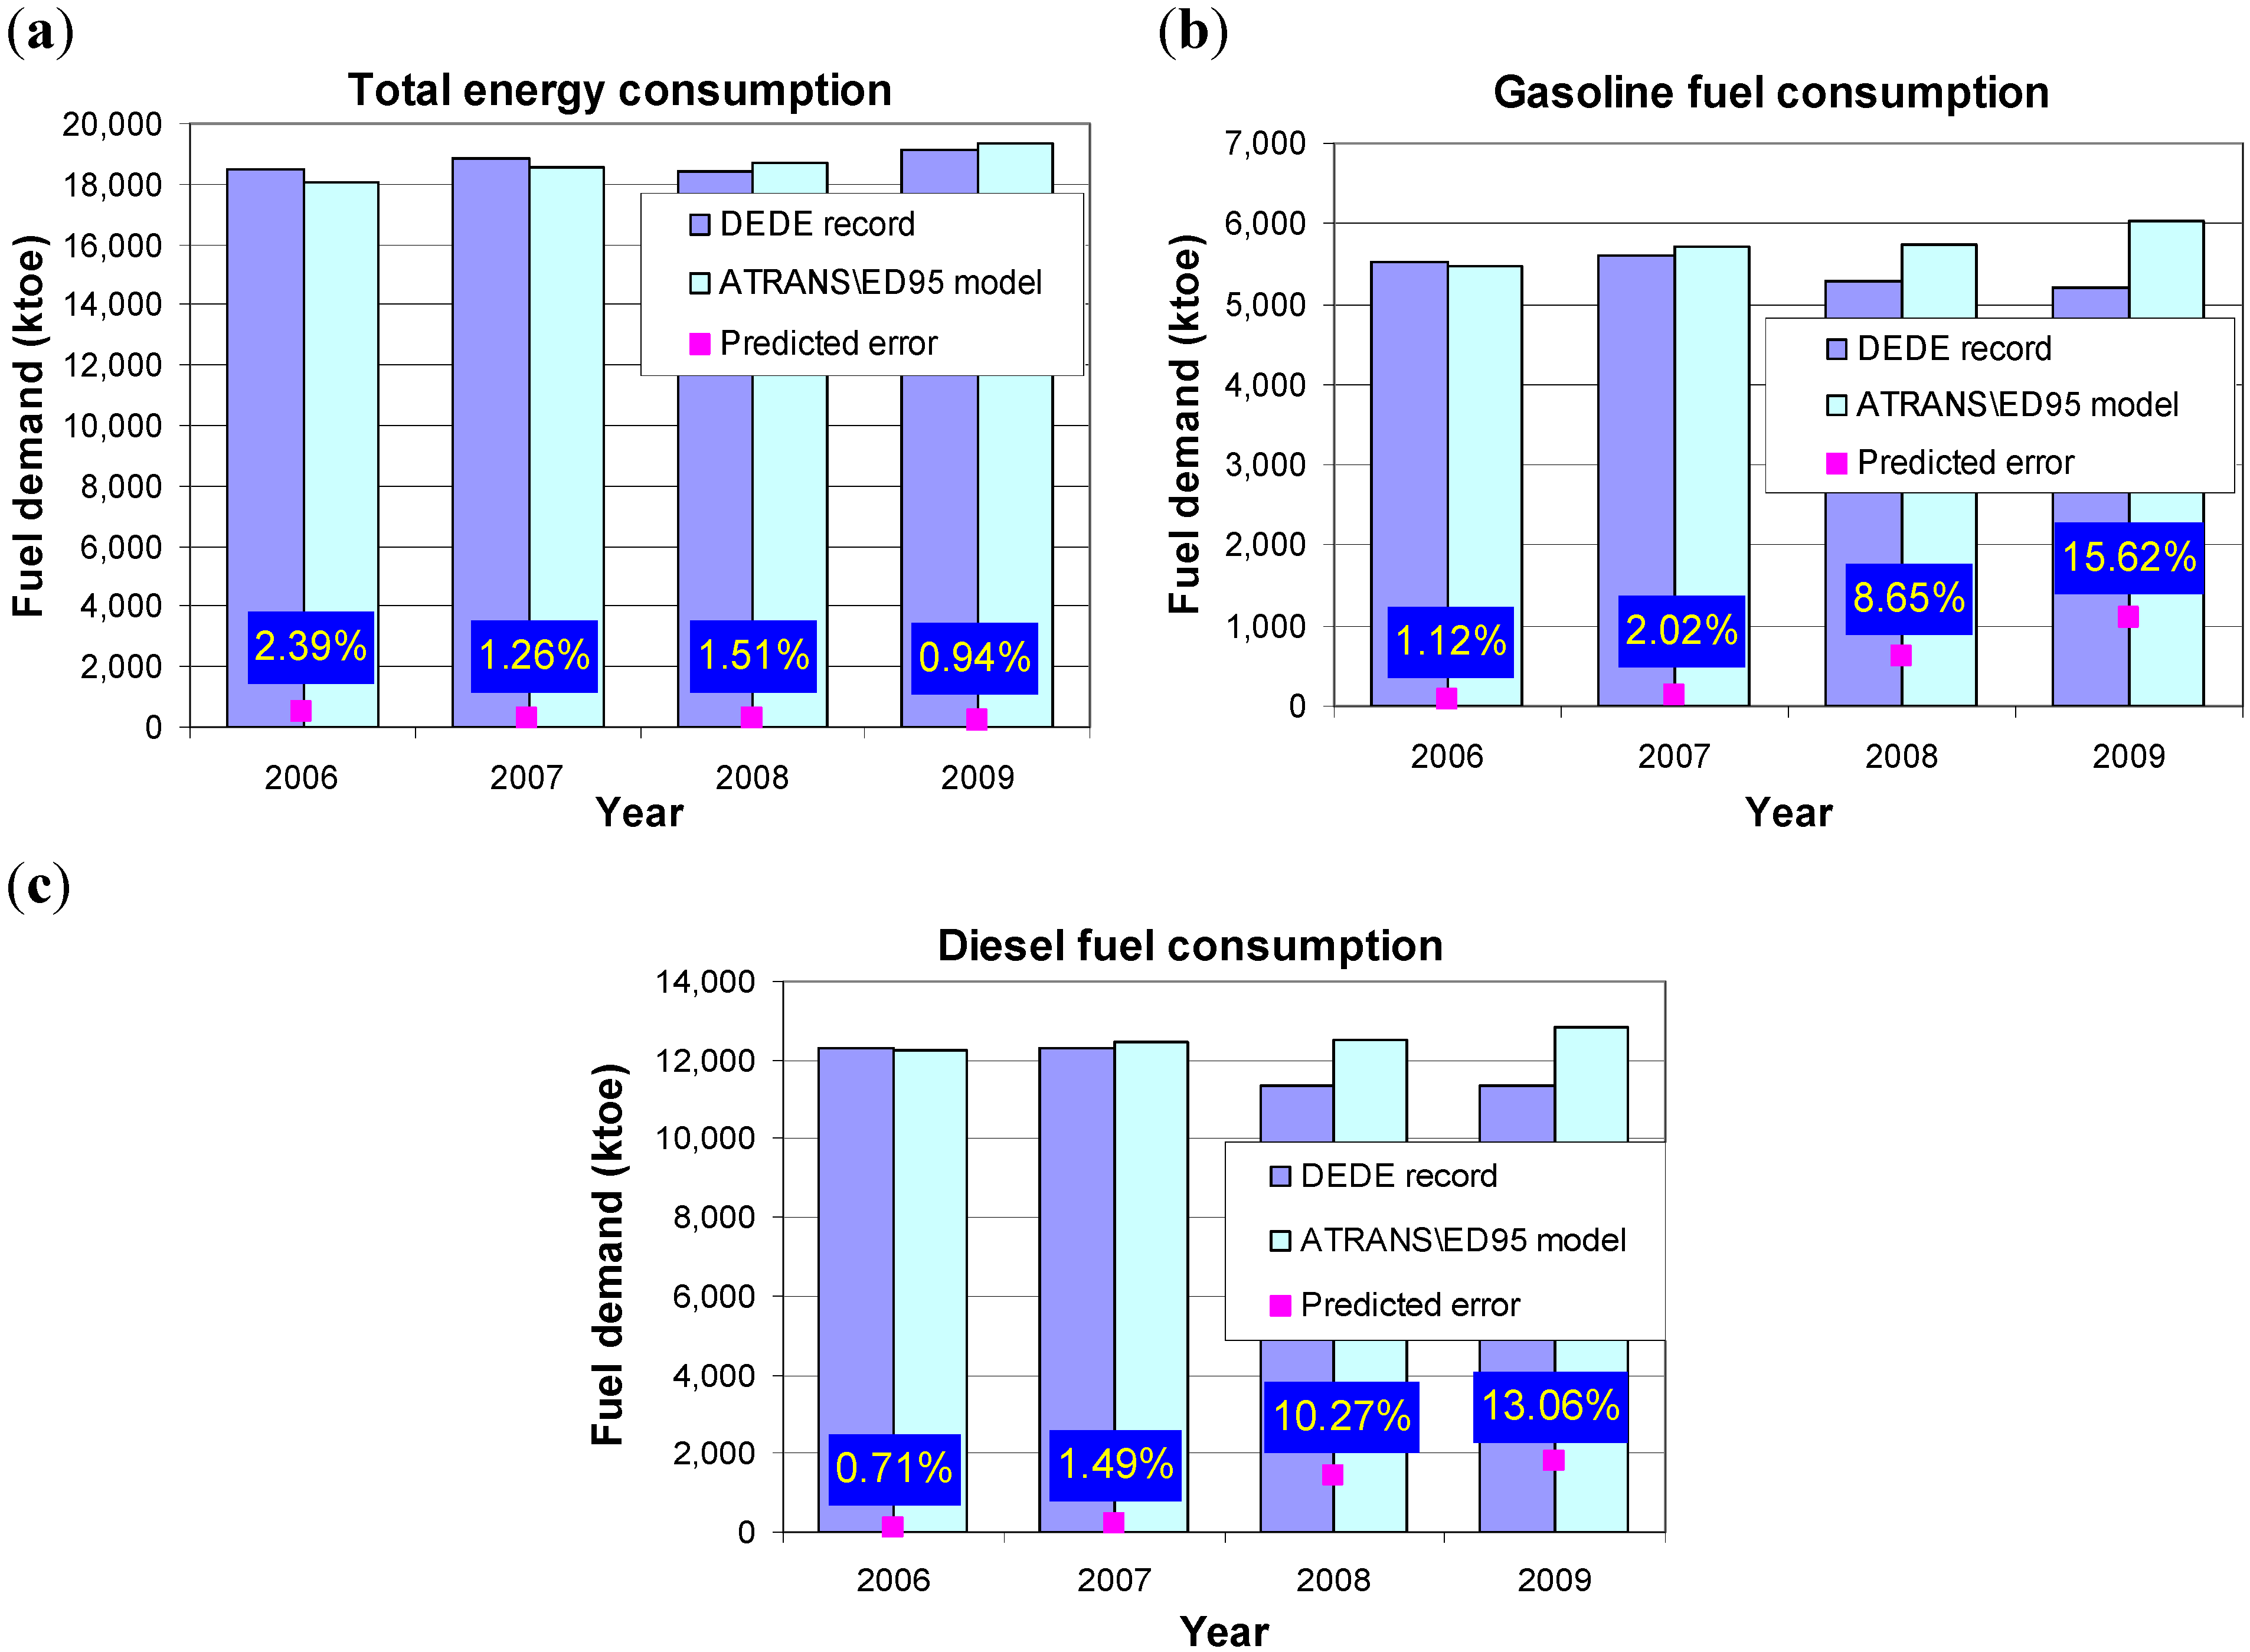
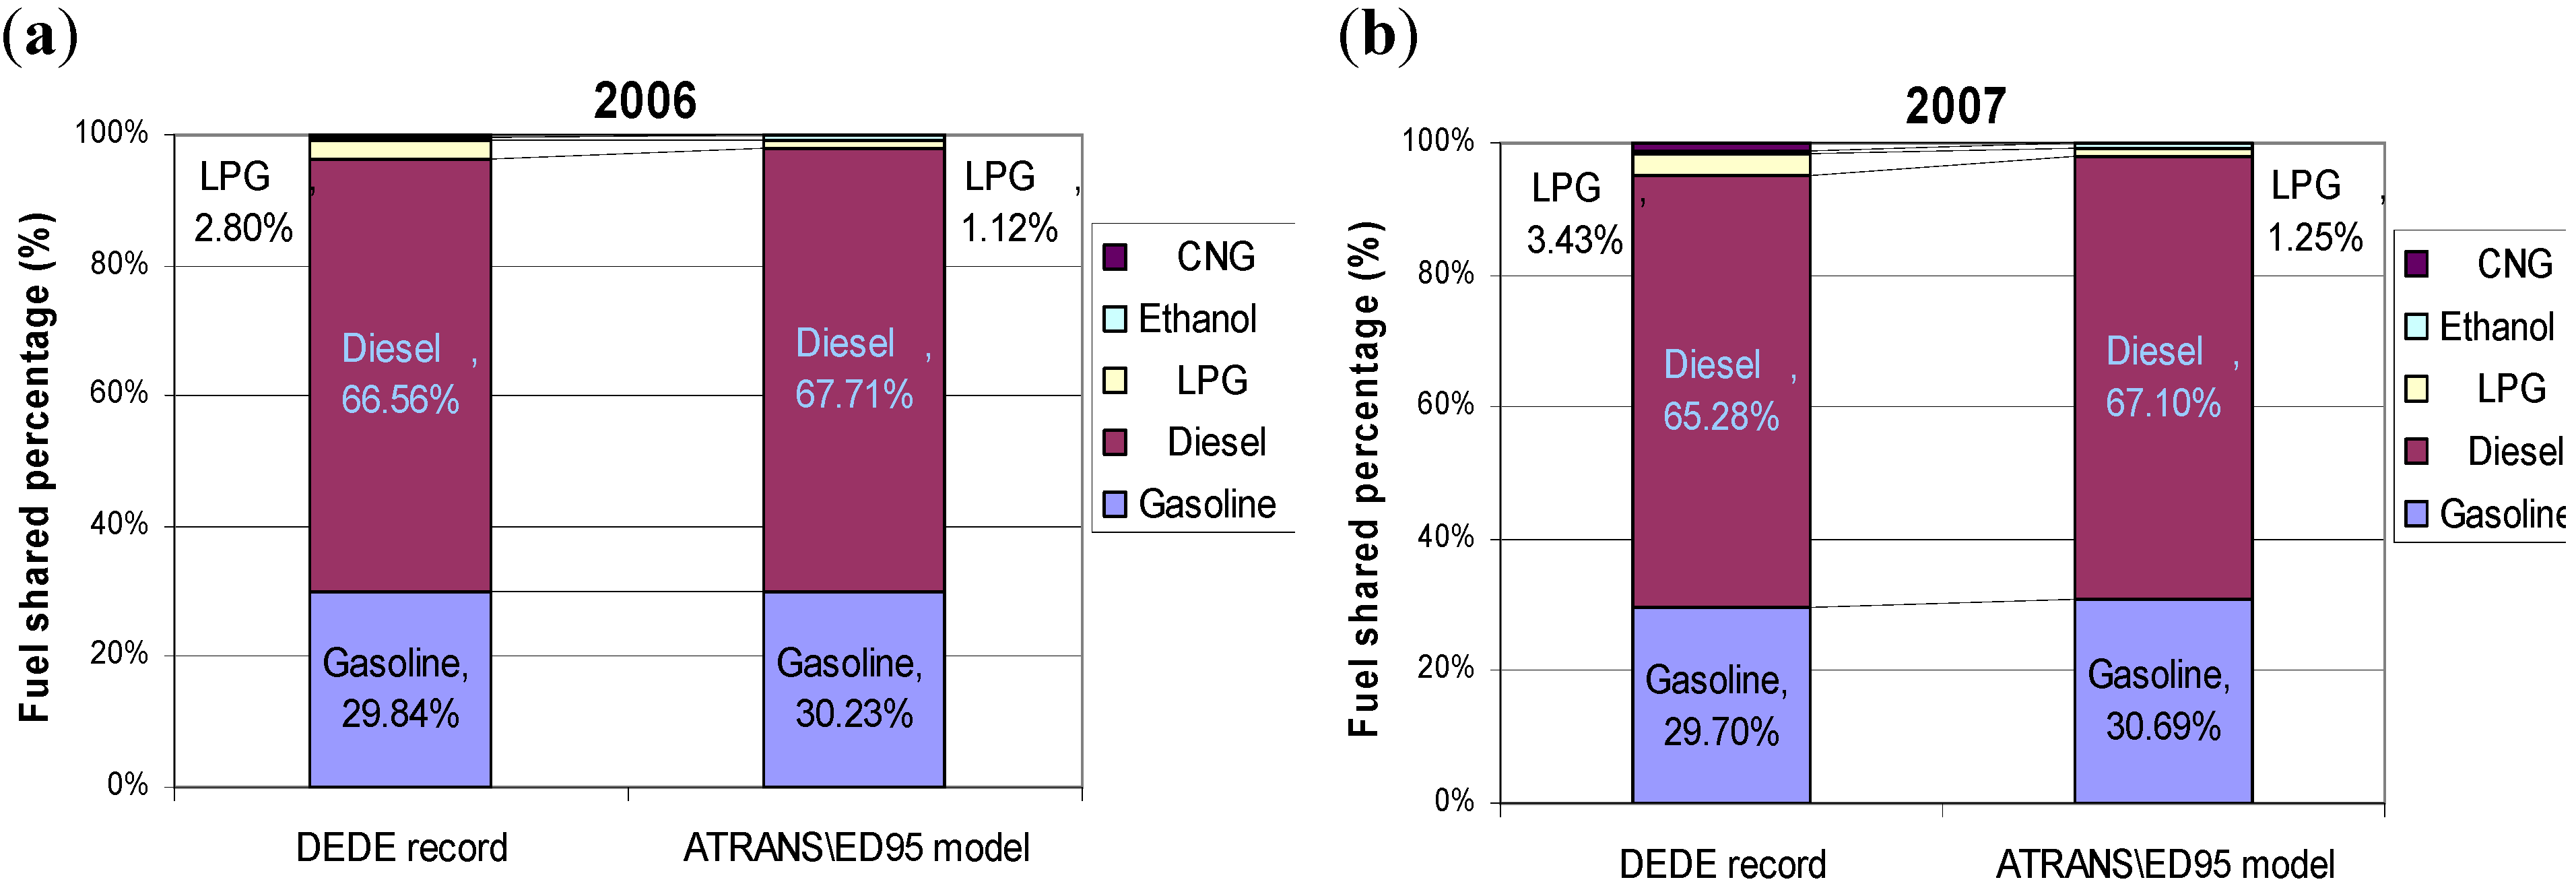
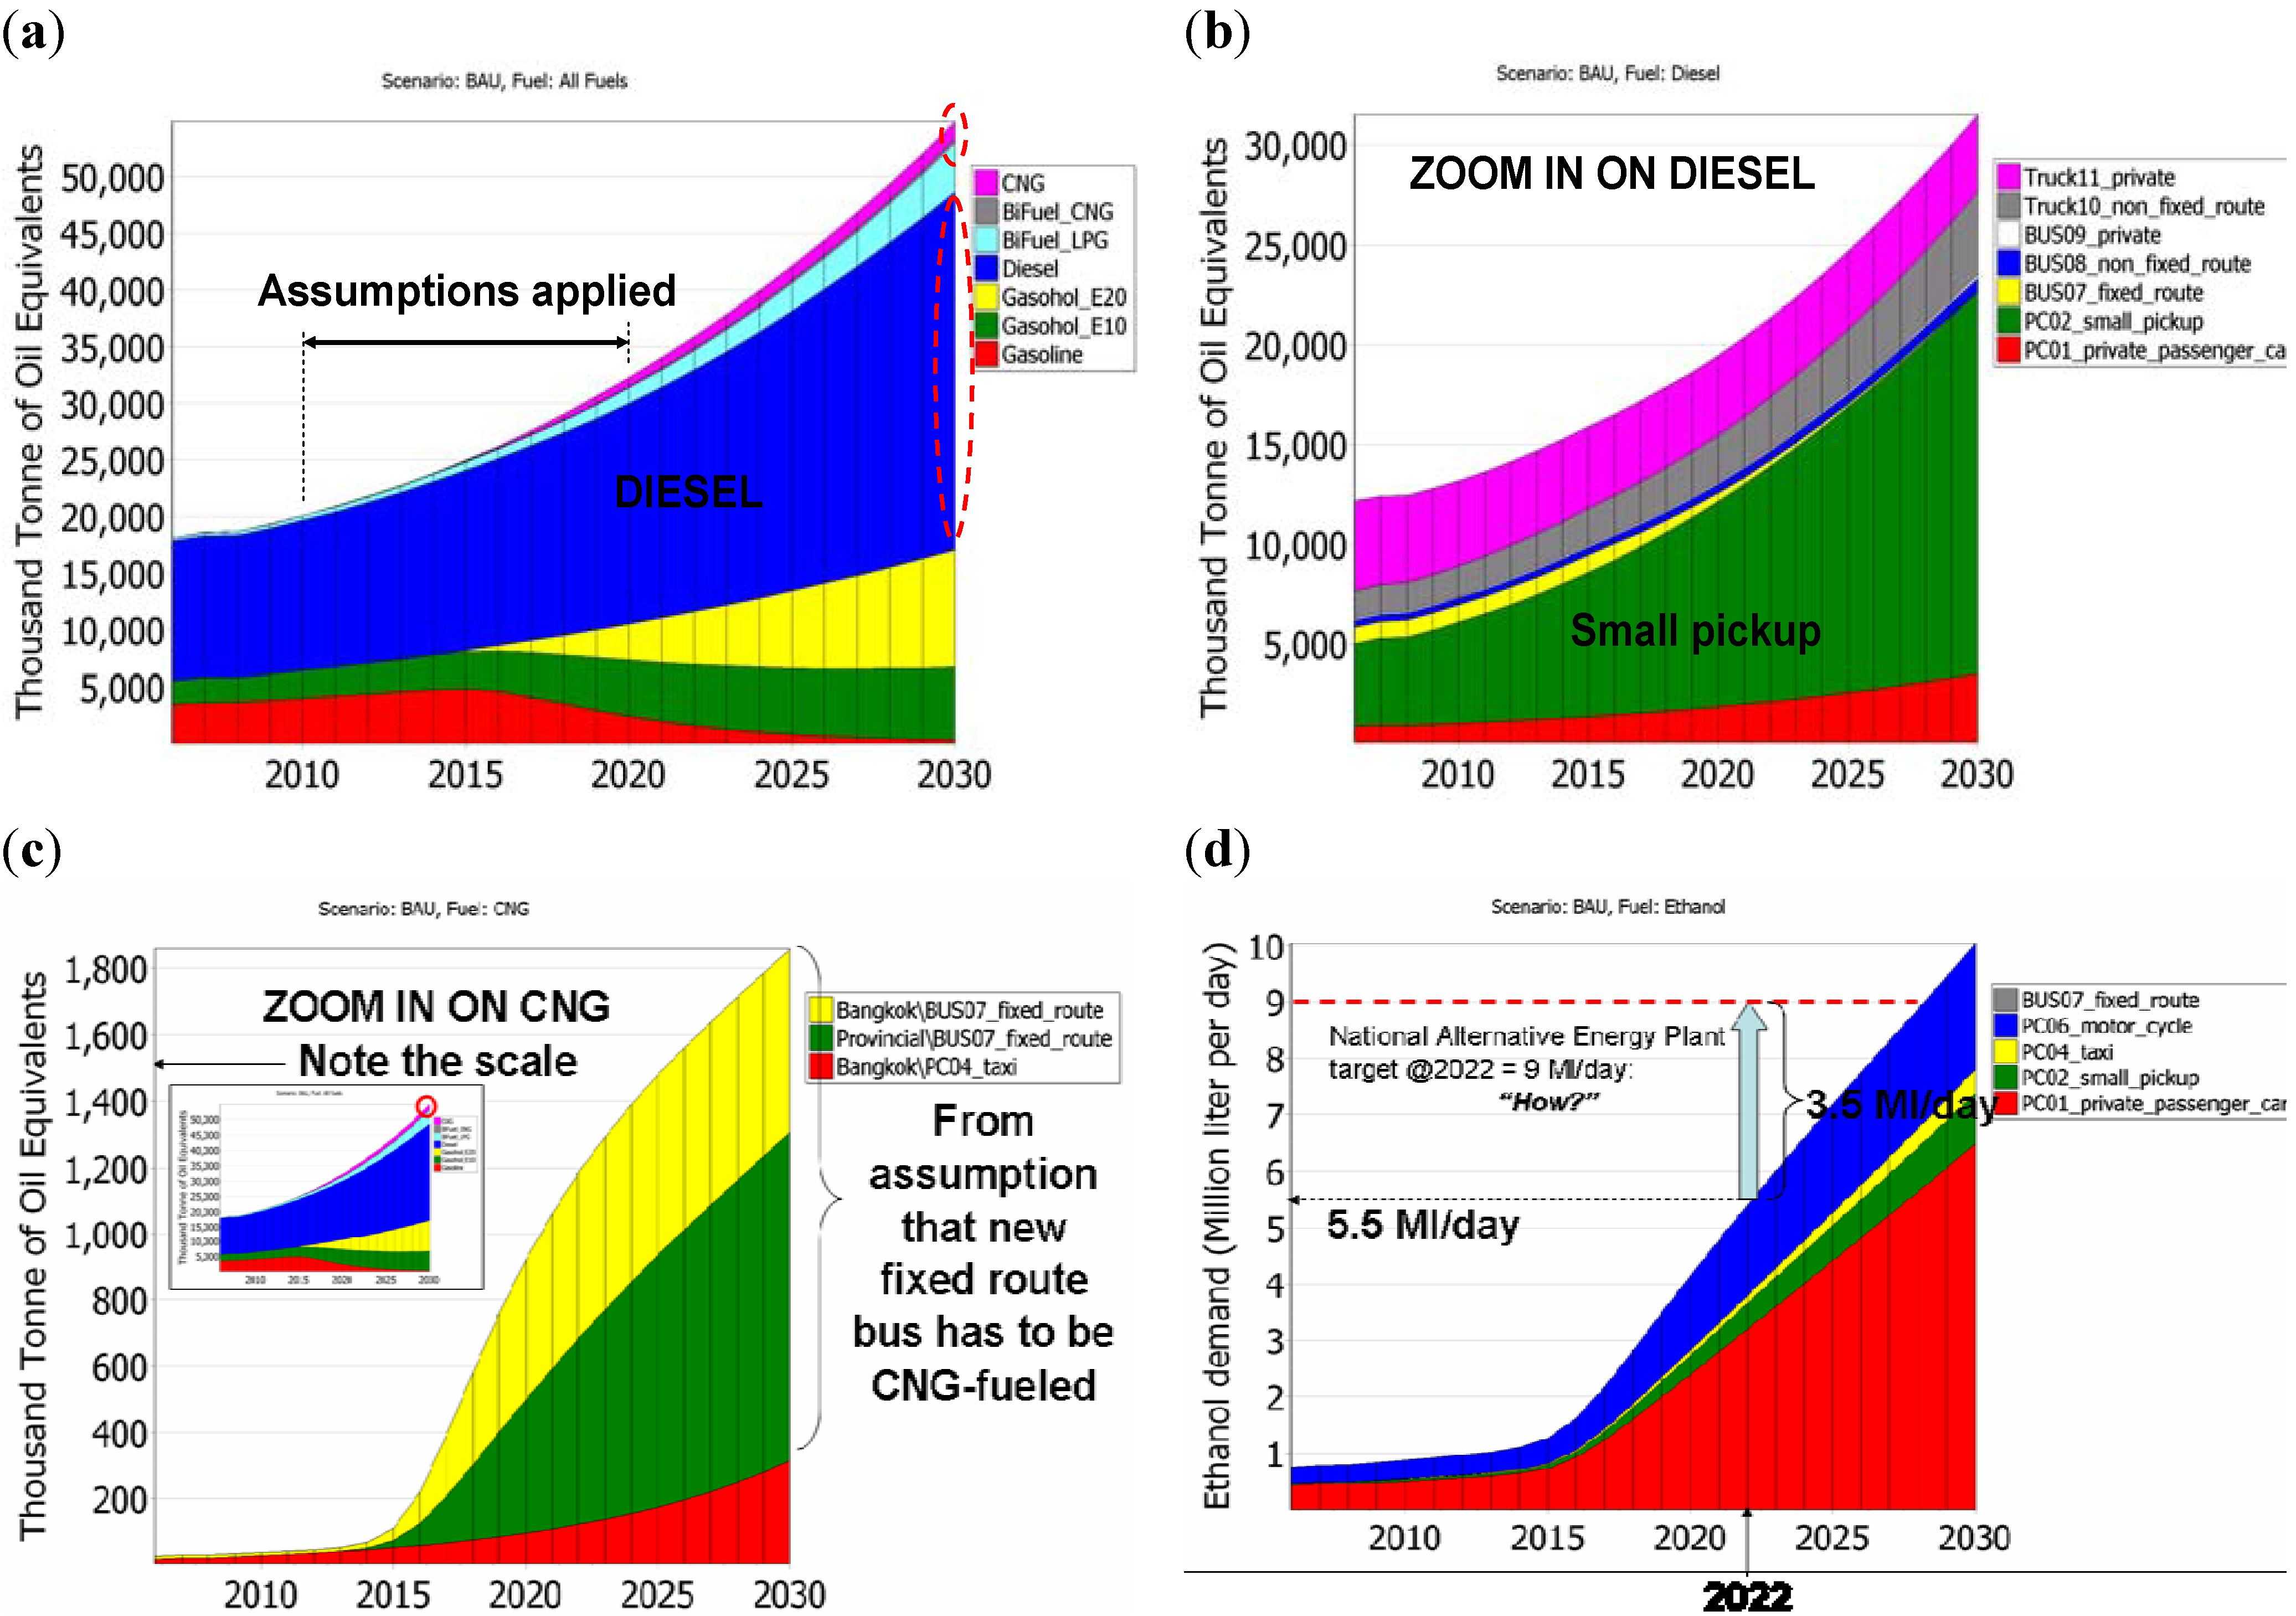
4.1. Business-As-Usual (BAU)

Figure 7a shows the predicted BAU demand of various fuels in the Thai transportation sector during 2010–2030. Clearly, the BAU assumptions in Table 6 applied during 2010–2020 have resulted in a switch from gasoline to E10 (new motorcycles), a switch from E10 to E20 (new passenger cars), and an increase of CNG from new NGV buses. As expected, diesel is still shown as a dominating fuel until 2030. With a zoom in on diesel, Figure 7b shows that small pick-up trucks are still predicted to be a dominating sector for diesel consumption while diesel consumption in fixed route buses decreases due to the BAU assumption of new NGV buses. With a zoom in on CNG, Figure 7c shows a sharp increase in a fixed route bus sector, from both Bangkok and provincial regions. As for ethanol demand, Figure 7d shows that without any ethanol promotion policy, ethanol demand by 2022 will only reach 5.5 ML/day, still short by 3.5 ML/day for the 9 ML/day target in the Thailand Alternative Energy Strategic Plan shown in Figure 2.

4.2. Scenarios Analyses

All nine cases shown in Table 6 were analyzed to assess the effectiveness of ED95 fuel utilization, both as NGV and diesel substitutes. For instance, case B2.1 has the modified assumption from BAU that new fixed route buses in Bangkok will be ED95 buses instead of NGV buses for the period of 2010–2020. Figure 8a clearly shows that the replacement of new NGV buses by ED95 buses in the Bangkok fixed route bus sector alone could only increase ethanol demand by 1.5 ML/day by 2022, still 2 ML/day short of the 9 ML/day target.
Figure 7. (a) Energy demand prediction (BAU) during 2010–2030 by fuel type with a zoom in on (b) diesel, (c) CNG and (d) ethanol.
Energies 04 00108 g007
Figure 8. Results from the case B2.1: (a) ethanol demand projection, and (b) GHG emission reduction.
Energies 04 00108 g008
With further analysis on the potential benefit of using ED95 on environment aspects, the GHG emissions are calculated according to the Intergovernmental Panel on Climate Change (IPCC) methodology, which is included in the technology environmental database in LEAP system [23]. The renewable biofuel is treated as carbon-neutral emission while fossil CNG is considered only on the gaseous combustion. For detailed GHG emission analyses of various biofuel pathways, readers are referred elsewhere [24]. The emissions considered here are the exhaust of mobile combustion: CO2, CH4 and N2O. Equation 2 shows the simplified calculation method, while Table 7 shows the emission factor (EF) and the global warming potential (GWP) of the CNG fuel consumed. Figure 8b clearly shows that up to 500 KTOE of CNG could be reduced with the reduction in GHG emission of 30 kTon of CO2,eq per year.
Energies 04 00108 i001
Table 7. GHG calculation parameters of CNG fuel.
CNG FuelCO2CH4N2O
EF (kg/TJ)55.5500.1
GWP (gCO2/g)125289
With a target of 9 ML/day ethanol utilization set in Thailand’s Alternative Energy Strategic Plan shown in Figure 2, Figure 9 shows ethanol demand prediction from selected cases of scenario analyses from Table 6. Without any policy push, the BAU case predicted that 9 ML/day target could be reached in 2028, six years delay from the target year 2022. With various degrees of ethanol promotion policy, the 9 ML/day target could be reached sooner. With an assumption that new fixed route NGV buses in Bangkok be replaced by ED95 buses starting from 2020 onward (case B1), an increase in ethanol demand is too slow (after 2024). Hence, policy implementation on ED95 technology should start from 2010, as in cases B2.1 and B2.2. With fixed route NGV buses replaced by ED95 buses both in Bangkok (after 2010) and provincial regions (after 2020, due to technology penetration lag), such as in case B2.2, the 9 ML/day target could be reached by 2025. Hence, it is inevitably suggested that ED95 fuel should be also considered for usage in other vehicle types currently powered with diesel.
Figure 9. Ethanol demand prediction from selected cases.
Energies 04 00108 g009
With expansion of ED95 fuel to replace diesel consumption in other vehicle types, it is not surprising that targeting pick-up trucks (case C6) is the most effective to reach 9 ML/day target by 2024. However, as the ED95 technology is not yet commercially available for vehicles other than buses, the case C6 may not be probable. Another more sounding assumption is to shift the implementation period of fixed route buses in provincial regions from 2020 to 2015 with lessons learned from the Bangkok case starting in 2010. The dotted line in Figure 9 shows that a 9 ML/day target can be reached by 2023.

5. Conclusions

The future energy consumption in the Thai transportation sector could be estimated by a mathematical model, which was developed in this work via the LEAP model and methodology. It must be noted that the predicted results may deviate from the actual energy consumption, which is affected by externalities such as sudden fuel price and consumer behaviors. Nevertheless, the predicted results can illustrate the energy demand trend with comparative capability to assess the impact of any policy push or new technology penetration. Within the scope of the present study, ethanol bus (ED95) technology was analyzed with the following results:
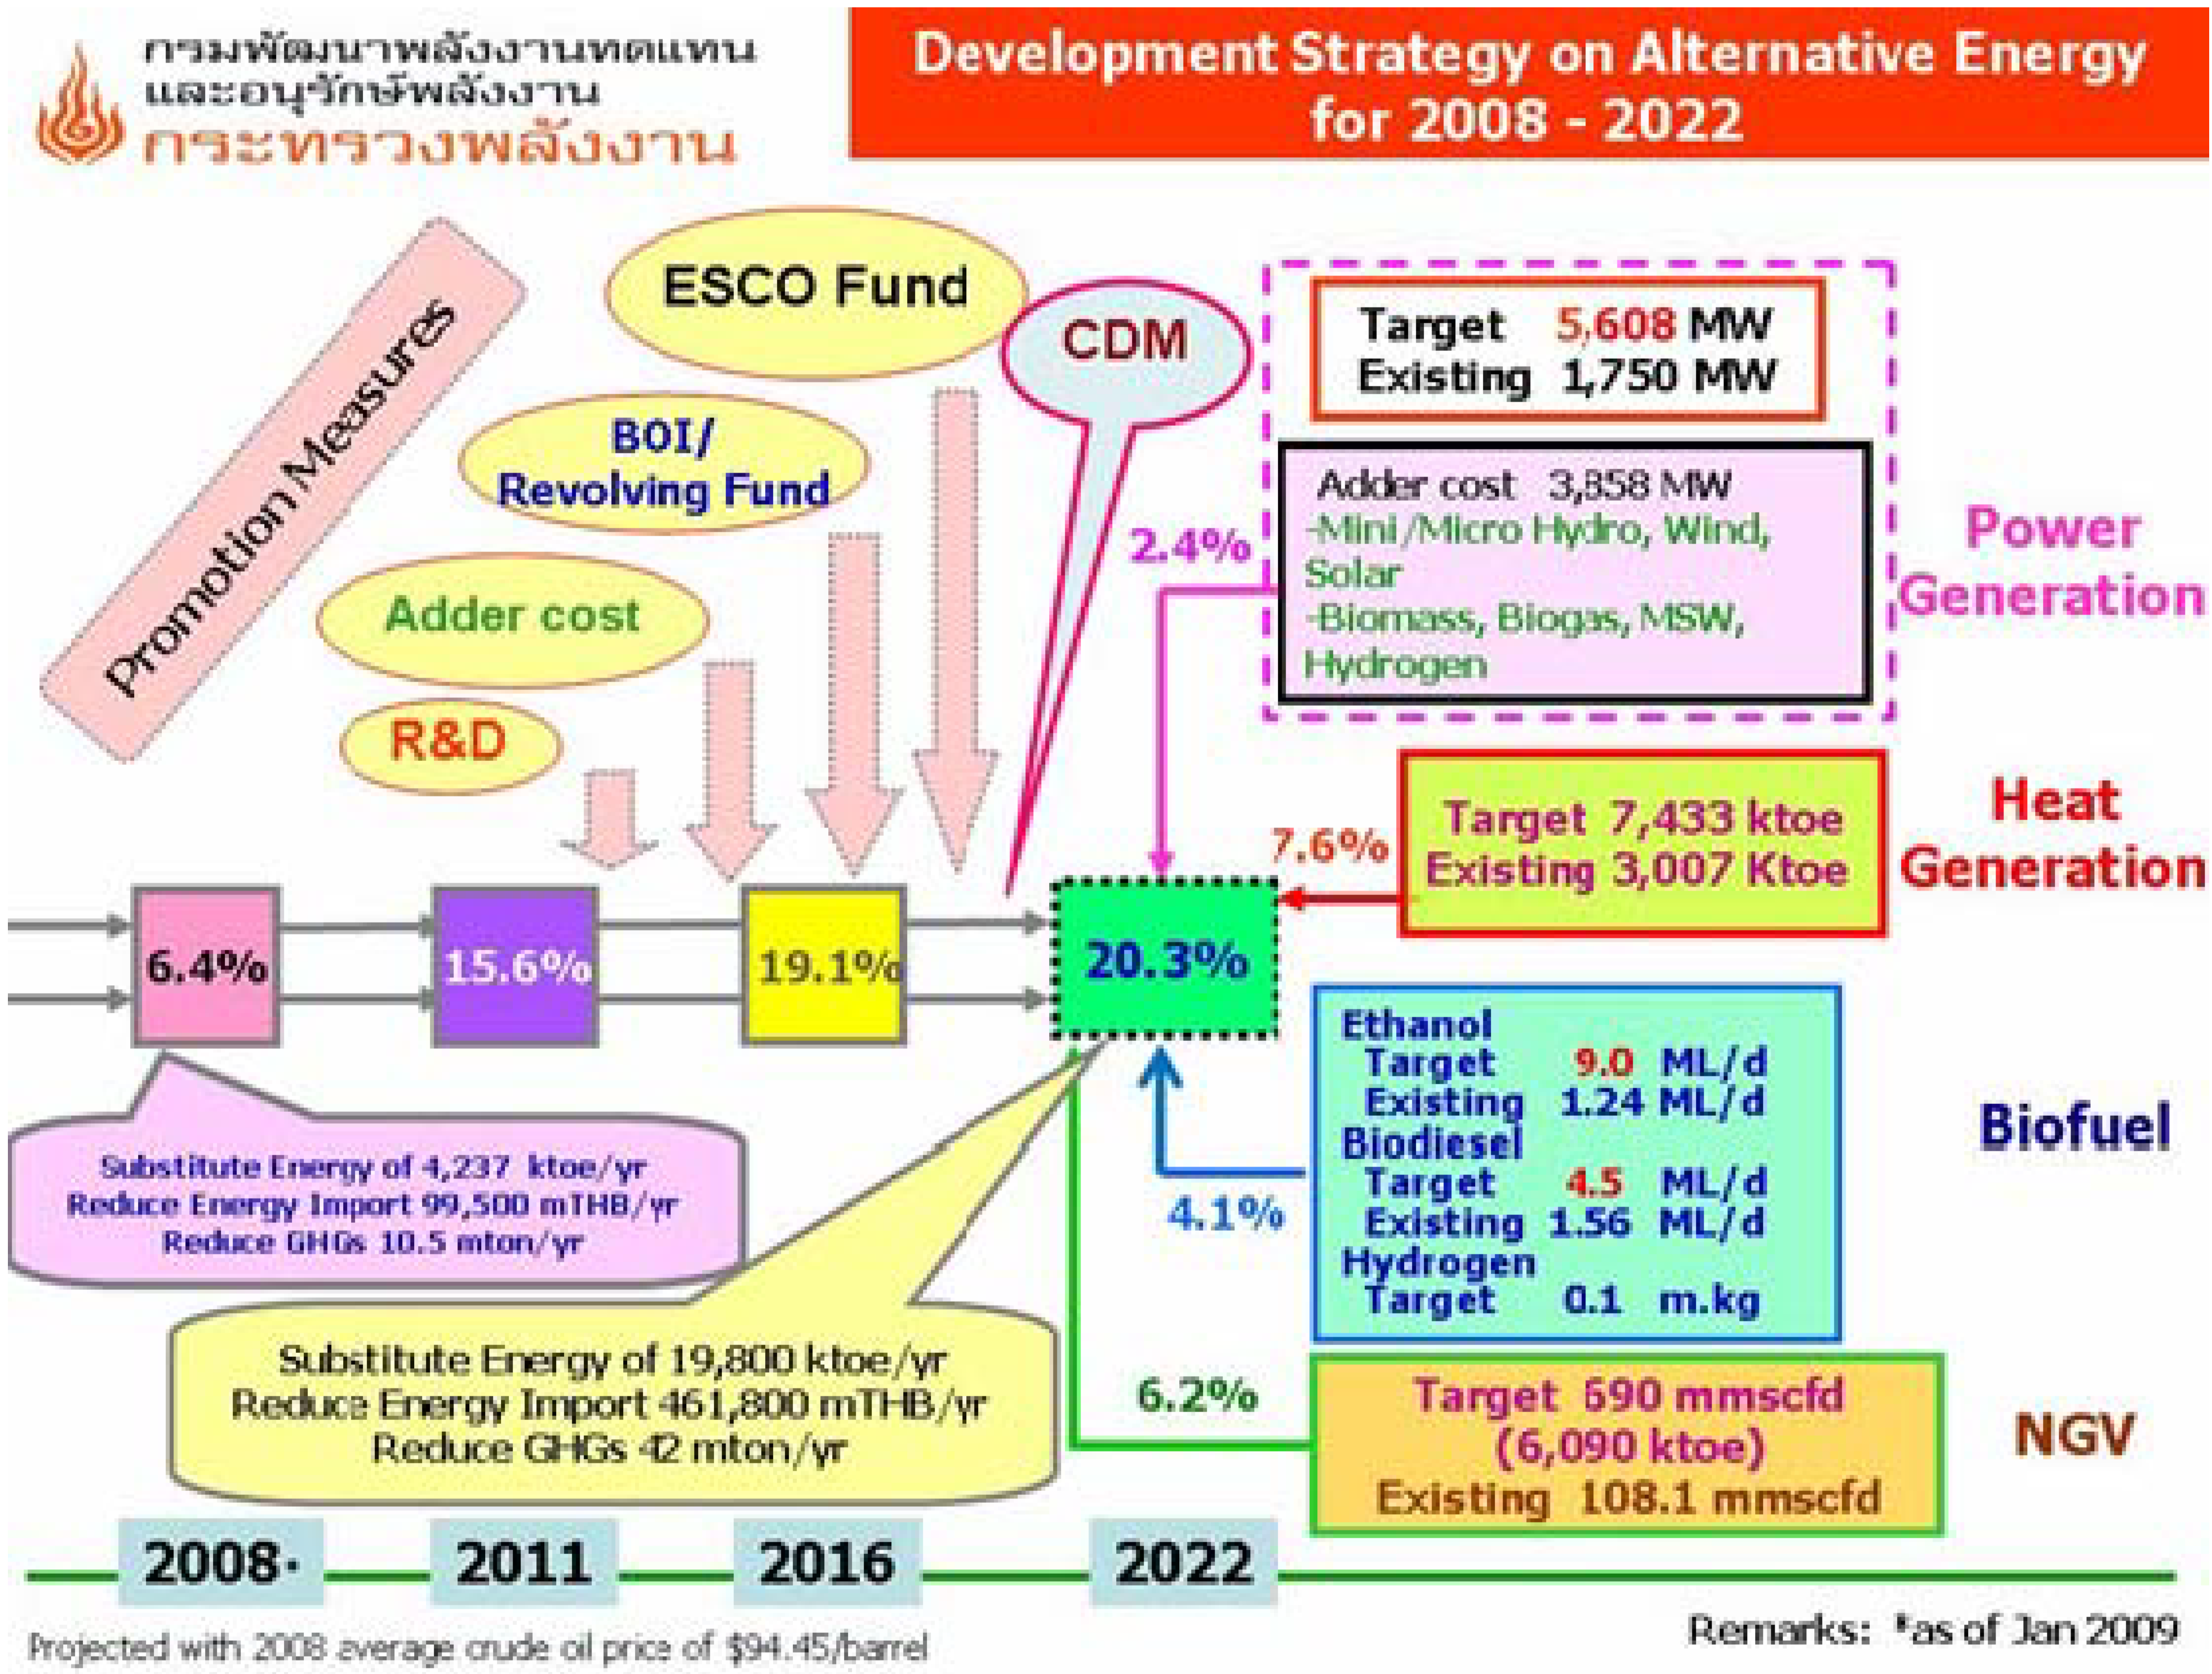
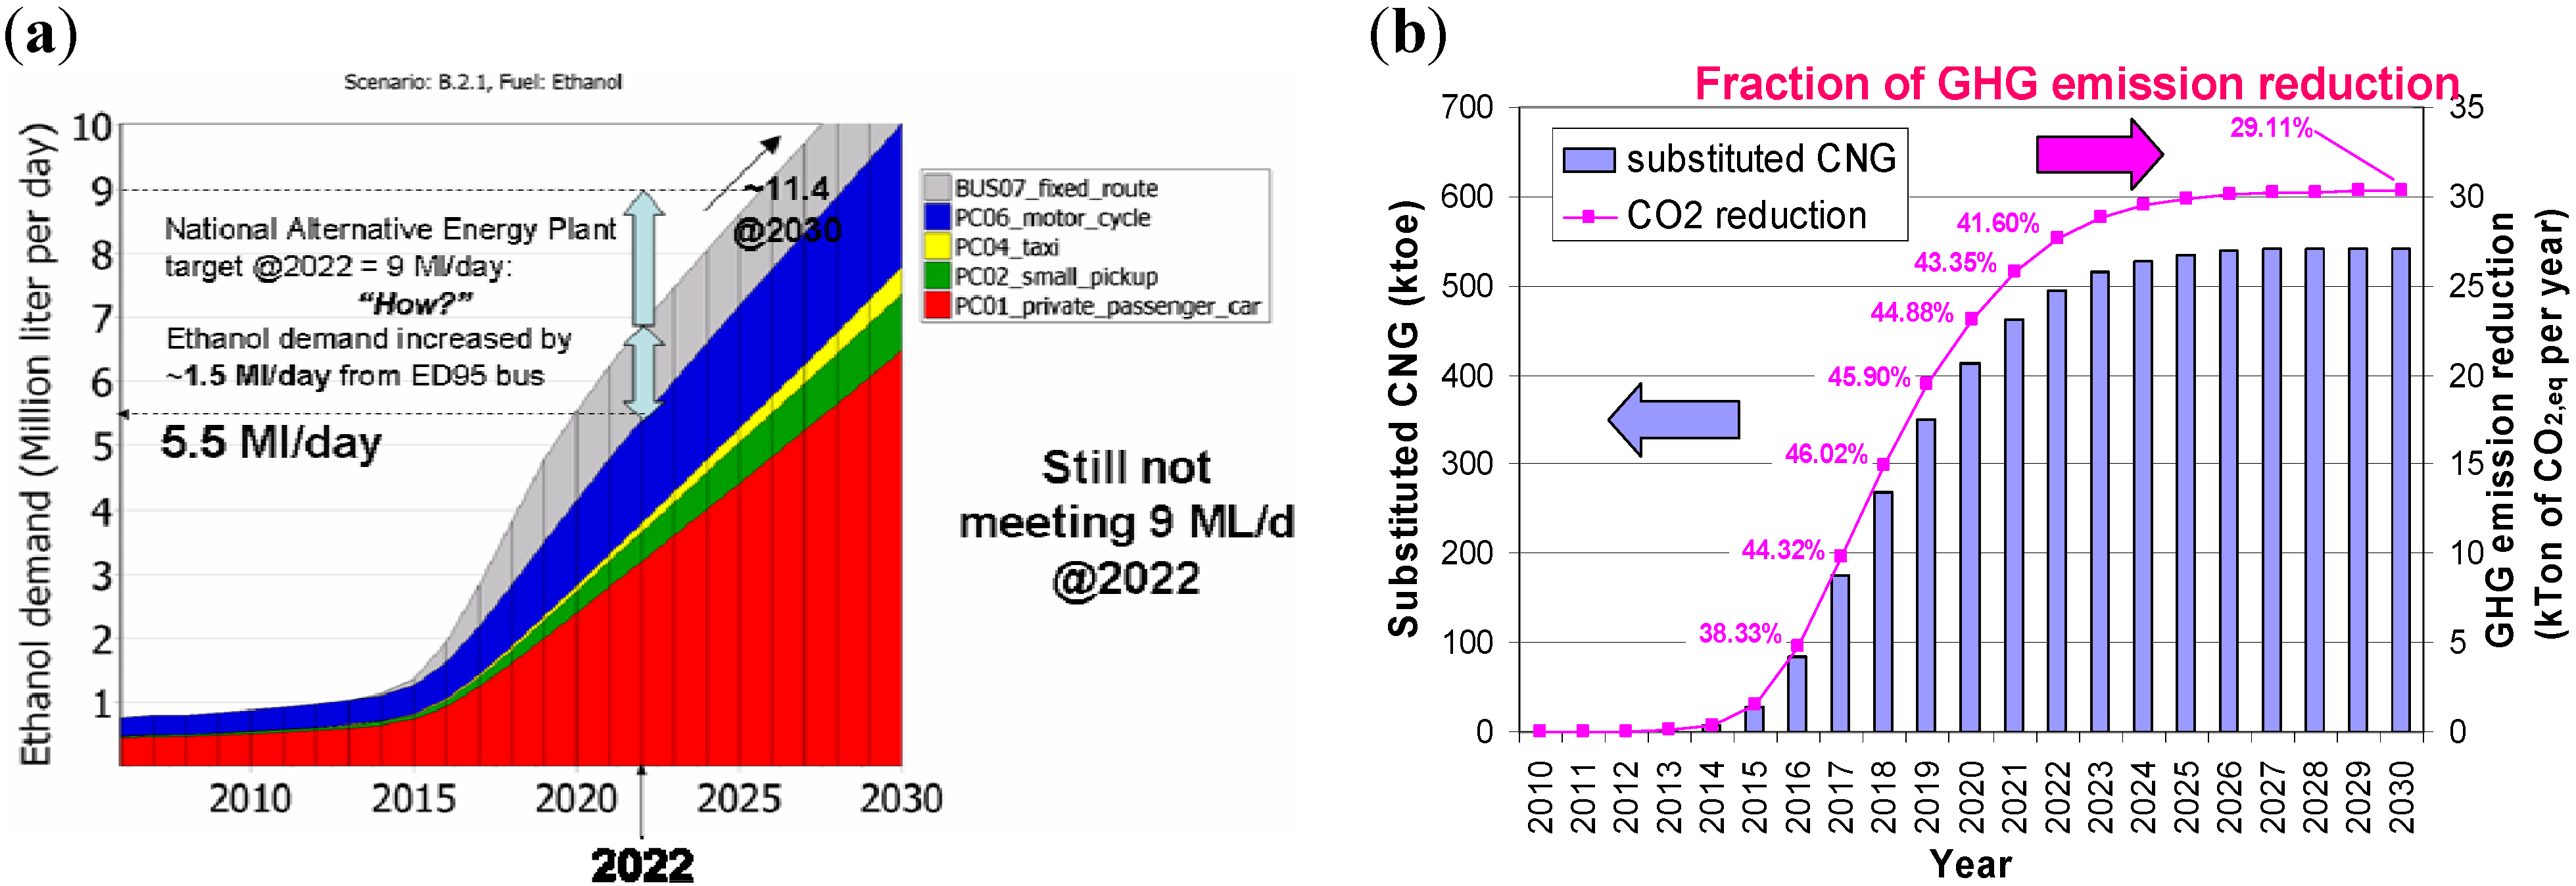
ED95 technology offers another mechanism to increase ethanol demand as projected by the Thailand Alternative Energy Strategic Plan (9 ML/day target in 2022).
ED95 buses should be introduced into fixed route buses in Bangkok from 2010 and later in provincial region from 2015 for most probable and effective promotion of ethanol utilization.
ED95 can be employed to decrease fossil fuel consumption and increase nation energy security from domestic renewable energy resources such as ethanol. Furthermore, greenhouse gas emissions could be reduced by switching from NGV to ED95 fuel technology.
However, further studies on the financial aspect, as well as infrastructure investment, should be considered for final assessment of the policy recommendation.

Acknowledgements

The authors would like to acknowledge financial support from Asian Transportation Research Society (ATRANS), Research Project A-09/003 (www.atransociety.com), as well as useful discussions with Jakapong Pongthanaisawan, Yossapong Laoonual, Sittha Sukkasi and Subongkoj Topaiboul.

List of Symbols and Abbreviations

B5
Biodiesel-blended (5% v/v) diesel
BAU
Business-as-usual
BKK
Bangkok
BOI
Board of Investment
CDM
Clean Development Mechanism
CI
Compression-Ignition
CNG
Compressed Natural Gas
DDF
Diesel Dual Fuel
DEDE
Department of Alternative Energy Development and Efficiency
DLT
Department of Land Transport
DS
Device share
E10
Ethanol-blended (10% v/v) gasoline
E20
Ethanol-blended (20% v/v) gasoline
EC
Energy Consumption (TJ)
ED95
A fuel mixture comprised of 95% ethanol and 5% additive
EDij
Energy demand of fuel type “i” from vehicle type “j” (L/year)
EFi
Emission factor of emission i (kg/TJ)
EM
Emission (kg CO2 equivalence)
ESCO
Energy service company
FEij
Fuel economy of registered vehicle type “j” that uses fuel type “i” (L/km)
GDP
Gross Domestic Product
GDPpCap
GDP per capita (Baht)
GHGs
Greenhouse gases
GWPi
Global warming potential of emission i (g CO2/g emission i)
i
Fuel type; emission type, (CO2, CH4, N2O)
IPCC
Intergovernmental Panel on Climate Change
j
Vehicle type
ktoe
Kiloton of oil equivalent
LEAP
Long range Energy Alternatives Planning system
LPG
Liquefied Petroleum Gas
ML
Million liters
Mmscfd
Million standard cubic feet per day
MSW
Municipal Solid Waste
MV
Motor Vehicle type
MW
Mega Watt
NGV
Natural Gas for Vehicle
NVij
Number of registered vehicle type “j” that uses fuel type “i” (number of vehicle)
PC
Passenger Car
Pop
Population (person)
R&D
Research and Development
sBus
Small rural bus
SI
Spark Ignition
τ
Reference year
THB
Thai baht currency
TJ
Tera (1012) joule
VKTj
Average distances traveled by vehicle type “j” in a year of interest (km/year)
VO
Vehicle Occupancy
yr
Year

References

  1. Thailand Energy Situation, 2008; Department of Alternative Energy, Development and Efficiency, Ministry of Energy: Thailand, 2008. Available online: http://www.dede.go.th/dede/fileadmin/upload/nov50/feb52/re1_pre_ener_2551.pdf (accessed on April 30, 2010).
  2. Transportation Statistics, 2008; Department of Land Transport, Ministry of Transport: Thailand, 2008. Available online: http://www.dlt.go.th/statistics_web/ statistics.html (accessed on April 30, 2010).
  3. Thailand Alternative Energy Strategic Plan for 2008–2022; Department of Alternative Energy, Development and Efficiency, Ministry of Energy: Thailand, 2010. Available online: http://www.dede.go.th (accessed on April 30, 2010).
  4. LEAP 2010; Homepage of the Stockholm Environment Institute. Available online: http://www.energycommunity.org/ (accessed on April 30, 2010).
  5. Pongthanaisawan, J.; Sorapipatana, C.; Limmeechokchai, B. Road Transport Energy Demand Analysis and Energy Saving Potentials in Thailand. Asian J. Energy Environ. 2007, 8, 49–72. [Google Scholar]
  6. Tanatvanit, S.; Limmeechokchai, B.; Chungpaibulpatana, S. Sustainable energy development strategies: implications of energy demand management and renewable energy in Thailand. Renew. Sustainable Energy Rev. 2003, 7, 367–395. [Google Scholar] [CrossRef]
  7. Limmeechokchai, B.; Chawana, S. Sustainable energy development strategies in the rural Thailand: The case of the improved cooking stove and the small biogas digester. Renew. Sustainable Energy Rev. 2007, 11, 818–837. [Google Scholar] [CrossRef]
  8. Shrestha, R.M.; Malla, S.; Liyanage, M.H. Scenario-based analyses of energy system development and its environmental implications in Thailand. Energy Policy 2007, 35, 3179–3193. [Google Scholar] [CrossRef]
  9. Santisirisomboon, J.; Limmeechokchai, B.; Chungpaibulpatana, S. An Assessment of Energy Efficiency Programs in Thai Commercial and Industrial Sectors. Energy Sources Part A 2000, 22, 825–836. [Google Scholar] [CrossRef]
  10. Phdungsilp, A. Integrated energy and carbon modeling with a decision support system: Policy scenarios for low-carbon city development in Bangkok. Energy Policy 2010, 38, 4808–4817. [Google Scholar] [CrossRef]
  11. Laoonual, Y.; Chindaprasert, N.; Pongthanaisawan, J.; Trinuruck, P. Assessment of E85 Promotion Policy in Transportation Energy Sector; Final Report submitted to Thailand Research Fund: Bangkok, Thailand, 2008. [Google Scholar]
  12. Pongthanaisawan, J.; Sorapipatana, C.; Limmeechokchai, B. Land Transport Demand Analysis and Energy Saving Potentials in Thailand. In Presented at Sustainable Energy and Environment Conference, Bangkok, Thailand, 2006.
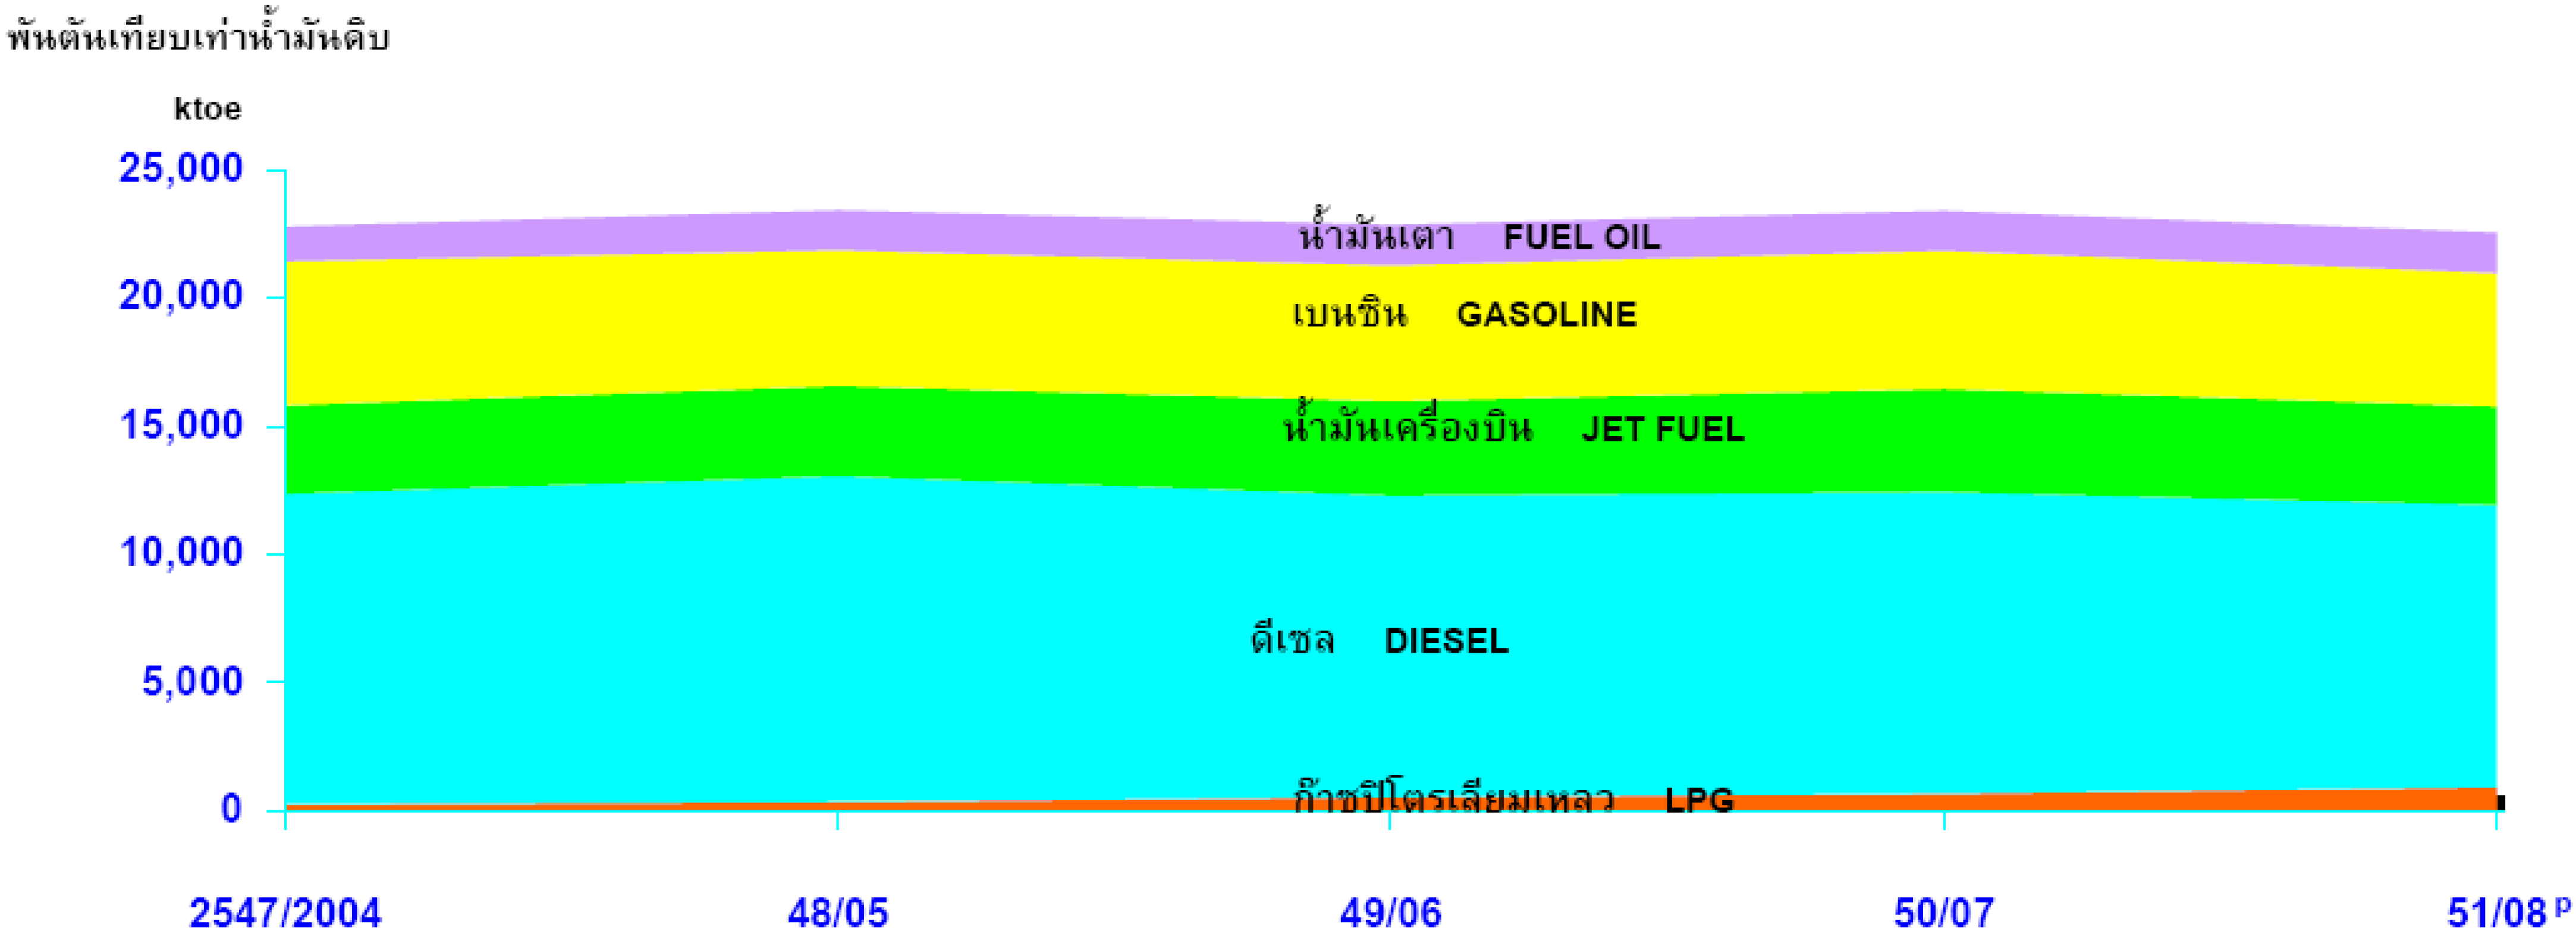
  13. Energy Situation and Management of Thailand 2004; Energy Policy and Planning Office, Ministry of Energy: Thailand, 2004. Available online: http://www.eppo.go.th/doc/report-2547/part-5.html (accessed on August 16, 2010).
  14. Fenton, P.; Carlsson, H. BioEthanol for Sustainable Transport (BEST): Results and Recommendations from the European BEST Project, 2009; Lenanders Grafi ska AB: Stockholm, Sweden, 2009; Available online: http://www.best-europe.org (accessed on April 30, 2010).
  15. Chollacoop, N.; Laoonual, Y.; Sukasi, S.; Topaiboul, S. Possibility of Ethanol Usage as Diesel Substitutes in Thai Transportation Sector; Final report submitted to ATRANS: Bangkok, Thailand, 2010. [Google Scholar]
  16. Button, K.; Ngoe, N.; Hine, J. Modeling Vehicle Ownership and Use in Low Income Countries. J. Transp. Econ. Policy 1993, 27, 51–67. [Google Scholar]
  17. Dargay, J.; Gately, D.; Sommer, M. Vehicle Ownership and Income Growth, Worldwide: 1960–2030. Energy J. 2007, 28, 163–190. [Google Scholar] [CrossRef]
  18. Nagai, Y.; Fukuda, A.; Okada, Y.; Hashino, Y. Two-wheeled Vehicle Ownership Trends and Issues in the Asian Region. J. East. Asia Soc. Transp. Stud. 2003, 5, 135–146. [Google Scholar]
  19. Energy Policy and Planning Office. Investigation of Energy Conservation in Automotive; Final report to Ministry of Energy: Bangkok, Thailand, 1997.
  20. Energy Policy and Planning Office. Survey of Energy Consumption in Transportation Sector; Final report to Ministry of Energy: Bangkok, Thailand, 2008.
  21. Eamrungroj, S. Clean CNG in Transportation in Bangkok, Proceedings of the Joint 7th APEC Coal Flow Seminar & the 8th APEC Clean Fossil Energy Technical Seminar 2000, Bangkok, Thailand, 2000.
  22. Wannatong, K.; Akarapanyavit, N.; Siengsanorh, S.; Chanchaona, S. Combustion and Knock Characteristics of Natural Gas Diesel Dual Fuel Engine; JSAE 20077147; Society of Automotive Engineers of Japan, Inc.: Tokyo, Japan, 2007. [Google Scholar]
  23. Intergovernmental Panel on Climate Change (IPCC). 2006 IPCC Guidelines for National Greenhouse Gas Inventories; Eggleston, H.S., Buendia, L., Miwa, K., Ngara, T., Tanabe, K., Eds.; IGES: Kanagawa, Japan, 2006; Volume 2, pp. 3.10–3.29. [Google Scholar]
  24. Ou, X.M.; Zhang, X.L.; Chang, S.Y.; Guo, Q.F. Energy consumption and GHG emissions of six biofuel pathways by LCA in (the) People’s Republic of China. Appl. Energy 2009, 86, S197–S208. [Google Scholar] [CrossRef]

