A Low Cost Wireless Data Acquisition System for a Remote Photovoltaic (PV) Water Pumping System

Abstract
:
1. Introduction
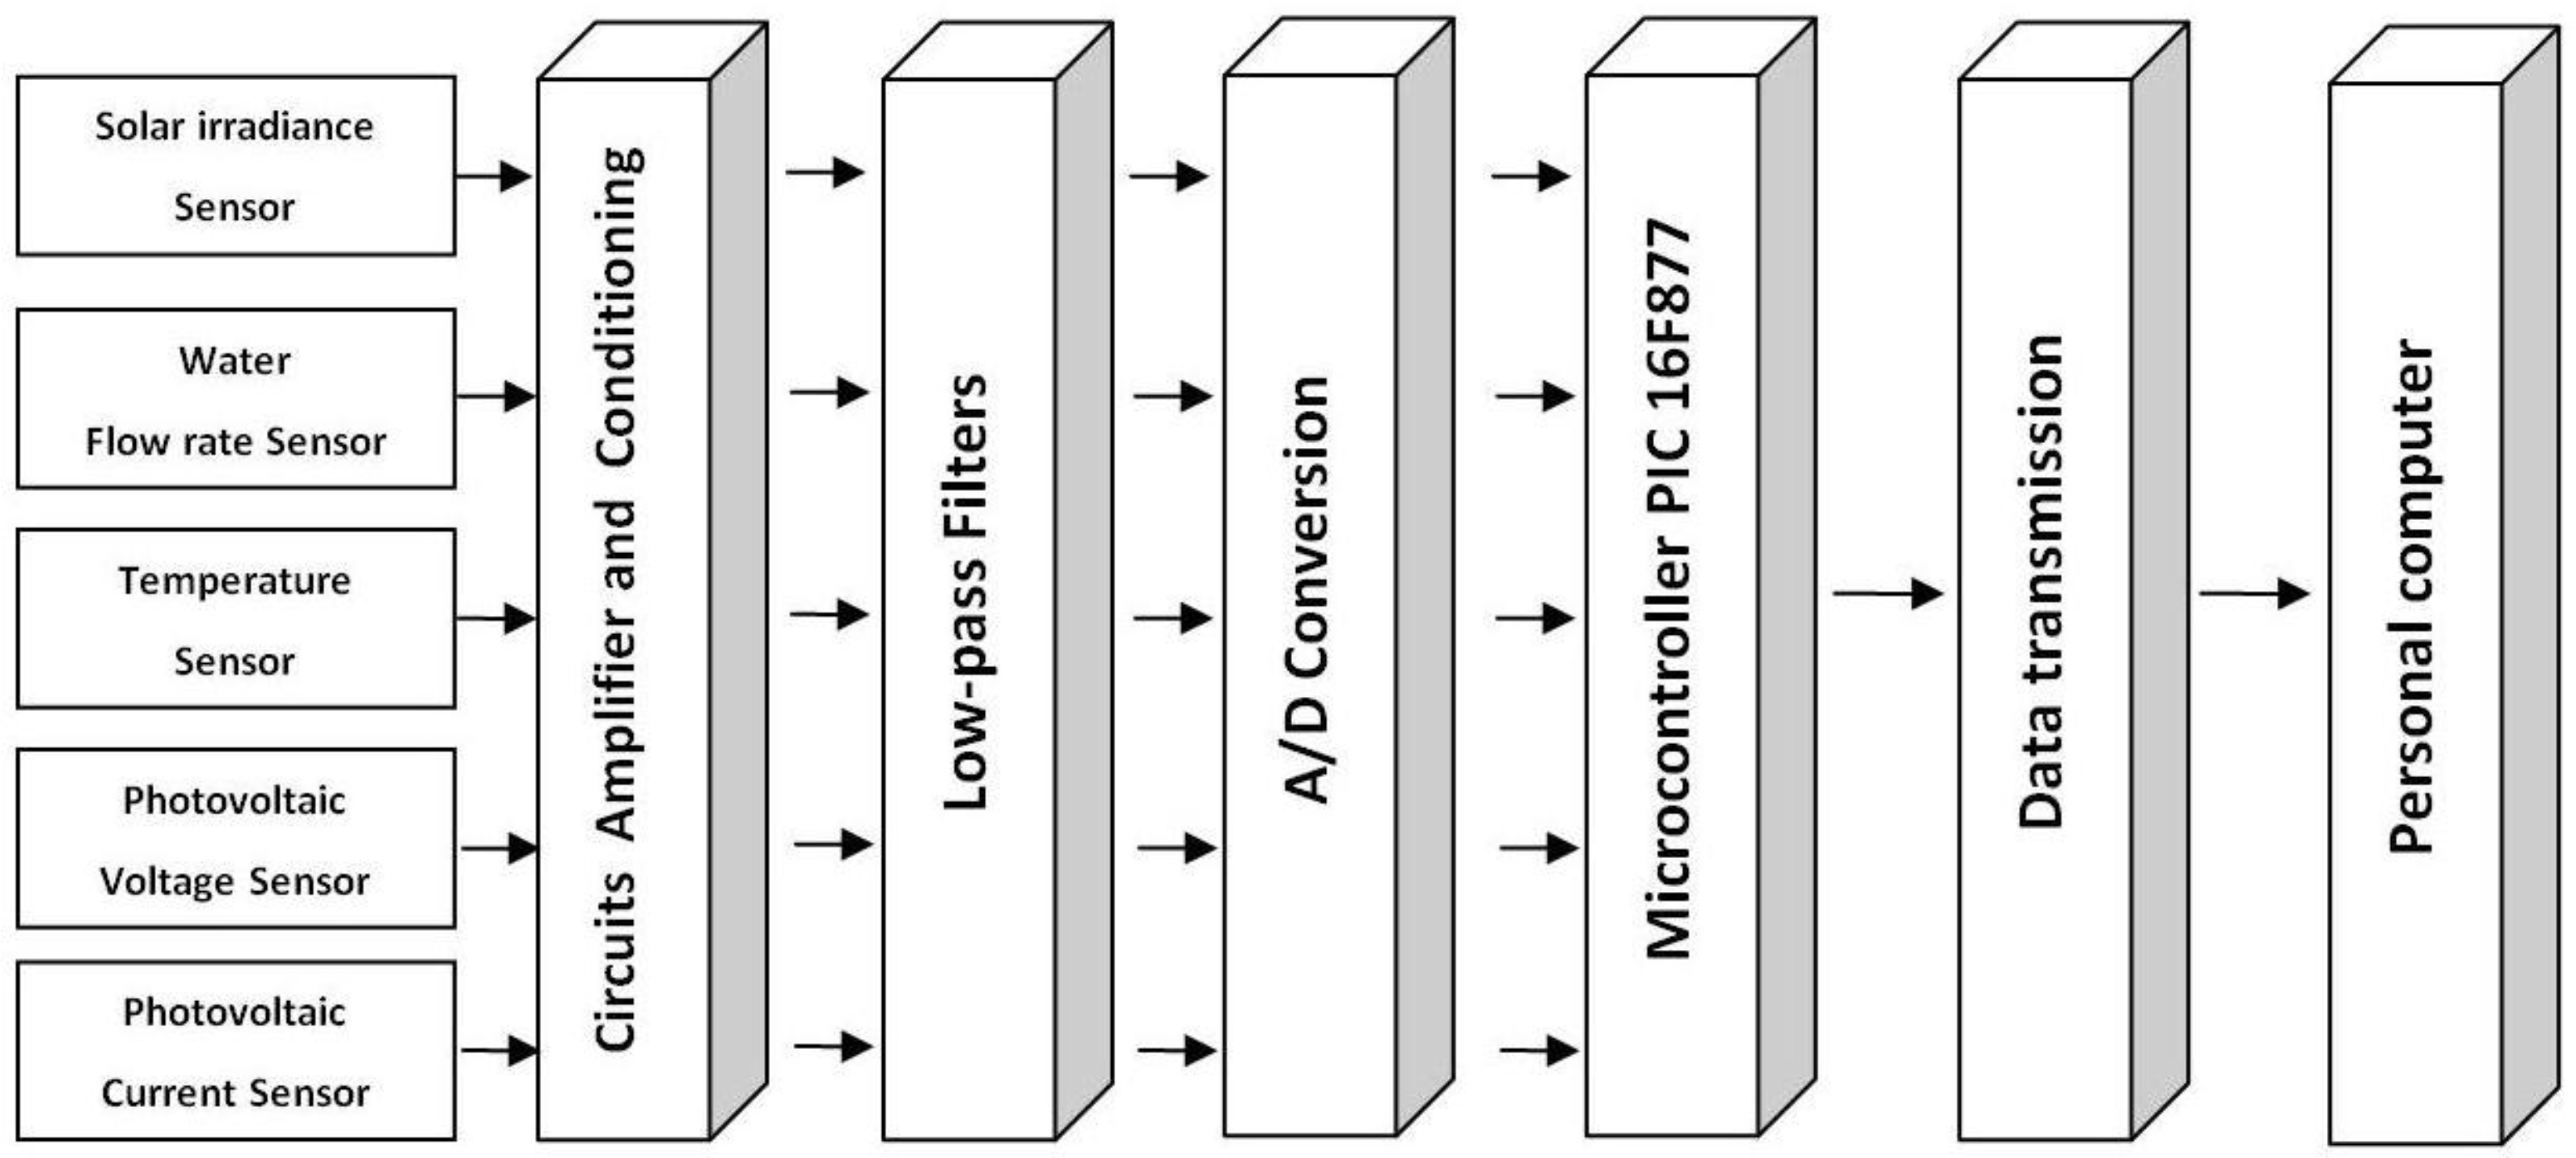
2. Methodology


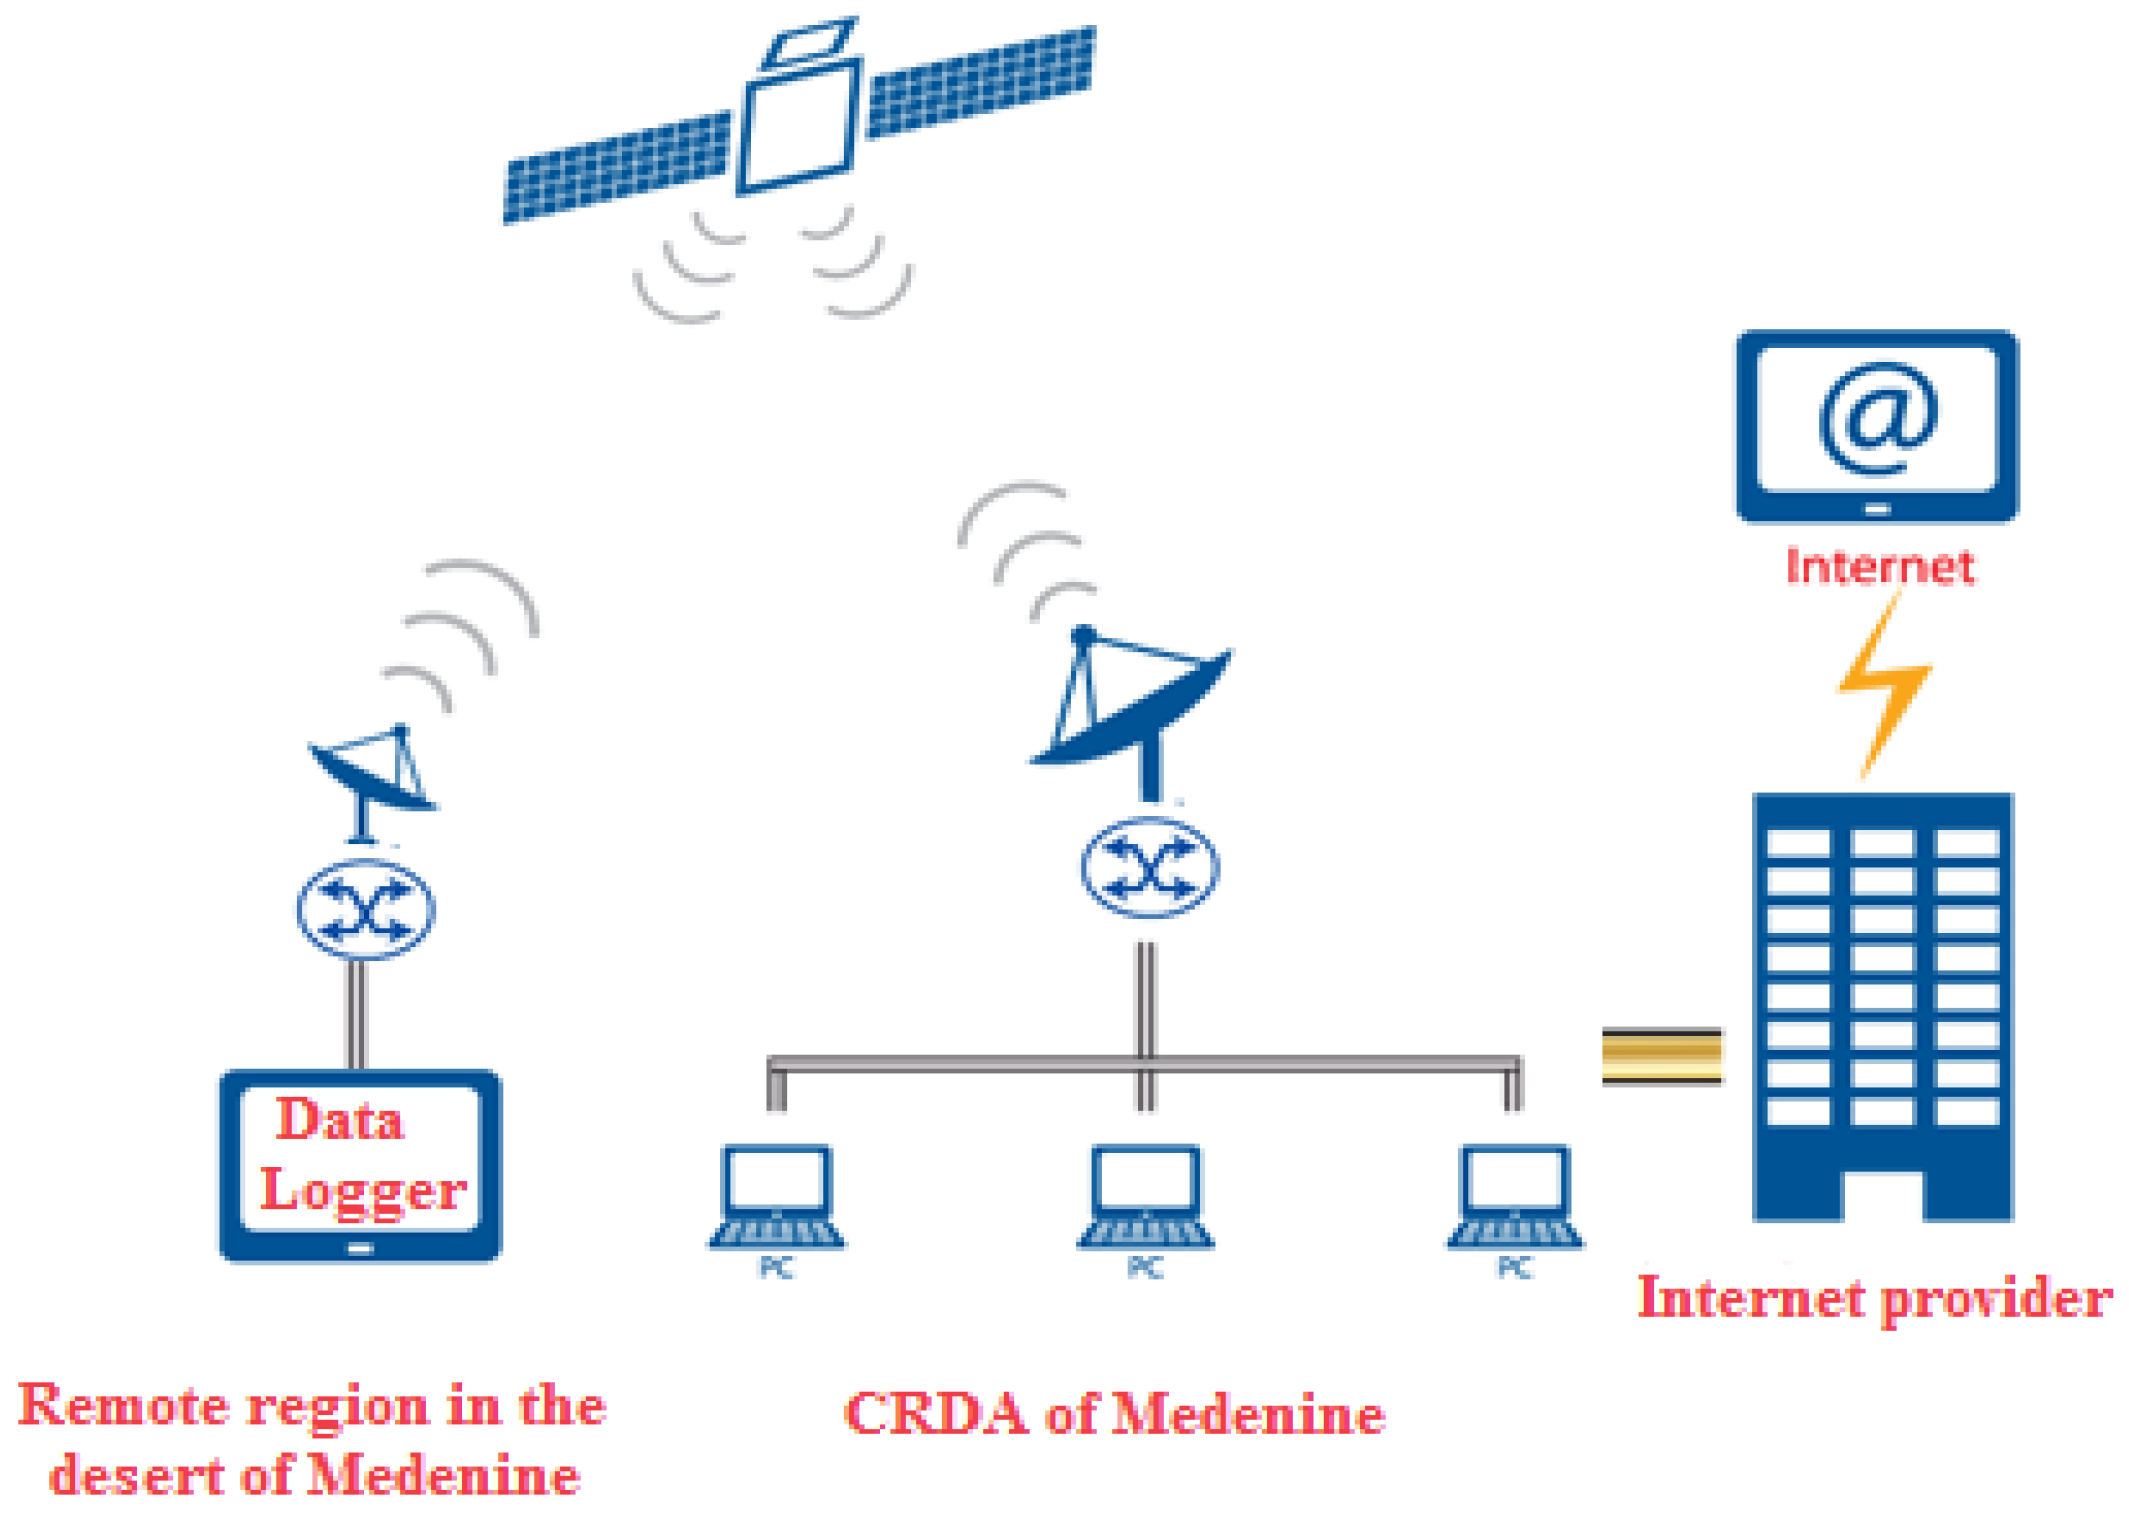
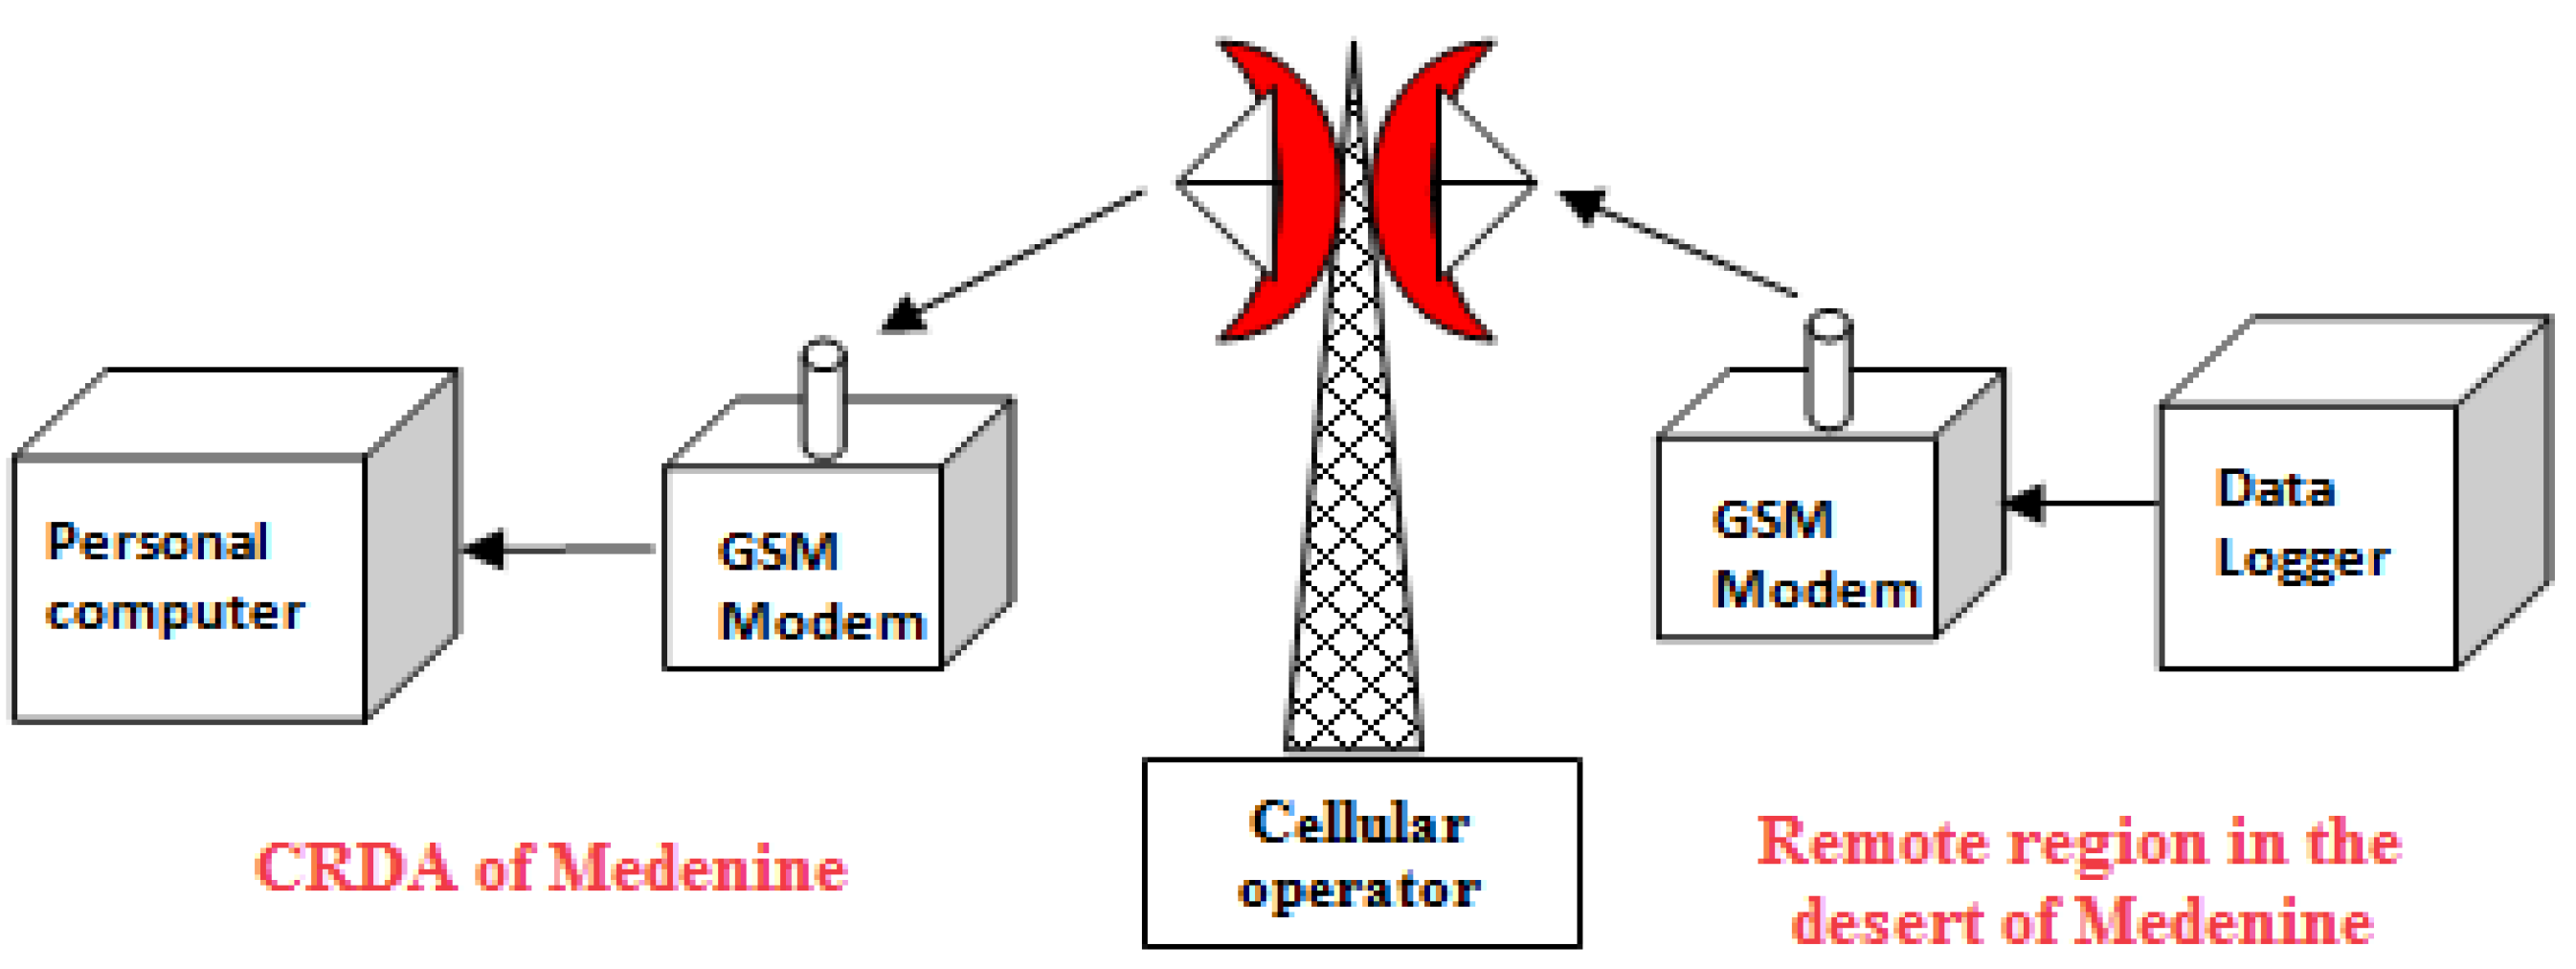
2.1. Transmission by Satellite
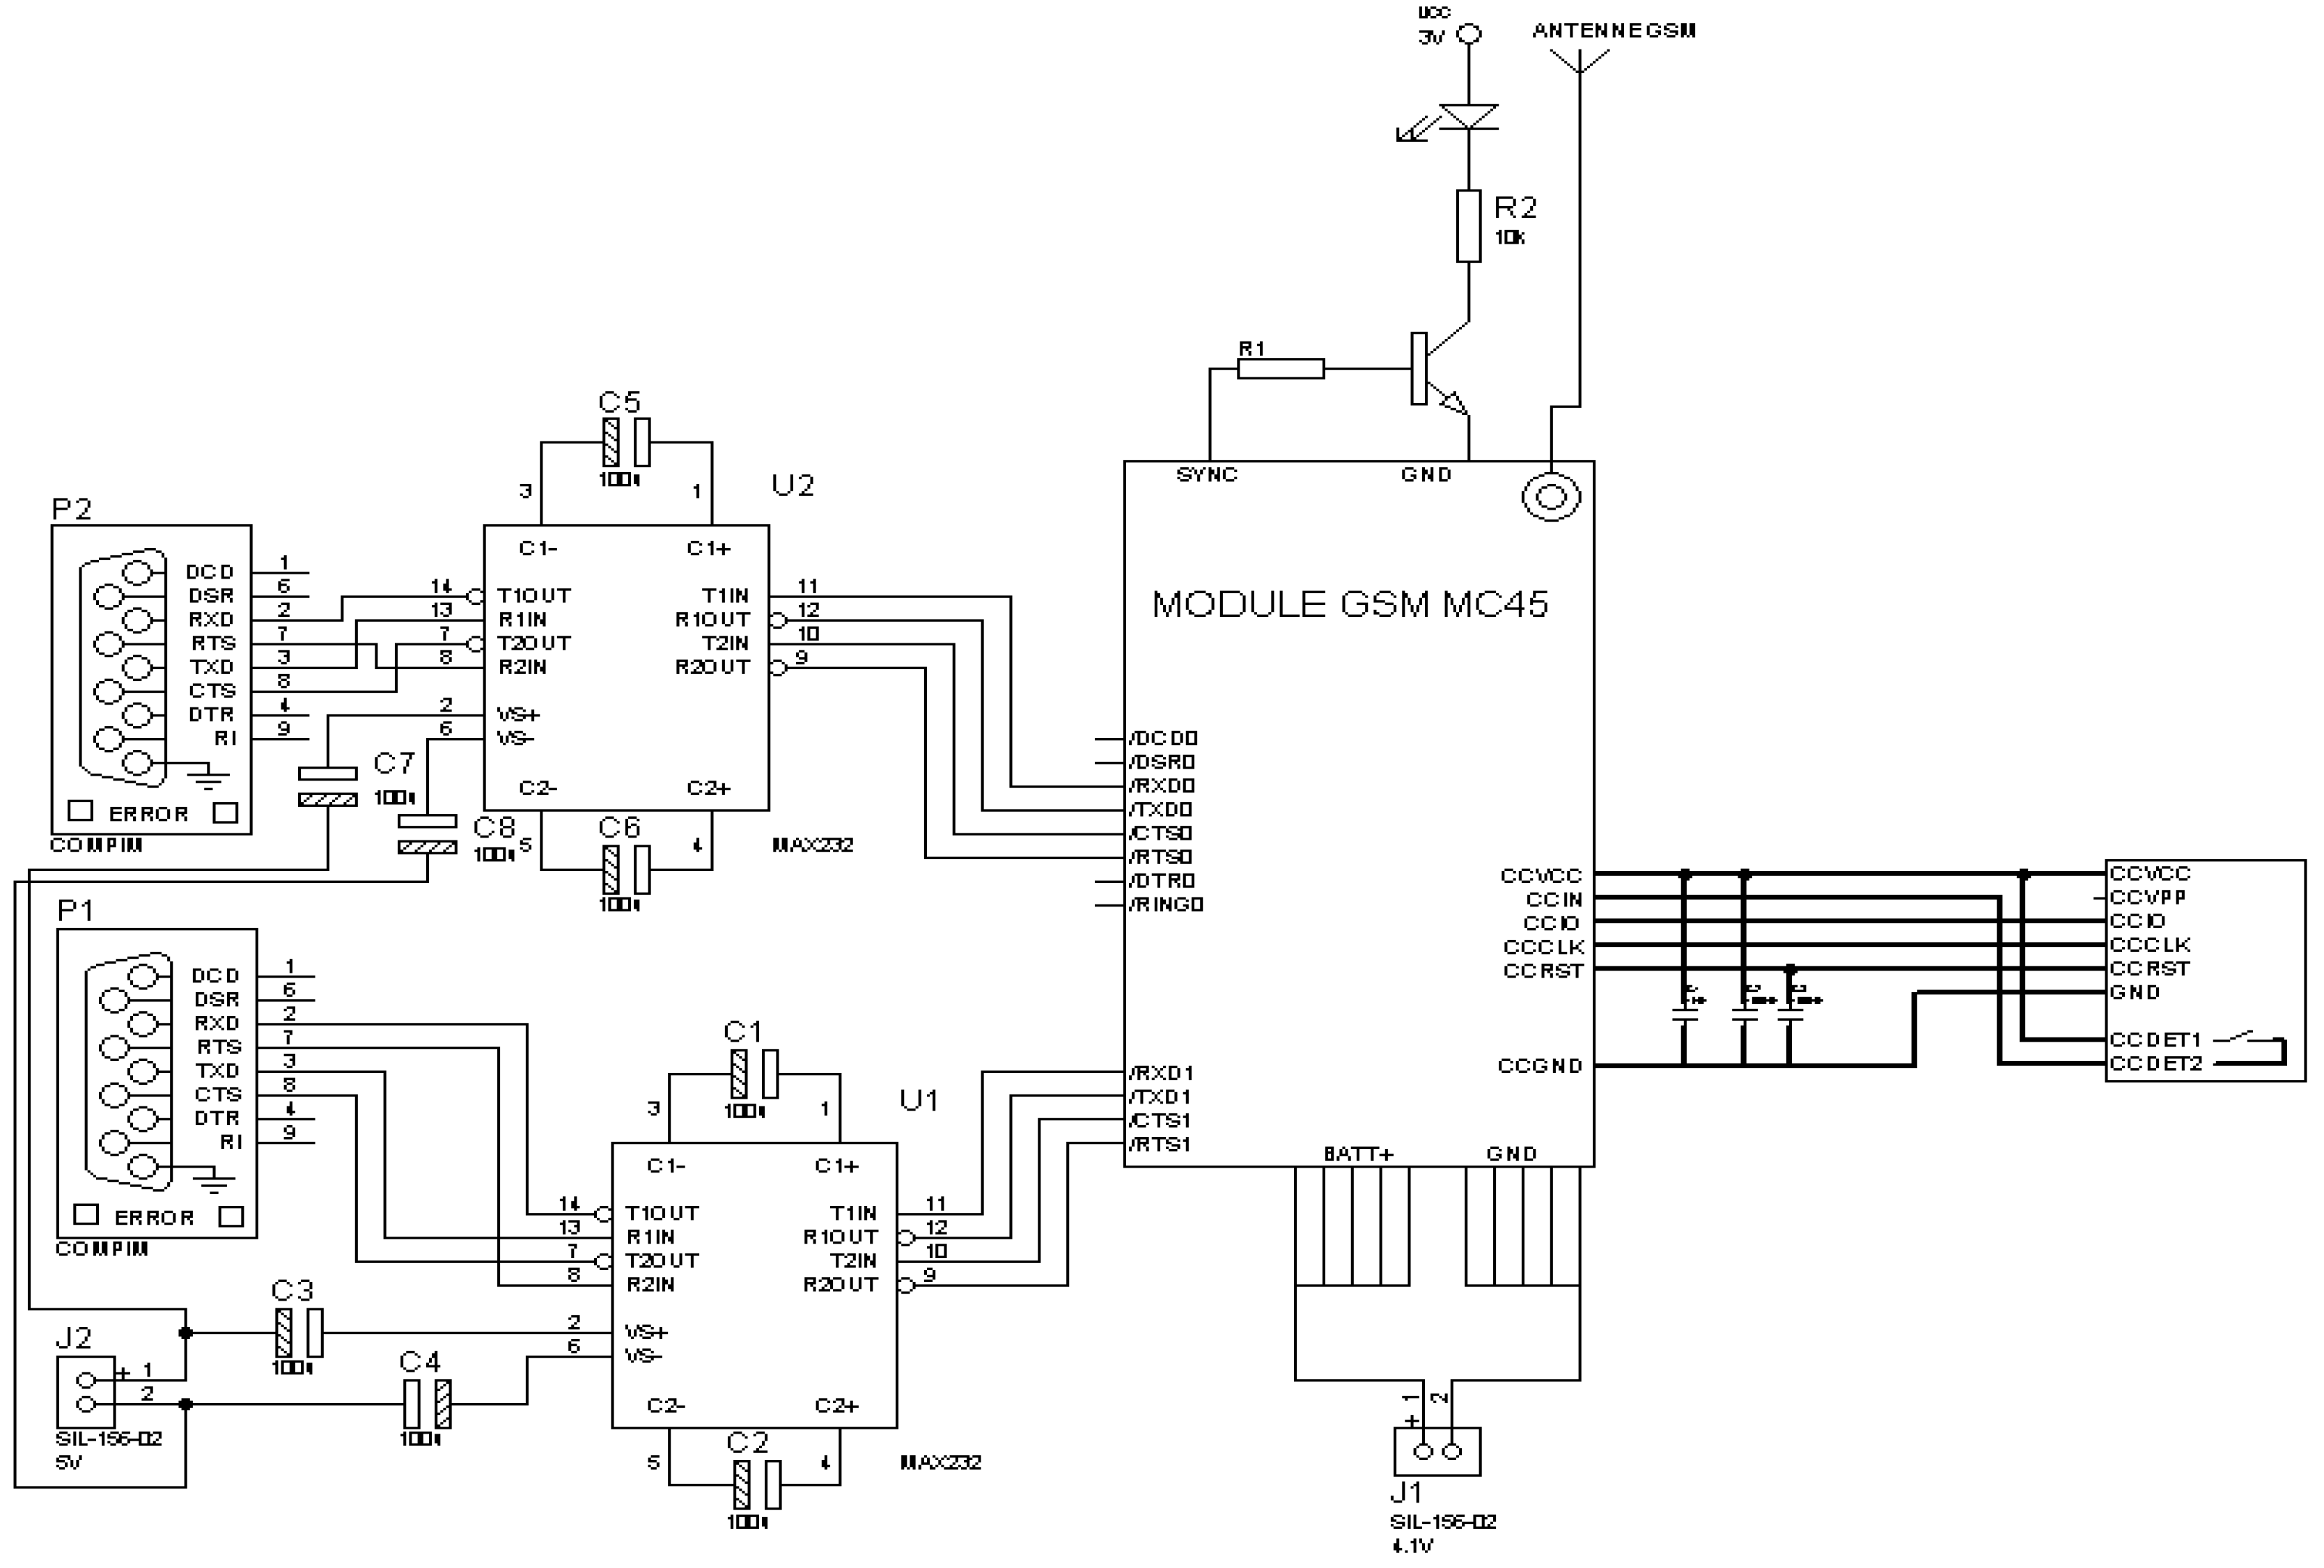
2.2. Transmission by GSM Modem/GPRS

2.3. Transmission by Radio Modem
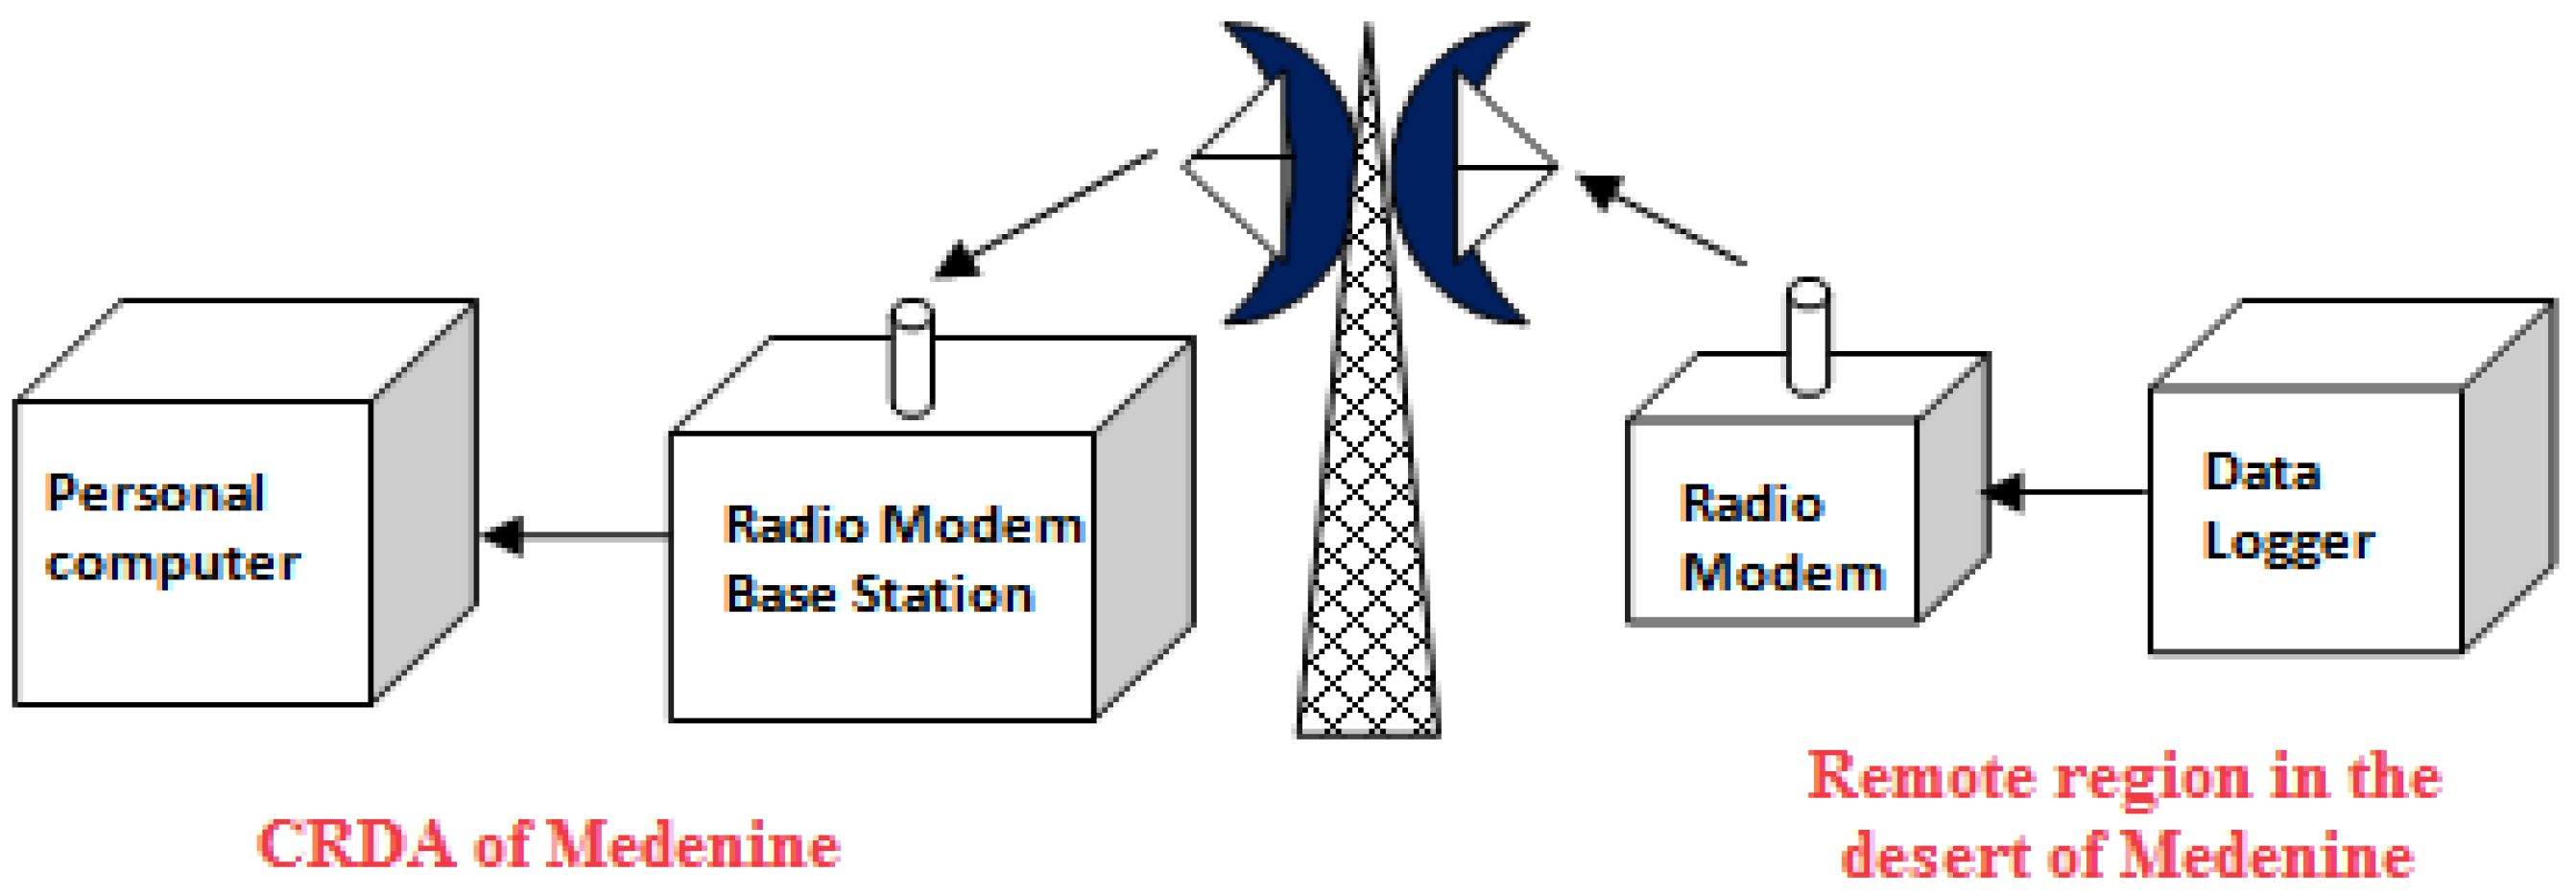
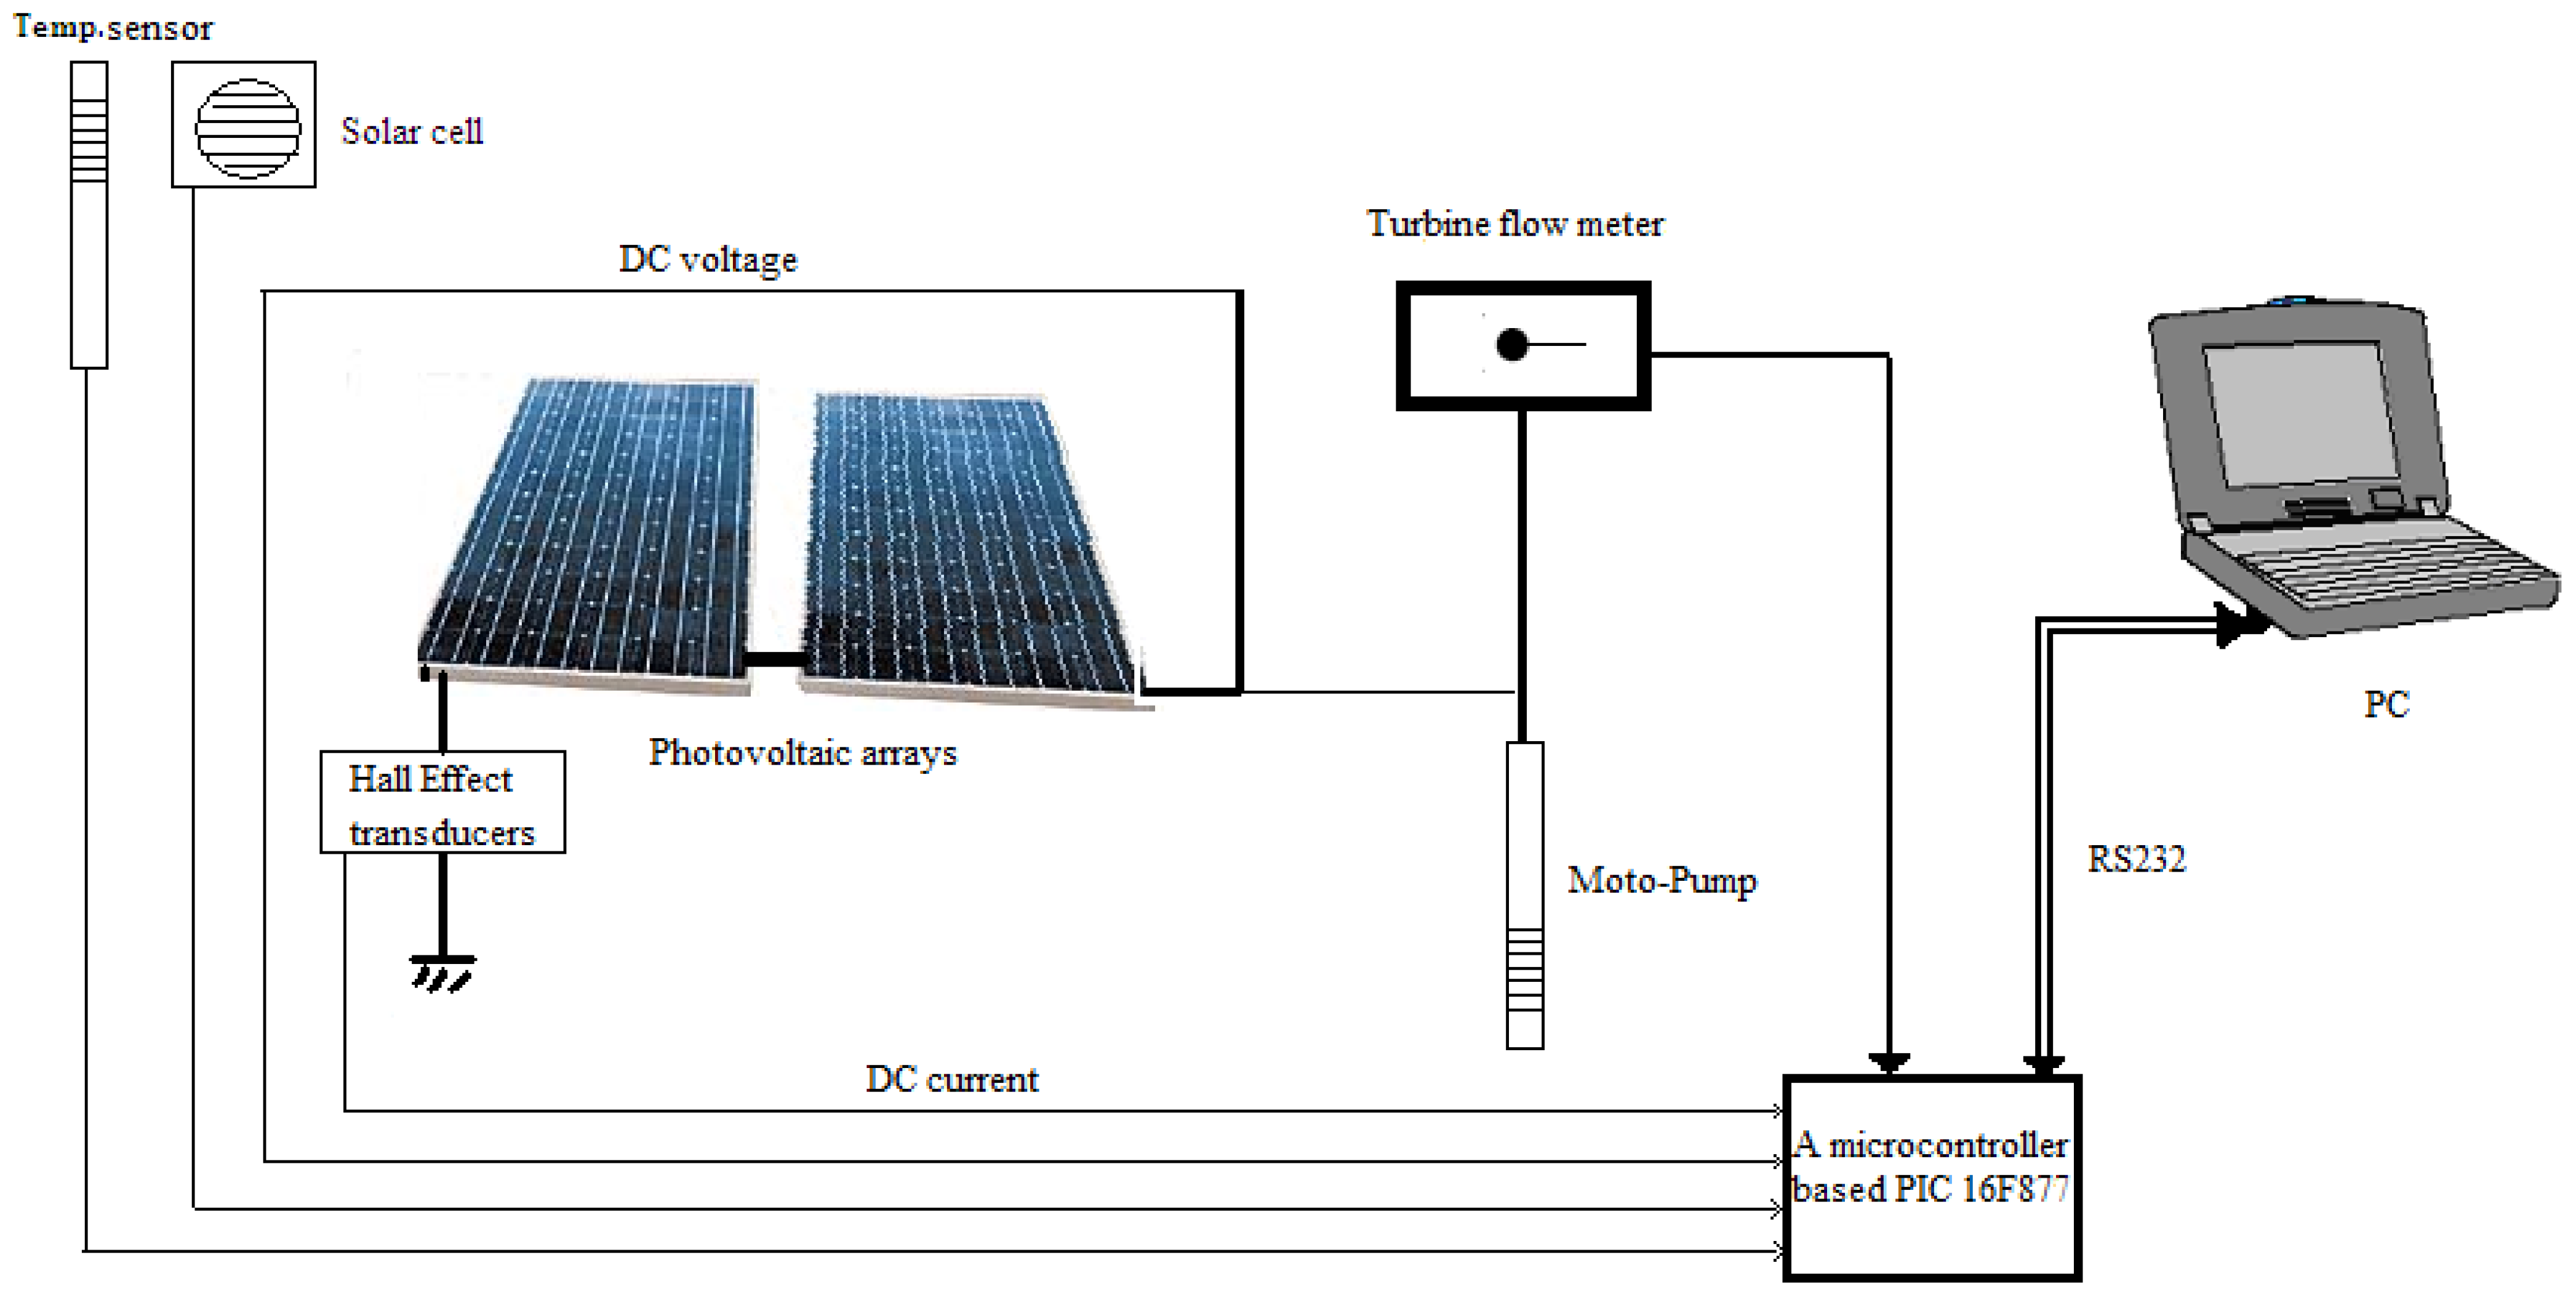
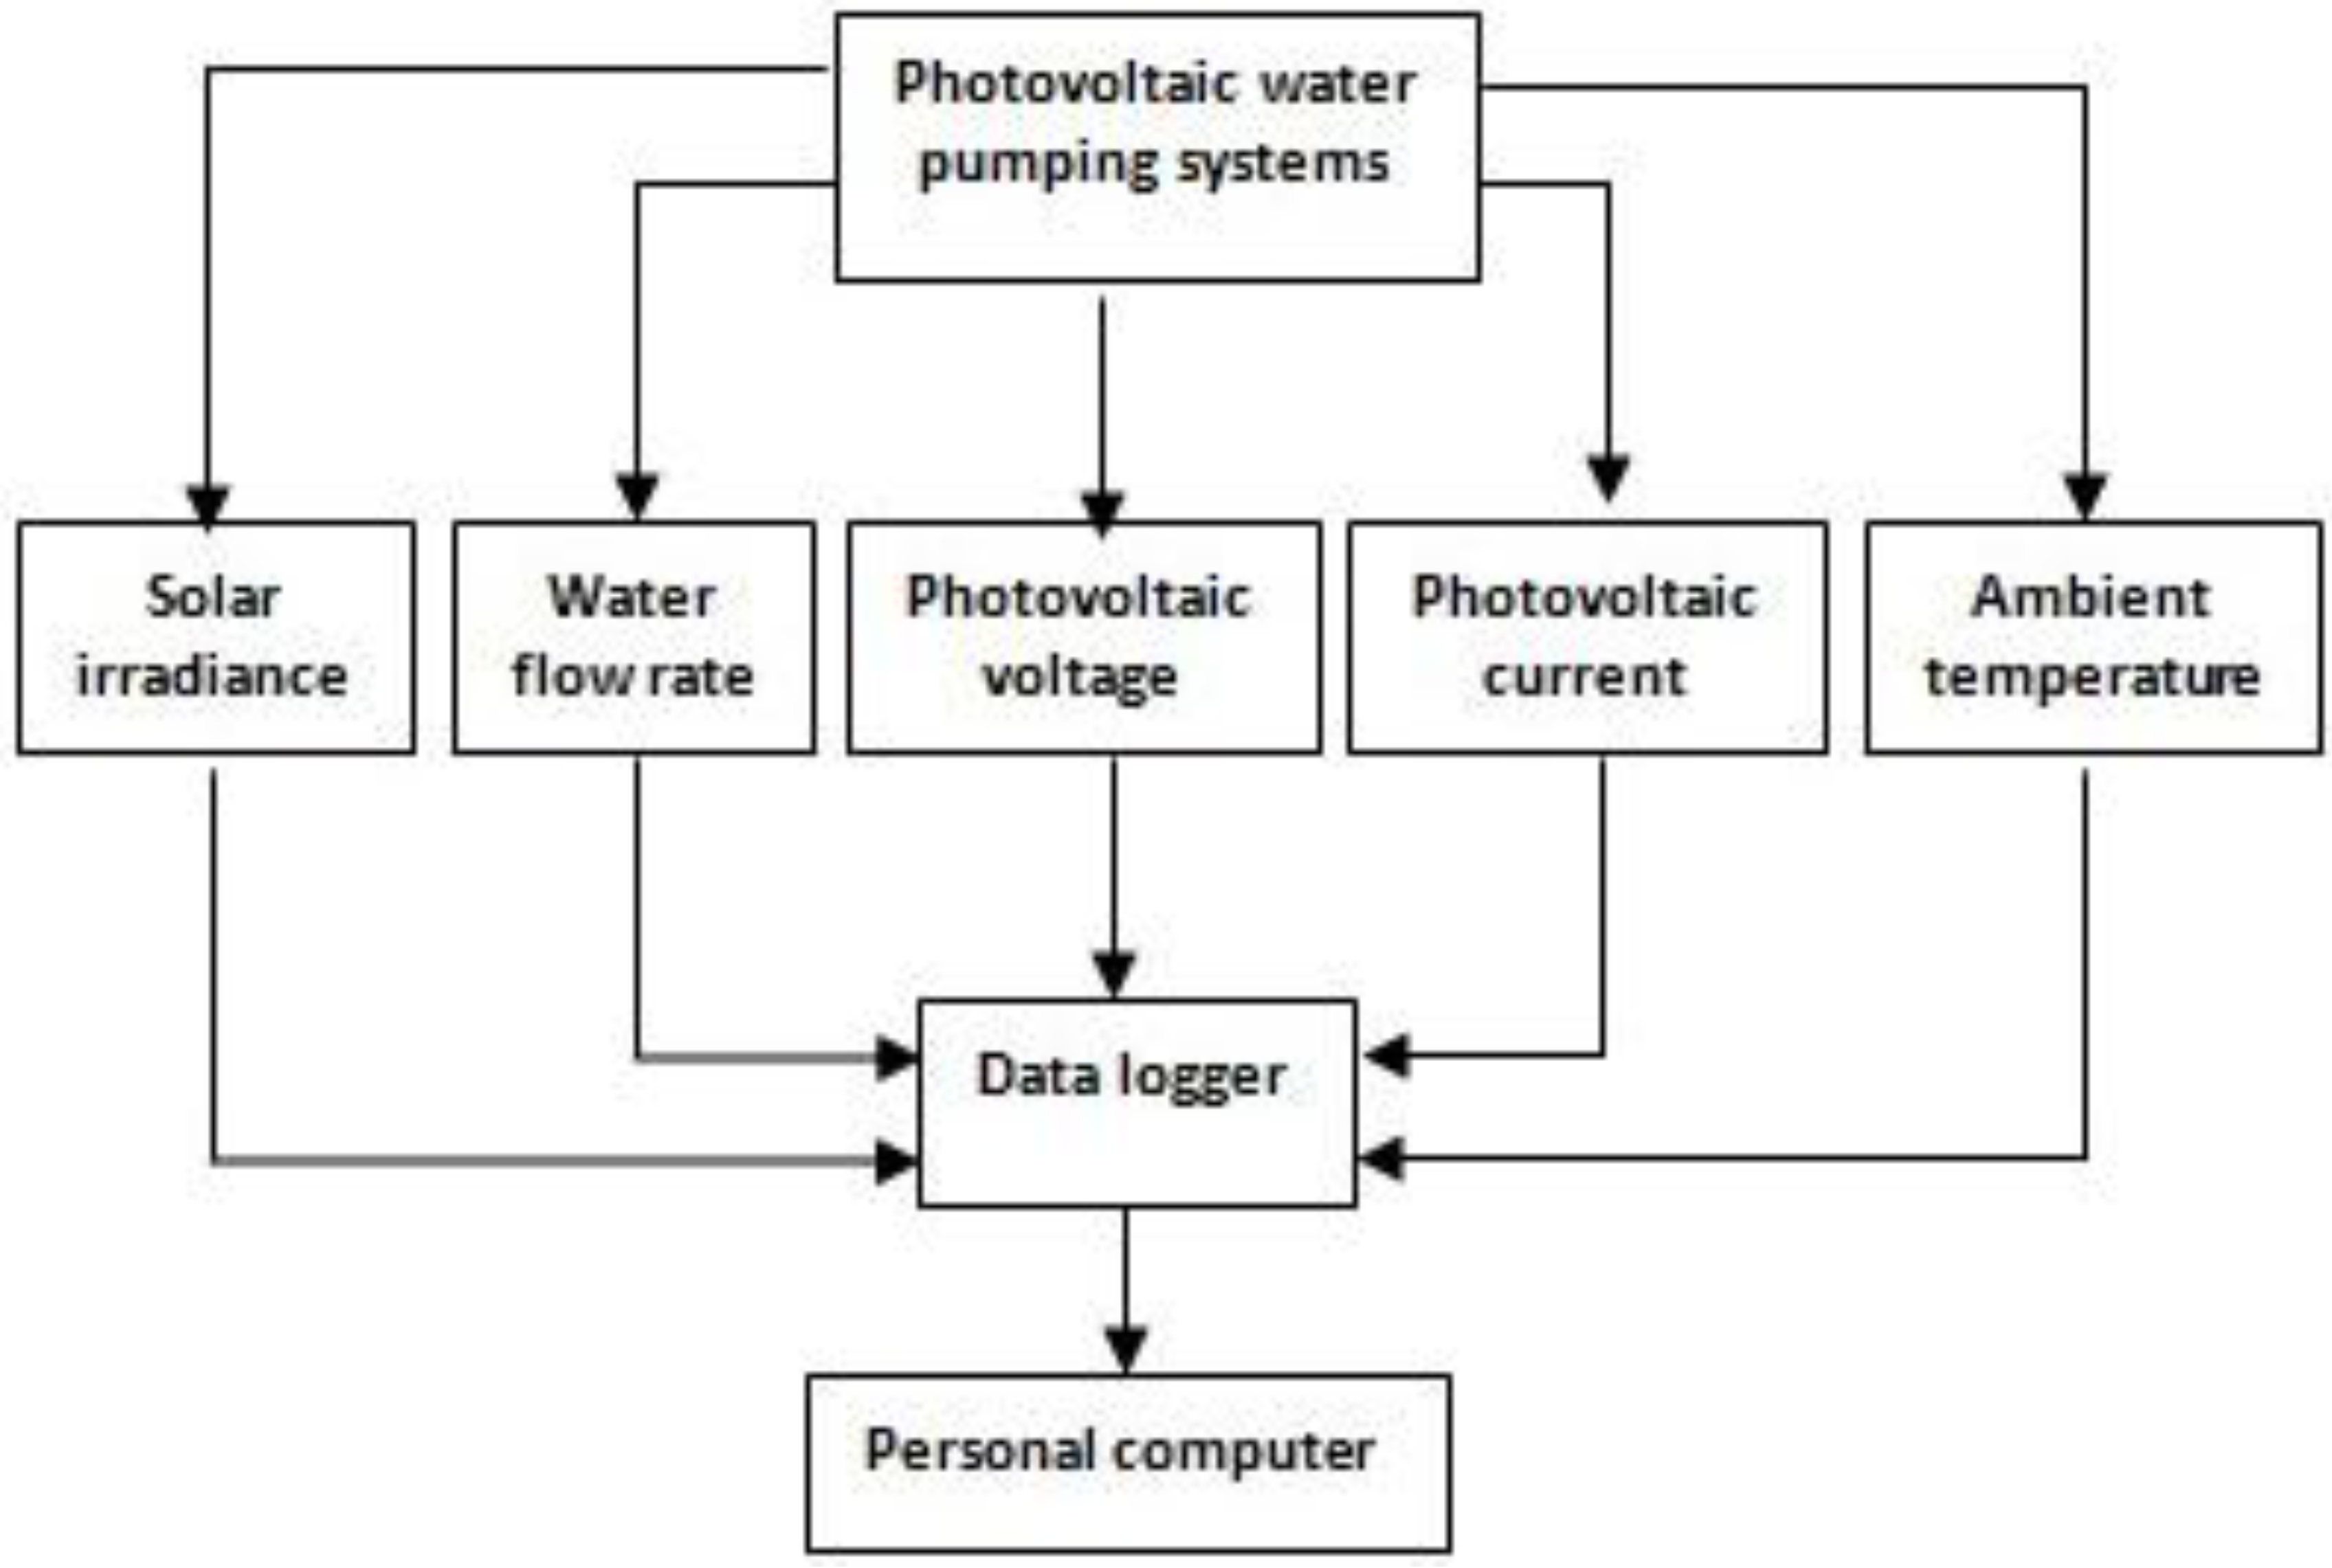
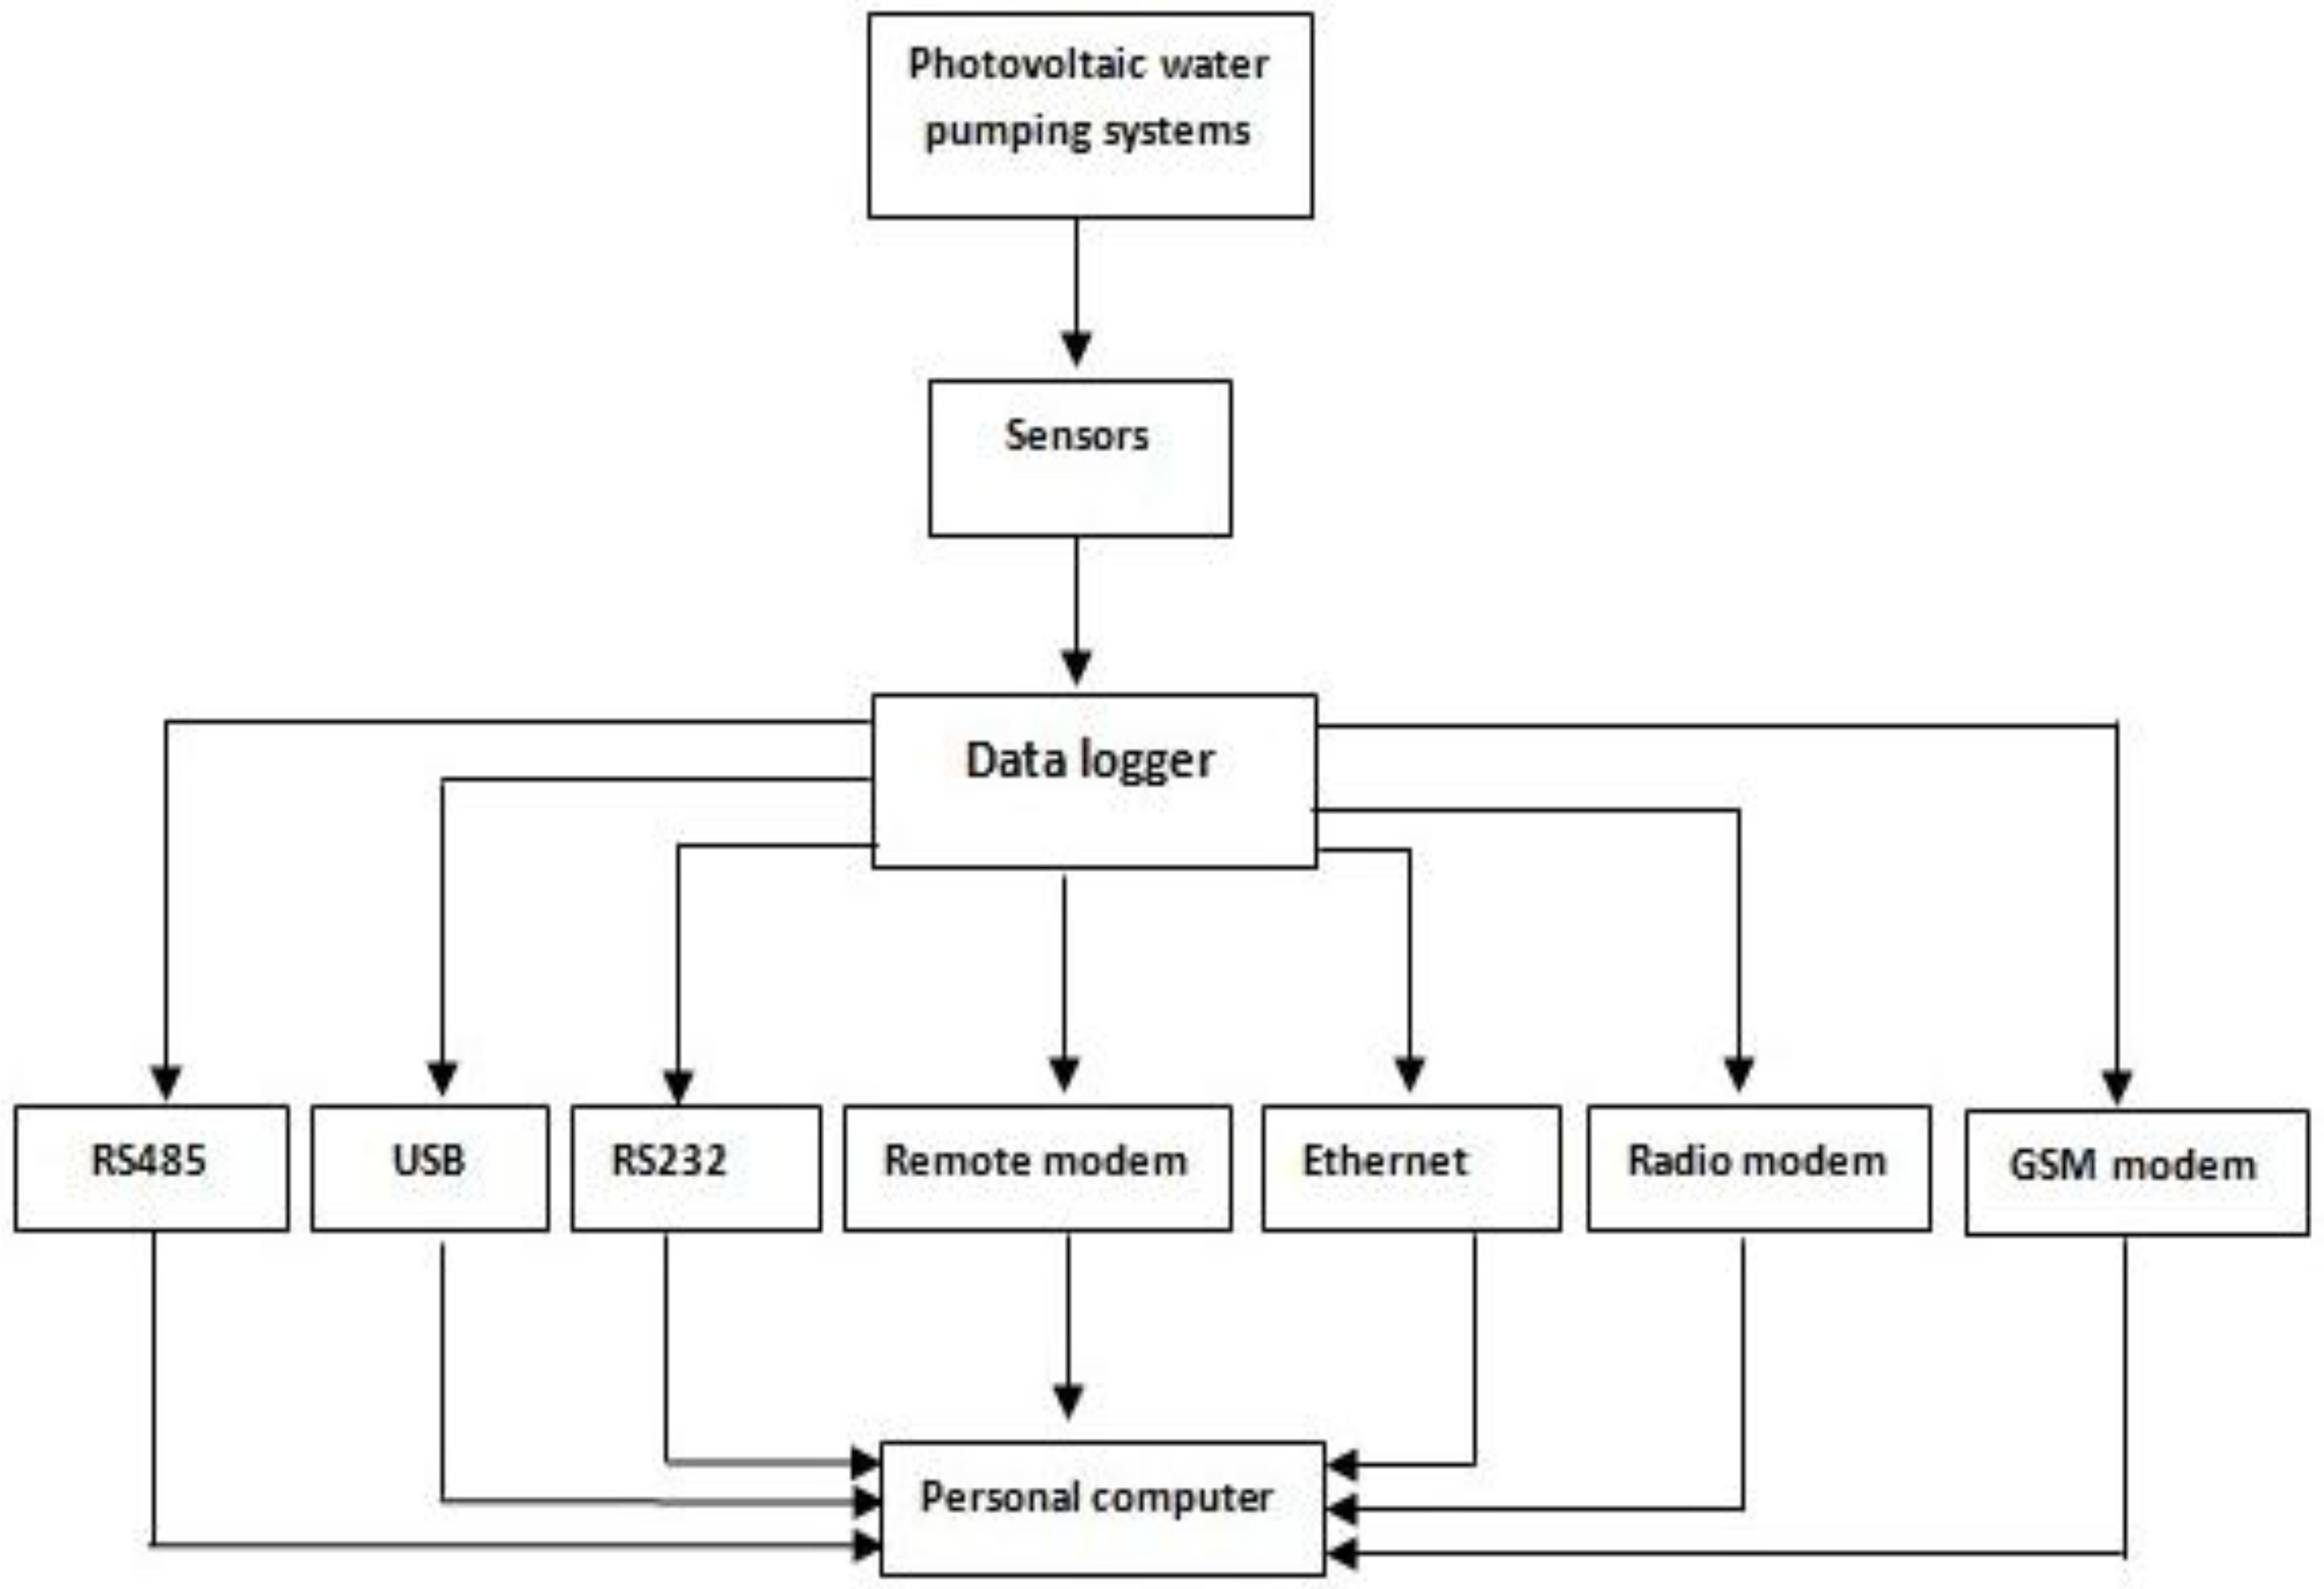
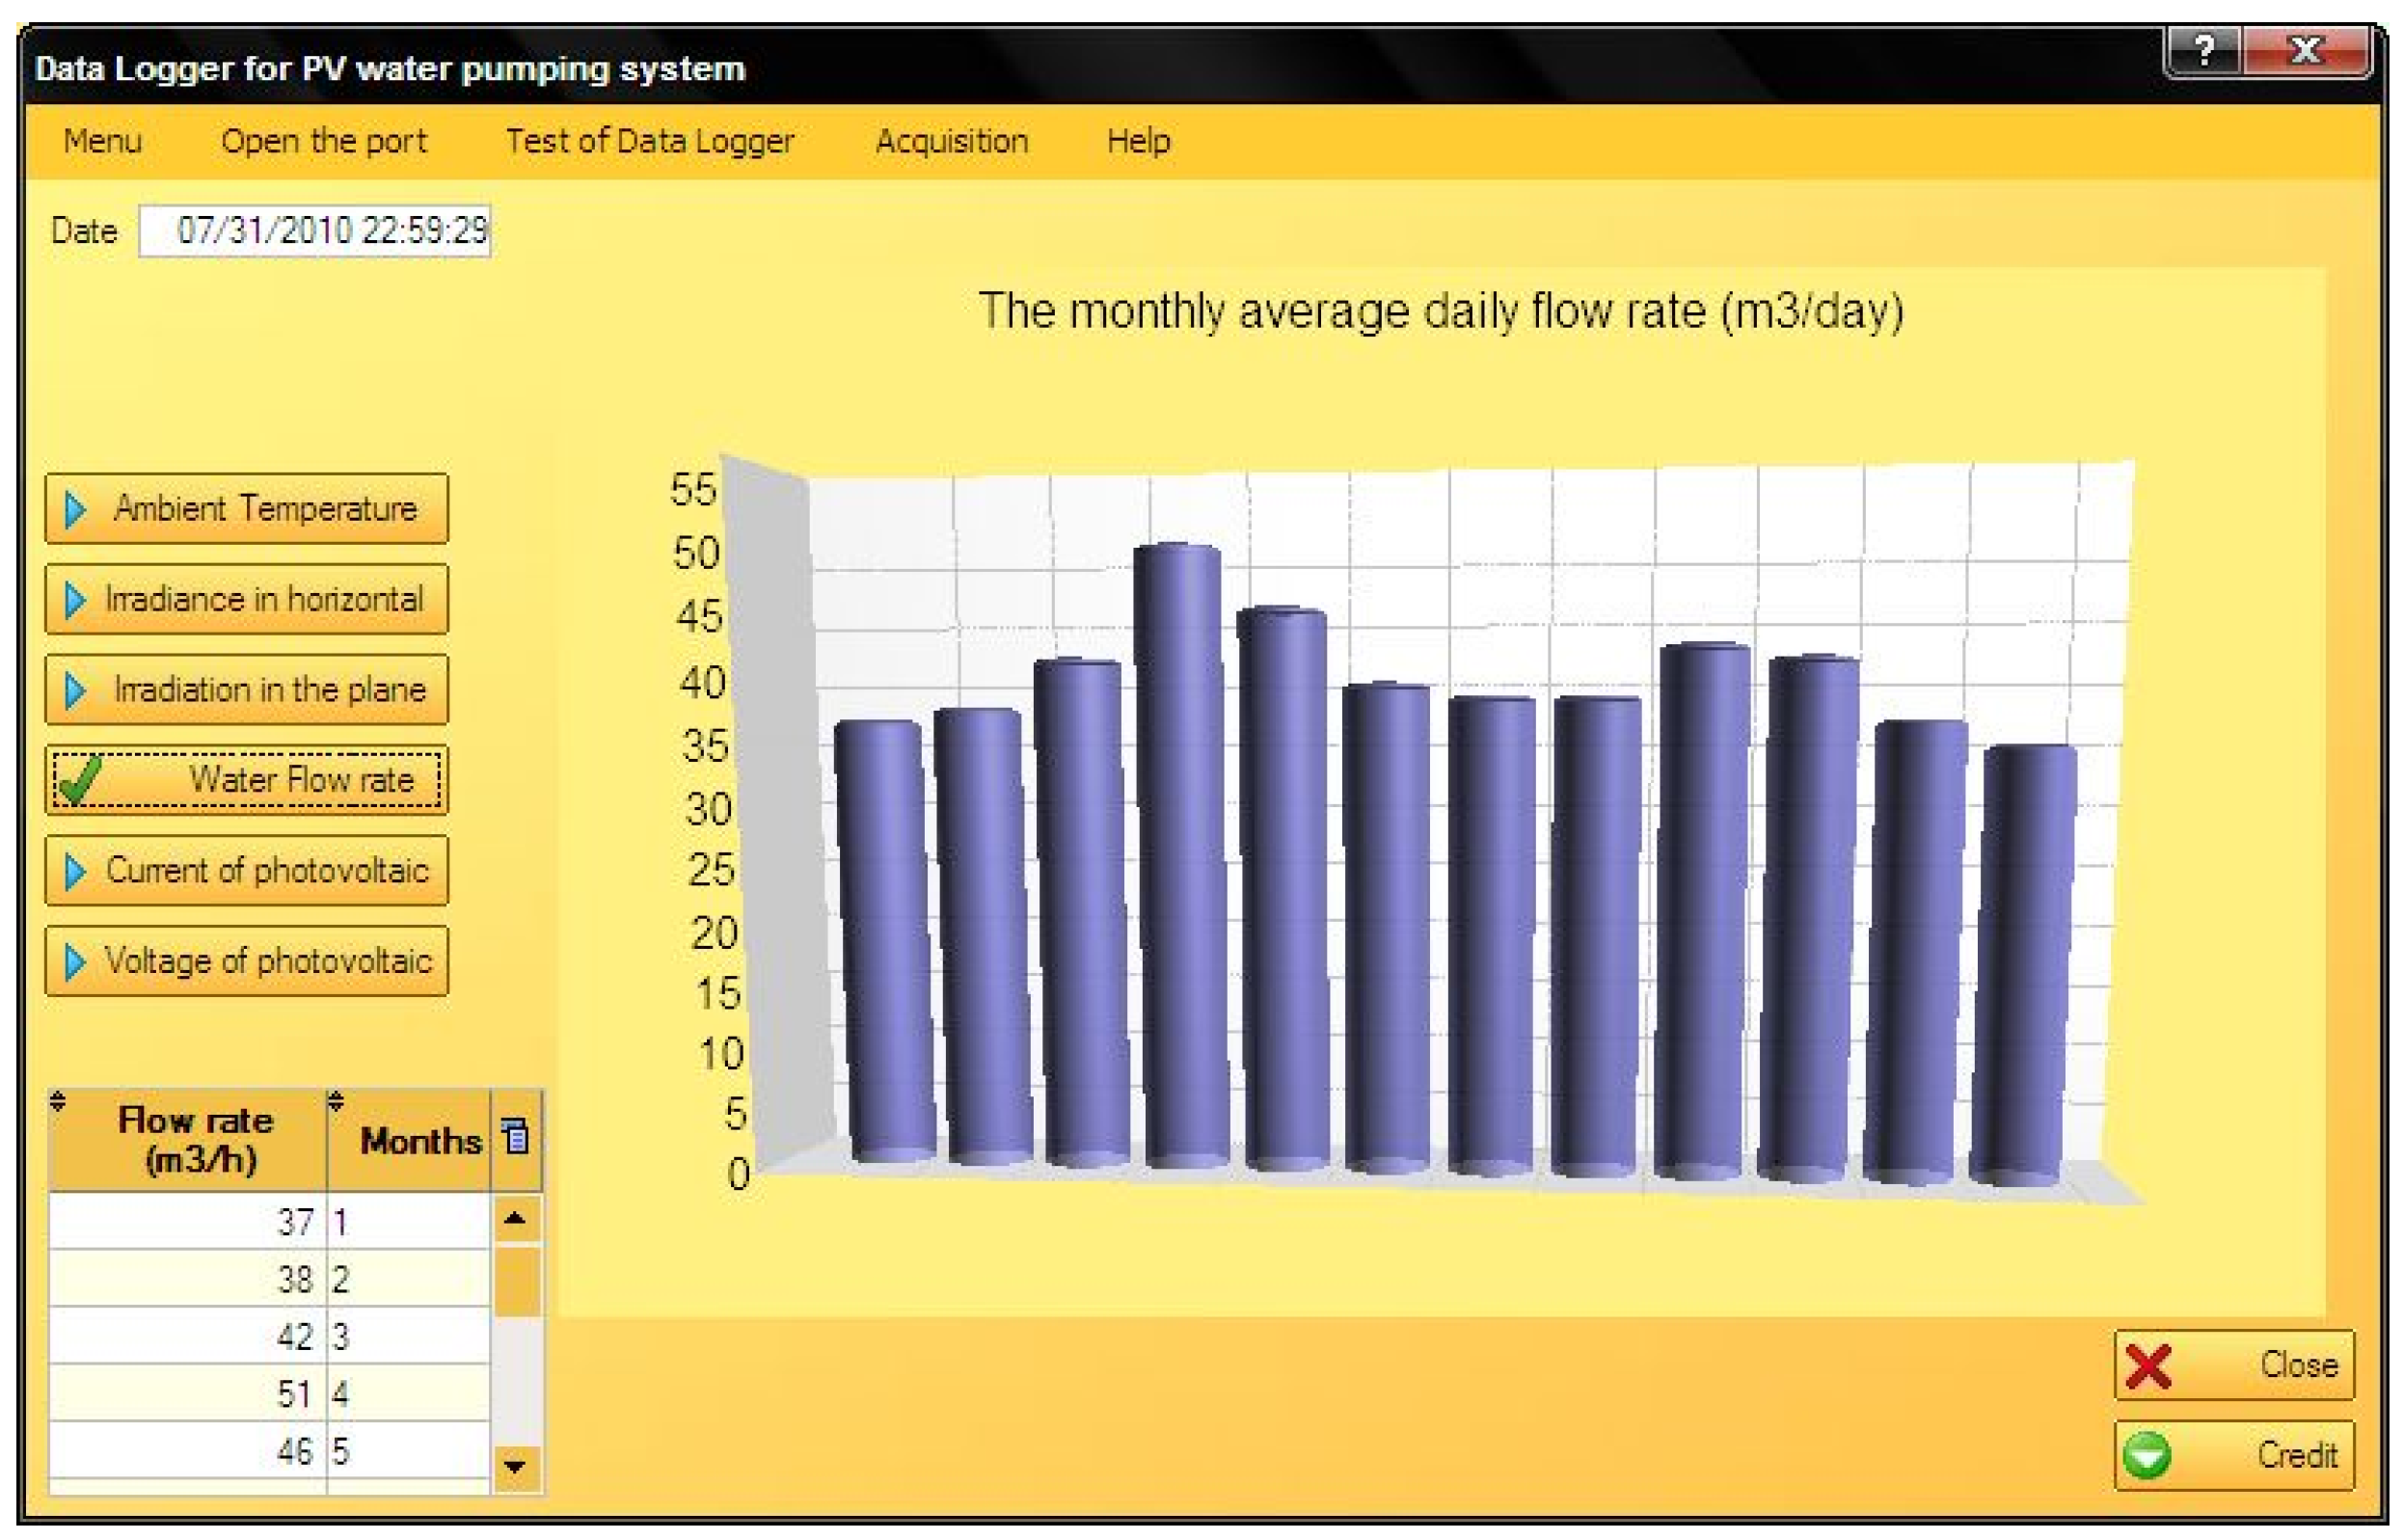
3. Developed Data Acquisition System
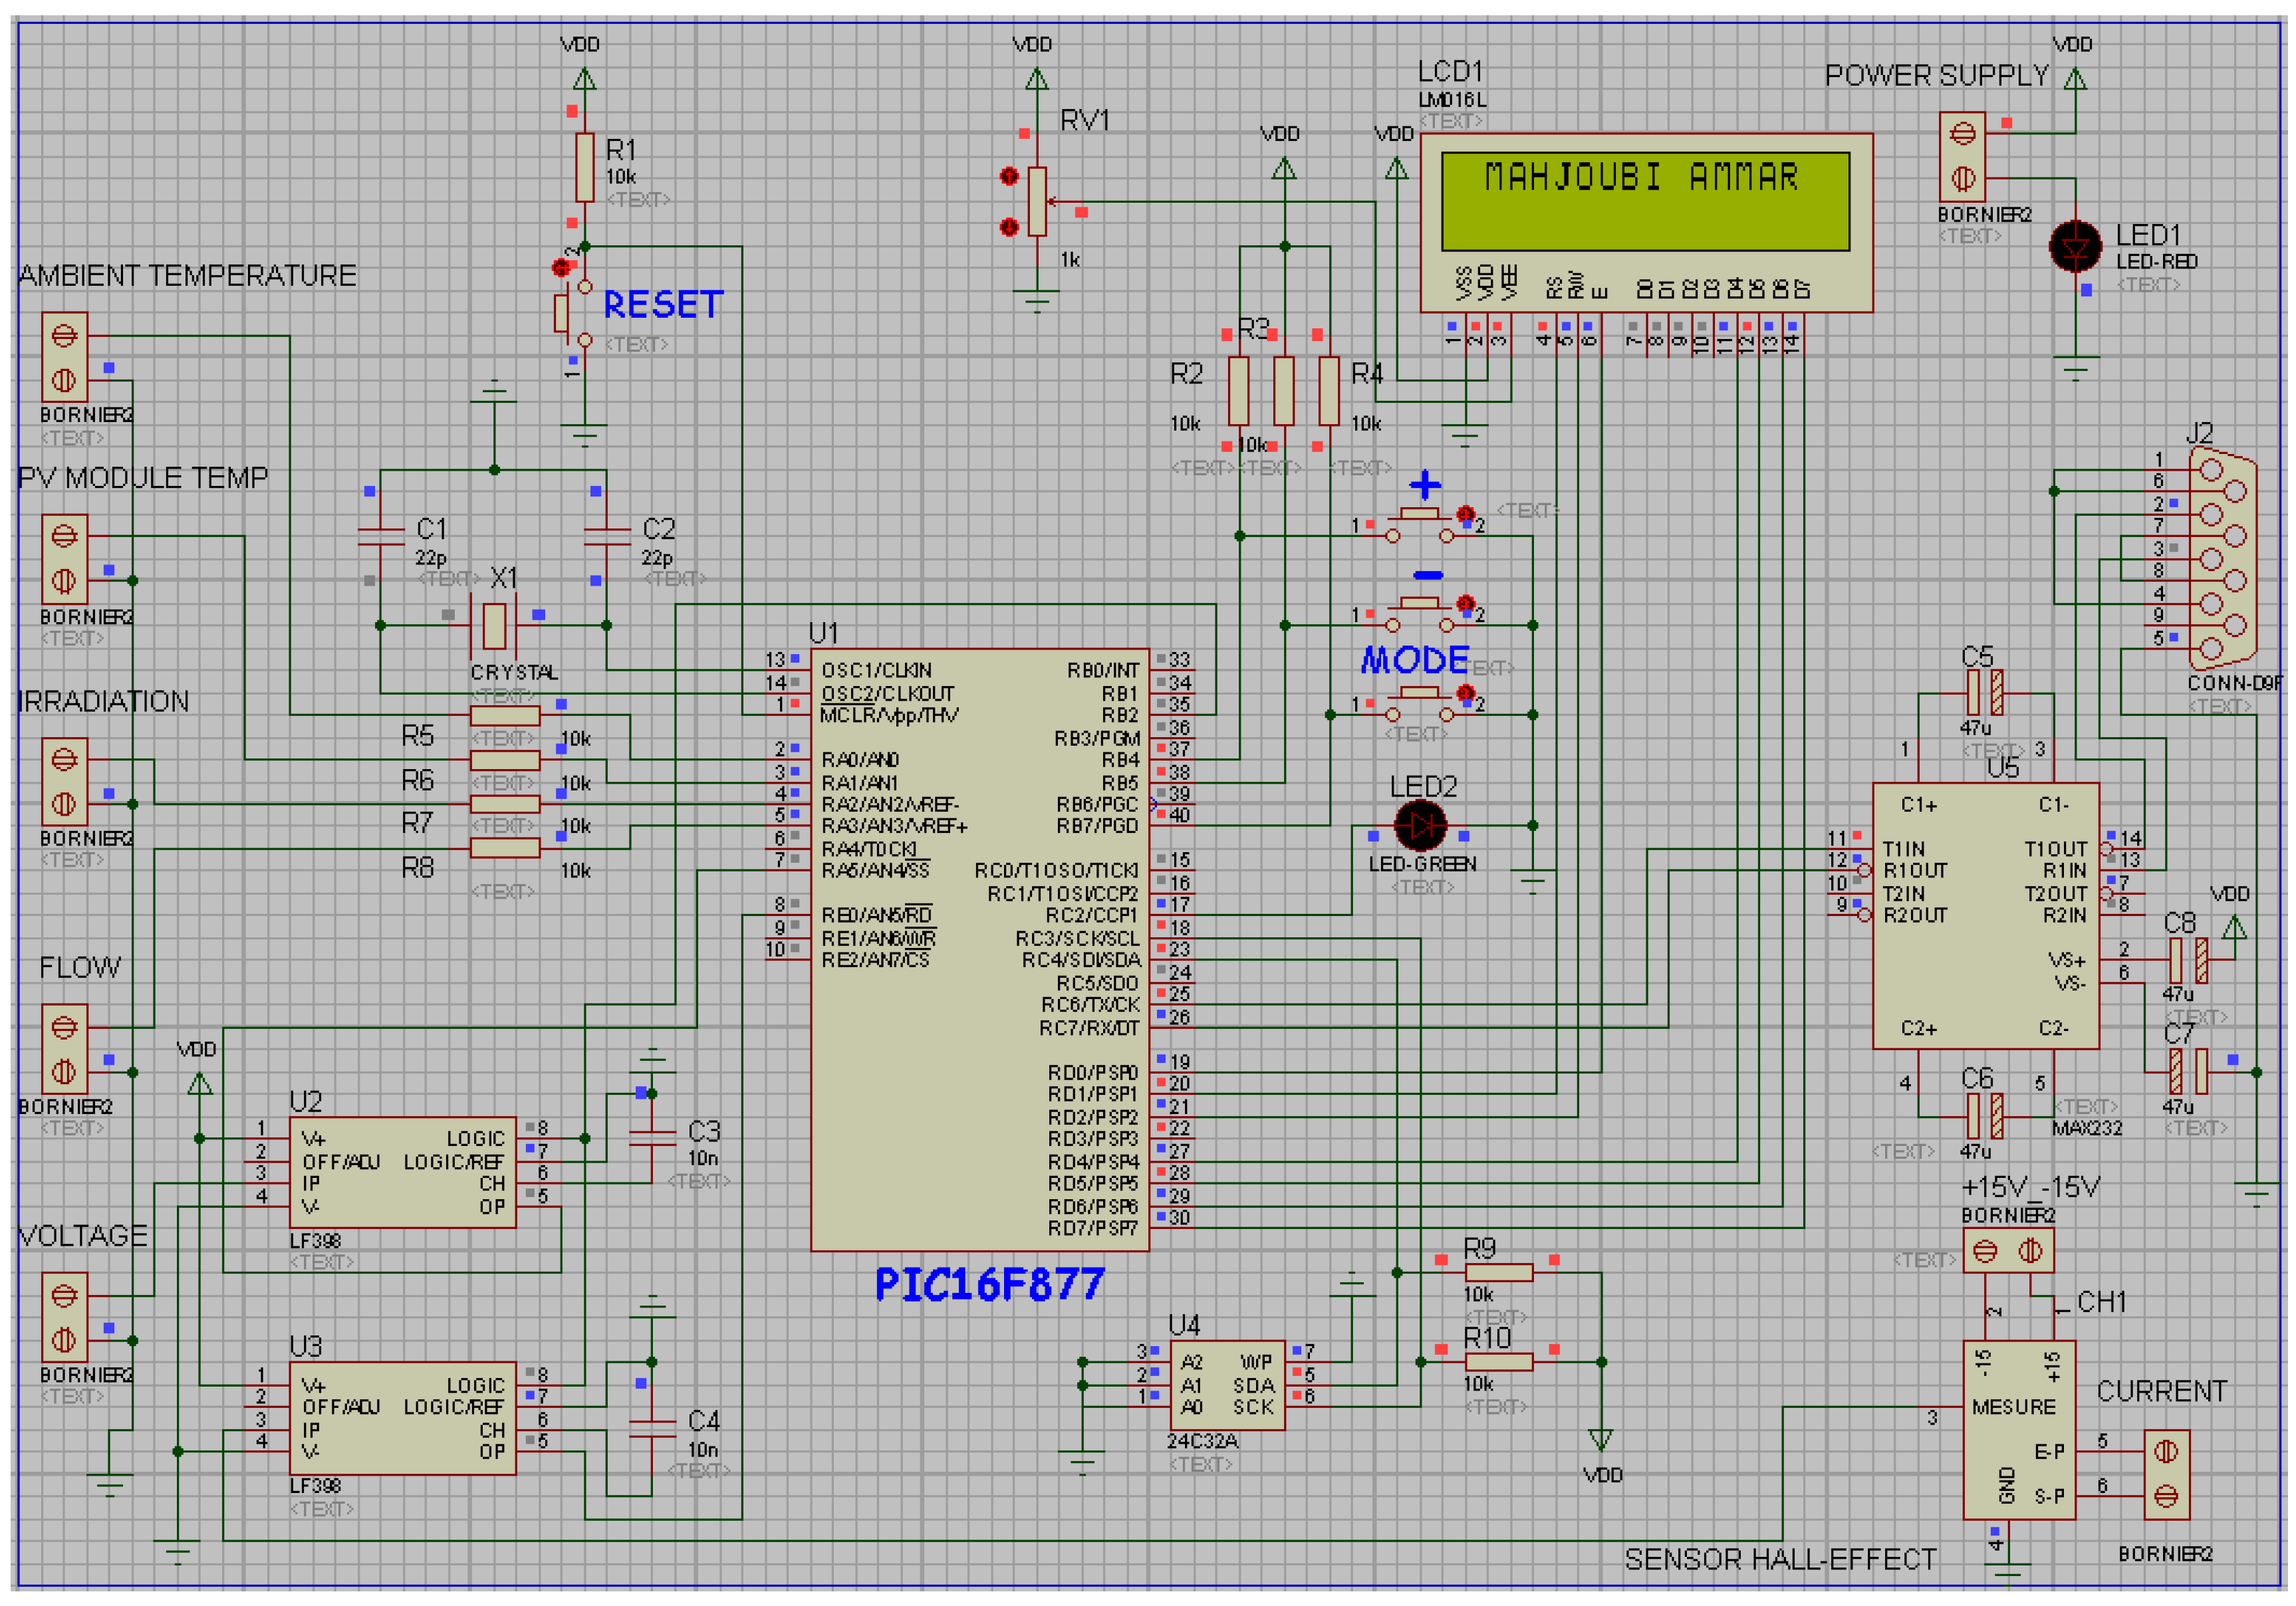
3.1. Description of the Developed Data Logger

| Quantity | References | Value |
|---|---|---|
| Resistors | ||
| 10 | R1–R10 | 10 kΩ |
| 1 | RV1 | 1 kΩ |
| Capacitors | ||
| 2 | C1, C2 | 22 pF |
| 2 | C3, C4 | 10 nF |
| 4 | C5–C8 | 47 µF |
| Integrated Circuits | ||
| 1 | U1 | PIC16F877 |
| 2 | U2, U3 | LF398 |
| 1 | U4 | MAX232 |
| 1 | U5 | 24C32A |
| Miscellaneous | ||
| 8 | +15_−15 V, Power supply, Ambient temperature, PV module temperature, Irradiation, Flow rate, Voltage, Current | Bornier2 |
| 1 | Ch1 | Sensor hall effect |
| 1 | J2 | DB9HF |
| 1 | LCD | LM016L |
| 5 | Reset, start, +, −, mode | Button |
| 2 | Red, green | Led |
| 1 | X1 | 20 mHz |
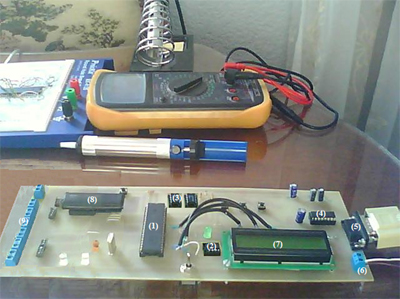
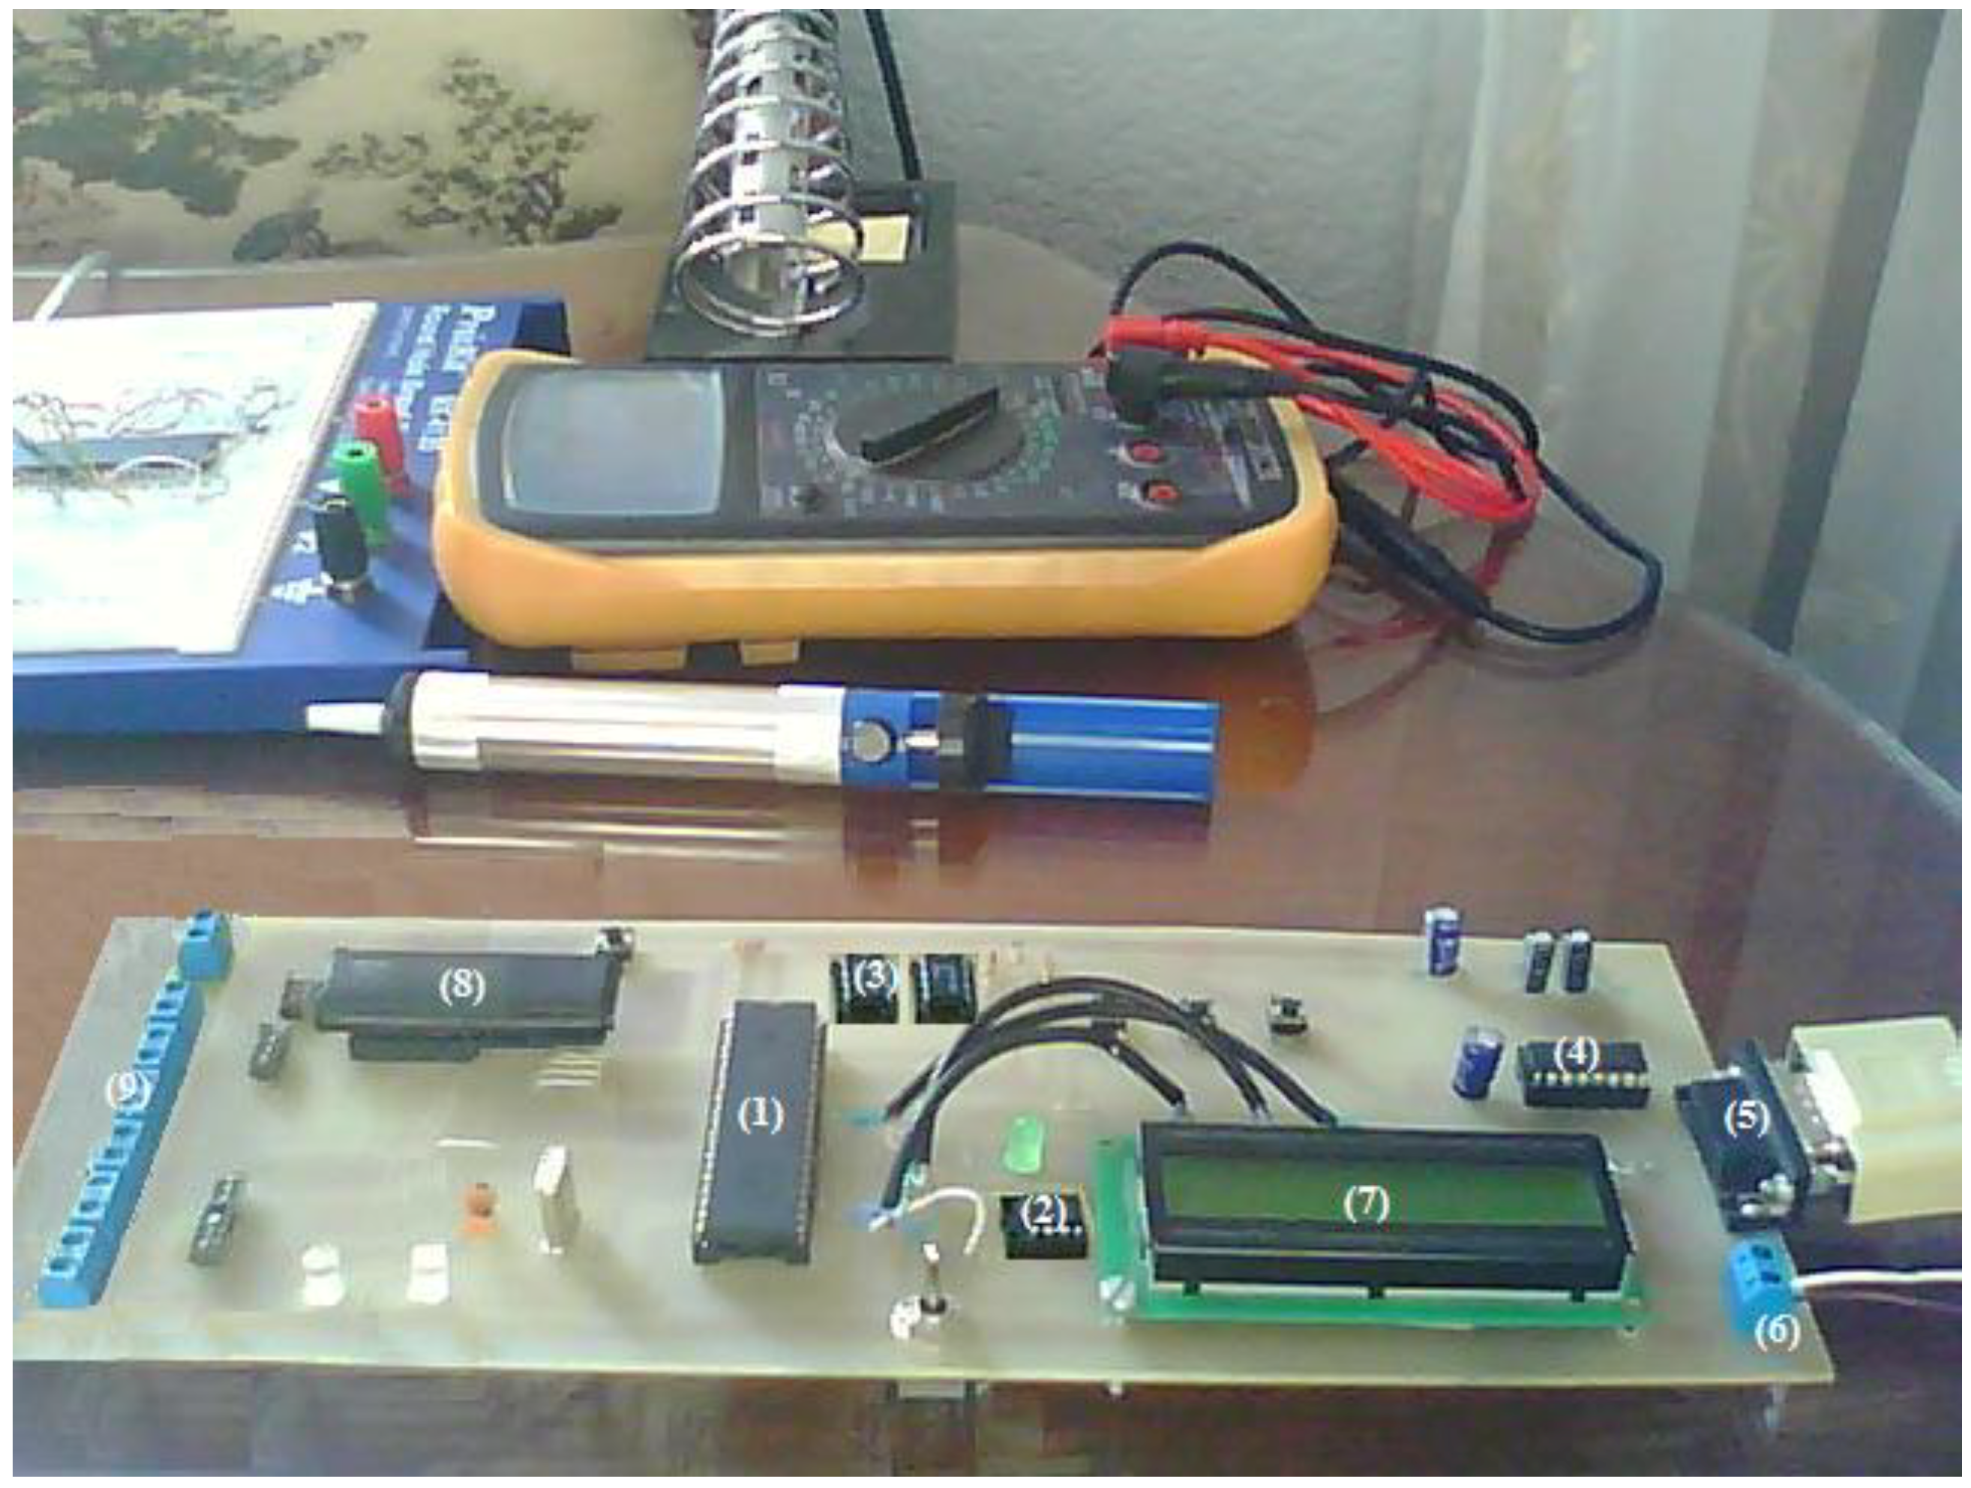
- (1)
- 16F877 Microcontroller
- (2)
- External 24C32A EEPROM memory
- (3)
- LF398 Integrated Circuit
- (4)
- MAX 232 drivers/receivers
- (5)
- DB 9F connector
- (6)
- Power supply
- (7)
- LM016L LCD
- (8)
- Hall-Effect Sensor
- (9)
- Sensor Outputs

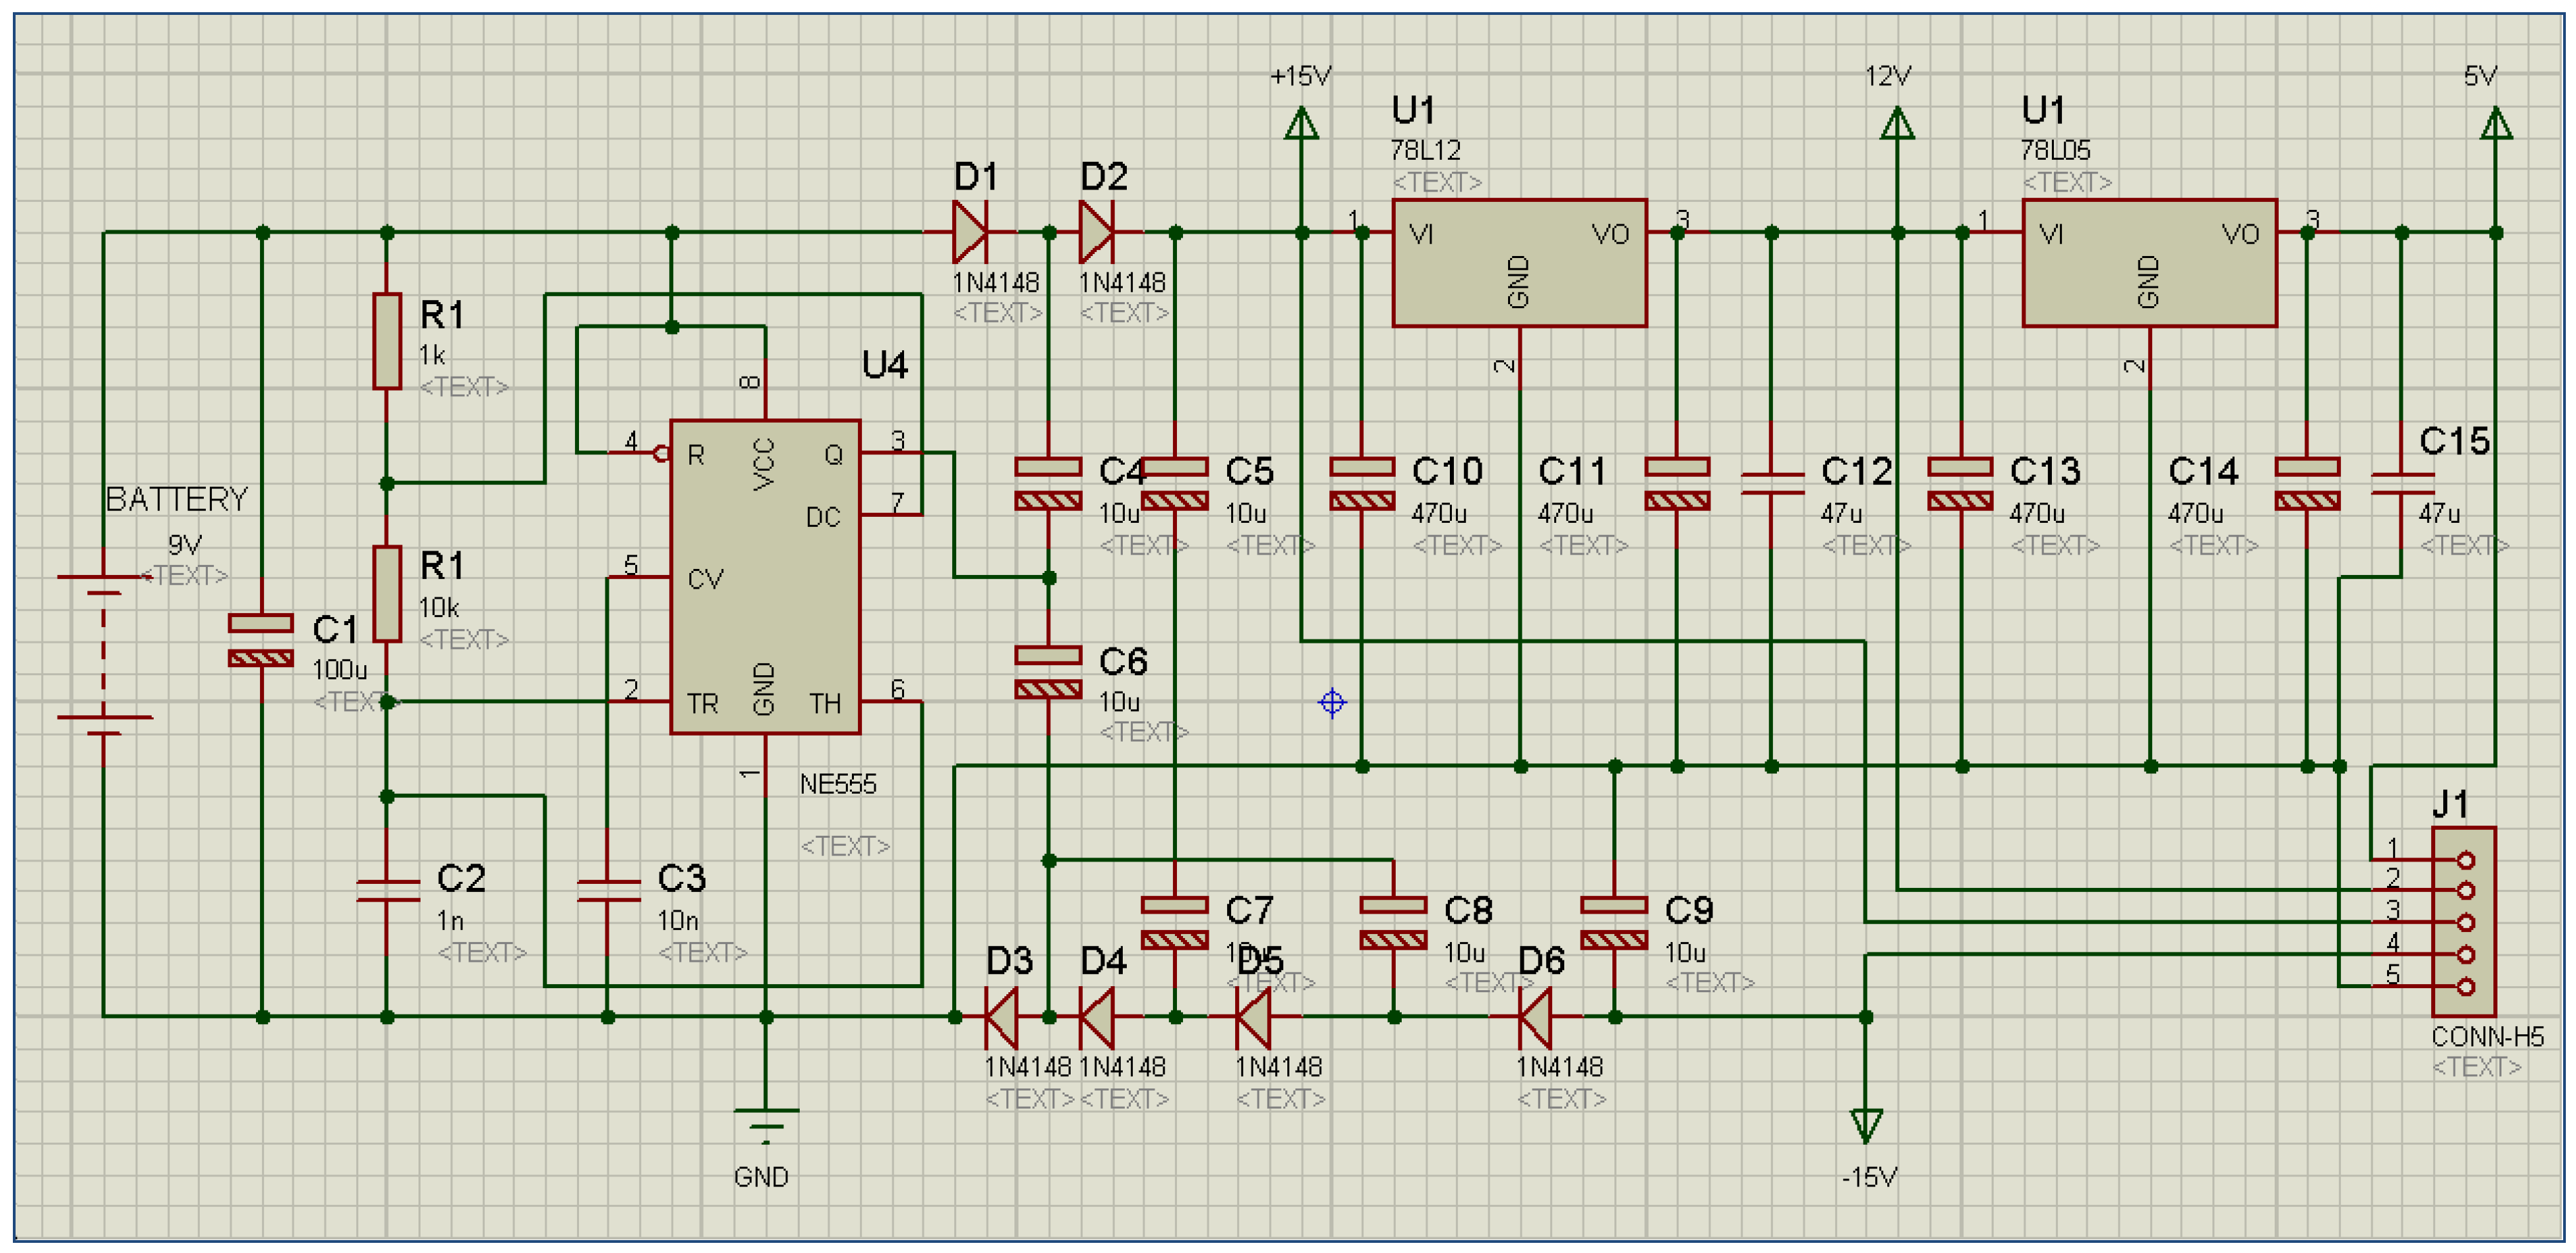
3.2. Power Supply
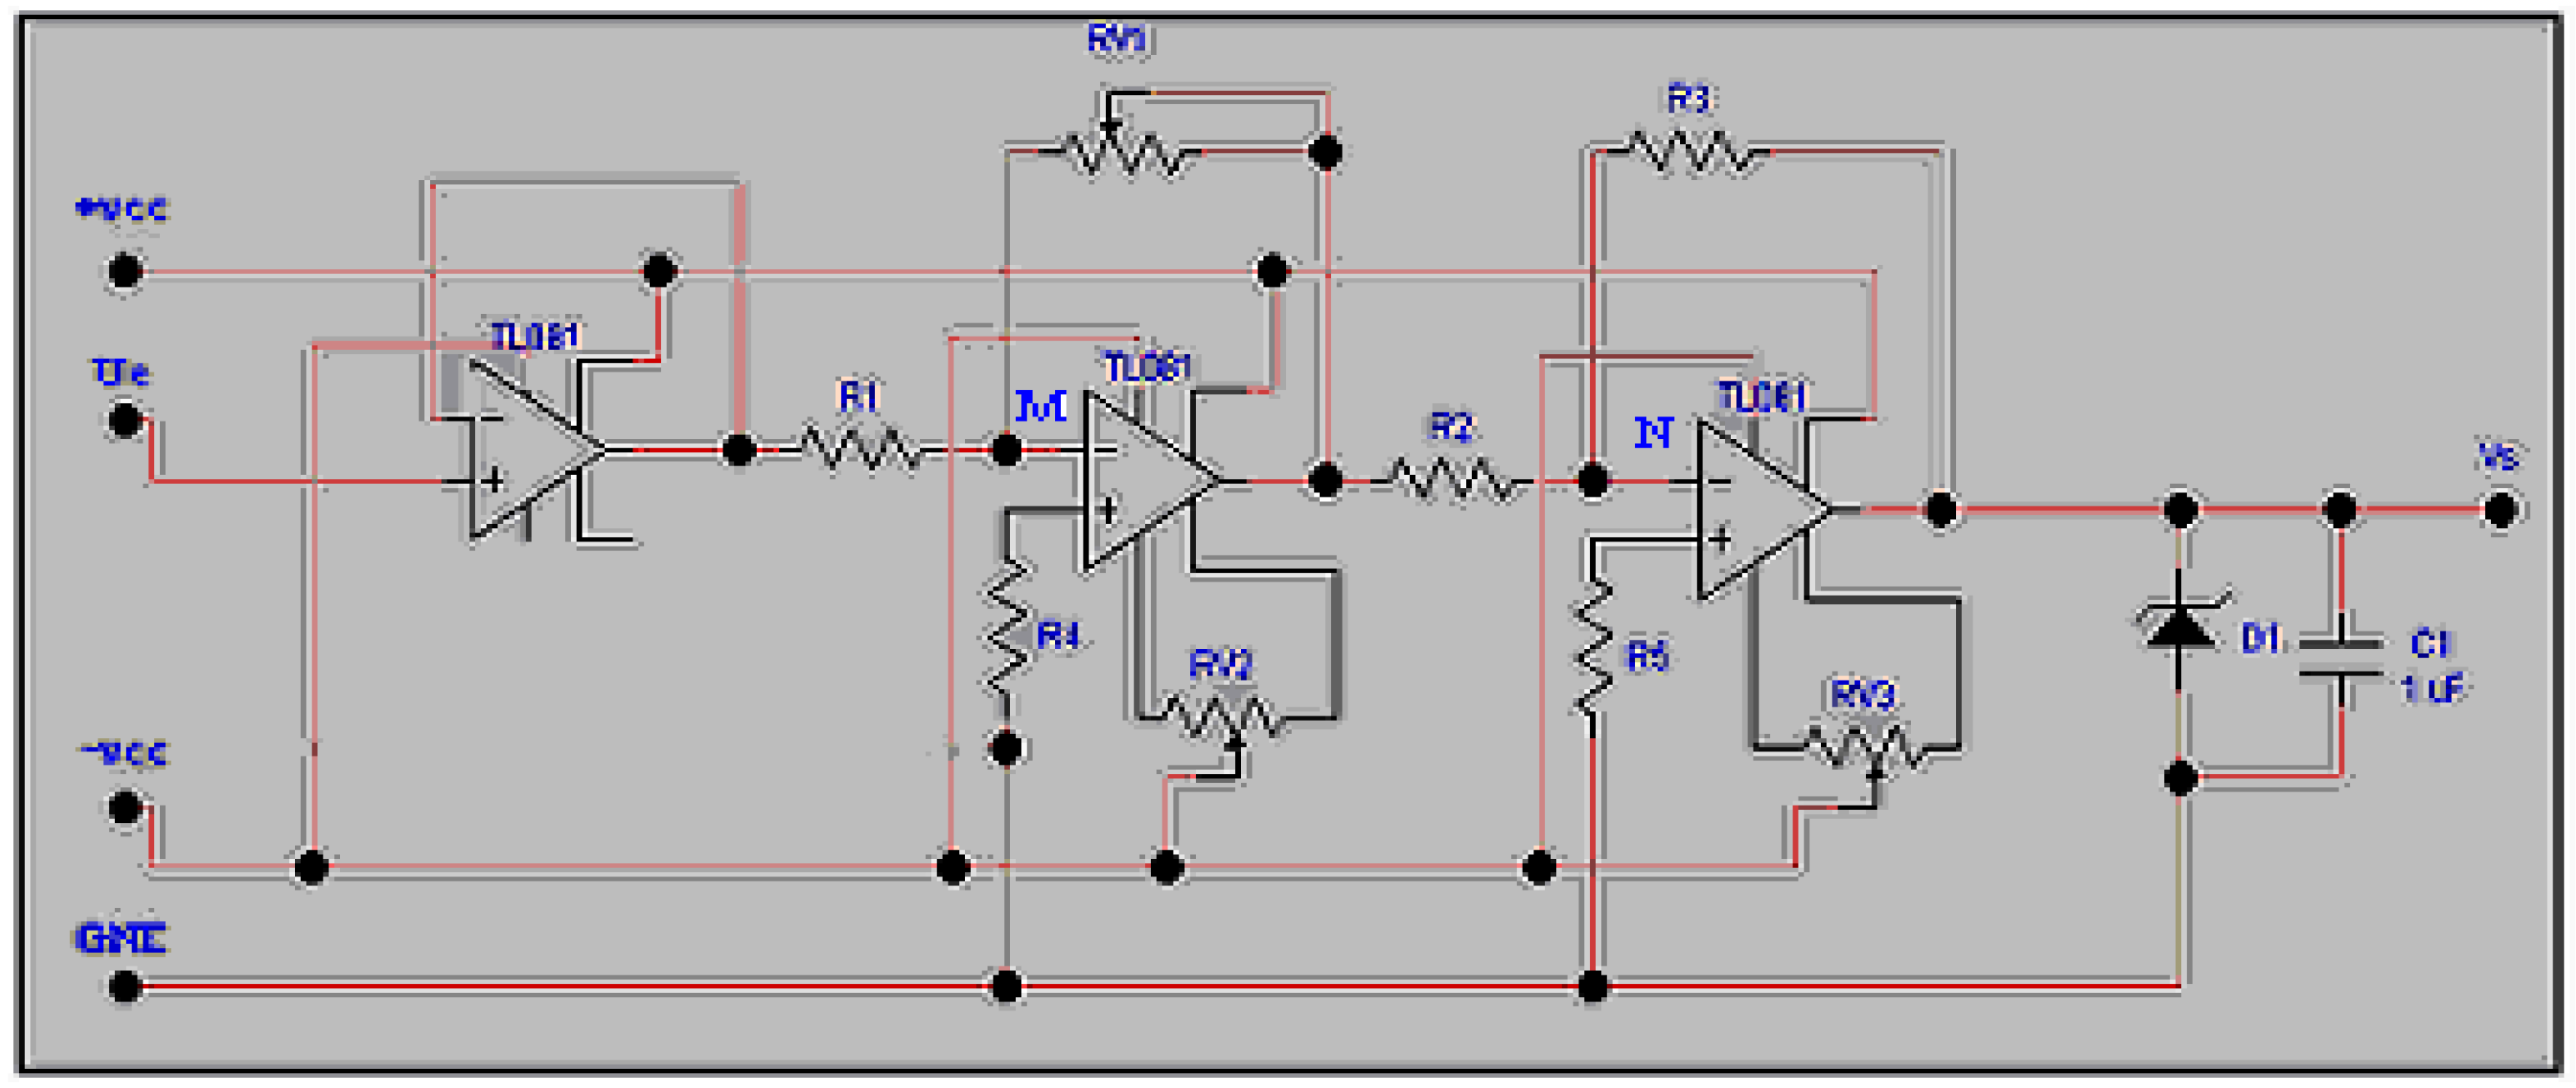
3.3. The Sensors and the Interface Circuits
3.3.1. Solar Irradiation Sensor
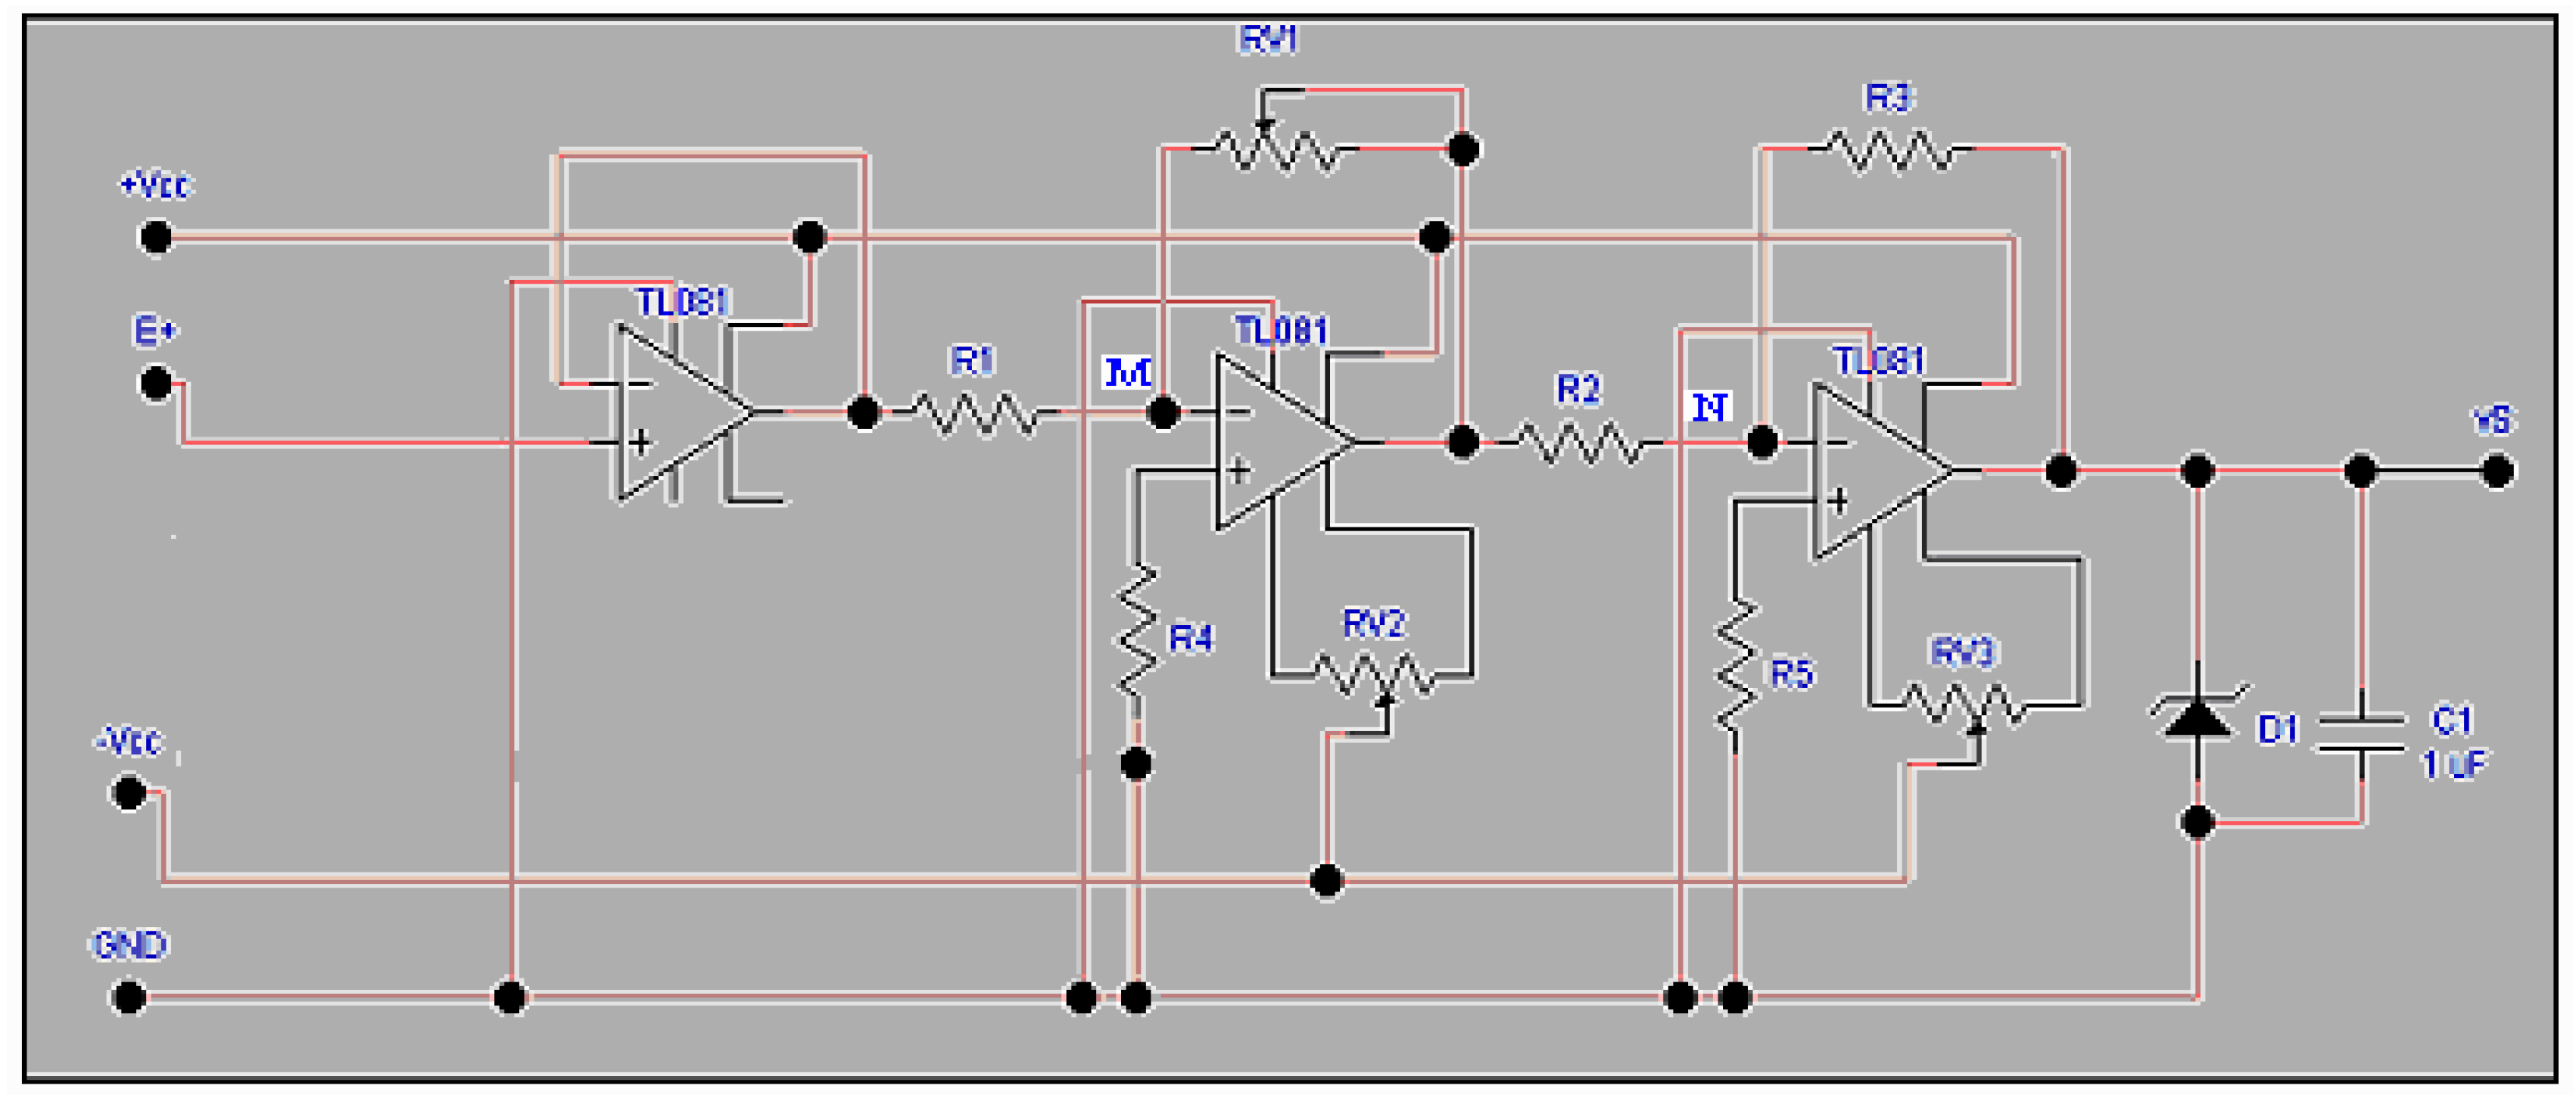
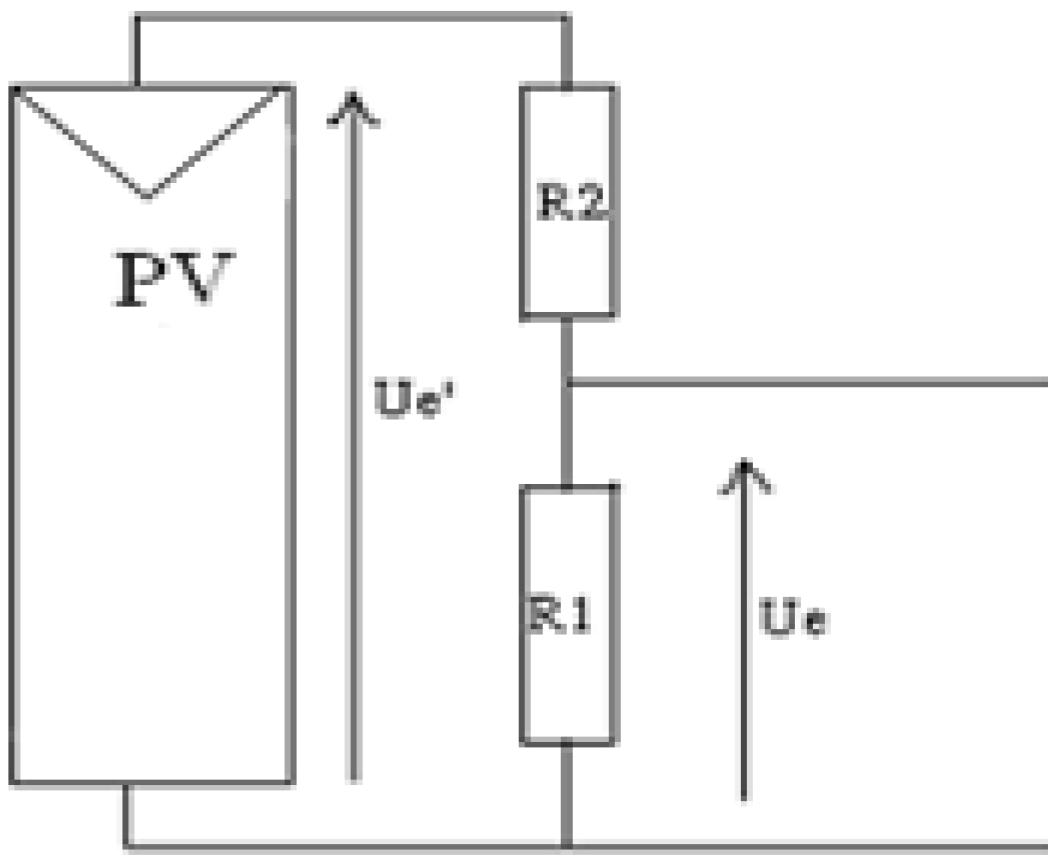
3.3.2. The Photovoltaic Voltage


3.3.3. The Temperature Sensor
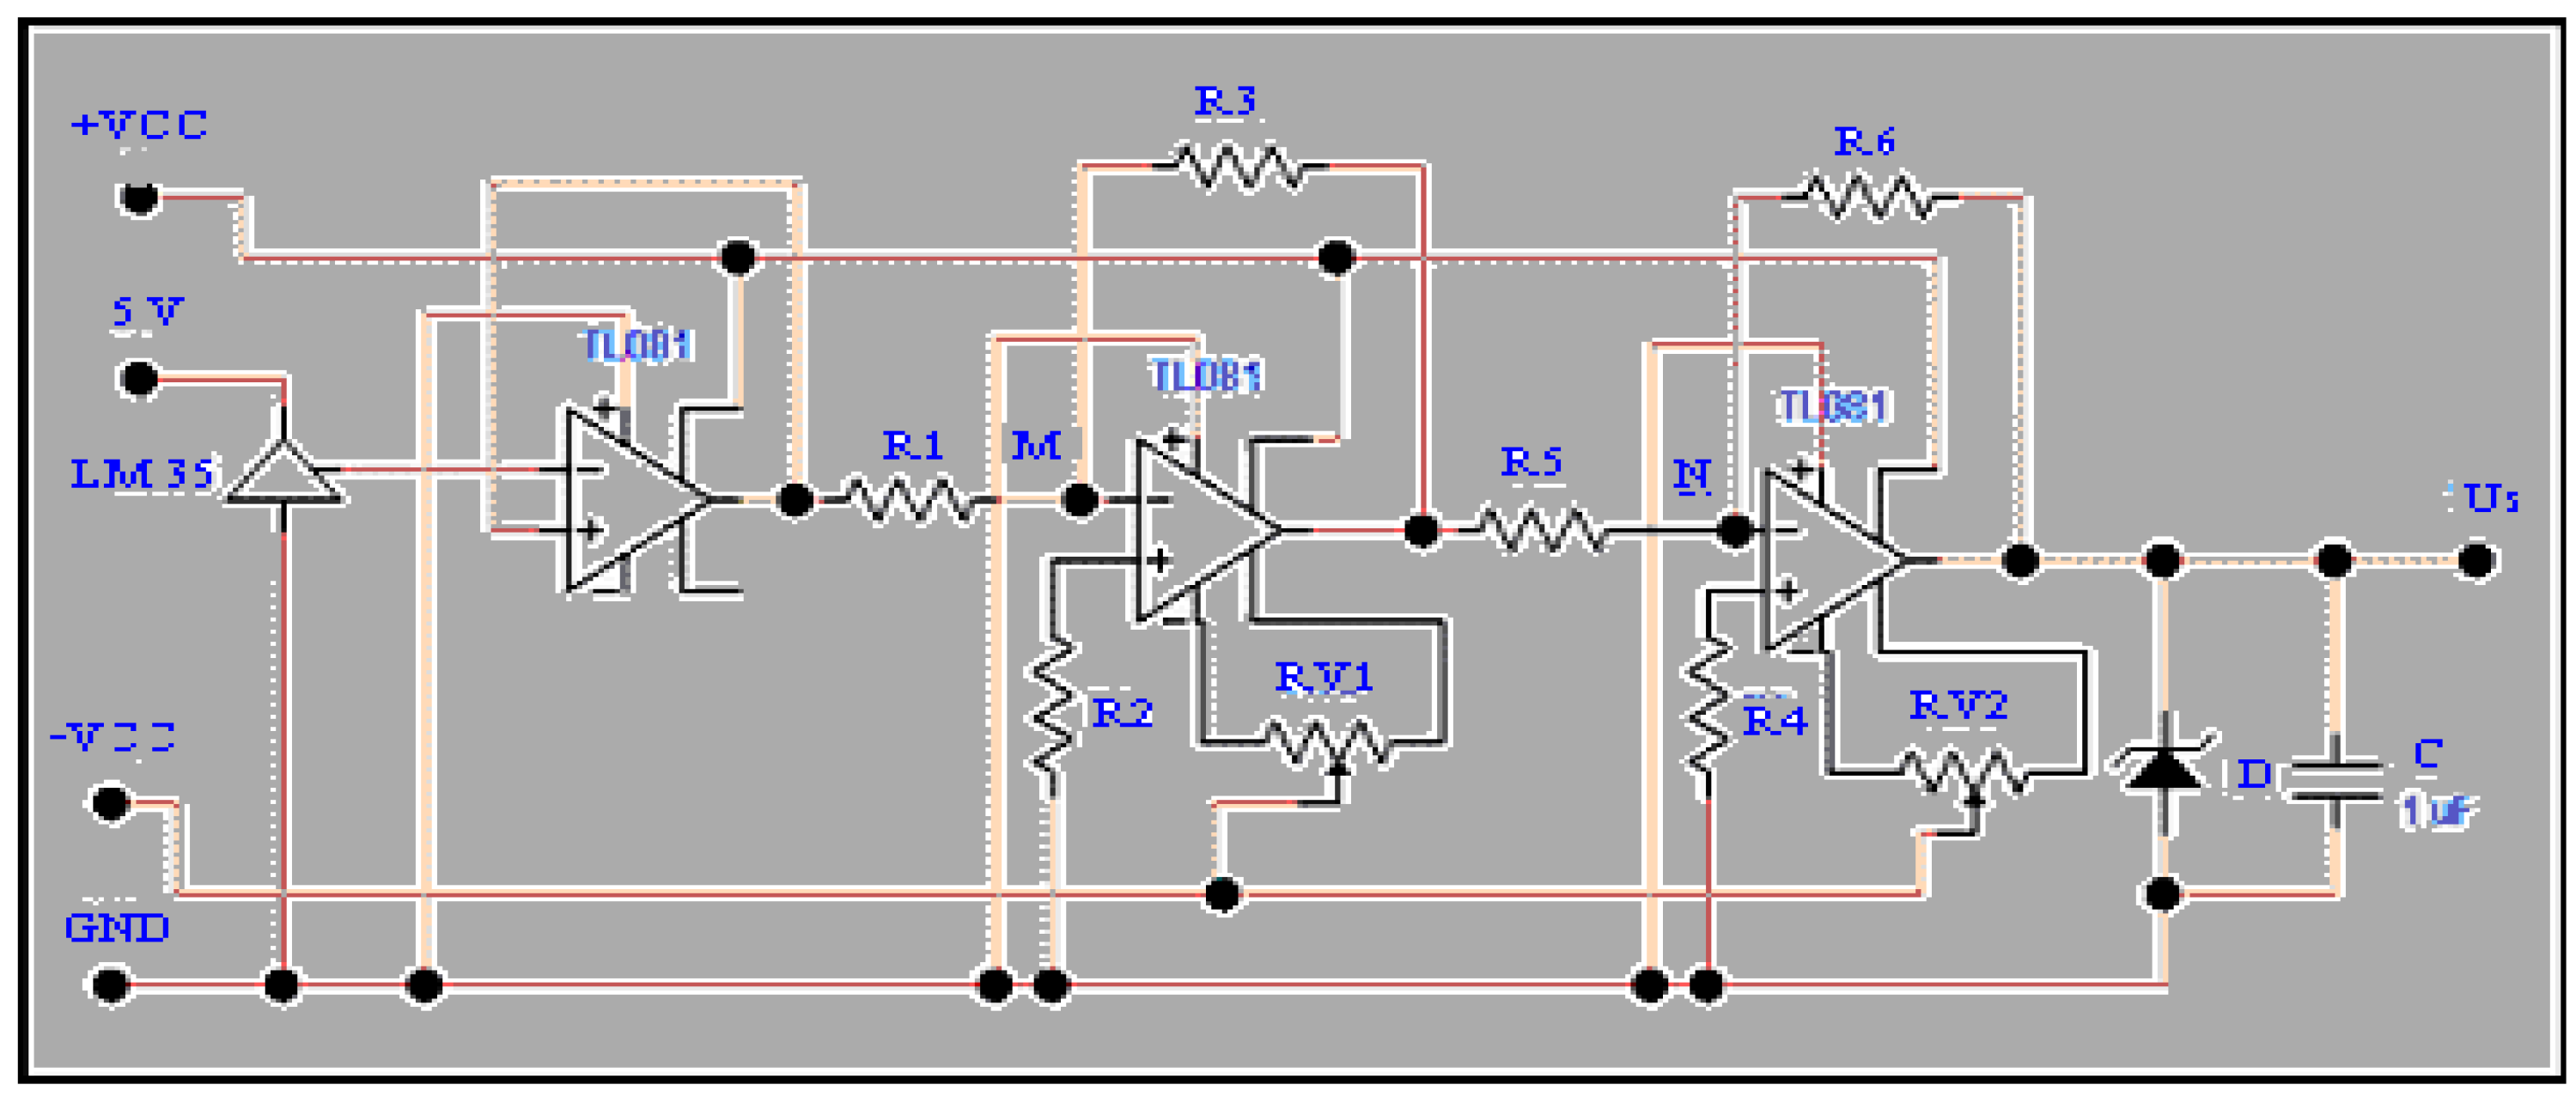
3.3.4. The Flow Rate Sensor
3.3.5. The Photovoltaic Current
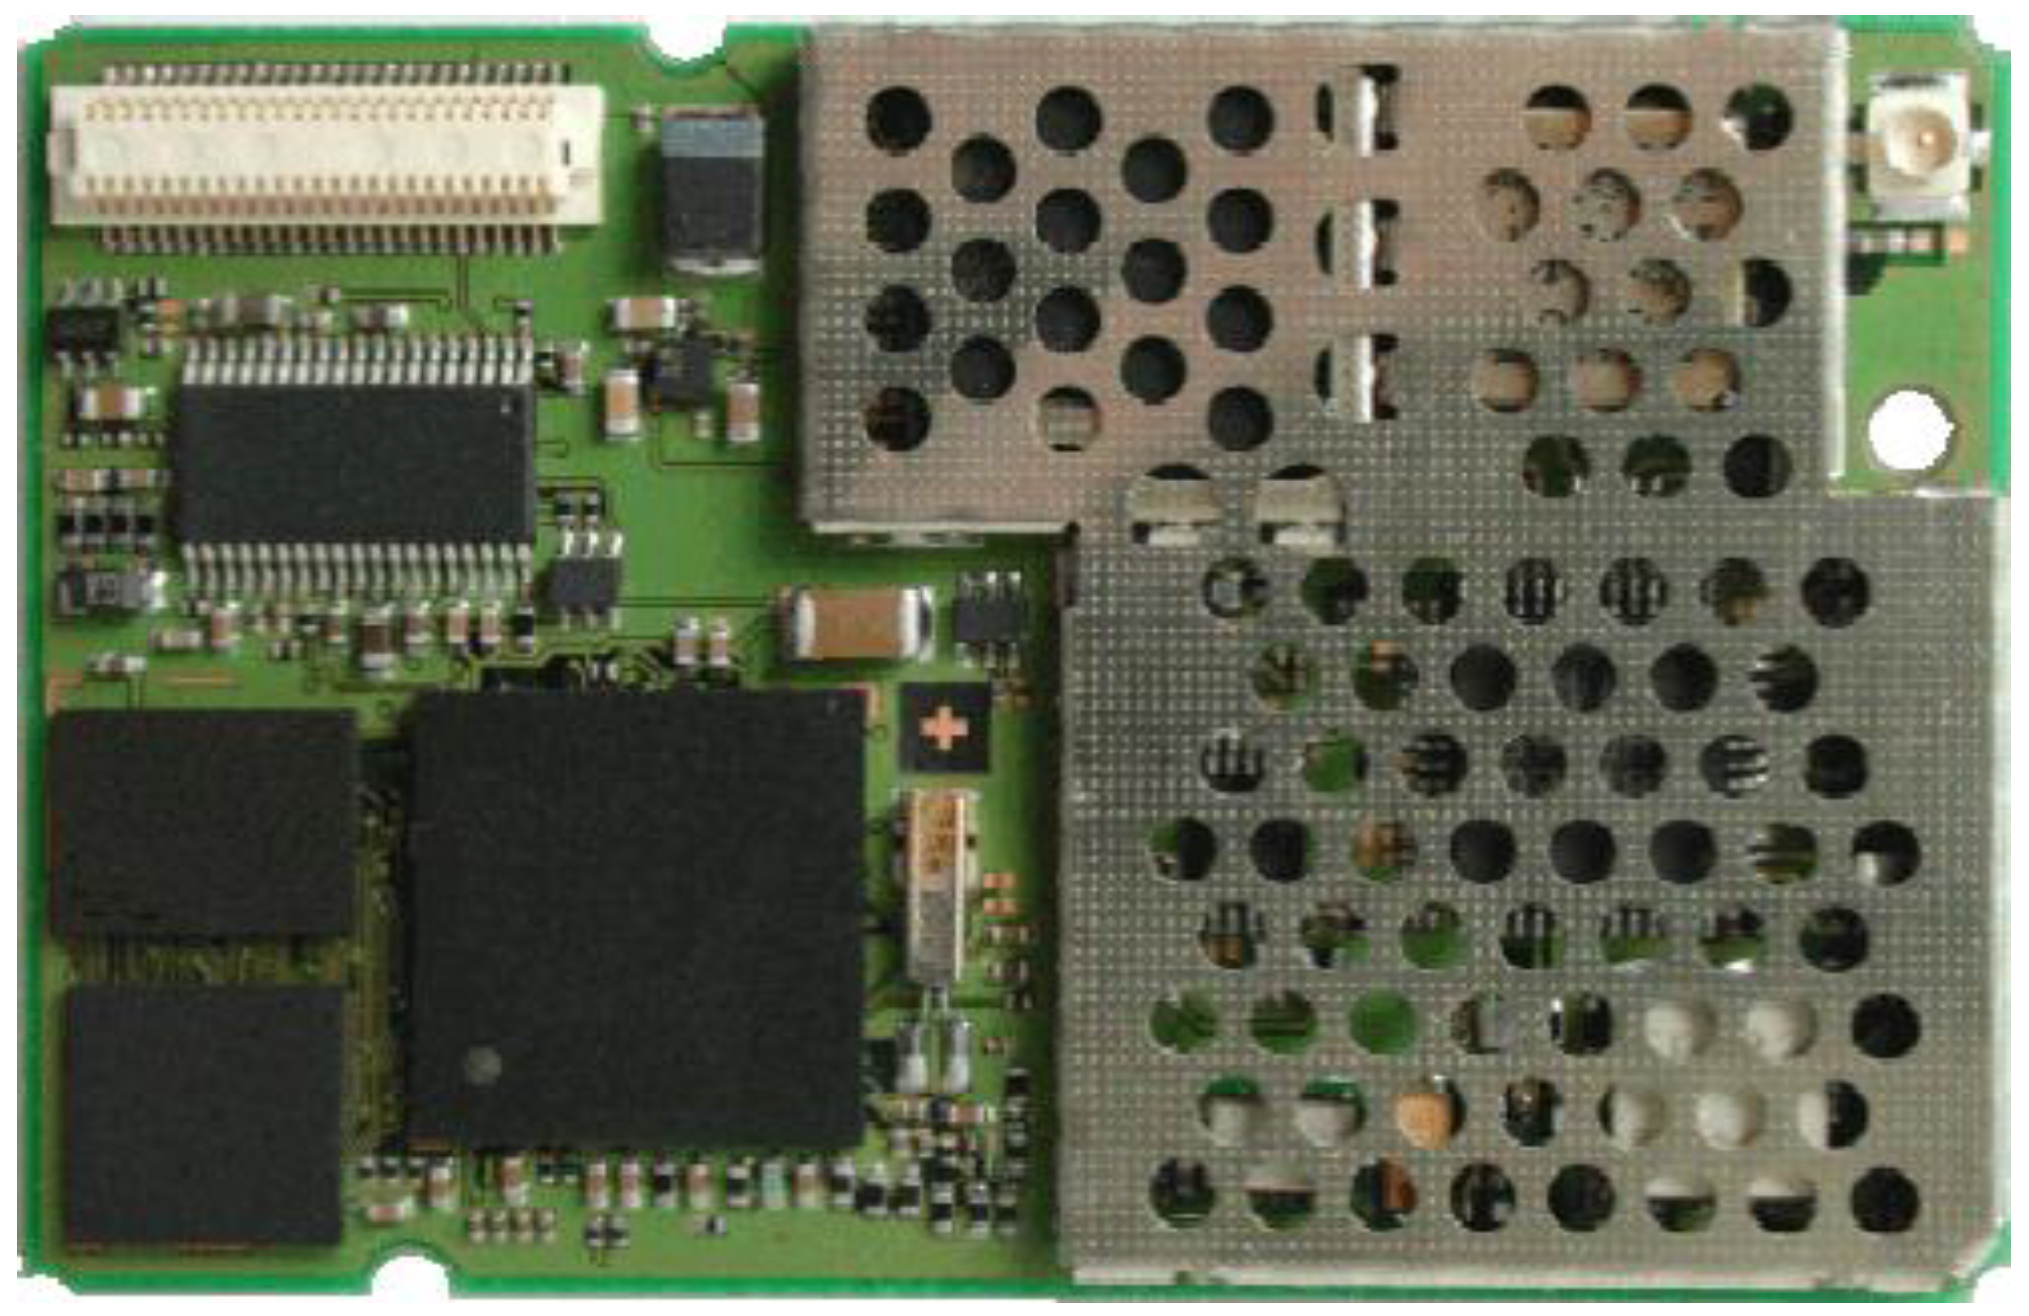
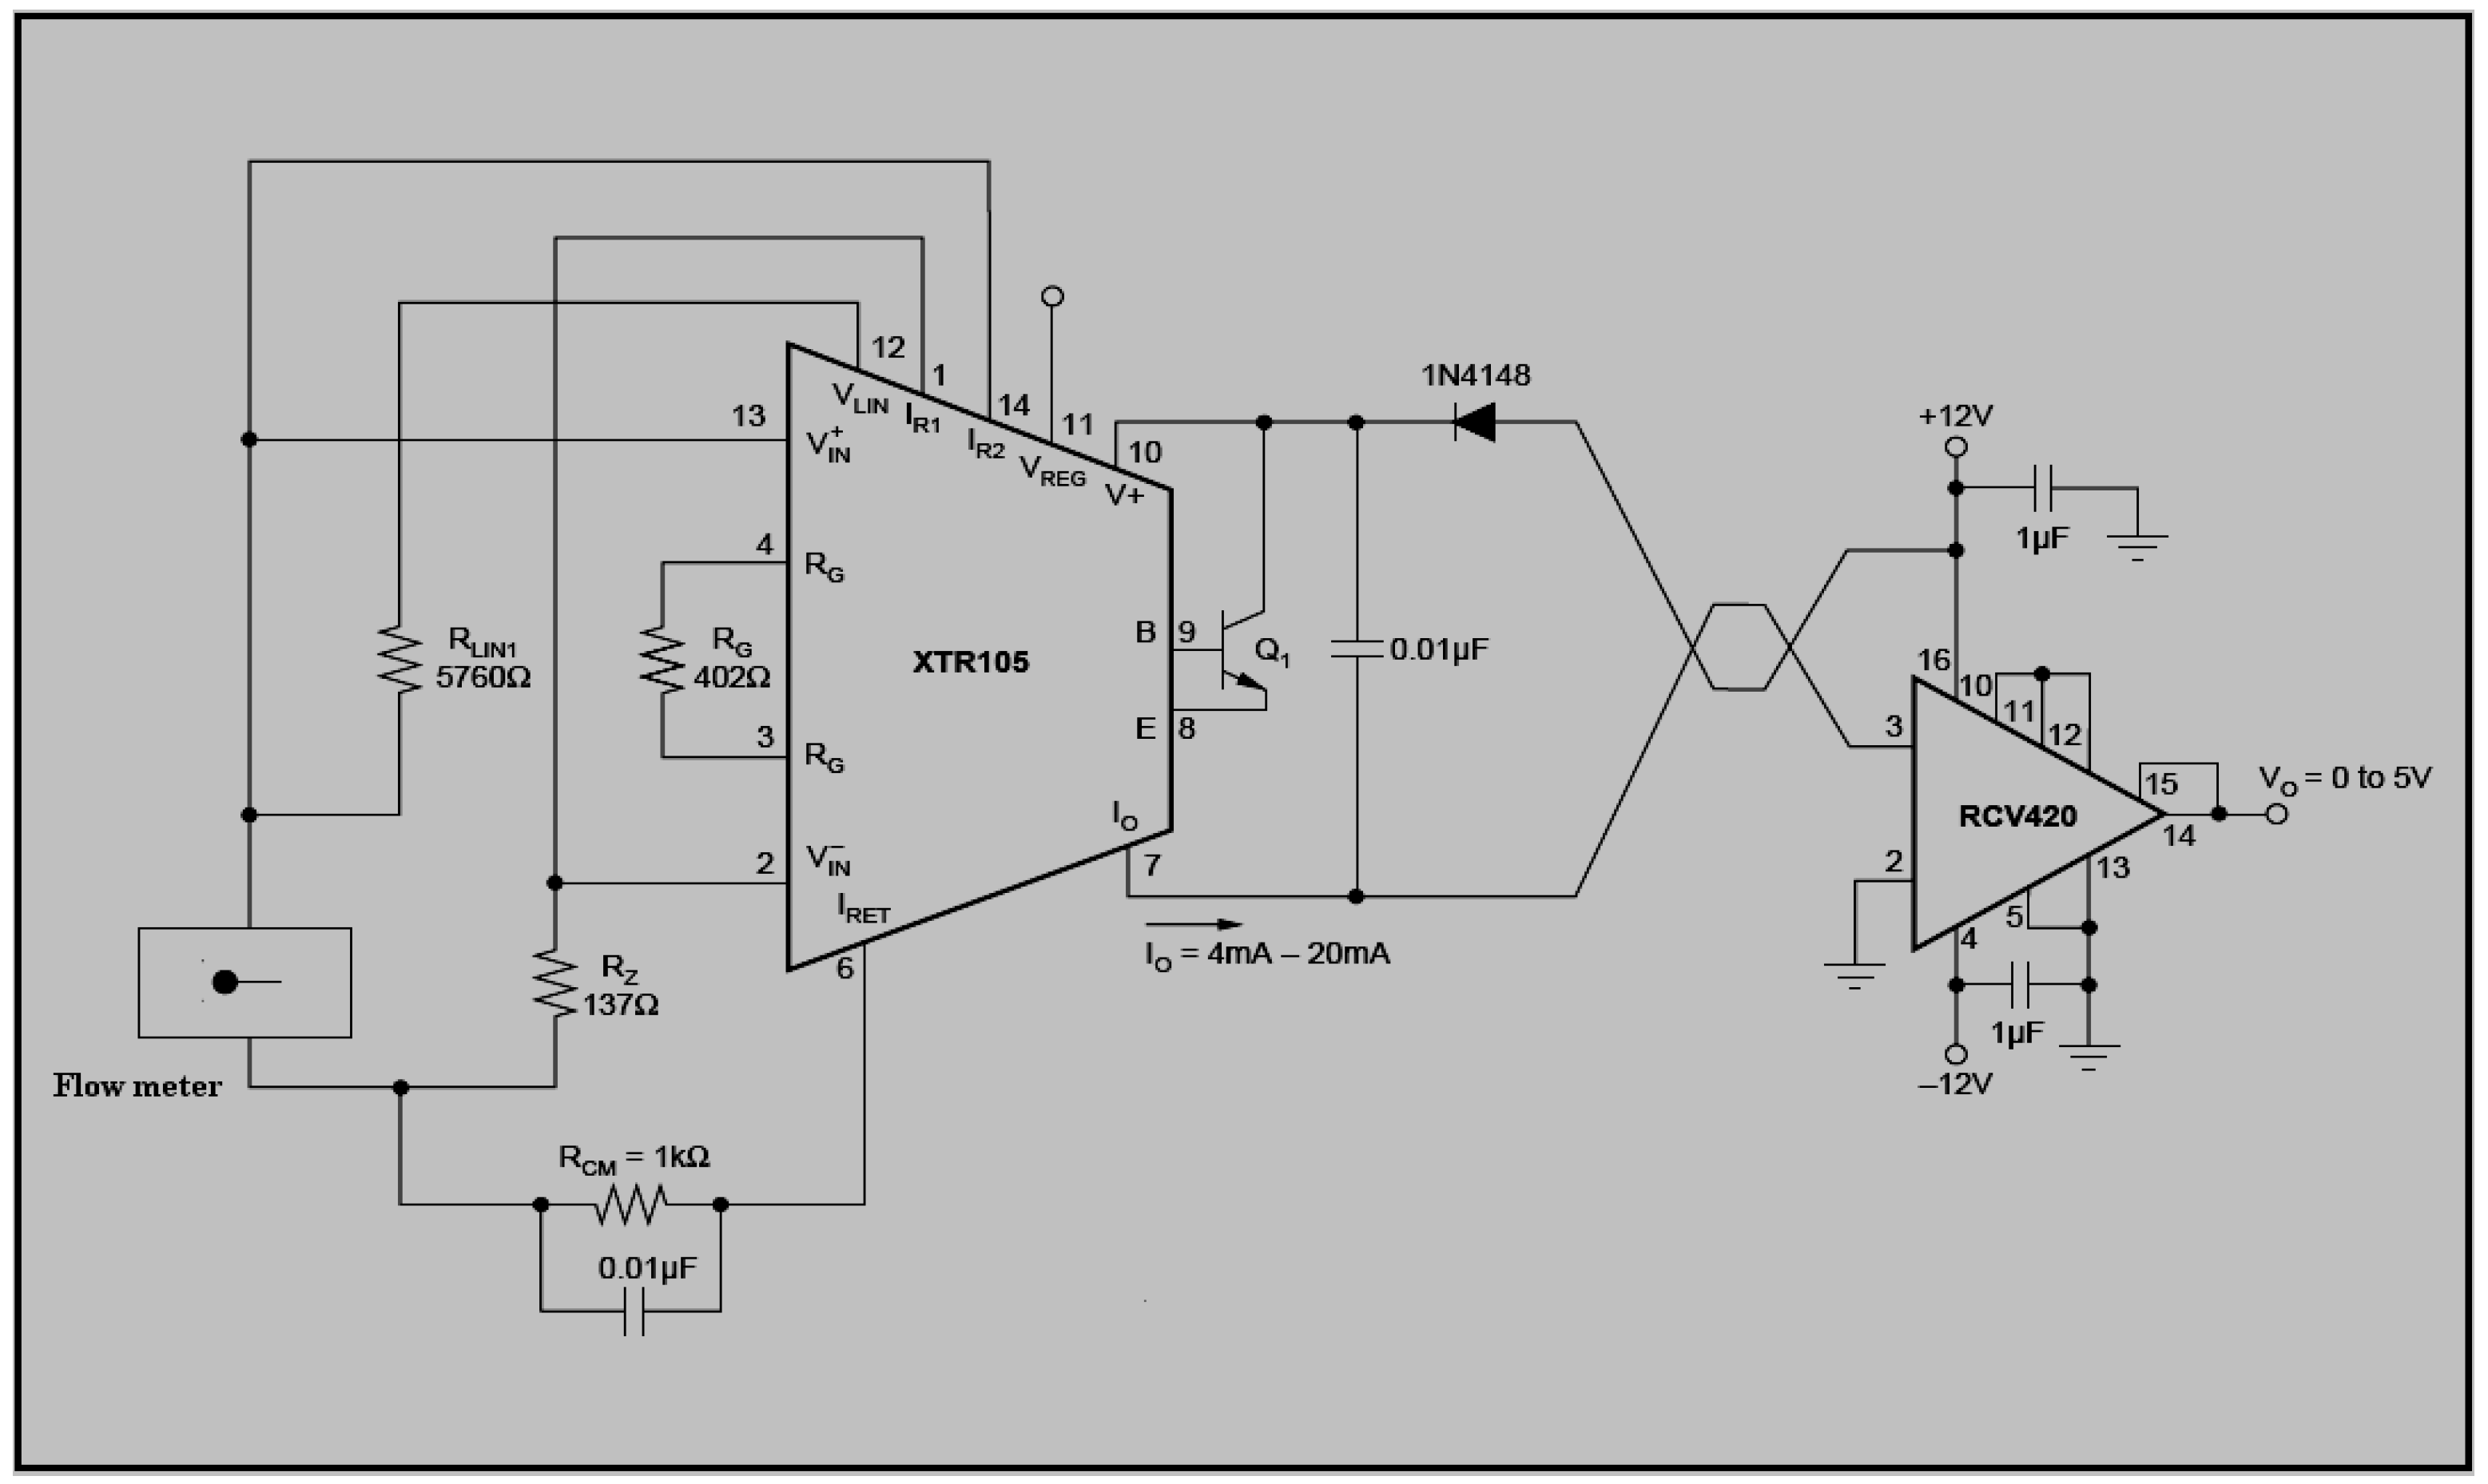
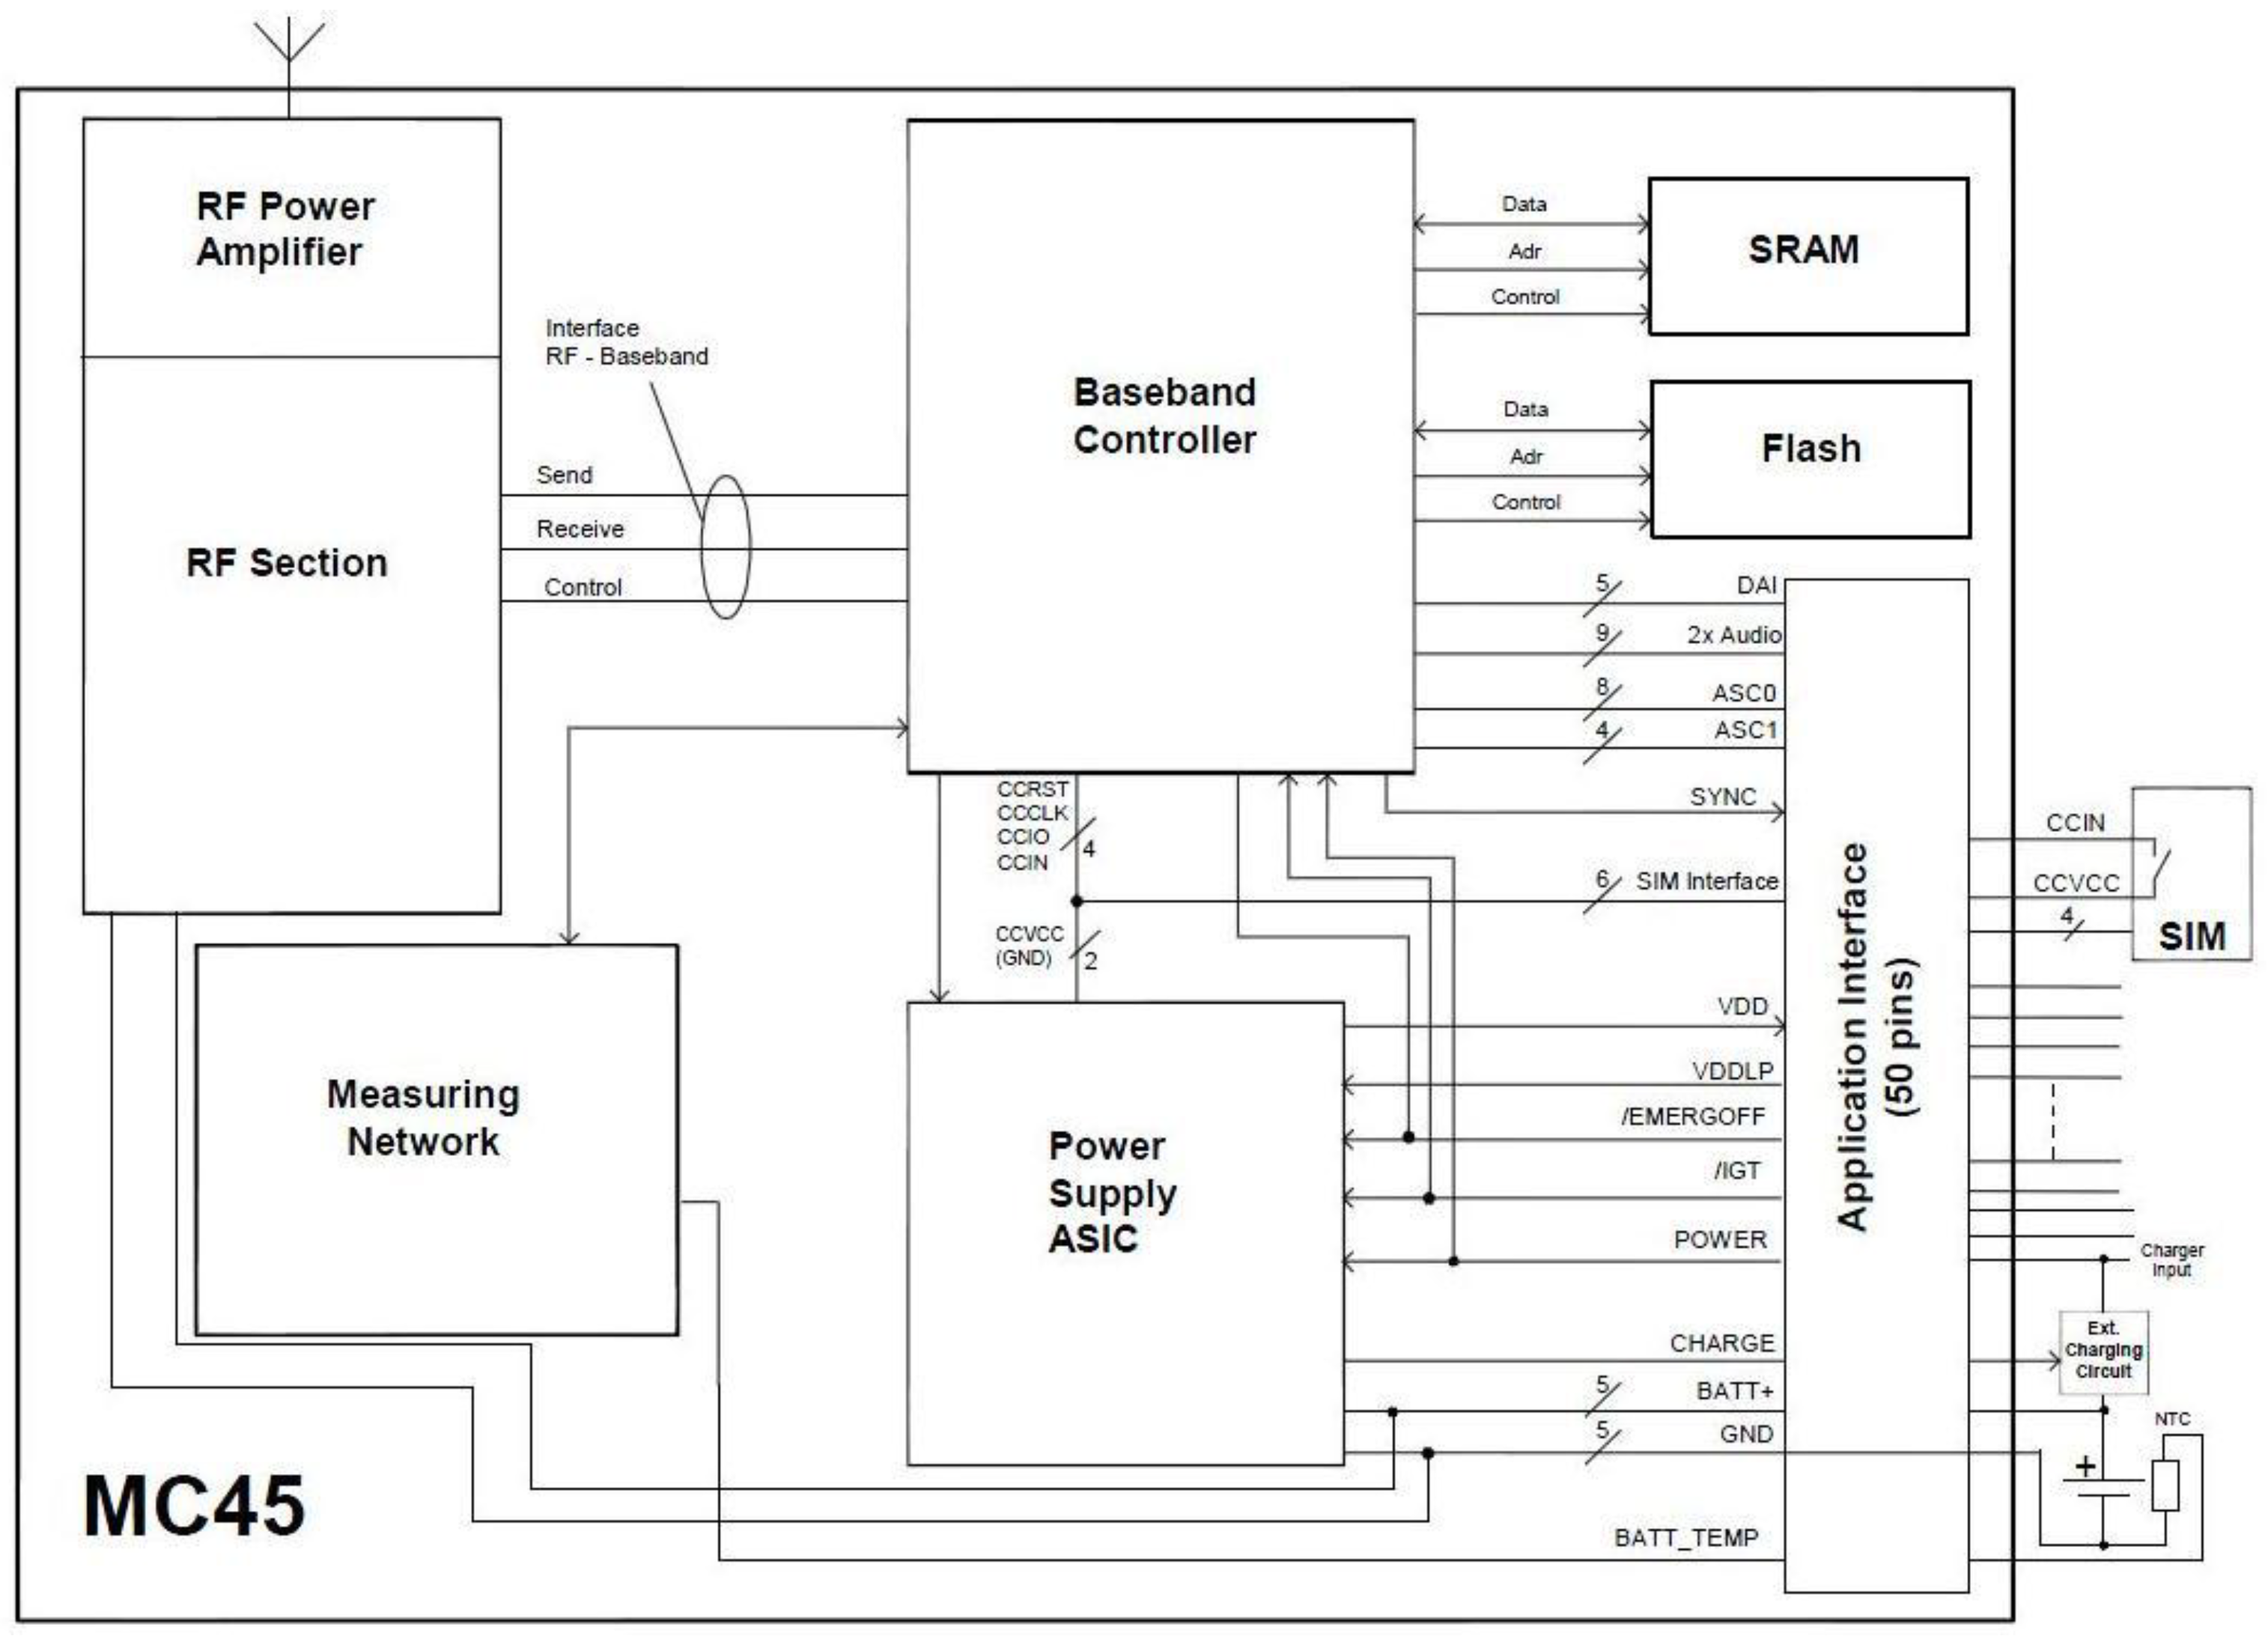
3.4. Remote Data Transmission

- •
- GSM/GPRS baseband block composed of: baseband controller operating at 26 MHz, ASIC power supply, flash, SRAM and application interface (board-to-board connector).
- •
- GSM RF block composed of: RF transceiver, RF power amplifier and RF front end (antenna connector).

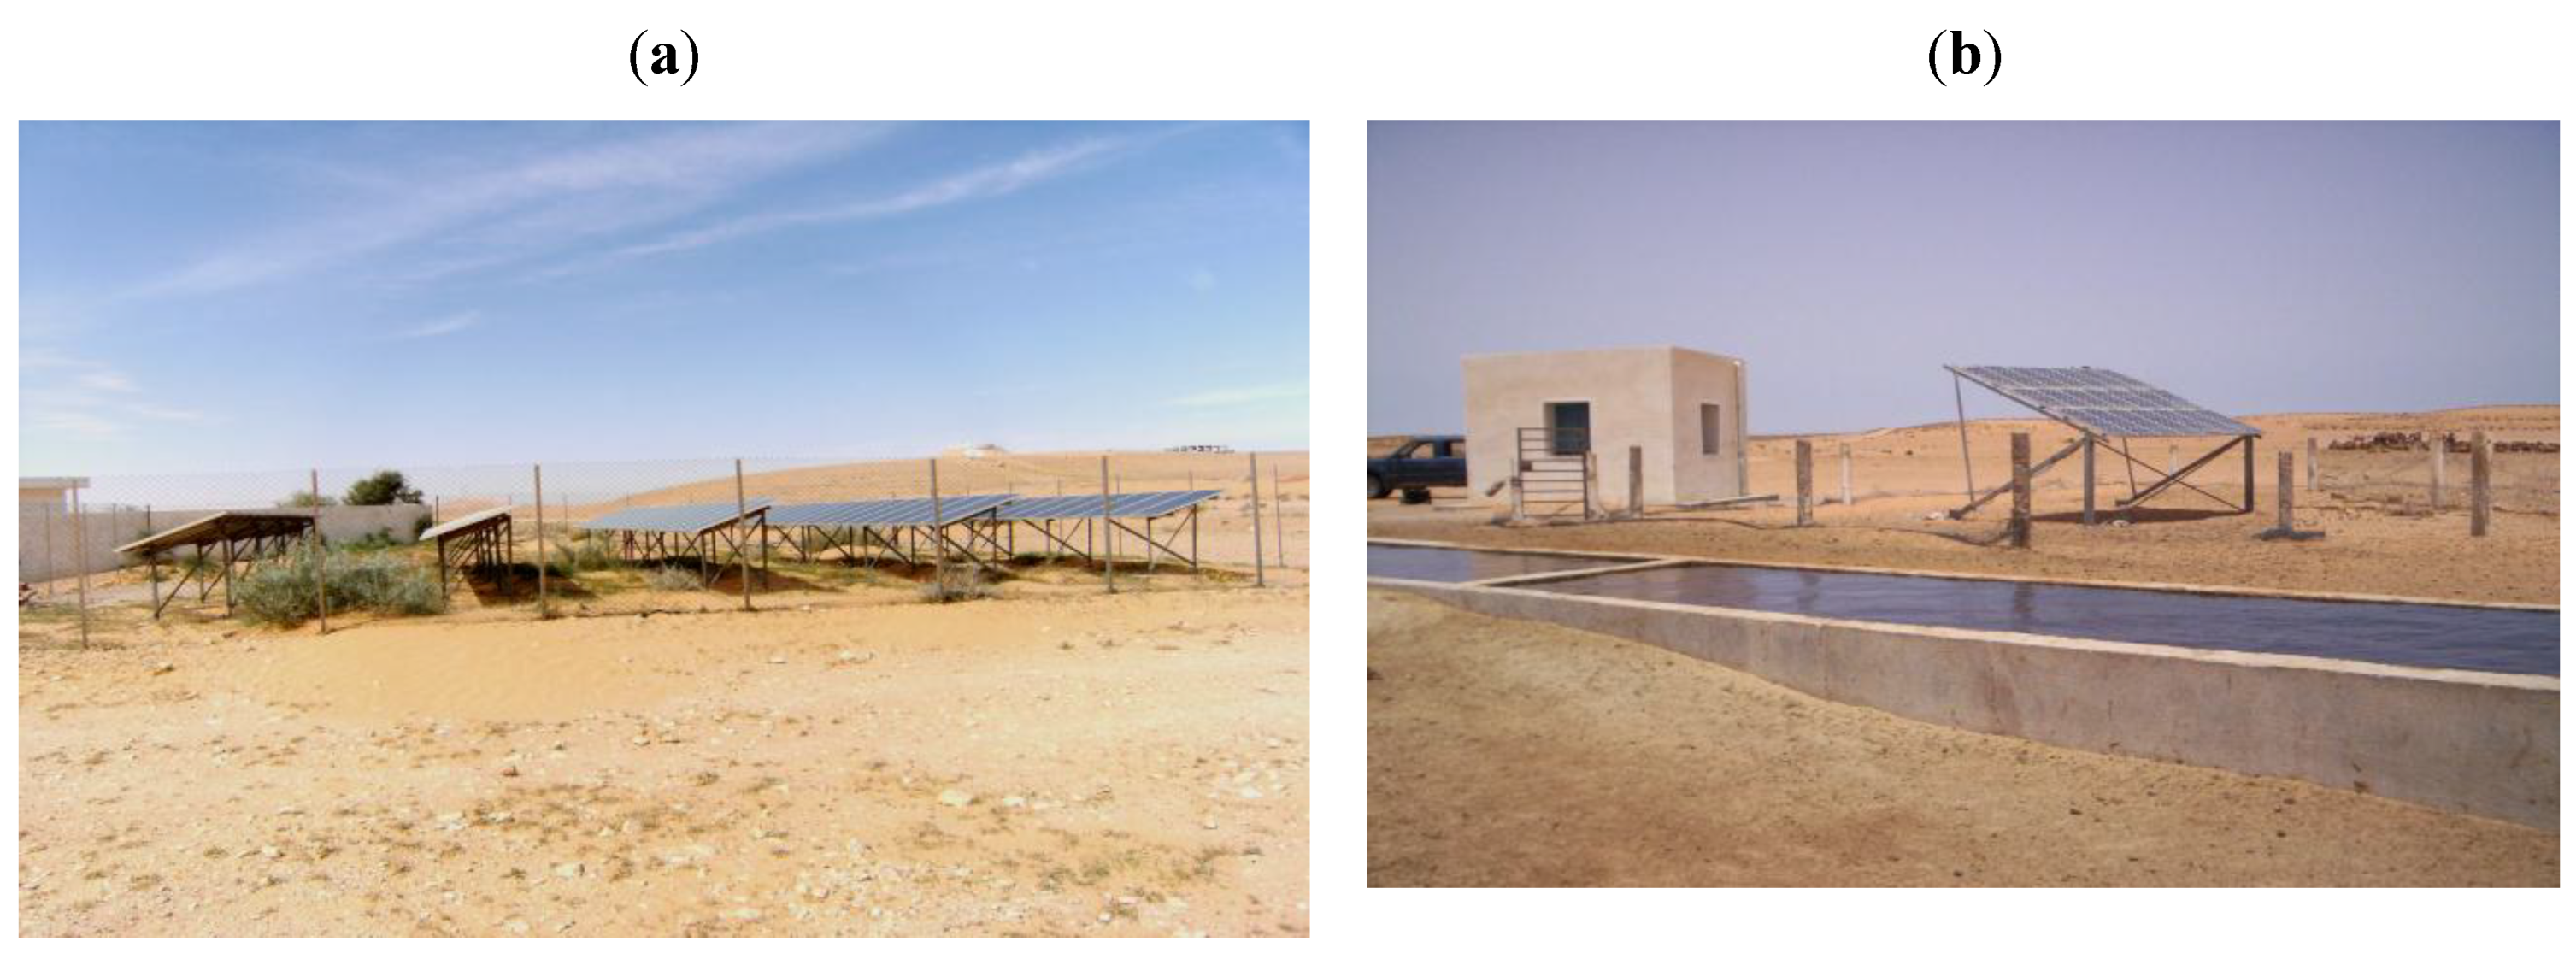
4. Description of the PV Water Pumping Systems
| Station | Bel Khchab | Om Chraket |
|---|---|---|
| Modules | monocrystal (100 Wc, 24 V) | monocrystal (65 Wc, 12 V) |
| PV array area (m2) | 85 | 21 |
| Nominal PV module efficiency (%) | 14 | 14 |
| Miscellaneous PV array losses (%) | 5 | 5 |
| Miscellaneous power conditioning losses (%) | 2 | 2 |
| Moto-Pump | Grundfos SP 8A-44 (7.5 kWh) | Grundfos SP 3A-10 (1.2 kWh) |
| Pump system efficiency (%) | 45 | 45 |
| Inverter | Telemecanique DC/AC | Grundfos SA-1500 DC/AC |
| Inverter efficiency (%) | 90 | 90 |
| HMT | 100 m | 40 m |
| Capacity storage tank | 500 m3 | 20 m3 |
| PV temperature coefficient (%/°C) | 0.4 | 0.4 |
| NOCT(°C) | 47 | 47 |
| Temperature of reference (°C) | 25 | 25 |
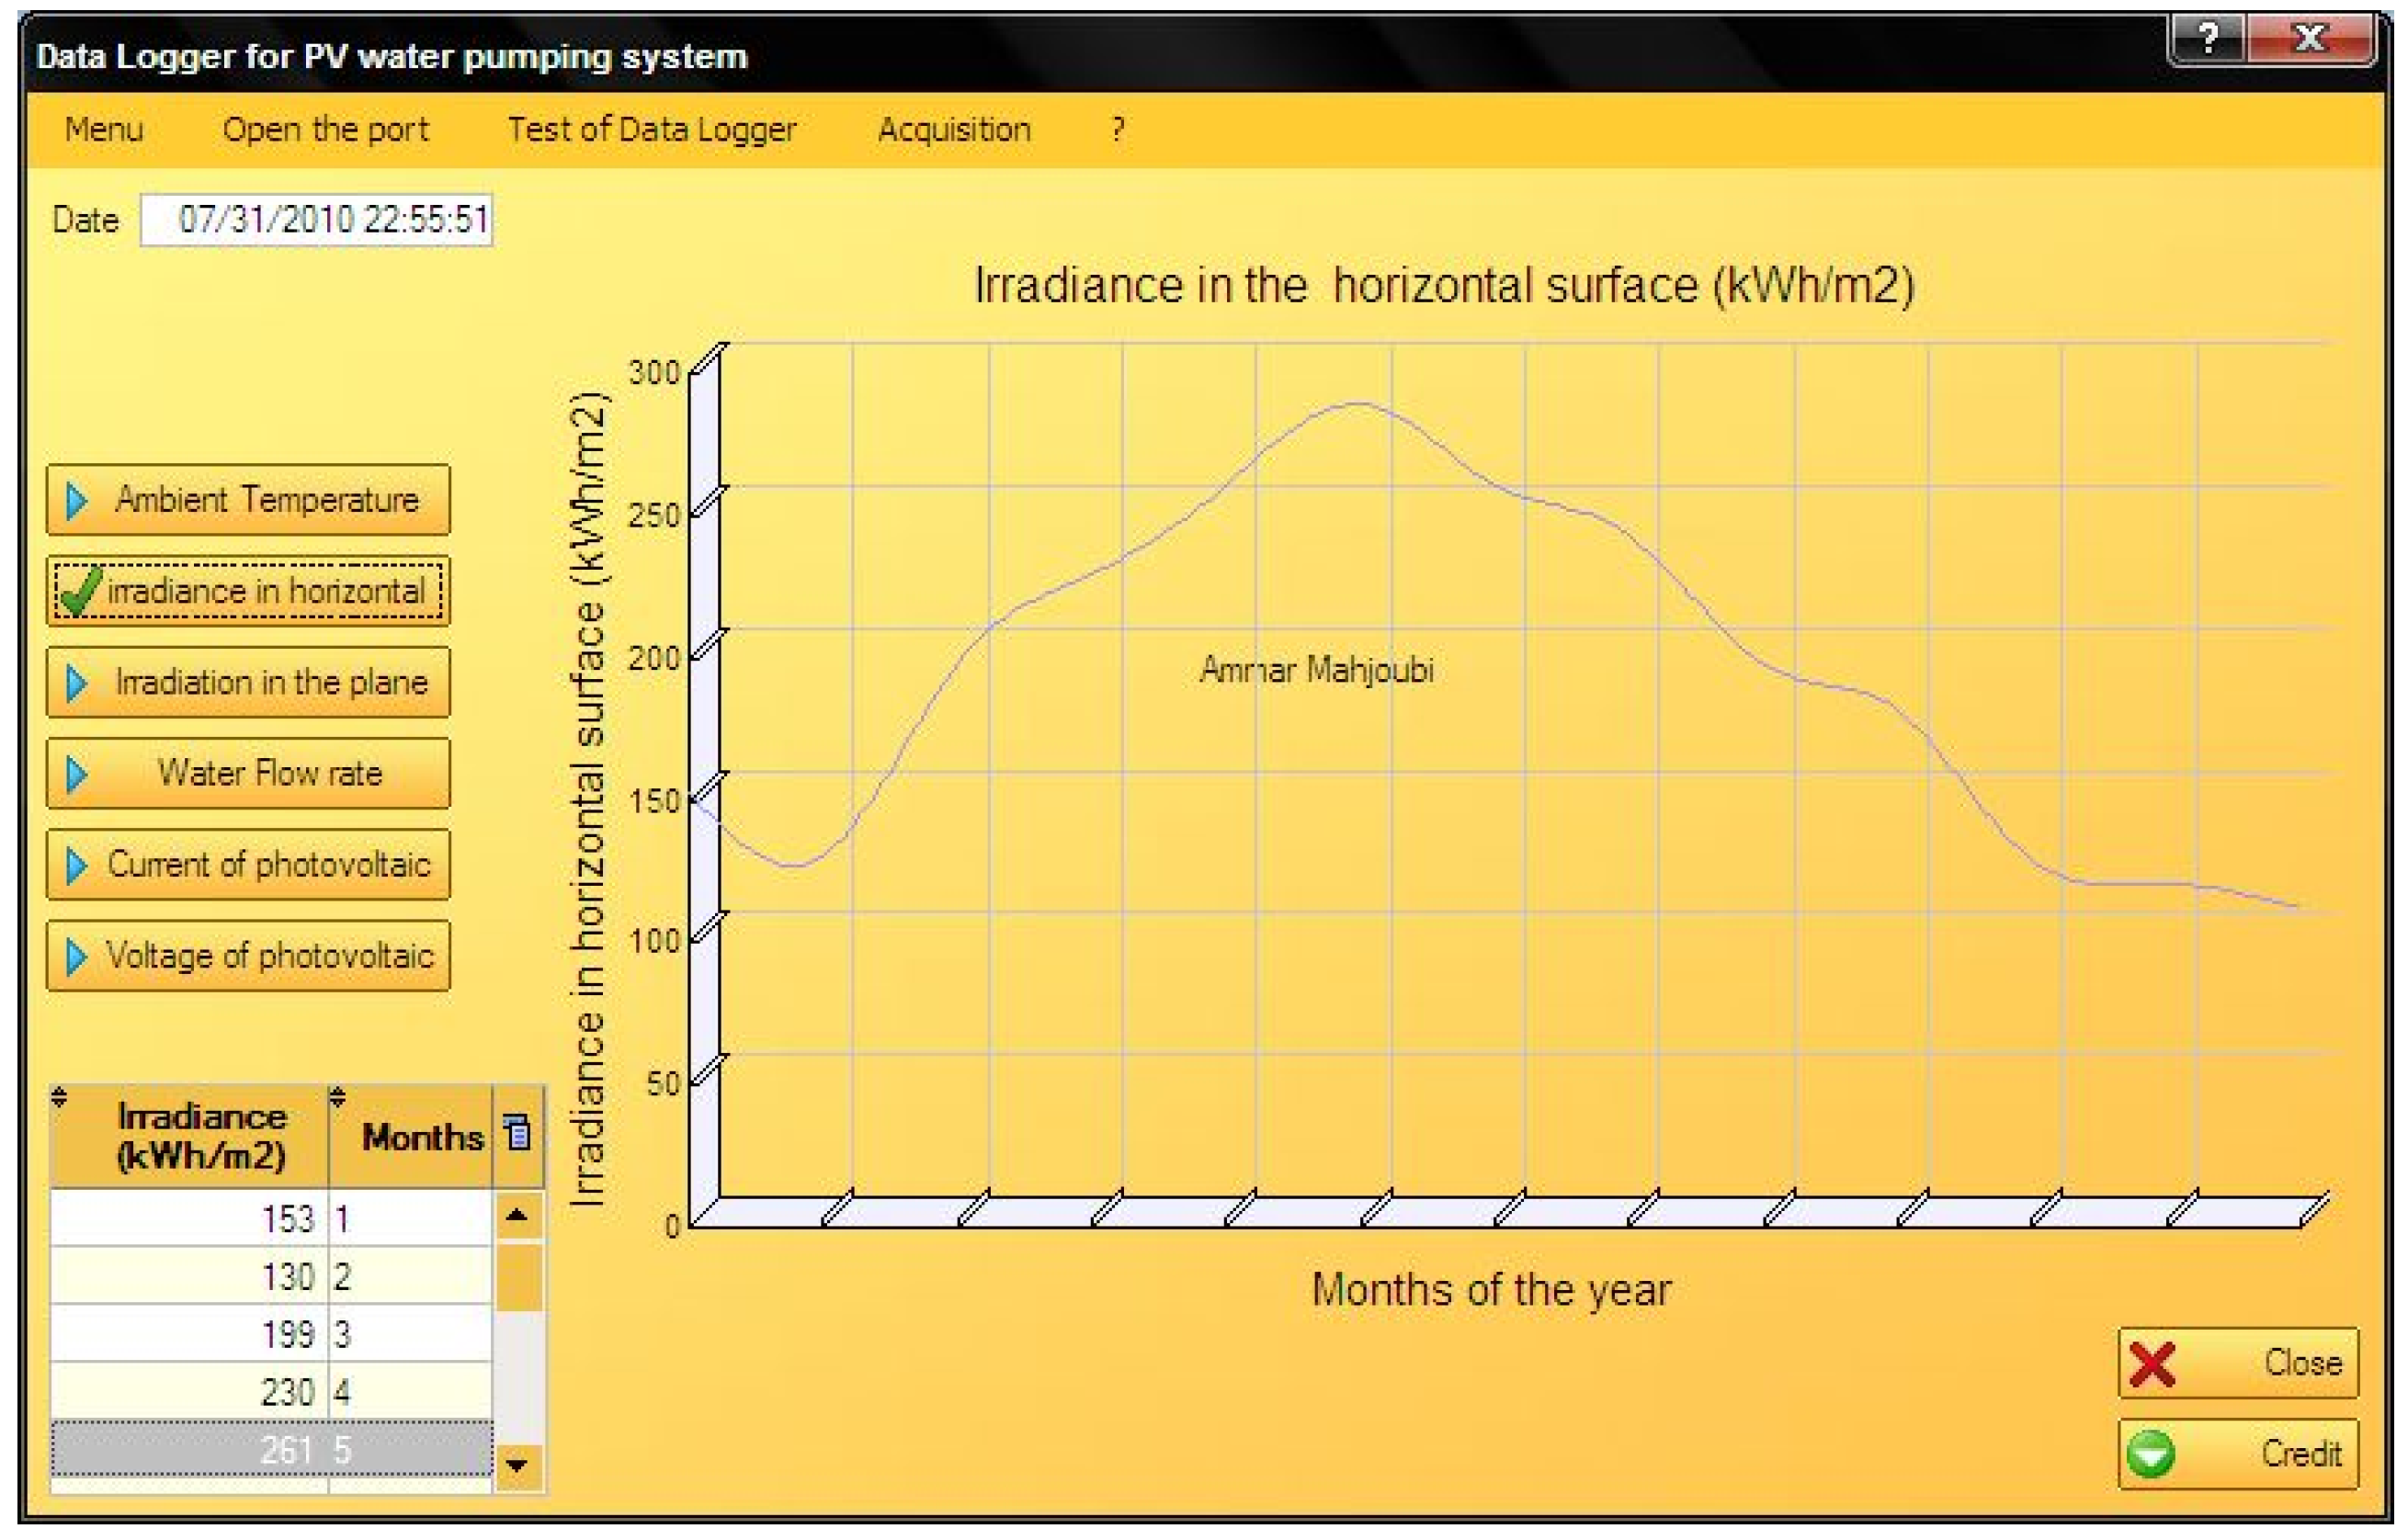
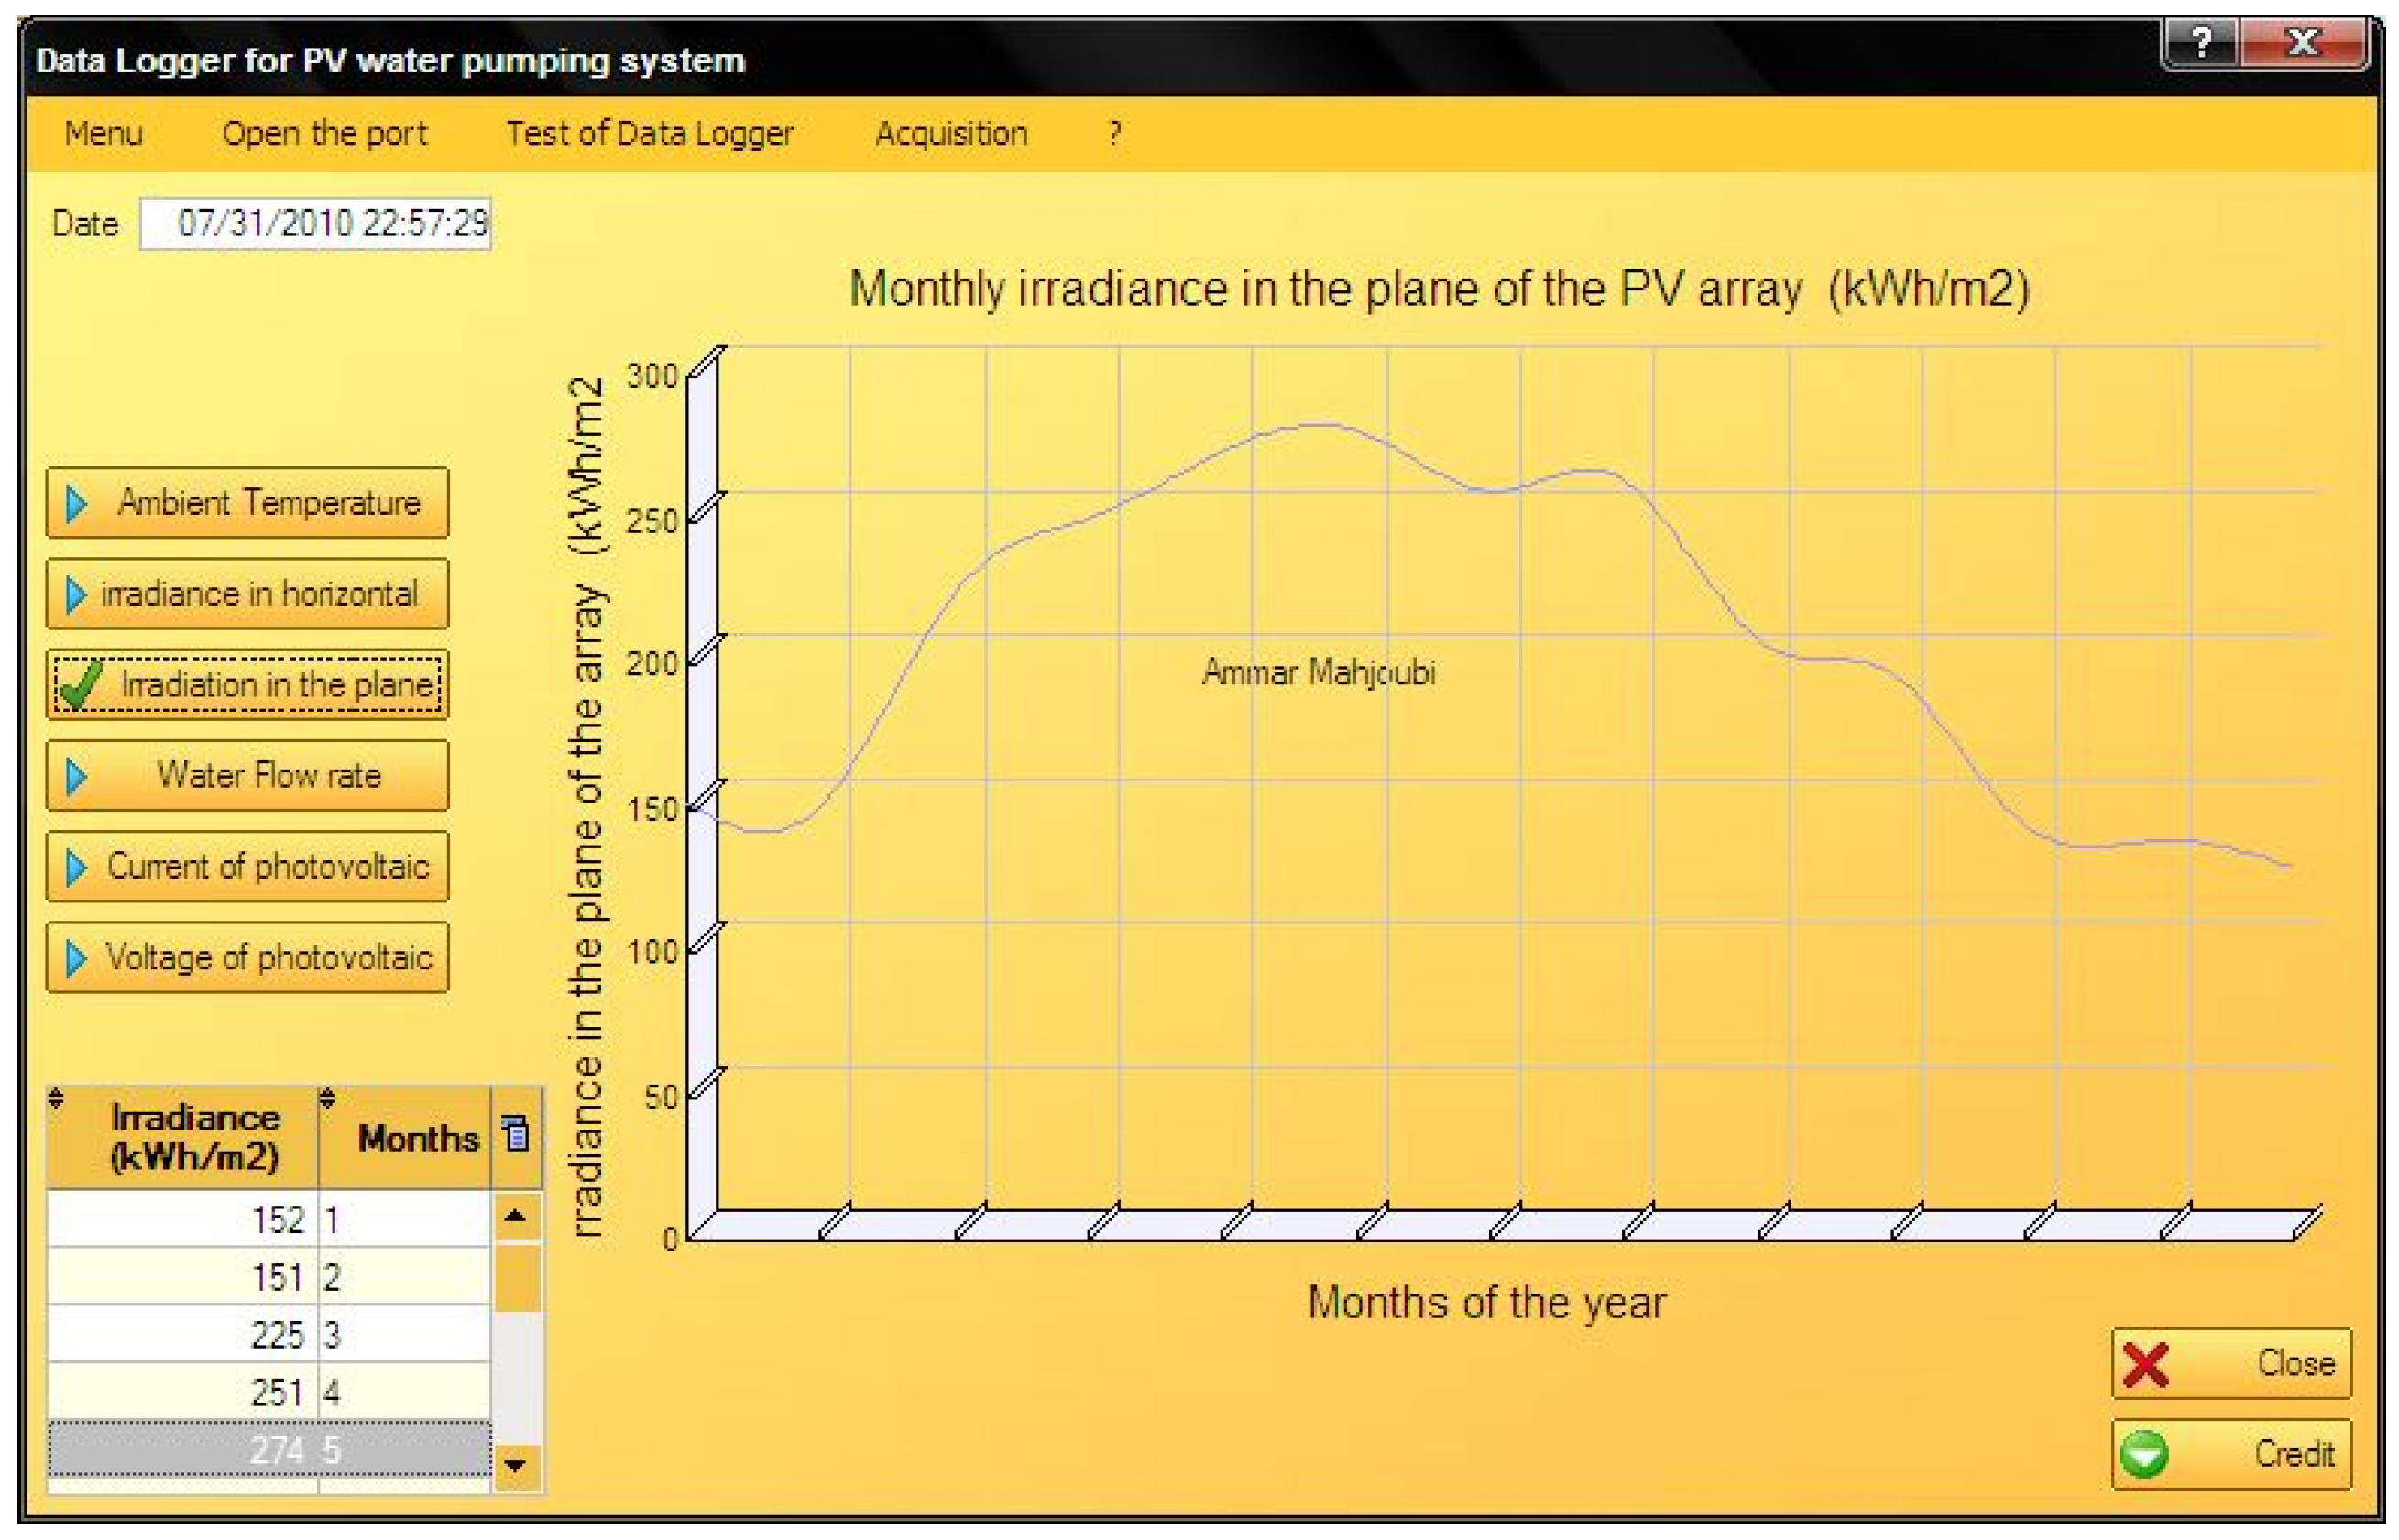
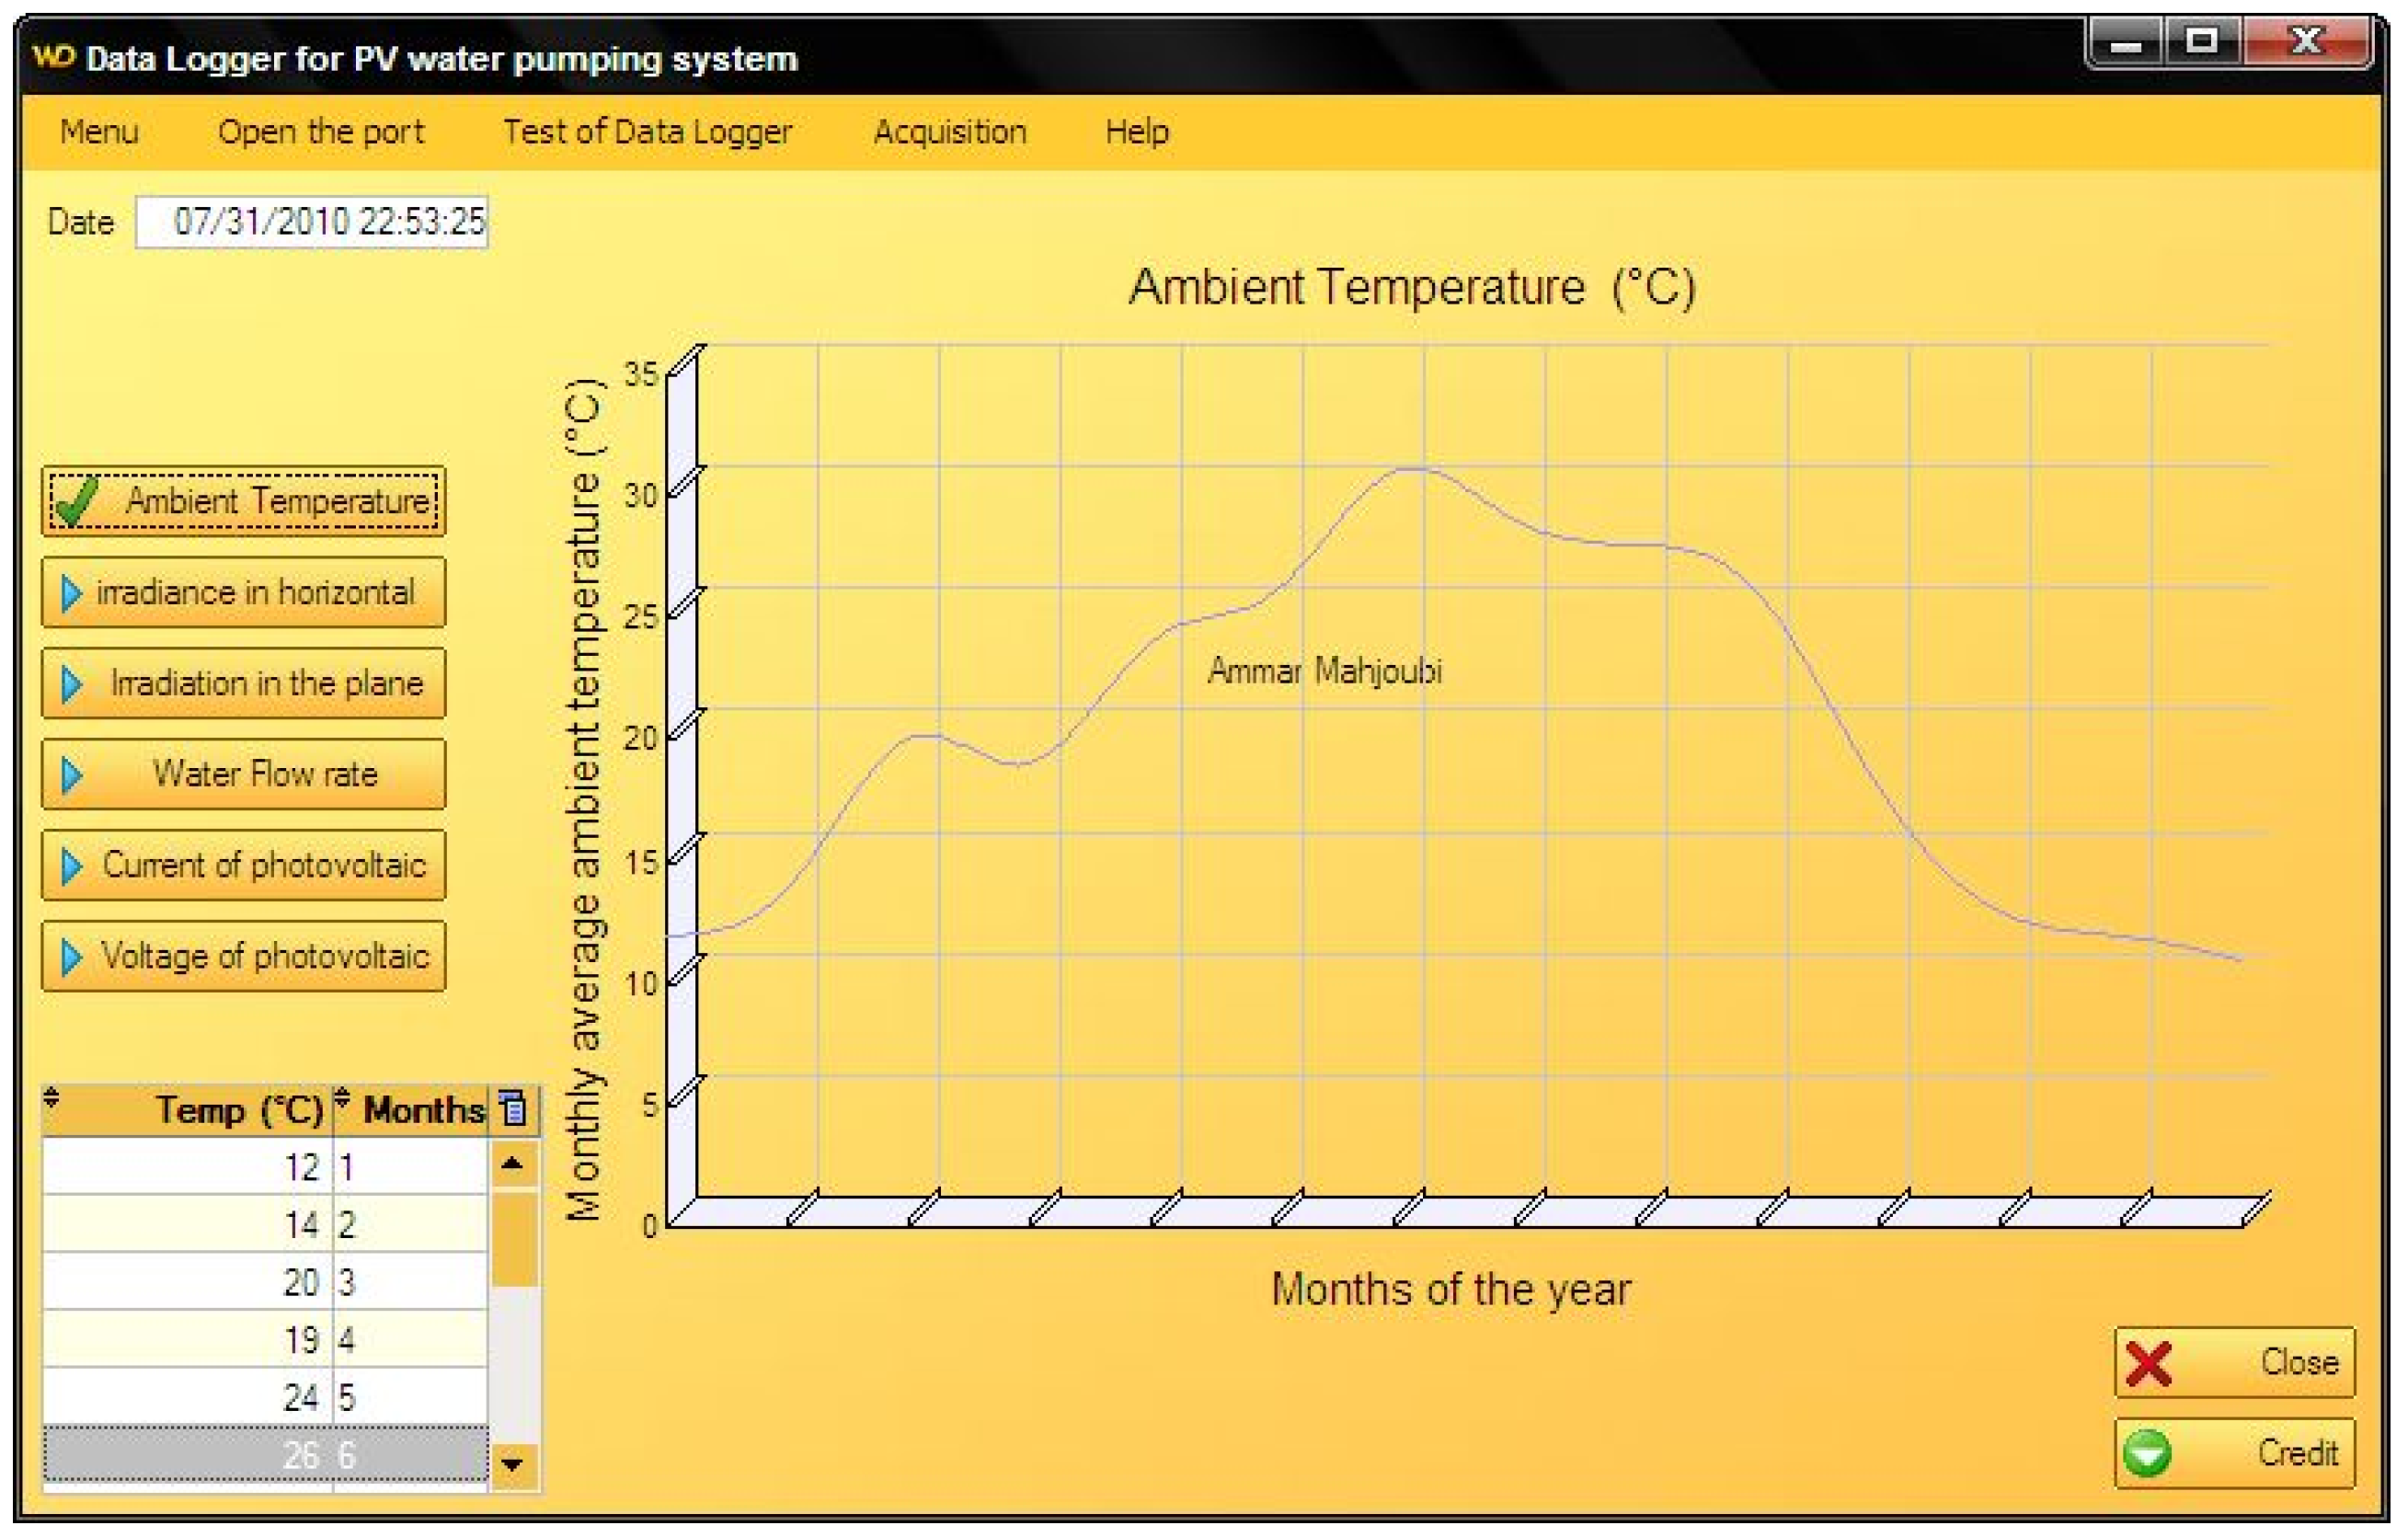
5. Results and Discussion
| Hours | January 1th | March 16th | July 15th | October 15th | ||||
|---|---|---|---|---|---|---|---|---|
| H | Ht | H | Ht | H | Ht | H | Ht | |
| 6.00 | 0.00 | 0.00 | 0.00 | 0.00 | 24.99 | 58.19 | 0.00 | 0.00 |
| 7.00 | 0.00 | 0.00 | 16.66 | 40.2 | 166.6 | 189.42 | 33.32 | 79.99 |
| 8.00 | 5.55 | 30.5 | 180.5 | 220.3 | 349.9 | 405.6 | 236 | 321.6 |
| 9.00 | 72.20 | 101.1 | 502.6 | 591.0 | 658.1 | 728.1 | 485.9 | 591.5 |
| 10.00 | 361.0 | 452.0 | 733.1 | 840.3 | 877.5 | 975.6 | 699.8 | 819.8 |
| 11.00 | 399.9 | 469.6 | 927.5 | 1048.4 | 1038 | 1074.4 | 855.3 | 983.1 |
| 12.00 | 274.9 | 309.0 | 958.0 | 1072.2 | 1135 | 1275.6 | 935.8 | 561.5 |
| 13.00 | 232.1 | 287.5 | 988.6 | 1114.0 | 1177 | 1295.6 | 944.1 | 1058.9 |
| 14.00 | 203.8 | 258.0 | 960.8 | 1078.1 | 1141 | 1261.9 | 871.9 | 979.7 |
| 15.00 | 183.2 | 221.1 | 794.2 | 817.1 | 919.1 | 1081.9 | 724.7 | 813.2 |
| 16.00 | 152.7 | 190.2 | 538.7 | 594.2 | 819.2 | 958.1 | 508.1 | 599.8 |
| 17.00 | 80.53 | 103.8 | 313.8 | 400.3 | 644.2 | 794.4 | 255.4 | 341.6 |
| 18.00 | 2.777 | 20 | 111.0 | 194.1 | 383.2 | 450.0 | 19.43 | 51.77 |
| 19.00 | 0.00 | 0.00 | 11.10 | 35.8 | 138.8 | 210.9 | 0.00 | 0.00 |
| 20.00 | 0.00 | 0.00 | 0.00 | 0.00 | 8.331 | 41.50 | 0.00 | 0.00 |
| Hours | January 1th | March 16th | July 15th | October 15th |
|---|---|---|---|---|
| Q (m3/h) | Q (m3/h) | Q (m3/h) | Q (m3/h) | |
| 6.00 | 0.00 | 0.00 | 0.43 | 0.00 |
| 7.00 | 0.00 | 0.12 | 0.94 | 0.23 |
| 8.00 | 0.03 | 1.67 | 1.62 | 1.64 |
| 9.00 | 0.58 | 4.14 | 3.32 | 3.37 |
| 10.00 | 4.05 | 5.71 | 4.79 | 4.85 |
| 11.00 | 4.09 | 6.83 | 6.07 | 5.93 |
| 12.00 | 2.28 | 7.68 | 6.78 | 6.49 |
| 13.00 | 1.98 | 7.91 | 6.97 | 7.81 |
| 14.00 | 1.69 | 7.65 | 6.63 | 8.42 |
| 15.00 | 1.41 | 6.61 | 5.91 | 7.50 |
| 16.00 | 1.33 | 4.51 | 4.63 | 5.13 |
| 17.00 | 0.97 | 2.54 | 2.97 | 2.10 |
| 18.00 | 0.02 | 0.84 | 1.33 | 0.14 |
| 19.00 | 0.00 | 0.08 | 0.23 | 0.00 |
| 20.00 | 0.00 | 0.00 | 0.05 | 0.00 |
| Hours | January 1th | March 16th | July 15th | October 15th | ||||
|---|---|---|---|---|---|---|---|---|
| H | Ht | H | Ht | H | Ht | H | Ht | |
| 6.00 | 0.00 | 0.00 | 0.00 | 0.00 | 24.99 | 58.19 | 0.00 | 0.00 |
| 7.00 | 0.00 | 0.00 | 16.66 | 40.2 | 166.6 | 189.42 | 33.32 | 79.99 |
| 8.00 | 5.55 | 30.5 | 180.5 | 220.3 | 349.9 | 405.6 | 236 | 321.6 |
| 9.00 | 72.20 | 101.1 | 502.6 | 591.0 | 658.1 | 728.1 | 485.9 | 591.5 |
| 10.00 | 361.0 | 452.0 | 733.1 | 840.3 | 877.5 | 975.6 | 699.8 | 819.8 |
| 11.00 | 399.9 | 469.6 | 927.5 | 1048.4 | 1038 | 1074.4 | 855.3 | 983.1 |
| 12.00 | 274.9 | 309.0 | 958.0 | 1072.2 | 1135 | 1275.6 | 935.8 | 561.5 |
| 13.00 | 232.1 | 287.5 | 988.6 | 1114.0 | 1177 | 1295.6 | 944.1 | 1058.9 |
| 14.00 | 203.8 | 258.0 | 960.8 | 1078.1 | 1141 | 1261.9 | 871.9 | 979.7 |
| 15.00 | 183.2 | 221.1 | 794.2 | 817.1 | 919.1 | 1081.9 | 724.7 | 813.2 |
| 16.00 | 152.7 | 190.2 | 538.7 | 594.2 | 819.2 | 958.1 | 508.1 | 599.8 |
| 17.00 | 80.53 | 103.8 | 313.8 | 400.3 | 644.2 | 794.4 | 255.4 | 341.6 |
| 18.00 | 2.777 | 20 | 111.0 | 194.1 | 383.2 | 450.0 | 19.43 | 51.77 |
| 19.00 | 0.00 | 0.00 | 11.10 | 35.8 | 138.8 | 210.9 | 0.00 | 0.00 |
| 20.00 | 0.00 | 0.00 | 0.00 | 0.00 | 8.331 | 41.50 | 0.00 | 0.00 |
| Hours | January 1th | March 16th | July 15th | October 15th |
|---|---|---|---|---|
| Q (m3/h) | Q (m3/h) | Q (m3/h) | Q (m3/h) | |
| 6.00 | 0.00 | 0.00 | 0.15 | 0.00 |
| 7.00 | 0.00 | 0.07 | 0.35 | 0.14 |
| 8.00 | 0.02 | 0.98 | 0.65 | 0.96 |
| 9.00 | 0.44 | 2.44 | 0.95 | 1.98 |
| 10.00 | 1.78 | 3.36 | 1.96 | 2.85 |
| 11.00 | 1.89 | 4.02 | 2.82 | 3.49 |
| 12.00 | 1.68 | 4.52 | 3.57 | 3.82 |
| 13.00 | 1.42 | 4.66 | 3.99 | 4.59 |
| 14.00 | 1.19 | 4.50 | 4.10 | 4.95 |
| 15.00 | 0.98 | 3.89 | 3.80 | 4.41 |
| 16.00 | 0.86 | 2.65 | 3.45 | 3.02 |
| 17.00 | 0.57 | 1.50 | 2.60 | 1.24 |
| 18.00 | 0.01 | 0.50 | 1.65 | 0.08 |
| 19.00 | 0.00 | 0.05 | 0.78 | 0.00 |
| 20.00 | 0.00 | 0.00 | 0.05 | 0.00 |


6. Conclusions
Acknowledgments
References
- Ameur, S.; Laghrouche, M.; Adane, A. Monitoring a greenhouse using a microcontroller-based meteorological data-acquisition system. Renew. Energy 2001, 24, 19–30. [Google Scholar] [CrossRef]
- Benghanem, M.; Maafi, A. Data acquisition system for photovoltaic systems performance monitoring. IEEE Trans. Instrum. Meas. 1998, 47, 30–33. [Google Scholar] [CrossRef]
- Benghanem, M.; Arab, A.H.; Mukadam, K. Data acquisition system for photovoltaic water pumps. Renew. Energy 1999, 17, 385–396. [Google Scholar] [CrossRef]
- Trotter, C.M.; Carson, W.W. Data acquisition from a parallax bar via an RS232C interface. Rev. Sci. Instrum. 1985, 56, 2154–2156. [Google Scholar] [CrossRef]
- Mukaro, R.; Carelse, X.F. A serial communication program for accessing a microcontroller-based data- acquisition system. Comput. Geosci. 1997, 23, 1027–1032. [Google Scholar] [CrossRef]
- Mukaro, R.; Carelse, X.F. A microcontroller-based data acquisition system for solar radiation and environmental monitoring. IEEE Trans. Instrum. Meas. 1999, 48, 1232–1238. [Google Scholar] [CrossRef]
- Mukaro, R.; Carelse, X.F; Olumekor, L. First performance analysis of a silicon-cell microcontroller based solar radiation monitoring system. Sol. Energy 1998, 63, 313–321. [Google Scholar] [CrossRef]
- Koutroulis, E.; Kalaitzakis, K. Development of an integrated data-acquisition system for renewable energy sources systems monitoring. Renew. Energy 2003, 28, 139–152. [Google Scholar] [CrossRef]
- Koutroulis, E.; Kalaitzakis, K.; Vlachos, V. Development of a data acquisition system for remote monitoring of renewable energy systems. Measurement 2003, 34, 75–83. [Google Scholar] [CrossRef]
- Belmili, H.; Ait Cheikh, S.M.; Haddadi, M.; Larbes, C. Design and development of a data acquisition system for photovoltaic modules characterization. Renew. Energy 2010, 35, 1484–1492. [Google Scholar] [CrossRef]
- Rosiek, S.; Batlles, F.J. A microcontroller-based data-acquisition system for meteorological station monitoring. Energy Convers. Manag. 2008, 49, 3746–3754. [Google Scholar] [CrossRef]
- Benghanem, M. Low cost management for photovoltaic systems in isolated site with new IV characterization model proposed. Energy Convers. Manag. 2009, 50, 748–755. [Google Scholar] [CrossRef]
- Benghanem, M. A low cost wireless data acquisition system for weather station monitoring. Renew. Energy 2010, 35, 862–872. [Google Scholar] [CrossRef]
- Benghanem, M. Measurement of meteorological data based on wireless data acquisition system monitoring. Appl. Energy 2009, 86, 2651–2660. [Google Scholar] [CrossRef]
- Tseng, C.L.; Jiang, J.A.; Lee, R.G.; Lu, F.M.; Ouyang, C.S.; Chen, Y.S.; Chang, C.H. Feasibility study on application of GSM-SMS technology to field data acquisition. Comput. Electr. Agric. 2006, 53, 45–59. [Google Scholar] [CrossRef]
- Siemens Mobile GSM Modem, MC45 Hardware Interface Description; Version 04.03; Siemens: Munich, Germany, 2004.
© 2011 by the authors; licensee MDPI, Basel, Switzerland. This article is an open access article distributed under the terms and conditions of the Creative Commons Attribution license (http://creativecommons.org/licenses/by/3.0/).
Share and Cite
Mahjoubi, A.; Fethi Mechlouch, R.; Ben Brahim, A. A Low Cost Wireless Data Acquisition System for a Remote Photovoltaic (PV) Water Pumping System. Energies 2011, 4, 68-89. https://doi.org/10.3390/en4010068
Mahjoubi A, Fethi Mechlouch R, Ben Brahim A. A Low Cost Wireless Data Acquisition System for a Remote Photovoltaic (PV) Water Pumping System. Energies. 2011; 4(1):68-89. https://doi.org/10.3390/en4010068
Chicago/Turabian StyleMahjoubi, Ammar, Ridha Fethi Mechlouch, and Ammar Ben Brahim. 2011. "A Low Cost Wireless Data Acquisition System for a Remote Photovoltaic (PV) Water Pumping System" Energies 4, no. 1: 68-89. https://doi.org/10.3390/en4010068