Article

Optimization of the Dilute Acid Hydrolyzator for Cellulose-to-Bioethanol Saccharification

by
Theocharis Tsoutsos
* and
Dimitris Bethanis
Environmental Engineering Department, Technical University of Crete, University Campus, Chania, GR 73100, Greece
*
Author to whom correspondence should be addressed.
Energies 2011, 4(10), 1601-1623; https://doi.org/10.3390/en4101601
Submission received: 1 August 2011 / Revised: 23 September 2011 / Accepted: 8 October 2011 / Published: 20 October 2011

Abstract

:
The production of fermentable sugar solutions for bioethanol production is optimized. The process of acid hydrolysis using dilute H2SO4 was selected. Suitable lignocellulosics which are abundant in the Mediterranean (corn stover, hardwood and wheat straw) were investigated, and therefore their exploitation could be economically feasible. The process was studied in the two most common hydrolyzators (batch and continuous stirred) by developing a specific simulator for different raw materials. The simulation was applied in a wide range of temperatures (100–240 °C) and acid concentrations (0.5–3.0% w/w), in order to optimize the productivity of fermentable pentosans and hexosans. It was confirmed that the production of sugar-rich solutions required a two-stage process; in the first stage the degradation of sugars takes place, since pentoses are formulated under milder conditions than hexoses; in the second stage of simulation, a variety of samples with high sugar concentration and low degradation products are tested. The xylose productivity ranges between 85–95% under the most optimal conditions compared to the theoretical values, while large variations in glucose were frequent (10–55%) in comparison with the theoretical values. The best theoretical results were achieved for wheat straw hydrolysis in a batch reactor.

1. Introduction

Biomass exploitation has great raw material availability challenges, particularly in the technological scheme of fuel bioethanol. Bioethanol is an environmentally friendly and directly exploitable fuel for substitution of petrochemicals, which today are used for the 97% of the transportation needs [1,2].
Figure 1. LGC-to-ethanol production scheme.
Energies 04 01601 g001
Today the wide use of lignocellulosics for 2nd generation biofuels taking into account that crop residues should not the removed from cropland to protect the soil from erosion is under discussion [3]. Furthermore the role of the plants as solar collectors is—globally—limited, since green plants collect less than 0.1% of solar energy per year [4]. Although there exists scepticism about the energy and environmental performance of this procedure [5], bioethanol production is considered almost greenhouse gas neutral, if only renewable raw materials are used. The aim of the current study was the investigation of hydrolyzate production from lignocellulosics (LGC), as a microbial substrate to produce fuel bioethanol [6] (Figure 1).
In the current study the dilute acid hydrolysis of various lignocellulosics (LGCs) was simulated in order to identify the optimal conditions for the production of hydrolyzates rich in fermentable sugars. The choice of LGC was made taking into consideration the design of a realistic process under Mediterranean conditions, taking into consideration the synthesis of a realistic and sustainable technological scheme.
The investigation was conducted by simulation of the hydrolysis reaction using the Matlab computational environment. Various process conditions were assessed and different types of raw materials and reactors were compared.

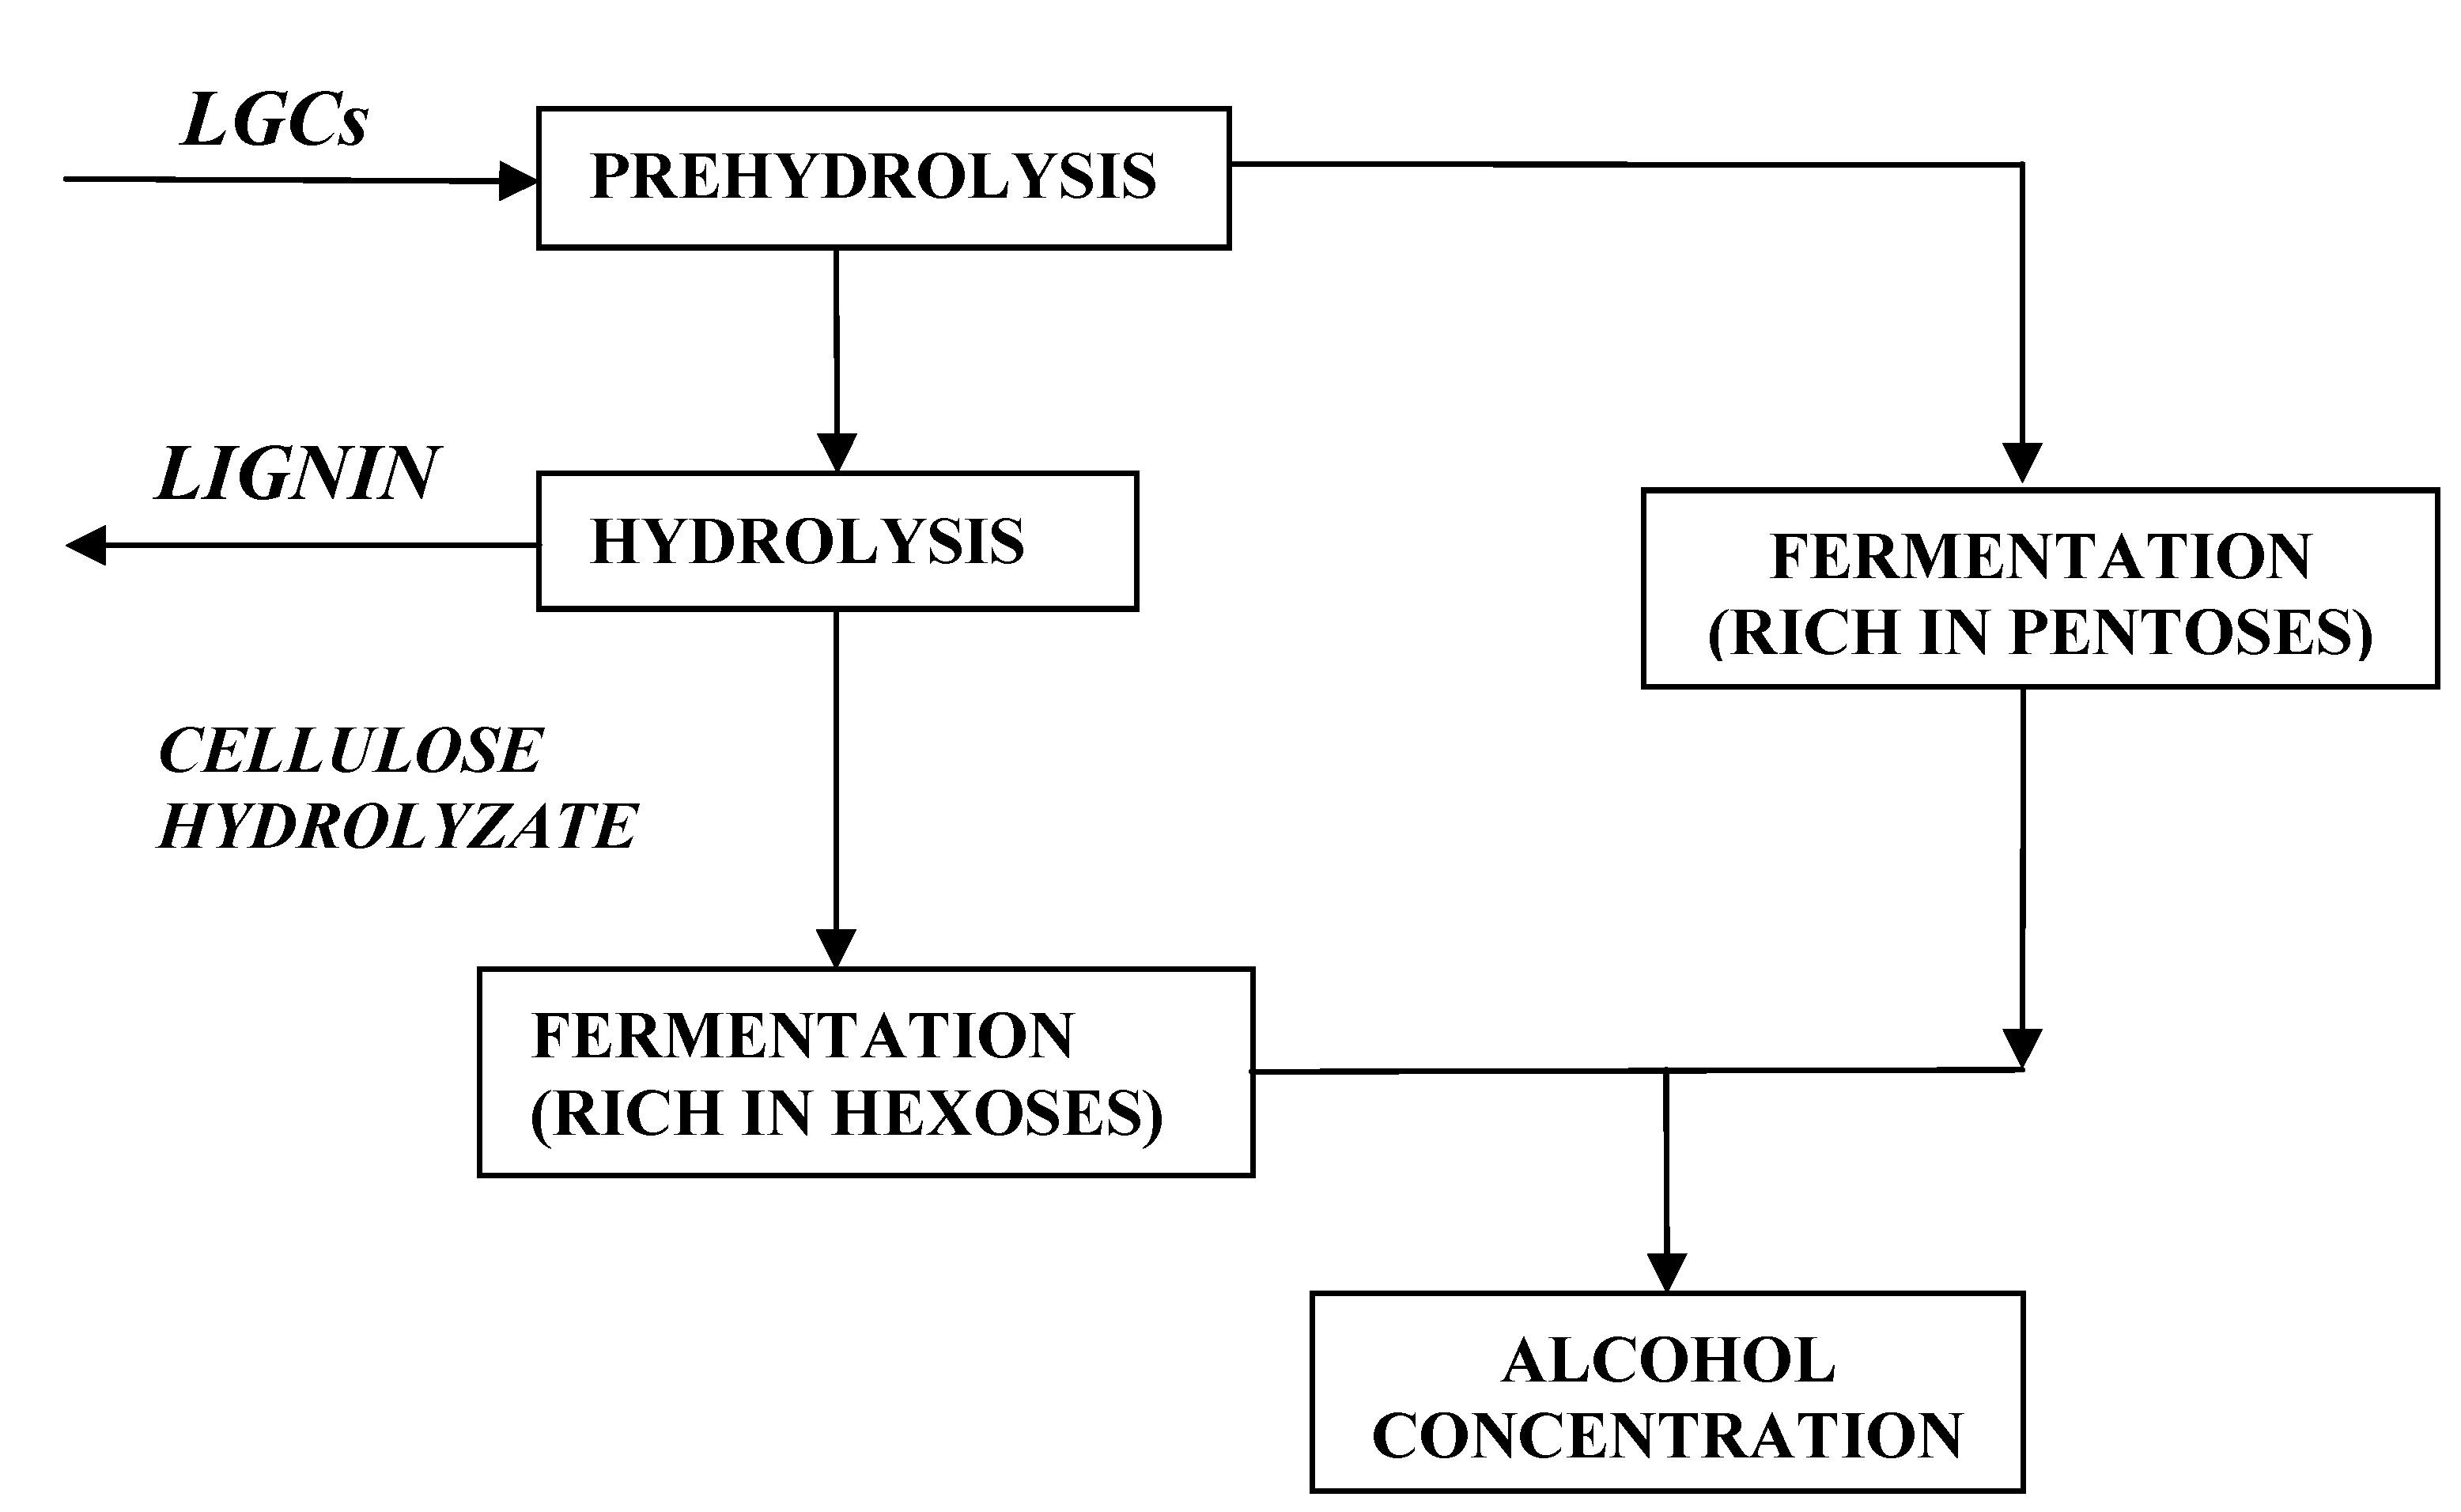
2. Lignocellolosics-to-Bioethanol

The production of LGC sugars is perhaps the most important stage in the ethanol production process, because good quality solutions favour the efficient conversion to ethanol. However the process is not complete, because the lignin-hemicellulose complex inhibits the penetration of the hydrolytic means, while due to its crystallinity the chemical breakdown of the cellulose is difficult. Consequently, for the improvement of the reaction productivity, is essential the pretreatment of the raw material. Generally, three hydrolysis alternatives exist after the pre-treatment process:
  • Enzymatic hydrolysis
  • Concentrated acid hydrolysis
  • Dilute acid hydrolysis [7]
Dilute acid hydrolysis is selected for the production of fermentable sugars via milder conditions than those in the case of concentrated acid. During this process dilute acid concentration (up to 3–4%) is used at temperatures of 100–240 °C. Several acids can be used, such as HCl, H2SO4, H3PO4 and HNO3. At temperatures between 110–140 °C hemicellulose is hydrolyzed, while crystalline cellulose remains practically unchanged up to 170 °C and its hydrolysis takes place up to 240 °C.
The difference between these two parts dominates the design of a two-stage process. The separate hydrolysis of the hemicellulose and cellulose parts, has already been studied for wood biomass [8,9,10] concerns initial hemicellulose hydrolysis in low temperature (120–150 °C) and then cellulose hydrolysis at higher temperatures of up to 240 °C.
During prehydrolysis the lignin-hemicellulose complex is broken down, facilitating the hydrolysis of hemicellulose and the production of sugar, mainly xylose, under relatively mild conditions. However at increased temperature xylose is broken down and undesirable byproducts are formed. Sugar removal is thus required before the activation of the second stage.
The next step is the application of higher temperatures (>170 °C) and potentially increased acid concentrations, so that the cellulosic part will be hydrolyzed.
The two stage process has several advantages such as:
  • it allows the production of useful byproducts such as xylitol and arabitol
  • it increases the cellulose breakdown during hydrolysis and consequently the sugar yield
  • it is more economical than the concentrated acid reaction because it requires cheaper equipment
  • important environmental problems related to the use of strong acids are avoided in its general design and management is less complicated than that of enzymatic hydrolysis [9,10]
However, it is noted that the operating conditions need to be carefully selected in order to avoid high concentrations of byproducts with significant inhibitory effect during the fermentation. Also, before the fermentation process, the hydrolyzates’ pH should be regulated, in order not to suspend the metabolism of the fermentation microbial cultures. The use of combined microorganisms, which can simultaneously ferment hexoses and pentoses, is also reported [11].

3. Methodology

3.1. Kinetics of the Dilute Acid Hydrolysis

3.1.1. Kinetics of the Acid Cellulose Hydrolysis

Saeman suggested the cellulose hydrolysis is a pseudo-homogenous system of two simple sequential reactions [12,13]. During the first reaction cellulose is hydrolyzed to glucose, while during the second glucose was degraded producing byproducts as follows:
cellulose k 1 glucose k 2 degradation products
Saeman modified the Arrhenius type constants as follows:
k i = A i C n i e ( E i R T )
where:
i: =1 for the production reaction, =2 for the degradation reaction
C: acid concentration (%w/w)
T: temperature (°Κ)
E1, E2: activation energy of the production and degradation of glucose
n1, n2: exponential acid parameters
A1, A2: pre-exponential parameters (min−1)
So the glucose concentration versus time is described in the following equation:
d G d t = k 1 C k 2 G
The values of the above parameters depend on the proportion of the three main biomass components and mainly on how these components are inter-connected. The pretreatment of the substrates influences the values of the kinetic parameters not only due to the removal of inorganic salts that affect the acid effectiveness, but mainly to the modification of the bonds between cellulose and lignin. This model includes several simplifications, as the system is, in fact, heterogeneous, while the crystallinity of cellulose and the diffusion of acid are not taken into account in this. Nevertheless in the range where cellulose is hydrolyzed, namely >170 °C, its amorphous part, which is much smaller, reacts very fast and does not influence considerably the overall process. Having this in mind more complex models have been developed, which examine the proportion between crystalline—amorphous cellulose, as well as the acid diffusion conditions in the raw material, but also the polymerization degree of the cellulose parts.
Several researchers trying to successfully analyze their experimental findings have suggested more complex models, such as the degradation of hemicellulose into two xylan parts: xylan (I) that hydrolyzes to oligomers very quickly and xylan (II) with a lower hydrolysis rate. However the concentration of oligomers is not always easy to determine; it has been reported that the simplified model does not affect the major part of the understating of the process [14].
Furthermore, as known, hemicelluloses are not only xylan (e.g., manan, arabinan, etc.), which is considered to adopt the current simplified methodology [15]. Nevertheless several researchers [16,17,18] have proved that the initial model describes, with notable accuracy, the role of dilute acid hydrolysis under conditions facilitating the reaction in the interface solution/raw material. This happens when the particles of the raw material are sufficiently small, so that they facilitate the acid diffusion, while the ratio solid/liquid is relatively small (1/5–1/10), so problems of flow or mixing inside the reactor are avoided. The main product of the glucose degradation is 5-hydroxymethylfurfural (HMF), which has inhibitory behaviour during fermentation (Scheme 1).
Scheme 1. Formation of HMF.
Energies 04 01601 g009

3.1.2. Kinetics of the Hemicellulose Acid Hydrolysis

Based on the Saeman’s model Chambers developed the equivalent for hemicellulose hydrolysis and this research gave satisfactory results for compatibility with experimental results [19,20,21]:
hemicelluloses k 1 xylose k 2 degradation products
For the successful understanding of their experimental results a more complicated model has been suggested, which describes the split of the tree-like hemicellulose into two xylan parts [22,23,24]. Afterwards the oligomers are hydrolyzed to xylose, which then is hydrolyzed to degradation products [25].
Scheme 2. Formation of furfural.
Energies 04 01601 g010
The main degradation product of xylose is furfural (Scheme 2), which like HMF is an ethanolic fermentation inhibitor.

3.1.3. Further Assumptions for Hydrolysis Simulation

The composition of LGC was considered as an expression of equivalent pentoses and hexoses, while the parts of hemicellulose and cellulose as equivalent concentrations of xylan and glucan respectively, a method that is often applied [26]. During the sugar degradation process it was assumed that xylose is transformed to furfural and glucose to HMF, respectively. The acidic medium used was H2SO4, which is the most common acid applied with good effectiveness and no significant creation of post-process environmental problems, unlike HCl. Isothermal conditions were assumed in all experiments.
Under real conditions other byproducts are formulated in small percentages, while furfural and HMF after enough retention time under acidic conditions are degraded to other byproducts. These two degradation products are the most important, as they are produced in great percentages, and they play important roles during the fermentation process of the hydrolyzates.

3.2. The Role of Degradation Products during Fermentation

Furfural and HMF are degradation products of the sugars—during dilute acid hydrolysis—with inhibitory effect during fermentation (inhibitors). These substances are considered the main inhibitors as their activity can be intense even at small concentrations [10,27,28].

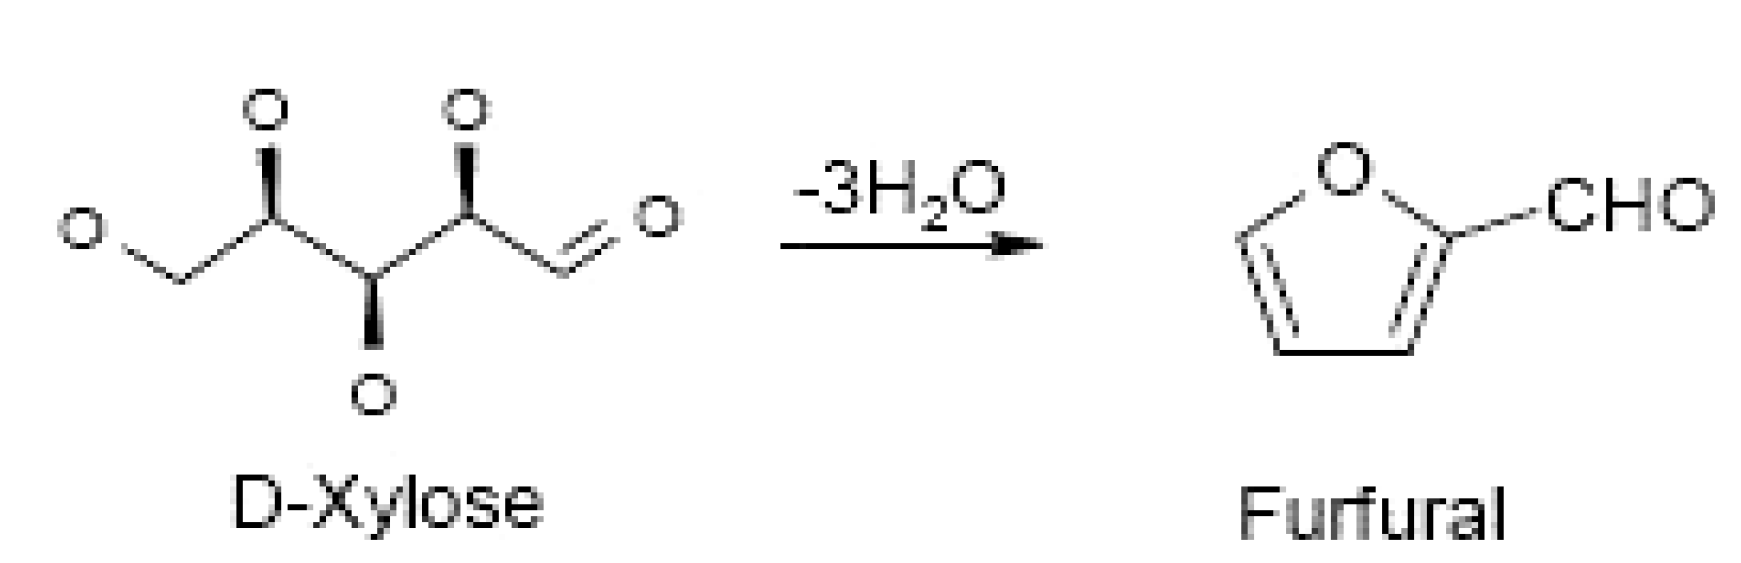
3.2.1. The Role of Furfural

Furfural inhibits the in vitro activity of important glucolytic enzymes resulting in the reduction of rate of reproduction of the microbial population and ethanol productivity of the culture [10]. The accurate determination of the relation between furfural concentration and inhibition is not easy, because it is influenced by several factors. This determination depends mainly on the type of micro-organism used, but also the initial inoculum concentrations of the culture [29].
In the international literature it is reported that concentrations >1 g/L in cultures of Saccharomyces cerevisae (SC) decrease considerably the amount of CO2 receipt [30,31] and the cell development in the initial stage of fermentation.
Nevertheless in these studies the initial quantity of inoculum is not reported. In research using a high initial quantity of SC inoculum (3.5 g/L) [32] important reductions both in the growth rate of the microbial population and in the ethanol production rate were observed with the addition of 3.0 g/L furfural. In relevant research addition of 4.0 g/L furfural resulted in a 65% reduction in CO2 receipt, 57% in ethanol production and 89% in the growth rate [10]. However for higher initial quantity of inoculum, about 9.0 g/L, the corresponding percentages were not particularly significant.
In general it is accepted that furfural extends the cell stagnation phase. Provided that the microbes can overcome this phase, furfural is metabolized into furfurylic ethanol, which does not intervene in the ethanol production. Also the total ethanol productivity is not limited even if the required production time will be increased. These problems can thus be minimized by using higher initial inoculation concentrations.
The target in the present study is the production of hydrolyzates with furfural concentrations up to 1.5–2.0 g/L, so fermentation with minimal required pretreatment is possible, which could decrease the total production cost [27].

3.2.2. The Role of HMF

HMF inhibits the fermentation process like furfural. It has been found that HMF has lower activity; however it remains in the culture four times longer than furfural [10]. One g HMF/L has no inhibitory effect on the yeast. However the corresponding addition of 2 g/L resulted a slight reduction of protein quantity and reduction of the growth rate by 23%. In other research on SC culture, a concentration of 2 g/L simply extended the stagnation phase of the culture [31]. An additional 4 g/L had as a result a 32% reduction in CO2 receipt, a 40% in ethanol production and 70% in the growth rate of the micro-organisms. However it has been found that an increase of the initial glucose concentration decreases the effect of HMF [1]. In the simulation the question was the production of hydrolyzates with HMF concentrations in the range 3.0–3.5 g/L, aiming at maximizing its fermentation productivity.

3.3. Sugar Production in Reactors

In the current paper we have studied two types of hydrolyzators, the Batch Reactor (BR) and the Continuous Stirred Tank Reactor (CSTR). BR provides simple handling; however its disadvantage is the process control. CSTR has the possibility for continuous operation; however it does not reach the output of BR. In each reactor the mass balance equation is in effect:
[input of substance i] + [output of substance i] + [rhythm of production of substance i] = [accumulation of the substance i in the reactor]

3.3.1. Concentrations in BR

In the case of BR both the 1st and the 2nd terms of the Equation (1) are equal to zero, so:
d N i d t = V n i r i
where:
Ni: the number of moles
ni: the stoichiometric coefficient of i
for Ni = V Ci:
d ( V C i ) d t = V d C i d t + C i d V d t = V n i r ( C i ) ( constant volume ) d C i d t = n i r ( C i )
So for a first order reaction ( | n i = 1 | ) of the scheme:
A k 1 B k 2 C
The equation is transformed:
d C A d t = n A r ( C i ) = k 1 C A d C A C A = k 1 d t ( for t = 0 , C A = C 0 ) C A ( t ) = C 0 e k 1 t
In a similar way the rest system has the form:
d C B d t = r 1 r 2 = k 1 C A k 2 C B
d C C d t = r 2 = k 2 C B
( 2 ) , ( 3 ) d C B d t = k 1 C 0 e k 1 t k 2 C B
This is a linear, first-order differential equation of the following type:
d y d x + p ( x ) y = q ( x )
for P ( x ) = x 0 x p ( x ) d x :
y ( x ) = y 0 e P ( x ) + x 0 x q ( x ) e ( P ( x ) + P ( x ) ) d x
For initial conditions t = 0, CA = C0, CB = 0, CC = 0
The results are:
C B ( t ) = C 0 k 1 k 2 k 1 ( e k 1 t e k 2 t )
if:
C A 0 C A = C B C C ( 5 ) , ( 3 )
C C ( t ) = C 0 ( 1 k 2 k 2 k 1 e k 1 t + k 1 k 2 k 1 e k 2 t )

3.3.2. Concentrations in CSTR

For CSTR the Equation (1) is modified:
d N i d t = F i 0 F i + V n i r
where:
Ni: number of moles
ni: the stoichiometric coefficient of i
Fi: the input rhythm of i moles
Under steady state conditions:
d N i d t = 0
By putting:
Fi0 = u0Ci0
where:
u0: initial volumetric input
Ci0: initial concentration of i
Fi = uCi
where:
u volumetric input in time t
In gas processes, as in our case, liquids, we can consider that the input rate is not altered:
u0 = u
The Equation (7) is modified:
u ( C i 0 C i ) + V n i r = 0
By putting:
τ = V u
where:
τ : the retention time inside reactor
C i 0 C i = τ n i r
For first-order reaction ( | n i = 1 | ) of the type:
A k 1 B k 2 C
where:
r1 = k1CA
r2 = k2CB
Equation (8) provides the system:
C A 0 C A = τ k 1 C A
C B C B 0 = τ ( k 1 C A k 2 C B )
C C C C 0 = τ k 2 C B
By solving the system considering that:
t = τ and CB0 = CC0 = 0:
C A ( t ) = C A 0 1 ( 1 + k 1 t )
C B ( t ) = C A 0 k 1 t ( 1 + k 1 t ) ( 1 + k 2 t )
C C ( t ) = C A 0 k 1 k 2 t 2 ( 1 + k 1 t ) ( 1 + k 2 t )

3.4. Selection of LGC

When selecting study materials which already exist in abundance in Mediterranean countries we took into consideration their theoretical high yield in sugars, allowing their realistic exploitation with rational economic terms.
A thorough literature review of the LGC raw materials used was undertaken and they were assessed based on the Mediterranean data. Afterwards the study focused on three different types: the residues from corn stover, wheat straw and hardwood; in addition to their potential energy benefit, this technological scheme provides a sustainable solution in the problem of their disposal [33]. With regard to the volume of produced hard wood residues these are produced from a large variety of wood processing processes industries. It is therefore an easy-to-find and widely available raw material.
The determination of kinetics for each LGC was made after thorough literature review for the selected materials. The target was to find kinetics, with assumptions similar to this study (Table 1 and Table 2).
Table 1. Kinetics of LGC hydrolysis.
k i = A i · C n i · e ( E i R · T ) R = 8.314 × 10⁻³ kJ/(mol K)
T (°K)i = 1, 2
xylanxylosexyloseF
LGCA1 (min−1)n1E1 (kJ/mol)A2 (min−1)n2E2 (kJ/mol)Source
Corn stover3.68 × 10200171.61.95 × 10140133.9[18]
Wheat straw2.025 × 10201.55167.01.52 × 10152.00141.0[17]
Hardwood6.23 × 10131.17116.432.33 × 10120.688113.51[33,34,35]
glucanglucoseglucoseHMF
LGCA1 (min−1)n1E1 (kJ/mol)A2 (min−1)n2E2 (kJ/mol)Source
Corn stover2.71 × 10192.74189.62.01 × 10141.86137.3[14]
Wheat straw1.68 × 10190.7190.372.21 × 10140.68150.62[13]
Hardwood2.85 × 10131.2133.052.75 × 10121.17124.68[36]
Table 2. % Content of cellulose, hemicellulose and lignin in the selected byproducts [37].
lignocellulosicsCellulose (%)Hemicelluloses (%)Lignin (%)
Hardwood40–5524–4018–25
Corn stover453515
Wheat straw305015

3.5. Cases Studied

Studying the hydrolysis of each LGC demanded analysis over a wide range of acid and temperature values, in order to display the most possible complete picture. Each LGC was simulated considering scenarios for different types of reactor while setting the values of temperatures and acid concentrations as variables. Since we dealt with three different materials and types of reactor, six basic scenarios were presented (Table 3).
Table 3. Simulation scenarios.
LGC materialReactor typeTemperature (°C)Acid concentration (% w/w)
Corn stoverBR120–230 per 100.5–2.5 per 0.5
Corn stoverCSTR110–230 per 100.5–2.5 per 0.5
HardwoodBR100–230 per 100.5–2.5 per 0.5
HardwoodCSTR100–230 per 100.5–2.5 per 0.5
Wheat strawBR100–240 per 100.5–2.0 per 0.5
Wheat strawCSTR100–240 per 100.5–2.0 per 0.5
In all cases the duration of the simulation was 300 min, in order to examine the hydrolysis process under relatively mild conditions, which have relatively low initial reaction rates. Following the initial process 400 diagrams resulted with sugar concentrations, degradation products, along with a quality indicator. After evaluating the diagrams and the behaviour of the hydrolyzed xylan and glucan it was concluded that additional tests the high yield range were needed.

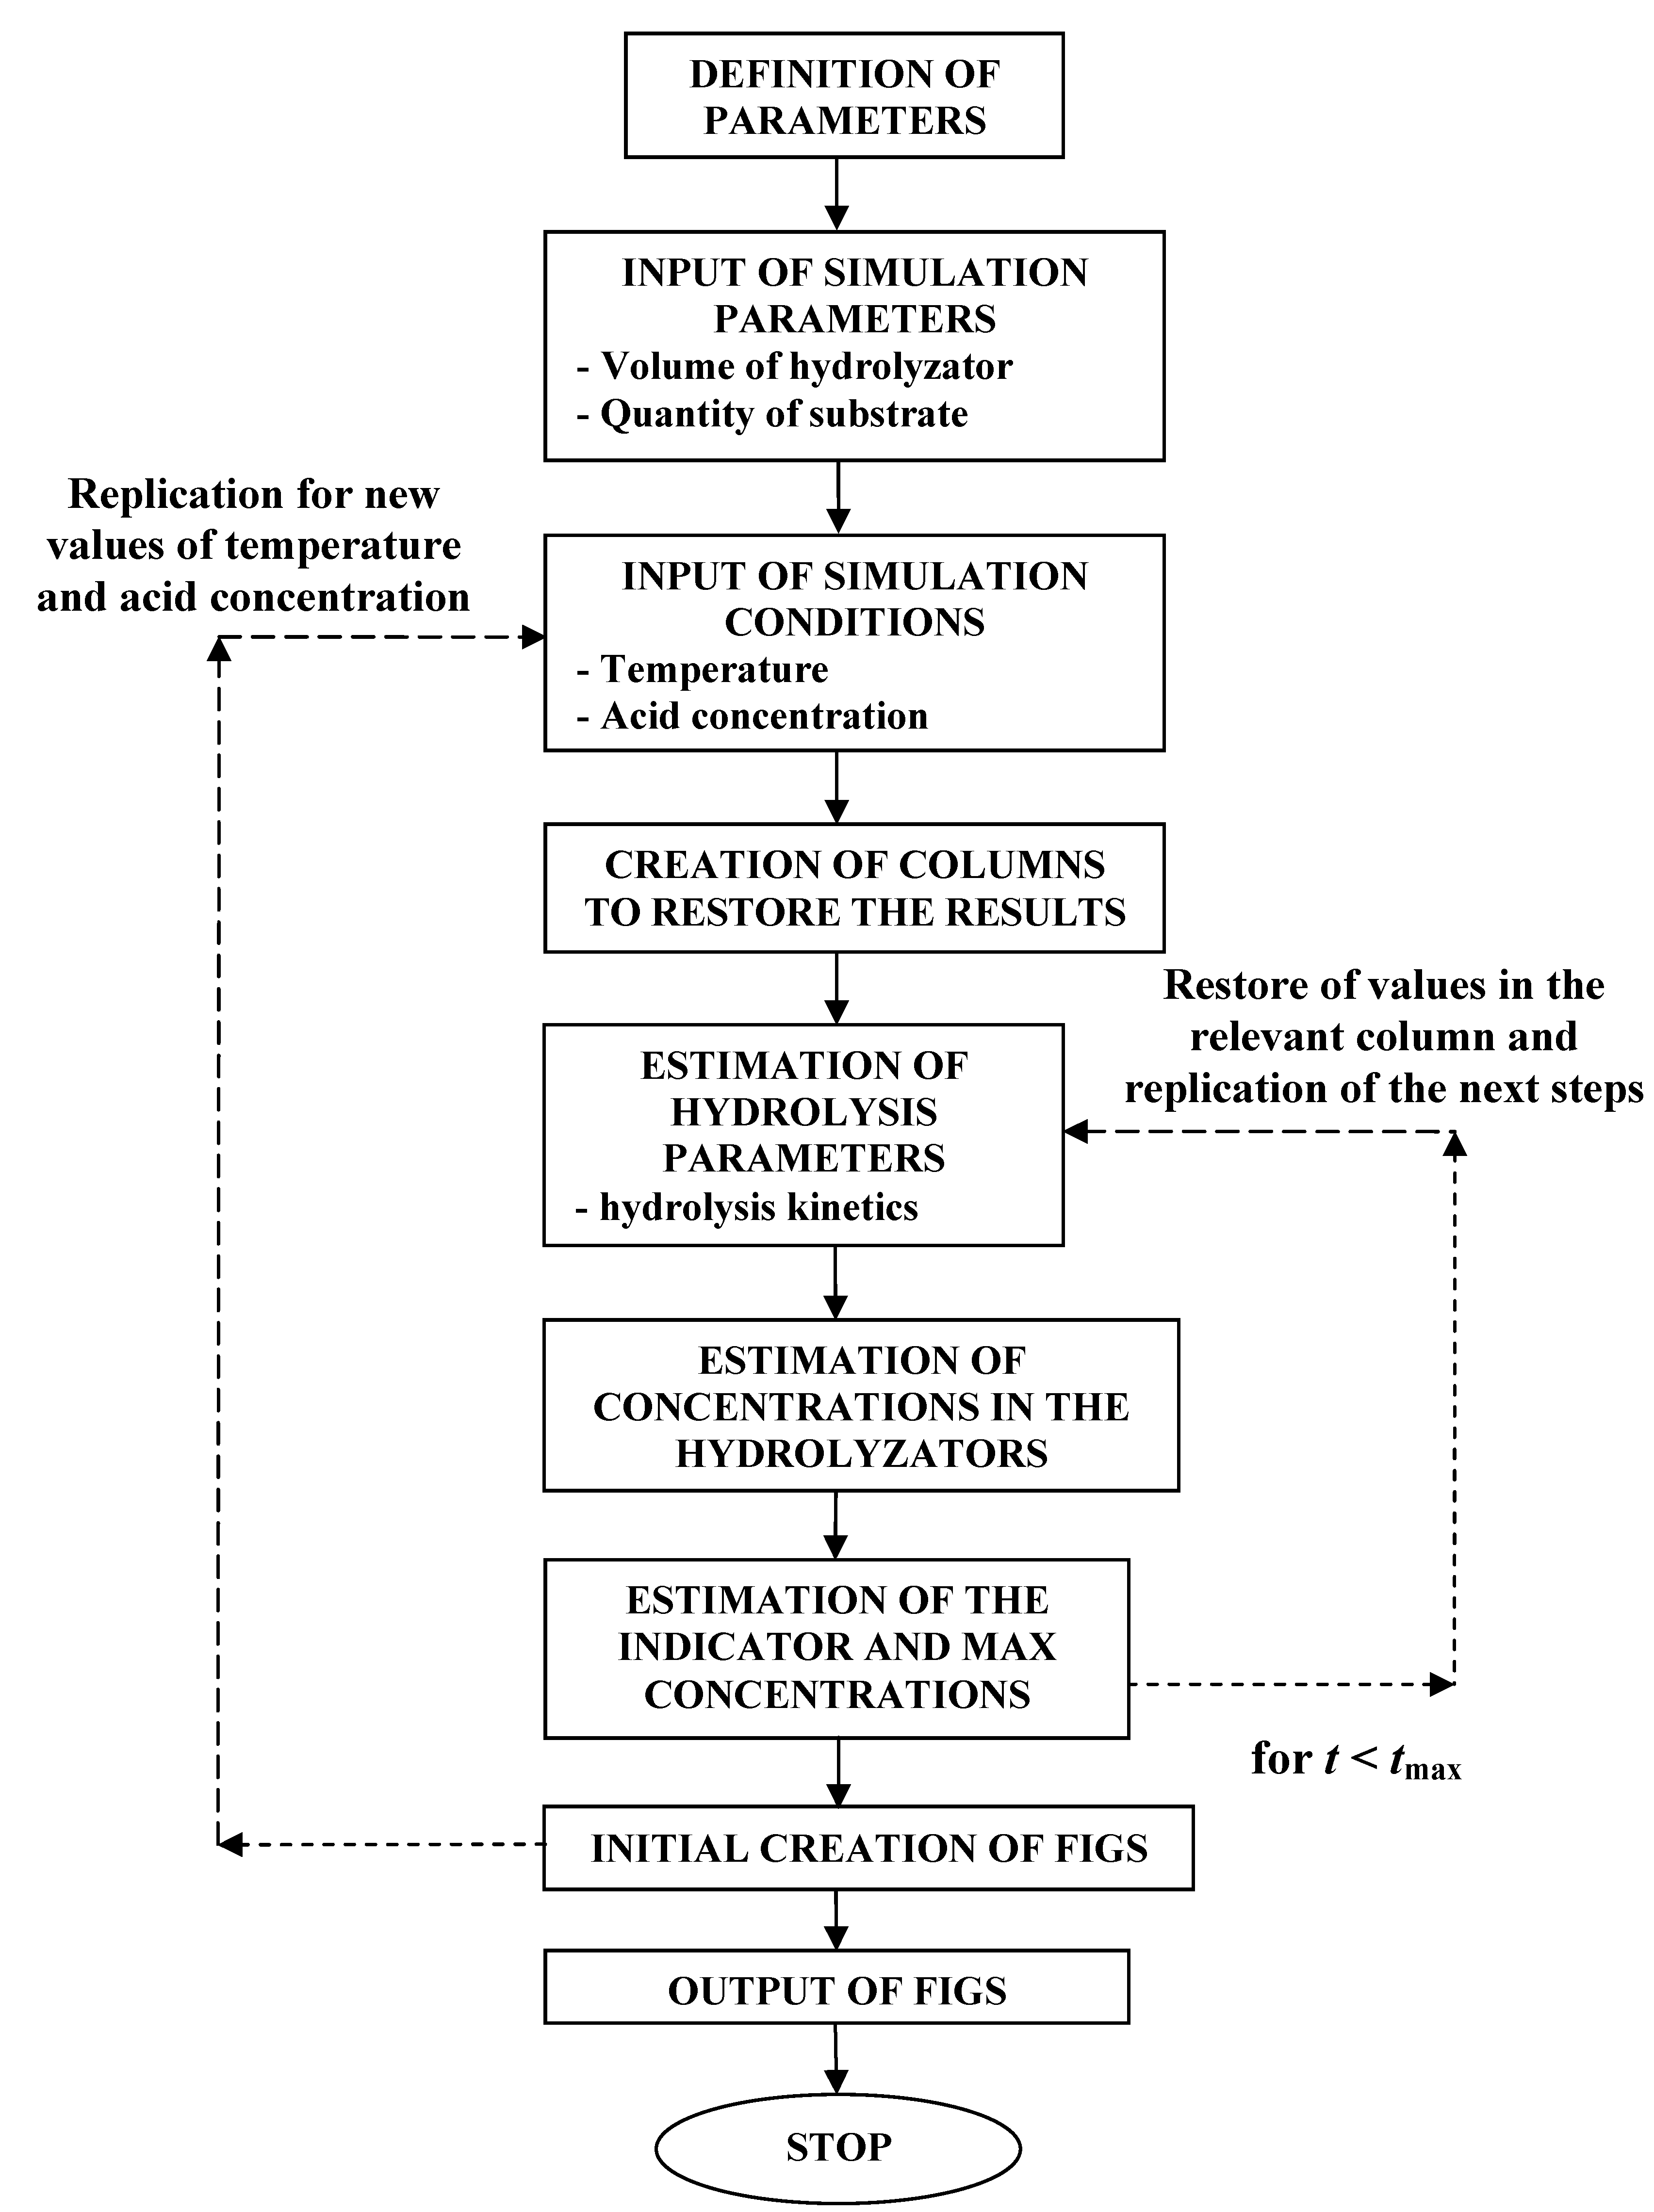
3.6. Simulation Method

The first step of the simulation was the development of a simulator in the Matlab 7.1 environment, which should have the maximum number of system variables possible. Thus testing many different scenarios becomes easier, while potential future changes in the code could enable its use to similar processes [38,39].
The graphic display of the resulted concentrations was essential for the hydrolysis simulation, allowing the comparison to be more direct and the results to be better displayed. The designed software was applied to different scenarios for different raw materials, conditions and parameters.
The different parameters of the selected reactors were:
  • volume
  • initial concentration of the LGC
The conditions that were altered per scenario were:
  • hydrolysis temperature
  • H2SO4 concentration
  • raw biomass material (substrate)
Figure 2. Logical flow of the developed module.
Energies 04 01601 g002
The estimated parameters for each different experiment were the concentrations of glucose, xylose, HMF and furfural. In order to introduce the fermentability of the solutions a “quality indicator” was created, which can show the ratio of sugars/degradation byproducts produced. The indicator used was the sum of sugar concentrations produced (in g/L) versus the sum of degradation product concentrations (in g/L). This parameter has been also used in other studies as indicative of the quality of hydrolyzates [21,22].
Initially the input data of each experiment were given. The next stage was the creation of empty vector-columns, with dimensions equal to the time steps, where the calculated parameters would be stored. Afterwards the hydrolysis kinetics for these particular conditions were assessed and then via the equations the values of the parameters were calculated and stored in the corresponding vectors. The previous stage was repeated for each time-step until the full scenario time was reached. Following the completion of calculations the commands of drawing and formulation of the figures were defined. At the last level of the code the figures formed by the computed data were drawn and exported as image files (Figure 2).

4. Results

4.1. General Comments

According to the results the mild hydrolyses of xylan and glucan happens under quite different conditions, something expected considering having the literature research. Xylan hydrolysis under favourable conditions occurs at temperatures that vary between 120–160 °C; while that of glucan ranges between 180–220 °C. Consequently under the conditions selected for efficient and qualitative xylan hydrolysis, part of the glucan remains practically unchanged, while, correspondingly, working under the conditions required for glucan hydrolysis, xylan is changed very fast into xylose and is degraded completely to furfural at a very high rate. This fact is reflected at the results with very low values of the quality indicator in ranges where glucan is hydrolyzed, as furfural concentration is extremely high.
Based on the previous analysis, it is obvious that the preferable method of hydrolysis is a two-stage one. Selecting the optimum parameters for each sugar, a second set of simulations is performed, in order to hydrolyze xylan, in the first stage, where glucan remains practically unaffected. Then, considering the removal of the produced xylose and furfural, the solution is hydrolyzed under conditions which are favourable for the production of glucose. Thus glucose solutions with considerably higher indicator values than those with the one-stage process are produced.
All simulation data show that increasing acid concentration decreases the time required for sugar production, however likewise the rate of production of inhibitors is increased. This results in the reduction of quality of the solutions.
The actual time ranges of the sugar production were selected at areas where the curve of the corresponding sugars concentration presented a smooth decline. The investigated areas were chosen as long as the corresponding inhibitor was within the previously set limits. Consequently the reported concentrations are not necessarily the highest achieved, since these are referred to increased levels of degradation products.

4.2. Comments on Corn Stover Hydrolysis

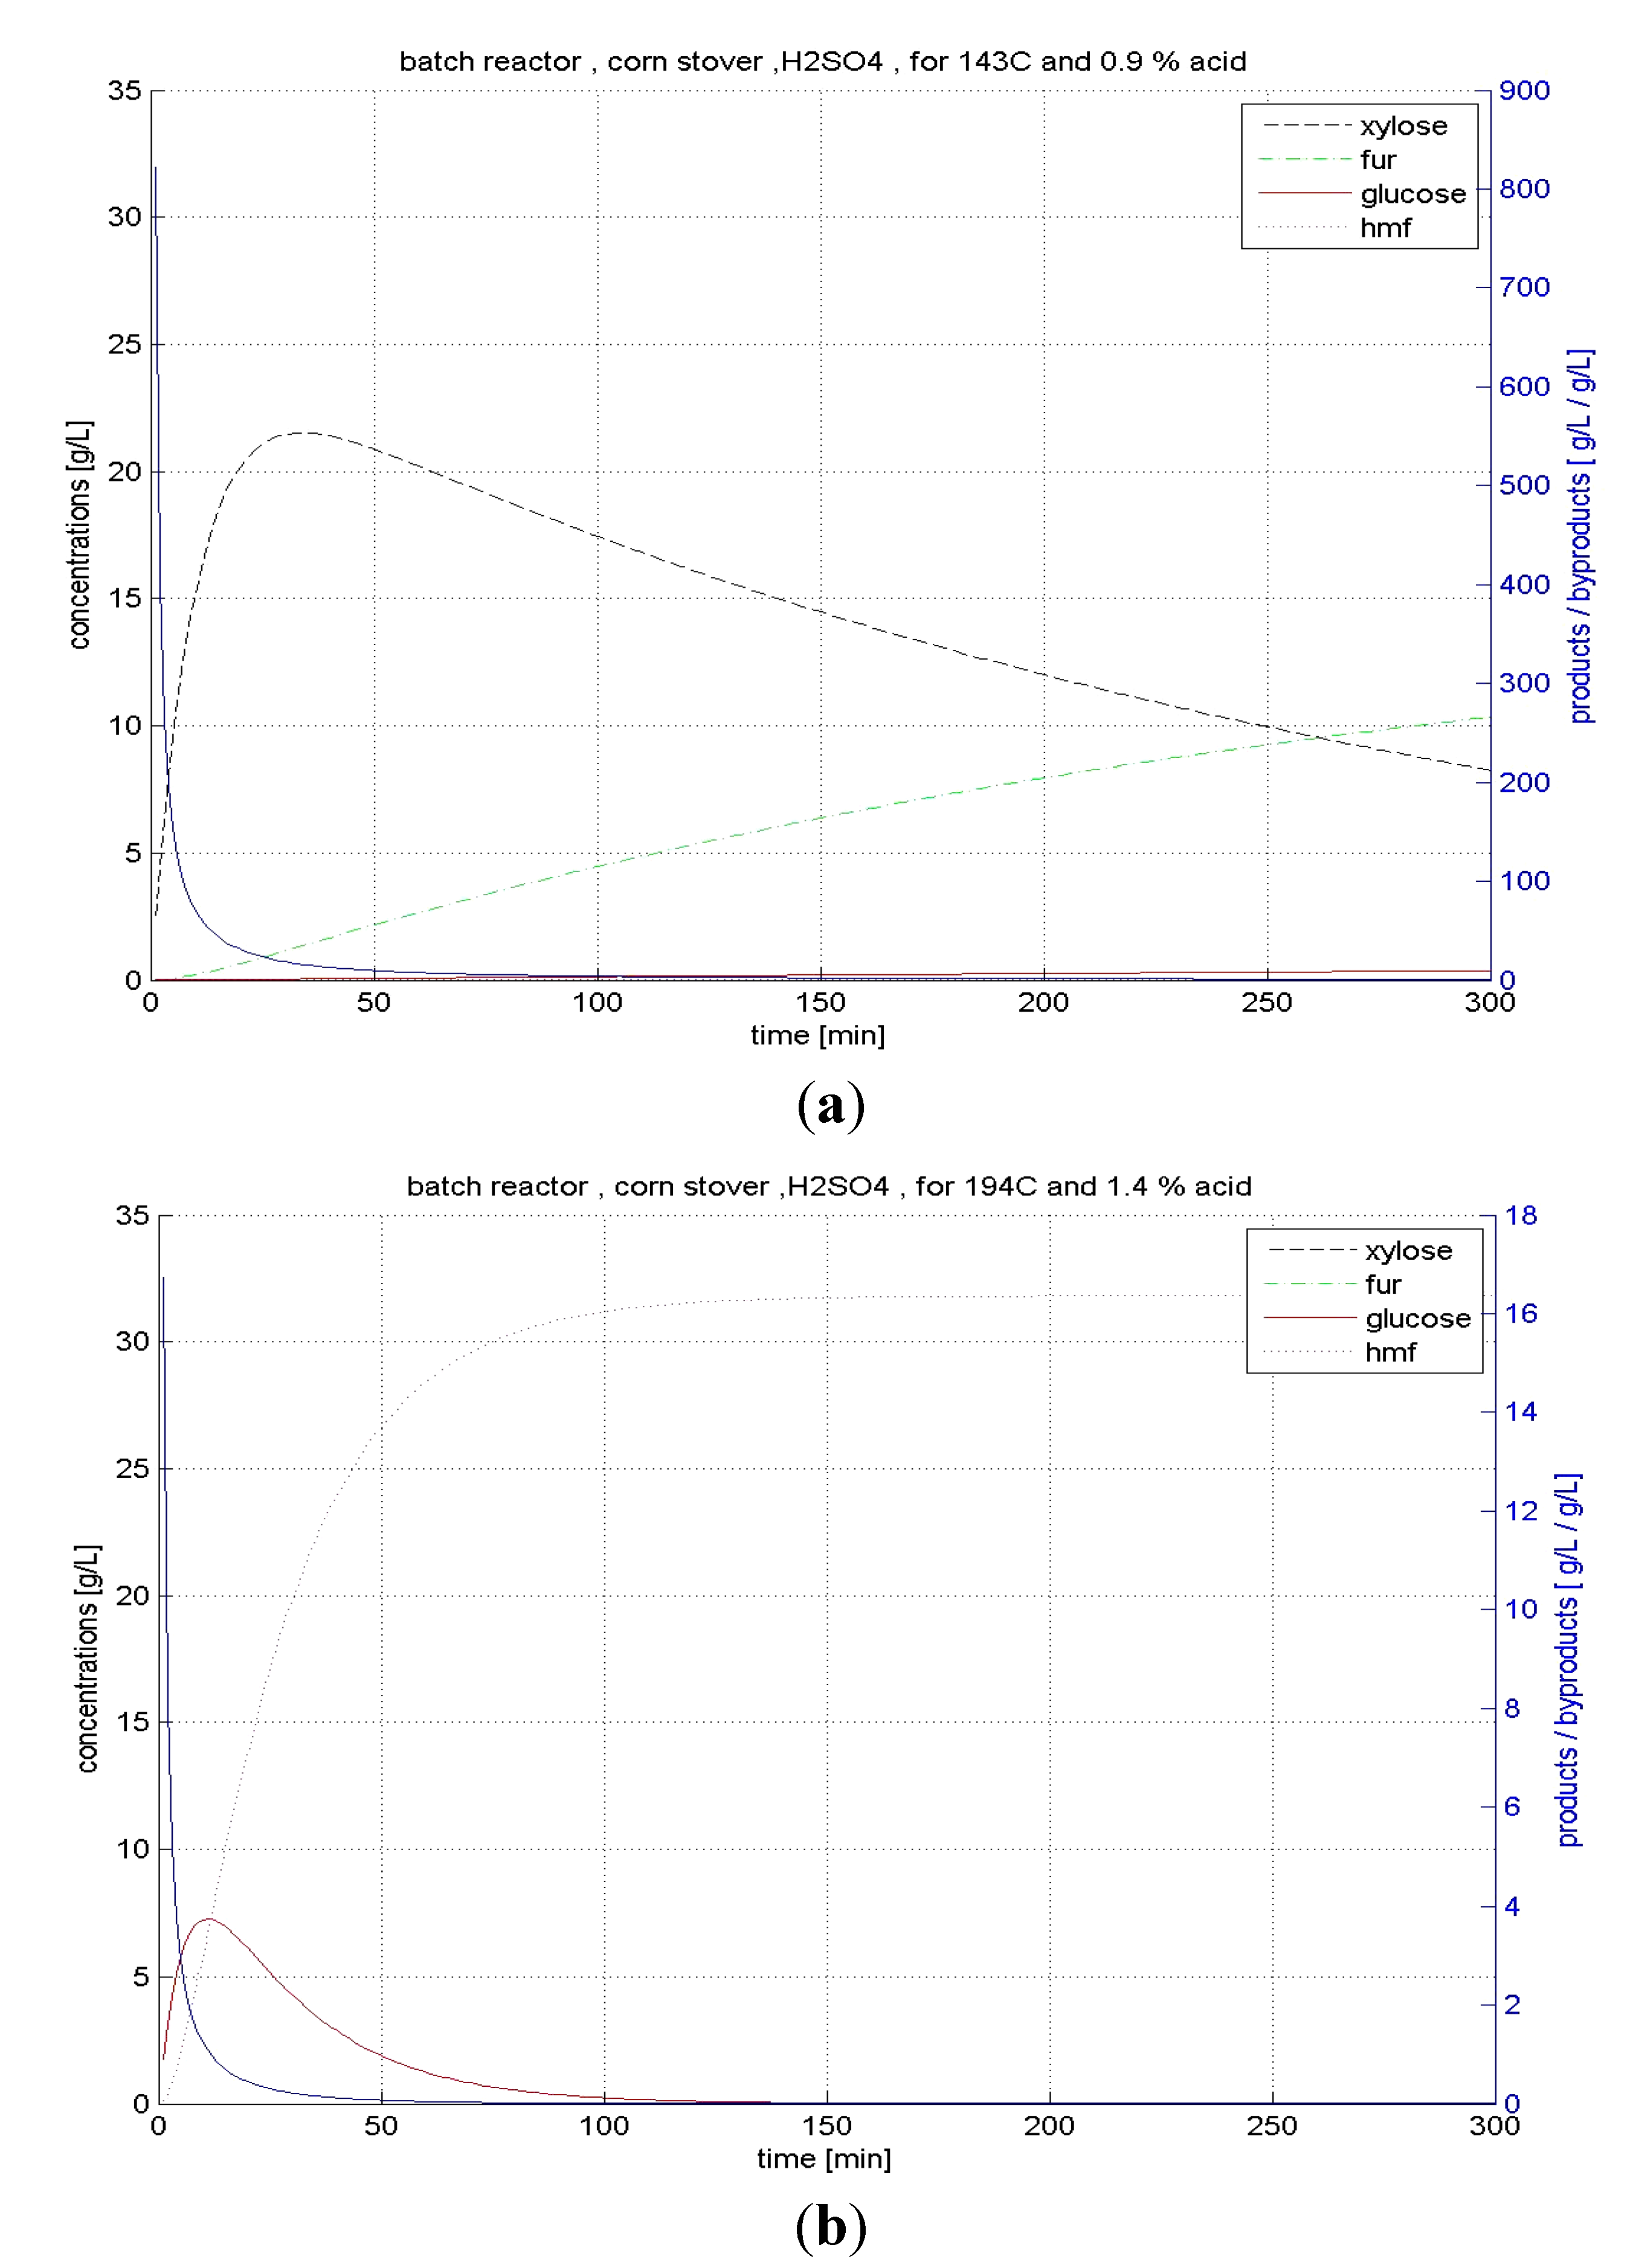
4.2.1. Hydrolysis in BR

Xylan is hydrolyzed at high efficiency even under the initial conditions of 120 °C for acid concentrations >1%. In general the yield of xylose is high enough, reaching concentrations around 20 g/L, while furfural concentration remains low enough to give solutions with indicator values >10 within the areas that we already have pointed out. The glucan part does not react substantially under these conditions and specifically in the relatively short time of hemicellulose hydrolysis. At temperatures >180 °C significant glucose conversion is observed. However this conversion is not particularly efficient and the glucose solutions produced range between 5.5–6.0 g/L, while HMF fluctuates in the selected limits we have identified. The simulation was repeated using lower temperature and acid concentration increase step (Figure 3a,b).
Figure 3. (a) Optimum conditions of xylan hydrolysis of corn stover in BR; (b) Optimum conditions of glucan hydrolysis of corn stover in BR.
Energies 04 01601 g003

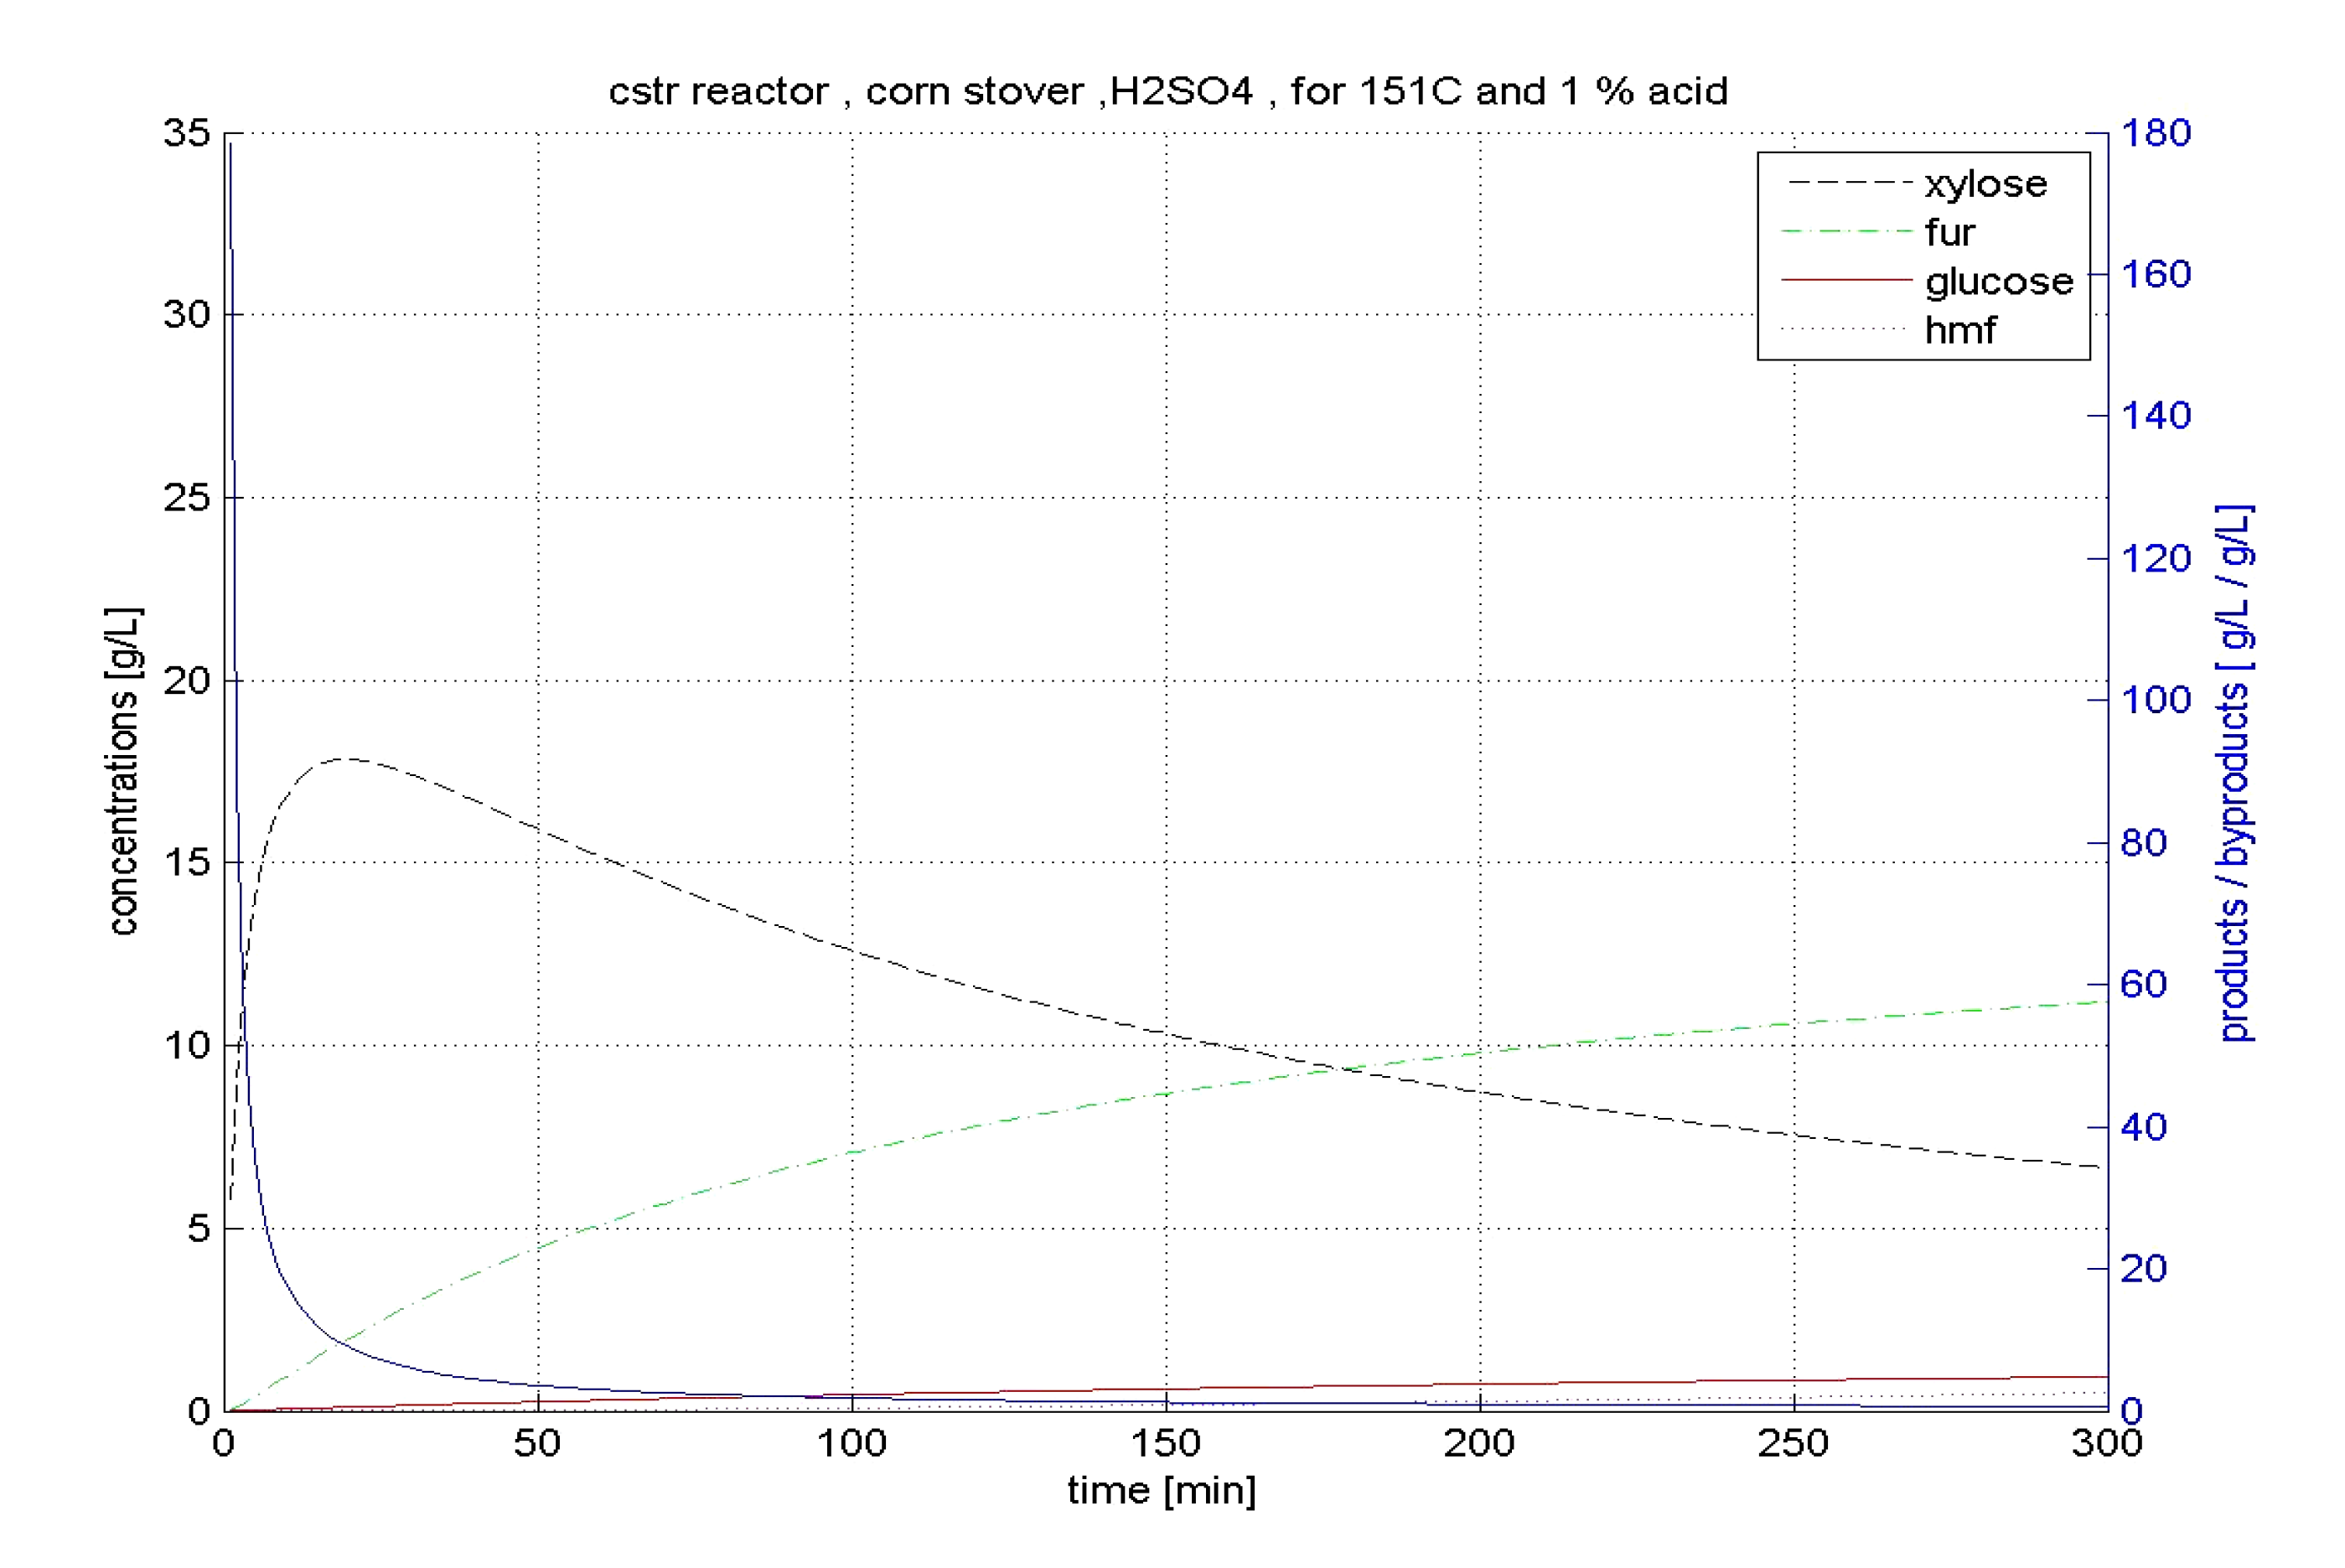
4.2.2. CSTR Hydrolysis

In CSTR the yield of sugars is regularly lower. Xylan is hydrolyzed easily at temperatures around 120–150 °C giving xylose concentrations 16.0–17.5 g/L with furfural within the limits set. The indicator fluctuates near a value of 10, while glucan begins to decompose above 160 °C with average acid concentrations. However even under condition, in which it is theoretically favourable to achieve more efficient conversion to glucose, the concentrations of the produced solution remain low while the level of HMF is high in areas with the highest concentration. In the most favourable areas, in terms of quality, we get glucose concentrations <5.0 g/L. An additional trial was performed in four different ranges of temperature and acid concentrations (Figure 4).
Figure 4. Optimum conditions of xylan hydrolysis of corn stover in CSTR.
Energies 04 01601 g004

4.3. Comments on Hardwood Hydrolysis

4.3.1. BR Hydrolysis

As presented in the brief evaluation tables, hardwood hydrolysis yields significant concentrations even from the initial simulation conditions with better output than corn stover. The xylan part is hydrolyzed efficiently in the favourable ranges and produces solutions at temperatures of 120–130 °C, with xylose concentrations near 20 g/L, while the indicator fluctuates between 13.5 and 15.5. A high percentage of the glucan part is hydrolyzed even at the temperature of 160 °C. Glucose concentration, while HMF is kept within the set limits, is around 15 g/L. The output is consequently better than the case of corn stover. After the total evaluation of diagrams, further trials with four different combinations of acid and temperature conditions were undertaken (Figure 5a,b).
Figure 5. (a) Optimum conditions of xylan hydrolysis of hardwood in BR; (b) Optimum conditions of glucan hydrolysis of hardwood in BR.
Energies 04 01601 g005

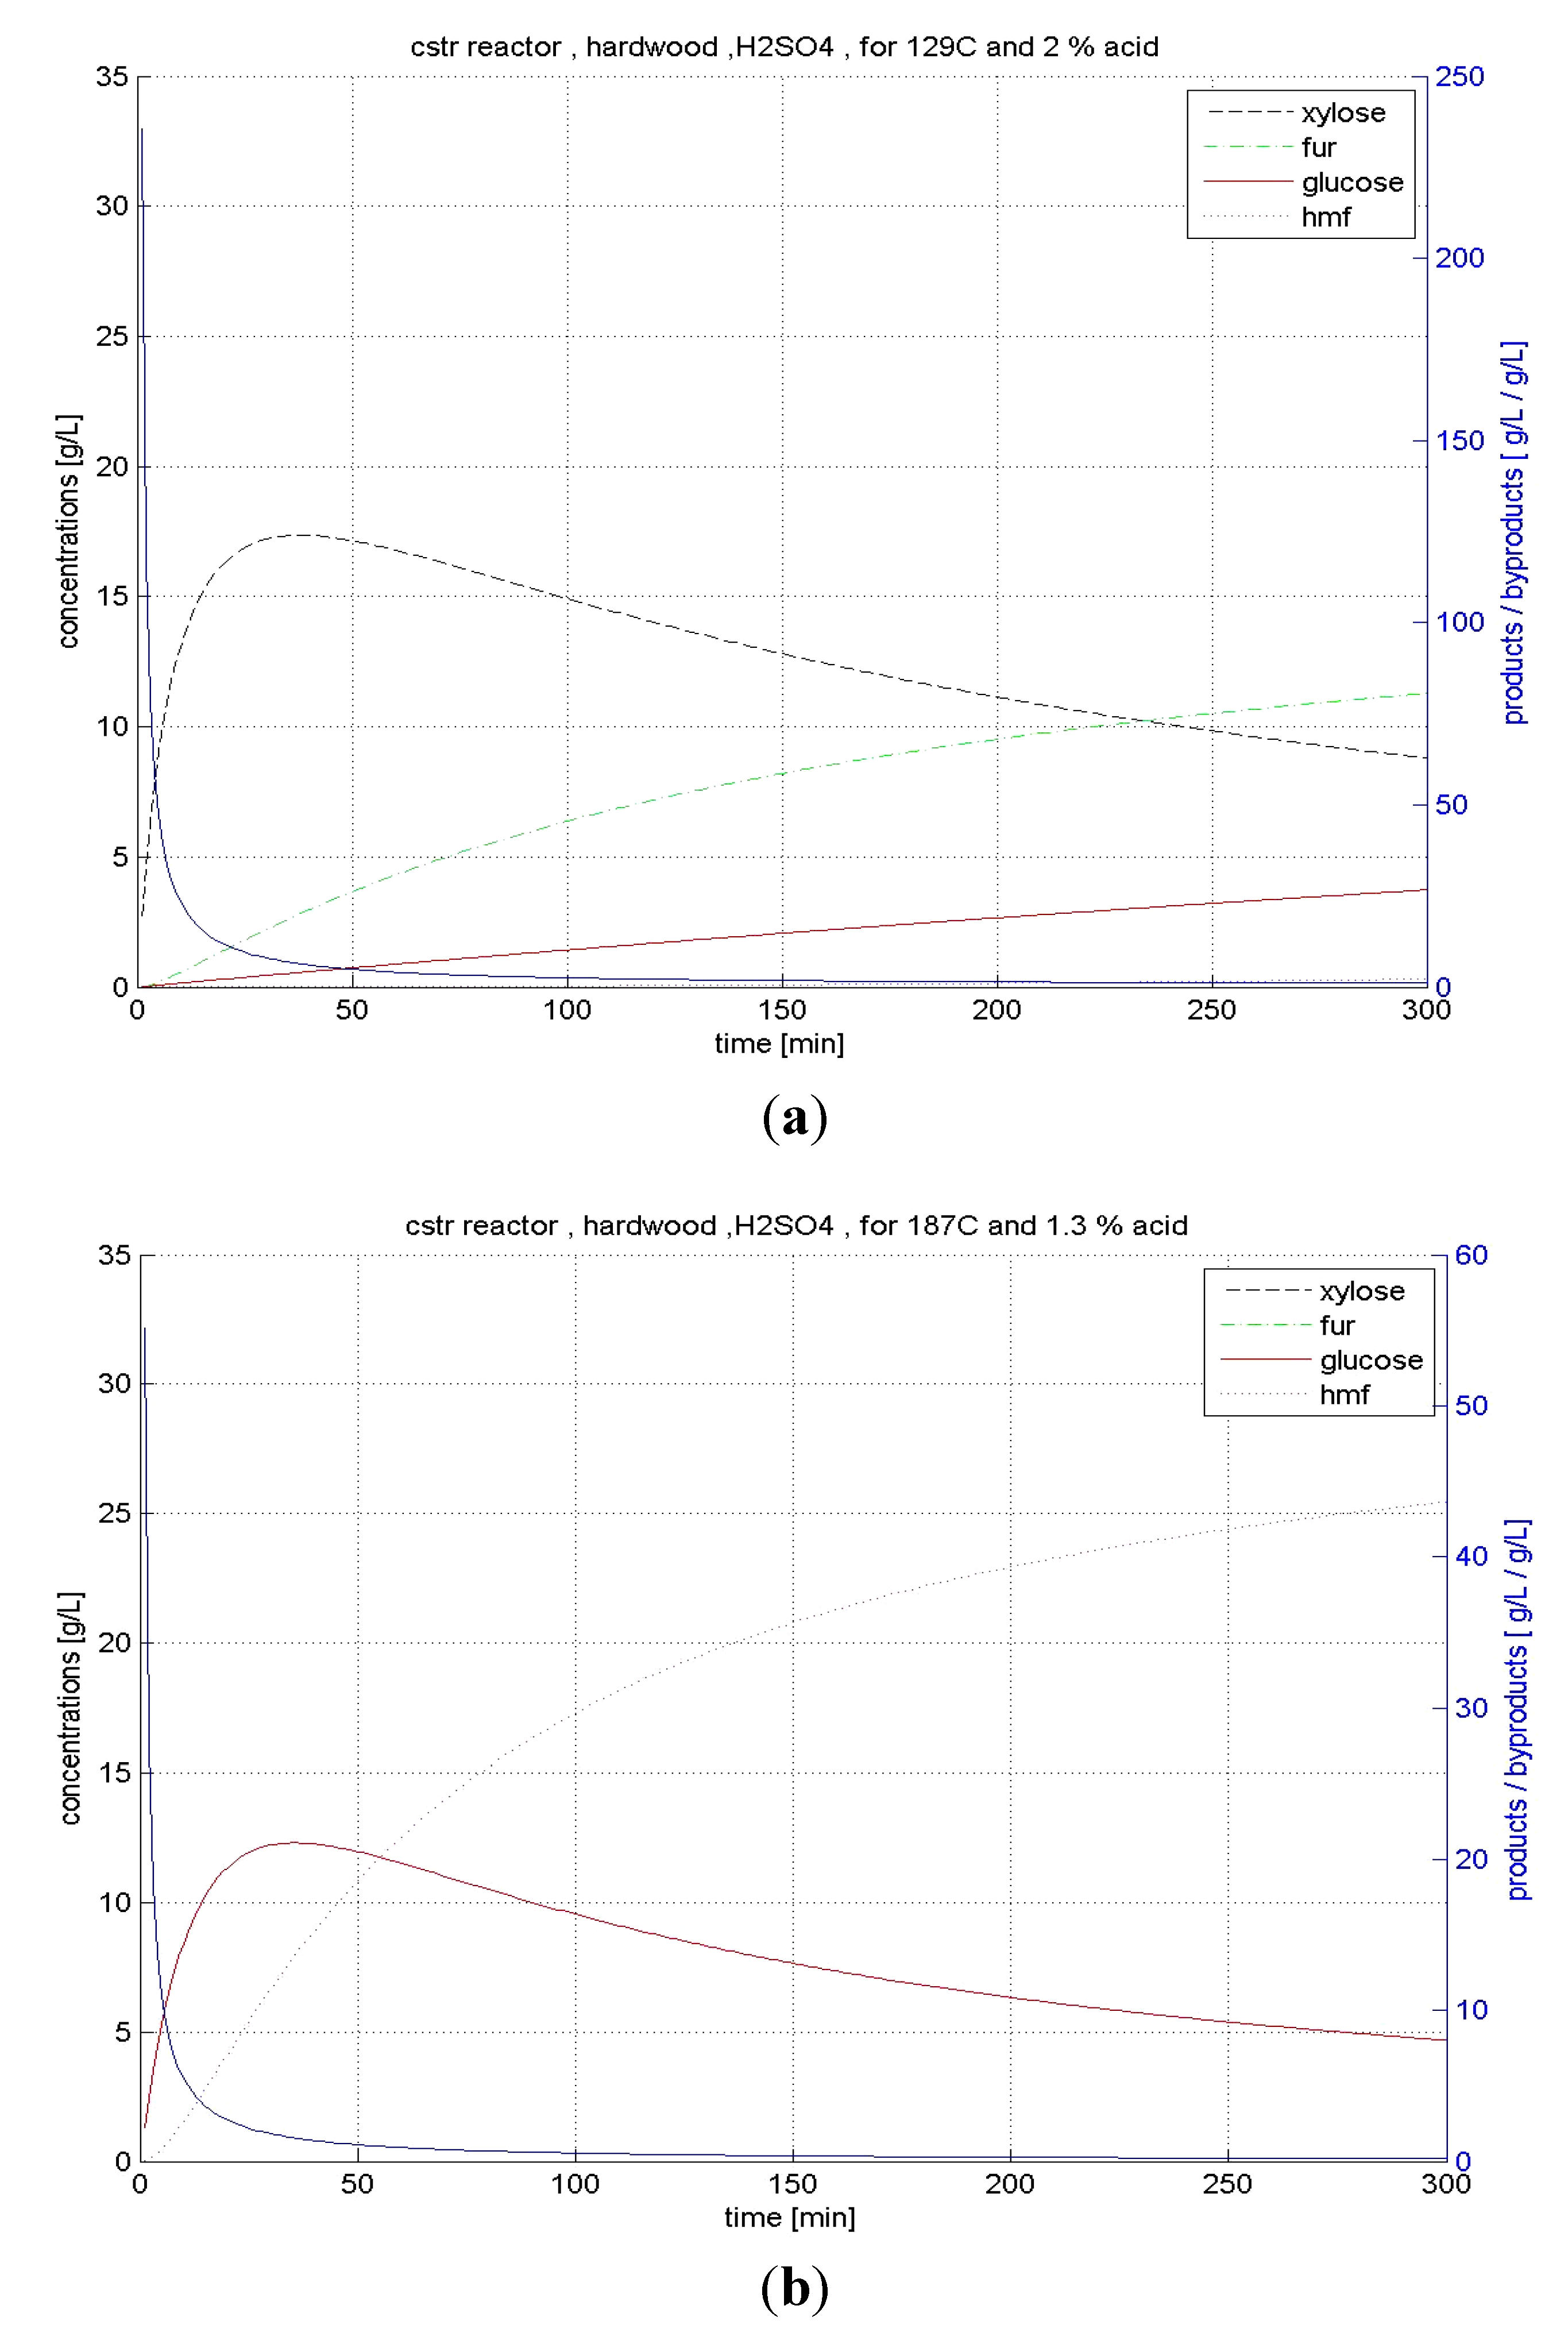
4.3.2. CSTR Hydrolysis

In CSTR hydrolysis the behaviour of the substrate is similar to those of the BR case; however the sugar yields are consistently lower. Xylose is produced at high levels from 100 °C for acid concentration >1%. Under the ideal conditions, concentrations around 15.5–16.5 g/L are achieved, while the indicator takes values between 9.5–10.5. Glucose starts to be produced in appreciable concentrations above 160 °C, while better behaviour is also displayed after 180 °C where concentrations around 10.0 g/L are achieved. Additional trials were performed in order to find the most optimal conditions (Figure 6a,b).
Figure 6. (a) Optimum conditions of xylan hydrolysis of hardwood in CSTR; (b) Optimum conditions of glucan hydrolysis of hardwood in CSTR.
Energies 04 01601 g006

4.4. Comments on Wheat Straw Hydrolysis

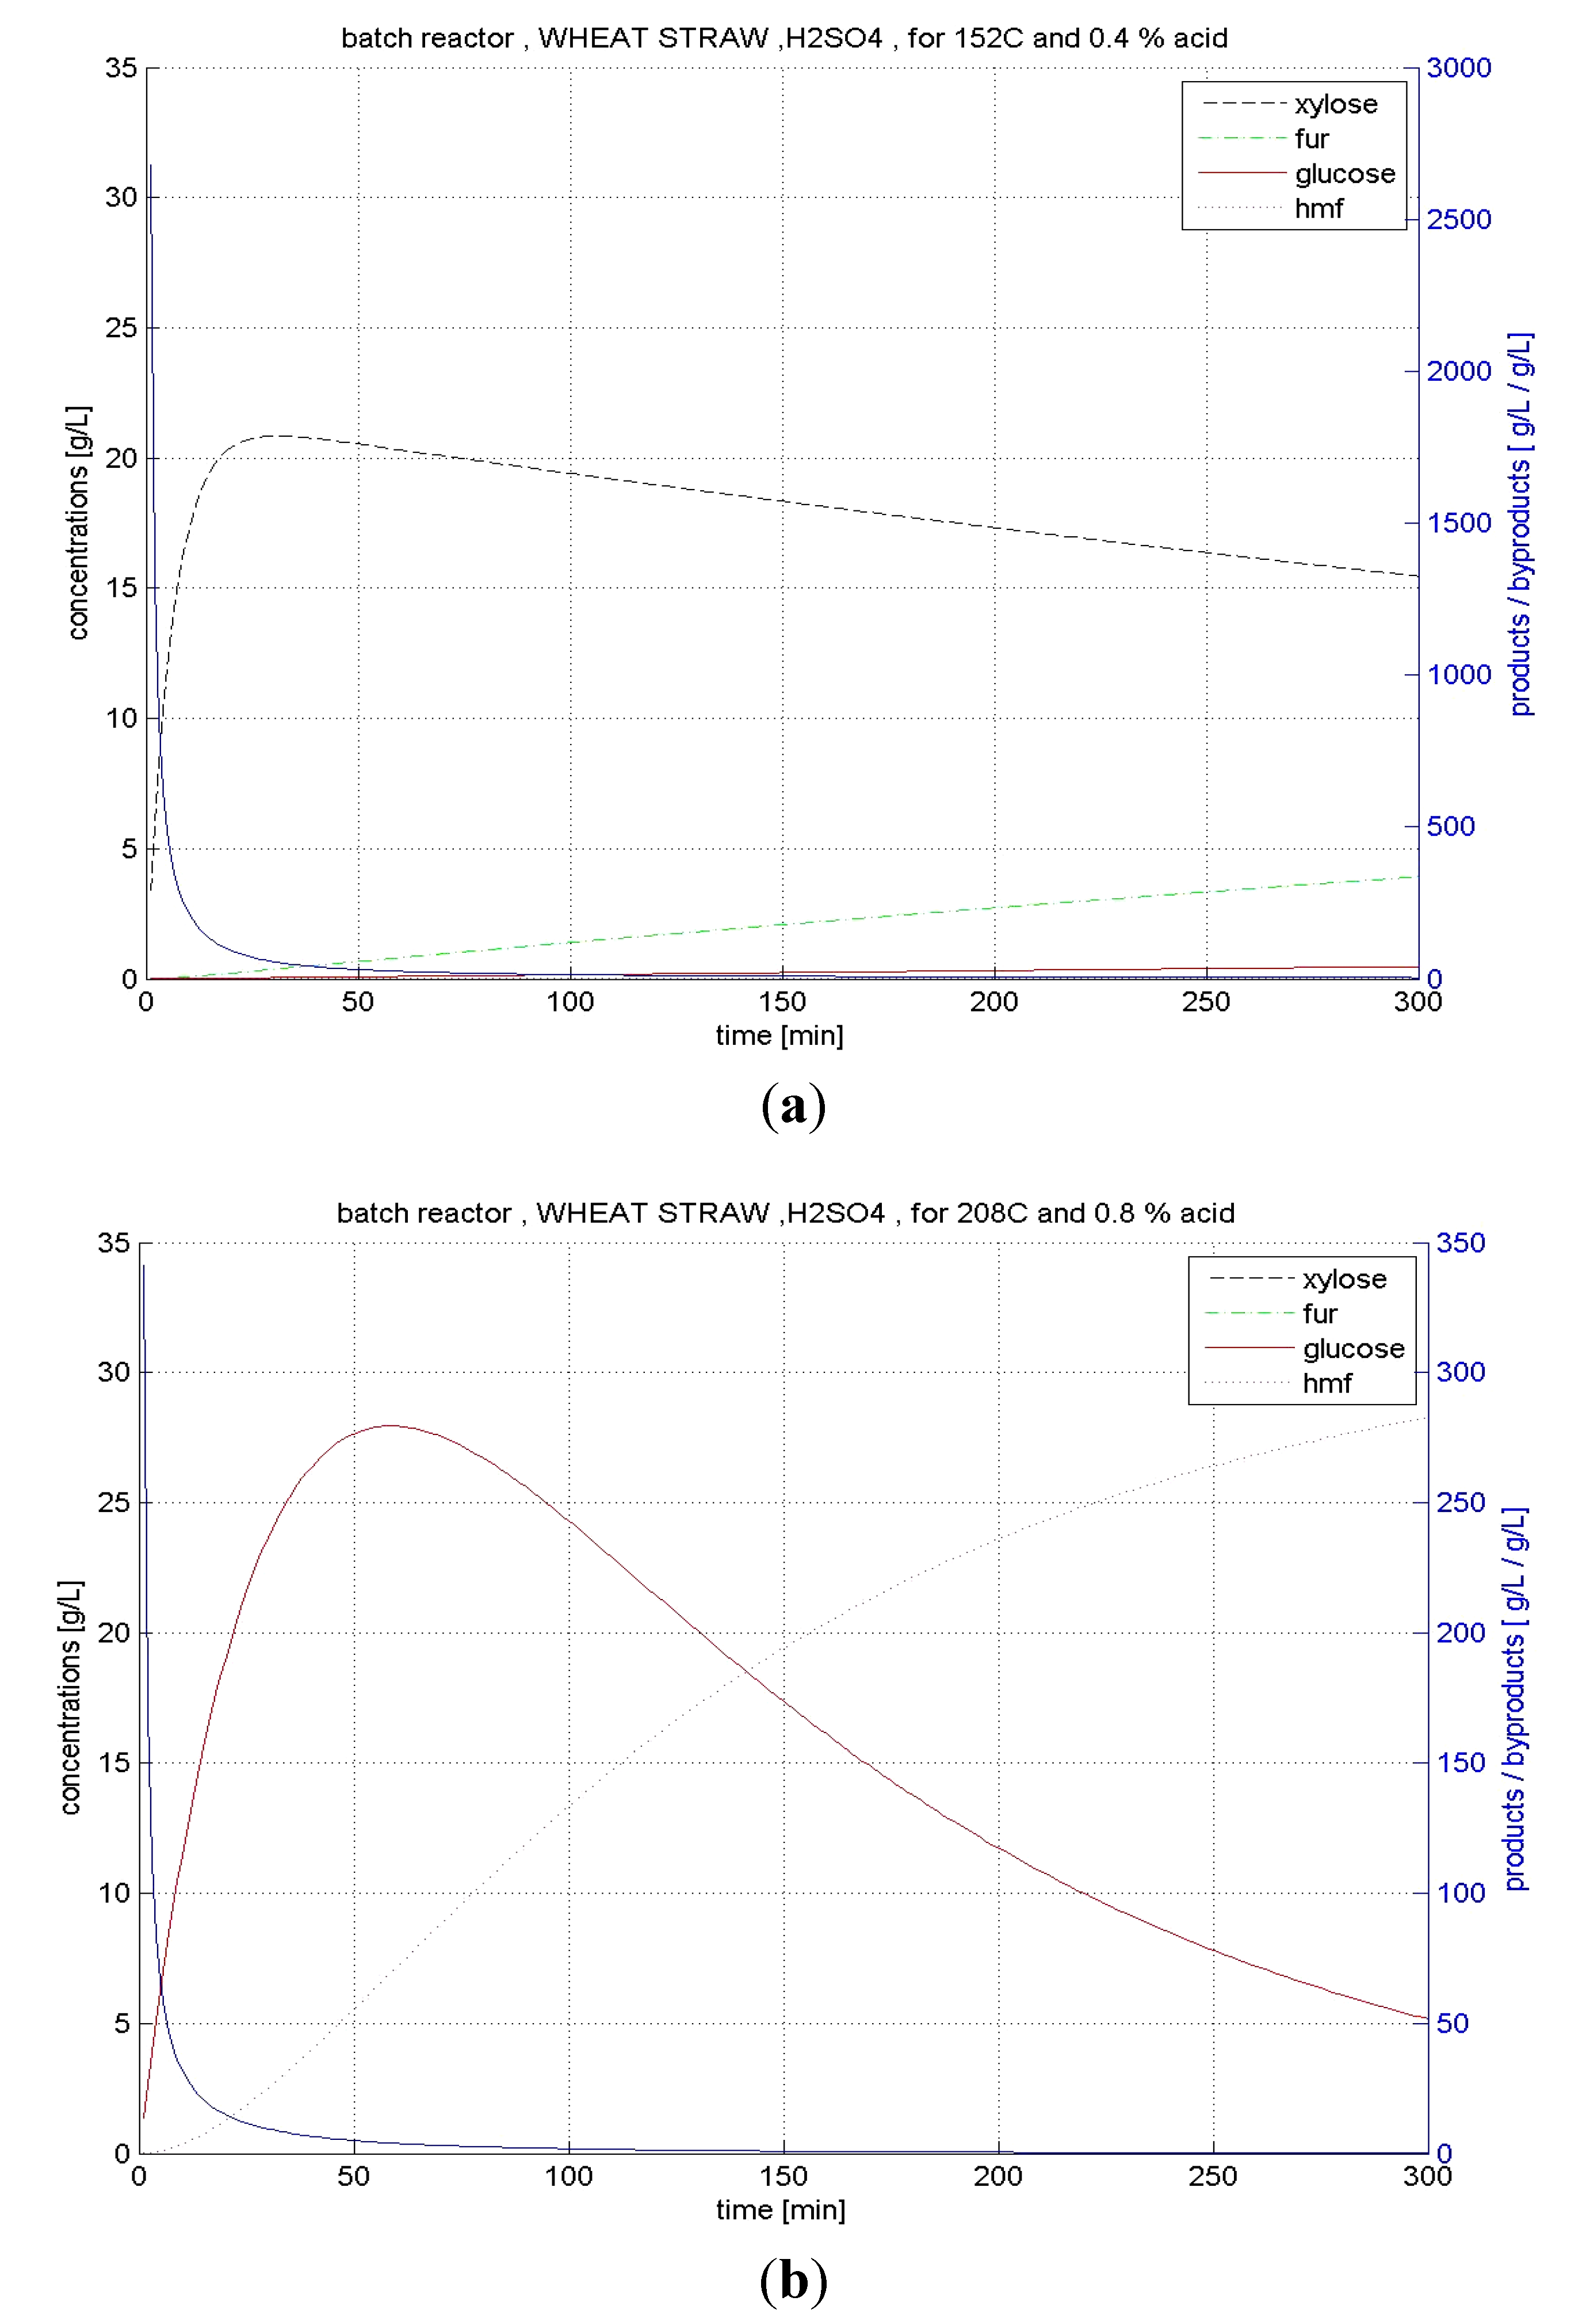
4.4.1. BR Hydrolysis

The wheat straw hydrolysis gives the best results both for sugar yields and the quality of the solution. The behaviour displayed suggests that hardwood can be hydrolysed favourably even at low temperatures (e.g., good yield xylose at 110 °C). In the 110–120 ° C temperature range and with acid concentration solutions >1% xylose concentrations of 19–20 g/L are produced, but after long times.
At higher temperatures (130–150 °C) the time is decreased considerably while the xylose concentration is also consistently near 20 g/L, apart from that it is remarkable that the furfural concentration remains regularly under 1 g/L. As a result high indicator values are recorded, from 25 to 50. The glucan part begins to decompose above 160 °C for medium acid concentrations. In any case up to 180 °C glucose does not reach its best yield, something that happens in the temperature zone between 190–210 °C. The concentrations achieved at these conditions reach 22–25 g/L and the HMF remains within the desirable limits. Additional trials were run in order to find the optimal conditions (Figure 7a,b).
Figure 7. (a) Optimum conditions of xylan hydrolysis of wheat straw in BR; (b) Optimum conditions of glucan hydrolysis of wheat straw in BR.
Energies 04 01601 g007

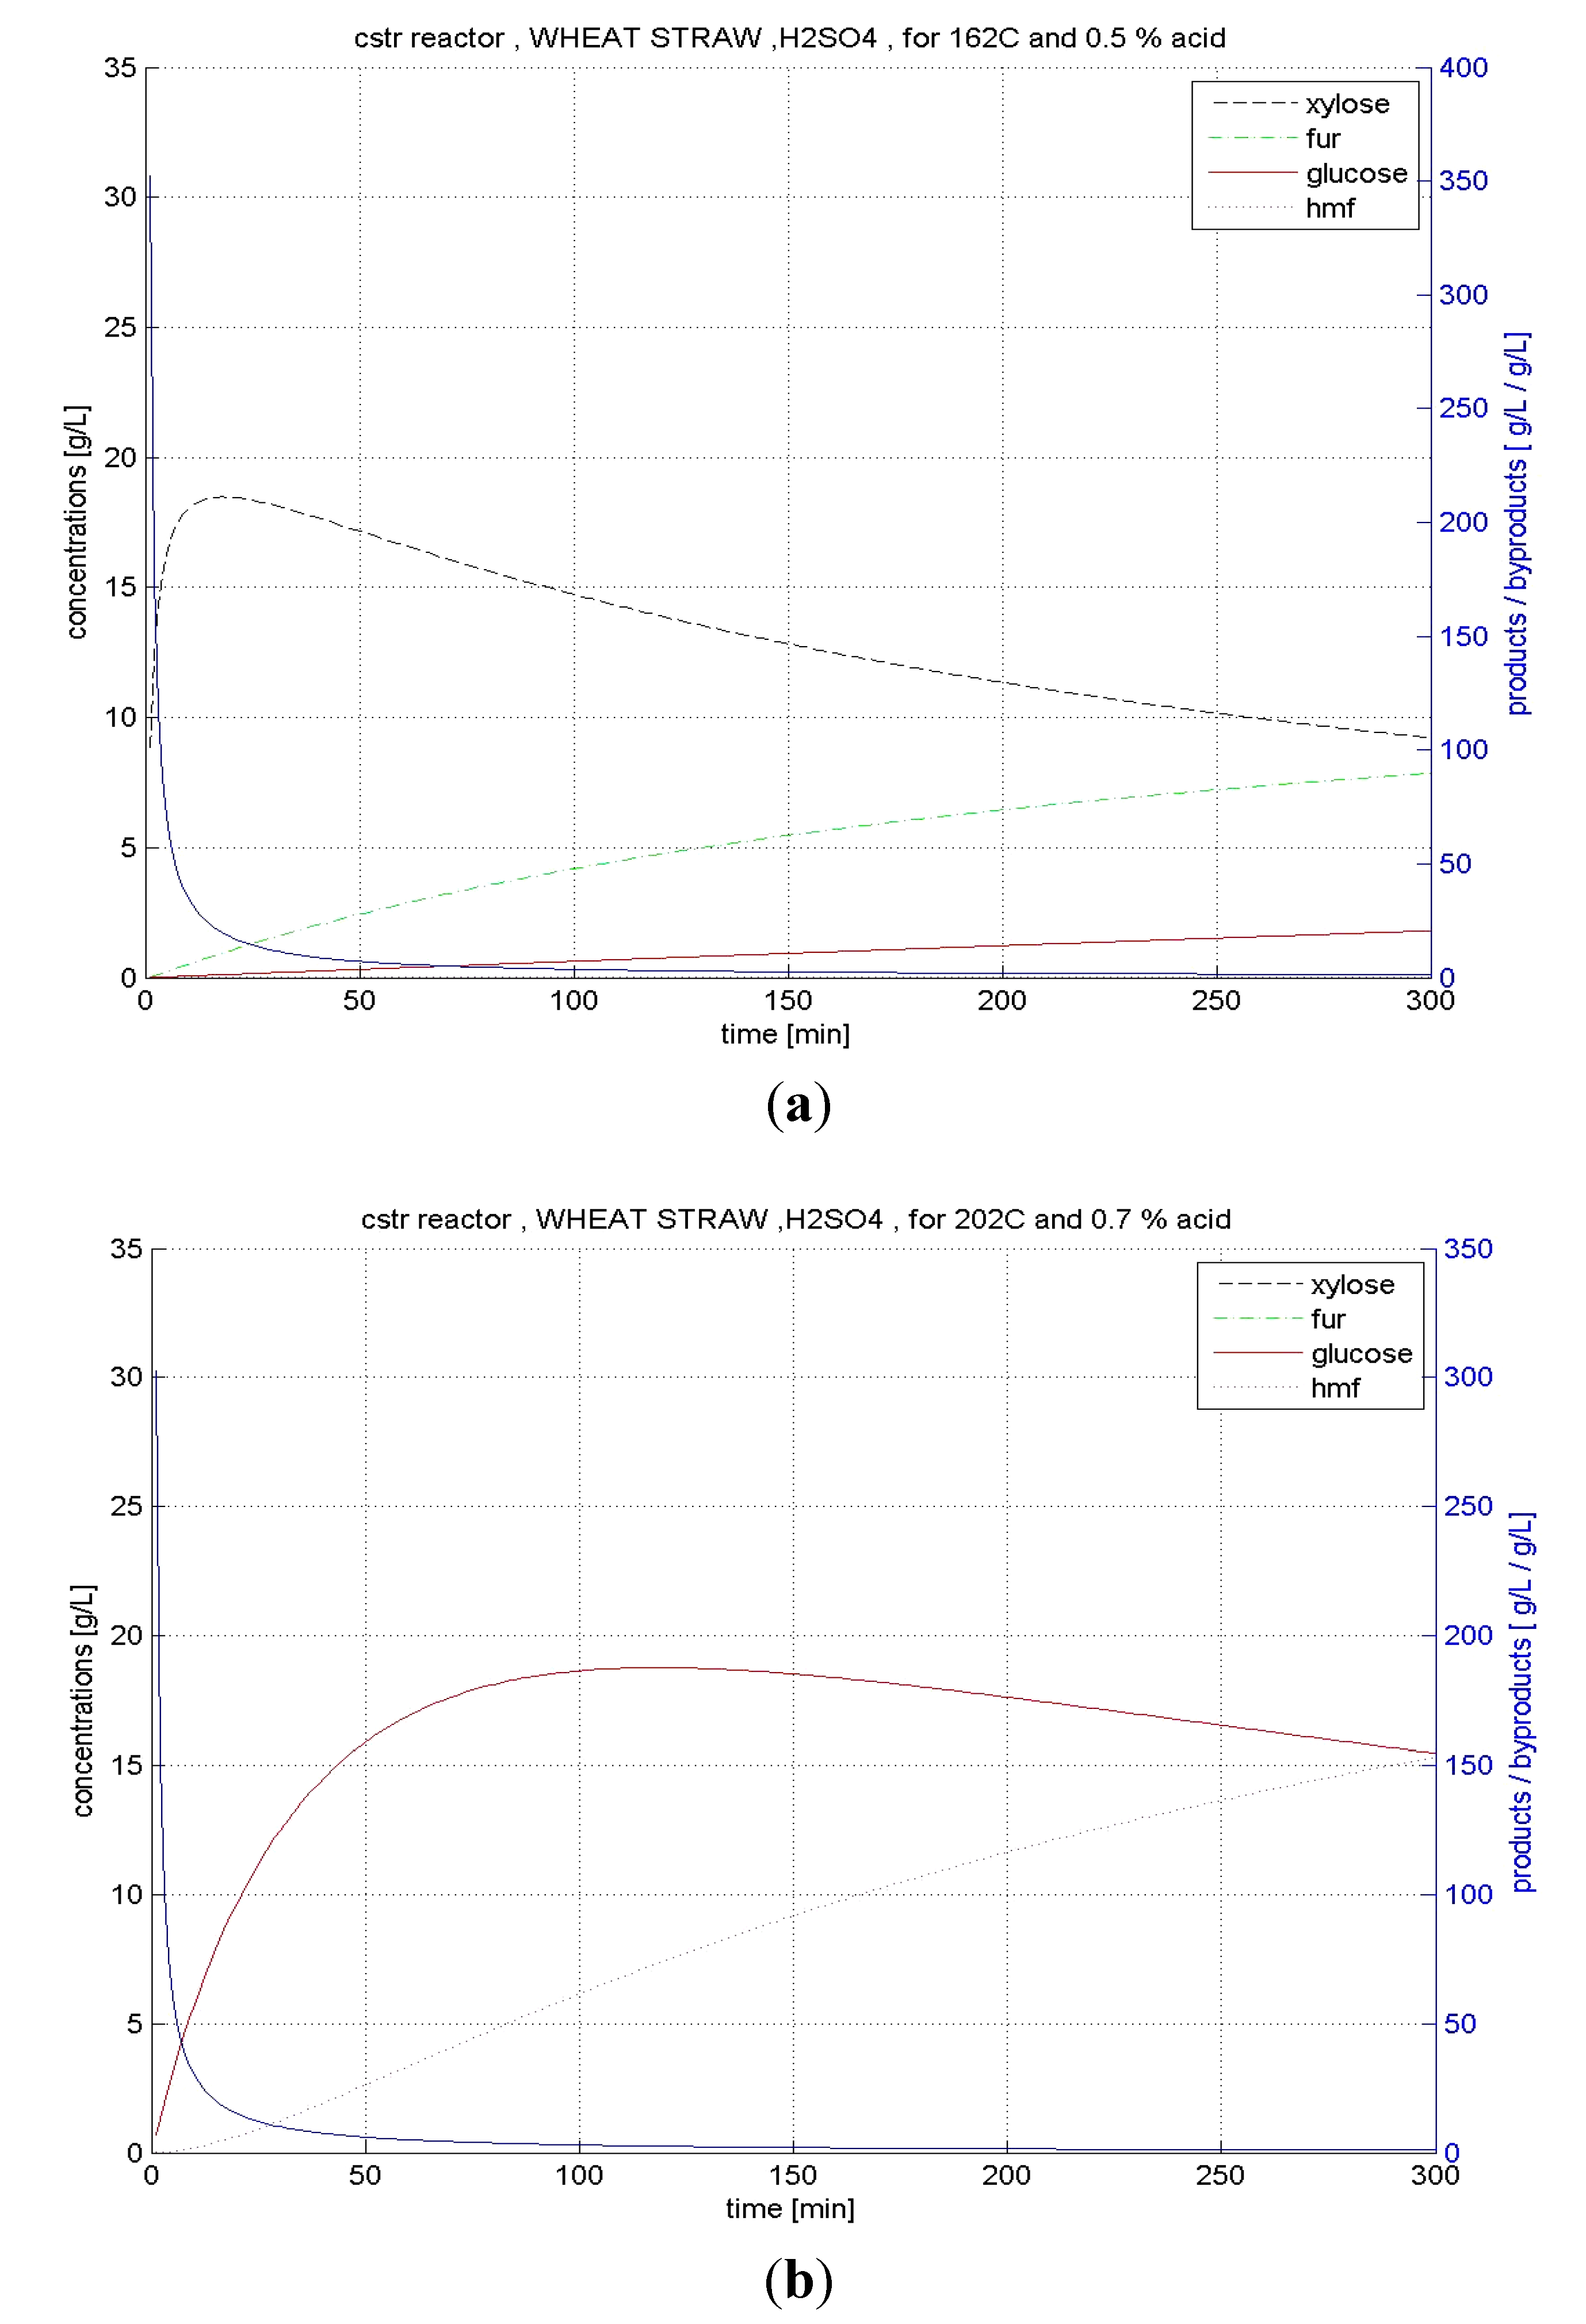
4.4.2. CSTR Hydrolysis

In the case of CSTR, the behaviour of hardwood towards acid concentration and temperature is similar to that of the BR. However the sugars concentrations are also in this case lower compared to the corresponding ones seen in the BR. At temperatures between 130–160 °C the xylose values fluctuate between 16–18 g/L, while under mild acid conditions (>1%) furfural is produced in concentrations up to 1.0 g/L (Figure 8a,b).
Figure 8. (a) Optimum conditions of xylan hydrolysis of wheat straw in CSTR; (b) Optimum conditions of glucan hydrolysis of wheat straw in CSTR.
Energies 04 01601 g008

4.5. Overall Evaluation of Raw Materials and Reactors

All three different studied materials gave very good results for the first stage of hydrolysis (xylan hydrolysis). Specifically in the BR the xylose yields are found >80%, with wheat straw reaching a maximum of 96%. Taking the conditions of hydrolysis into consideration, hardwood achieves an optimal yield at a lower temperature than the other two, while corn stover demands lower temperature than wheat straw.
The glucose results, which are the most important for efficient ethanolic fermentation, present great variation between materials. Using corn stover hydrolysis yields sugars reaching 15% efficiency under optimal conditions, while keeping the quality indicator lower than 2. For hardwood the data shows significant improvement, with yields around 20–40% of the theoretical and of course better quality of solutions with indicator values of 2–3. The best results, even for glucose, were produced from wheat straw hydrolysis. Under optimum conditions the sugar yield fluctuates between 35–55%, while the best quality is reported and the indicator ranges from 5.0 to 7.5. Temperature presents relative uniformity for all materials and takes values between 190 and 200 °C. The results are compiled in Table 4.
Table 4. Brief presentation of yields and indicators of raw materials under the optimum conditions.
LGCReactorSugarΤ (°C)ac (% w/w)Yield (%)Indicator
Corn stoverBRxylose1430.987.918.66
glucose1941.414.81.95
CSTRxylose1511.072.411.92
glucose1851.69.21.35
Hard- woodBRxylose1222.583.114.66
glucose1980.639.82.67
CSTRxylose1292.060.610.84
glucose1871.323.63.25
Wheat strawBRxylose1520.496.170.82
glucose2080.855.97.83
CSTRxylose1620.585.323.58
glucose2020.736.25.04
These results are in agreement with those presented by other researchers. Bhandari et al. [19] worked in autoclaves with corn stover under conditions of 140–240 °C in 0.5–1.5% acid and achieved yields of 60–75% for xylose and 5–25% for glucose. Veeraghavan et al. [24] by hydrolyzing hardwood in autoclave under 140–160 °C conditions, achieved yields of 65–85%. Abasaeed and Lee [40] working with hardwood in BR at 198–215 °C and 1–3% acid achieved glucose yields of 35–45%. Ranganathan [18] working in autoclave with wheat straw at temperatures 120–210 °C and 0.5–1.5% acid, was able to produce 80–95% xylose [20]. Jimenez and Ferrer [41] in a 150 mL Berghof reactor using wheat straw under 0.5–4.0% acid conditions achieved glucose yields as high as 35% of the theoretical value.

5. Conclusions

Among the three different studied LGCs, wheat straw gave the best results. The glucose yields, based on the theoretical potential, under optimum conditions were 10–20% higher than the other ones; this substrate provided the maximum indicators, allowing an easier and more economic fermentation process.
Between the two studied reactor types (BR and CSTR), the BR design favours the hydrolysis process, displaying xylose yields higher by 10–20% than the corresponding of CSTR for all LGCs used; likewise glucose values where higher by 5–20%. Finally the quality indicator was also higher for each substrate working with BR rather than CSTR.
The results are in accordance with experimental data from many other researchers. The main advantages of the developed simulator are the quick calculations and flexibility; several different elements, such as indicators and constraints at the process of simulation, can be incorporated with minor changes in the initial code structure.
The most important disadvantage is the possible non correspondence in practical questions trying to be applied at wide scale applications, often due to the changes in the composition of raw materials, that can significantly alter the proposed optimal conditions. The method also lacks the ability to simulate reactors with more complicated characteristics and operation conditions such as the percolator reactor, which is of high interest.

Abbreviations:

A1, A2
pre-exponential parameters (min−1)
BR
batch reactor
C
acid concentration (%w/w)
CS
Cerevisae Sacharomycae
CSTR
Continuous Stirred Tank Reactor
E1, E2
activation energy of the production and degradation of glucose
G
Glucose concentration
HMF
5-hydroxymethylfurfural
LGCs
lignocellulosics
n1, n2
exponential acid parameters
T
temperature (°Κ)

References

  1. Mielenz, J.R. Ethanol production from biomass: technology and commercialization status. Curr. Opin. Microbiol. 2001, 4, 324–329. [Google Scholar] [CrossRef] [PubMed]
  2. Kondili, E.M.; Kaldellis, J.K. Biofuel implementation in East Europe: Current status and future prospects. Renew. Sustain. Energy Rev. 2007, 11, 2137–2151. [Google Scholar] [CrossRef]
  3. Lal, R.; Pimentel, M. Soil erosion: A carbon sink or source? Science 2008, 319, 1040–1041. [Google Scholar] [CrossRef] [PubMed]
  4. Pimentel, D.; Patzek, T. Green plants, fossil fuels, and now biofuels. Editorial: BioScience 2006, 56, 875. [Google Scholar] [CrossRef]
  5. Pimentel, D.; Pimentel, M. Corn and cellulosic ethanol cause major problems. Energies 2008, 1, 35–37. [Google Scholar] [CrossRef]
  6. Tsoutsos, T.; Bethanis, D.; Gekas, V. Simulation of Fermentable Sugar Production from Lignocellulosics to Fuel Bioethanol. In Proceedings of the 15th European Biomass Conference and Exhibition, Berlin, Germany, 7–11 May 2007.
  7. Sidiras, D.; Koukios, E. Simulation of acid-catalysed organosolv fractionation of wheat straw. Bioresour. Technol. 2004, 94, 91–98. [Google Scholar] [CrossRef] [PubMed]
  8. Stinson, J.M. Energy from Biomass; Technical Insights, Inc.: New York, NY, USA, 1983. [Google Scholar]
  9. Tsoutsos, T.D.; Koukios, E.G. Modeling and comparison of major types of dilute acid hydrolysis reactors for cellulose saccharification. Cellul. Chem. Technol. 1990, 24, 713–725. [Google Scholar]
  10. Taherzadeh, M.J.; Gustafsson, L.; Niklasson, C.; Lidén, G. Conversion of furfural in aerobic and anaerobic batch fermentation of glucose by Saccharomyces cerevisiae. J. Biosci. Bioeng. 1999, 87, 169–174. [Google Scholar] [CrossRef] [PubMed]
  11. Mamma, D.; Koullas, D.; Fountoukidis, G.; Kekos, D.; Macris, B.J.; Koukios, E. Bioethanol from sweet sorghum: Simultaneous saccharification and fermentation of carbohydrates by a mixed microbial culture. Process Biochem. 1996, 31, 377–381. [Google Scholar] [CrossRef]
  12. Saeman, J.F. Kinetics of wood saccharification: Hydrolysis of cellulose and decomposition of sugars in dilute acid at high temperature. Ind. Eng. Chem. 1945, 37, 43–52. [Google Scholar] [CrossRef]
  13. Tsoutsos, T.D.; Koukios, E.G. Selection of a reaction system for cellulose saccharification: A global approach. Chem. Biochem. Eng. Quart. 1991, 3, 151–156. [Google Scholar]
  14. Maloney, M.T. An engineering analysis of the production of xylose by dilute-acid hydrolysis of hardwood hemicellulose. Biotechnol. Prog. 1986, 2, 192–202. [Google Scholar] [CrossRef] [PubMed]
  15. Chambers, R.P.; Lee, Y.Y.; McCaskey, T.A. Liquid Fuel and Chemical Production from Cellulosic Biomass—Hemicellulose Recovery and Pentose Utilization in a Biomass Processing Complex. In Proceedings of the 3rd Annual Biomass System Conference (DE-AS051), Golden, CO, USA, 1979; pp. 255–264.
  16. Sidiras, D.; Batzias, F.; Schroeder, E.; Ranjan, R.; Tsapatsis, M. Dye adsorption on autohydrolyzed pine sawdust in batch and fixed-bed systems. Chem. Eng. J. 2011, 171, 883–896. [Google Scholar] [CrossRef]
  17. McPharland, J.J.; Grethlein, H.E.; Converse, A.O. Kinetics of acid hydrolysis of corn stover. Sol. Energy 1982, 28, 55–63. [Google Scholar] [CrossRef]
  18. Ranganathan, D.G.; MacDonald, D.G.; Bakhshi, N.N. Kinetic studies of wheat straw hydrolysis using sulphuric acid. Can. J. Chem. Eng. 1985, 63, 840–844. [Google Scholar] [CrossRef]
  19. Bhandari, N.; Macdonald, D.G.; Bakhshi, N.N. Kinetic studies of corn stover saccharification using sulphuric acid. Biotechnol. Bioeng. 1984, 26, 320–327. [Google Scholar] [CrossRef] [PubMed]
  20. Aguilar, R.; Ramırez, J.A.; Garrote, G.; Vazquez, M. Kinetic study of the acid hydrolysis of sugar cane bagasse. J. Food Eng. 2002, 55, 309–318. [Google Scholar] [CrossRef]
  21. Aguilar, R.; Ramırez, J.A.; Garrote, G.; Vazquez, M. Hydrolysis of sugar cane bagasse using nitric acid: a kinetic assessment. J. Food Eng. 2004, 61, 143–152. [Google Scholar] [CrossRef]
  22. Maloney, M.T.; Chapman, T.W.; Baker, A.J. Dilute acid hydrolysis of paper birch: kinetic studies of xylan and acetyl-group hydrolysis. Biotechnol. Bioeng. 1985, 27, 335–361. [Google Scholar]
  23. Harris, J.F.; Baker, A.J.; Conner, A.H.; Jeffries, T.W.; Minor, J.L.; Pettersen, R.C.; Scott, R.W.; Springer, E.L.; Wegner, T.H.; Zerbe, J.I. Two-Stage Dilute Acid Hydrolysis of Wood: An Investigation of Fundamentals; Gen. Tech. Rep. FLP-45; Department of Agriculture, Forest Service, Forest Products Laboratory: Madison, WI, USA, 1985. [Google Scholar]
  24. Veeraraghavan, S.; Chambers, R.P.; Myles, M.Y.; Lee, A. Kinetic Model and Reactor Development in Hemicellulose Hydrolysis. In Proceedings of the AIChE National Meeting, Orlando, FL, USA, 1982.
  25. Carrasco, E.; Roy, C. Kinetic study of dilute-acid prehydrolysis of xylan-containing biomass. Wood Sci. Technol. 1992, 26, 189–208. [Google Scholar]
  26. California Energy Commission. Appendices evaluation of biomass-to-ethanol fuel potential in California. Available online: http://www.energy.ca.gov/reports/1999-12-22_500-99-022.html (accessed on 19 February 2011).
  27. Boyer, L.J.; Vega, J.L.; Klasson, K.T.; Klausen, E.C.; Gaddy, J.L. The effects of furfural on ethanol production by S. cerevisiae in Batch culture. Biomass Bioenergy 1992, 3, 41–48. [Google Scholar] [CrossRef]
  28. Liu, Z.L.; Slininger, P.J.; Dien, B.S.; Berhow, M.A.; Kurtzman, C.P.; Gorsich, S.W. Adaptive response of yeasts to furfural and 5-hydroxymethylfurfural and new chemical. J. Ind. Microbiol. Biotechnol. 2004, 31, 345–352. [Google Scholar] [CrossRef] [PubMed]
  29. Olsson, L.; Hahn-Hiigerdal, B. Fermentation of lignocellulosic hydrolysates for ethanol production. Enzym. Microb. Technol. 1996, 18, 312–331. [Google Scholar] [CrossRef]
  30. Banerjee, N.; Bhatnagar, R.; Viswanathan, L. Inhibition of glycolysis by furfural in Saccharomyces cerevisiae. Eur. J. Appl. Microbiol. Biotechnol. 1981, 11, 226–228. [Google Scholar] [CrossRef]
  31. Sanchez, B.; Bautista, J. Effects of furfural and 5-hydroxymethylfurfural on the fermentation of Saccharomyces cerevisiae and biomass production from Candida guilliermondii. Enzym. Microb. Technol. 1988, 10, 315–318. [Google Scholar] [CrossRef]
  32. Azhar, A.F.; Bery, M.K.; Colcord, A.R.; Roberts, R.S.; Corbitt, G.V. Factors affecting alcohol fermentation of wood acid hydrolyzate. Biotechnol. Bioeng. Symp. 1981, 11, 293–300. [Google Scholar]
  33. Vamvuka, D.; Tsoutsos, T. Energy exploitation of biomass residues in the island of Crete. Energy Explor. Exploit. 2002, 20, 113–120. [Google Scholar] [CrossRef]
  34. Kwarteng, I.K. Kinetics of the Acid Hydrolysis of Hardwood in a Continuous Plugflow Reactor. Ph.D. Thesis, Thayer School of Engineering, Dartmouth College, Hanover, Germany, 1983. [Google Scholar]
  35. Converse, A.O.; Kwarteng, I.K.; Grethlein, H.E.; Ooshima, H. Kinetics of thermochemical pretreatment of lignocellulosic materials. Appl. Biochem. Biotechnol. 1989, 20/21, 63–78. [Google Scholar] [CrossRef]
  36. Lee, W.G.; Lee, J.S.; Shin, C.S.; Park, S.C.; Chang, H.N.; Chang, Y.K. Ethanol production using concentrated oak wood hydrolyzates and methods to detoxify. Appl. Biochem. Biotechnol. 1999, 13, 547–559. [Google Scholar] [CrossRef]
  37. Sun, Y.; Cheng, J. Hydrolysis of lignocellulosic materials for ethanol production: A review. Bioresour. Technol. 2002, 83, 1–11. [Google Scholar] [CrossRef] [PubMed]
  38. MathWorks. MATLAB Programming Tips, Version 6. 2002. e-book. Available online: http://www.caspur.it/risorse/softappl/doc/matlab_help/pdf_doc/matlab/programming_tips.pdf (accessed on 19 February 2011).
  39. MathWorks. Using MATLAB Graphics, Version 6. 2002. e-book. Available online: http://courses.washington.edu/css485/graphg.pdf (accessed on 19 February 2011).
  40. Abasaeed, A.E.; Lee, Y.Y. Effect of transient heat transfer and particle size on acid hydrolysis of hardwood cellulose. Bioresour. Technol. 1990, 35, 15–21. [Google Scholar] [CrossRef]
  41. Jimenez, L.; Ferrer, J.L. Saccharification of wheat straw for the production of alcohols. Process Biochem. 1991, 26, 153–156. [Google Scholar] [CrossRef]

