1. Introduction
The world’s major automakers are developing plug-in vehicles as part of their strategy to address efficiency, air-pollution, energy-security, greenhouse-gas, and other concerns held by regulators and consumers. Production of early offerings is already slated to be in the tens of thousands of vehicles in 2011, and, with several additional manufacturers planning to introduce models in 2012 and 2013, could exceed 100,000 soon. However, the assortment and degree of benefits realized by plug-ins, as well as the challenges their commercialization poses, depend on a number of factors. These include: vehicle design [
1], adoption, and use, as well as recharging behavior and the nature and extent of available infrastructure. Analysis of data from real-world use of plug-in vehicles can contribute to a better understanding of their anticipated use and impact, and of how these vehicles might best be designed, charged, and otherwise prepared for by policymakers and strategic planners. Nevertheless, such data are still relatively scarce and usually based on the use of aftermarket conversions [
2]. This study examines the real-world use over the course of a year of an early-generation, nickel-metal-hydride (NiMH) plug-in-hybrid vehicle—the Toyota Plug-In HV—by a series of 12 California households able to charge both at home and work (but not elsewhere). It analyzes driving and charging behavior and calculates measures of energy consumption and greenhouse gas (GHG) emissions associated with the observed vehicle use.
Early experimental development of plug-in hybrids focused largely on vehicles with 50–150 miles (mi) of all-electric-range (AER) capability [
3] and subsequent early theoretical analysis on designs with 20–60 AER [
4]. More recently, analysis has suggested the early stages of plug-in-hybrid evolution efforts should focus on vehicles with an AER of 10 to 20 mi rather than 30 to 40 mi [
5]. Like Williams and Lipman [
6], this study focuses on plug-in hybrids with smaller batteries providing shorter charge-depleting (CD) ranges and operating in blended mode. Such vehicles promise to more economically provide fuel economy improvements (currently a more familiar metric to consumers than all-electric range) [
7] and to require less powerful and capacious electric components [
8] and less-costly-to-buy-and-operate recharging infrastructure. Axsen
et al. [
9] found, given a hypothetical choice, potential early adopters of plug-in hybrids in California opted for vehicle designs with the lowest CD range. In their exercise, the base CD range offered was 10 miles, with an option to purchase 20 miles for an additional $2,000 or 40 miles of electric range for $4,000. For these reasons smaller-battery, blended-mode plug-in hybrids may be more easily and widely commercialized and supported, particularly in the near-to-mid term.
The design of the vehicle driven for the study presented here is at the low end on the spectrum of battery size and CD range (see
Section 2.1). Indeed, it should be noted that the most current Toyota Plug-In HV, a plug-in version of the Prius utilizing 5.2 kilowatt-hours (kWh) of lithium-ion (Li-ion) batteries, is purported to roughly double the nominal miles of CD range [
10]. Uniquely, then, this study explores this less-charted end of the analysis spectrum. In doing so, it also creates a perspective on the starting point of an innovation trajectory that builds up to plug-in vehicles from what exists commercially today (the successful Toyota Prius), concordant with the way successful innovations tend to build on continuous origins [
11,
12].
The data for this analysis were collected as part of an interdisciplinary research collaboration, the California Clean Mobility Partnership (CCMP). The CCMP was funded through California Assembly Bill 1811’s incentive program for alternative fuels, managed by the California Air Resources Board (CARB) and the California Energy Commission (CEC), along with cost share from Toyota Motor Engineering & Manufacturing North America, Inc. (TEMA) and Toyota Motor Sales’ Advanced Technology Group (TMS). The overall research team included the University of California (Berkeley and Irvine), CARB, TEMA, and TMS.
Households selected for the project participated for three months, consecutively driving a hybrid (Toyota Prius), a plug-in hybrid (Toyota Plug-In HV), and then a fuel-cell SUV (Toyota FCHV-adv) for four weeks per vehicle. In addition to the vehicle operation data described in this study, data were collected from focus groups, surveys, interviews, GPS systems, and user logs to inform other attitudinal, behavioral, technical, economic, and environmental/energy assessments, as well as policy and educational message development.
4. Summary & Conclusions
4.1. Study Context
Analysis of data from real-world use of plug-in vehicles—still relatively rare due to limited vehicle availability and nascent vehicle and infrastructure design—can contribute to a better understanding of their anticipated use and impact. This study examines the real-world use over 12 months of an early-generation, nickel-metal-hydride plug-in-hybrid vehicle by a series of 12 California households able to charge at home and work.
Plug-in hybrids with smaller batteries providing shorter charge-depleting (CD) ranges and operating in blended mode may be more easily and widely commercialized and supported, particularly in the near-to-mid term (see
Section 1). The vehicle driven for the study was one of the first manufacturer-provided plug-in hybrids available for study and is at the low end on the spectrum of battery size and CD range—lower than the Prius Plug-in Hybrid Vehicle (Prius PHV) using lithium-ion batteries announced for availability in early 2012 [
32]—creating a perspective on the starting point of an innovation trajectory that builds up to plug-in vehicles from what exists commercially, concordant with the way successful innovations tend to build on continuous origins [
11,
12].
Determination of household placement location was constrained by a number of practical factors. Access to hydrogen fueling for a vehicle not analyzed here but part of the overall CCMP study, the Toyota FCHV-adv, was a key constraint for placement selection.
4.2. Driving & Charging Behavior
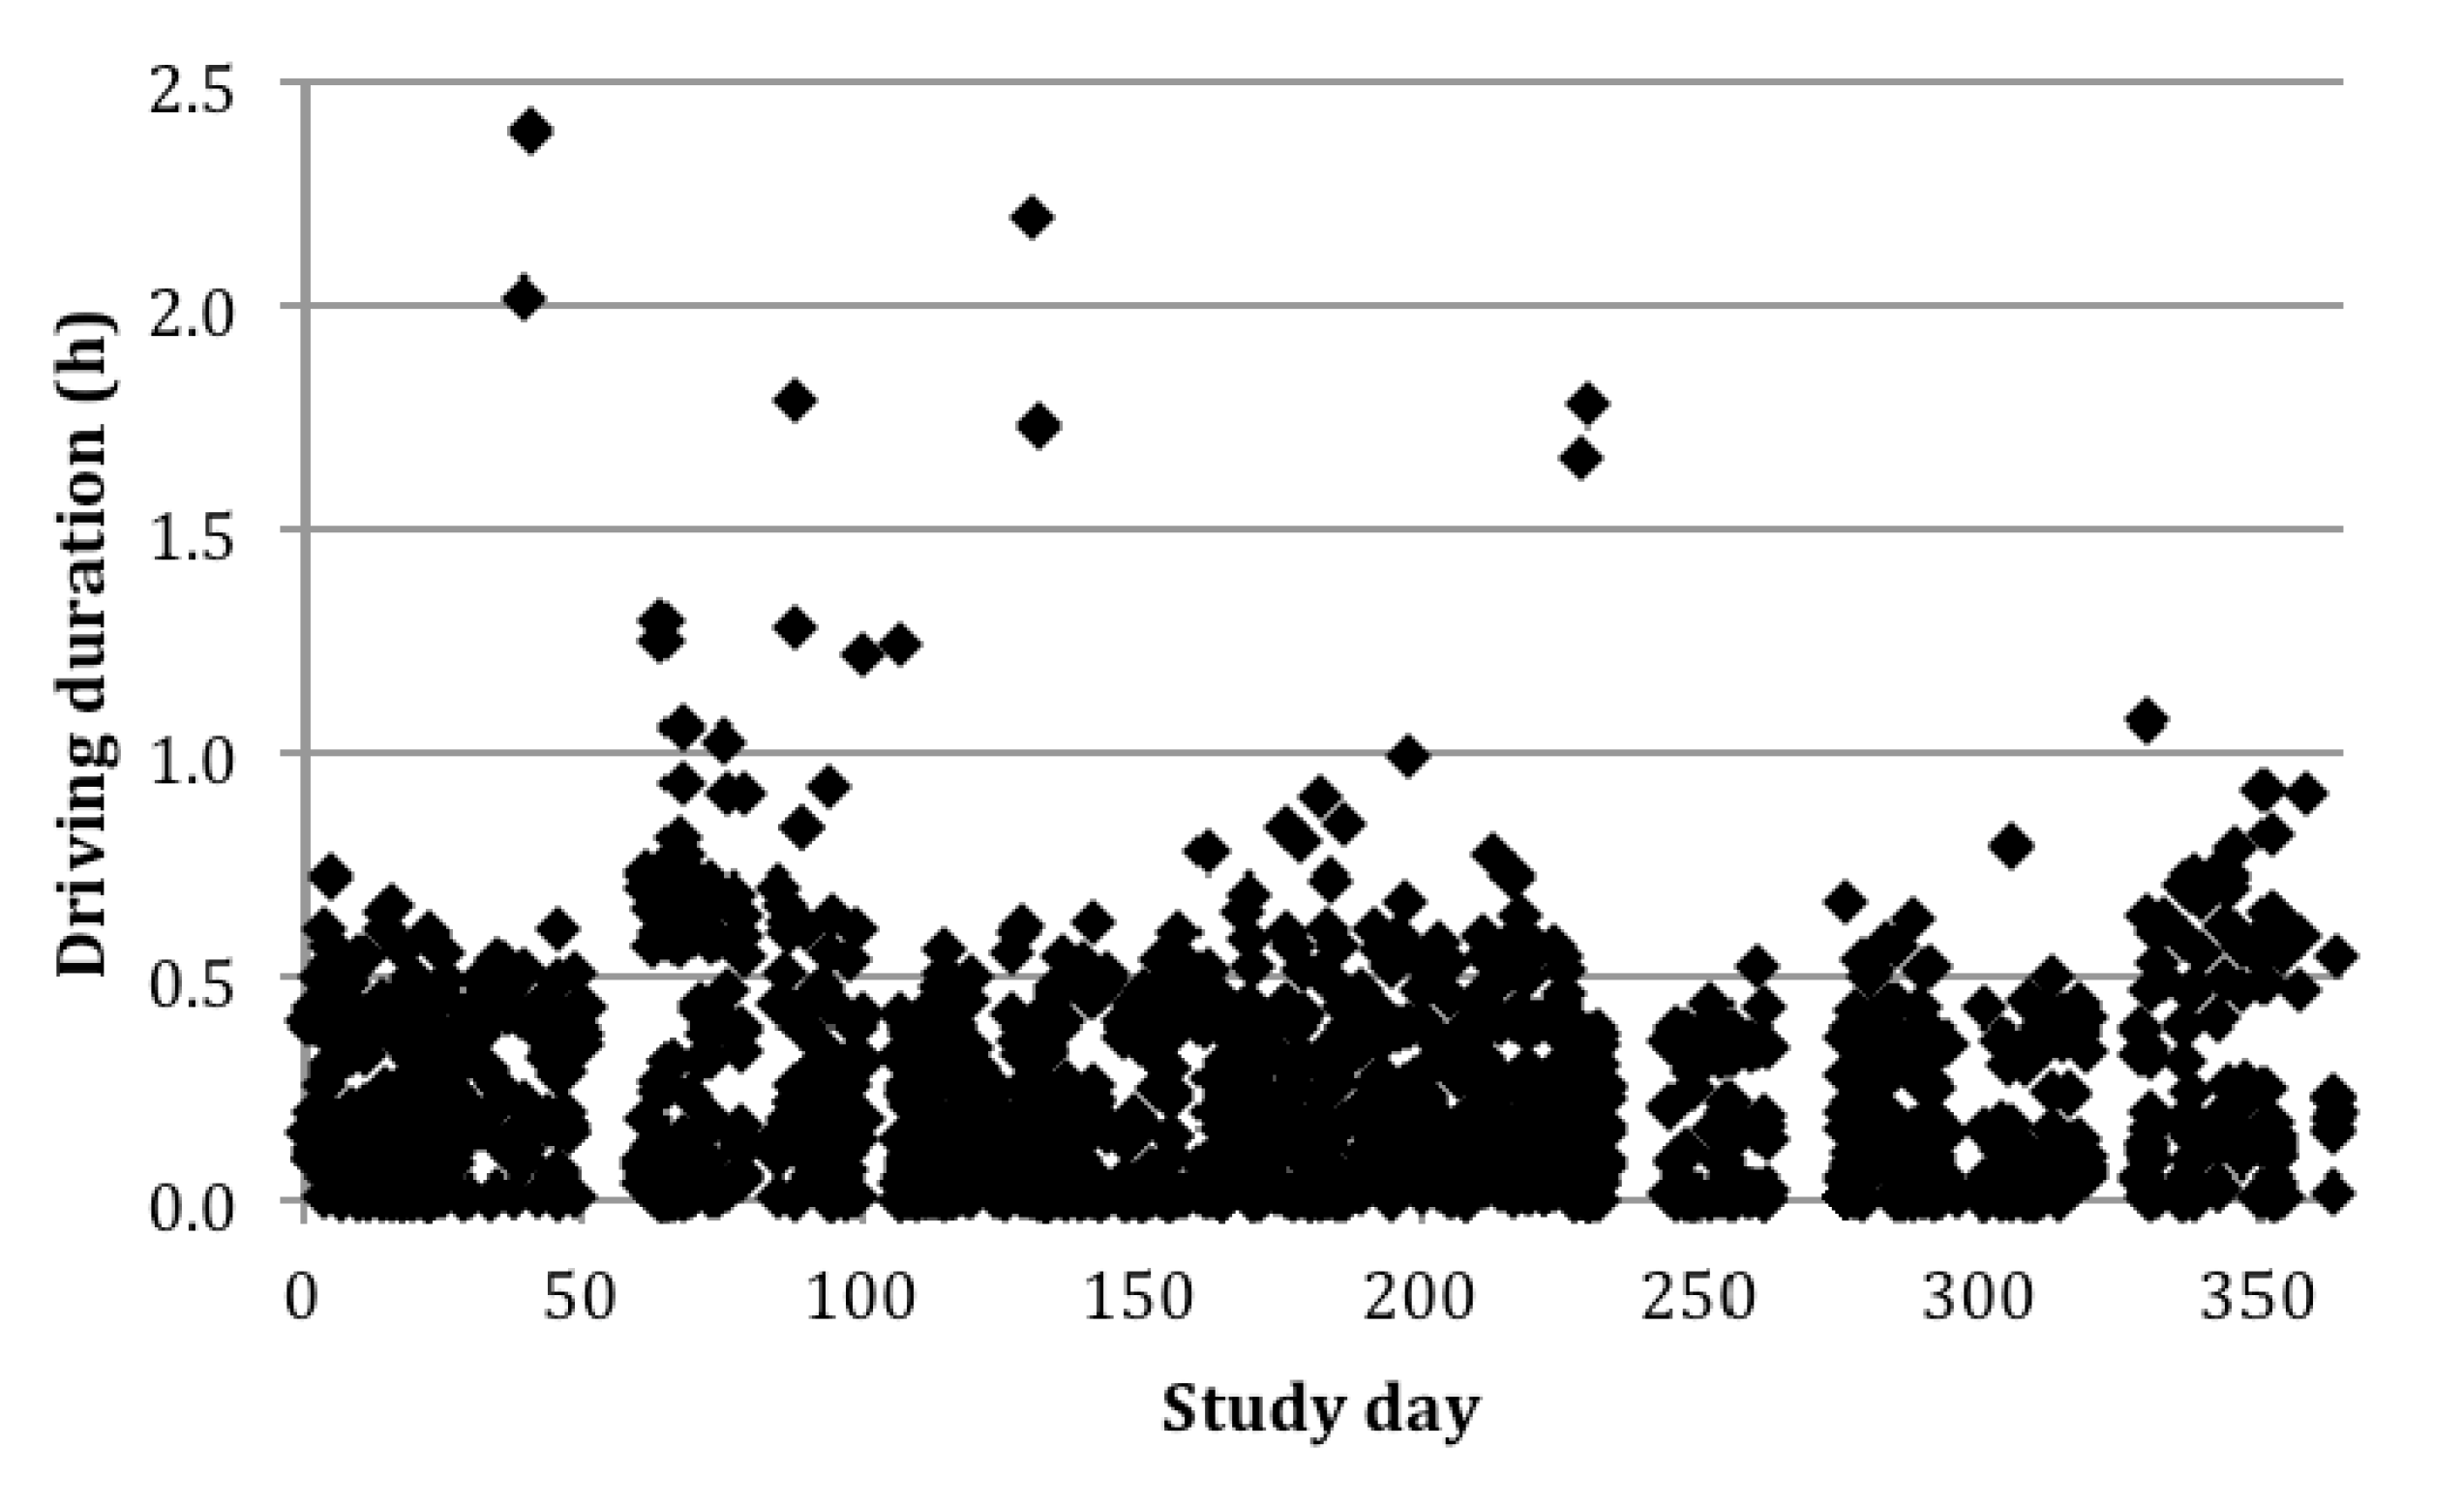
The dataset analyzed here includes 2113 logged events (1676 driving and 437 charging events) in northern California from May 2009 into May 2010. There were 1557 trips covering 11,309 miles, excluding 119 zero-distance driving events. Trips ranged up to 2.4 hours and 133 miles long, but averaged 14 minutes and 7 miles. More total distance was covered on weekdays, generally over 30 mi/day and averaging 35 mi/day as compared to weekends, which averaged 21 mi/day. However, some of the longest-distance days were observed on the weekends.
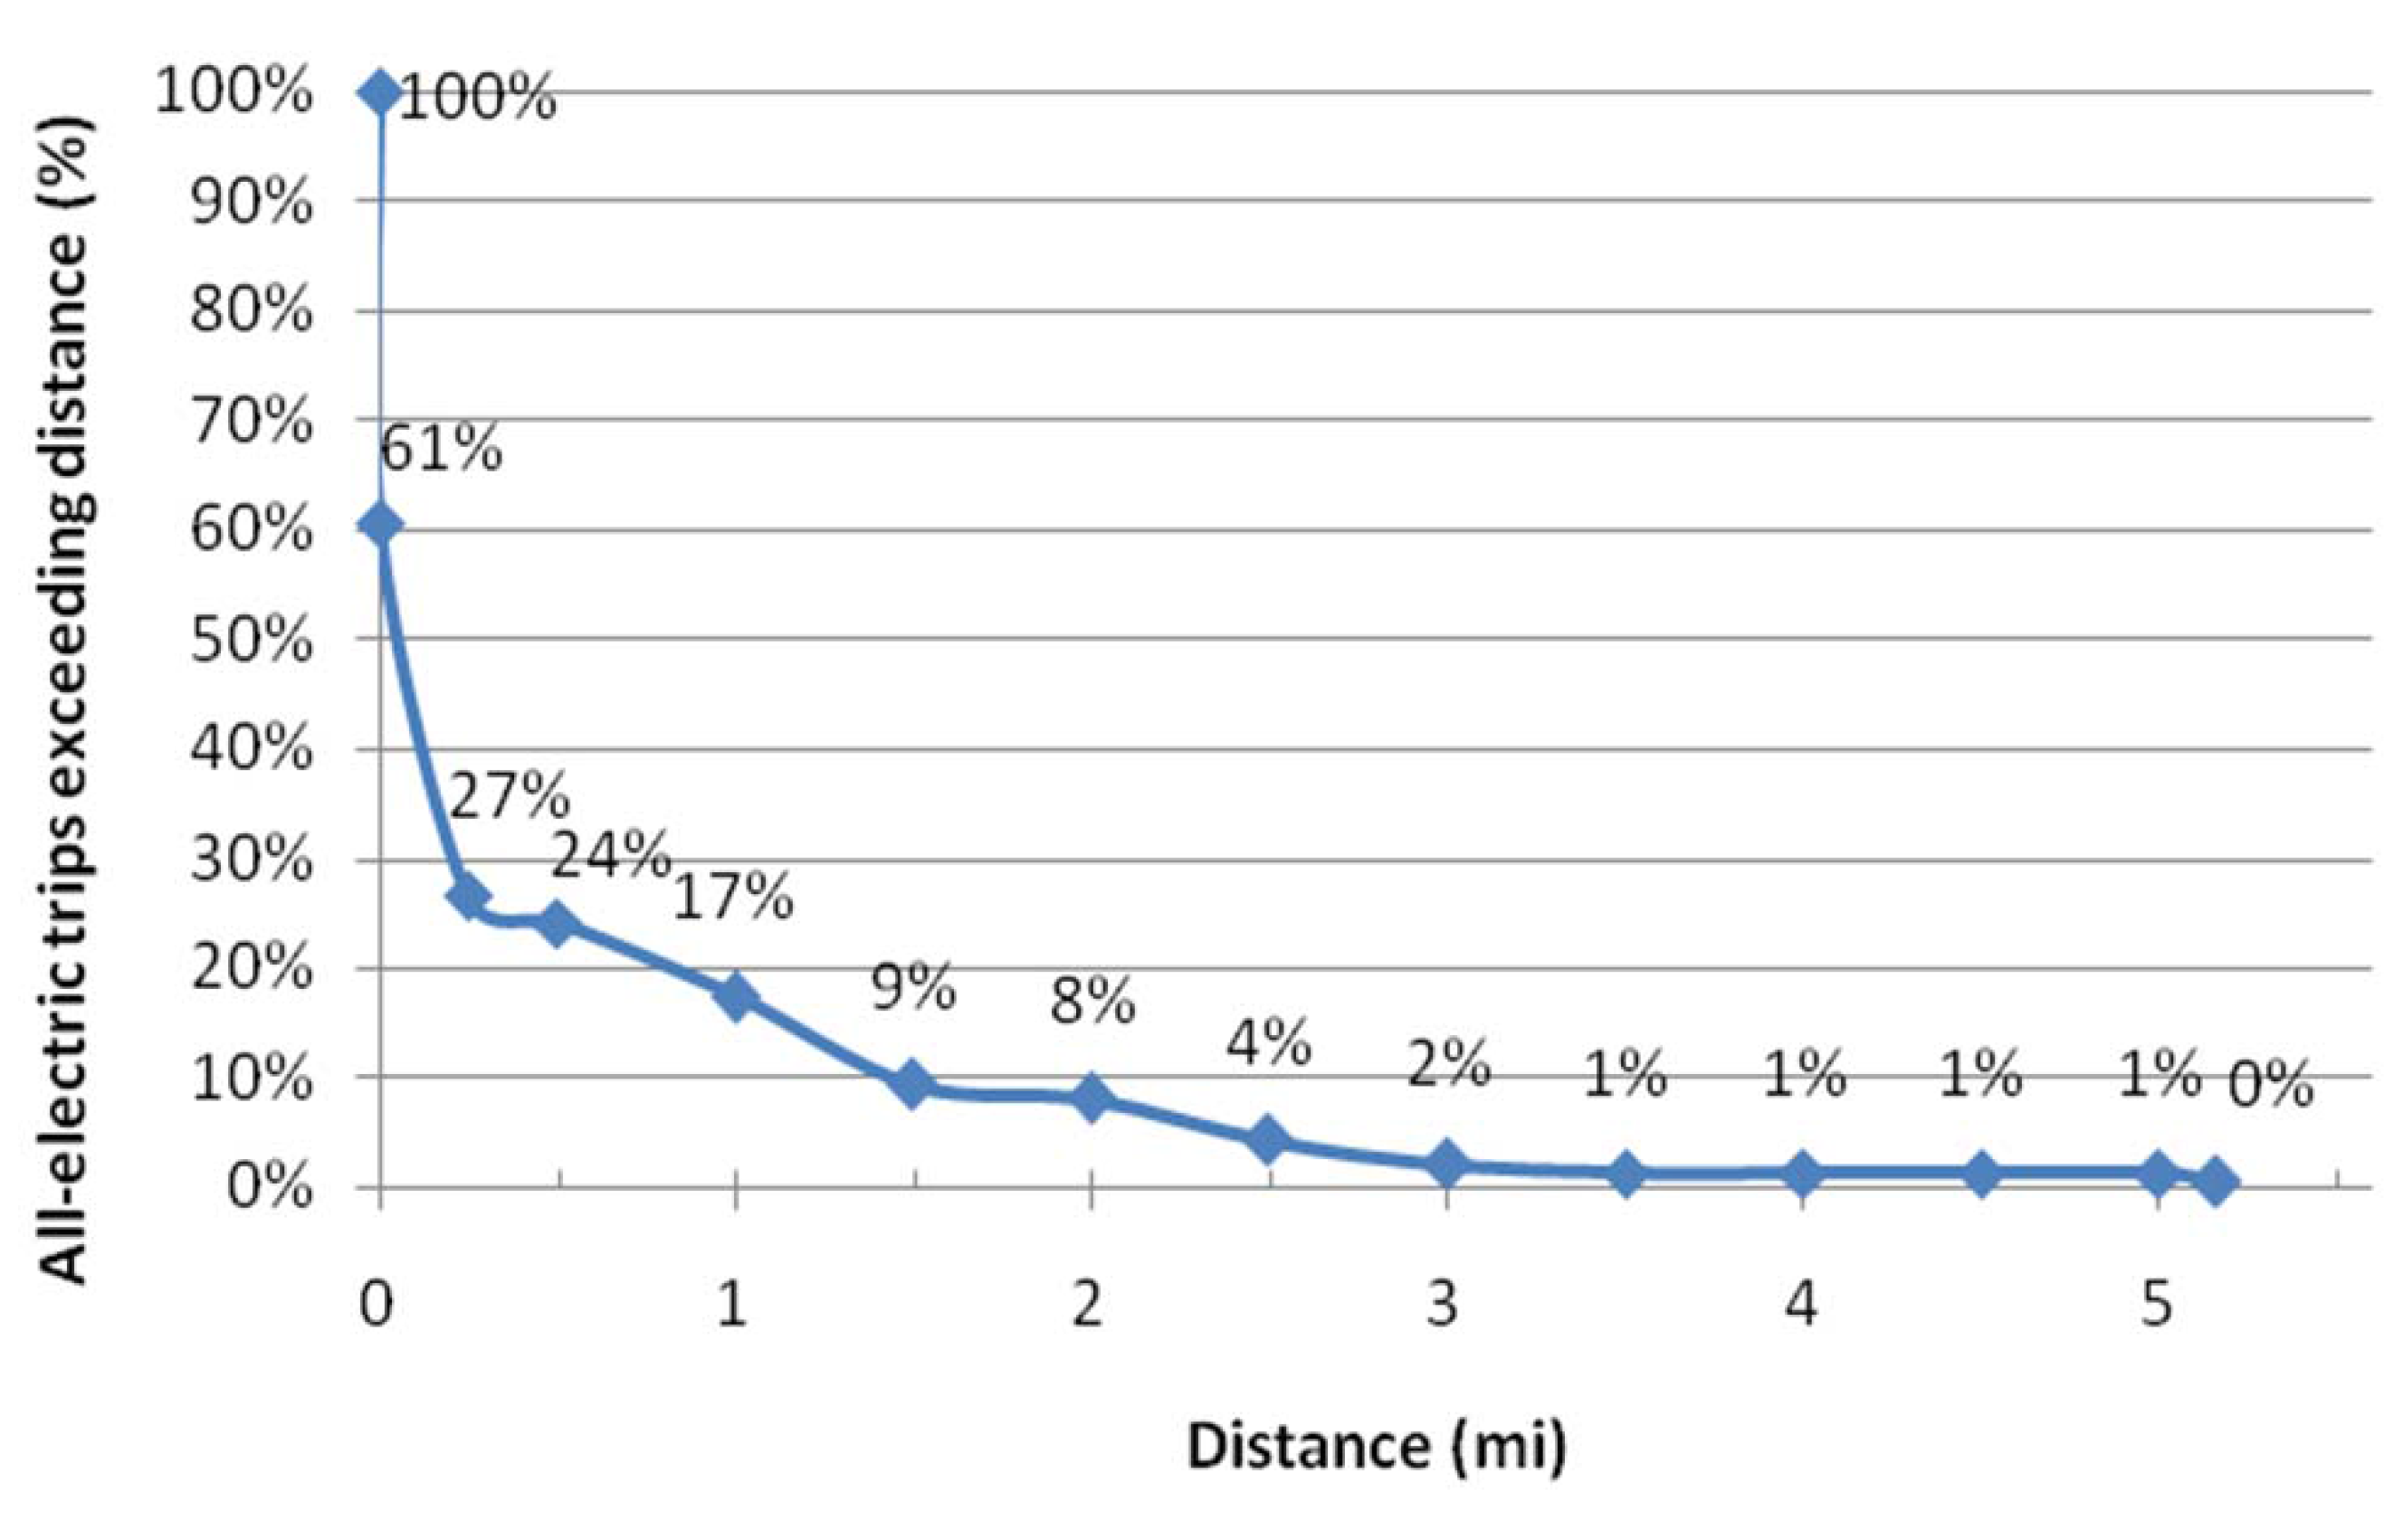
The findings suggest that for the expensive battery asset to be fully utilized on at least 81% of the days driven by the study participants—who had a higher percentage of travel days exceeding distances comparable to charge-depleting ranges of interest (10–50 miles) than the NHTS drivers illustrated in
Figure 1—the battery should be designed to provide no more than 20 miles of CD range. In contrast, on about half of the days driven, a 40-mi CD range would not be fully utilized. This is of course a very different optimization (maximizing utilization and minimizing size for affordability) than for an all-battery EV: if able to provide a full 100 miles of range (at several times the battery cost) EVs face the challenging prospect of not providing enough to fully cover all of the driving logged for our study participants—let alone their perceived range needs or desires—with accordant marketing and product re-definition challenges. This is not to say that those challenges are insurmountable or that one product definition or multifaceted business model is superior to another, but rather to simply highlight the distinctions between plug-in hybrids and battery EVs in this regard.
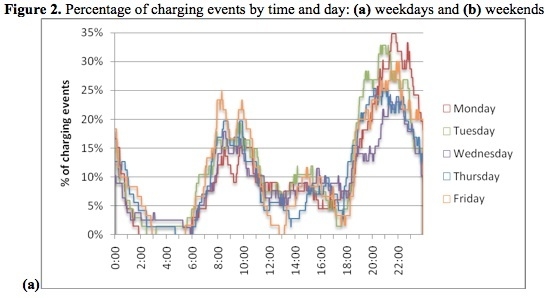
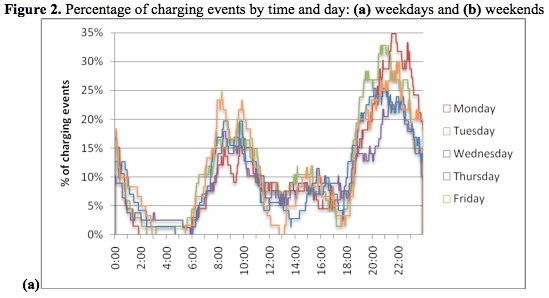
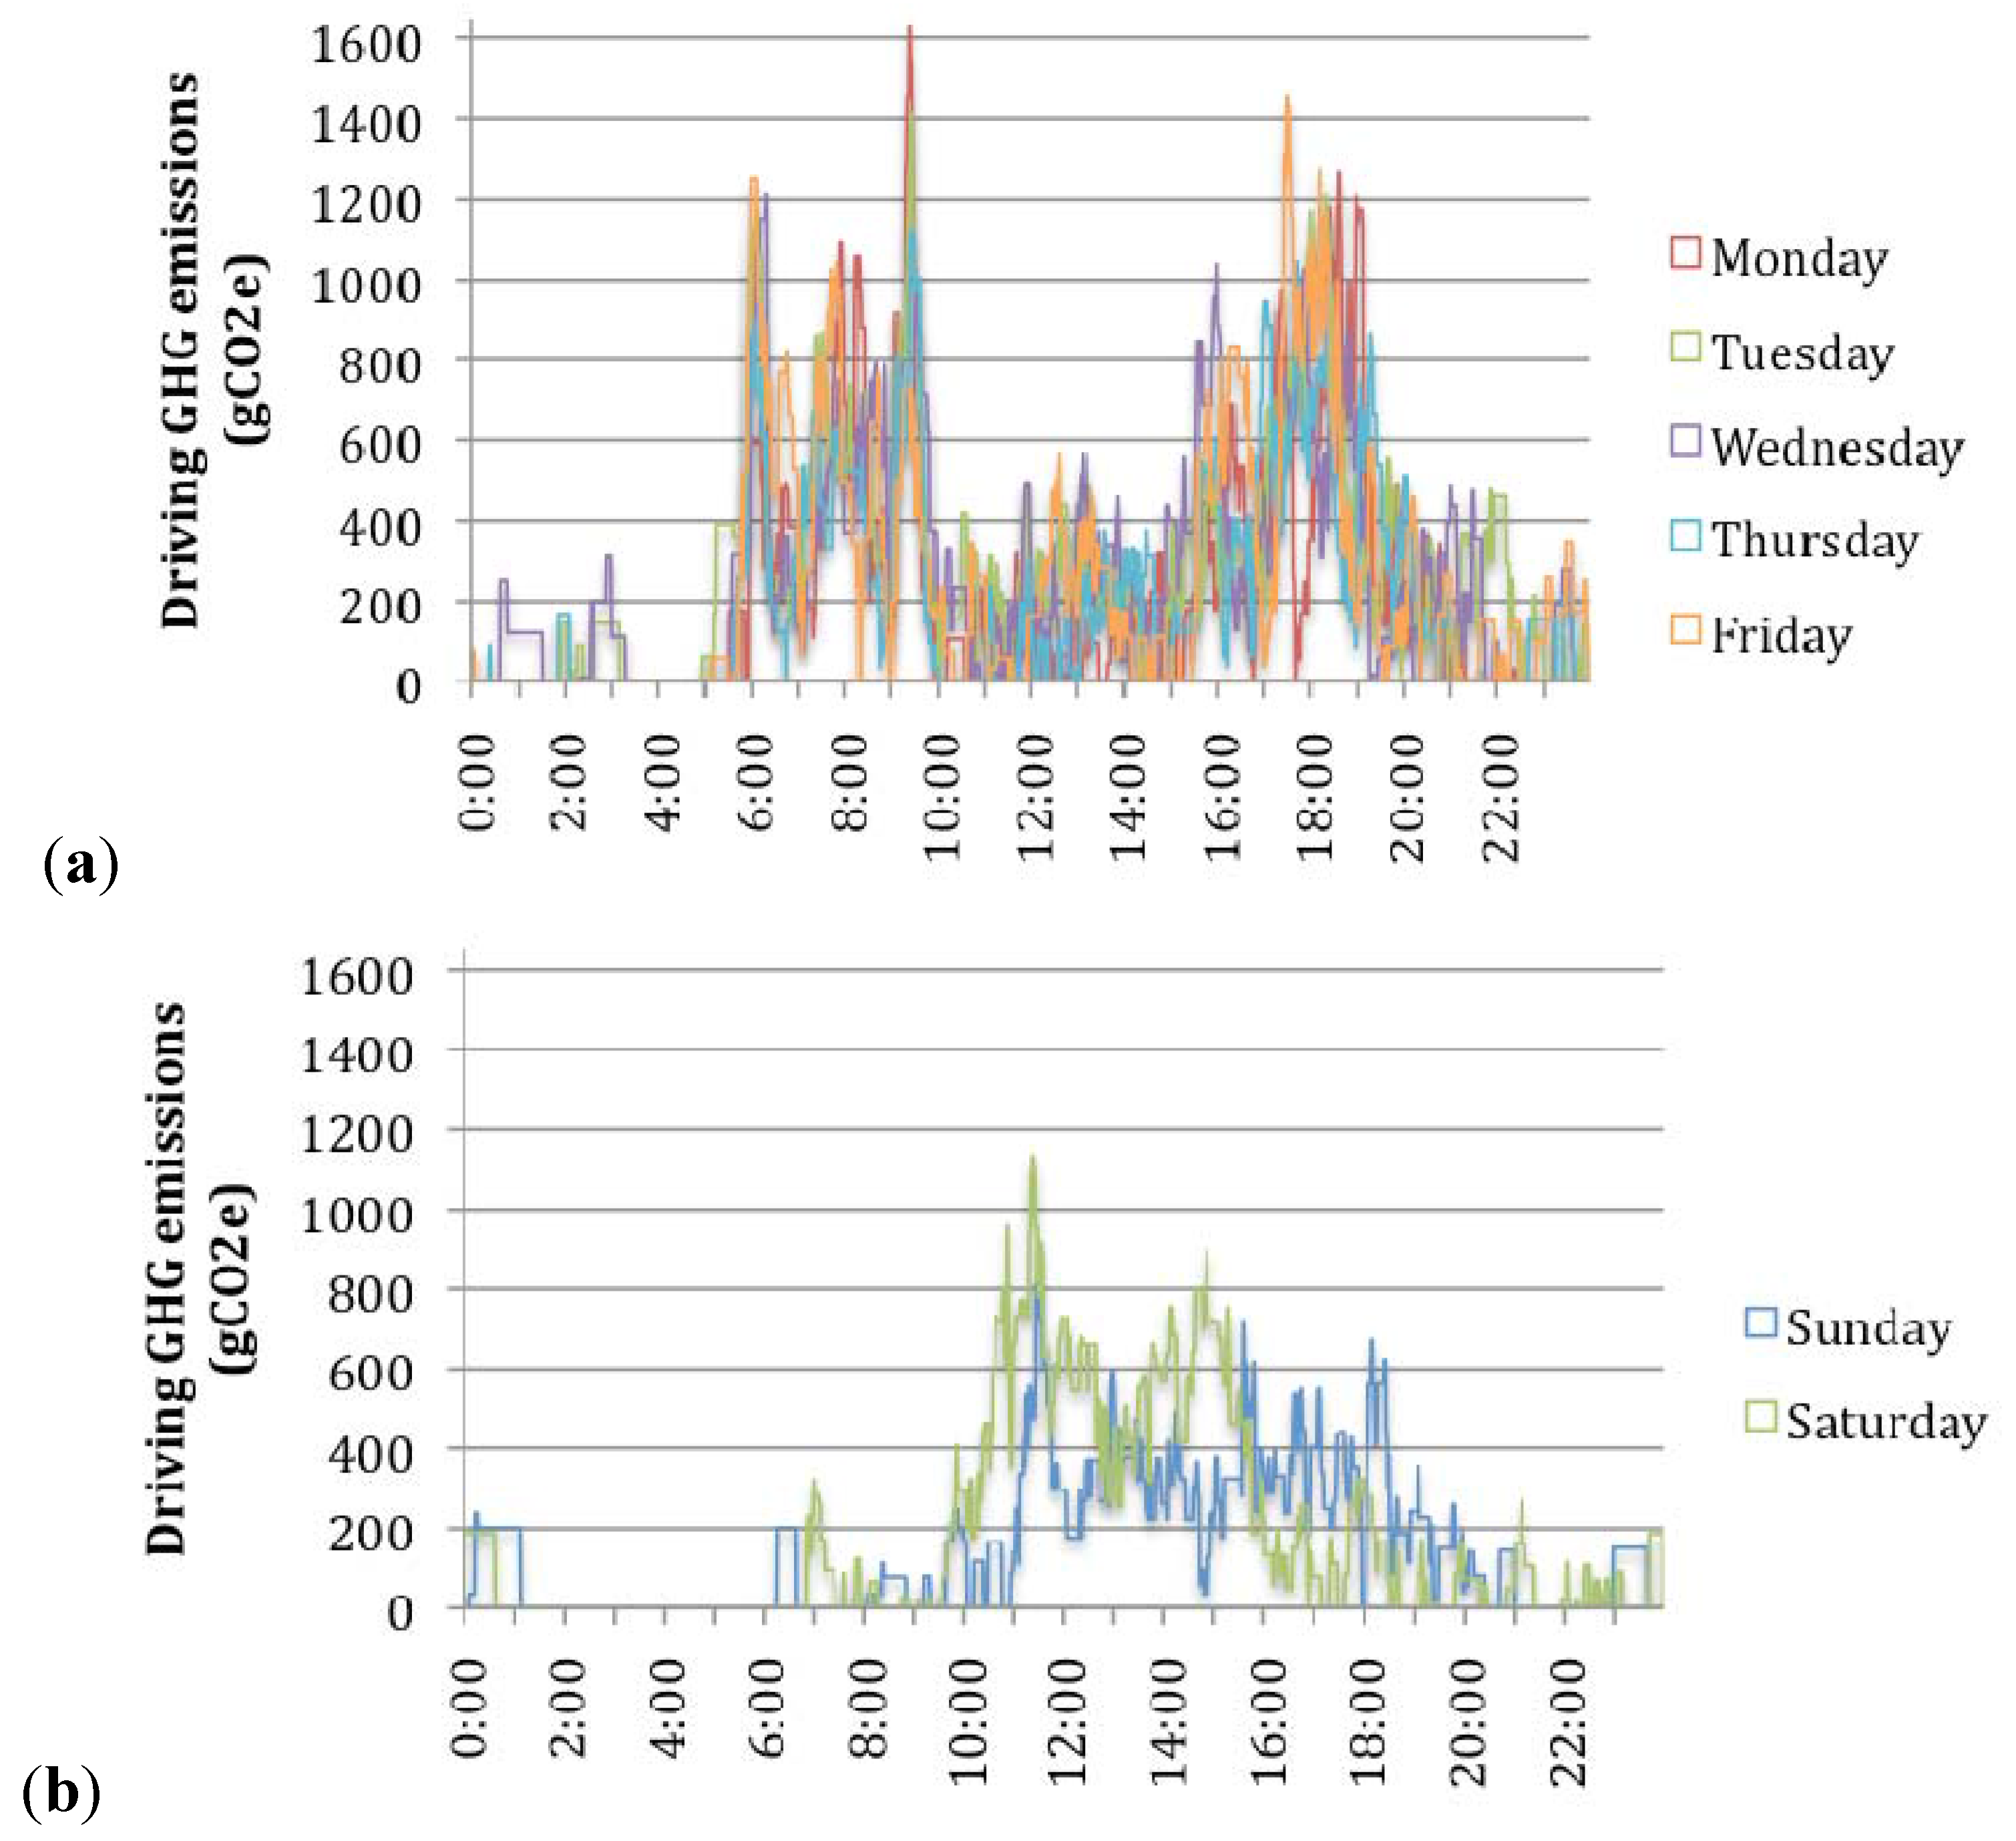
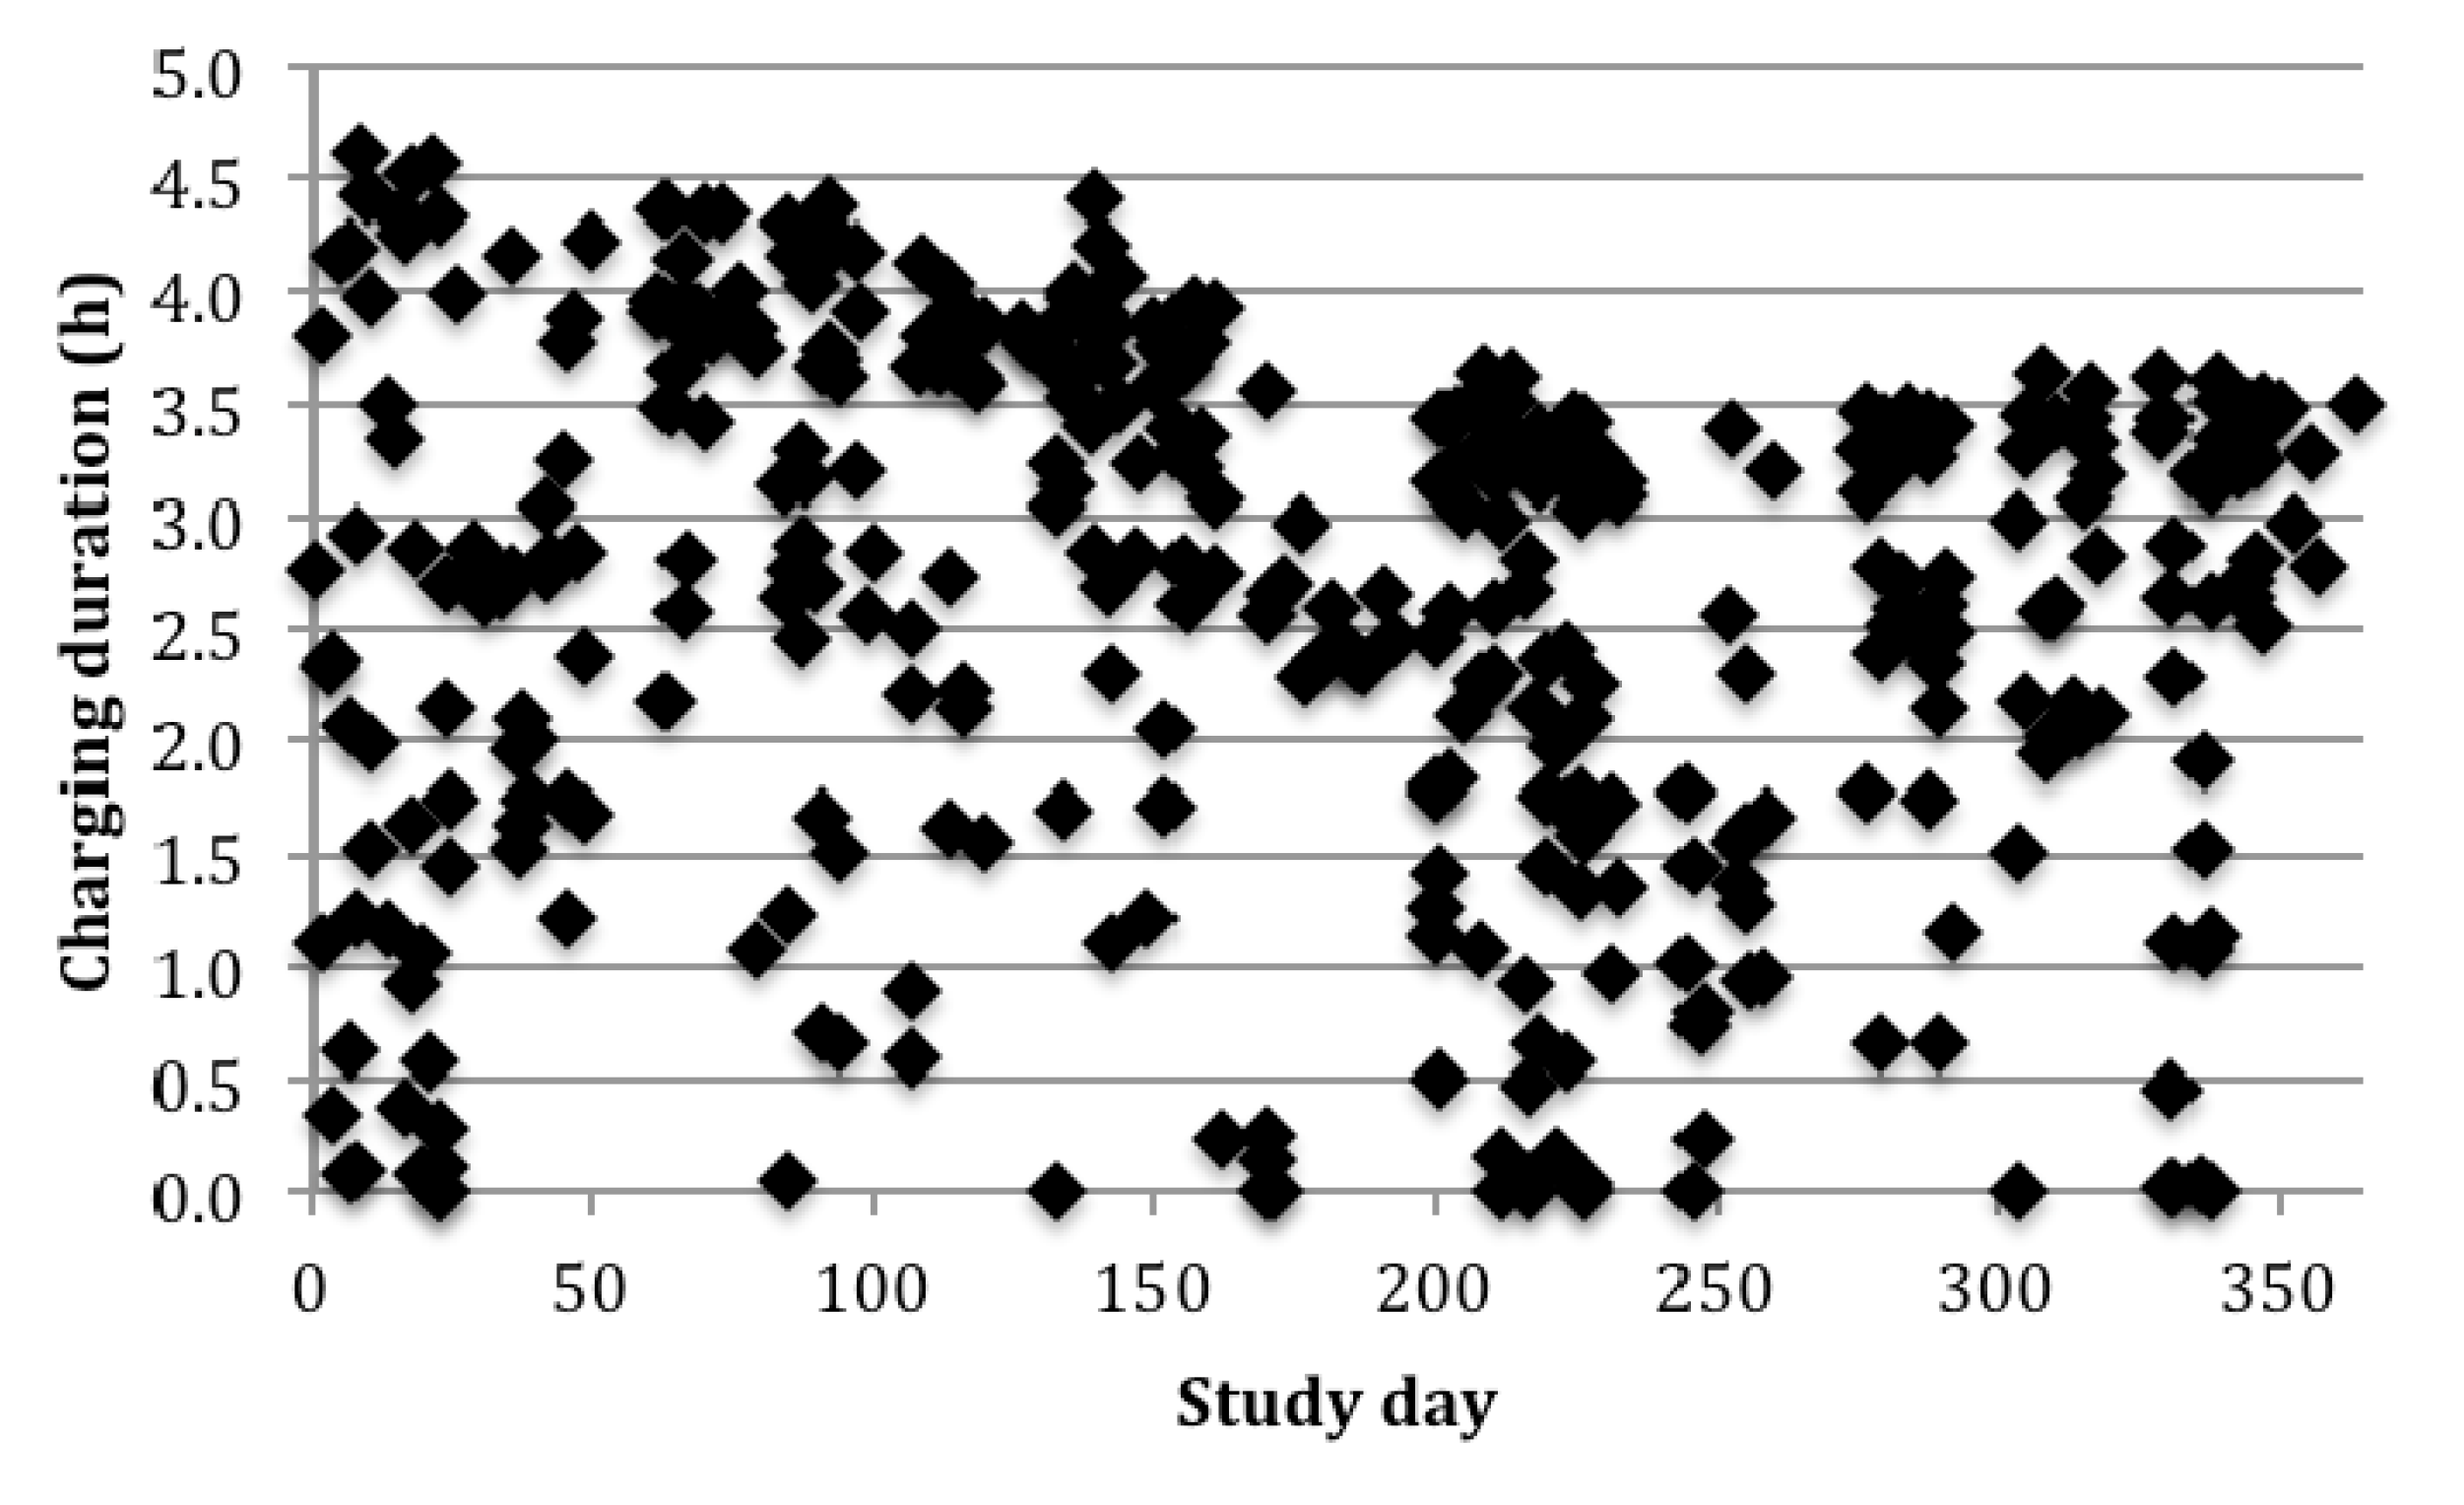
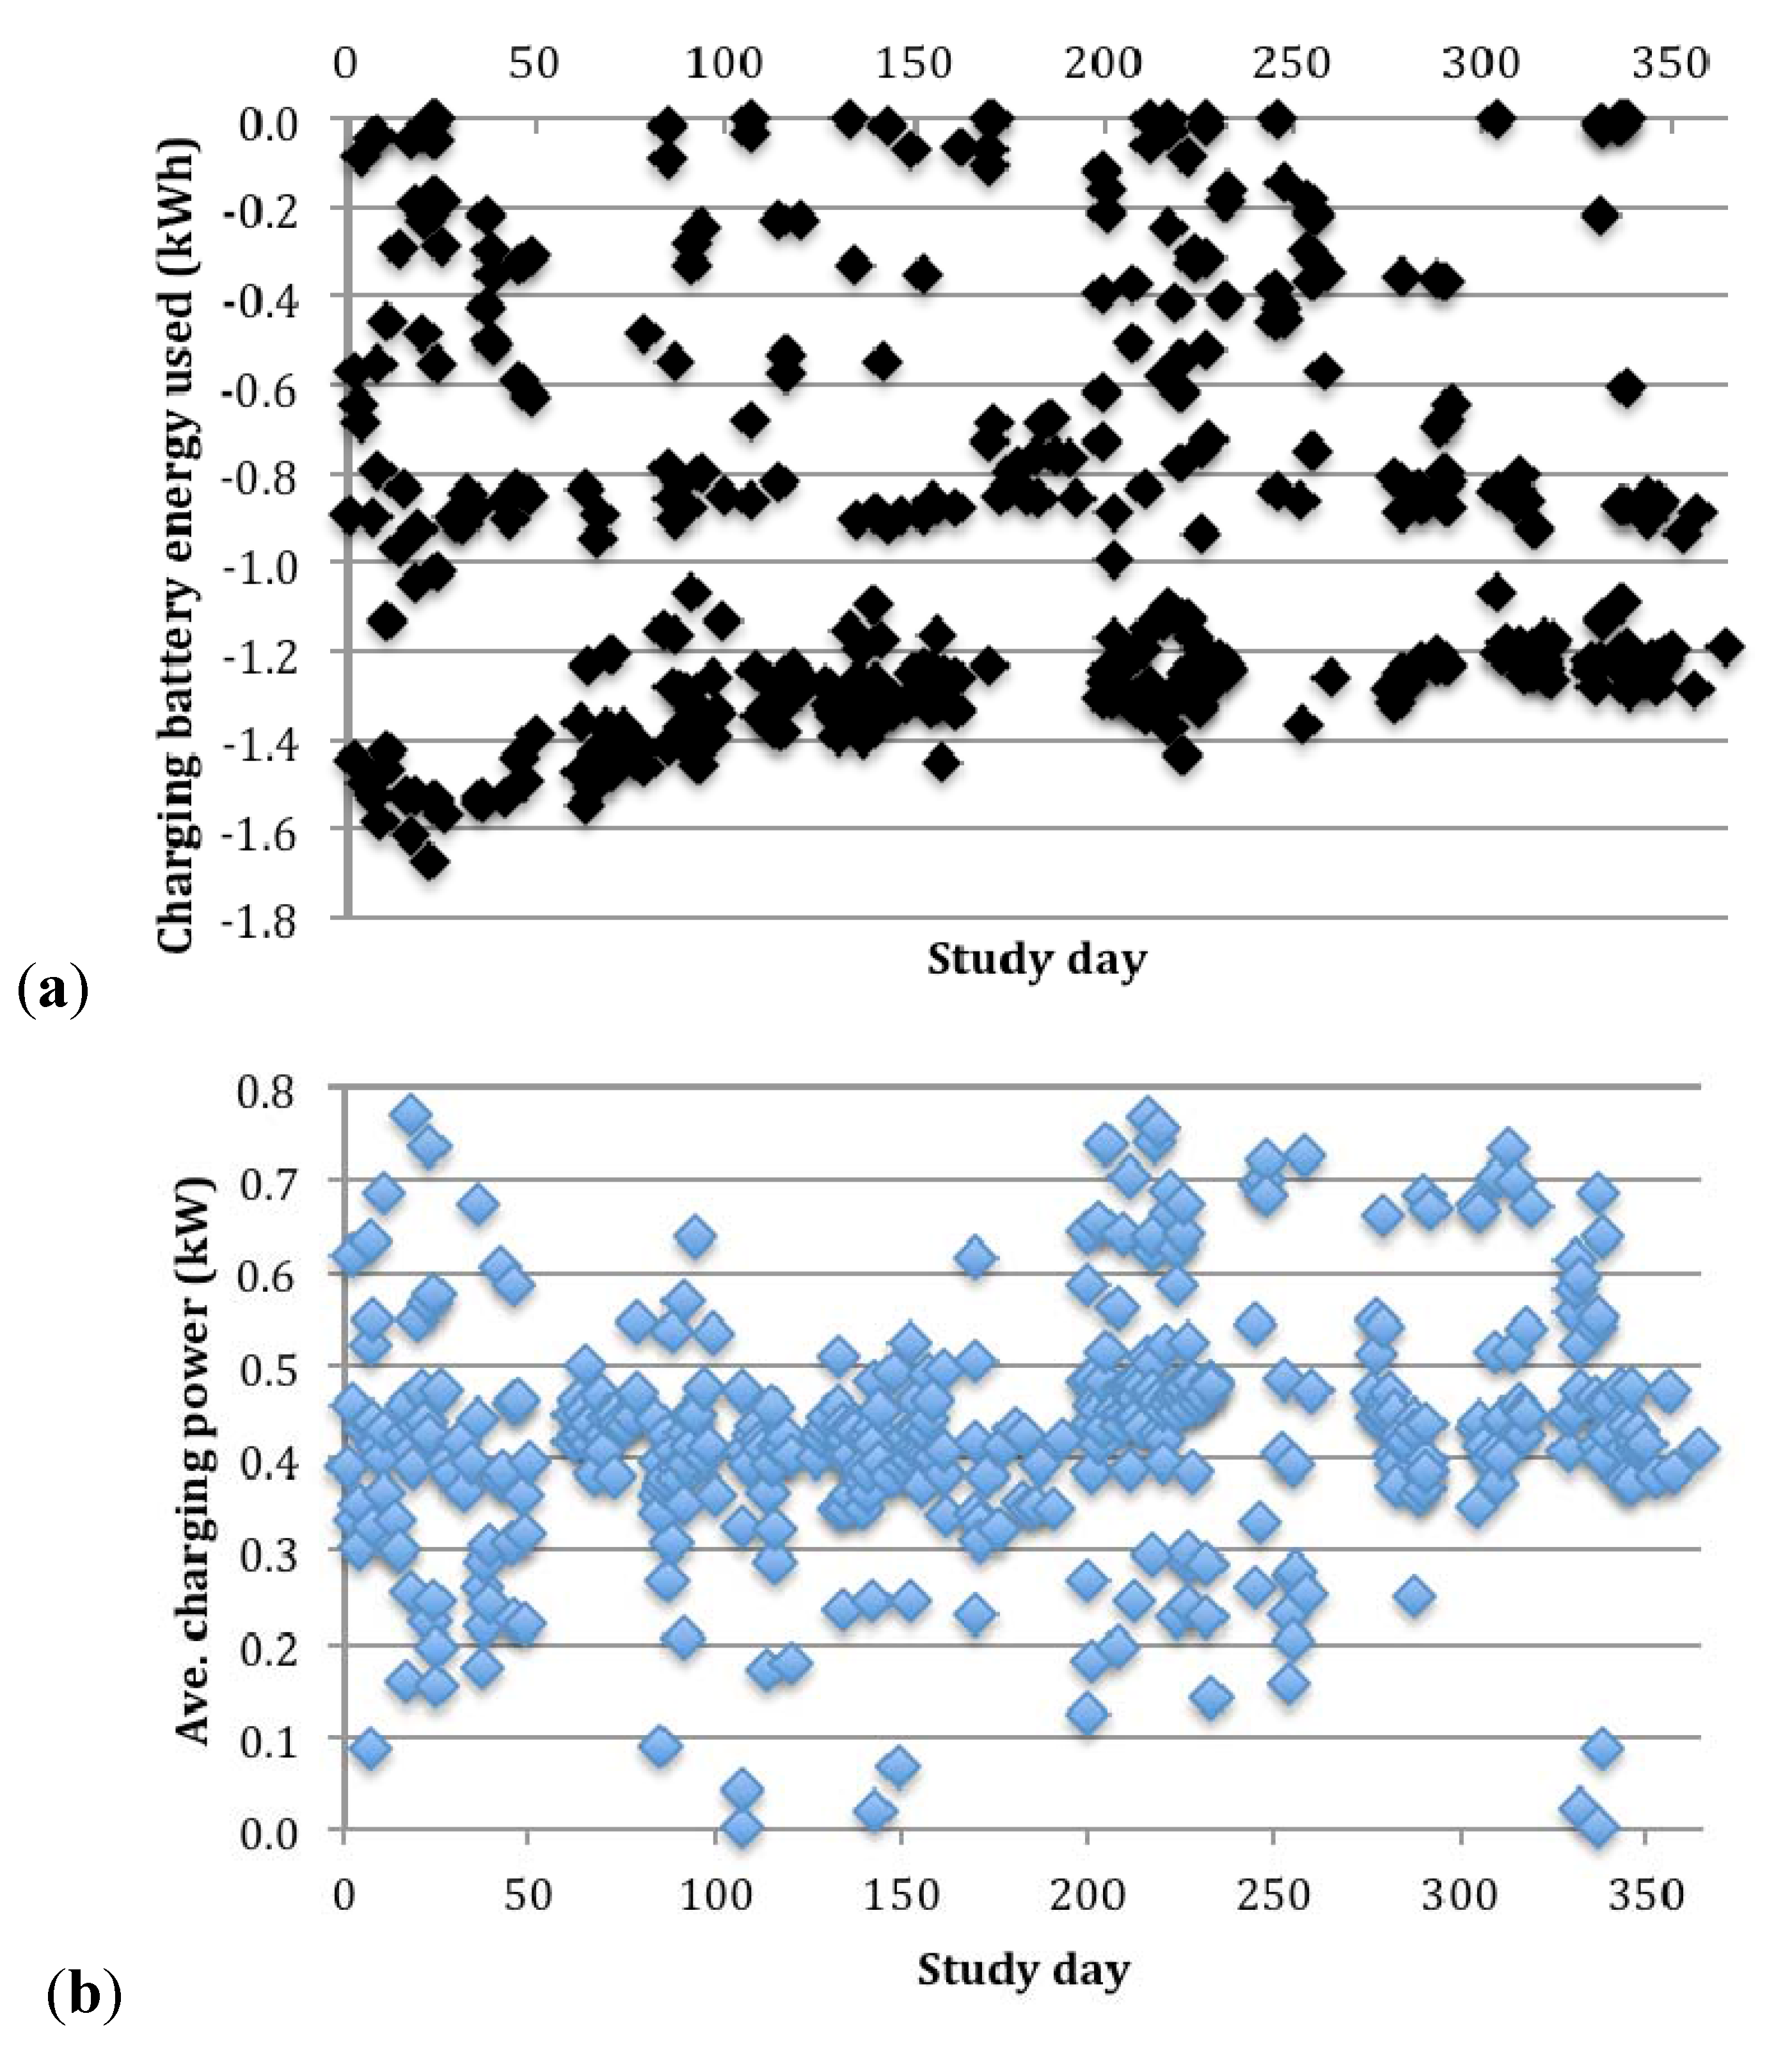
Charging events lasted as long as 4.6 hours, but, on average, were a little over two-and-one-half hours. In terms of the diurnal distribution of charging events, the biggest “mountain” of weekday charging events occurred between 6pm and 3am, peaking between roughly 7pm to 11pm. The second-biggest mass of charging events, presumably highly influenced by the availability of workplace charging, happened between 6am and noon, peaking between roughly 8am to 10am. A third peak occurred roughly between 1pm and 5pm.
4.3. Energy Use
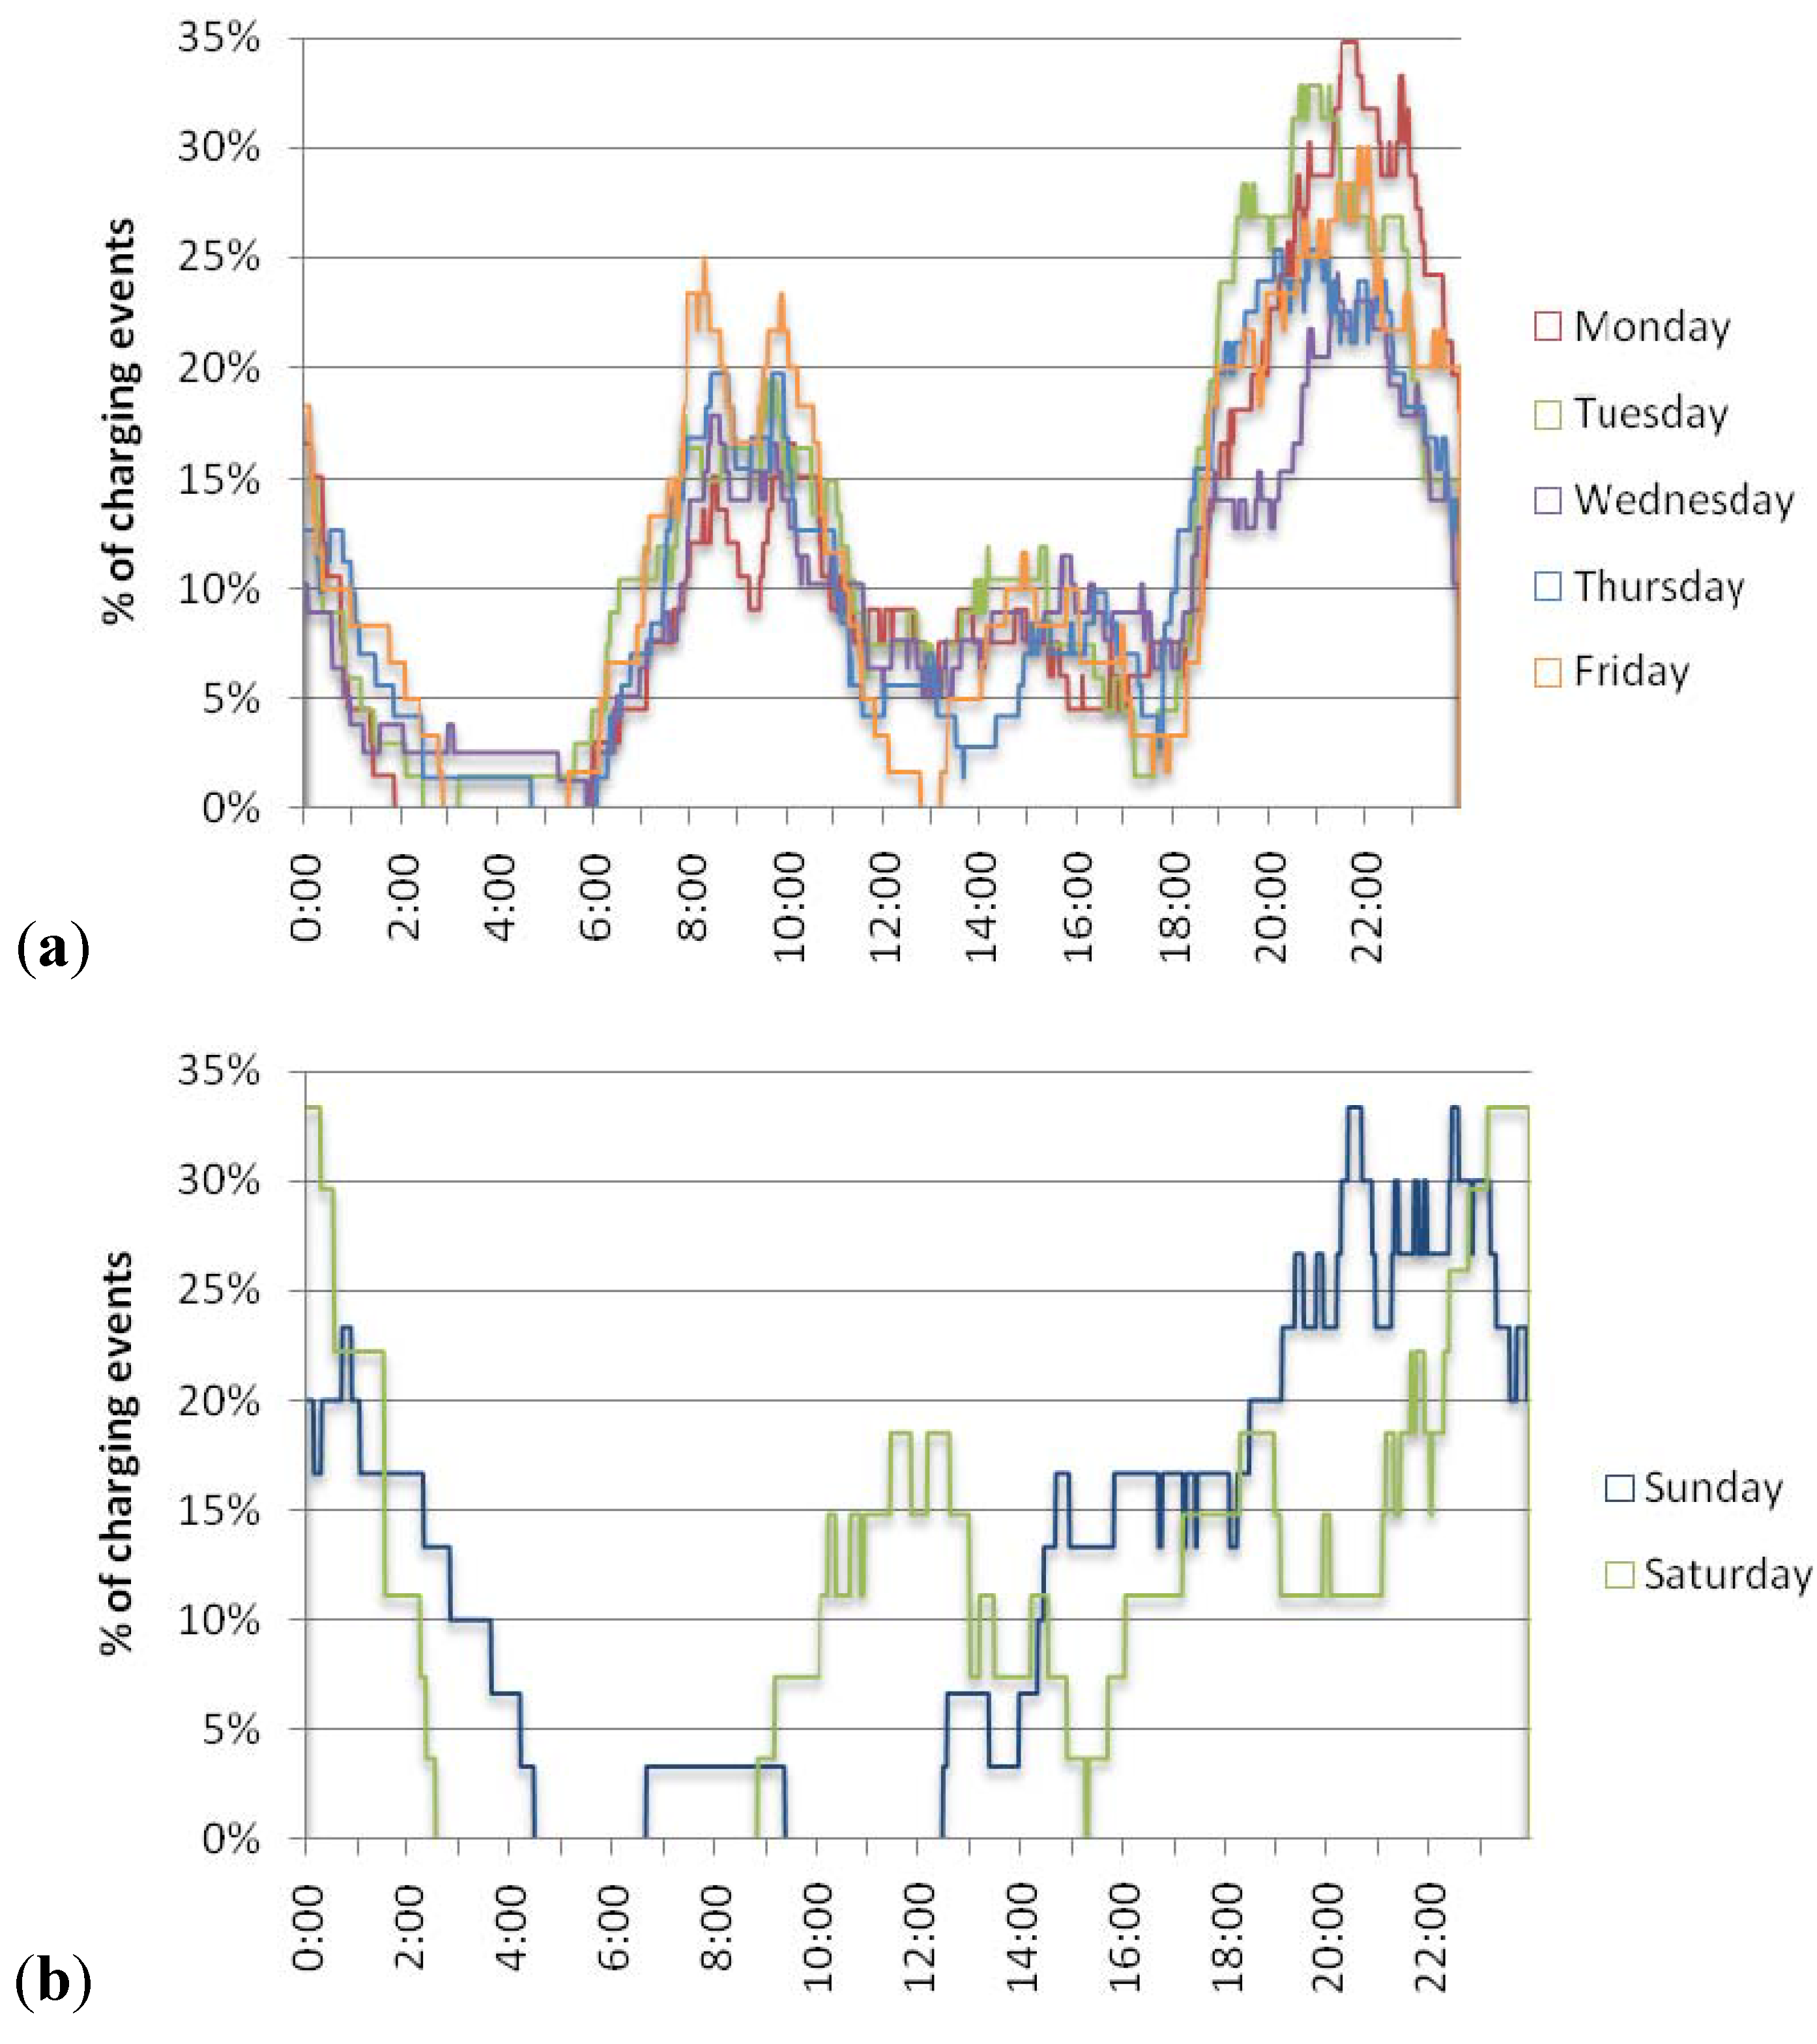
Most trips used less than one-half gallon of gasoline. The mean gasoline consumption was 0.1 gallons (gal) per trip, whereas the maximum was 2.7 gal, and the total amount of fuel consumed was 225 gal. Dividing total gasoline used by total distance traveled, the average fuel consumption for this particular set of vehicle observations is 0.66 kWh of gasoline per mi. Including total charging energy (i.e., total battery energy divided by 0.83 to account for charging losses), the overall average is 0.70 kWh/mi. This implies that electricity consumption accounted for roughly 6% of the total energy used (gasoline plus electricity).
The extreme variability and influence of plugging in on fuel economy largely disappears for trips longer than roughly 10 miles (though the considerable variability seen for charge-sustaining hybrids of course remains). Unlike aftermarket conversions, all-electric operation lasted for the entire multiple-mile trip in several cases without the vehicle engine turning on. Nevertheless most (73%) of the entirely electric trips observed were less than one quarter of a mile in length. This is expected, because the vehicle was not designed to maximize the provision of fully electric trips or even of all-electric range, but rather uses computer optimization to manage electric operation within the context of its charge-depleting, blended-mode operation. Further, hard accelerations may have been required at the beginning of many trips.
The largest observed charging event added 1.67 kWh to the battery, 64% of the 2.6-kWh battery pack. Most of the charging events observed, however, added less than 1.4 kWh, and the mean charge 0.92 kWh, or about 35% of a 2.6-kWh pack. Though no data is available describing the instantaneous charging power, the mean average power drawn (as described in
Section 3.2.2) was estimated to be less than one-half of one kilowatt—quite modest relative to the requirements facing utilities should battery EVs and/or fast charging become prevalent. Despite a slightly lower percentage of charging events, substantially more total charging was done on weekdays, as might be expected with the availability of workplace charging.
4.4. Greenhouse Gas (GHG) Emissions
Emissions from charging were estimated to be a small fraction (12%) of emissions from driving this study vehicle, as seen in
Figure 6. Over time, however, the proportion of charging emissions will increase with the increased utilization of electric drive. Further, when assigning emissions to vehicle charging, policymakers face a difficult choice. For example, they can choose to assign rates reflective either of total power-plant operation averaged over the year or of marginal additions to the grid (emissions from the last power-plant(s) added to serve additional load). Charging load can currently be thought of as a marginal load in the sense that it is being added onto an existing electrical grid whose operation was planned for other reasons. Hence, the example in
Figure 6 assigns a simplified marginal emissions rate (reflective of the last power-plants added, but assumed constant and averaged over the year). However, as charging becomes part of the planning process, assigning to charging load the full burden of the marginal emission rate is arguably over-burdening one type of load relative to another.
Table 10 compares GHG emissions from charging calculated from the electricity demand observations using three methods: one “average” and two “marginal” methods. Emissions averaged approximately 226 g/mi and were, in total, roughly half that of a conventional baseline.
4.5. Key Findings
Key findings from this study of the use of an early-generation, nickel-metal-hydride Toyota Prius Plug-in HV include:
Study participants had a higher percentage of travel days exceeding key distances (10–50 miles) than the NHTS drivers illustrated in
Figure 1.
Nevertheless, for a plug-in hybrid’s expensive battery asset to be fully utilized on at least 81% of the days driven by the study participants, the battery would need to be designed to provide no more than 20 miles of charge-depleting or “electric” range. In contrast, on about half of the days driven, a 40-mile charge-depleting range would not be fully utilized.
With “unconstrained” [
33] at-home and free workplace charging, this study observed earlier evening (6pm to midnight), additional daytime (6am to noon and, to a lesser extent, noon to 6pm), and less nighttime (midnight to 6am) charging than assumed in some studies (e.g., [
27]).
The mean average power drawn for charging, estimated as described in
Section 3.2.2, was less than one-half of one kilowatt. The maximum average power drawn was less than one kilowatt.
The overall average fuel consumption for this particular set of vehicle observations is calculated to be 0.66 kilowatt-hours of gasoline per mile. Including charging, the overall average is estimated to be 0.70 kilowatt-hours per mile.
The study participants were estimated to produce roughly 226 grams of GHGs per mile, including emissions from both gasoline (88%) and California marginal electricity (12%). Assuming California marginal electricity increases the contribution of charging by 56% relative to assuming California average electricity.
As expected, the real-world use of a small-battery, blended-mode plug-in hybrid produces results distinct from, and with greater variation and complexity than, analysis of all-electric designs characterized with necessarily simplifying assumptions. For example, Shiau
et al. [
29] confine their scope “to the all-electric strategy for simplicity since blended-strategy operation characteristics are sensitive to control parameters,” and their analysis reasonably treats battery depth-of-discharge as a simple function of driving distance, all-electric range as a simple function of battery capacity, and charge-depleting efficiency as constant. Real-world fuel economy of course exhibits considerable variability, as seen in
Figure 3. In this case, the extreme variability of real-world fuel economy observations—enhanced by plugging in, charging, and then depleting charge via a complex control strategy—gives way to the less extreme but still considerable variability of regular hybrid operation as trips exceed roughly 10 miles.
The small-battery, blended-operation vehicle observed here used a relatively small amount of electricity. Electricity consumption accounted for roughly 6% of the total energy used (gasoline plus electricity) and emissions from charging are estimated to be roughly 12% of emissions estimated for driving the study vehicle. And the low power draw of this type of vehicle, estimated to average less than one kilowatt in this study, is comparable to other household appliances and significantly less than the likely requirements of battery EVs and fast charging. Nevertheless, the vehicle achieved, through a number of mechanisms, significant fuel-economy and GHG-emissions improvements. For example, the study vehicle was estimated to have averaged roughly half the emissions expected from a 2009 fleet-wide average vehicle, or a rate roughly comparable to previous analysis [
4,
27] of plug-in hybrids charged by similarly carbon-intensive electricity but largely at night and designed for 20 miles of all-electric range from batteries roughly twice the capacity (and thus cost).
4.6. Directions for Future Research
Additional research is needed analyzing driving and recharging patterns and their relationship to different plug-in-vehicle designs. Future analysis of the CCMP and subsequent vehicle placements could dig more deeply into dynamics related to the distance driven between charging and the electric contribution to driving range in small-battery blended-mode plug-in hybrids. It could also include more and different types of data and analysis—e.g., characterizing the use of the other study vehicle types, using attitudinal/behavioral data from surveys and interviews, and identifying trends in use over time to look for “waning novelty” or “increasing familiarity” effects. Further, investigation of additional topics related to plug-in-hybrid use could be informed by subsequent placements with enhanced data collection, such as how engine on/off events relate to criteria-air-pollutant impacts. Collaborations between analysts modeling and those deploying plug-in hybrids could establish particularly fruitful feedback loops to inform both lines of inquiry.
Collectively, this growing body of knowledge will create an increasing understanding of the anticipated use and impact of electric-drive vehicles, and of how these vehicles might best be designed, fueled, and otherwise prepared for by policymakers and strategic planners.


