Improved Methods for Production Manufacturing Processes in Environmentally Benign Manufacturing

Abstract
:1. Introduction
2. Methodology
2.1. Introduction
2.2. Methodology for Determining Production Processes at Three Levels
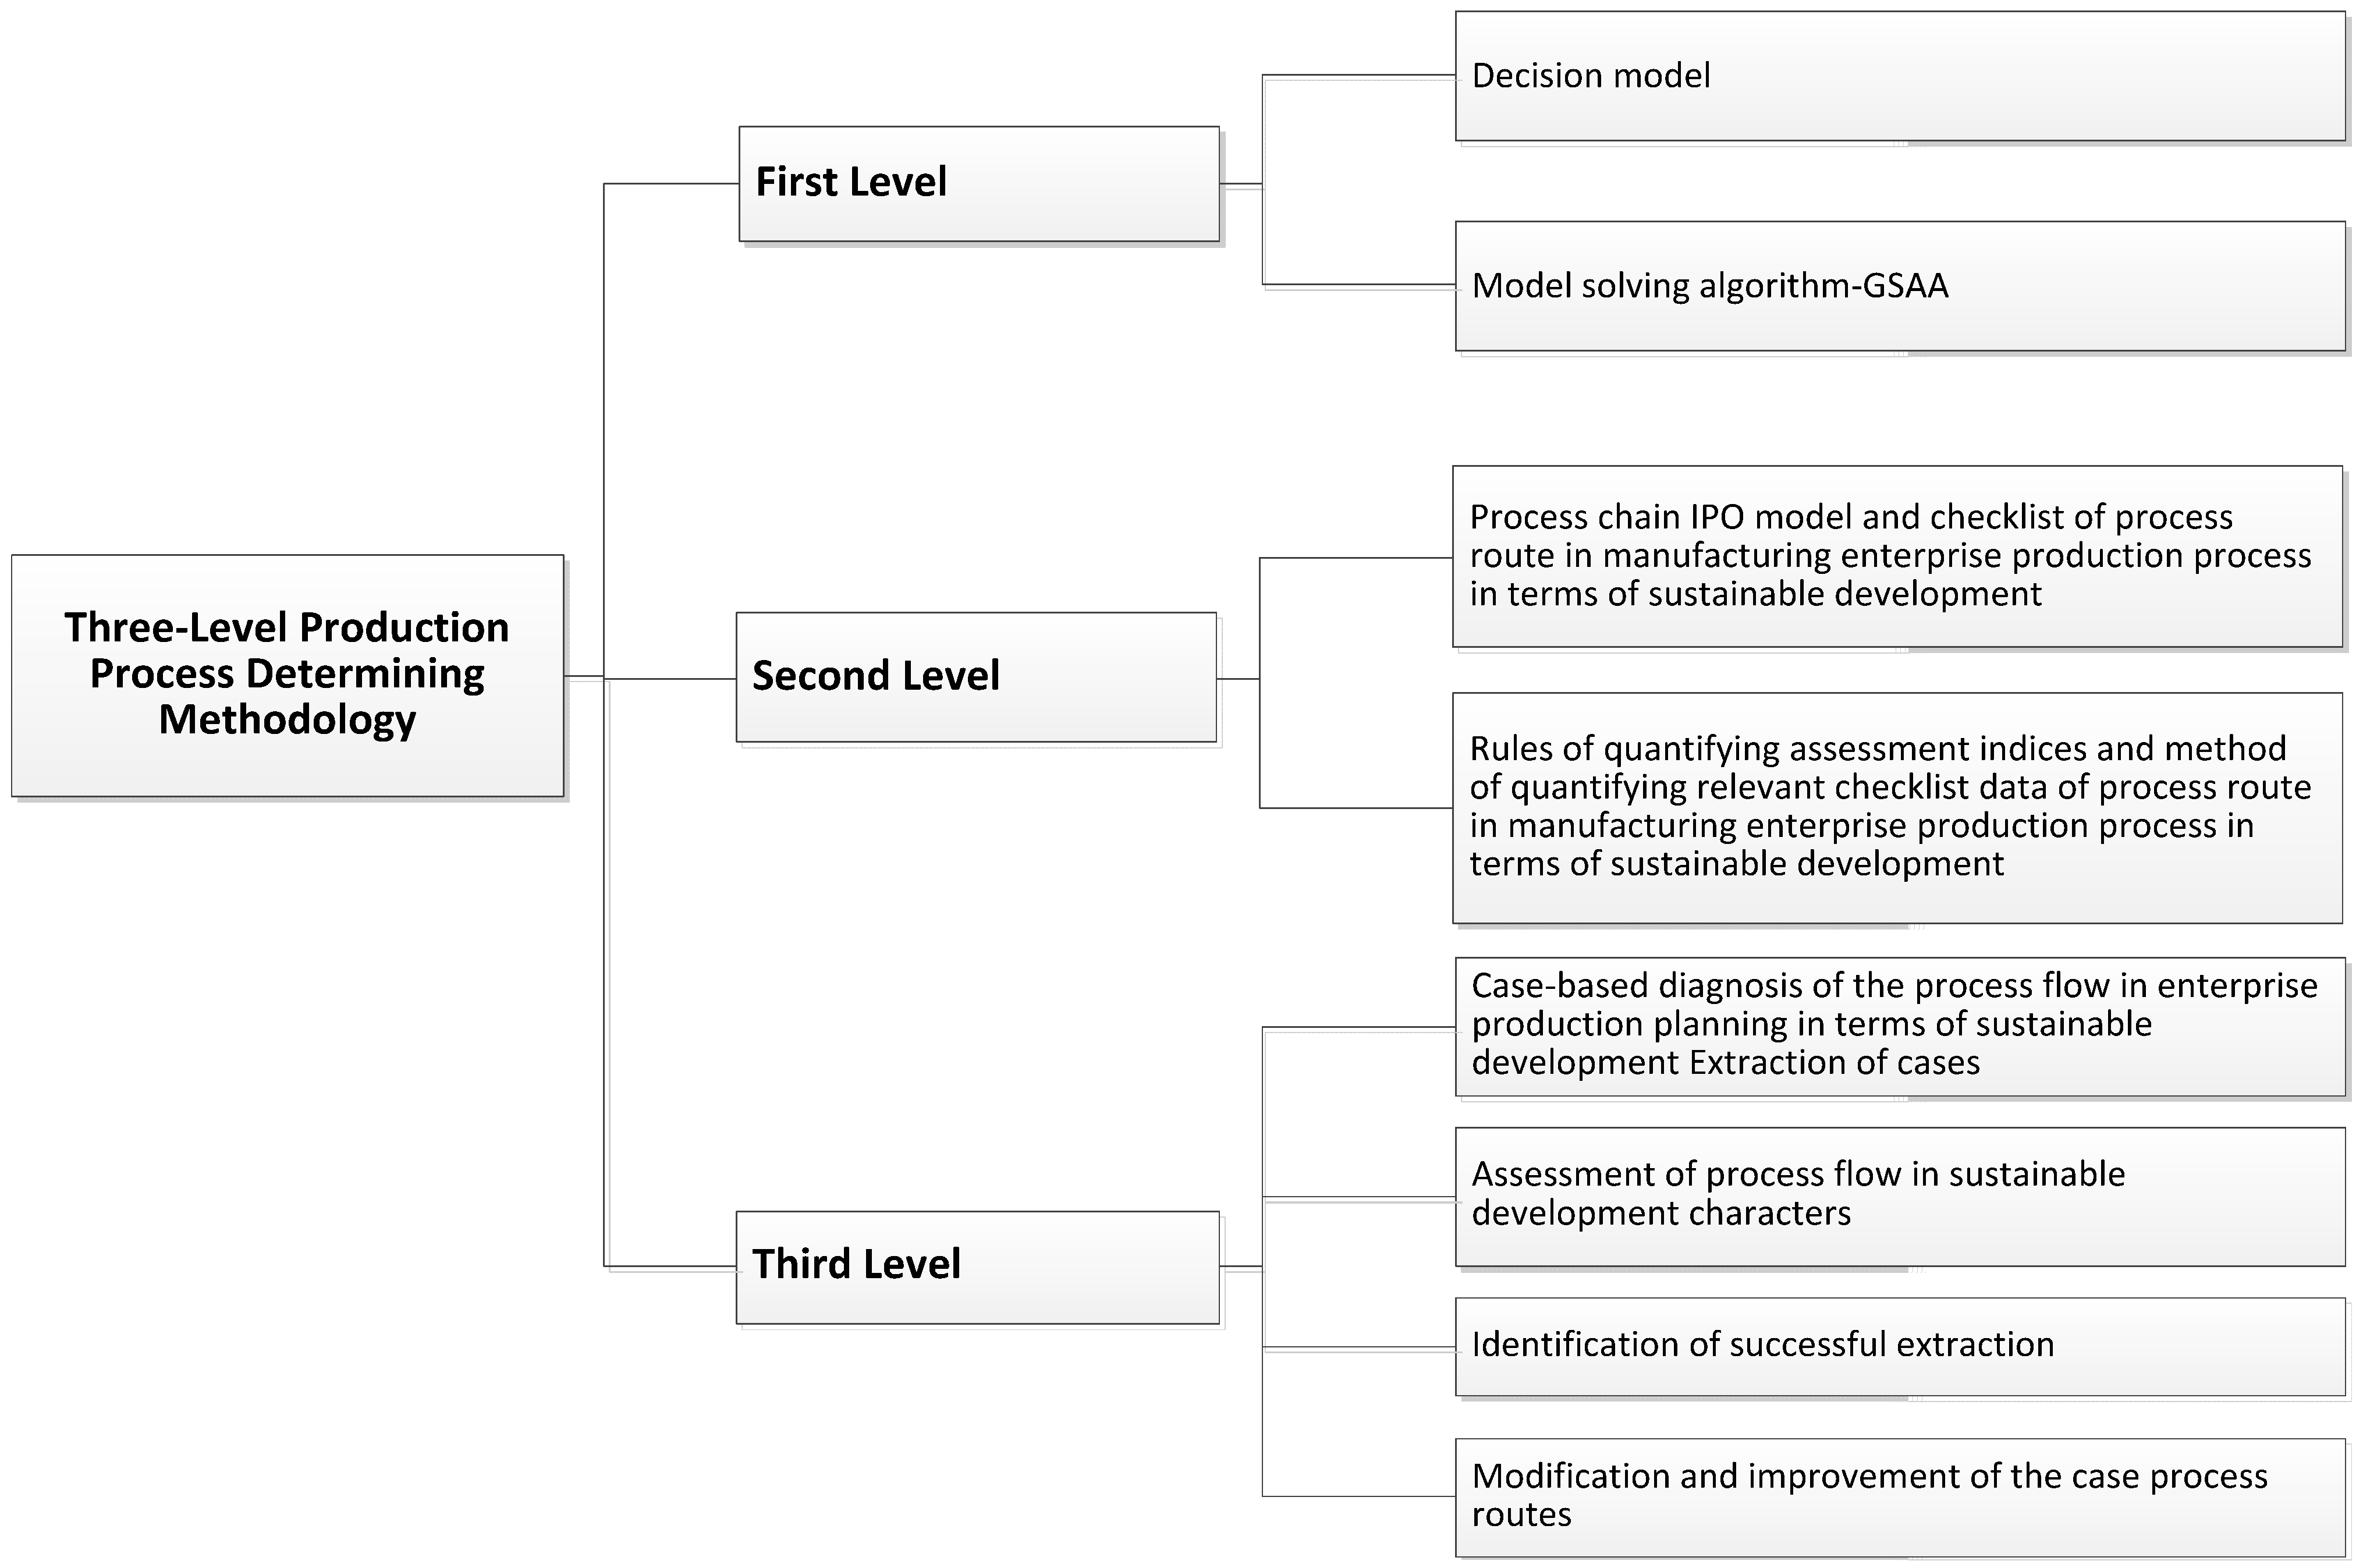
2.2.1. Architecture of the Three Levels of the Methodology for Determining Production Processes

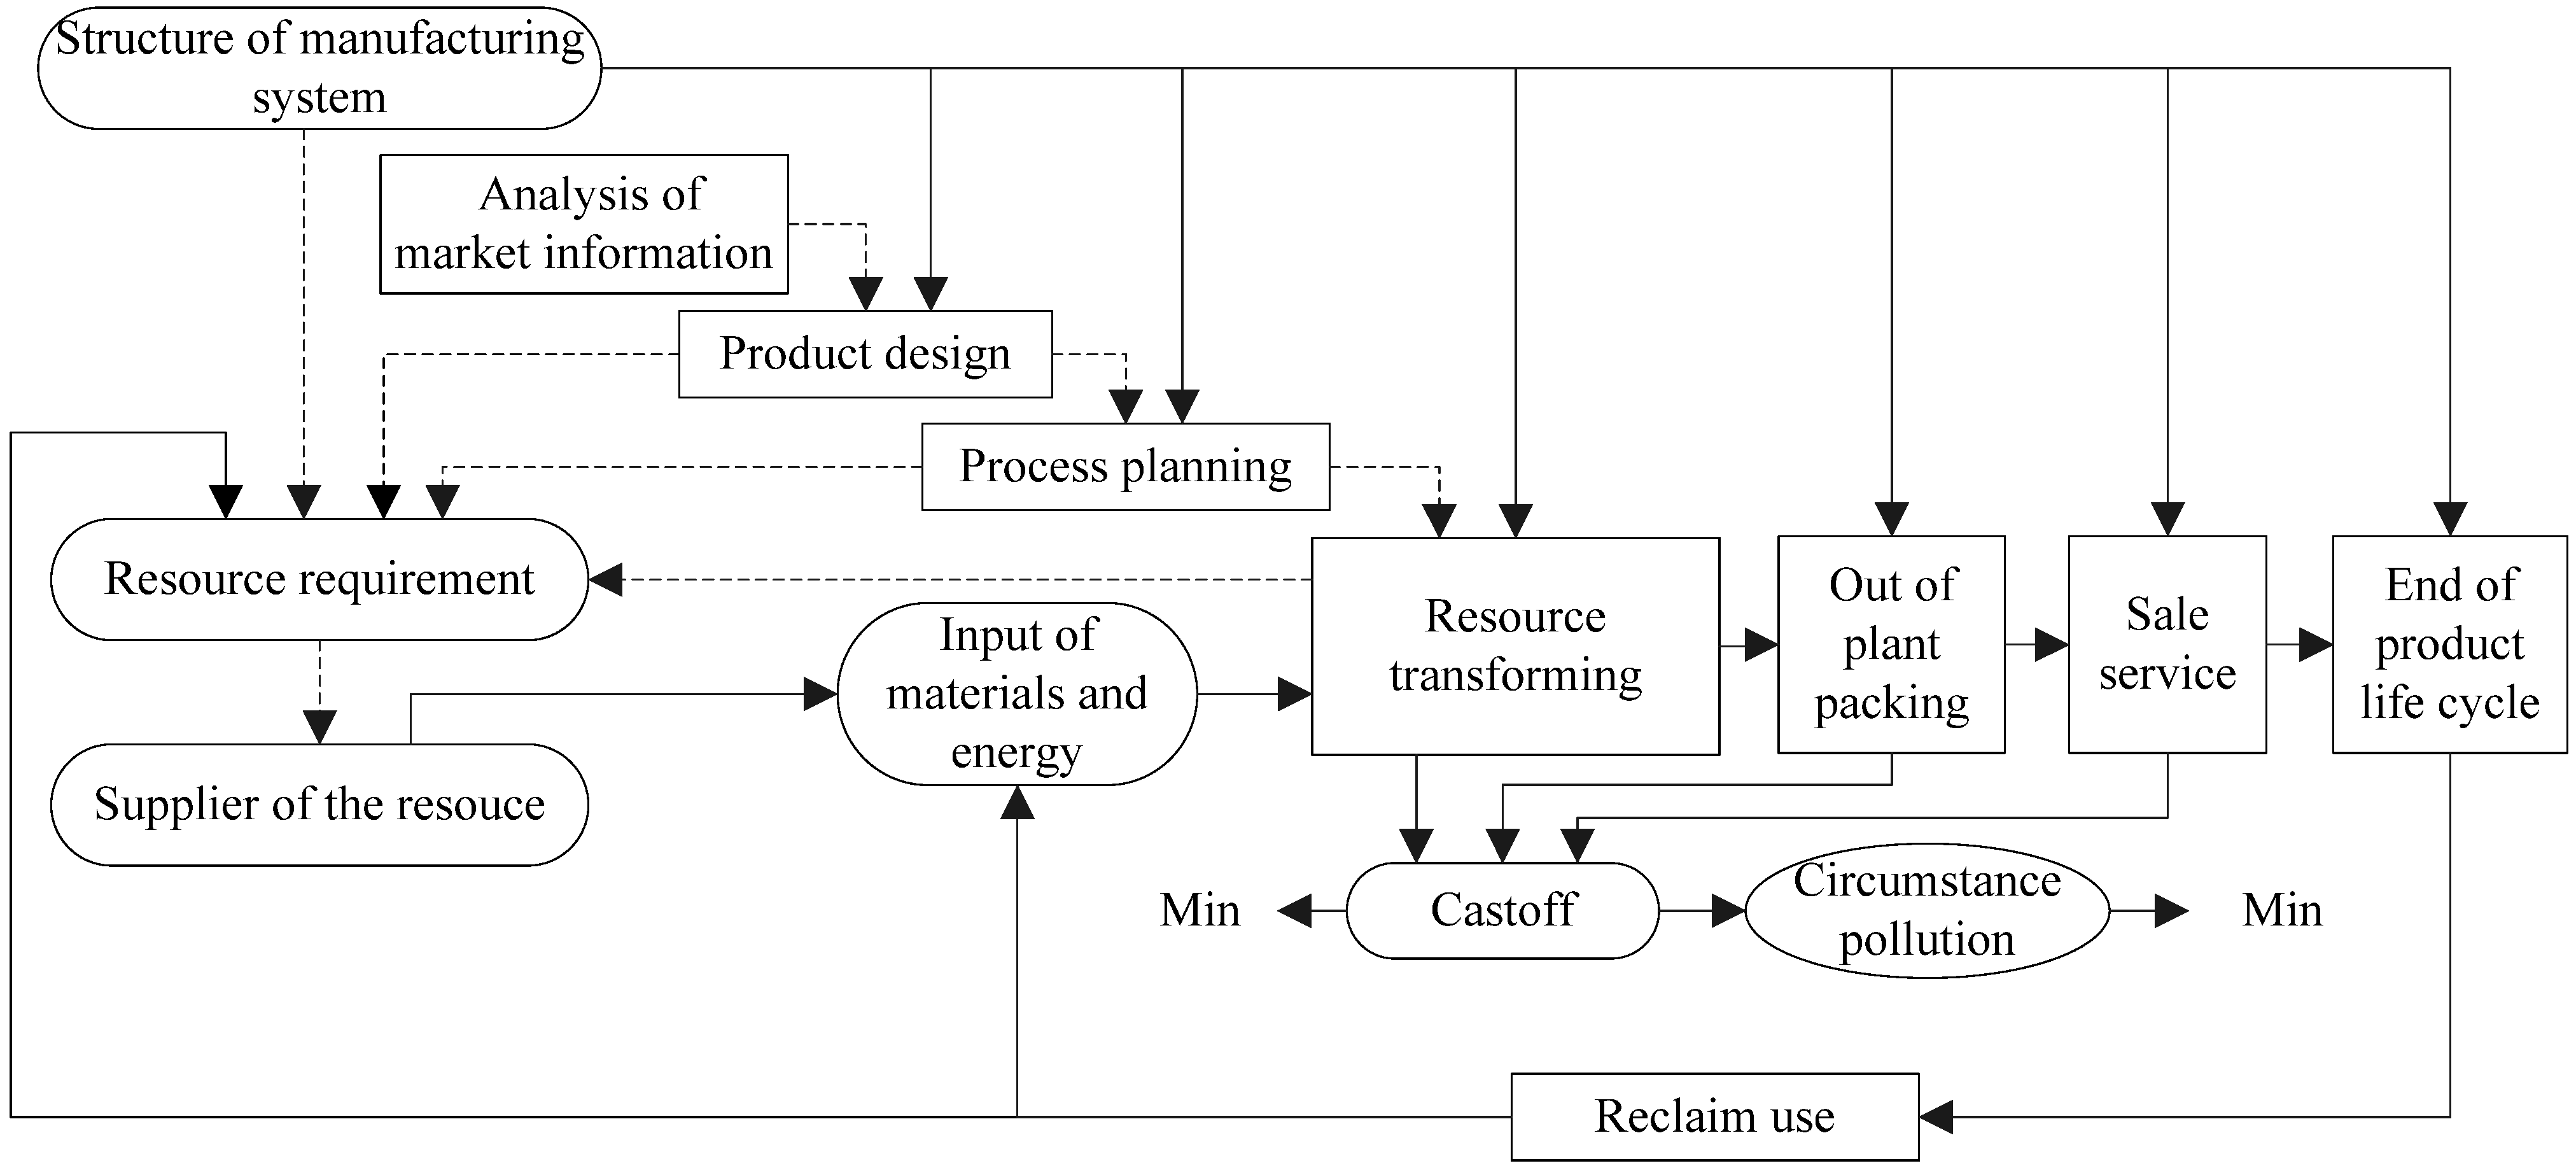
2.2.2. First Level of the Methodology
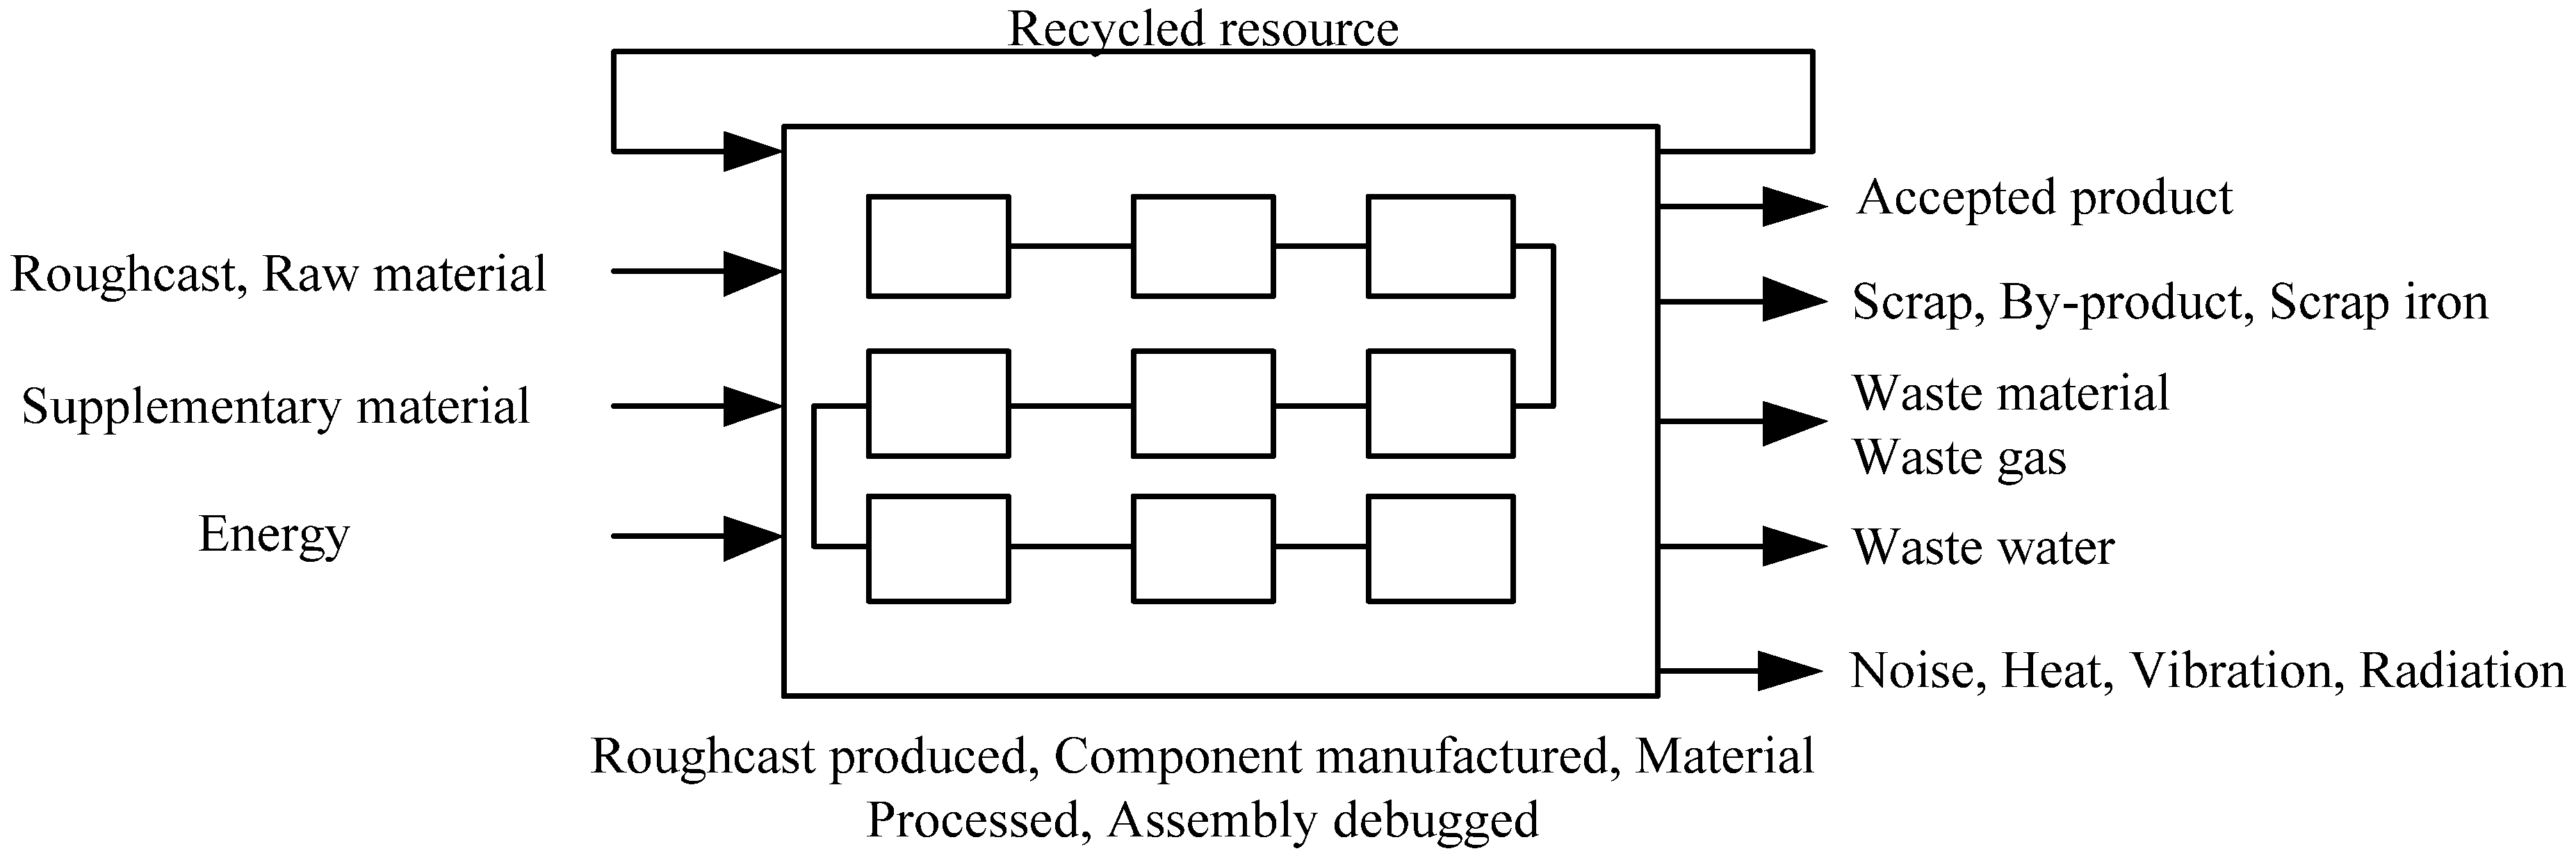
2.2.3. The Second Level of the Methodology

| Process Input: Cutting-Roughcast | Process Output: Semi-Finished Articles | ||
|---|---|---|---|
| Raw material | Roughcast Name | Product | Product Name |
| Material Name | Weight | ||
| Weight | Chip | Component | |
| Tool | Tool Name | Weight | |
| Material | Noise | Sound Pressure | |
| Process parameters | Cutting Speed | Sound Power | |
| Cutting Rate | Waste water | Component | |
| Cutting Depth | Weight | ||
| Electricity power | Power | ||
| Operation time | |||
| Pneumatic power | Power | ||
| Operation time | |||
| Recycle | |||
| Clamp | Name | Cooling liquid | Name |
| Weight | Weight | ||
| Recycle Rate | Recycle Rate | ||
| Raw material use efficiency (L): | |
| Raw material consumption (W), kg: | |
| Tool consumption (mt), kg: | |
| Cutting fluid consumption (mf), kg: | |
| Energy consumption (E), J: |
| Solid wastage (mchip), kg: | |
| Discharge gas (mevap), kg: | |
| Discard solution (m’f): | |
| Noise, dB: Equivalent continuous sound pressure level (marked corresponding to the state standard) | |
| Security | The valve of degree of health hazard |
| Method | A | B | C | D | E | F |
|---|---|---|---|---|---|---|
| 10 points | 10, 9 | 8, 7 | 6, 5 | 4, 3 | 2, 1 | 0 |
| Note | A: Extremely adverse; B: Quite adverse; C: Moderately adverse; D: Fairly adverse; E: Appreciably adverse; F: No impact | |||||
| Method | A | B | C | D | E | F |
|---|---|---|---|---|---|---|
| 10 points | 10, 9 | 8, 7 | 6, 5 | 4, 3 | 2, 1 | 0 |
| Note | A: Extremely harmful; B: Quite harmful; C: Moderately harmful; D: Fairly harmful; E: Inappreciably harmful; F: No impact | |||||
| Method | Very Poor | Poor | General | Good | Very Good |
|---|---|---|---|---|---|
| 10 points | 10, 9 | 8, 7 | 6, 5 | 4, 3 | 2, 1 |
| Noise (db) | >95 | 90–95 | 85–89 | 80–84 | <79 |
| Process | Raw material consumption (M) | Supplementary material consumption (SM) | Energy consumption (E) | Emission of air pollution (G) | Emission of water pollution (W) | Waste material (S) | Other pollution (O) | Security (S) | Assessment (Hp) |
|---|---|---|---|---|---|---|---|---|---|
| Pro-1 | M1 | SM1 | E1 | G1 | W1 | S1 | O1 | SE1 | Hp1 |
| Pro-2 | M2 | SM2 | E2 | G2 | W2 | S2 | O2 | SE2 | Hp2 |
| … | Mi | SMi | Ei | Gi | Wi | Si | Oi | SEi | Hpi |
| Pro-n | Mn | SMn | En | Gn | Wn | Sn | On | SEn | Hpn |
| Weight (W) | w1 | w2 | w3 | w4 | w5 | w6 | w7 | w8 |
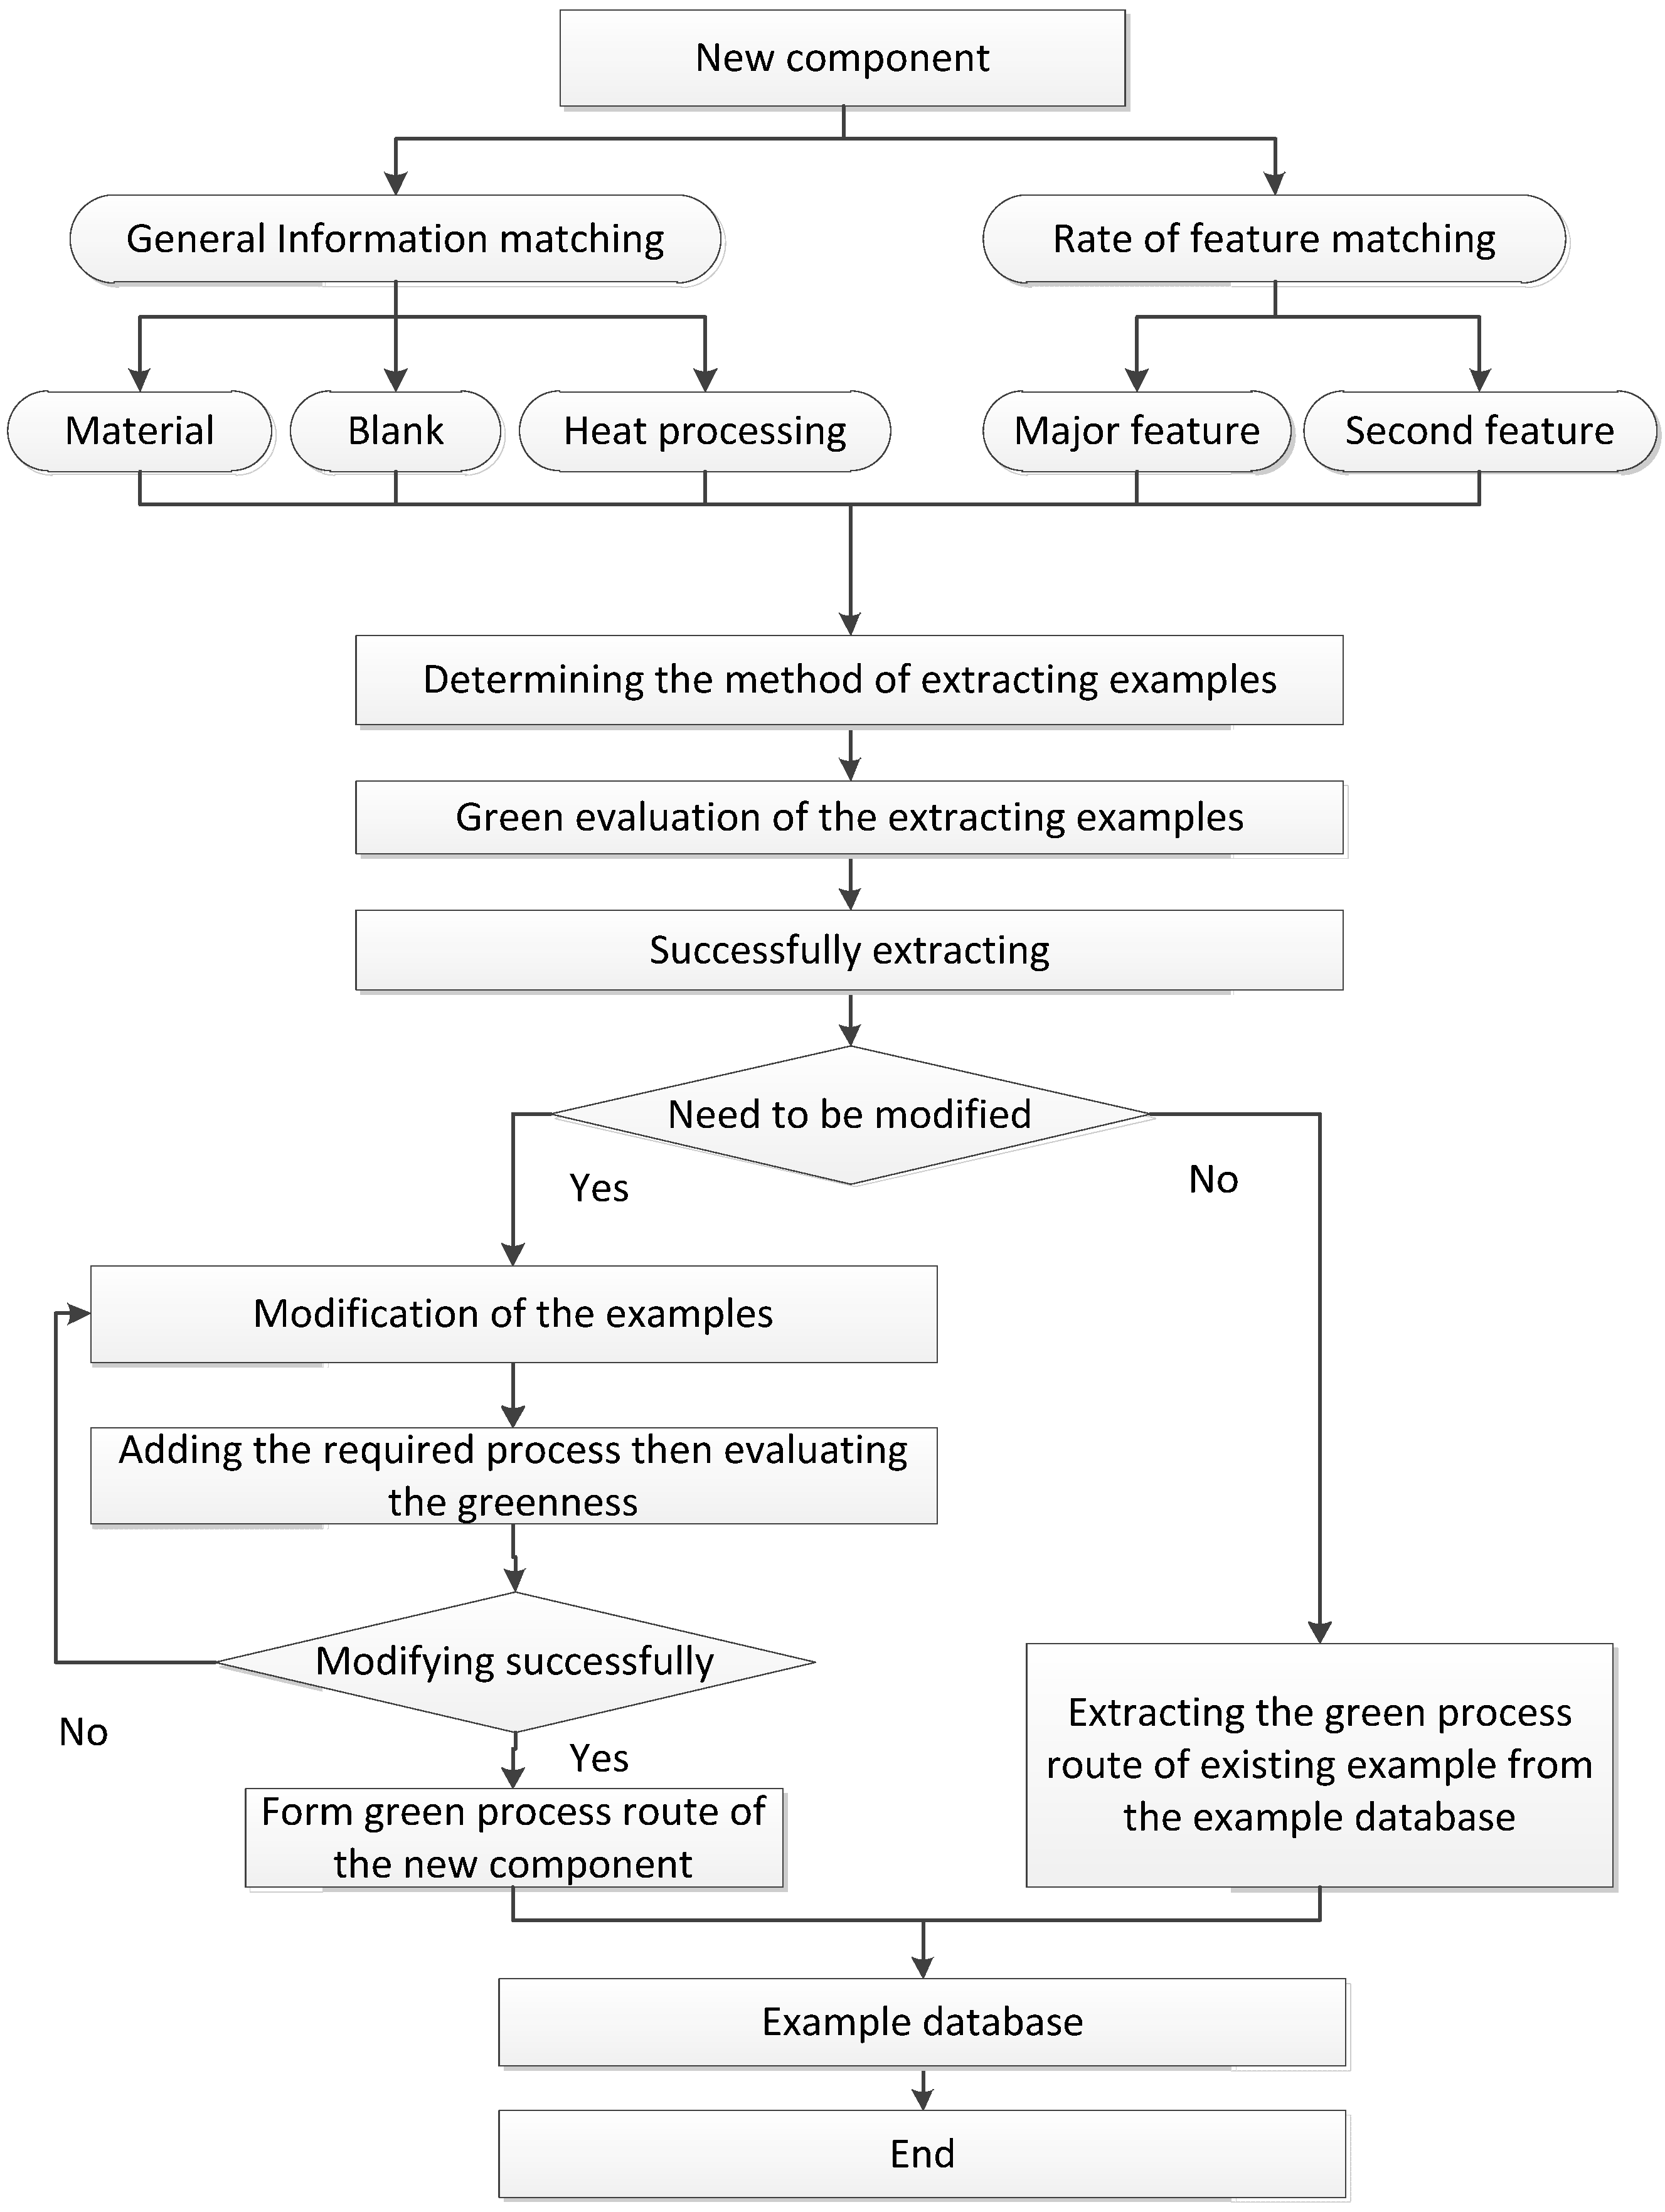
2.2.4. The Third Level of the Methodology
- is the weighting coefficient for the material matching;
- is the weighting coefficient for the feature matching;
- is the weighting coefficient for the component information matching;
- is the material matching ratio, which measures the degree to which the new component material matches the material type of the previous material;
- is the machining feature matching ratio, which measures the degree to which the machining features match; and
- is the component information matching ratio, which measures the degree to which the component information matches.
- is defined as:
- is defined as:
- is the number of features in the new components that match features in the previous case;
- is the number of features.
- is defined as
- is the number of the new component’s processing information items that match items of the previous case; and
- is the total number of the component processing information items.
3. Case Study
3.1. Single New Part Database


3.2. Case-Based Diagnosis of the Process Flow in Enterprise Production Planning in Terms of EBM Extraction of Cases
3.2.1. Assessment of the Process Flow in Terms of EBM Characteristics
3.2.2. Identification of Successful Extraction
| Process | Raw material consumption (M) | Supplementary material consumption (SM) | Energy consumption (E) | Emission of air pollution (G) | Emission of water pollution (W) | Waste material (S) | Other pollution (O) | Security (S) | Assessment (Hp) |
|---|---|---|---|---|---|---|---|---|---|
| Gross turning | 7.002 | 5.002 | 6.002 | 6.002 | 4.002 | 10.002 | 8.001 | 8.01 | 6.663 |
| Hardening & tempering | 4.002 | 4.002 | 5.002 | 6.002 | 6.001 | 14.502 | 8.001 | 7.02 | 7.043 |
| Fine turning | 0.002 | 7.002 | 9.002 | 9.002 | 8.001 | 10.002 | 8.67 | 0.0 | 7.309 |
| Fine grinding out | 3.02 | 3.01 | 4.02 | 4.02 | 3.01 | 8.02 | 4.01 | 5.00 | 4.294 |
| Hobbing | 6.002 | 6.57 | 6.002 | 7.502 | 6.17 | 10.02 | 6.51 | 5.02 | 6.840 |
| Gross grinding teeth | 4.002 | 3.01 | 4.02 | 4.03 | 6.03 | 10.01 | 4.02 | 5.02 | 5.081 |
| Quenching | 6.002 | 5.668 | 6.002 | 7.502 | 6.168 | 10.502 | 6.502 | 6.02 | 6.924 |
| Broaching | 4.02 | 13.02 | 8.01 | 4.02 | 2.01 | 10.01 | 6.02 | 5.02 | 6.036 |
| Weight | 0.06 | 0.08 | 0.12 | 0.2 | 0.16 | 0.12 | 0.16 | 0.1 | |
| Overall assessment value: 6.274 | |||||||||
| Process | Raw material consumption (M) | Supplementary material consumption (SM) | Energy consumption (E) | Emission of air pollution (G) | Emission of water pollution (W) | Waste material (S) | Other pollution (O) | Security (S) | Assessment (Hp) |
|---|---|---|---|---|---|---|---|---|---|
| Gross turning | 7.002 | 5.335 | 6.002 | 5.335 | 4.668 | 10.502 | 8.001 | 9.02 | 6.823 |
| Hardening & tempering | 0.002 | 7.002 | 8.001 | 1.001 | 8.001 | 10.502 | 8.335 | 7.84 | 6.379 |
| Fine turning | 4.002 | 3.668 | 5.002 | 4.002 | 3.001 | 10.002 | 5.002 | 6.02 | 5.017 |
| Hobbing | 6.002 | 5.5668 | 6.002 | 7.502 | 6.168 | 10.502 | 6.502 | 6.02 | 6.916 |
| Boring | 6.002 | 5.002 | 6.002 | 6.666 | 4.335 | 10.502 | 8.001 | 0 | 6.048 |
| Gross grinding teeth | 4.002 | 4.002 | 5.002 | 5.835 | 6.502 | 10.252 | 5.002 | 5.02 | 5.900 |
| Fine grinding out | 3.002 | 3.668 | 5.002 | 5.002 | 5.668 | 13.002 | 6.002 | 5.02 | 6.004 |
| Broaching | 4.002 | 3.001 | 8.001 | 4.002 | 2.668 | 11.002 | 7.002 | 6.02 | 5.710 |
| Fine grinding | 4.002 | 3.001 | 4.502 | 4.002 | 5.502 | 10.502 | 5.002 | 5.02 | 5.264 |
| Fine grinding teeth | 8.001 | 2.001 | 8.001 | 2.001 | 2.668 | 13.502 | 6.002 | 5.02 | 5.510 |
| Weight | 0.06 | 0.08 | 0.12 | 0.2 | 0.16 | 0.12 | 0.16 | 0.1 | |
| Overall assessment value: 5.957 | |||||||||
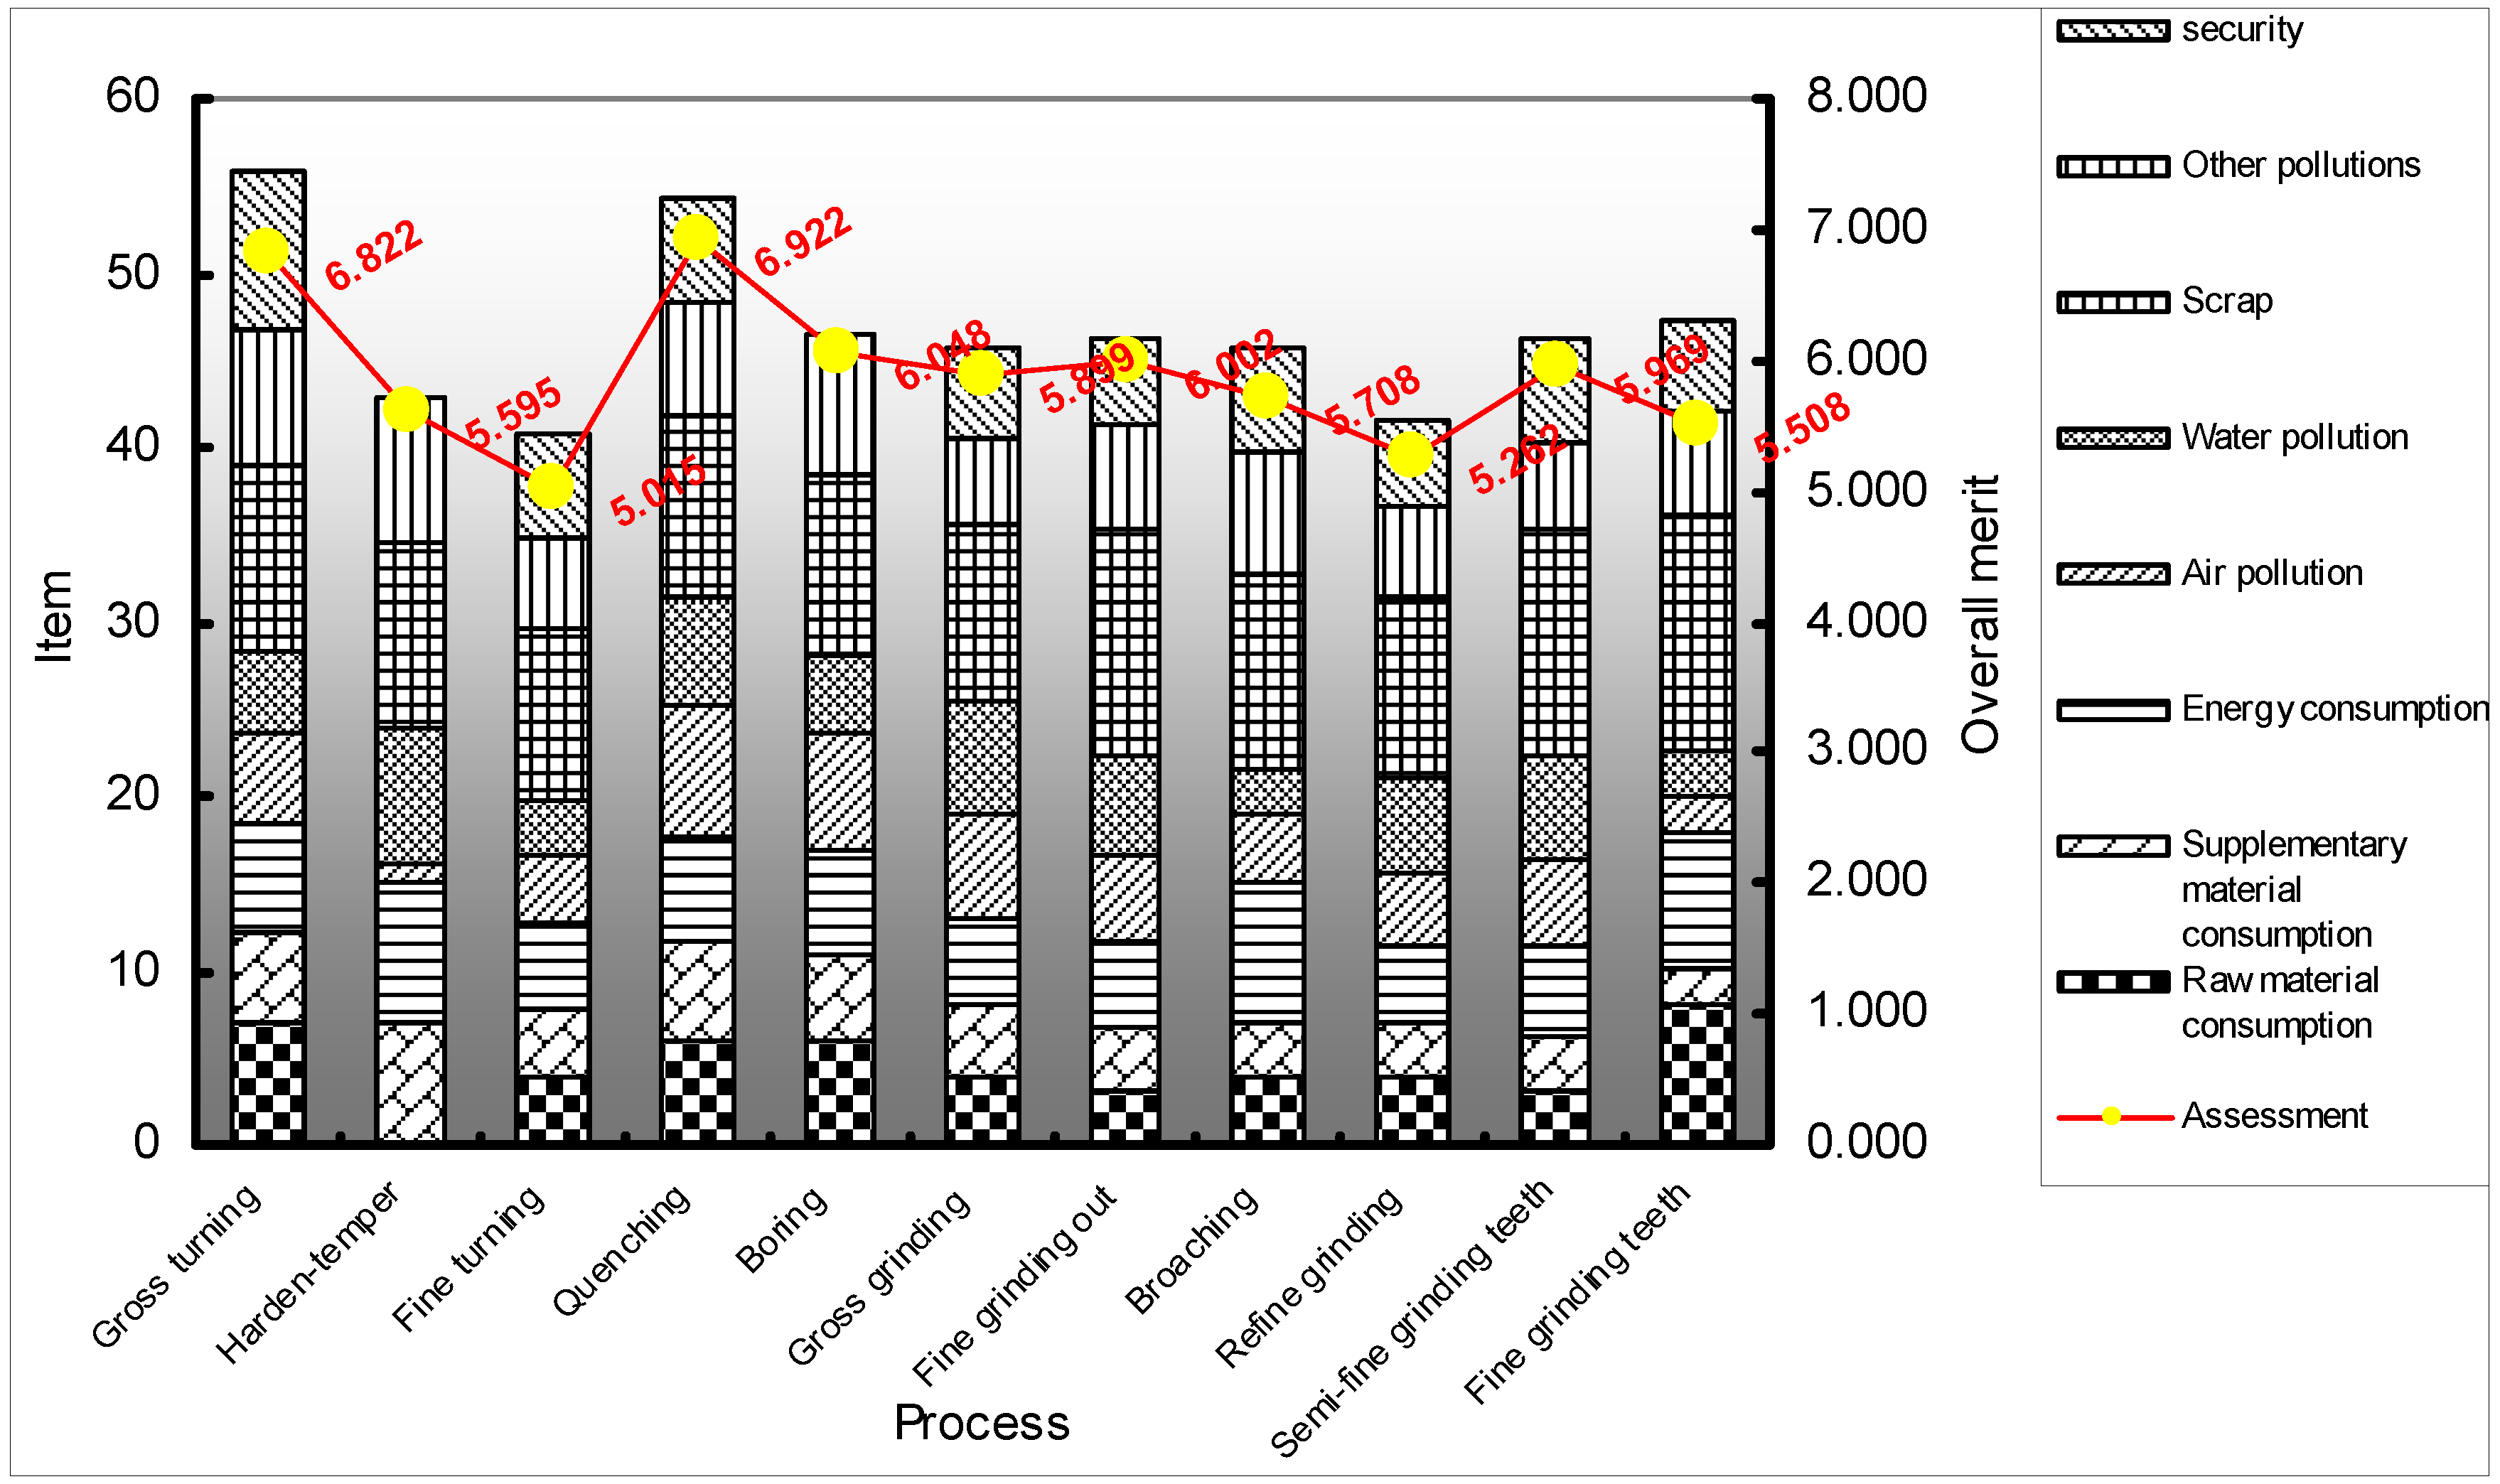
| Process | Raw material consumption (M) | Supplementary material consumption (SM) | Energy consumption (E) | Emission of air pollution (G) | Emission of water pollution (W) | Waste material (S) | Other pollution (O) | Security (S) | Assessment (Hp) |
|---|---|---|---|---|---|---|---|---|---|
| Gross turning | 7.002 | 5.335 | 6.002 | 5.335 | 4.668 | 10.502 | 8.001 | 9.02 | 6.822 |
| Hardening & tempering | 0.002 | 7.002 | 8.001 | 1.001 | 8.001 | 10.502 | 8.335 | 0 | 5.595 |
| Fine turning | 4.002 | 3.668 | 5.002 | 4.002 | 3.001 | 10.002 | 5.002 | 6.02 | 5.015 |
| Hobbing | 6.002 | 5.5668 | 6.002 | 7.502 | 6.168 | 10.502 | 6.502 | 6.02 | 6.802 |
| Quenching | 6.002 | 5.668 | 6.002 | 7.502 | 6.168 | 10.502 | 6.502 | 6.02 | 6.922 |
| Boring | 6.002 | 5.002 | 6.002 | 6.666 | 4.335 | 10.502 | 8.001 | 0 | 6.048 |
| Gross grinding teeth | 4.002 | 4.002 | 5.002 | 5.835 | 6.502 | 10.252 | 5.002 | 5.02 | 5.899 |
| Fine grinding out | 3.002 | 3.668 | 5.002 | 5.002 | 5.668 | 13.002 | 6.002 | 5.02 | 6.002 |
| Broaching | 4.002 | 3.001 | 8.001 | 4.002 | 2.668 | 11.002 | 7.002 | 6.02 | 5.708 |
| Fine grinding | 4.002 | 3.001 | 4.502 | 4.002 | 5.502 | 10.502 | 5.002 | 5.02 | 5.262 |
| Semi-fine grinding teeth | 3.002 | 3.335 | 5.002 | 5.002 | 6.002 | 13.002 | 5.002 | 6.02 | 5.969 |
| Fine grinding teeth | 8.001 | 2.001 | 8.001 | 2.001 | 2.668 | 13.502 | 6.002 | 5.02 | 5.508 |
| Weight | 0.06 | 0.08 | 0.12 | 0.2 | 0.16 | 0.12 | 0.16 | 0.1 | |
| Overall assessment value: 5.971 | |||||||||
3.3. Modification and Improvement of the Case Process Routes
| Project Name | General Score | Similarity Value | EBM Overall Merit |
|---|---|---|---|
| YKA4232A-51308 | 2.573 | 0.88 | 6.522 |
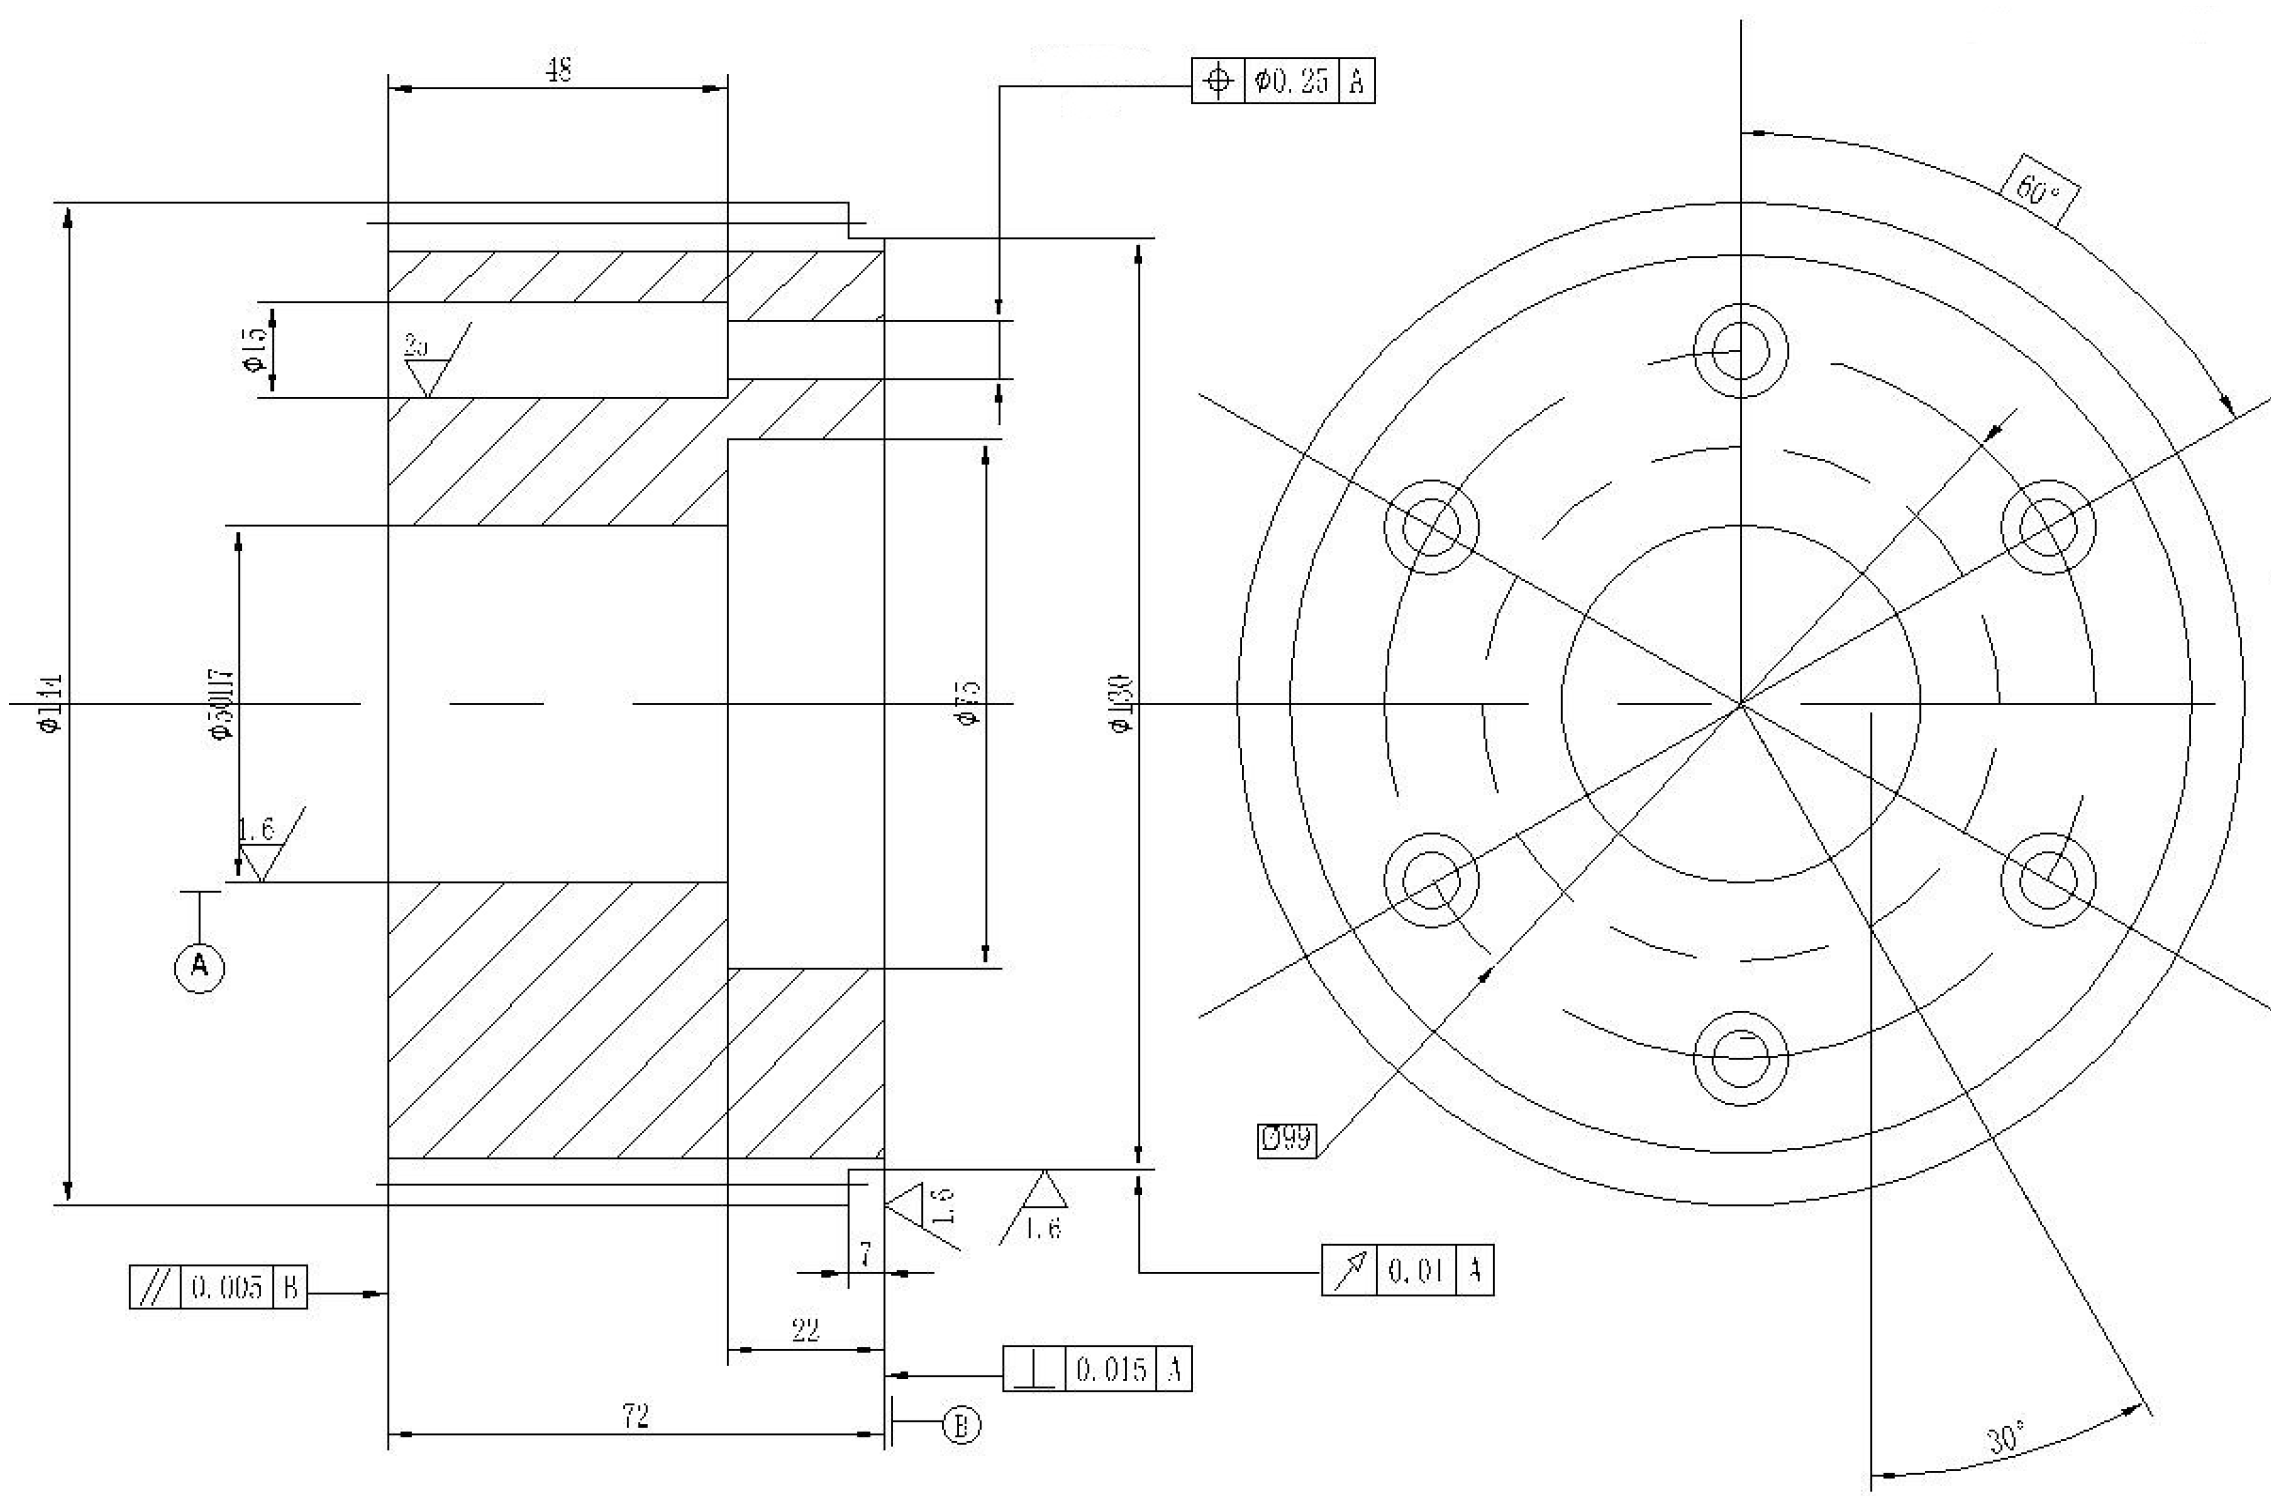
| Scheme | Materials | Module | Tech Number | External Diameter | Gear Cutting Breadth | Helix Angle |
|---|---|---|---|---|---|---|
| Yka4332A-051308 | 45# Steel | 2 | 65 | 142.34 | 70 | 20 |
| Gear Cutting Machine | Gear Tools | |||||
|---|---|---|---|---|---|---|
| YkA4332A | Materials | Module | Head number | Rotation direction | Ordinance | Accuracy grade |
| Fine grinding | Coat HSS | 2 | 1 | Dextrorotation | ¢32*¢70*110 | AA |
| Cutting mode | Cutting speed m/min | Hobbing-rotational speed r/min | Amount feed for axial mm/r | Pickup depth mm | Division change gear | Differential change gear |
|---|---|---|---|---|---|---|
| Up milling | 45 | 200 | 1 | 4.35 | 70*65/60*65 | 62*70/65*72 |

4. Concluding Remarks
Acknowledgments
References
- Gutowski, T.; Murphy, C.; Allen, D.; Bauer, D.; Bras, B.; Piwonka, T.; Sheng, P.; Sutherland, J.; Thurston, D.; Wolff, E. Environmentally benign manufacturing: Observations from Japan, Europe and the United States. J. Clean. Prod. 2005, 1, 1–17. [Google Scholar] [CrossRef]
- Bras, B.; Isaacs, J.A.; Overcash, M. Environmentally benign manufacturing—A workshop report. J. Clean. Prod. 2006, 5, 527–535. [Google Scholar] [CrossRef]
- Emblemsvåg, J.; Bras, B. ISO14000 and Activity-Based Life Cycle Assessment in Environmentally Conscious Design and Manufacturing: A Comparison. In Proceedings of the 1998 ASME Design Engineering Technical Conference, Atlanta, GA, USA, 13–16 September 1998.
- Klein, M.R. SIMAR: A software environment to define and test strategic management knowledge bases. Decis. Support Syst. 1999, 2, 151–177. [Google Scholar] [CrossRef]
- Feelders, A.J.; Daniels, H.A.M. A general model for automated business diagnosis. Eur. J. Oper. Res. 2001, 3, 623–637. [Google Scholar] [CrossRef]
- Sheng, P.; Srinivasan, M.; Chryssolouris, G. Hierarchical part planning strategy for environmentally conscious machining. CIRP Ann. Manuf. Technol. 1996, 1, 455–460. [Google Scholar] [CrossRef]
- Kheawhom, S.; Hirao, M. Decision support tools for environmentally benign process design under uncertainty. Comput. Chem. Eng. 2004, 9, 1715–1723. [Google Scholar] [CrossRef]
- Kuo, T.C.; Chang, S.H.; Huang, S.H. Environmentally conscious design by using fuzzy multi-attribute decision-making. Int. J. Adv. Manuf. Technol. 2006, 5, 419–425. [Google Scholar] [CrossRef]
- Gutowski, T.G.; Branham, M.S.; Dahmus, J.B.; Jones, A.J.; Thiriez, A.; Sekulic, D.P. Thermodynamic analysis of resources used in manufacturing processes. Environ. Sci. Technol. 2009, 5, 1584–1590. [Google Scholar] [CrossRef]
- Diwekar, U.M.; Shastri, Y.N. Green process design, green energy, and sustainability: A systems analysis perspective. Comput. Chem. Eng. 2010, 9, 1348–1355. [Google Scholar] [CrossRef]
- Xue, H.; Kumar, V.; Sutherland, J.W. Material flows and environmental impacts of manufacturing systems via aggregated input-output models. J. Clean. Prod. 2007, 13–14, 1349–1358. [Google Scholar] [CrossRef]
- Jiang, Z.-G.; Zhang, H.; Xiao, M. Analysis model of resource consumption and environmental impact for manufacturing process. Syst. Eng. Theory Pract. 2008, 7, 132–137. [Google Scholar] [CrossRef]
- Rusinko, C.A. Green manufacturing: An evaluation of environmentally sustainable manufacturing practices and their impact on competitive outcomes. IEEE Trans. Eng. Manag. 2007, 3, 445–454. [Google Scholar] [CrossRef]
- Jayal, A.D.; Badurdeen, F.; Dillon, O.W., Jr.; Jawahir, I.S. Sustainable manufacturing: Modeling and optimization challenges at the product, process and system levels. CIRP J. Manuf. Sci. Technol. 2010, 3, 144–152. [Google Scholar] [CrossRef]
- Tan, X.C.; Liu, F.; Cao, H.J.; Zhang, H. A decision-making framework model of cutting fluid selection for green manufacturing and a case study. J. Mater. Process. Technol. 2002, 1–3, 467–470. [Google Scholar] [CrossRef]
- National Standard. Machining Process Design Handbook; Mechanical Industrial Press: Beijing, China, 2007; Volume 1, pp. 205–296. [Google Scholar]
© 2011 by the authors; licensee MDPI, Basel, Switzerland. This article is an open access article distributed under the terms and conditions of the Creative Commons Attribution license (http://creativecommons.org/licenses/by/3.0/).
Share and Cite
Tan, X.-C.; Wang, Y.-Y.; Gu, B.-H.; Mu, Z.-K.; Yang, C. Improved Methods for Production Manufacturing Processes in Environmentally Benign Manufacturing. Energies 2011, 4, 1391-1409. https://doi.org/10.3390/en4091391
Tan X-C, Wang Y-Y, Gu B-H, Mu Z-K, Yang C. Improved Methods for Production Manufacturing Processes in Environmentally Benign Manufacturing. Energies. 2011; 4(9):1391-1409. https://doi.org/10.3390/en4091391
Chicago/Turabian StyleTan, Xian-Chun, Yan-Yan Wang, Bai-He Gu, Ze-Kun Mu, and Can Yang. 2011. "Improved Methods for Production Manufacturing Processes in Environmentally Benign Manufacturing" Energies 4, no. 9: 1391-1409. https://doi.org/10.3390/en4091391