Article

Emergy-Based Adjustment of the Agricultural Structure in a Low-Carbon Economy in Manas County of China

1
State Key Laboratory of Earth Surface Processes and Resource Ecology, Beijing Normal University, Beijing 100875, China
2
College of Resources Science & Technology, Beijing Normal University, Beijing 100875, China
3
The Agrometeorological Center of Sichuan Province, Chengdu 610072, China
4
Academy of Disaster Reduction and Emergency Management Ministry of Civil Affairs and Ministry of Education, Beijing Normal University, Beijing 100875, China
5
Department of Sciences for the Environment, Parthenope University of Naples, Naples 80133, Italy
*
Author to whom correspondence should be addressed.
Energies 2011, 4(9), 1428-1442; https://doi.org/10.3390/en4091428
Submission received: 11 July 2011 / Revised: 16 September 2011 / Accepted: 16 September 2011 / Published: 21 September 2011
(This article belongs to the Special Issue Low Carbon Transitions Worldwide)

Abstract

:
The emergy concept, integrated with a multi-objective linear programming method, was used to model the agricultural structure of Xinjiang Uygur Autonomous Region under the consideration of the need to develop a low-carbon economy. The emergy indices before and after the structural optimization were evaluated. In the reconstructed model, the proportions of agriculture, forestry and artificial grassland should be adjusted from 19:2:1 to 5.2:1:2.5; the Emergy Yield Ratio (1.48) was higher than the average local (0.49) and national levels (0.27); and the Emergy Investment Ratio (11.1) was higher than the current structure (4.93) and that obtained from the 2003 data (0.055) in Xinjiang Uygur Autonomous Region, the Water Emergy Cost (0.055) should be reduced compared to that before the adjustment (0.088). The measurement of all the parameters validated the positive impact of the modeled agricultural structure. The self-sufficiency ratio of the system increased from the original level of 0.106 to 0.432, which indicated a better coupling effect among the subsystems within the whole system. The comparative advantage index between the two systems before and after optimization was approximately 2:1. When the mountain ecosystem service value was considered, excessive animal husbandry led to a 1.41 × 10¹⁰ RMB·a−1 indirect economic loss, which was 4.15 times the GDP during the same time period. The functional improvement of the modeled structure supports the plan to “construct a central oasis and protect the surrounding mountains and deserts” to develop a sustainable agricultural system. Conserved natural grassland can make a large contribution to the carbon storage; and therefore, it is wise alternative that promote a low-carbon economic development strategy.

1. Introduction

Energy modeling research for analyzing alternative energy systems and future scenarios in anticipation of the LCS (Low Carbon Society) has grown considerably in the past two decades [1]. Under the promotion of the Obama government, the U.S. has developed renewable energy and reduced fossil fuels as a proportion of the national energy use to promote the development of a domestic low-carbon economy [2]. Ma and Li gave suggestions on how to promote sustainable food safety, such as the development of water-saving agriculture and the reduction of energy consumption in agriculture, which were set against the background of low carbon economy in Hennan of China [3]. Parthan et al. summarized the low-carbon energy policy and development community about REEEP (Renewable Energy and Energy Efficiency Partership) and the lessons learned from its five year implementation [4]. The relationship between economic structure and productivity growth has received much attention in recent decades [5]. Evans [6] reappraised the farm adjustment strategy in terms of its ability to illuminate contemporary agricultural changes. Handa [7] reviewed Jamaican structural adjustment policies that considered inequality and poverty. Using the agent-based spatial and dynamic simulation model AgriPoliS, Happe [8] investigated the relationship between structural change in agriculture and policy regime switch at the regional level by simulating the changes that occurred in two different farm structures in response to the policy change. The impacts of agricultural land use are far-reaching and affect areas outside of production. These impacts lead us to examine the interactions between socio-economic and environmental systems and land use problems. China depends on an agricultural system that has evolved over thousands of years and that intensively exploits environmental resources [9]. The Chinese government has been involved with structural agricultural adjustment for over 30 years and has implemented many policies promoting sustainable agricultural development. Xinjiang Uygur Autonomous Region (XUAR) is an important area in China undergoing agricultural structural adjustment and it is now implementing a low-carbon development strategy. This paper tries to use multi-objective linear programming combined with the synthetic emergy method to obtain higher resource use efficiency to help solve complex socio-economic, environmental systems and land use problems through low-carbon economic development.
XUAR is very important area which covers about 17% of the total national area and supplies over 40% of China’s total cotton production and also is a key farming, forestry and pastoral area. Since the 1990s, cotton production in XUAR has become strategically important. However, the pursuit of profits has forced 80% of the cotton fields to grow the same crop for many consecutive years [10], and serious problems with declining fertility, increasing diseases and pests, and poor cotton quality have resulted. Meanwhile, free-grazing animal husbandry methods have caused significant destruction of the mountainous pasture resources. The number of animals far exceeds the carrying capacity of the grassland. Constant overgrazing has led to degradation of the grassland and worsening of water conservation practices. Many rivers and streams are gradually diminishing, and overgrazing in mountainous areas has become an ecological challenge. Consequently, revolutionary changes are urgently required in which animal husbandry transitions from traditional to modern industrial production that is supported by cultivated grasslands. Cotton agriculture should also be adjusted into a more sophisticated infrastructure in which animal husbandry plays an important role while still maintaining cotton and grain production, thereby improving energy use efficiency. In addition natural grassland conservation can effectively reduce the CO2 emission caused by overgrazing which is an important step toward low-carbon development.

2. Materials and Methods

2.1. General Information about the Investigated Area

Manas county sits in the center of XUAR and it is known as the “Western Gate” of Urumqi. It is located between the middle range of the northern Tianshan Mountains and the southern border of the Zhungaer Basin [11,12]. The climate is a temperate continental dry and semi-dry climate, with annual radiation of 128 kcal cm−2. The annual precipitation is 190.3 mm, and the annual evaporation is 1713.4 mm. On average, there are 172 frost-free days, and annual average air temperature is 6.9 °C. The aspect of this region slopes downwards from the south toward the north and tilts from the southeast to the northwest. The geomorphologic sectors include mountains, flat plains, and deserts. The 1.176 × 10⁹ m2 central alluvial plain is the major agricultural crop growing area [11,12].

2.2. Current State of Water and Land Utilization in Manas County

According to the data provided by Manas county water utility management office, the amount of water used for agriculture in 2005 was 5.83 × 10⁸ m3 or 92.69% of the total water consumption in that year. Industry used 3.59 × 10⁷ m3 or 5.71% of the water consumed, and domestic water utilization was 1.05 × 10⁷ m3, accounting for 1.67% of the total consumption [11,12].
In 2005, Manas county had 9.597 × 10⁹ m2 of land. The structure of land utilization was as follows: agricultural land 6.193 × 10⁹ m2, accounting for 64.5% of the total land area. Of the agricultural land, 1.37 × 10⁸ m2 was used to grow cash and grain crops and 605% to grow cotton. Forests that sheltered agricultural land occupied 1.6 × 10⁷ m2, accounting for 36% of forested land. Artificial grassland covered 7.4 × 10⁶ m2, which only accounted for 0.18% of the total pasture coverage. The ratio of land utilization was 19:2:1 for oasis agriculture (Table 1). The area of fertile land is referred as an “oasis” and it is often created by cultivation growing crops with irrigation. Oases are mainly distributed in temperate and warm temperate desert areas in China [13], where they provide shelter forestry, and artificial grassland, respectively.
Table 1. Land use of Manas county in 2005.
ItemLand Area (m2)
Agriculture land6.193 × 109
Cash crop and food crop1.37 × 108
Cotton3.72 × 109
Forest land
Grassland
4.44 × 10⁷
4.44 × 10⁹

2.3. Sources of Data

Data were obtained from a variety of sources, including a land survey by the Land Ministry of XUAR, the 2006 Manas County Encyclopedia, the records of the XUAR Agricultural, Animal Production, and Meteorology Stations, the XUAR Construction League, and the Manas County Water, Land, Agriculture, Animal Production, Forestry, Grassland Management, and River and Water Resources Management Offices. Some additional information was provided by experts or collected from field investigations and measurements.

2.4. Methodology

Emergy was first proposed by the well-known ecologist H. T. Odum in the late 1980s [14]. Odum defined emergy as the available energy of one kind used directly or indirectly to generate a service or product [15]. Analysis of energy values makes it possible to quantify the contributors that maintain an ecosystem. This concept is superior to other contemporary methods, which lack sufficient consideration of the ecosystem in terms of its impact on human activities. The theories and methods of Emergy have been widely applied to different systems to better understand the issues that are related to resource management and to evaluate alternative solutions in regards to policy questions [16,17,18,19]. Emergy analysis has been used to analyze different agricultural systems to compare and contrast resource use, productivity, environmental impact and sustainability in different countries [20,21,22,23,24,25]. Currently, there are few studies that have applied an emergy evaluation to agricultural structure adjustment with other mathematical methods. All the transformities used in this paper were considered in relation to the annual global budget of 15.83 × 1024 seJ/year. Figure 1 shows the Energy system diagram of the agricultural system in Manas county.
Multi-objective linear programming is based on the efficacy coefficient method. It uses the principles of fuzzy mathematics to process the target variables used to determine the membership functions in a multi-objective linear system [26]. In this paper, the qualitative phenomenon of land utilization styles and water resource utilization states were first converted into quantitative “transformed” data for use in a multi-objective linear programming model. The integrated model was used to evaluate the structure of agroforestry and pastures to determine the proportions of agriculture, forestry, and grassland that would yield the highest ecological and economical efficiencies. This model attempted to provide the theoretical basis for structural adjustment in the production and marketing systems of the mountain, oasis and desert areas through ecological and economical functional transition. Combination of emergy analysis and multi-objective linear programming could be good alternative to solving complex design problems, e.g., sometimes we have to consider quantity and quality of the production, but usually the objectives seem to contradict each other, which makes it hard to make a decision. By using the emergy method and multi-objective linear programming, all concerns about quantity and quality could be better understood. Wang evaluated the water resource utilization in land-use model of Lee County of Florida by using emergy analysis coupled with linear programming techniques [27].
Figure 1. Energy system diagram of the agricultural system in Manas county.
Energies 04 01428 g001

3. Results and Discussion

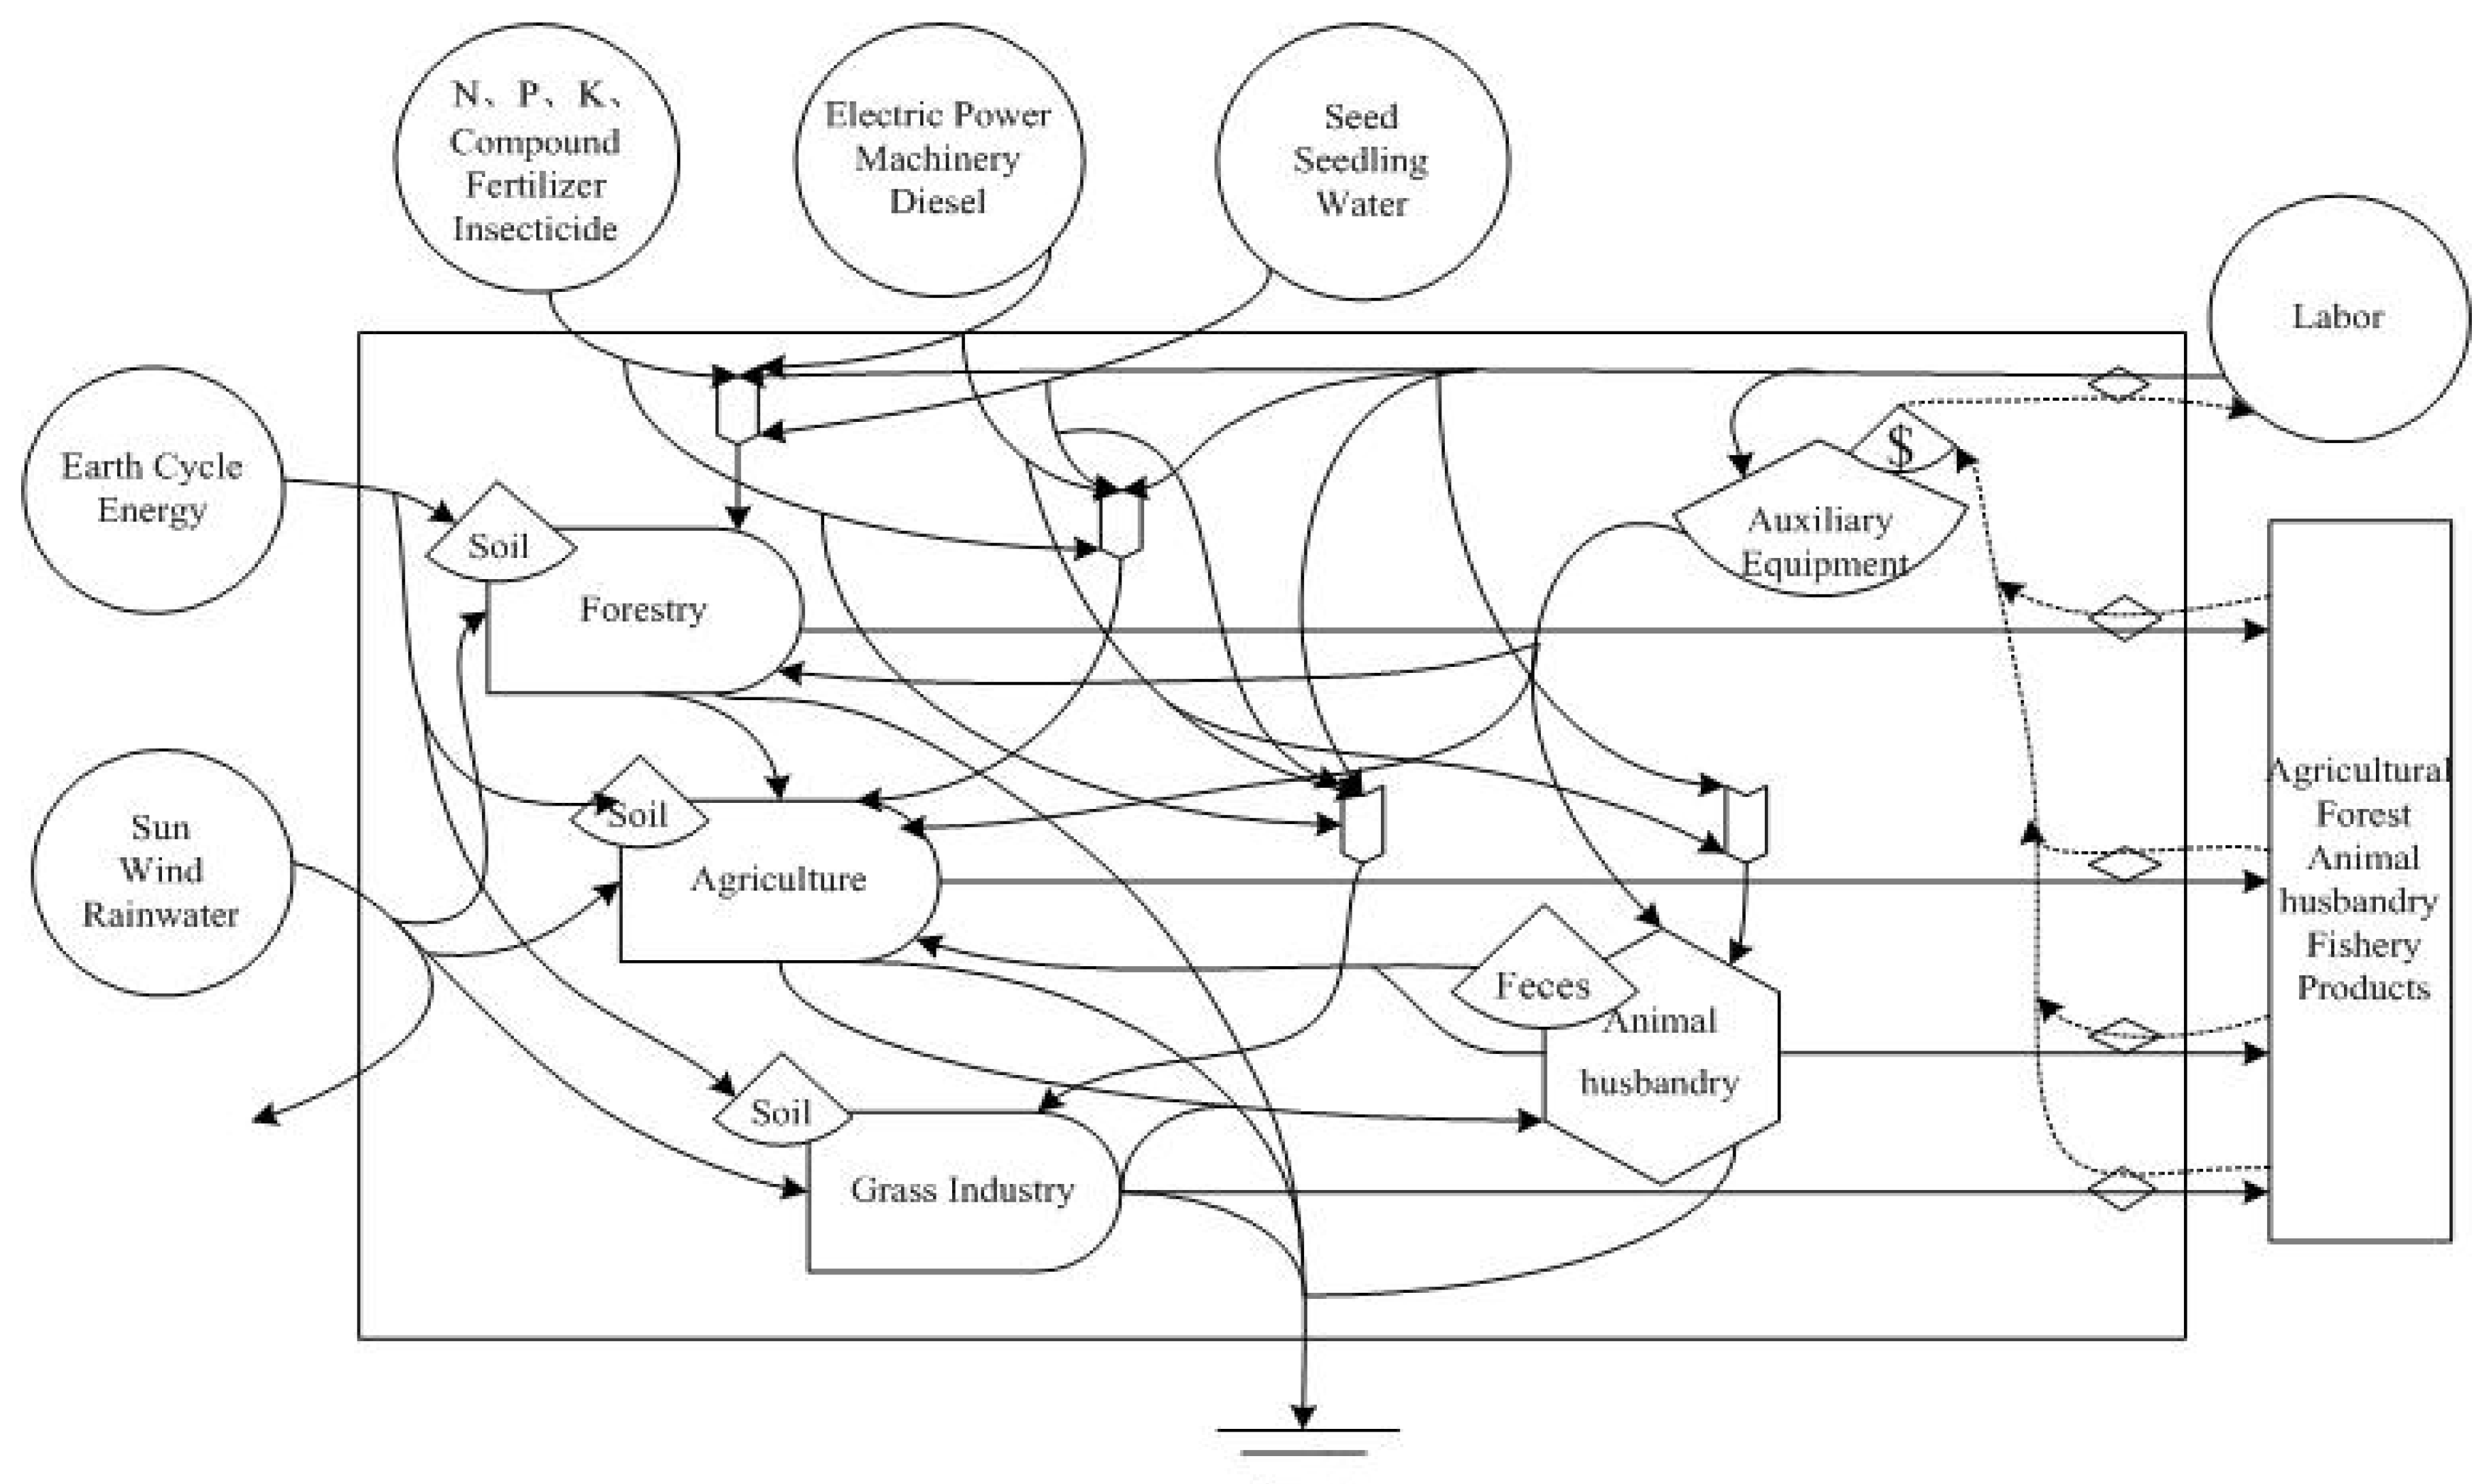
3.1. Construction of an Optimization Model of Ecological and Economical Systems of Agroforestry and Grassland

The goal of structural optimization was to develop an agricultural production management model, which would efficiently utilize water and land resources and promote conservation of the ecosystem. The new, sustainable agribusiness should be structured to have appropriate economical factors, a highly trained labor force, a sophisticated technical support platform, and a multiple orientated service network. By constructing an optimization model, the paper presents scenario of land use under the agriculture construction adjustment with consideration of economic and environmental issues.

3.2. Mathematical Modeling

3.2.1. The Standard Equation of the Mathematical Model

A multi-objective linear programming method and MFPS (multi-function programming support) software were used to analyze the structure of the agroforestry and grassland production systems. The basic principles, systematic decision variables, model constraint equations and parameters for modeling the optimum agronomy-forestry-grassland structure were determined according to components of the contemporary structure and integrated with data from the currently active production system. The mathematical models were the same as those previously described with minor modification [26,28]:
The constraint equation was j = 1 n a i j x j > b i (b ≥ 0, i = 1,2,…,m); x ≥ 0 (j = 1,2,…,n). The objective function was f ( x ) = j = 1 n c j x j = max  (or min) answer for the ( x j ) group, where:
  • x j was the decision variable (or variable);
  • a i j was the coefficient of the decision variables (or technical coefficient) under the constraint condition;
  • b i was the resources threshold or production threshold for item (the constrain for the items on the right side of the equation);
  • c j was the total productivity coefficient of the variable or net productivity coefficient (or profit coefficient) of the objective function; and
  • f was the decision objective.
The decision objective of the variables was to achieve the highest economical efficiency under the optimum ecological conditions.

3.2.2. Determination of the Decision Variables

The decision variables were determined according to land use. Agricultural land was used for wheat, corn, rice, cotton, oil seeds, sugar beet, tomato, and grapes; the forestry land for shelter trees; and the grassland for feeding animals (Table 1). The emergy produced per unit land area and the emergy investment were used as the objective function to calculate the ratio among the respective areas for the three types of land utilization.
Table 1. Decision variable and variable coefficient.
VariablesItemsIrrigation WaterUnit YieldInternal Circulation Energy FlowPurchased Renewable EnergyPurchased Nonrenewable Energy
X1Wheat5.60 × 10146.12 × 10151.62 × 10161.89 × 10168.87 × 1015
X2Corn4.07 × 10159.36 × 10151.53 × 10162.15 × 10161.01 × 1016
X3Rice1.42 × 10151.65 × 10151.56 × 10161.91 × 10166.24 × 1015
X4Cotton3.56 × 10152.75 × 10167.10 × 10146.38 × 10158.55 × 1015
X5Oil crop7.62 × 10145.15 × 10161.46 × 10161.74 × 10162.00 × 1015
X6Beet8.13 × 10141.05 × 10172.19 × 10162.45 × 10161.64 × 1016
X7Tomato3.56 × 10157.91 × 10167.10 × 10146.29 × 10151.18 × 1016
X8Grape5.60 × 10141.80 × 10161.53 × 10161.79 × 10161.08 × 1016
X9Poplar8.91 × 10141.28 × 10163.14 × 10106.84 × 10157.71 × 1015
X10Grass1.21 × 10142.43 × 10152.43 × 10153.62 × 10152.76 × 1013
Note: The units are solar emjoules per hectare (sej/hm2) of the crop.

3.2.3. Characterization of Different Objective Functions

The structure of agroforestry and grasslands is very complex; model optimization requires synergy among ecological, economical and social factors, as well as the best coupling effects within the system. The model placed water resources as the first priority, while also ensuring the best-synchronized interaction among the subsystems. The water emergy cost (WEC) stands for the amount of emergy used in the water consumption. It is calculated using the equation WEC = the total value of water emergy consumption/the emergy output and is a measure of the utilization effectiveness of water resources—the lower the better. The systematic self-sustainability ratio (SSR) is a measurement of the coupling effect within the system and is calculated as SSR = the emergy value that flows within the system/the renewable emergy purchased for the whole system. The optimum value for the best effect is one. The net emergy yield ratio (EYR) is the objective function. To ensure high economic efficiency, the amount of irrigation water was projected according to the total area of artificial grassland that would be required to produce enough feedstock for the animals. The protection of water resources and land was enforced to conserve the ecosystem. For the social effect, constraints were placed on the amount of grain that would be availabe per capita.
The model was constructed on the principles of minimal water energy cost ([f1(x)/f2(x)]), maximal self-sustainability ratio [f3(x)/f4(x)], and maximal net emergy output ratio [f2(x)/f5(x)] for the whole system. The objective functions were defined as follows:
f1(x)
= min = total water consumption energy abundance
= 5.60 × 1014 X1 + 4.07 × 1015 X2 + 1.42 × 1015 X3 + 3.56 × 1015 X4 + 7.62 × 1014 X5 + 8.13 × 1014 X6 + 3.56 × 1015 X7 + 5.60 × 1014 X8 + 8.91 × 1014 X9 + 1.21 × 1014 X10
f2(x)
= max = total output
= 6.12 × 1015 X1 + 9.36 × 1015 X2 + 1.65 × 1015 X3 + 2.75 × 1016 X4 + 5.15 × 1016 X5 + 1.05 × 1017 X6 + 7.91 × 1016 X7 + 1.80 × 1016 X8 + 1.28 × 1016 X9 + (2.43 × 10¹⁵ + 4.70 × 106) X10
f3(x)
= max = flow of energy within the whole system = domestic animals + animal feces + deciduous leaves + crop residues f1(x) = min + grass feedstock
= 1.62 × 1016 X1 + 1.53 × 1016 X2 + 1.56 × 1016 X3 + 7.10 × 1014 X4 + 1.46 × 1016 X5 + 2.19 × 1016 X6 + 7.10 × 1014 X7 + 1.53 × 1016 X8 + 3.14 × 1010 X9 + 2.43 × 1015 X10
f4(x)
= min = the renewable energy purchased for the whole system
= 1.89 × 1016 X1 + 2.15 × 1016 X2 + 1.91 × 1016 X3 + 6.38 × 1015 X4 + 1.74 × 1016 X5 + 2.45 × 1016 X6 + 6.29 × 1015 X7 + 1.79 × 1016 X8 + 6.84 × 1015 X9 + (3.62 × 10¹⁵ + 1.55 × 1016) X10
f5(x)
= min = the non-renewable energy purchased for the whole system
= 2.78 × 1016 X1 + 3.15 × 1016 X2 + 2.52 × 1016 X3 + 1.49 × 1016 X4 + 1.94 × 1016 X5 + 4.11 × 1016 X6 + 1.82 × 1016 X7 + 2.87 × 1016 X8 + 1.46 × 1016 X9 + (2.24 × 10¹⁶ + 3.65 × 1015) X10

3.2.4. Analysis of Constraints

(1)
Grain yields and the constraints on the growth area of agricultural and cash crops
In 2005, the total population in Manas county was 169,716. Using the standard of annual grain consumption of 350 kg per capita, to achieve grain self-sufficiency, the county needs to produce a minimum of 5.94 × 10⁷ kg annually. To meet the demand of existing markets, cotton yield should stabilize at the current level, and grape and tomato growth area should be maintained maintain at least 2212 hm2 and 3333 hm2, respectively.
(2)
Constraints of water and land resources
In 2005, water induction reached 30–40%, which was above the internally accepted threshold for water resource utilization [29]. The result was the exhaustion of water resources outside of the oasis and lower water levels in downstream areas. The ecological water was nearly exclusively used for irrigation. This type of water utilization situation is not healthy; half (50%) of the water resources should be saved for ecological purposes. Because the oasis has expanded to its maximum limits, the reclamation process should be stopped. Ecological conservation and construction practices should be used to determine the limits of expansion for the oasis in the future.
(3)
Constraints of artificial grassland growth
In 2005, the county had 2972 hm2 of artificial grassland that grew perennial purple-flower alfalfa. With three harvests annually, the crop yielded 10,500 kg/hm2 dried feed. Given that each sheep unit lives on 730 kg/year, the artificial grassland could support 42,748 heads of standard sheep unit [30]. The People’s Republic agriculture industry standard (NY/T 635–2002) defines the standard sheep unit as a 50 kg adult ewe who is feeding a lamb less than six months old and consumes 1.8 kg standard hay per day, or other equivalent livestock. However, the actual existing heads of standard sheep unit in 2005 was 334,668. The straw, agricultural byproducts and produce from the artificial grassland totaled 7.21 × 10⁴ t, which was not enough to feed all the animals. To stabilize meat production, the county should take the following actions: introduce high production meat breeds that can produce three times as much meat as the current breed and expand the artificial grassland area to 7756 hm2. The operational mechanism of the restructured model is to achieve higher meat yields of better quality through breed improvement and the establishment of artificial grassland. The optimum production chain should eventually be led by confined animal husbandry and incorporate meat sheep processing and marketing sectors.

3.3. The Structural Optimization and Adjustment of the Agroforestry and Grassland System in Manas County

3.3.1. Optimization Scenario for the Agroecosystem in Manas County

The optimal value for each item in the model above was calculated in the MFPS program as follows: water emergy cost [f1(x)/f2(x)] = total water consumption cost/total emergy output value = 0.055;
Self-sustainability ratio [f3(x)/f4(x)] = the amount of emergy circulated within system/total purchased renewable resources = 0.432;
Net emergy output ratio [f2(x)/f5(x)] = emergy output value/ total system purchased renewable and nonrenewable resources = 1.48.
Table 2 showed that the structure adjustment ratio coefficient (agriculture:forest:grassland) of the optimization scenario of the agroecosystem was 5.2:1:2.5 compared to the previous coefficient of 19:2:1.
Table 2. Optimization scenario for the agroecosystem in Manas county.
VariablesX1X2X3X4X5X6X7X8X9
ItemOWheatMaizeCottonOil cropSugar BeetTomatoGrapeForestGrassland
Optimal value401857518,19721940112212739654716,663

3.3.2. Comparison of the Emergy Parameters between Systems before and after Structural Optimization

To test the rationality of restructuring, all the parameters in the model were compared between the systems before and after the optimization.

3.3.3. Emergy Yield Ratio

The Emergy Yield Ratio (EYR) is the ratio of the output emergy to the invested emergy, which includes the purchased emergy and feedback emergy during the economic process [15]. This ratio tests whether the system is competitive in providing basic emergy for the economic activities during the process [31]. After structural adjustment, the EYR was 1.48, higher than the original level (0.49). This improvement indicates the enhancement of emergy utilization efficiency after the structural change, which is mainly attributed to higher environmental emergy use. Consequently, the optimized system is more competitive than the original one.

3.3.4. Emergy Loading Ratio

The Emergy Loading Ratio (ELR) is the ratio between the purchased emergy and emergy from the self-generated non-renewable resources plus the free environmental energy value. Odum [15] proposed that it resembles the electricity load on an electronic circuit. A higher ELR indicates a higher intensity of emergy utilization of the economic system while also putting higher pressure on the environmental system. A high ELR is a warning signal to the economic system that it will enter an irreversible functional degradation or experience diminishing returns if the high ELR conditions continue. From the viewpoint of emergy, the importation of large amounts of emergy from outside as well as excessive exploration and utilization of local non-renewable resources are the main reasons that cause environmental degradation [32]. In the XUAR model after optimization (Table 3), there was a much higher ELR.
Table 3. Comparison between the systems before and after structural optimization.
Parameters NotesBefore and after optimization
Emergy yield ratio (EYR)Y/NP + RP0.491.48
Environment loading ratio (ELR)(NP + RP + NR)/RR4.9611.4
Emergy investment ratio(EIR)(NP + RP)/(NR + RR)4.9311.1
Water emergy cost (WEC)Total water consumption/Y0.0880.055
System self sustainability ratio (SSR)(If−h + Ih−a + Ia−h + Ig−h)/(RPa + RPf + RPh + RPg)0.1060.432
This occurred because the mountains and deserts were closed and protected, and the local mountain economy transitioned from logging and grazing activities to a system consisting of artificial forests in the oasis, artificial pastures and grassland agriculture. The eventual improvement in the ecological services gained from the closing and protection of the mountains and deserts was tremendous.

3.3.5. Emergy Investment Ratio

The Emergy Investment Ratio (EIR) is the ratio between the emergy invested (or feedback) from the economic system and the emergy flowing into the production process from natural environmental resources [15]. This index represents the degree of utilization of environmental resources by the system and measures the economic development and environmental load. A higher ratio indicates that the system has a higher degree of economic development, while a lower value suggests less economic development and a stronger reliance on the environment. The EIR is normally higher in developed regions than in underdeveloped places where more unexplored resources attract investors [33]. Table 3 shows that the EIR was higher in the optimized system (11.1) than in either the original one (4.93) or the 2003 figure (0.055). This analysis suggests that after structural change, the investment of large amounts of feedback emergy and application of the mechanical growing model would have significantly increased the utilization efficiency of the resources.

3.3.6. Water Emergy Cost

The optimized system should utilize drip irrigation mulched with plastic film, high-pressure percolation irrigation and other water-saving practices. Farmland leveling and alteration of the irrigated area, selecting, breeding, and introducing drought tolerant grass species, and reducing the growth of water-consuming crops should also be implemented. All these measures together would produce lower water consumption emergy per unit output and better efficiency in utilizing the water resources. Without doubt, lower water consumption can be considered an indirectly approach to achieving the low-carbon economy alternative.

3.3.7. System Self-sustainability Ratio

The System Self-sustainability Ratio (SSR) was proposed as an emergy index for evaluating the sustainable development of simple systems. The SSR is calculated using the following equation: SSR   =   I f a + I h a + I a h + I g h R P a + R P f + R P h + R P g . It can also be used to estimate the coupling effect among subsystems in a complex system. When the recycling ratio of renewable emergy is higher, the utilization efficiency improves, which leads to improved coupling among the internal structural components and forms a more efficient circulation system. In the above equation, If−a is the material emergy contributed from forestry to agriculture, such as falling leaves; Ih−a is the material emergy contributed from animal husbandry to agriculture, such as feces, and animal power.; Ia−h is the material emergy contributed to animal husbandry from agriculture, such as plant residue; and Ig–h is the material emergy contributed to animal husbandry from grass industry, such as the feed. The RP represents renewable emergy input such as seeds, animal power, feces, labor, and plant residues, which are purchased for the four subsystems: agronomy, forestry, animal husbandry and grasslands. Table 3 shows that the RP value of the optimized system is 0.432, which is higher than the original (0.106). Therefore, the systematic coupling was optimized after the reconstruction. The improvement of energy use efficiency is one of the main objectives in low-carbon economy. The coupling system of after structure adjustment can be benefit to that in sustainable development practice.

3.3.8. Structural Comparative Advantage Index

This paper attempts to identify the strong and weak points of systems before and after optimization using the comparative advantage index (CAI) of agricultural structure, which is expressed in the following equation: CAI =  E Y R b E Y R a × E L R b E L R a × W E C b W E C a . This parameter was proposed based on the ESI (The ratio of the Emergy Yield Ratio to the Environmental Loading Ratio. It measures the contribution of a resource or process to the economy per unit of environmental loading.). Taking the drought and semi-drought conditions of XUAR into full consideration, water resources are critically important. The inclusion of water energy costs can reflect the utilization efficiency of water resources. The ratio of CAI was calculated to be 2:1, which is larger than its original value. This indicates that both the ecological and economical efficiencies were significantly improved in the optimized system.

3.4. Estimation of the Depreciation in Ecosystem Service Value of Grazing Mountainous Land in Manas County, XUAR

The nutrients in ecosystems circulate in the soil, air and organisms that form the ecosystem. Soil nutrients support all terrestrial activities. The average bulk density of the top 20 cm of soil and the average content of soil organic matter and total nitrogen in mountain and desert pastures were used to determine the amount of nutrients required to maintain the ecosystem. Table 4 compares how pasture and desert zones provide soil nutrients. The value of this ecosystem service would be significantly raised by eliminating animal grazing The pastures contained organic matter at 3.89 × 10⁷ t·a−1 and total nitrogen at 2.102 × 10⁶ t·a−1, while the desert pastures contained organic matter at 3.32 × 10⁷ t·a−1 and total nitrogen content at 1.94 × 10⁶ t·a−1. When multiplied by the average fertilizer price of 2549 yuan/t (1990 price) [34], the annual added value of the nutrient circulation from pasture zone would be 1.38 × 10¹⁰ yuan·a−1 higher than the desert pasture zone.
Table 4. The value of ecosystems that maintain nutrient circulation.
Total Area (hm2)Organic Matter Content (t·a−1)Nitrogen Content (t·a−1)Value (Yuan·a−1)
Grassland belt4.102 × 1053.89 × 1072.102 × 1061.05 × 1011
Desert grassland belt 3.32 × 1071.94 × 1069.12 × 1010
Good planting coverage can conserve moisture. Manas county is a typical semi-drought region; the annual precipitation is only 190.3 mm, and water shortages are one constraint on the services of the local ecosystem. The value of water conservation can be obtained using soil water potential to calculate the average water potential in the top 2 m of soil [34]. Multiplying by the area, the total amount of water held in the soil can be estimated. The water in the reservoir costs 0.67 yuan/t water (1990 price) [35]. Using a shadow engineering method, the resultant water loss value in the desert was estimated to be 3.13 × 10⁸ yuan·a−1, calculated by subtracting the equivalent value of soil water potential in the desert grassland from that of grassland fields.
Using the above approach, indirect economic losses caused by overgrazing were estimated to be approximately 1.41 × 10¹⁰ yuan·a−1, which is 4.15 times the contemporary total gross domestic product (GDP) of the county. After adding other factors such biodiversity and climate buffering capacity, the loss could be even bigger. Overgrazing has led to the gradual weakening of the ecological service function of the mountain forests. However, such impacts are not reflected in market values and are therefore easily neglected. It is hard to raise public awareness about the damage and loss from overgrazing by domestic animals.
The agroforestry ecosystem has been severely damaged north of the Tianshan mountains from overgrazing. It is imperative to change the current situation of animal production industry in this region. The focus should be placed on establishing artificial grasslands to replace the natural grassland for producing animal feed [36]. It is equally important to promote confined animal operation and transition from traditional into pasture animal operation styles and from growing almost exclusively cotton to a comprehensive system comprising animal husbandry, grasslands, and grain, as well as cotton production. The goat meat production in XUAR is the highest in the nation, but its goat meat has not yet been exported to other countries. Instead, China imports large amounts of sheep meat. Opening XUAR to the international fresh meat market is another reason for promoting sheep production in this area.
Presently, there is a national program called “the Sloping Land Conversion Program”, which is primarily implemented in XUAR. This movement is expected to help conserve the ecological systems in the mountains to complement and restore forestry and pasture and to achieve sustainable development of the ecosystem. The model also supports the proposal of “Promoting the center oasis and protecting the mountains and deserts in the surrounding areas”. The goal is to build an ecologically friendly oasis in the middle of the basin and to nurture the mountains and deserts along both sides to provide enough time for the mountain forests and pastures to restore water conservation and ecological service functions. The sandy land will be enclosed and protected. China’s grasslands cover contains 9–16% of the total carbon in world grasslands although they only comprise 6–8% of the total world grassland area and at the same time they make a big contribution to the world carbon storage and may have significant effects on the carbon cycle. Grasslands and pastures are an indispensable source of natural capital and provide a large amount of agricultural products and ecosystem services as well as serve a role in controlling the rise in atmospheric CO2 concentrations and enhance carbon sequestration, especially in the environmentally fragile region of XUAR in China. However, overgrazing seems to be the main reason for environmental degradation which directly or indirectly result increasing CO2 emissions. The trend of overgrazing will not end in the near future unless herdsmen find a feasible alternative. This paper explains a scenario for eliminating grazing through agricultural structure adjustments, which should be performed with interdisciplinary participation and would benefit herdsmen and the environment. In the long run, actions conserving ecosystems including natural grassland protection through increasing carbon sequestration can make a great contribution to low-carbon development.

4. Conclusions

The emergy method is suitable for evaluating the effects of agricultural structural adjustment, which is a very complex issue hindering regional sustainable development. After structural optimization, agricultural land would account for 56% of the total land area. The arable land removed from continuous cotton growth could be utilized for a cotton and alfalfa rotation or intercropping, and the artificial grassland could be expanded to 16,663 ha. The saved land would primarily be used to grow purple alfalfa, thereby increasing the artificial grassland area from 4.5% to 28.9%. The larger artificial grassland is expected to produce an abundance of feed for the animal industry, which is the prerequisite for the transition from a grazing style towards a confined system for raising domestic animals. More importantly, the adjustment in the water utilization ratio among different crop species can improve the overall water utilization efficiency, and the unit output cost could be reduced from 0.088 to 0.055. The appropriate combination and cooperation among different resources will ensure improved economic efficiency, better ecological conservation, and stronger social development, and more import, through agricultural structure adjustment, herdsmen will find new ways to live better while not depending on grazing which could be a disadvantage to carbon storage of the natural grassland. All of these changes are consistent with the goal of developing a low-carbon economy, and together they can be considered as feasible low-carbon development strategy.

Acknowledgements

This article was supported by the National Natural Science Funds Key Project (No. 90711001, 41030535) and “973” (2007CB106807) and the 11th Five-year Plan of China Science & Technology Supporting Program (2006BAJ10B05).

References

  1. Nakata, T.; Silva, D.; Rodionov, M. Application of energy system models for designing a low-carbon society. Prog. Energy Combust. Sci. 2011, 37, 462–502. [Google Scholar] [CrossRef]
  2. Yang, X.W.; Jia, X. Low-carbon economy and low-carbon food. Energy Procedia 2011, 5, 1099–1103. [Google Scholar] [CrossRef]
  3. Ma, S.L.; Li, R.H. Evaluation on sustainable food security in henan against the background of low-carbon economy. Agric. Agric. Sci. Procedia 2010, 1, 412–416. [Google Scholar] [CrossRef]
  4. Parthan, B.; Osterkorn, M.; Kennedy, M.; John, H.; St. Bazilian, M.; Monga, P. Lessons for low-carbon energy transition: Experience from the Renewable Energy and Energy Efficiency Partnership (REEEP). Energy Sustain. Dev. 2010, 14, 83–93. [Google Scholar] [CrossRef]
  5. Andrés, M.S.; Cuadrado-Roura, J.R. Is growth of services an obstacle to productivity growth? A comparative analysis. Struct. Change Econ. Dyn. 2009, 20, 254–265. [Google Scholar]
  6. Evans, N. Adjustment strategies revisited: Agricultural change in the Welsh Marches. J. Rural Stud. 2009, 25, 217–230. [Google Scholar] [CrossRef]
  7. Handa, S. Structural adjustment policies, income distribution and poverty: A review of the Jamaican experience. World Dev. 1997, 25, 915–930. [Google Scholar] [CrossRef]
  8. Happe, K. Does structure matter? The impact of switching the agricultural policy regime on farm structures. J. Econ. Behav. Organ. 2008, 67, 431–444. [Google Scholar] [CrossRef]
  9. Barry, S.; Cai, Y.L. Climate change and agriculture in China. Glob. Environ. Change 1996, 6, 205–214. [Google Scholar] [CrossRef]
  10. Lai, X.Q. Oasis Agriculture in Xinjiang; Xinjiang Uygur Autonomous Region Science and Heath Press: Xinjiang Uygur, China, 2002; pp. 100–156. [Google Scholar]
  11. County Statistical Editing Office. Encyclopedia of Manas County of Xinjiang Uygur Autonomous Region; Urumqi Autonomous District Press: Xinjiang Uygur Autonomous Region, China, 2006. [Google Scholar]
  12. Xinjiang Uygur Autonomous Region Autonomous District Statistics office. Xinjing Survey and Statistics Encyclopedia; China Statistics Press: Beijing, China, 2005. [Google Scholar]
  13. Rahmutulla, A.; Tashkin, J. Discussion on oasis conception and its classification. Arid Land Geogr. 2000, 23, 129–132. [Google Scholar]
  14. Odum, H.T. Emergy in Ecosystems. In Ecosystem Theory and Application; Poluin, N., Ed.; John Wiley Sons: New York, NY, USA, 1986. [Google Scholar]
  15. Odum, H.T. Environmental Accounting: Emergy and Environmental Decision-Making; John Wiley Sons: New York, NY, USA, 1996. [Google Scholar]
  16. Agostinho, F.; Ambrósio, L.A.; Ortega, E. Assessment of a large watershed in Brazil using Emergy Evaluation and Geographical Information System. Ecol. Model. 2010, 221, 1209–1220. [Google Scholar] [CrossRef]
  17. Dong, X.B.; Ulgiati, S.; Yan, M.C.; Gao, W.S.; Zhang, X.S. Energy and emergy evaluation of bio-ethanol production from wheat in China. Energy Policy 2008, 36, 3882–3892. [Google Scholar] [CrossRef]
  18. Cavalett, O.; Queiroz, J.F.; Orteg, E. Emergy assessment of integrated production systems of grains, pig and fish in small farms in the South Brazil. Ecol. Model. 2006, 193, 205–224. [Google Scholar] [CrossRef]
  19. Brown, M.T.; Ulgiati, S. Emergy evaluations and environmental loading of electricity production systems. J. Clean. Prod. 2002, 10, 321–334. [Google Scholar] [CrossRef]
  20. Martin, J.F.; Diemont, S.A.W.; Powell, E.; Stanton, M.; Levy-Tacher, S. Emergy evaluation of the performance and sustainability of three agricultural systems with different scales and management. Agric. Ecosyst. Environ. 2006, 115, 128–140. [Google Scholar] [CrossRef]
  21. Lefroy, E.; Rydberg, T. Emergy evaluation of three cropping systems in southwestern Australia. Ecol. Model. 2003, 161, 195–211. [Google Scholar] [CrossRef]
  22. Rydberg, T.; Jansen, J. Comparison of horse and tractor traction using emergy analysis. Ecol. Eng. 2002, 19, 13–28. [Google Scholar] [CrossRef]
  23. Ulgiata, S.; Brown, M.T. Monitoring patterns of sustainability in natural and man-made ecosystems. Ecol. Model. 1998, 108, 23–36. [Google Scholar] [CrossRef]
  24. Agostinhoa, F.; Diniz, G.; Sichec, R.; Ortegaa, E. The use of emergy assessment and the Geographical Information System in the diagnosis of small family farms in Brazil. Ecol. Model. 2008, 210, 37–57. [Google Scholar] [CrossRef]
  25. Castellini, C.; Bastianoni, S.; Granai, C.; Dal Bosco, A.; Brunetti, M. Sustainability of poultry production using the emergy approach: Comparison of conventional and organic rearing systems. Agric. Ecosyst. Environ. 2006, 114, 343–350. [Google Scholar] [CrossRef]
  26. Jiang, Q.D.; He, J.Q.; Chen, S.H. The Applied Linear Programming Method and the Supporting System; Qinghua University Press: Beijing, China, 2006. [Google Scholar]
  27. Wang, F.C.; Odum, H.T.; Costanza, R. Energy criteria for water use. J. Water Resour. Plan. Manag. Div. 1980, 1, 185–203. [Google Scholar]
  28. Liu, G.C.; Wang, X.D.; Hu, X.C. The optimum model of the grain production structure in the ZangBu basin of Kangmanie County, Tibet. J. Mt. Sci. 2004, 1, 54–58. [Google Scholar] [CrossRef]
  29. Xu, J.F. Challenges and Strategies in the Water Recourse Development in the Manas River Reach; Xinjiang Uygur Autonomous Region Science and Heath Press: Xinjiang Uygur, China, 1995. [Google Scholar]
  30. Dong, X.B.; Yan, M.C.; Gao, W.S. Emergy evaluation of eco-productive paradigm of artificial grassland-meat sheep breeding-company system in Chifeng city of Inner Mongolia. Trans. Chin. Soc. Agric. Eng. 2007, 9, 195–200. [Google Scholar]
  31. Bao, Y.S. Problems the animal husbandry of the inner Mongolia grassland is facing and the way to deal with them. J. Inner Mongolia Norm. Univ. 2002, 31, 44–47. [Google Scholar]
  32. Li, S.C.; Fu, X.F.; Zheng, D. Emergy analysis for evaluating sustainability of Chinese economy. J. Nat. Resour. 2001, 4, 297–304. [Google Scholar]
  33. Lu, H.F.; Campbell, Daniel E.; Li, Z.A. Emergy synthesis of an agro-forest restoration system in lower subtropical China. Ecol. Eng. 2006, 27, 175–192. [Google Scholar] [CrossRef]
  34. Xiao, H.; Ouyang, Z.Y. Preliminary evaluation of forest ecosystem services functions and the ecological value. Chin. J. Appl. Ecol. 2000, 4, 481–484. [Google Scholar]
  35. Wang, J.; Wei, Y.M.; Sun, Y.Y. Effects of excessive grazing on grassland eco-system services valuation—a case study in Gansu Maqu County. J. Nat. Resour. 2006, 1, 109–117. [Google Scholar]
  36. Zhang, J.M. Appraisal of oasis ecologic economy based on energy analysis in the Manas River Basin of Xinjiang Uygur Autonomous Region Wei Autonomous Region. Bull. Water Soil Conserv. 2007, 1, 151–154. [Google Scholar]

