Standardization Work for BEV and HEV Applications: Critical Appraisal of Recent Traction Battery Documents


Abstract
:1. Introduction
- Sufficient power capabilities, so that the necessary power required for propulsion can be supplied to the motor in any reasonable driving condition;
- Quick charging time, in order to increase vehicle availability;
- Sufficient lifetime, both in terms of calendar life and number of charge/discharge cycles;
- Cost.

2. Standardization Work
3. Energy and Power Performances for BEV and HEV Applications
3.1. Pre-Conditioning Test

| Test item | Test | Condition | Pack/System ISO/CD 12405-1/2 | Extended | Cell IEC 62660-1 | Extended |
|---|---|---|---|---|---|---|
| Pre-conditioning | Cycling | Temperature | 25 °C | 25 °C | ||
| Charge | standard charge | Standard Charge | ||||
| Discharge | 2C | 0.2C | 2 It | |||
| # Cycles | 5 | 5 | ||||
| Energy and capacity | CC discharge | Temperature | −18 °C, 0 °C, 25 °C, 40 °C | −20 °C, 0 °C, 25 °C, 45 °C | ||
| Charge | standard charge | # It-rates until max charge It-rate (as 1/3It, 1It, 2It, ...) | standard charge | # It-rates until max charge It-rate (as 1/3It, 1It, 2It, ...) | ||
| Discharge | 1C, 10C, 20C, Imax | 1/3It, 2It, 5It | 1C, 10C, 20C, Imax | 1/3It, 2It, 5It | ||
| # cycles | 2 | 2 | ||||
| Power and resistance | Pulse charge/ discharge | Temperature | −18 °C, 0 °C, 25 °C, 40 °C | −20 °C, 0 °C, 25 °C, 45 °C | 40 °C instead of 45 °C | |
| Discharge | Imax, dis | 1/3It, 2It, 5It, 10It | 0.2C, 1C, 5C, 10C | 1/3It, 2It, Imax | ||
| Duration | 0.1 s, 2 s, 10 s, 18 s | 10 s | ||||
| Charge | 0.75* Imax, dis | 1/3It, 2It, 5It, 10It, Imax | 1/3C, 1C, 5C, 10C | 2 It, Imax | ||
| Duration | 0.1 s, 2 s, 10 s | 10s | ||||
| SoC | 80%, 65%, 50%, 35%, 20% | 50% | 80%, 65%, 35%, 20% | |||
| Energy efficiency | Pulse charge/ discharge | Temperature | 0 °C, 25 °C, 40 °C | −18 °C | −20 °C, 0 °C, 25 °C, 45 °C | 40 °C instead of 45 °C |
| Discharge | See sequence in Table 4 | 1/3It, 1It, 2It, 5It, 10It, Imax | 1/3C, 1C, 5C, 10C | 2It, Imax | ||
| Duration | 10s | 10s | ||||
| Charge | See sequence in Table 4 | 1/3It, 1It, 2It, 5It, 10It, Imax | 1/3C, 1C, 5C, 10C | 2It, Imax | ||
| Duration | 10 s | 10 s | ||||
| SoC | 65%, 50%, 35% | 80%, 20% | 50% | 80%, 65%, 35%, 20% |
| Cycle 1 (Ah) | Cycle 2 (Ah) | Cycle 3 (Ah) | Cycle 4 (Ah) | Cycle 5 (Ah) | |
|---|---|---|---|---|---|
| Cell 1 | 46.83 | 46.86 | 46.78 | 46.69 | 46.59 |
| Cell 2 | 45.54 | 45.50 | 45.36 | 45.26 | 45.15 |
| Cell 3 | 46.24 | 46.31 | 45.25 | 46.19 | 46.11 |
3.2. Energy Capabilities


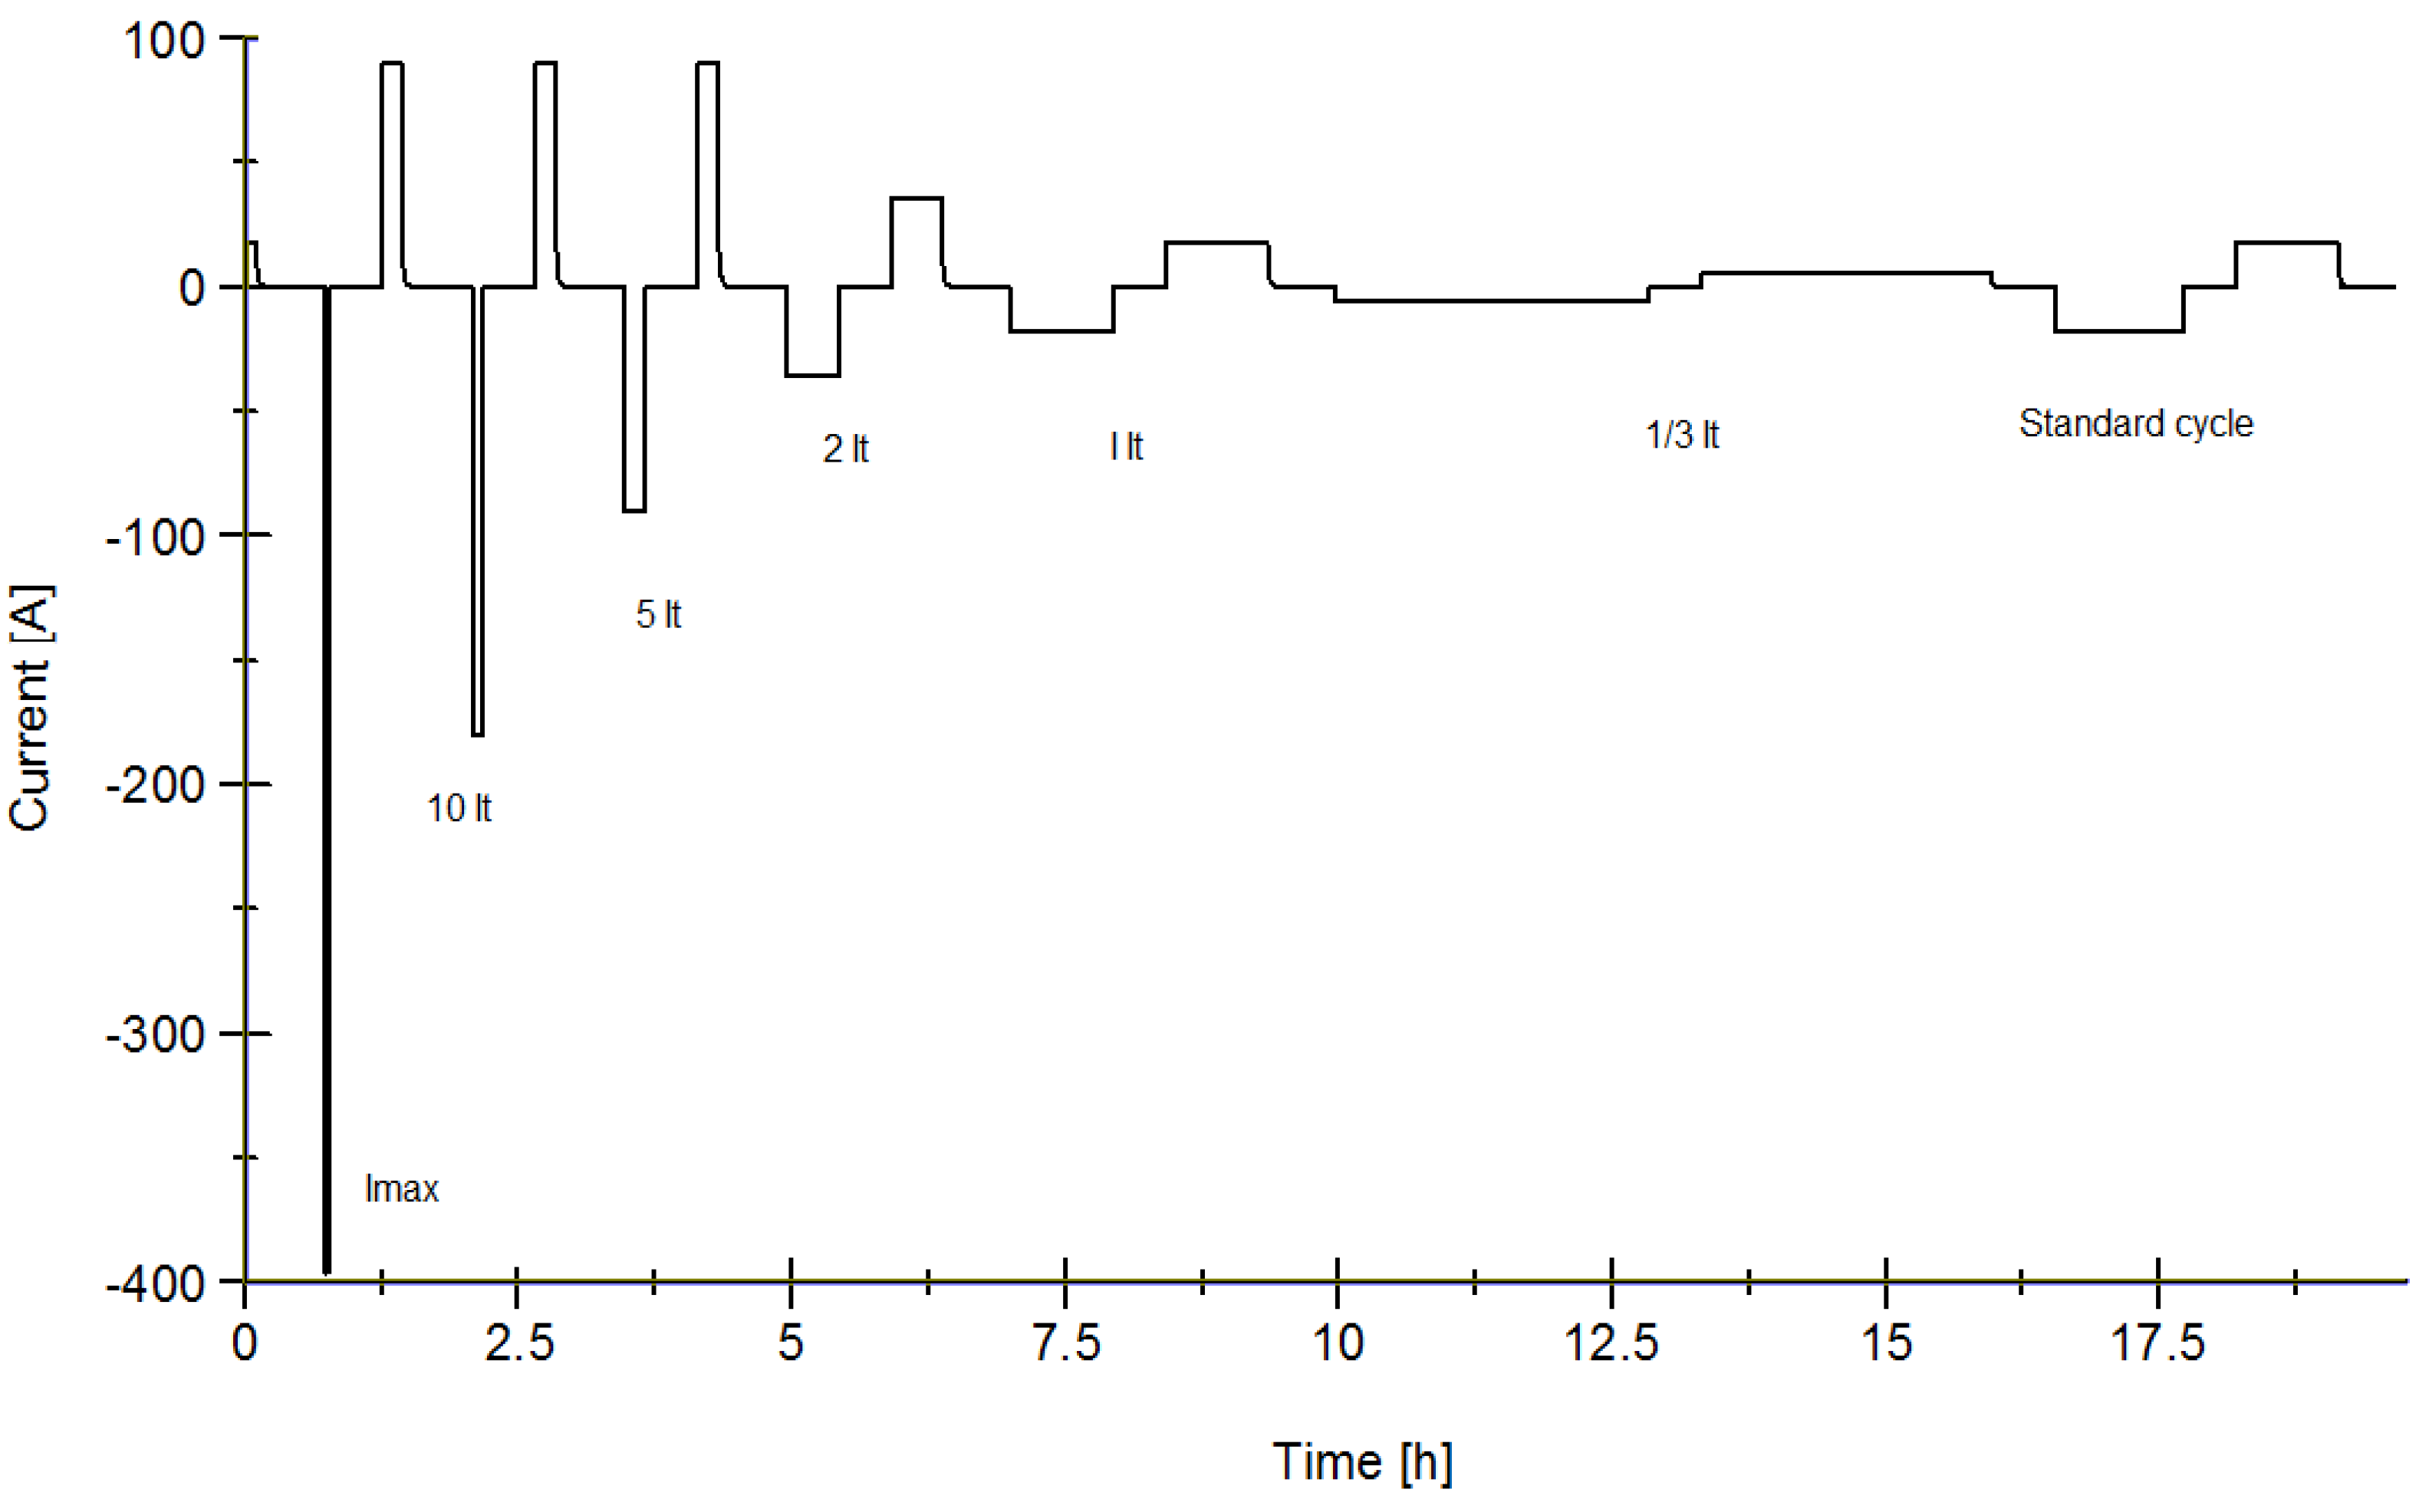
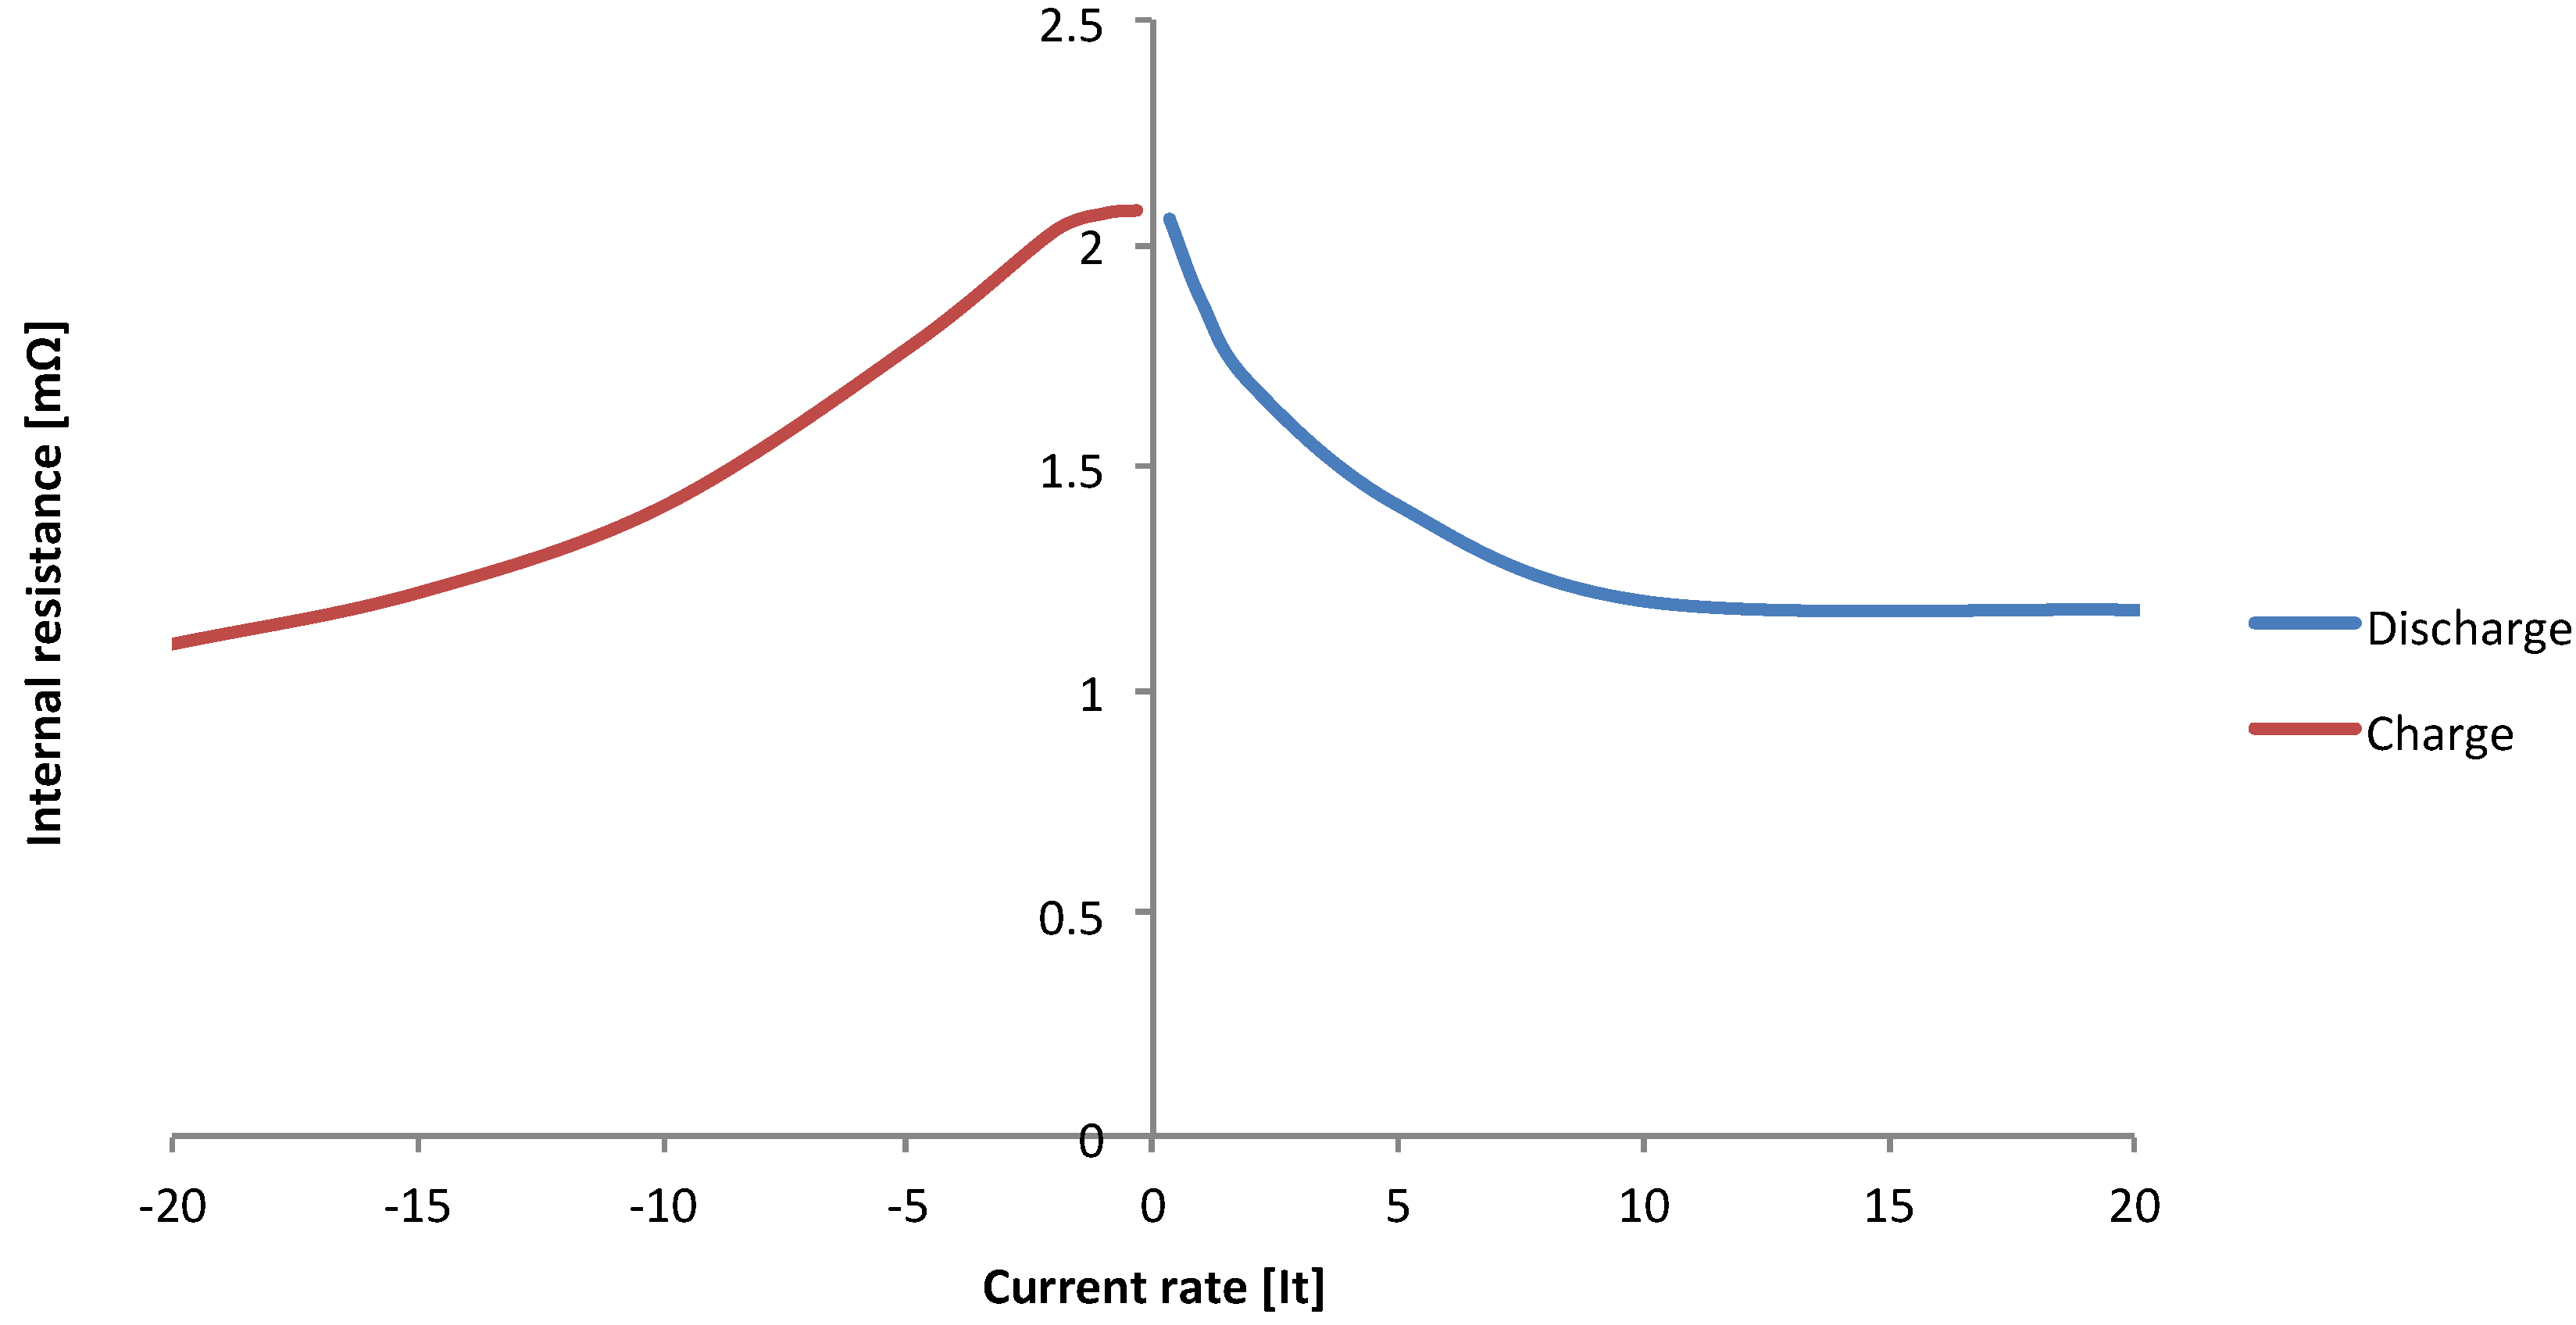
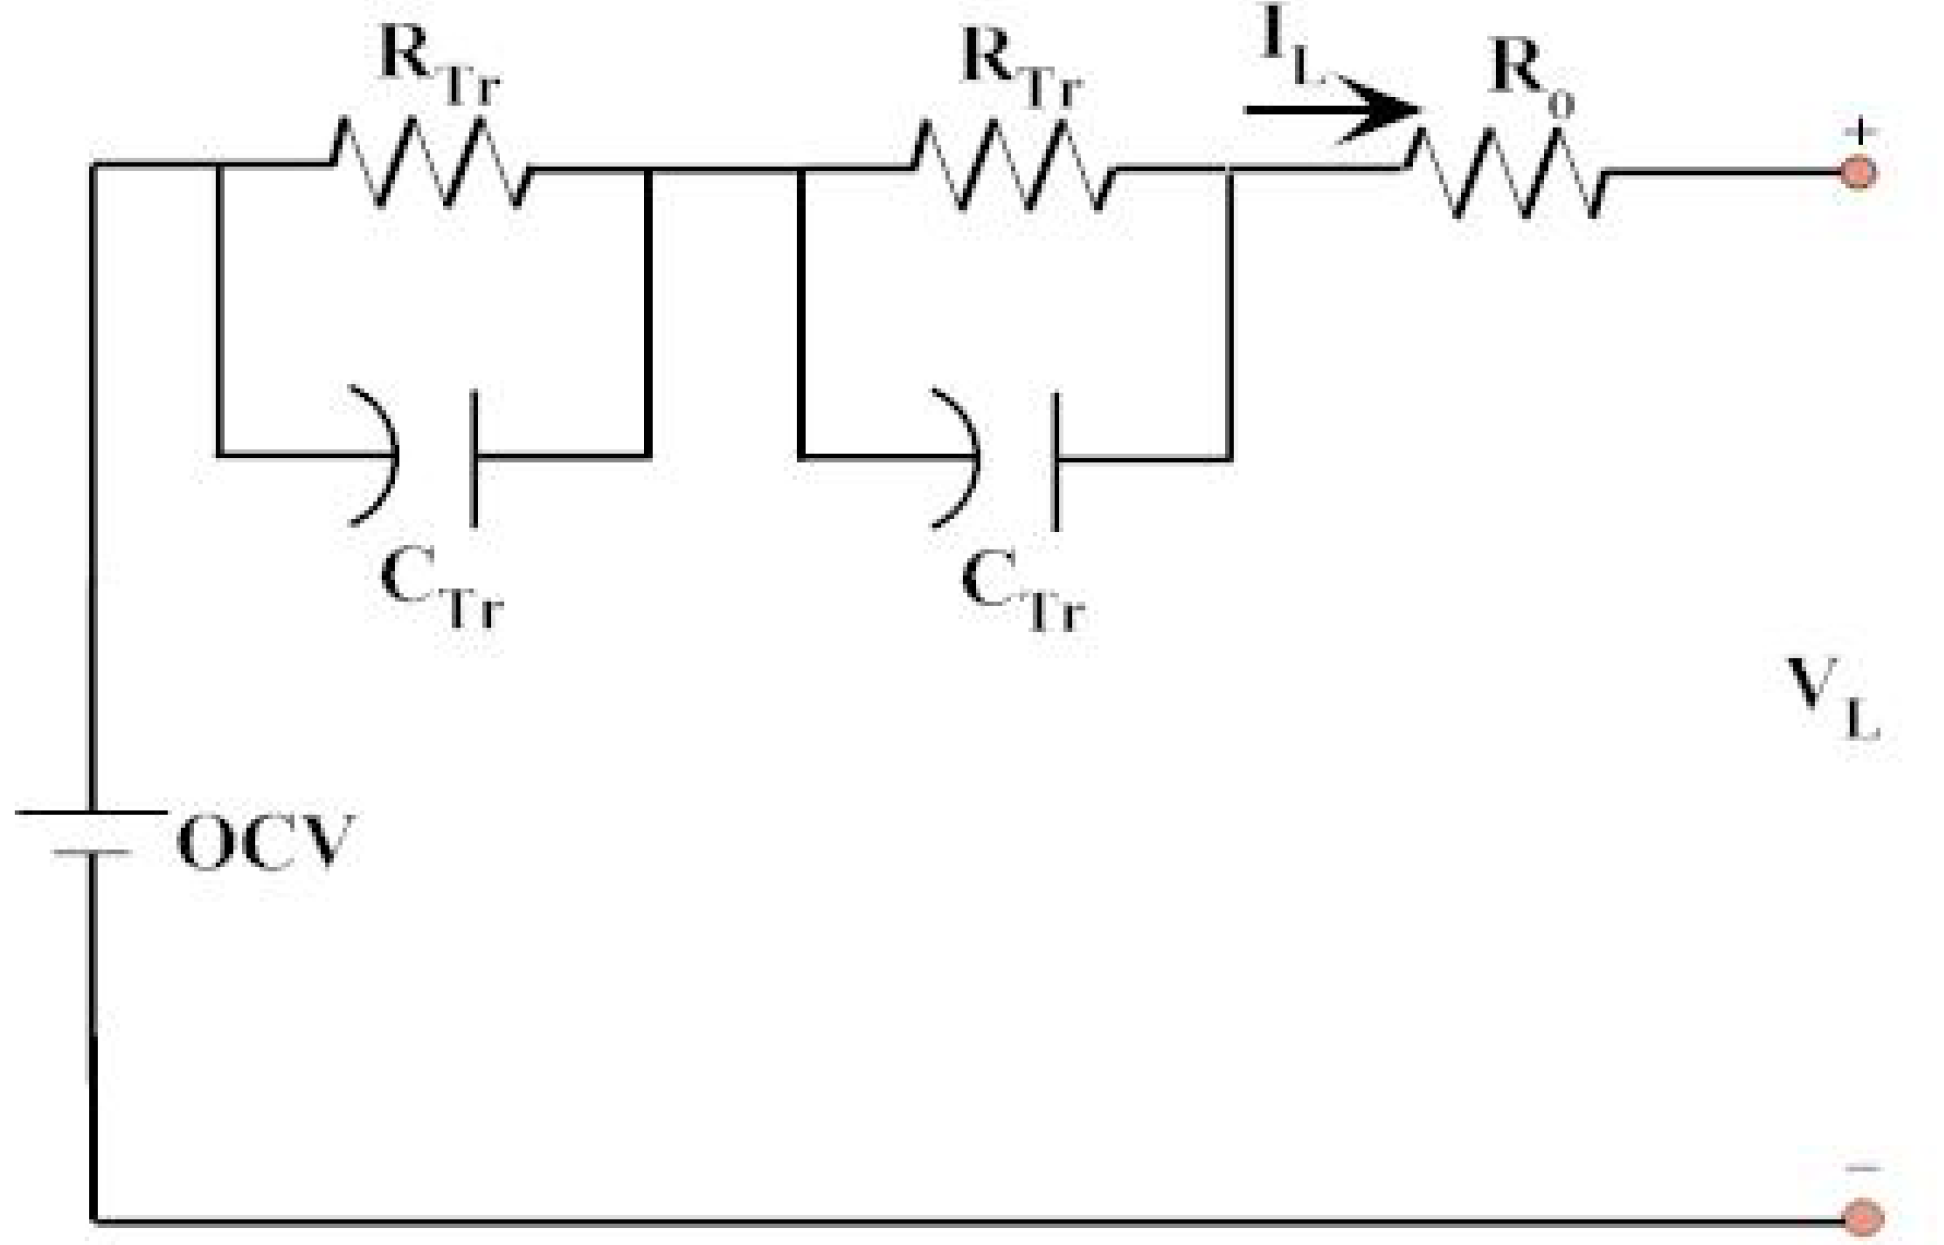
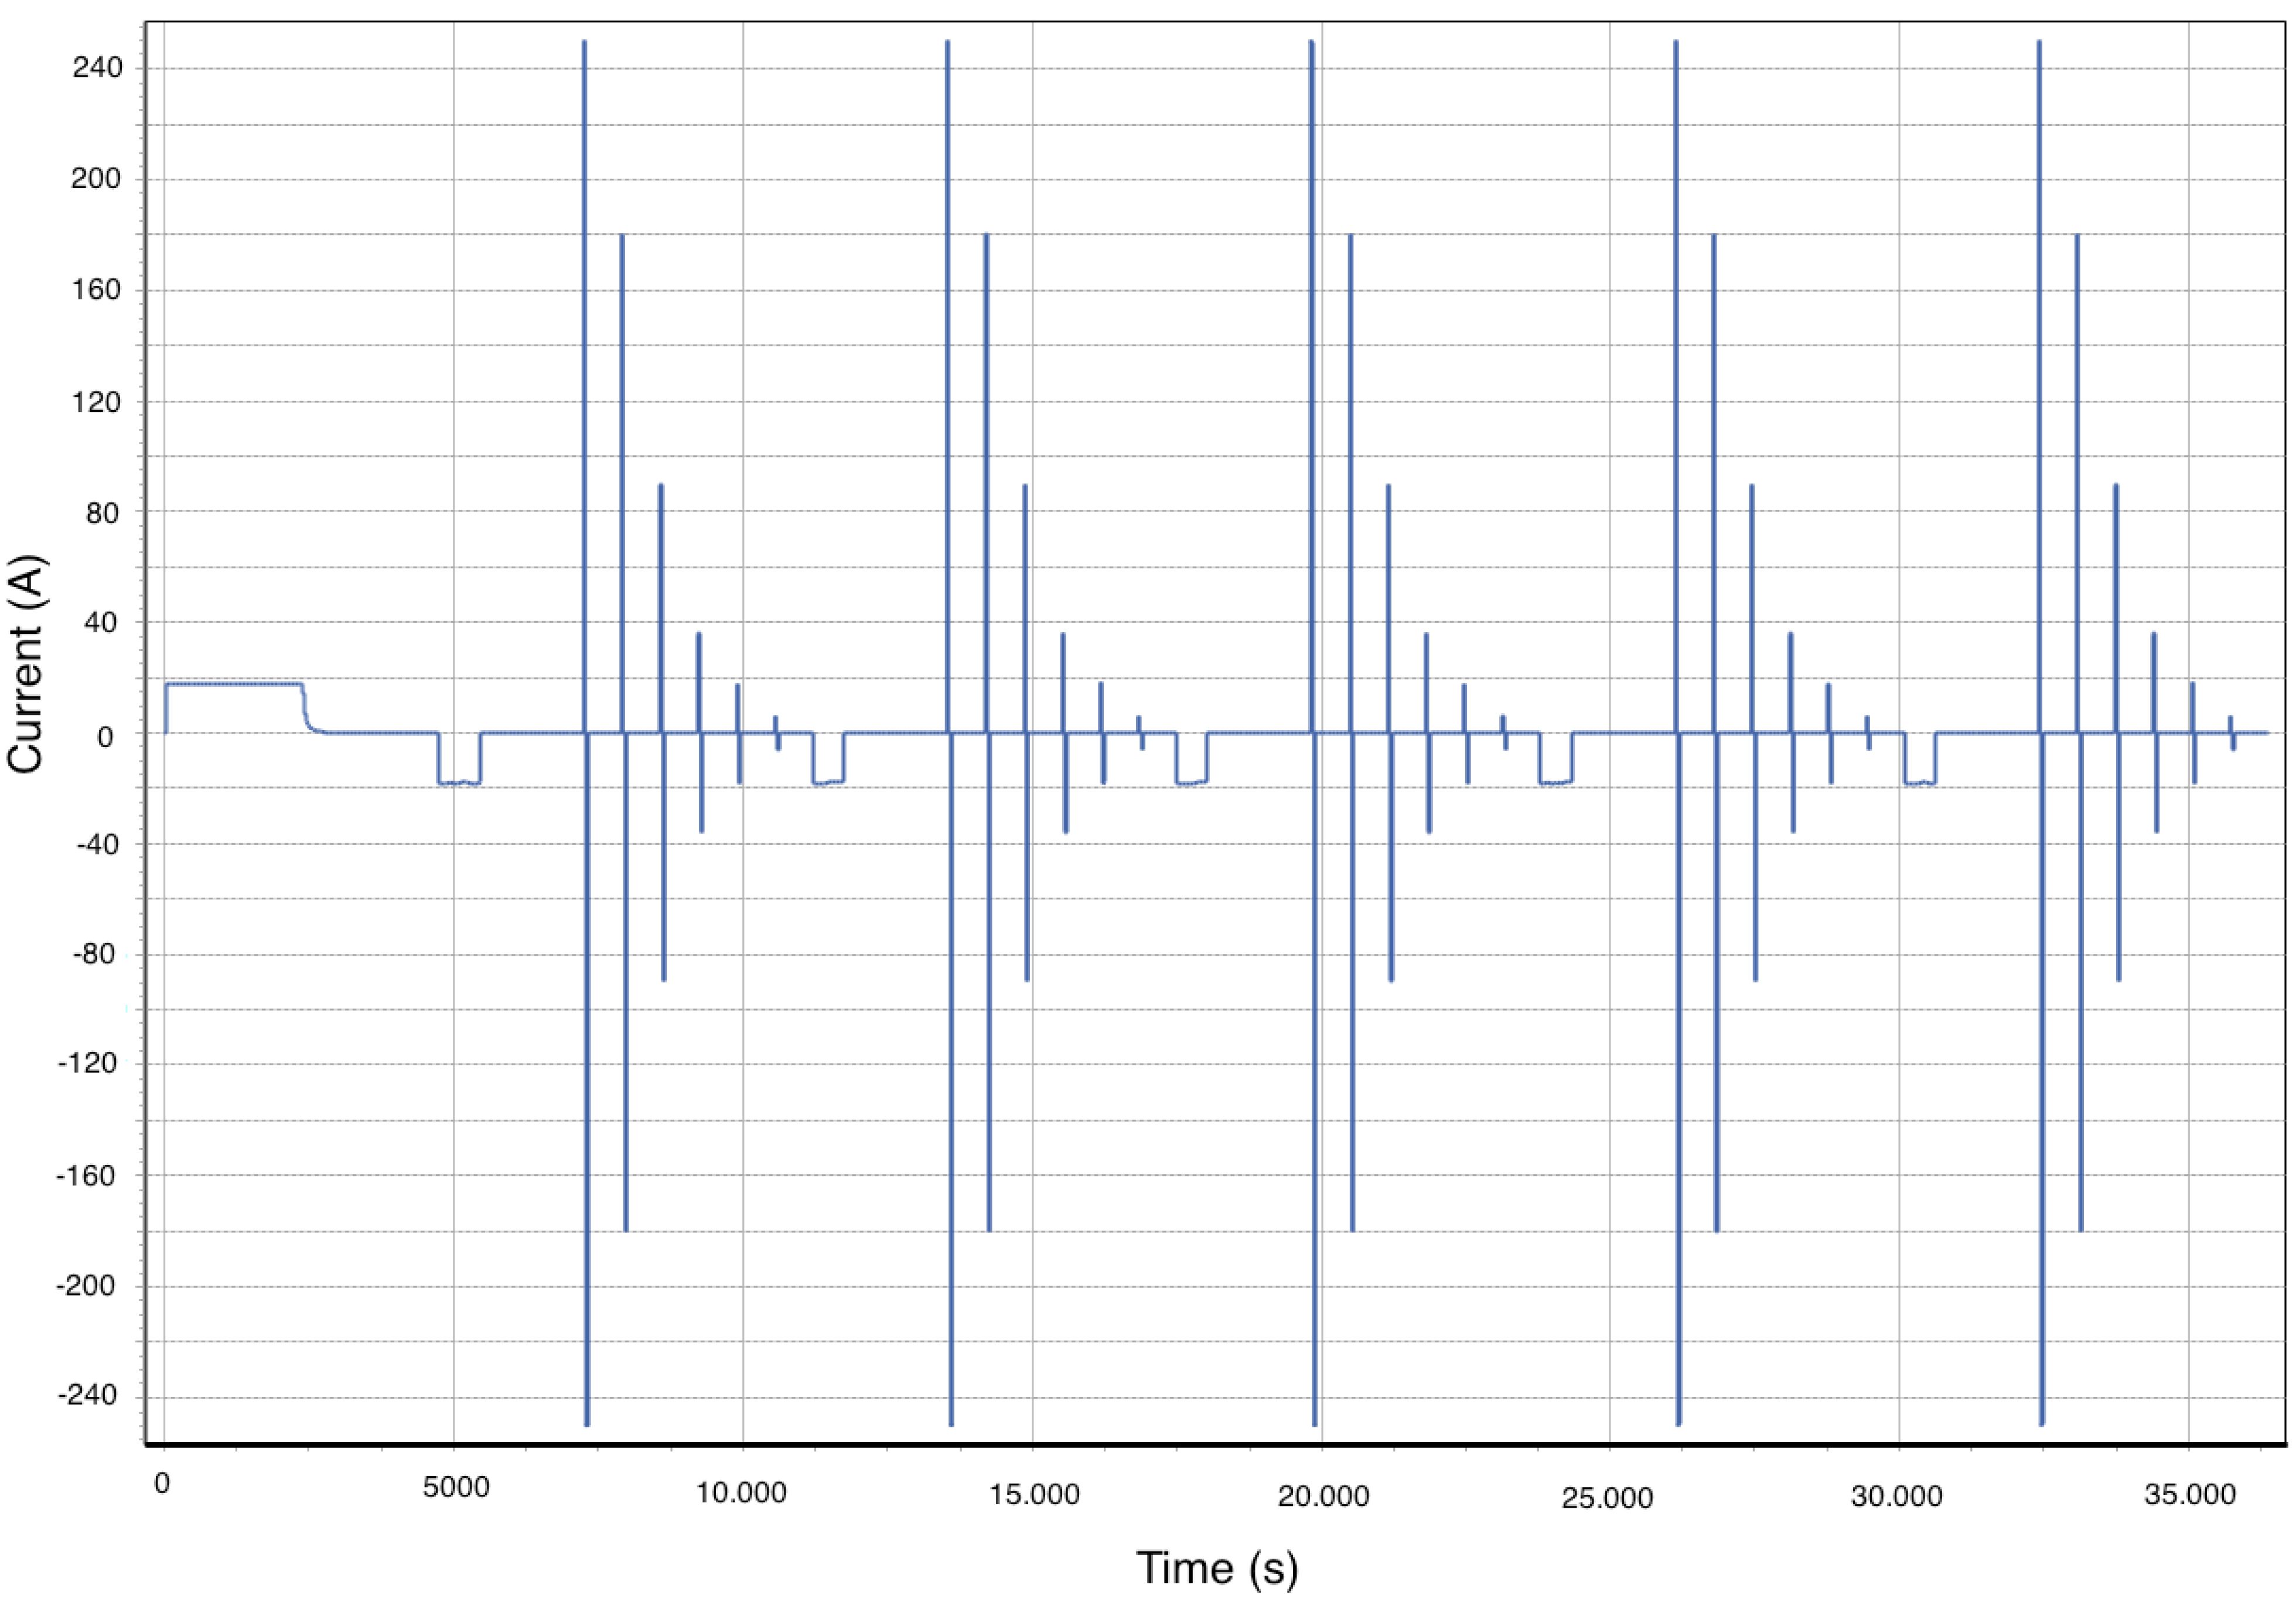
3.3. Power Capabilities
| 15 min | Break | |||||
| OCV | OCV’ | Ri | Rp1 | τ1 | Rp2 | τ2 |
| 3.303 | 0.017 | 0.010 | 0.004 | 3.109 | 0.005 | 44.99 |
| 10 min | Break | |||||
| OCV | OCV’ | Ri | Rp1 | τ1 | Rp2 | τ2 |
| 3.300 | 0.018 | 0.011 | 0.003 | 3.102 | 0.005 | 44.89 |

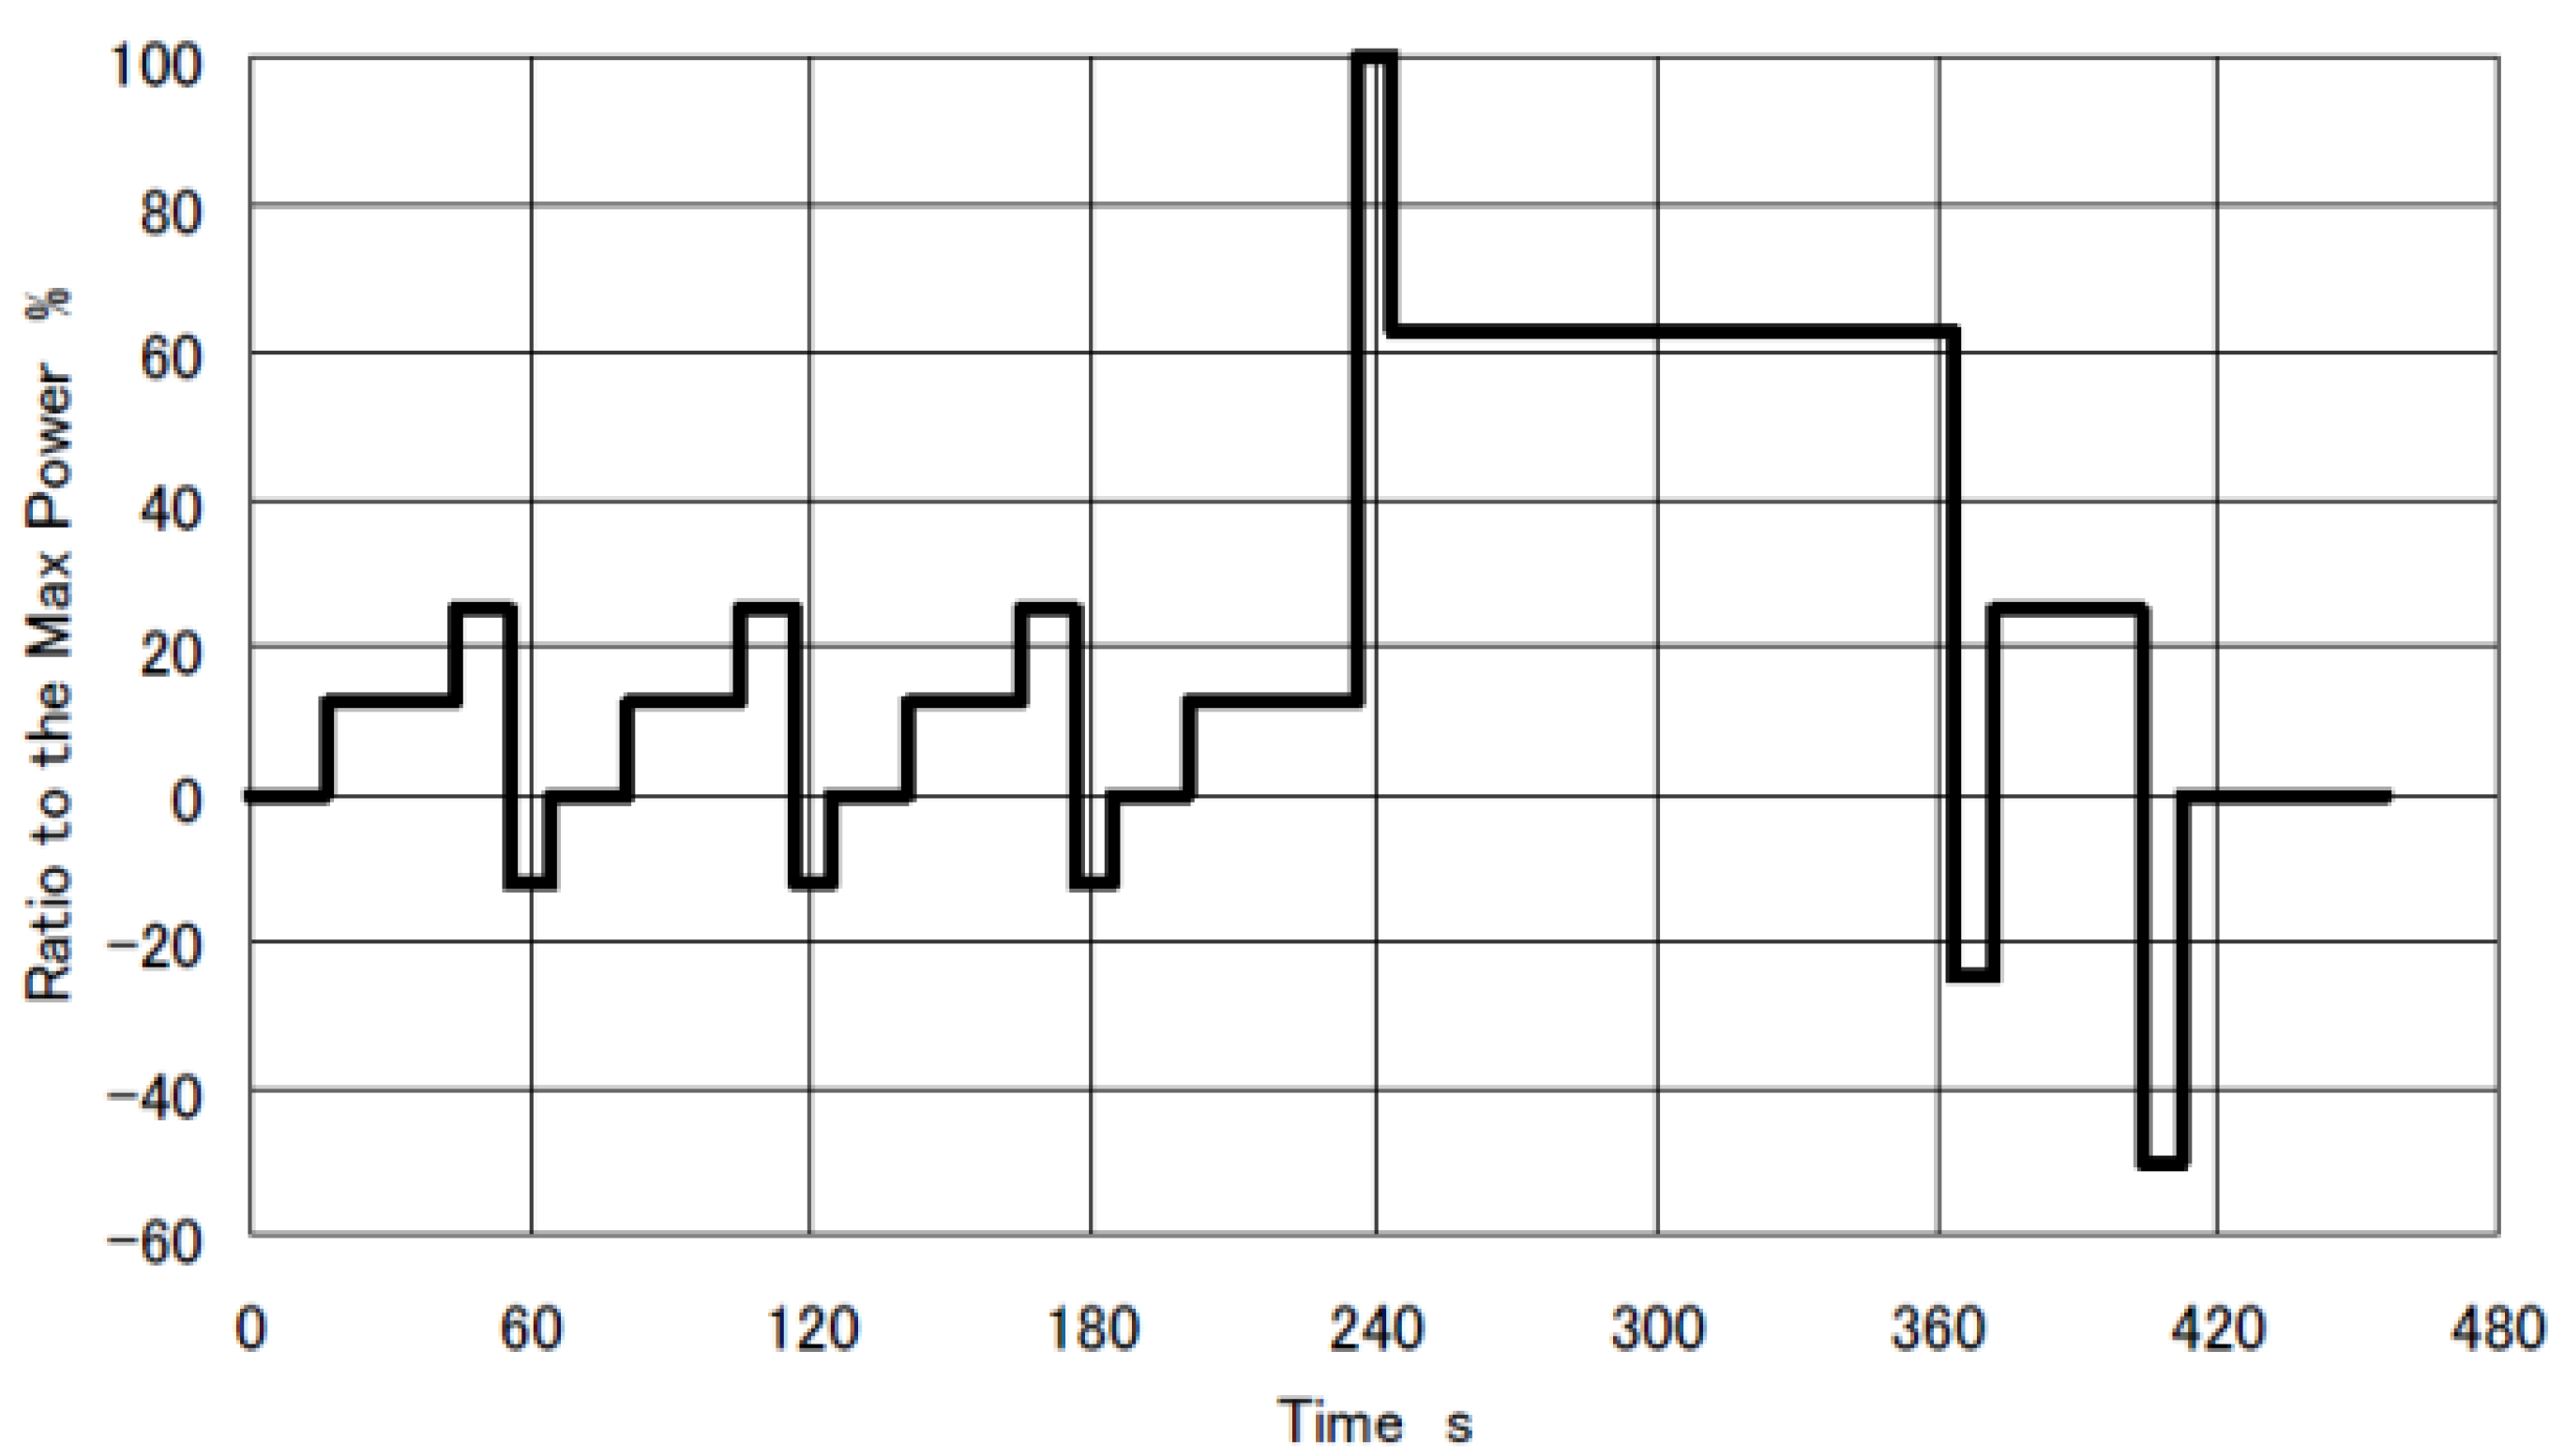
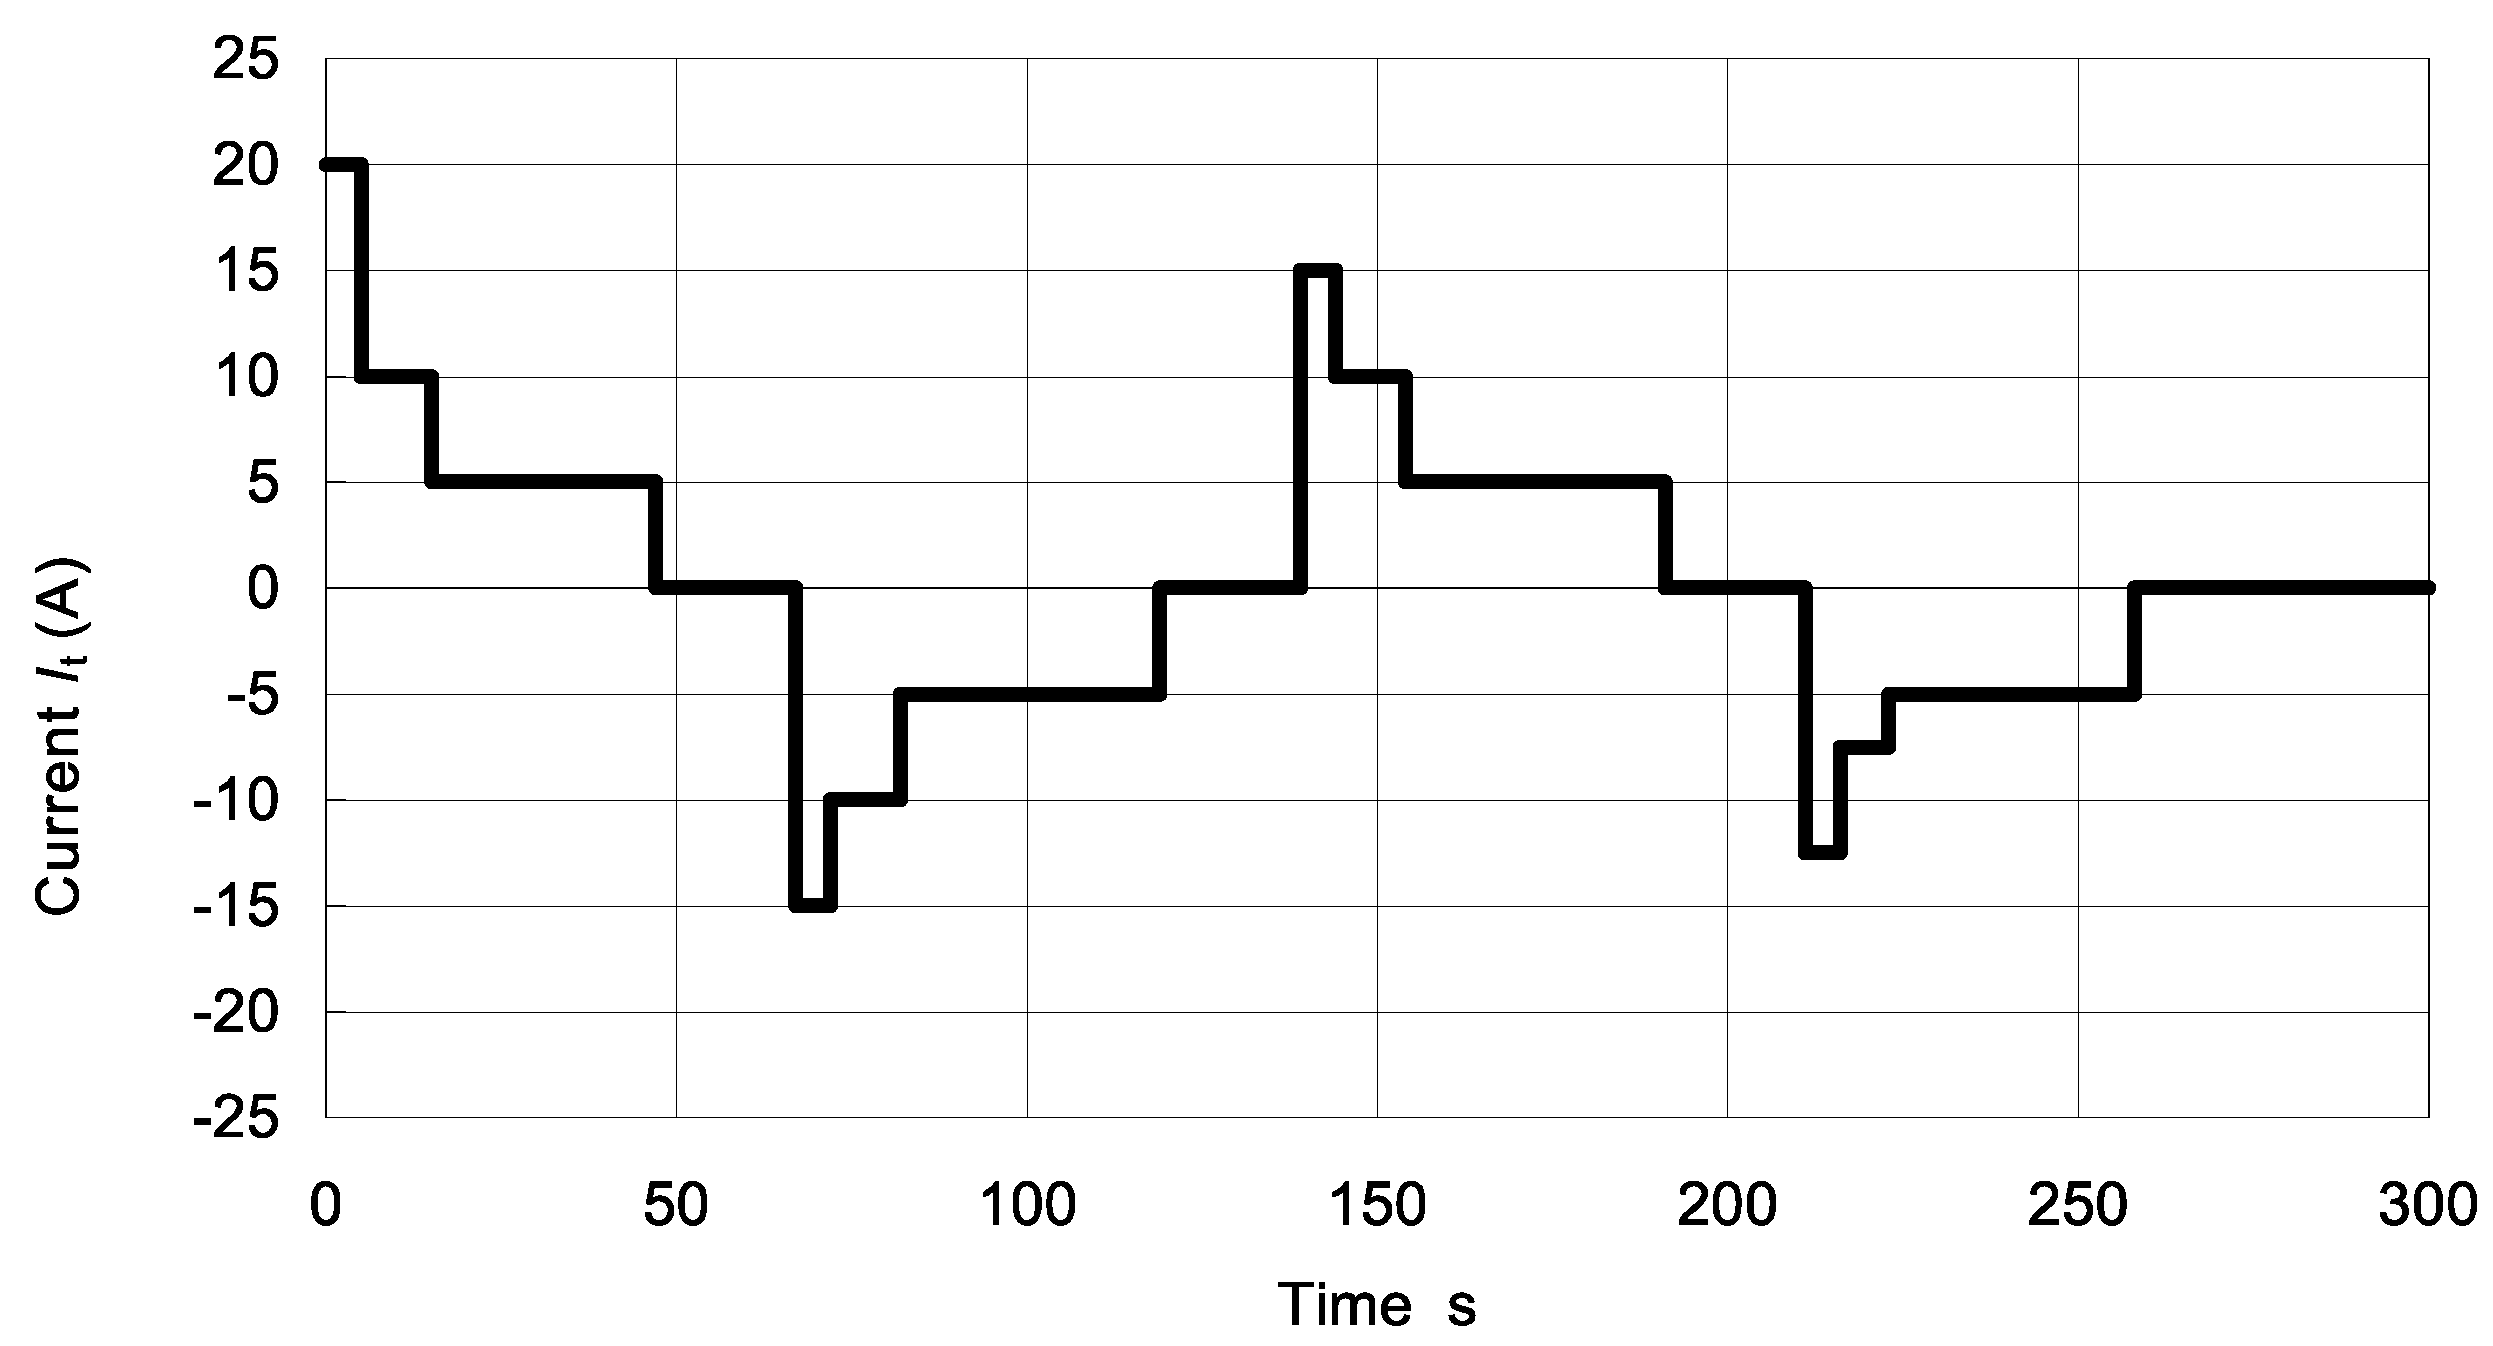
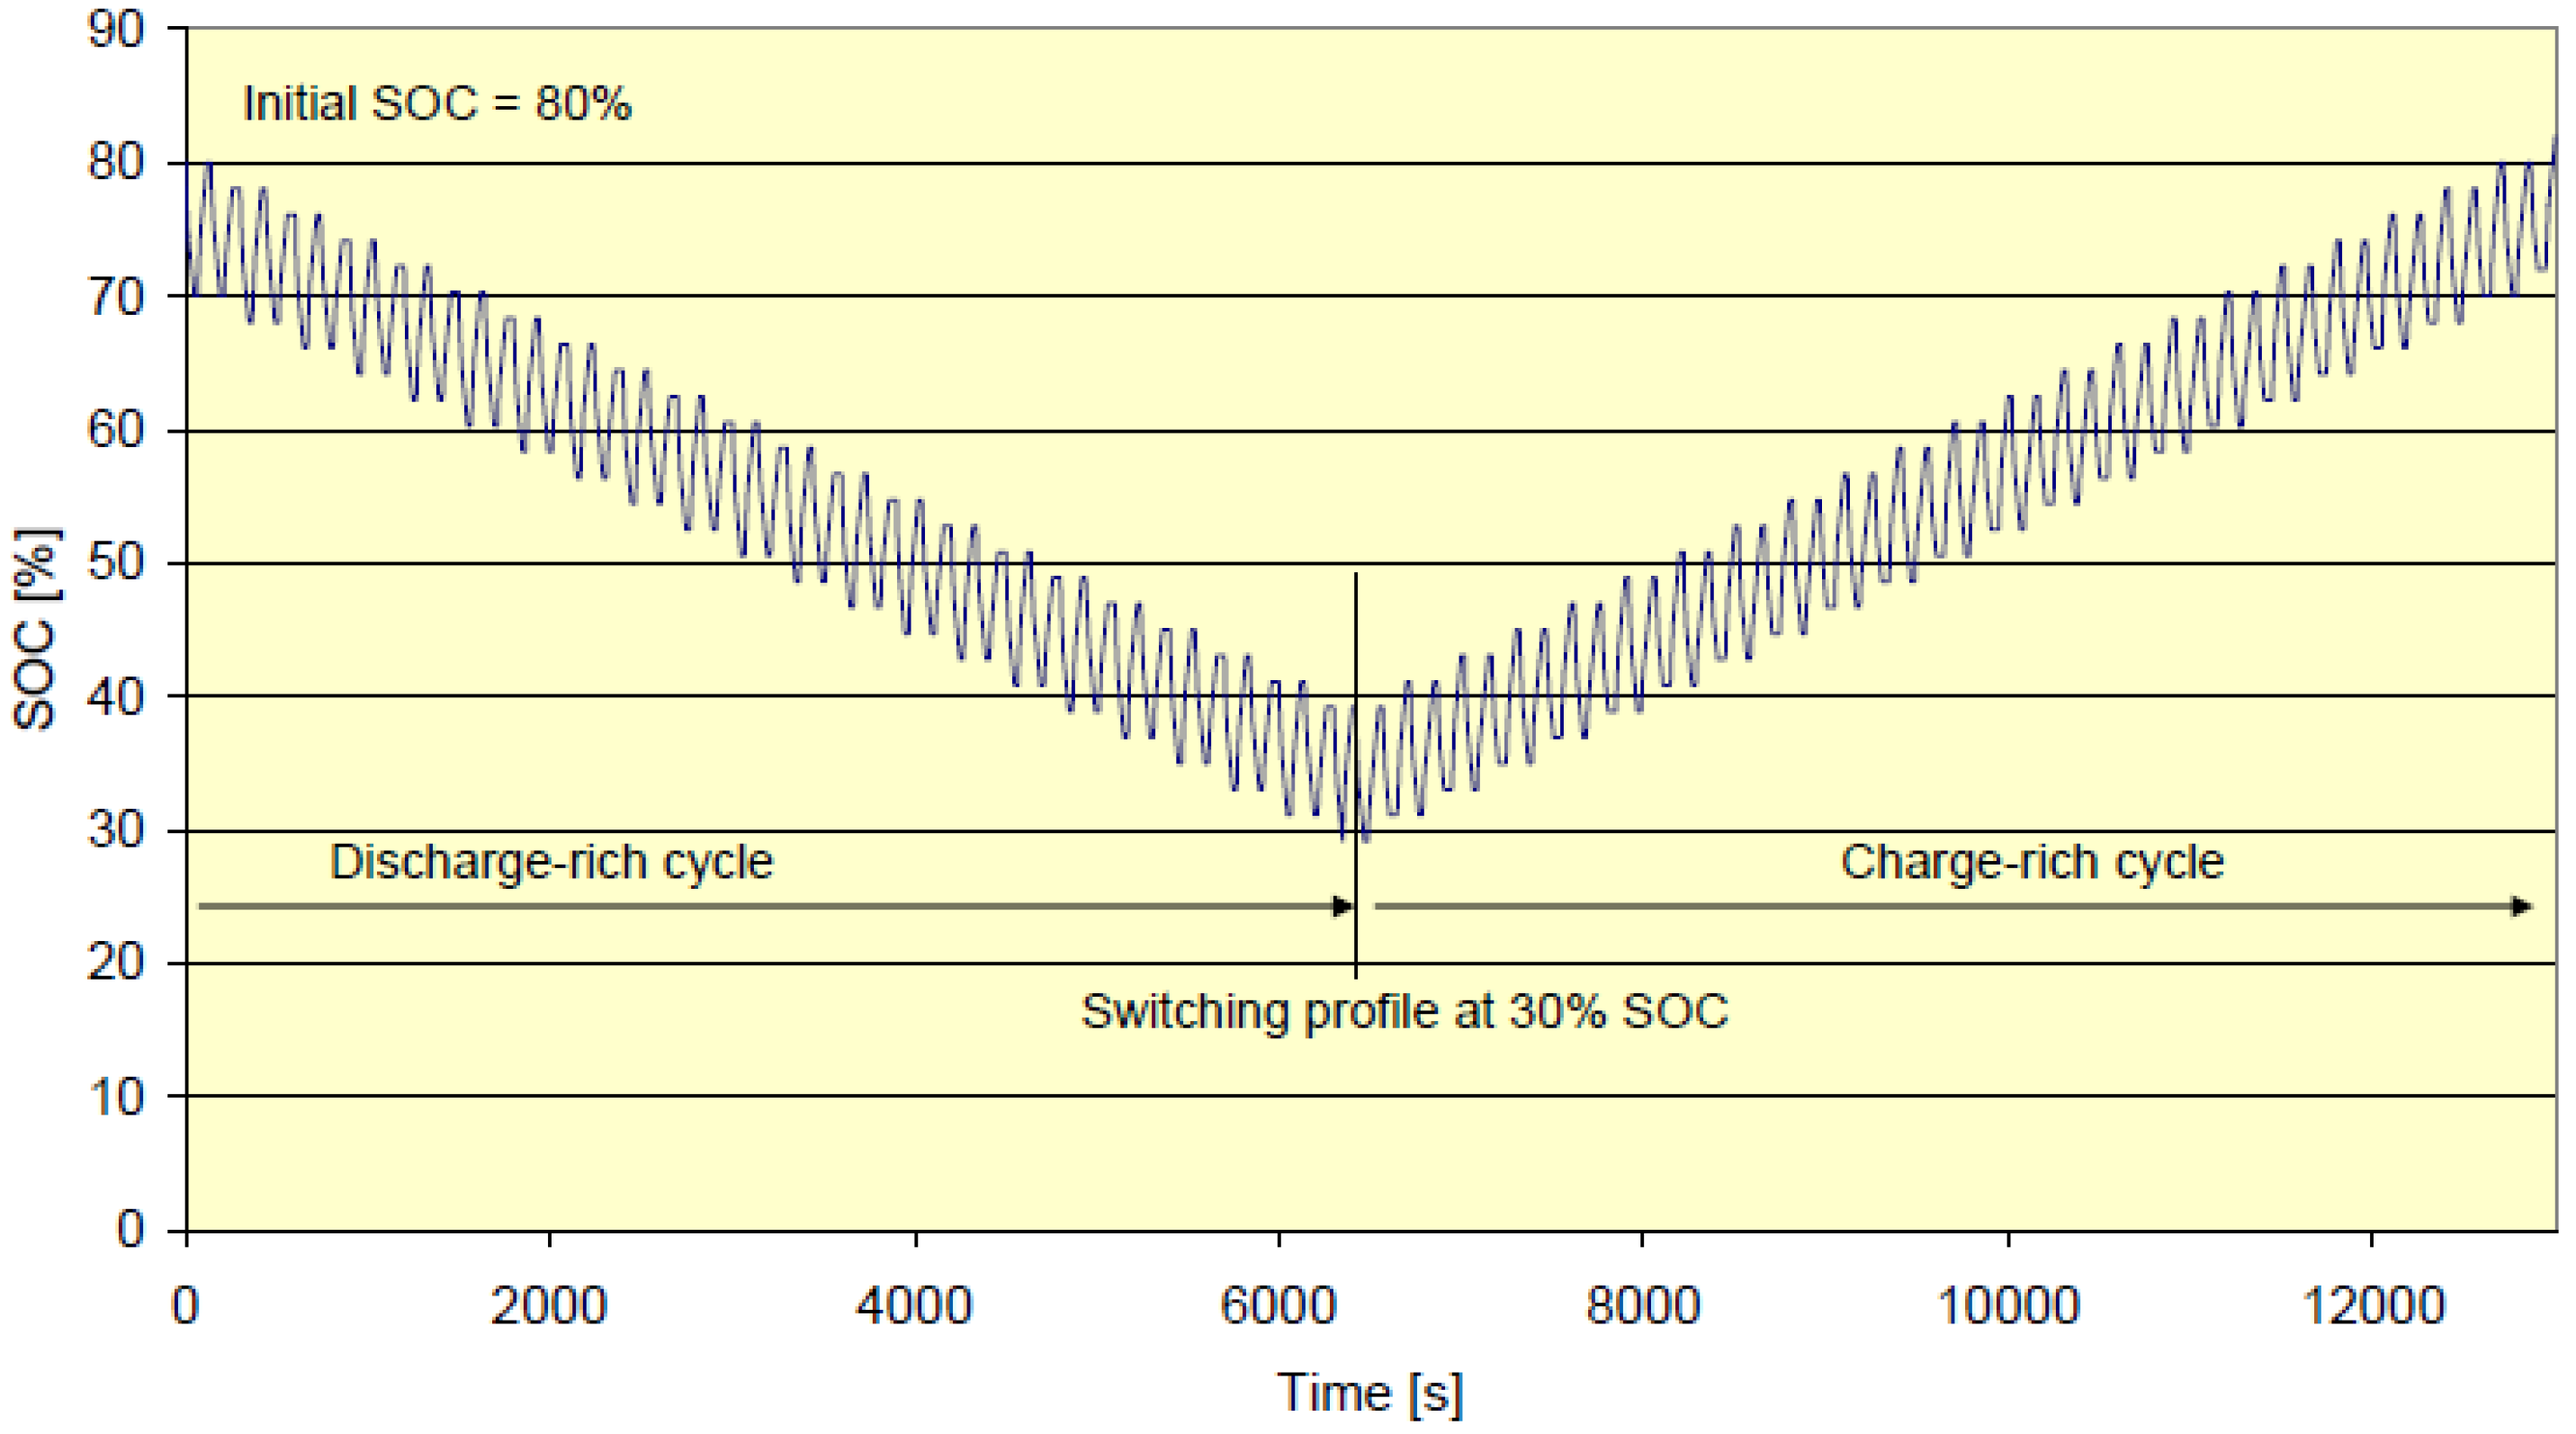
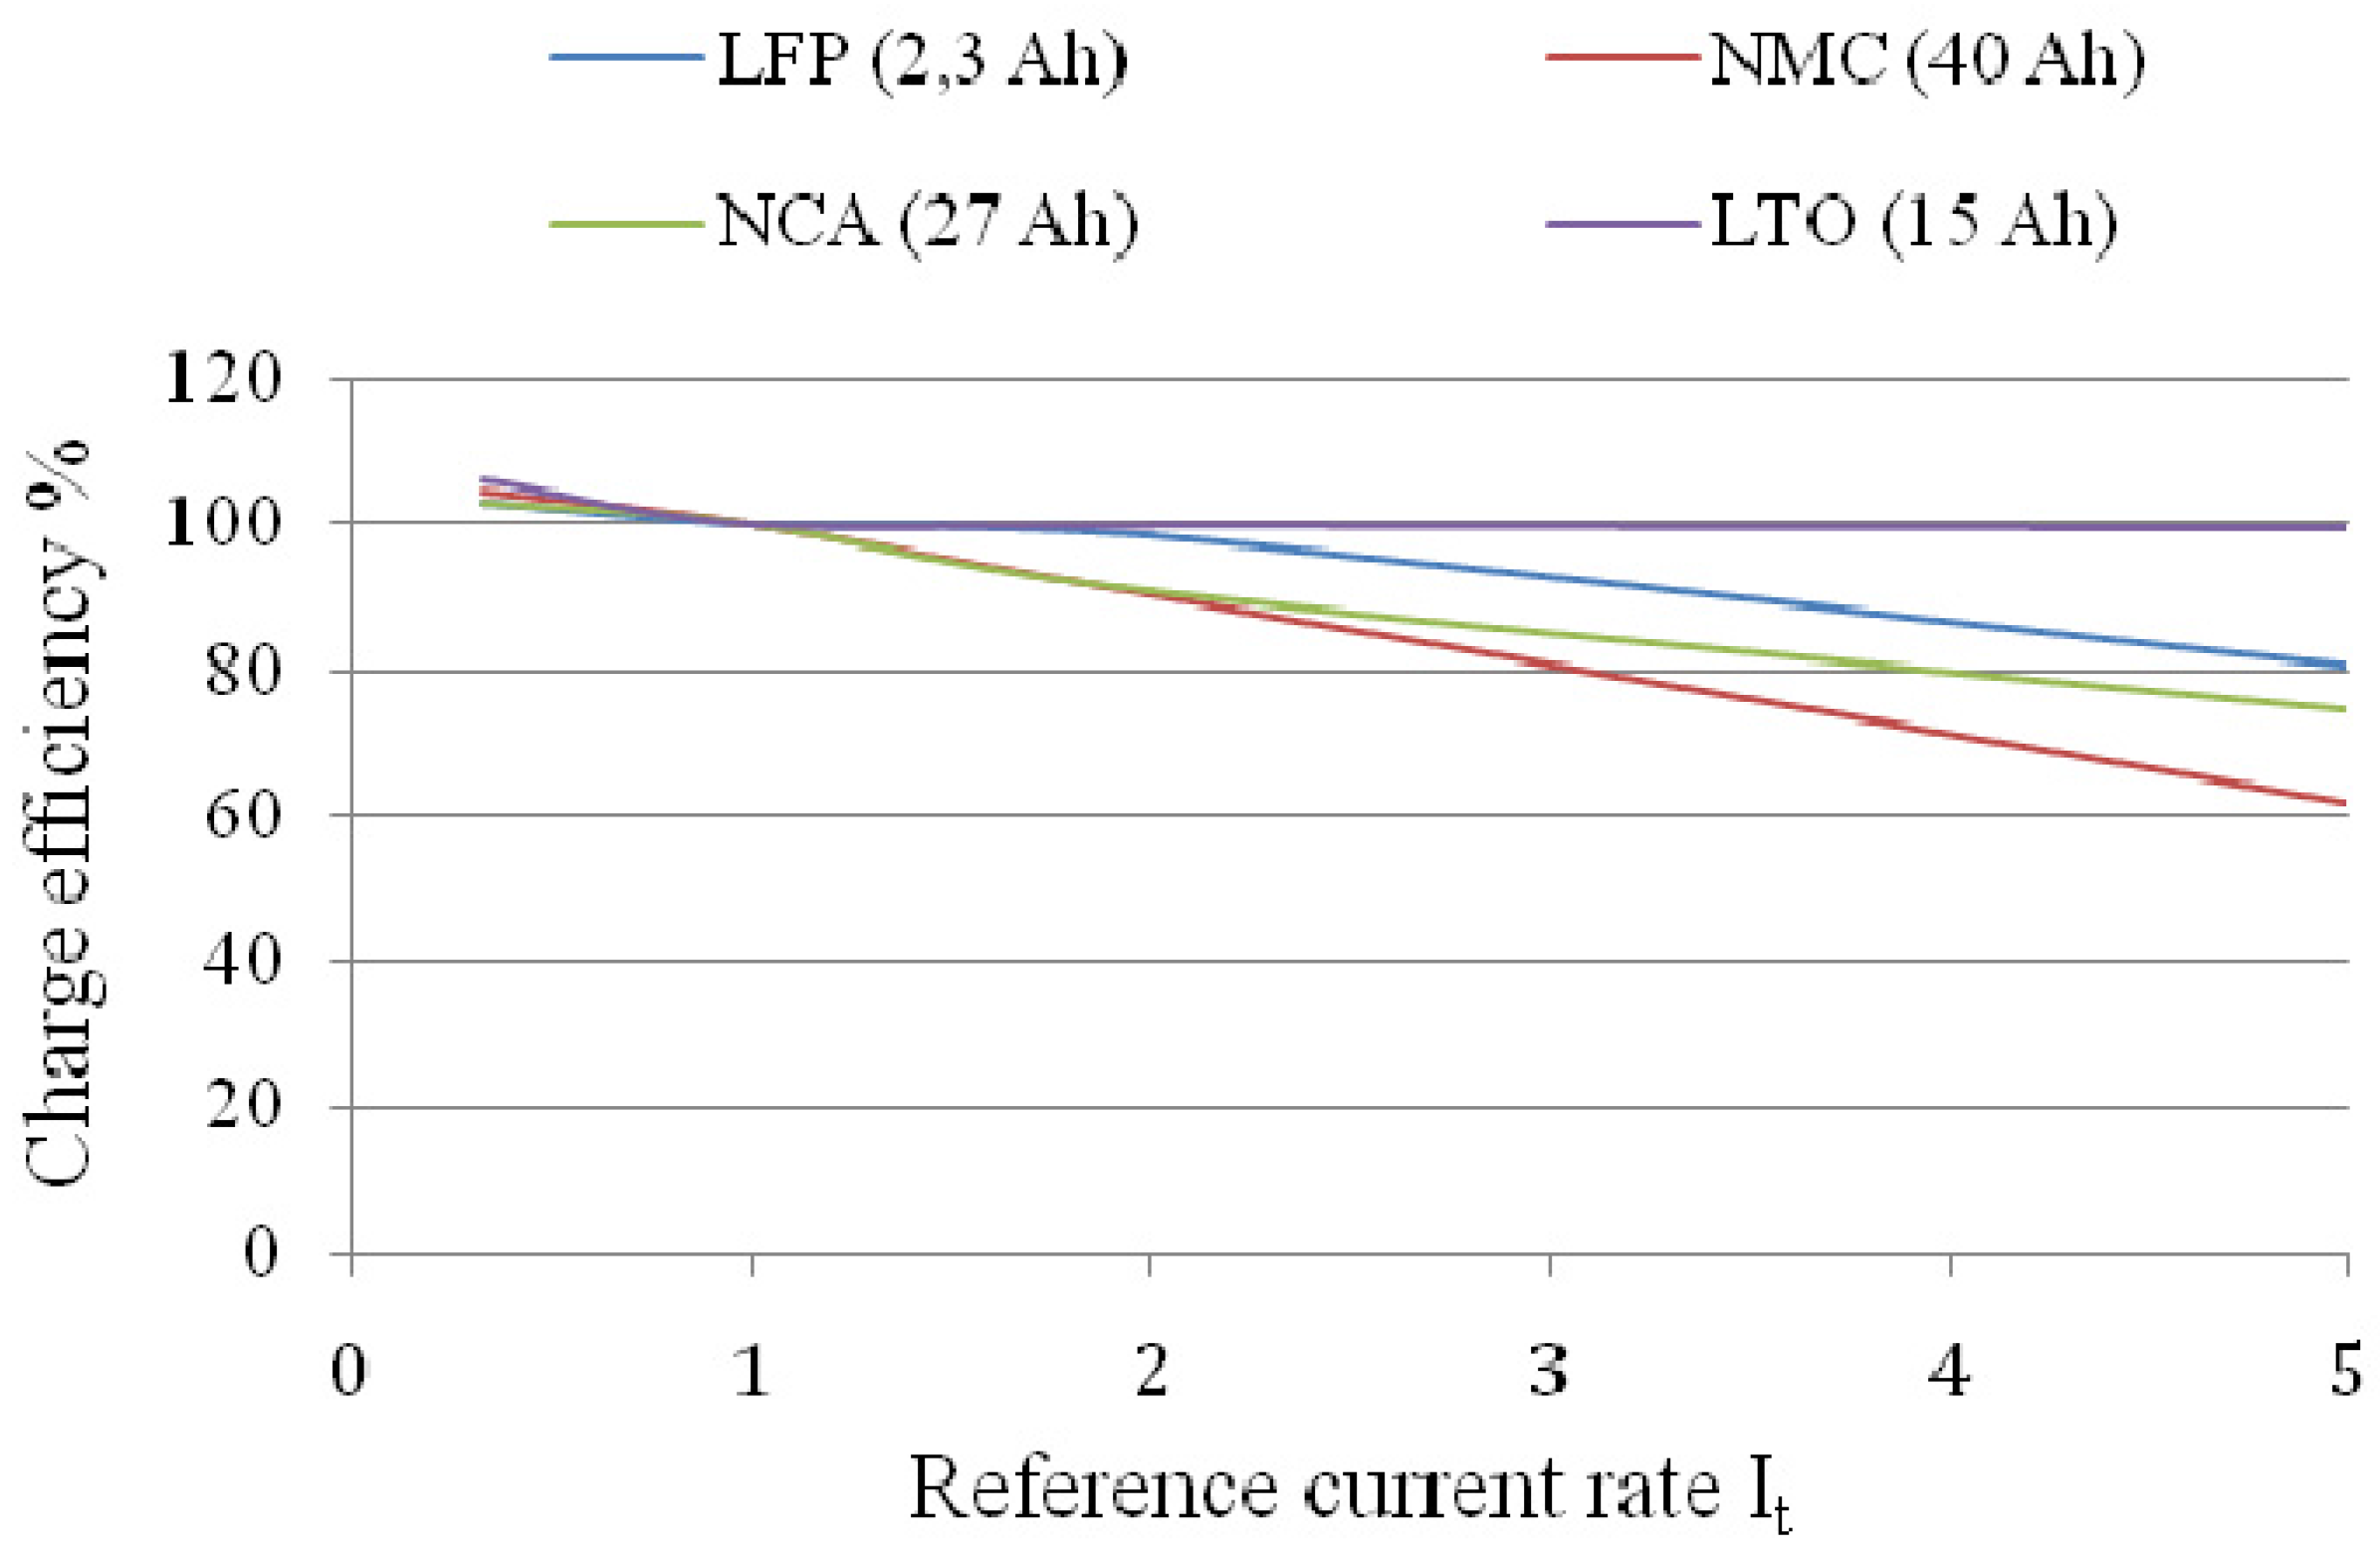
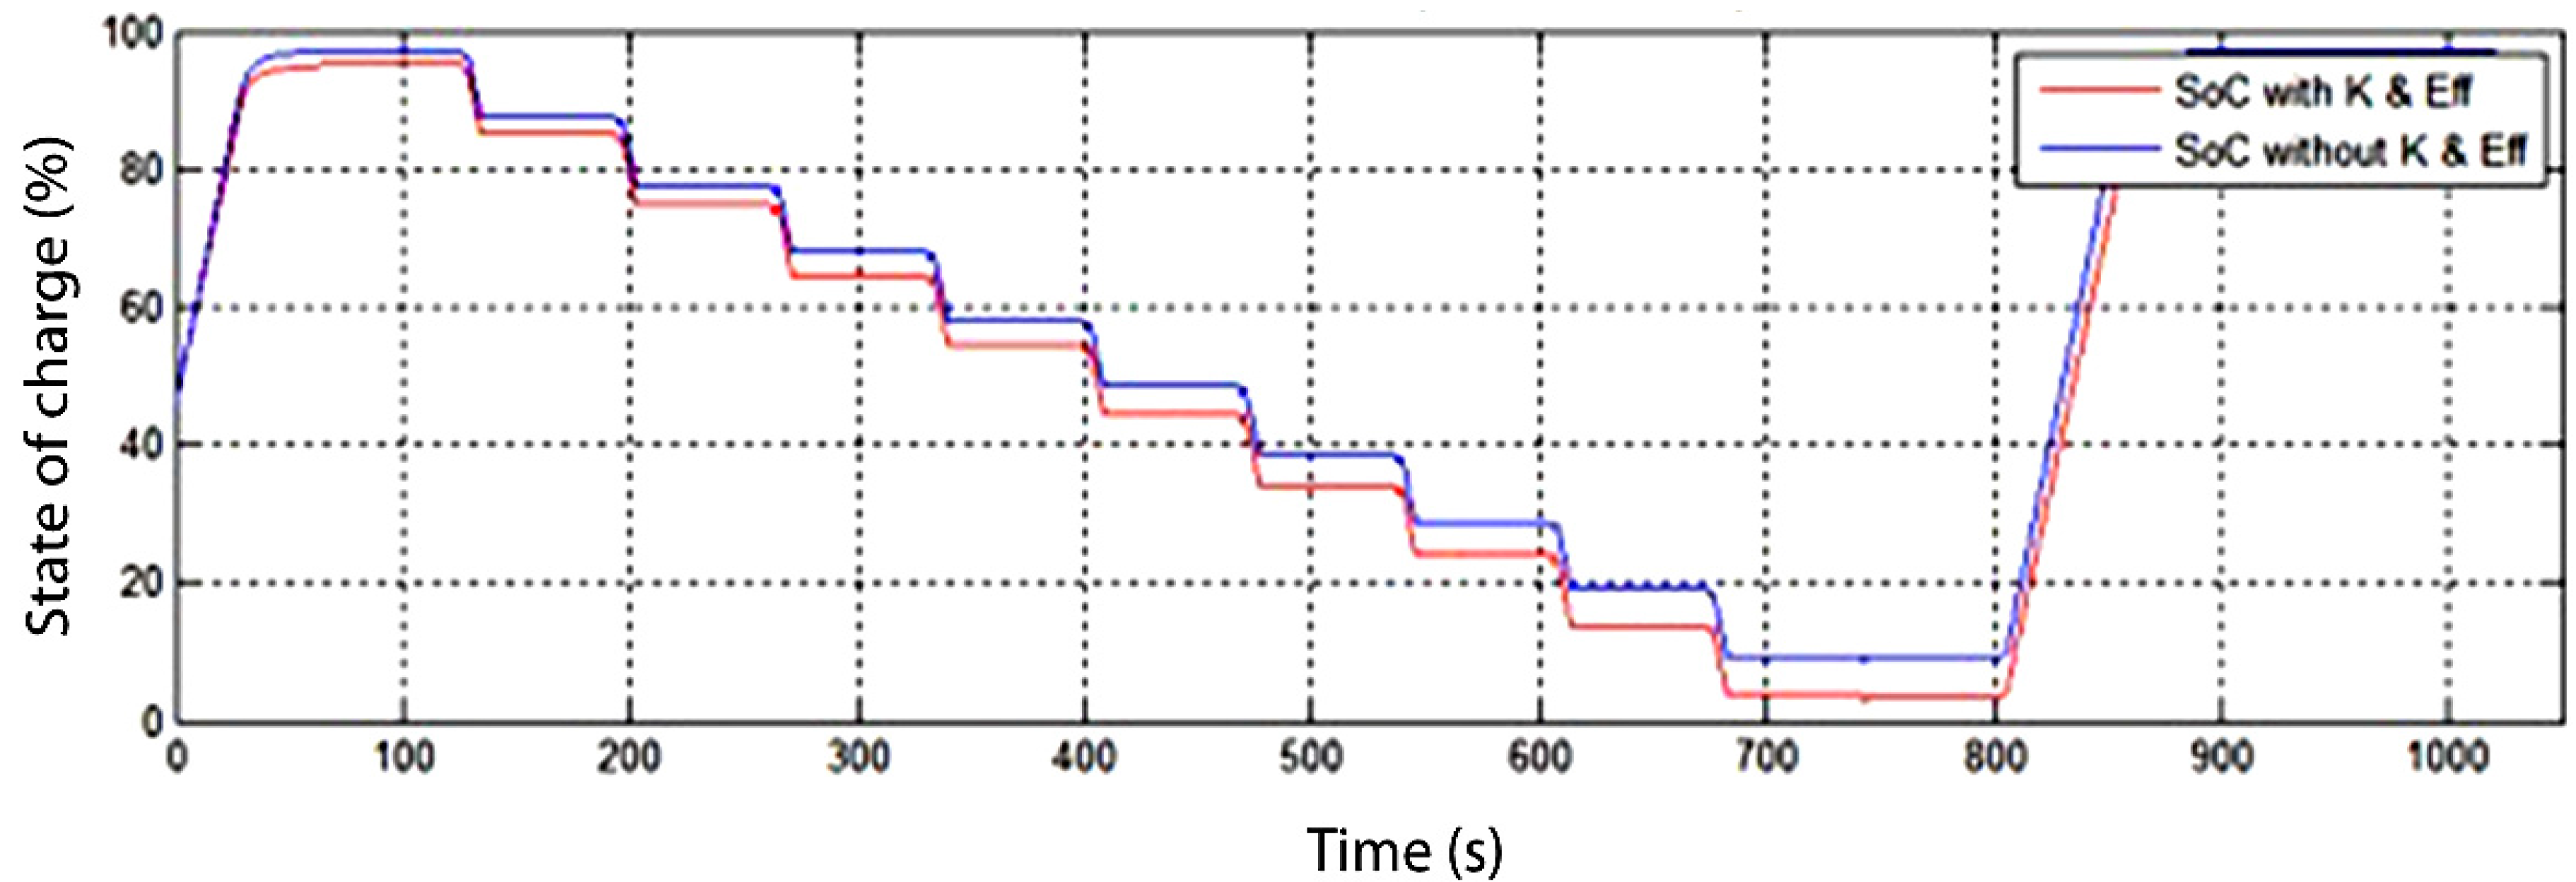
3.4. Energy Efficiency
| Time Increment (s) | Time Cumulative (s) | Current |
|---|---|---|
| 0 | 0 | 0 |
| 12 | 12 | 20It or Imax |
| 40 | 52 | 0 |
| 16 | 68 | −15It or Imax |
| 40 | 108 | 0 |
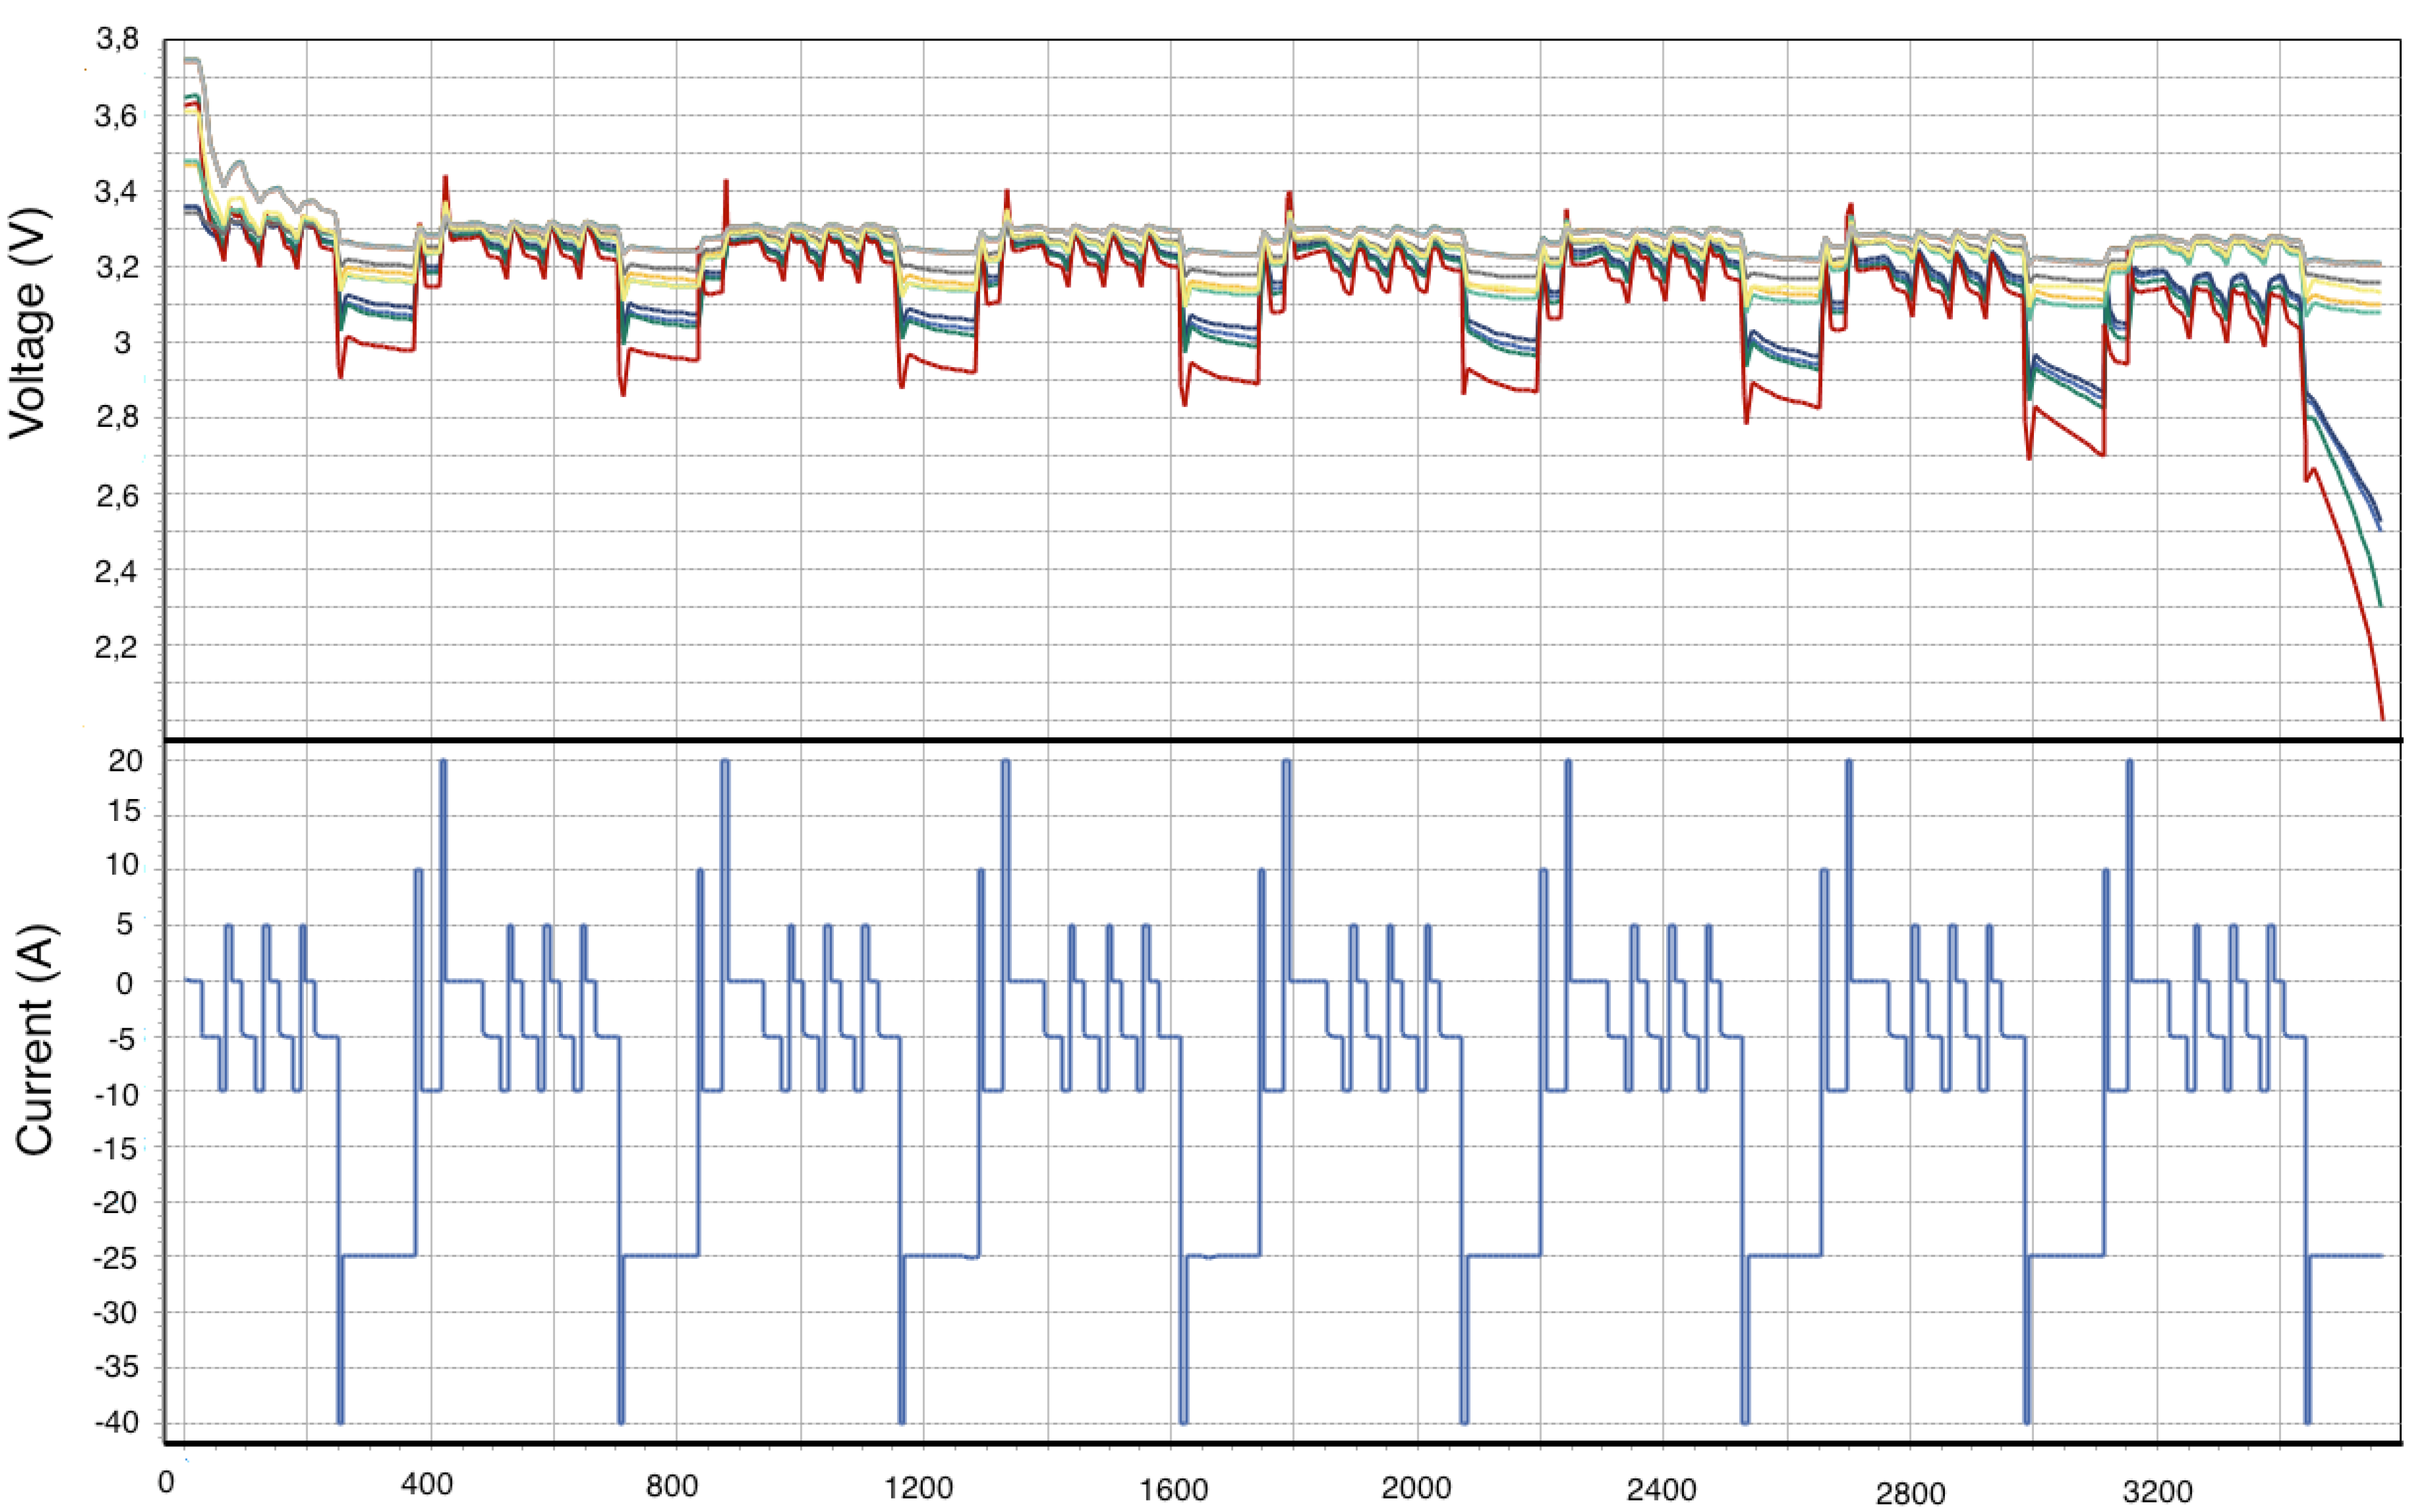
4. Life Cycle Tests
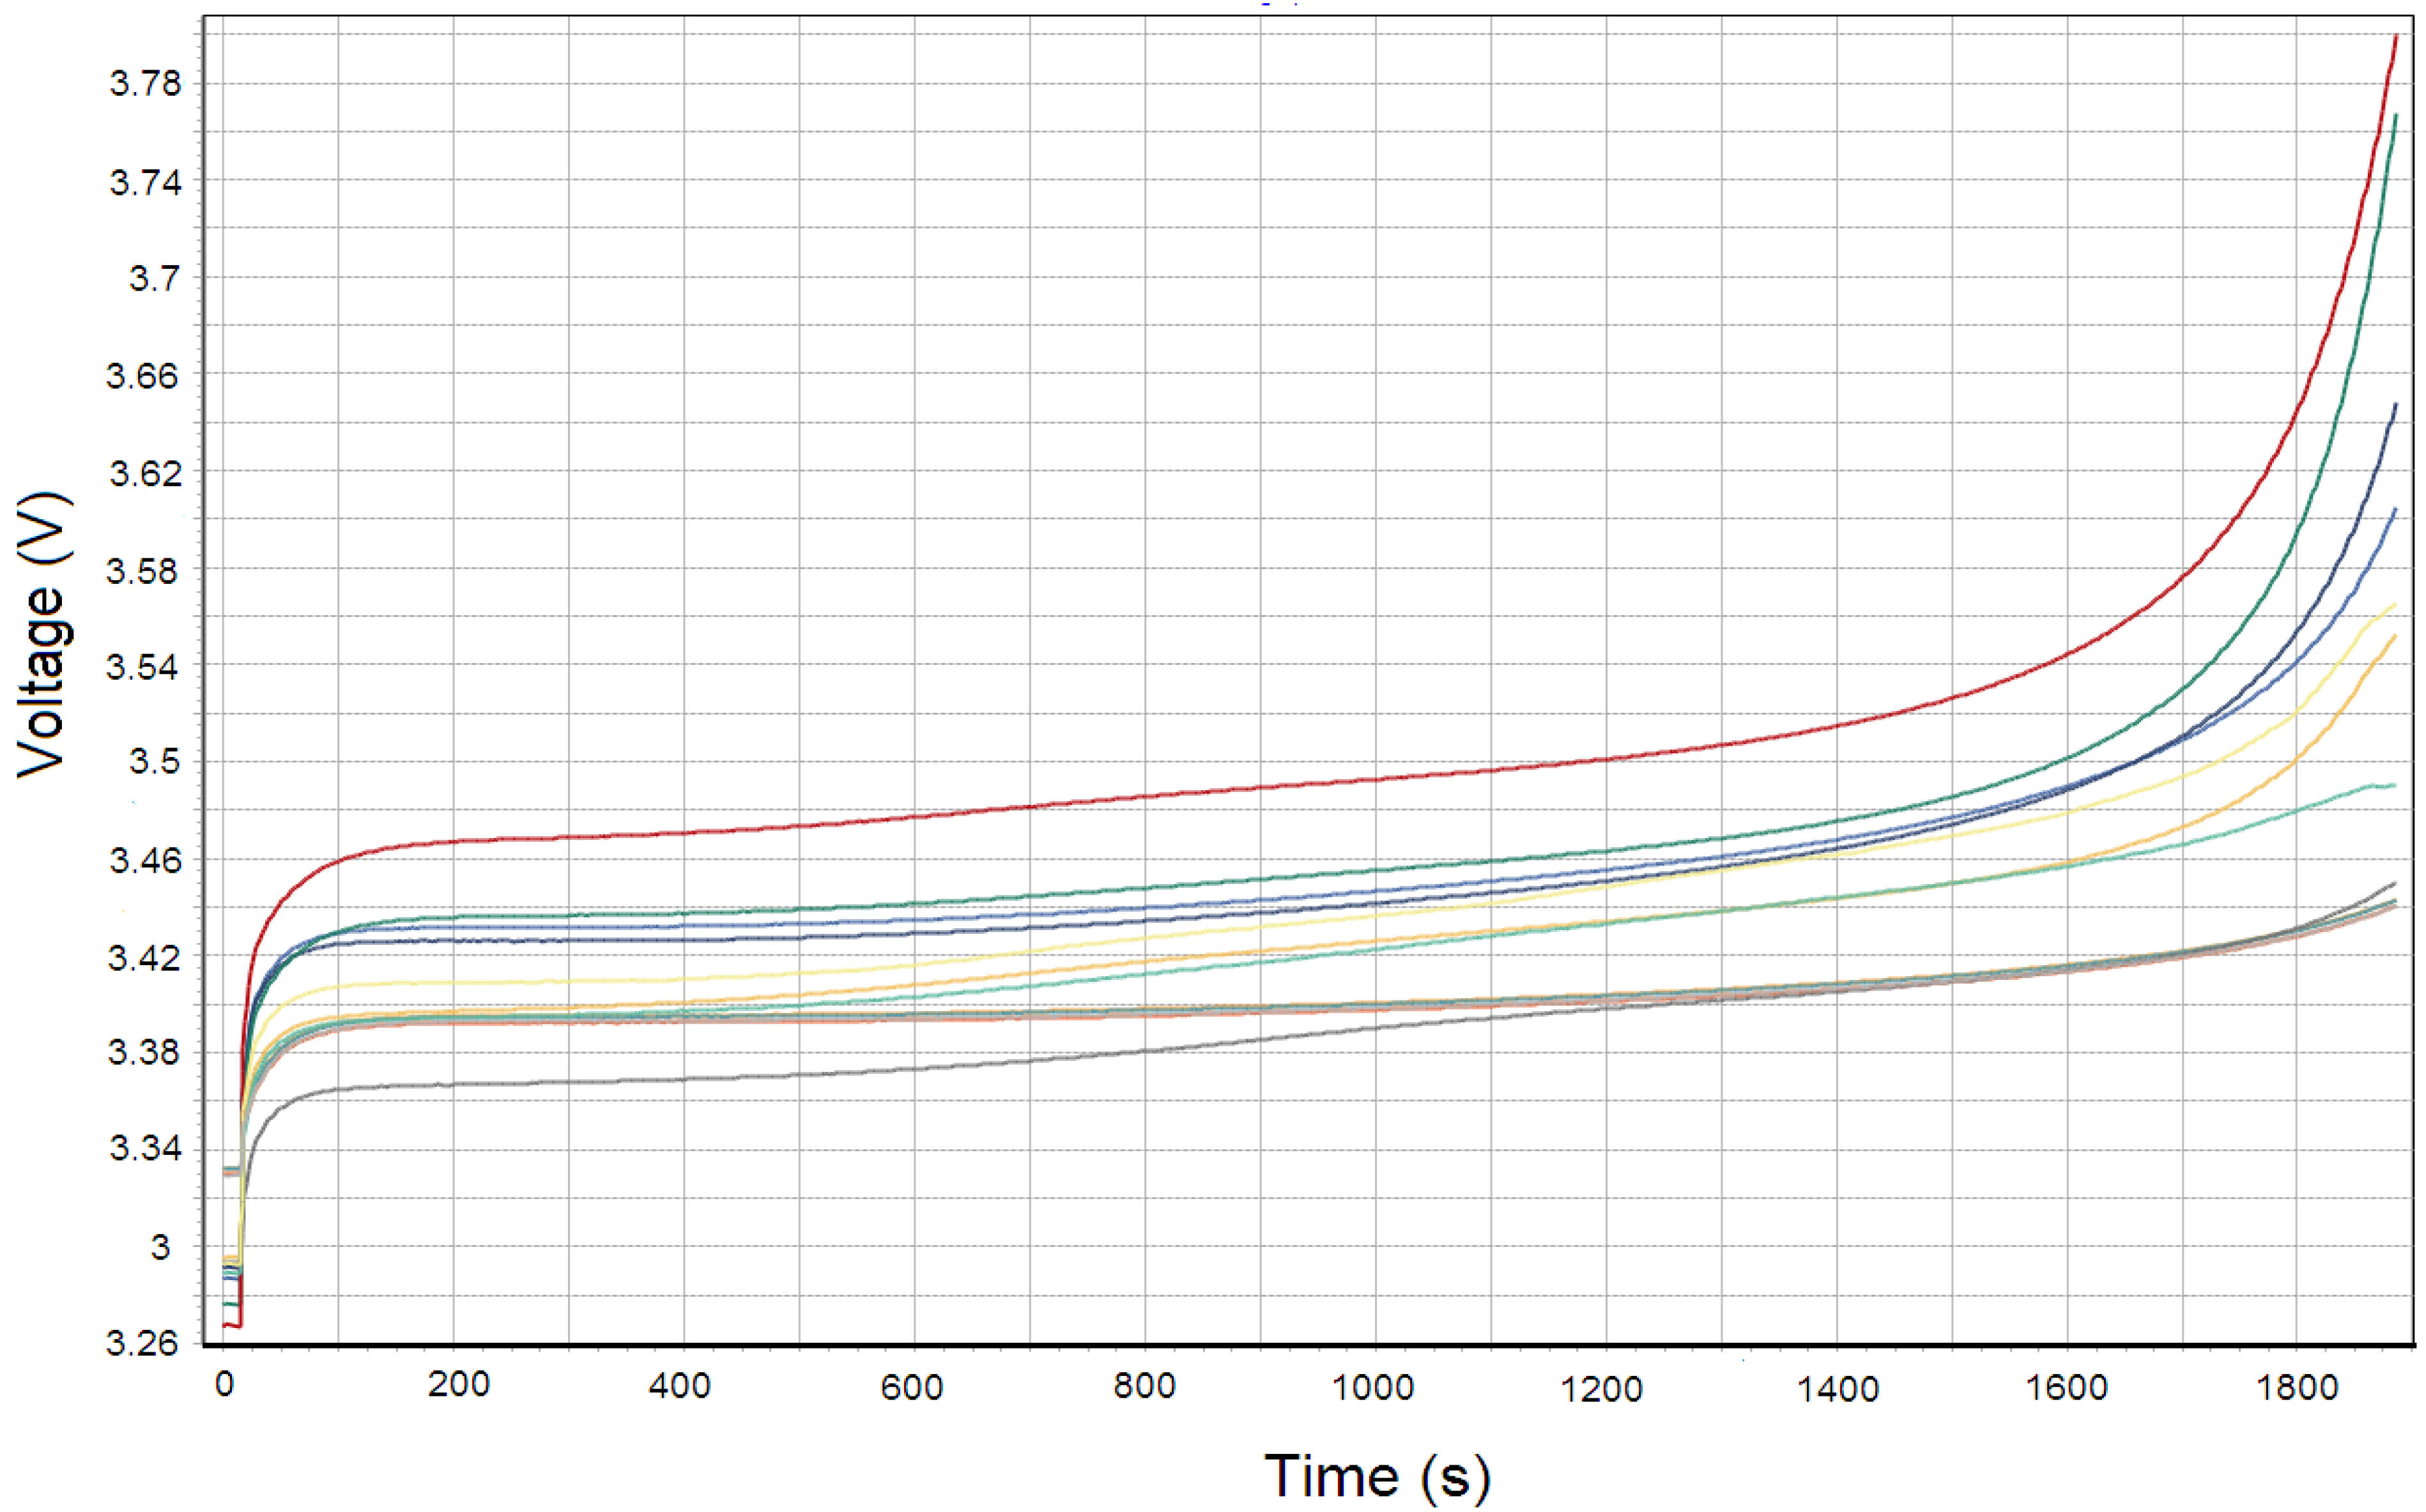
4.1. High Energy


4.2. High Power


| Battery | Capacity (Ah) | 30% SoC, @ 20It | 80% SoC, @ 12.5It |
|---|---|---|---|
| A | 2.3 | YES | NO |
| B | 7 | YES | NO |
| C | 5.7 | NO | NO |
| D | 11 | NO | NO |
| E | 12 | NO | NO |
| F | 10 | NO | NO |
| G | 18 | YES | YES |
5. Conclusions
References
- Emadi, A.; Rajashekara, K.; Williamson, S.S.; Lukic, S.M. Topological overview of hybrid electric and fuel cell vehicular power system architectures and configurations. IEEE Trans. Veh. Technol. 2005, 54, 763–770. [Google Scholar] [CrossRef]
- Cooper, A.; Furakawa, J.; Lam, L.; Kellaway, M. The ultrabattery—A new battery design for a new beginning in hybrid electric vehicle energy storage. J. Power Sources 2009, 188, 642–649. [Google Scholar] [CrossRef]
- Van den Bossche, P.; Vergels, F.; van Mierlo, J.; Matheys, J.; van Autenboer, W. SUBAT: An assessment of sustainable battery technology. J. Power Sources 2005, 162, 913–919. [Google Scholar] [CrossRef]
- Axsen, J.; Burke, A.; Kurani, K. Batteries for Plug-in Hybrid Electric Vehicles (PHEVs): Goals and the State of Technology Circa 2008; Research Report; Institute of Transportation Studies, University of California, Davis: Davis, CA, USA, 2008. [Google Scholar]
- Van Mierlo, J.; Maggetto, G.; van den Bossche, P. Models of energy sources for EV and HEV: Fuel cells, batteries, ultra-capacitors, flywheels and engine-generators. J. Power Sources 2004, 28, 76–89. [Google Scholar]
- Omar, N.; Verbrugge, B.; Mulder, G.; van den Bossche, P.; van Mierlo, J.; Daowd, M.; Dhaens, M.; Pauwels, S. Evaluation of Performance Characterisics of Various Lithium-Ion Batteries for Use in BEV Application. In Proceedings of the IEEE Vehicle Power and Propulsion Conference, Lille, France, 1–3 September, 2010.
- Omar, N.; Daowd, M.; Verbrugge, B.; Mulder, G.; van den Bossche, P.; van Mierlo, J.; Dhaens, M.; Pauwels, S.; Leemans, F. Assessment of Performance Characteristics of Lithium-Ion Batteries for PHEV Vehicles Applications Based on a Newly Test Methodology. In Proceedings of the 25th World Battery, Hybrid and Fuel Cell Electric Vehicle Symposium, Shenzhen, China, 5–9 November 2010.
- Burke, A.F. Batteries and ultracapacitors for electric, hybrid, and fuel cell vehicles. Proc. IEEE 2007, 95, 806–820. [Google Scholar] [CrossRef]
- Burke, A.; Miller, M. Performance Characteristics of Lithium-ion Batteries of Various Chemistries for Plug-in Hybrid Vehicles. In Proceedings of the 24th World Battery, Hybrid and Fuel Cell Electric Vehicle Symposium, Stavanger, Norway, 13–16 May 2009.
- Onda, K.; Ohshima, T.; Nakayama, M.; Fukuda, K.; Araki, T. Thermal behaviour of small lithium-ion battery during rapid charge and discharge cycles. J. Power Sources 2006, 158, 535–542. [Google Scholar] [CrossRef]
- Yu, H.; Zhang, X.; Jalbout, A.F.; Yan, X.; Pan, X.; Xie, H.; Wang, R. High-rate characteristics of novel anode LiTi5O12/polyacene materials for Li-ion secondary batteries. J. Electrochim. Acta 2008, 152, 4200–4204. [Google Scholar] [CrossRef]
- Liaw, B.Y.; Nagasubramanian, G.; Jungst, R.G.; Doughty, D.H. Modeling of lithium ipon cells—A simple equivalent-circuit model approach. J. Solid State Ion. 2004, 175, 835–839. [Google Scholar] [CrossRef]
- Wu, M.; Liu, K.H.; Wang, Y.; Wan, C. Heat dissipation design for lithium-ion batteries. J. Power Sources 2002, 109, 160–166. [Google Scholar] [CrossRef]
- Sawai, K.; Yamato, R.; Ohzuku, T. Impedance measurements on lithium-ion battery consisting of Li[Li1/3]O4 and LiCo1/2Ni1/2O2. J. Electrochim. Acta 2006, 51, 1651–1655. [Google Scholar] [CrossRef]
- Johnson, B.A.; White, R.E. Characterization of commercially available lithium-ion batteries. J. Power Sources 1998, 70, 48–54. [Google Scholar] [CrossRef]
- Meekhun, D.; Boitier, V.; Dilhac, J. Study of the Ambient Temperature Effect on the Characteristics and the Lifetime of Nickel-Metal Hybride Secondary Battery. In Proceedings of the Electrical Power & Energy Conference, Montreal, Canada, 22–23 October 2009.
- Roscher, M.A.; Uwe Sauer, D. Dynamic electric behaviour and open-circuit-voltage modelling of LiFePO4-based lithium ion secondary batteries. J. Power Sources 2011, 196, 331–336. [Google Scholar] [CrossRef]
- Wu, H.; Su, C.; Shieh, D.; Yang, M.; Wu, N. Enhanced high-temperature cycle life of LiFePO4-based Li-ion batteries by vinylene carbonate as electrolyte additive. J. Electrochem. Solid State Lett. 2006, 9, A537–A541. [Google Scholar] [CrossRef]
- Tikhonov, K.; Koch, V.R. Li-Ion Battery Electrolytes Designed for a Wide Temperature Range; Technical Report; Covalent Associates, Inc.: Woburn, MA, USA, 2006. [Google Scholar]
- Andre, D.; Meiler, M.; Steiner, K.; Walz, H.; Soczka-Guth, T.; Uwe Sauer, D. Characterization of high-power lithium-ion batteries by electrochemical impedance spectroscopy. II: Modelling. J. Power Sources 2010, 196, 5334–5341. [Google Scholar] [CrossRef]
- Lee, S.; Kim, J.; Lee, J.; Cho, B.H. State-of-charge and capacity estimation of lithium-ion battery using a new open-circuit voltage versus state-of-charge. J. Power Sources 2008, 185, 1367–1373. [Google Scholar] [CrossRef]
- Dubary, M.; Svoboda, V.; Hwu, R.; Law, B.Y. A roadmap to understand battery performance in electric and hybrid vehicle operation. J. Power Sources 2007, 174, 366–372. [Google Scholar] [CrossRef]
- Hu, Y.; Yurkovich, S.; Guezennec, Y.; Yurkovich, B.J. Electro-thermal battery model identification for automotive applications. J. Power Sources 2011, 196, 449–457. [Google Scholar] [CrossRef]
- Hu, Y.; Yurkovich, S.; Guezennec, Y.; Yurkovich, B.J. A technique for dynamic battery model identification in automotive applications using linear parameter varying structures. J. Control Eng. Pract. 2009, 17, 1190–1201. [Google Scholar] [CrossRef]
- Thele, M.; Bohlen, O.; Uwe Sauer, D.; Karden, E. Development of a voltage-behavior model for NiMH batteries using an impedance-based modelling concept. J. Power Sources 2008, 175, 635–643. [Google Scholar] [CrossRef]
- ISO 12405-1: Electrically propelled road vehicles—Test specification for lithium-ion traction battery packs and systems—Part 1: High power applications. 2011. Available online: http://www.iso.org/iso/catalogue_detail?csnumber=51414 (accessed on 18 January 2012).
- ISO 12405-2: Electrically propelled road vehicles—Test specification for lithium-ion traction battery packs and systems—Part 2: High energy applications. 2011. Available online: http://www.iso.org/iso/catalogue_detail?csnumber=55854 (accessed on 18 January 2012).
- IEC 62660-1: Electrically propelled road vehicles—Test specification for lithium-ion traction battery packs and systems—Part 1: High power applications. 2011. Available online: http://webstore.iec.ch/Webstore/webstore.nsf/Artnum_PK/44728 (accessed on 18 January 2012).
- IEC 62660-2: Secondary batteries for the propulsion of electric road vehicles—Part 2: Reliability and abuse testing for lithium-ion cells. 2011. Available online: http://webstore.iec.ch/Webstore/webstore.nsf/Artnum_PK/44727 (accessed on 18 January 2012).
- IEC 61982-2: Part 2: Dynamic discharge performance test and dynamic endurance test. August 2002. Available online: http://webstore.iec.ch/webstore/webstore.nsf/Artnum_PK/29145 (accessed on 18 January 2012).
- IEC 61434: Secondary cells and batteries containing alkaline or other non-acid electrolytes—Guide to designation of current in alkaline secondary cell and battery standards. 1996. Available online: http://webstore.iec.ch/webstore/webstore.nsf/Artnum_PK/21274 (accessed on 18 January 2012).
- Van den Bossche, P.; Verbrugge, B.; Omar, N.; van Mierlo, J. The Electric Vehicles charged by the Grid: Voltage and Power Levels. In Proceedings of the Plug-In Hybrids and Electric Vehicles (PHEV-09), Montreal, Canada, 28–30 September 2009.
- FreedomCAR Battery Test Manual for Power Assist Hybrid Electric Vehicles; U.S. Department of Energy: Washington, DC, USA, 2003.
- Kharkats, Y.I.; Sokirko, A.V.; Bark, F.H. Properties of polarization curves for electrochemical cells described by Butler-Volmer kinetics and arbitrary values of the transfer coefficient. Electrochimica Acta 1995, 40, 247–252. [Google Scholar] [CrossRef]
© 2012 by the authors; licensee MDPI, Basel, Switzerland. This article is an open access article distributed under the terms and conditions of the Creative Commons Attribution license (http://creativecommons.org/licenses/by/3.0/).
Share and Cite
Omar, N.; Daowd, M.; Hegazy, O.; Mulder, G.; Timmermans, J.-M.; Coosemans, T.; Van den Bossche, P.; Van Mierlo, J. Standardization Work for BEV and HEV Applications: Critical Appraisal of Recent Traction Battery Documents. Energies 2012, 5, 138-156. https://doi.org/10.3390/en5010138
Omar N, Daowd M, Hegazy O, Mulder G, Timmermans J-M, Coosemans T, Van den Bossche P, Van Mierlo J. Standardization Work for BEV and HEV Applications: Critical Appraisal of Recent Traction Battery Documents. Energies. 2012; 5(1):138-156. https://doi.org/10.3390/en5010138
Chicago/Turabian StyleOmar, Noshin, Mohamed Daowd, Omar Hegazy, Grietus Mulder, Jean-Marc Timmermans, Thierry Coosemans, Peter Van den Bossche, and Joeri Van Mierlo. 2012. "Standardization Work for BEV and HEV Applications: Critical Appraisal of Recent Traction Battery Documents" Energies 5, no. 1: 138-156. https://doi.org/10.3390/en5010138