Development and Evaluation of an Economic-Driving Assistance Program for Transit Vehicles
Abstract
:1. Introduction
- (1)
- Minimize fuel consumption of transit vehicles while improving the level of service of transit systems;
- (2)
- Capture explicitly the dynamic interaction between bus speed, bus holding time, bus dwell time and signal timings at downstream intersections; and
- (3)
- Optimize bus holding times and recommend bus speed dynamically with respect to real time signal status and bus arrivals.
2. Basic Concept and Framework of EDTV

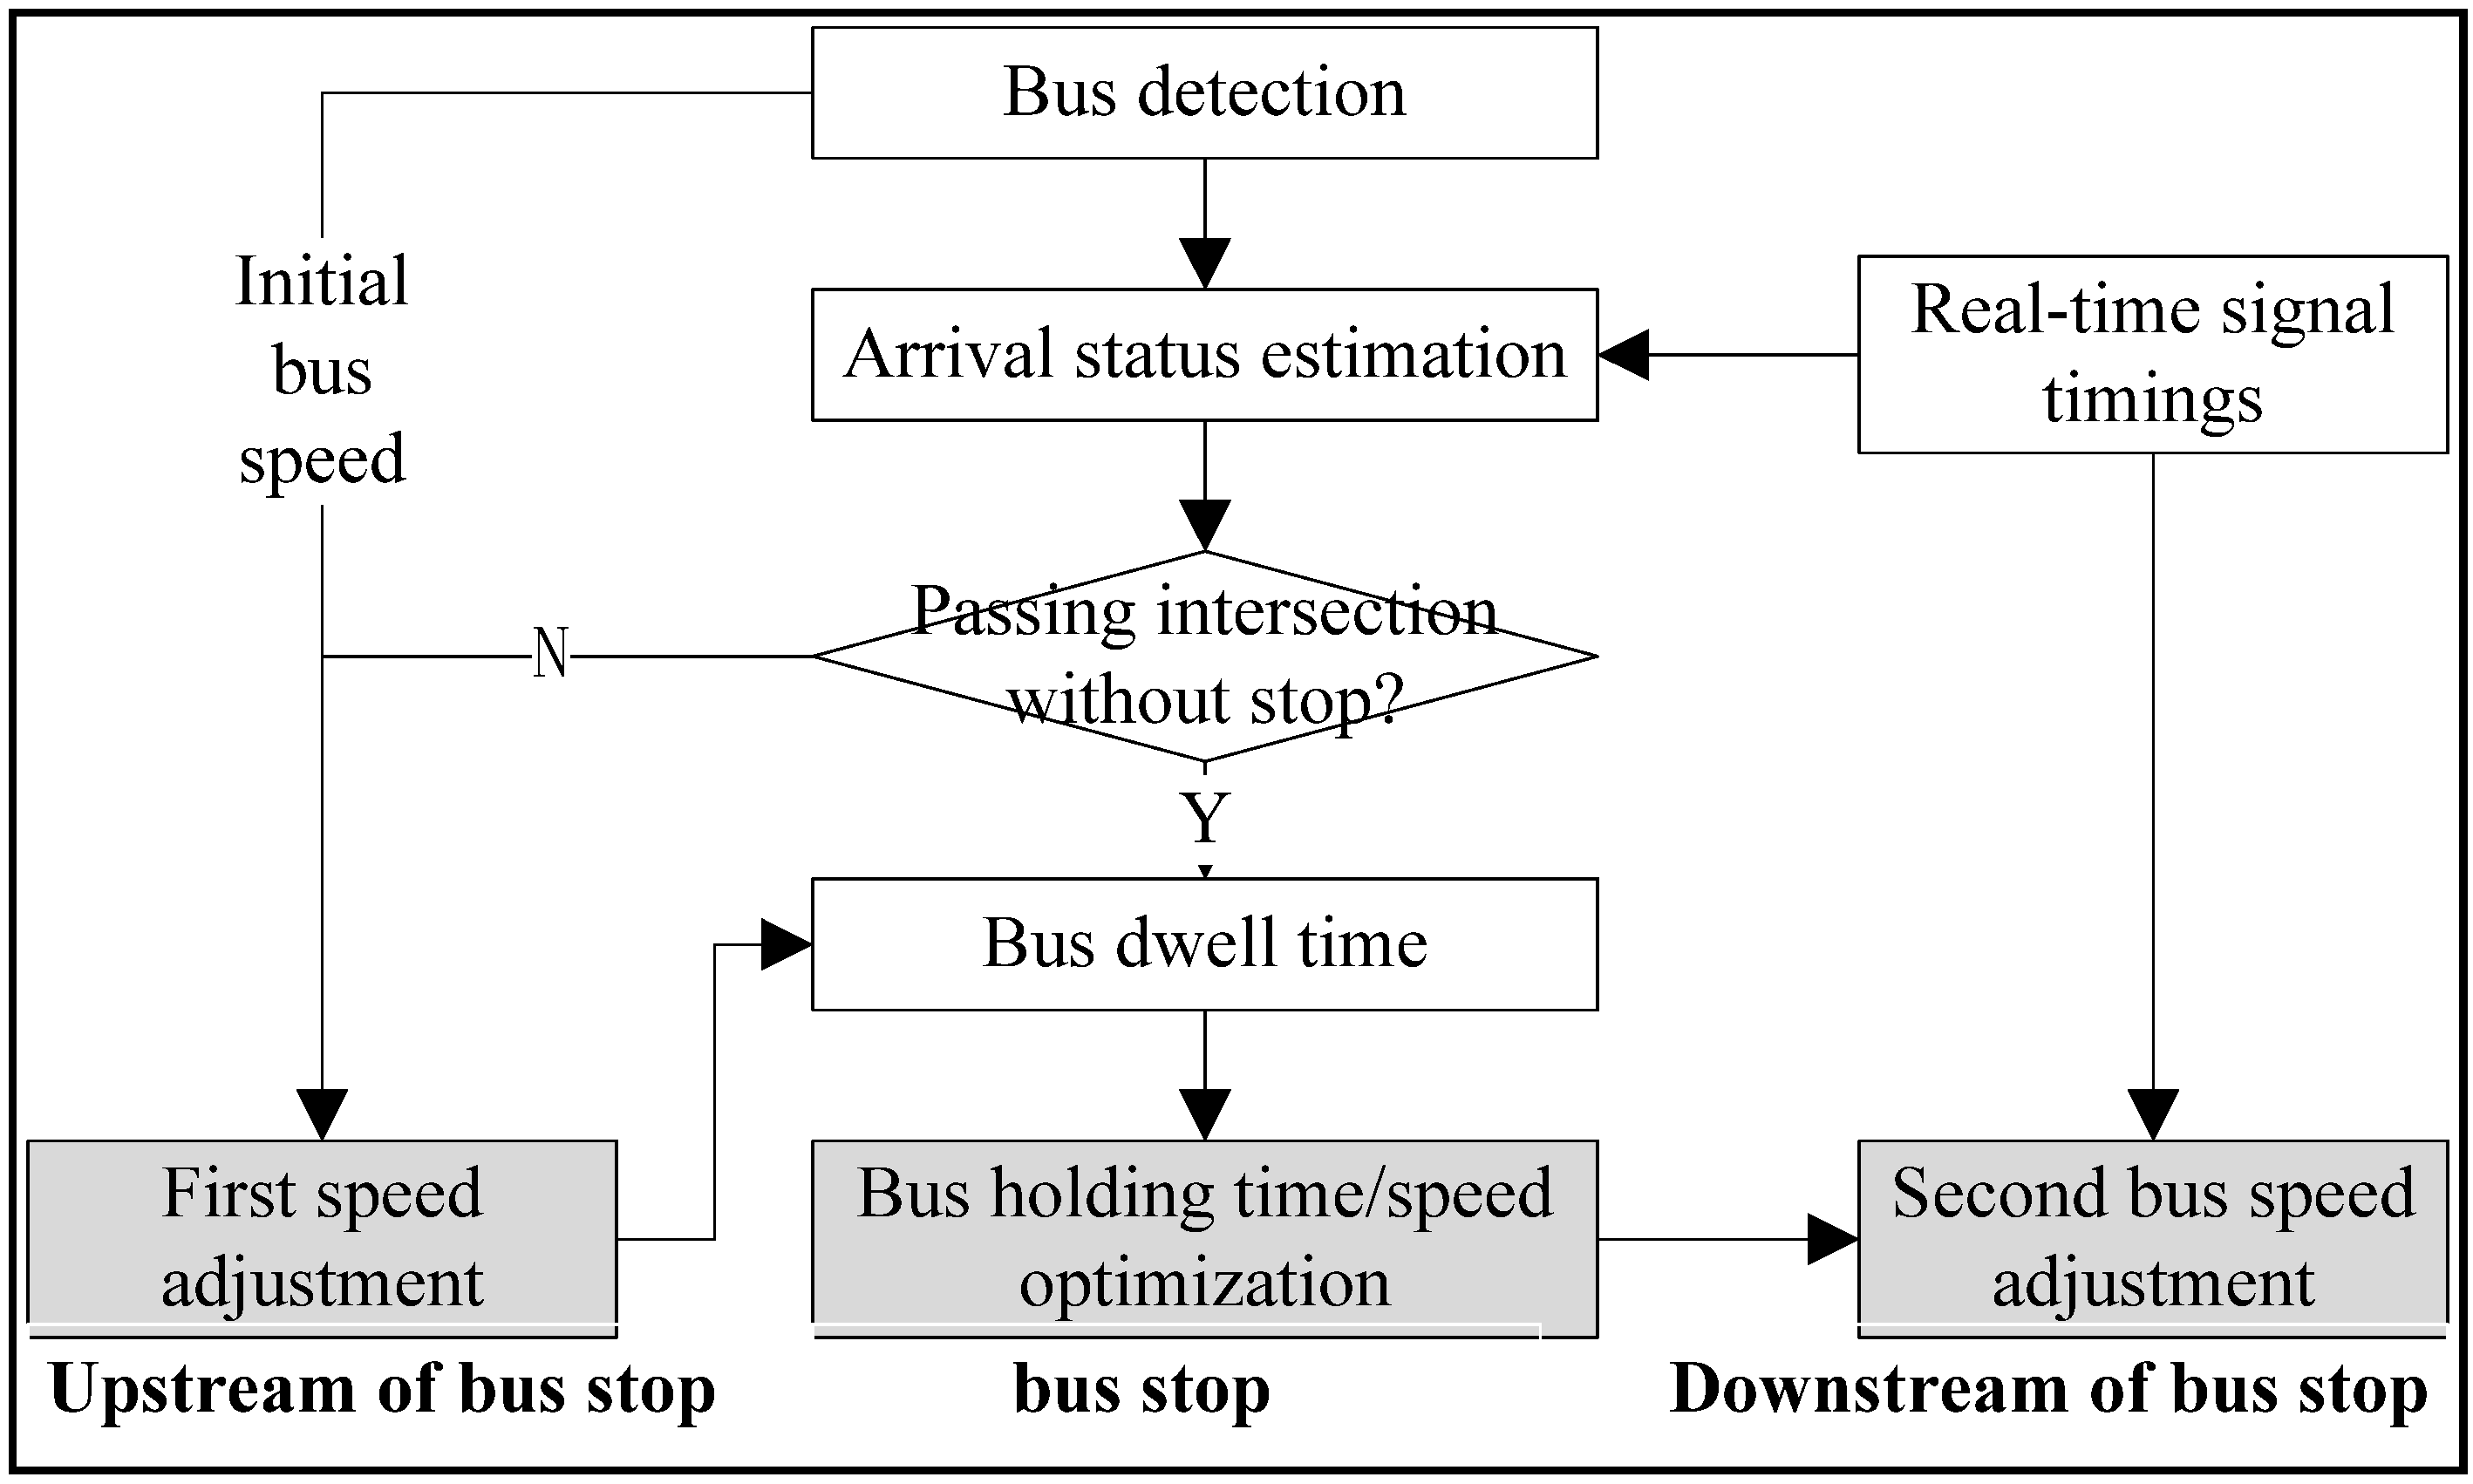
- (1)
- First speed adjustment: generate the first recommended speed which can be used by a detected bus to travel the distance between bus detector location and the bus stop.
- (2)
- Holding time/speed optimization: provide a recommended holding time at the bus stop after the bus door has closed and a recommended speed for a bus traveling the distance between the bus stop and the stop line at a downstream intersection.
- (3)
- Second speed adjustment: monitoring changes of real-time signal timings and bus speed, and generating real-time recommended bus speeds.
3. Optimization Methods for Adjustment of Bus Speed and Holding Time
3.1. Assumptions
- (1)
- The bus detection and communication system can provide real-time two-way communications between buses and traffic controllers and support the real time optimization of bus speed and transit signal priority; and
- (2)
- There is an exclusive bus lane in the studied approaches, and all buses will accept the recommended speed and holding time immediately and accurately.
3.2. Notations
| ν0 | The current real time bus speed (m/s) |
| νmax | The maximum allowed bus speed (m/s) |
| νmin | The minimum allowed bus speed (m/s) |
| T0 | The time when bus reaches the intersection with current speed (s) |
| C | The cycle length (s) |
| gs | The starting time of bus phase (s) |
| ge | The ending time of bus phase (s) |
| The starting time of bus-arriving-window (s) | |
| The ending time of bus-arriving-window (s) | |
| L | The length of distance between bus detector and bus stop (m) |
| L’ | The length of distance between bus stop and the stop line (m) |
| α | Time headway for safety parking (s) |
| ν | The recommended speed for the bus at upstream of bus stop (m/s) |
| ν’ | The recommended speed for the bus at downstream of bus stop (m/s) |
| ν* | The real-time bus speed (m/s) |
| h | Bus holding time at bus stop (s) |
| hmax | Maximum bus holding time at bus stop (s) |
| n | Positive integer, number of cycles |
3.3. Logic 1: First Speed Adjustment Logic
- Logic 1.1: If there is no preceding bus, go to Logic 2 directly.
- Logic 1.2: Average bus dwell time is used to calculate bus arrival time at the downstream intersection, and bus holding time at the bus stop is assumed equal to 0;
- Logic 1.3: If the arrival time of the preceding bus is earlier than the planned arrival time of the current bus, the preceding bus has no impact on the current bus and goes to Logic 1.5, otherwise, goes to logic 1.4.
- Logic 1.4: If the arrival time of the preceding bus is later than the planned arrival time of the preceding bus, the passing time of the current bus is related with that of the preceding bus and it is of no use to adjust the current bus speed, then, goes to Logic 2.
- Logic 1.5: In order to minimize bus travel time, if the current bus can arrive at the stop line within the green time of a bus signal at a higher speed value within the allowed speed range, the highest feasible speed can be selected. Therefore the recommend bus speed can be computed with the following equation, and goes to Subset 2; otherwise, goes to Logic 1.6.
- Logic 1.6: If the arrival time of the bus driving with the current speed is within the range of the green time of the bus phase, the current bus speed should not be changed, goes to Logic 2;
- Logic 1.7: If the slowest bus arriving time (traveling with the slowest speed) is within the bus green time, the recommended speed can be computed with the following equation; otherwise, the bus cannot pass the intersection by changing speed, and the recommended speed is set to equal the current bus speed.
3.4. Logic 2: Integrated Optimization of Bus Holding Time and Bus Speed
- Logic 2.1: Estimate the arrival time of the bus at the stop line with the speed recommended by Logic 1 under no holding situation. The holding time should be as short as possible to decrease bus travel time. Therefore, if the bus arrives at intersection during the green time, the original recommended speed should be adopted as recommended speed again, the holding time is equal to 0; otherwise, goes to Logic 2.2;ν′ = νh = 0
- Logic 2.2: If the bus can arrives at an intersection with the highest speed during green time, the highest speed should be adopted as the recommended speed to minimize bus travel time, the holding time is equal to 0 accordingly;ν′ = νmaxh = 0
- Logic 2.3: If the bus can arrive at an intersection with the lowest speed during green time, there is no need to hold the bus at the bus stop to avoid potential confusion of passengers. The recommended speed should be the highest speed with which bus can pass the intersection without stopping. Therefore, the bus speed can be calculated by Equation (7), and holding time should be 0 as shown in Equation (8).v'=L/(nC−T0 + ge)
- Logic 2.4: Let t represent the signal status which is the length of passing red time of bus signals when a bus arrives at the stop line using the lowest speed. If t < hmax, it means the bus can pass the intersection without stopping by adjustment of holding time. In order to minimize holding time, the recommended speed should be the minimum speed and the holding time can be calculated based on the recommended speed as shown in Equation (10). Otherwise, it means bus still has to stop at the intersection even if the maximum holding time is used, goes to Logic 2.5.
- Logic 2.5: The bus cannot avoid stopping again at the downstream intersection by adjust holding time and speed, therefore, the holding time and speed can be can be calculated by the following equations:
3.5. Logic 3: Second Speed Adjustment
- Logic 3.1: If v* is not equal with v’, and bus can pass the stop line without stopping according to Logic 2, the v* should be updated by the following equation:
- Logic 3.1: If a bus has to stop at the stop line according to Logic 2, there is no need to monitor the value of v*.
4. Evaluation and Analysis
4.1. Experiment Design

4.2. Experimental Results and Analyses
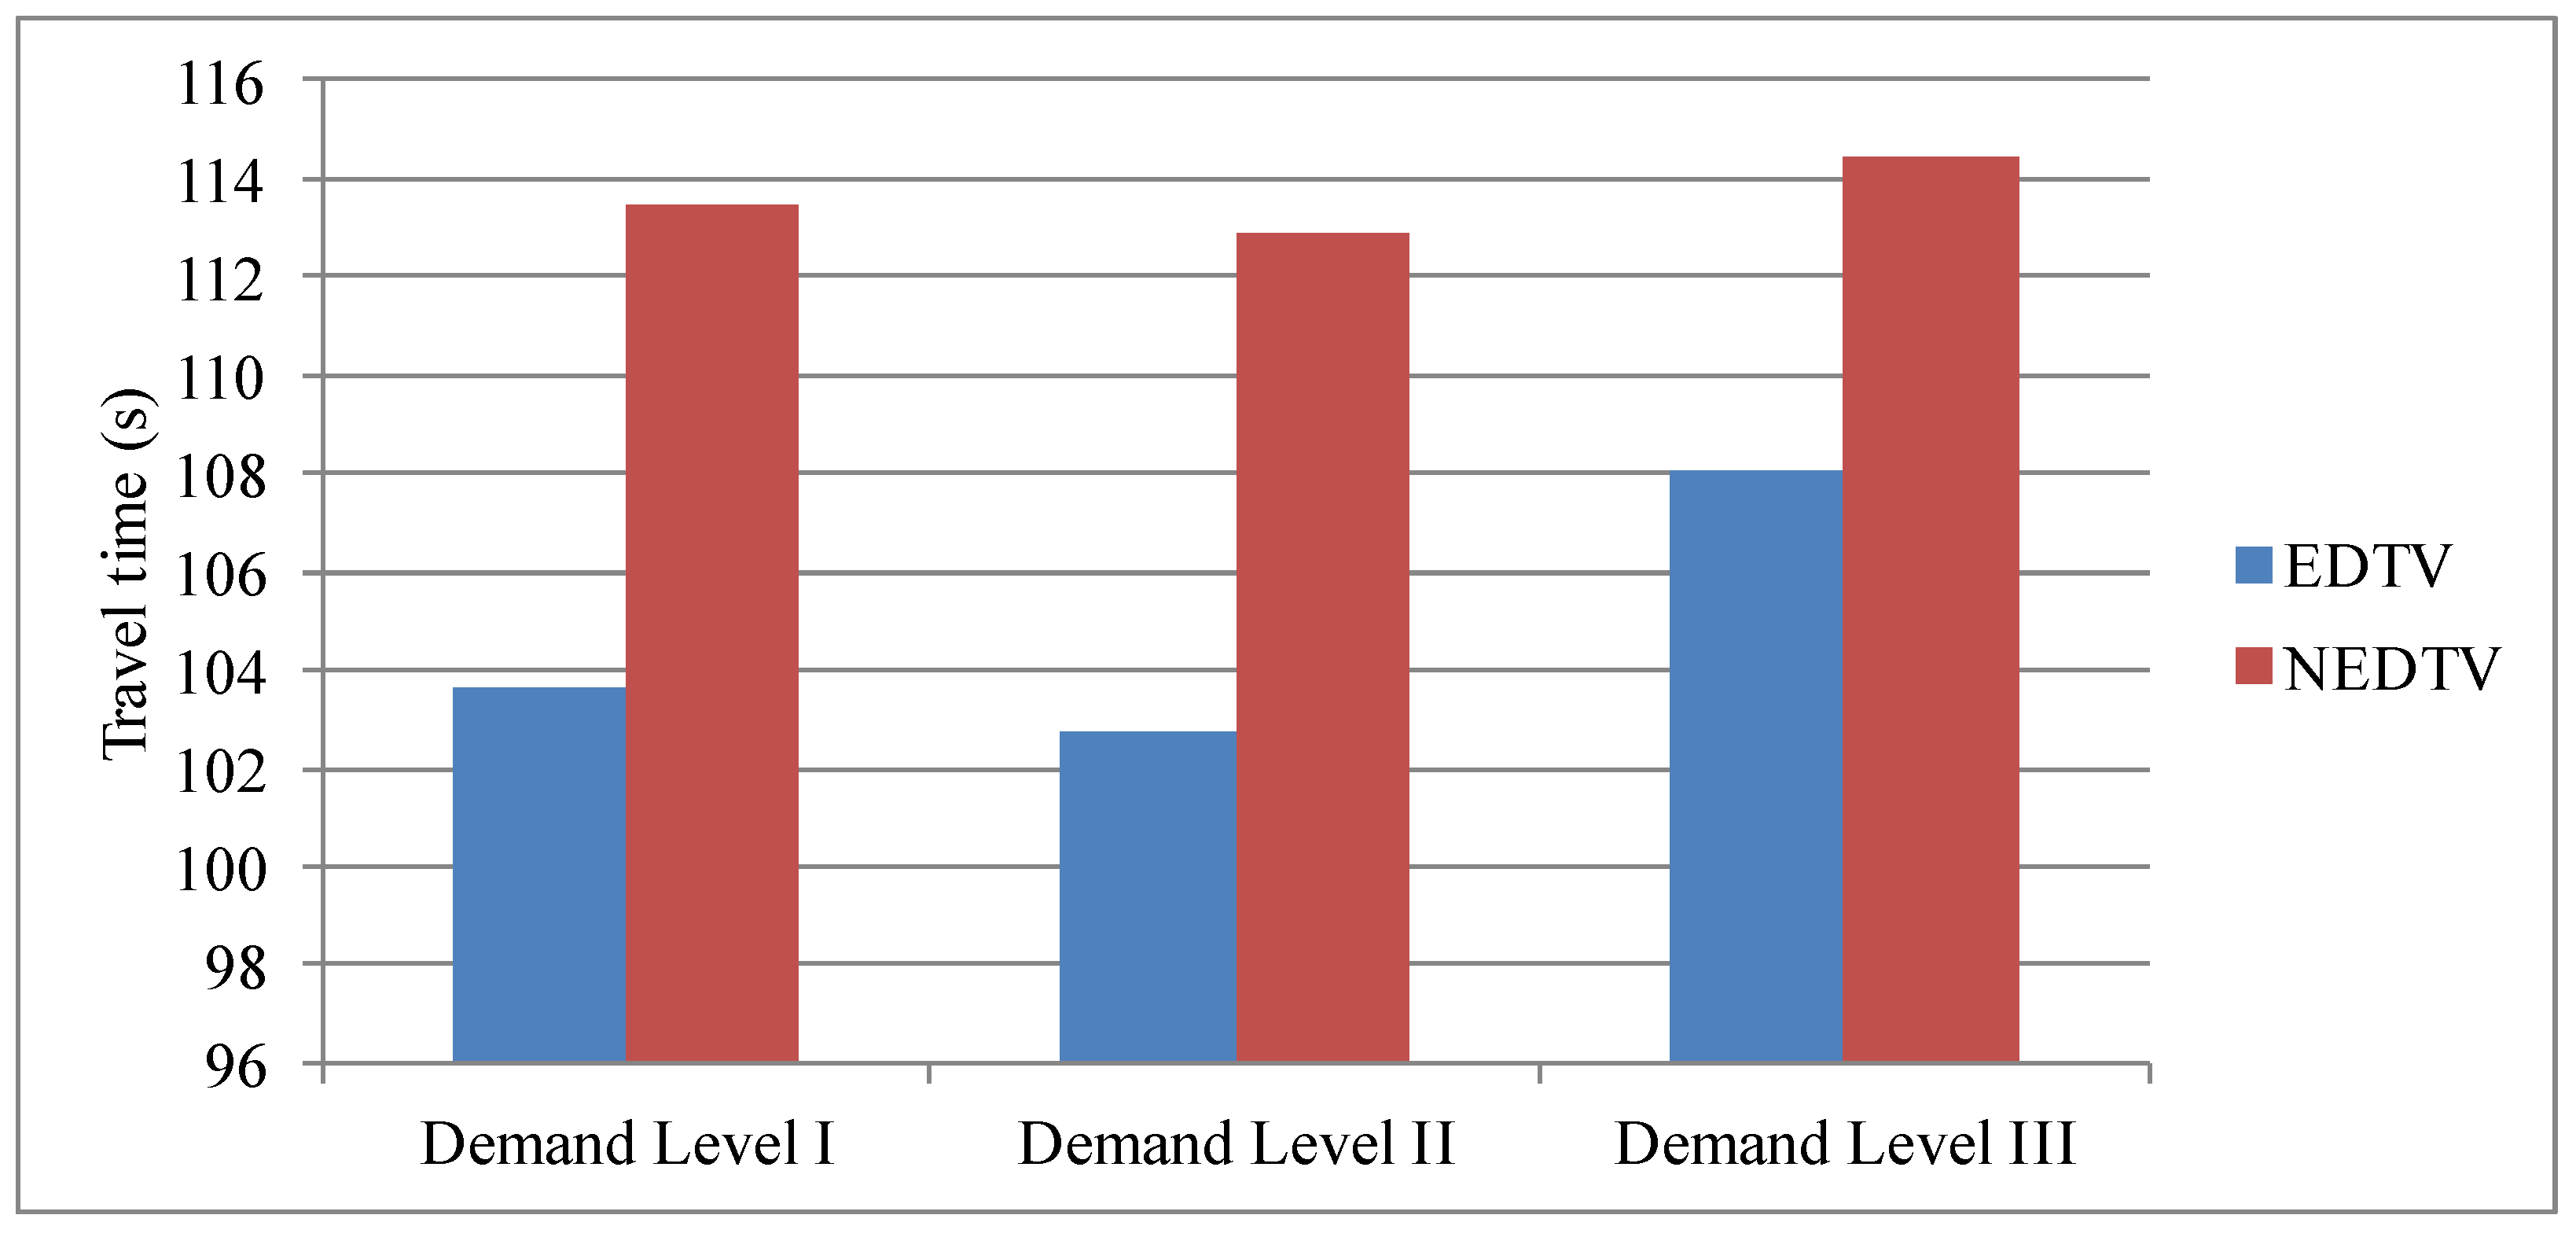
- No EDTV (NEDTV): implements fixed signal timing plans optimized offline using Synchro 6 without EDTV.
- EDTV: implements the same signal plans as the No EDTV scenario, and recommended bus speed, and holding time generated by the proposed EDTV method.
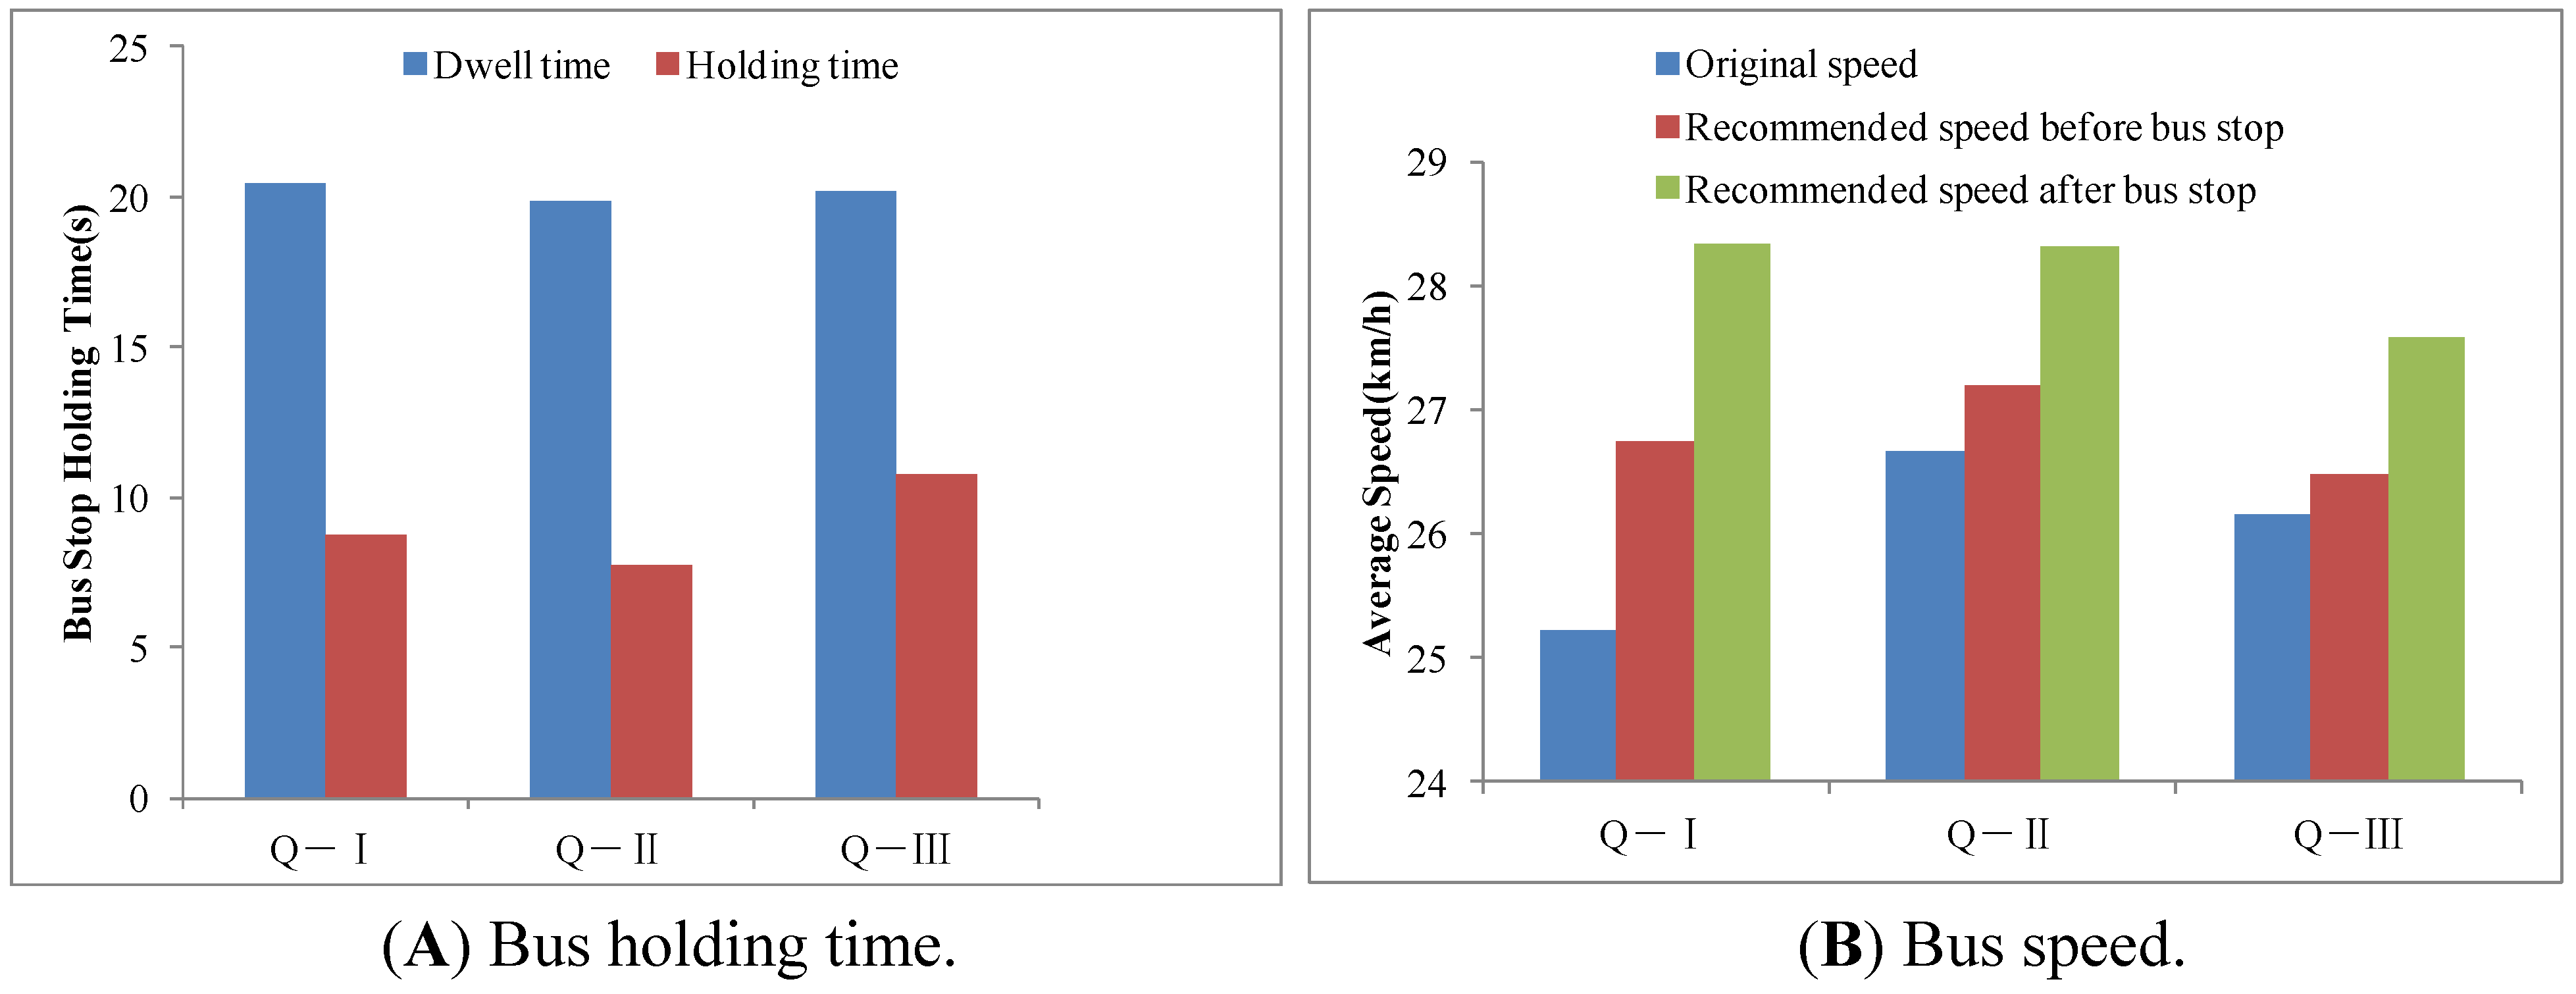
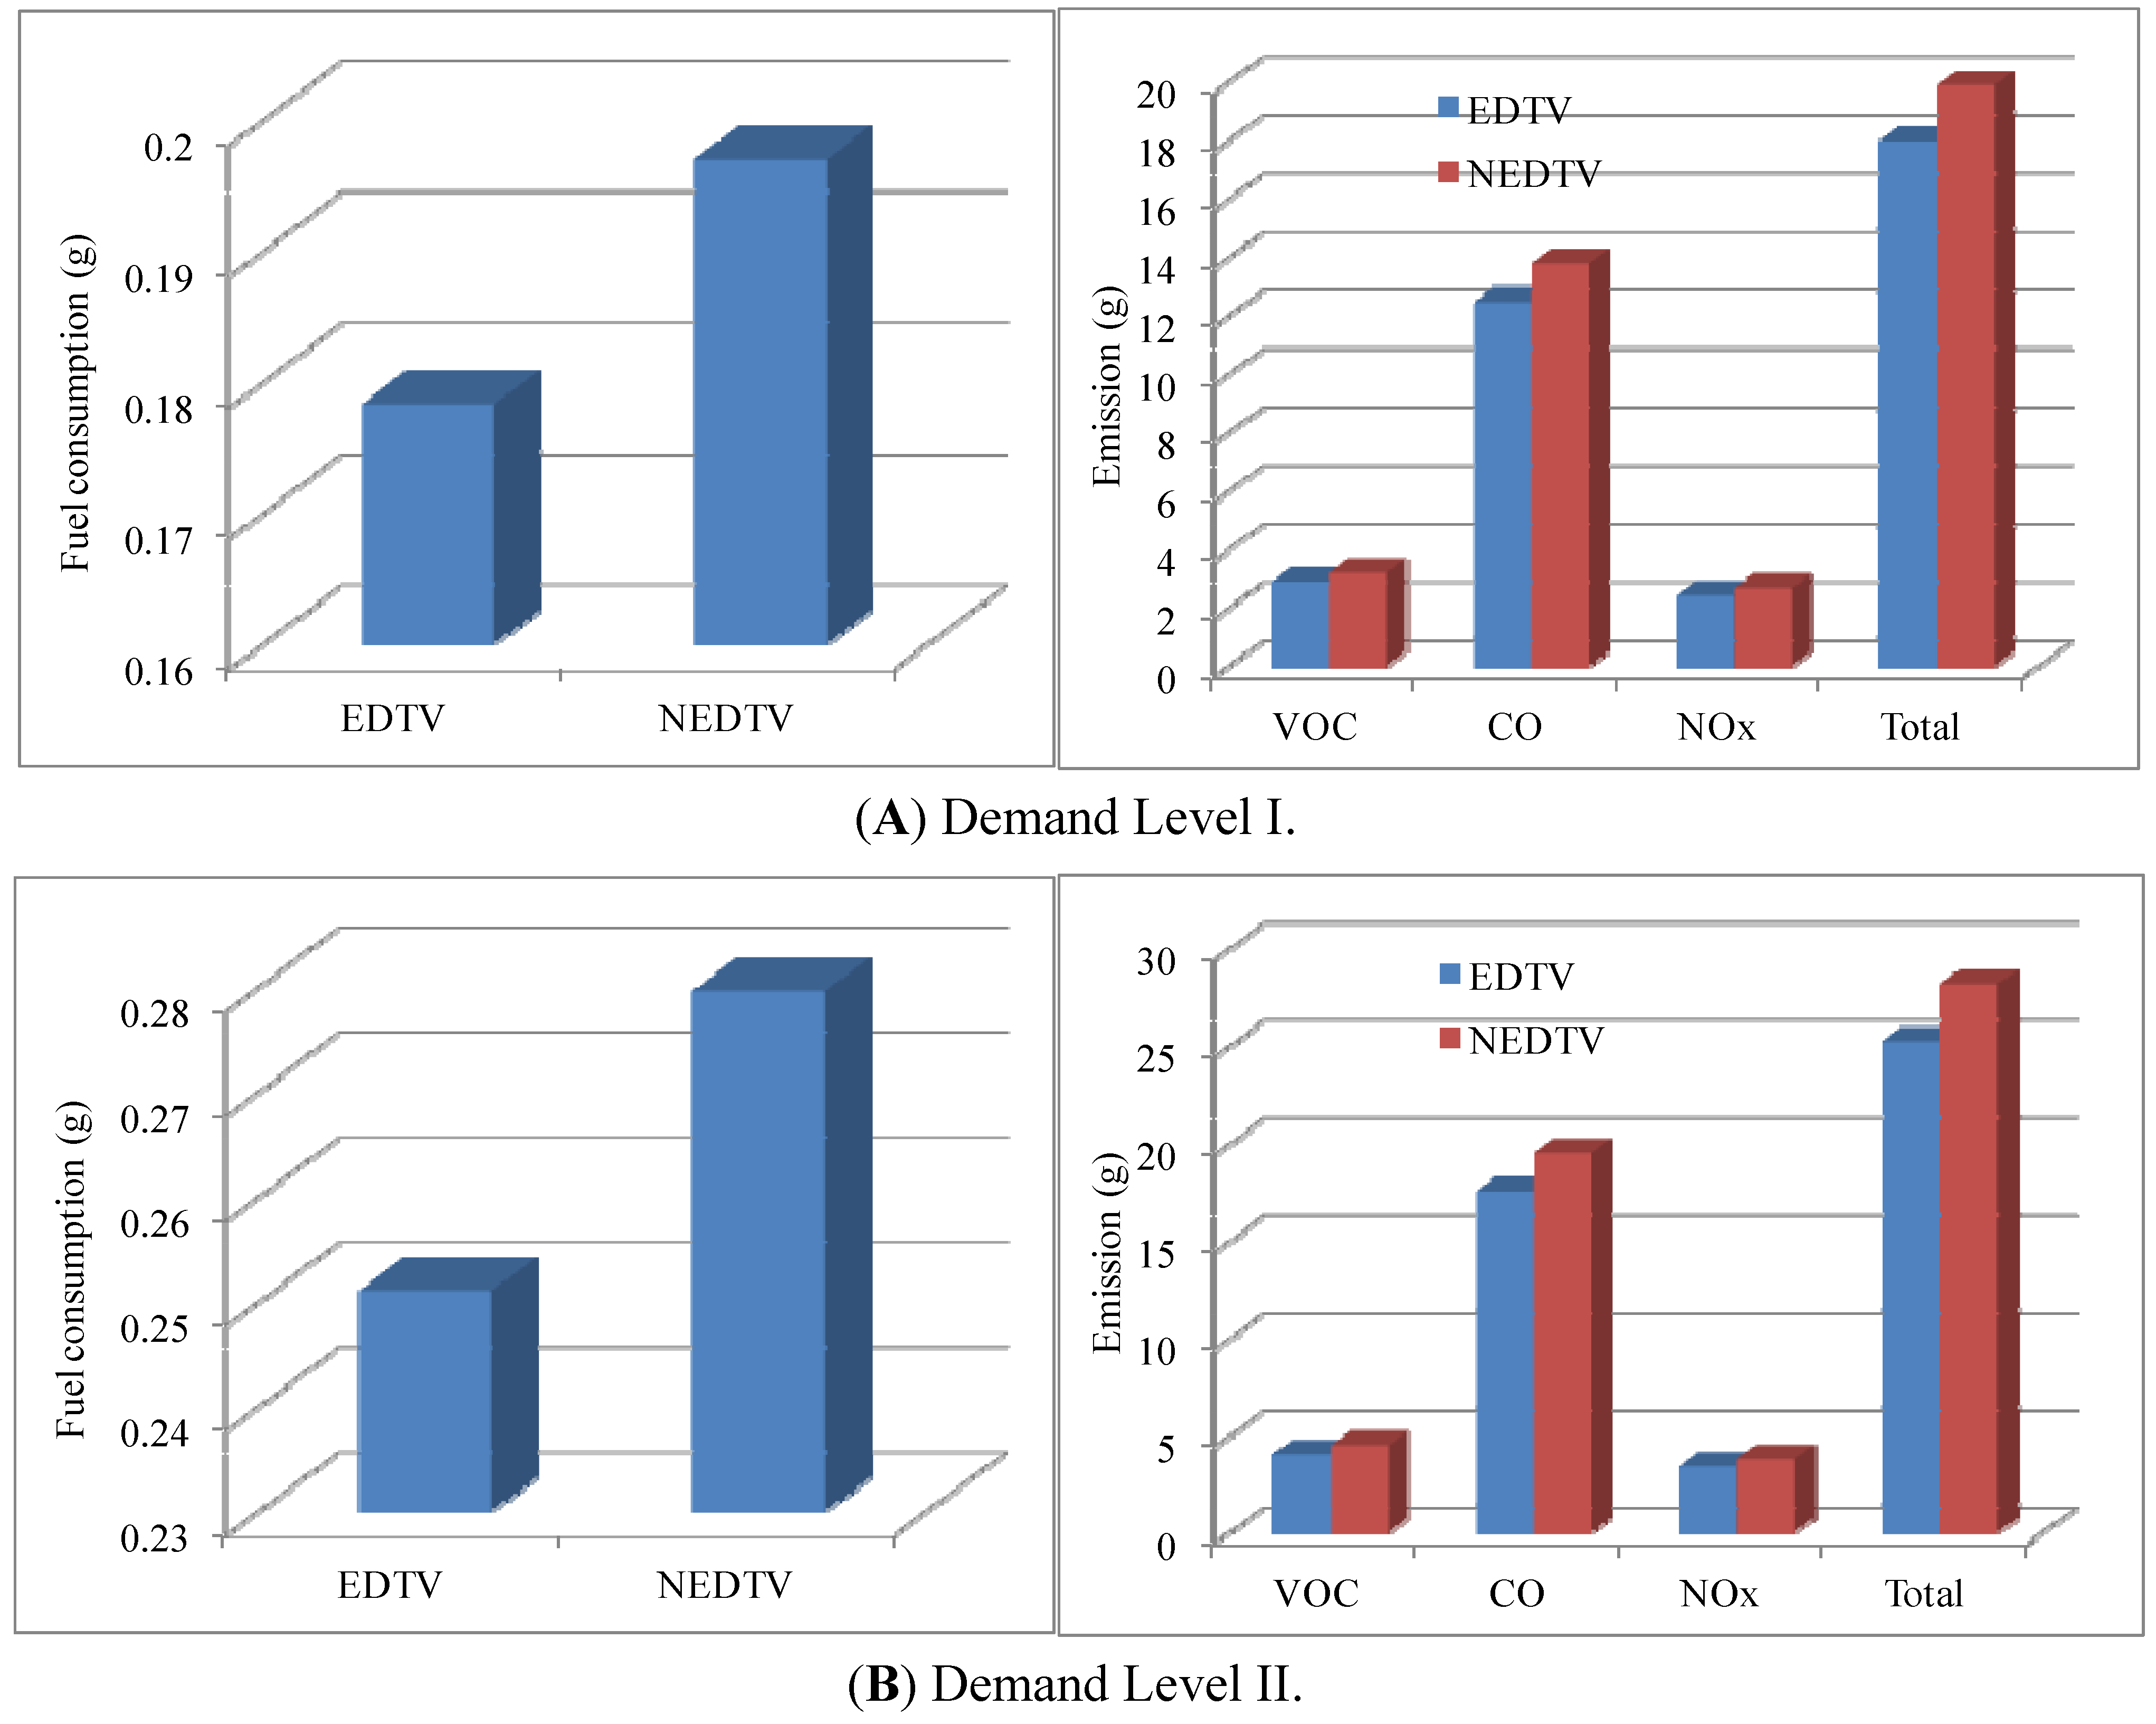
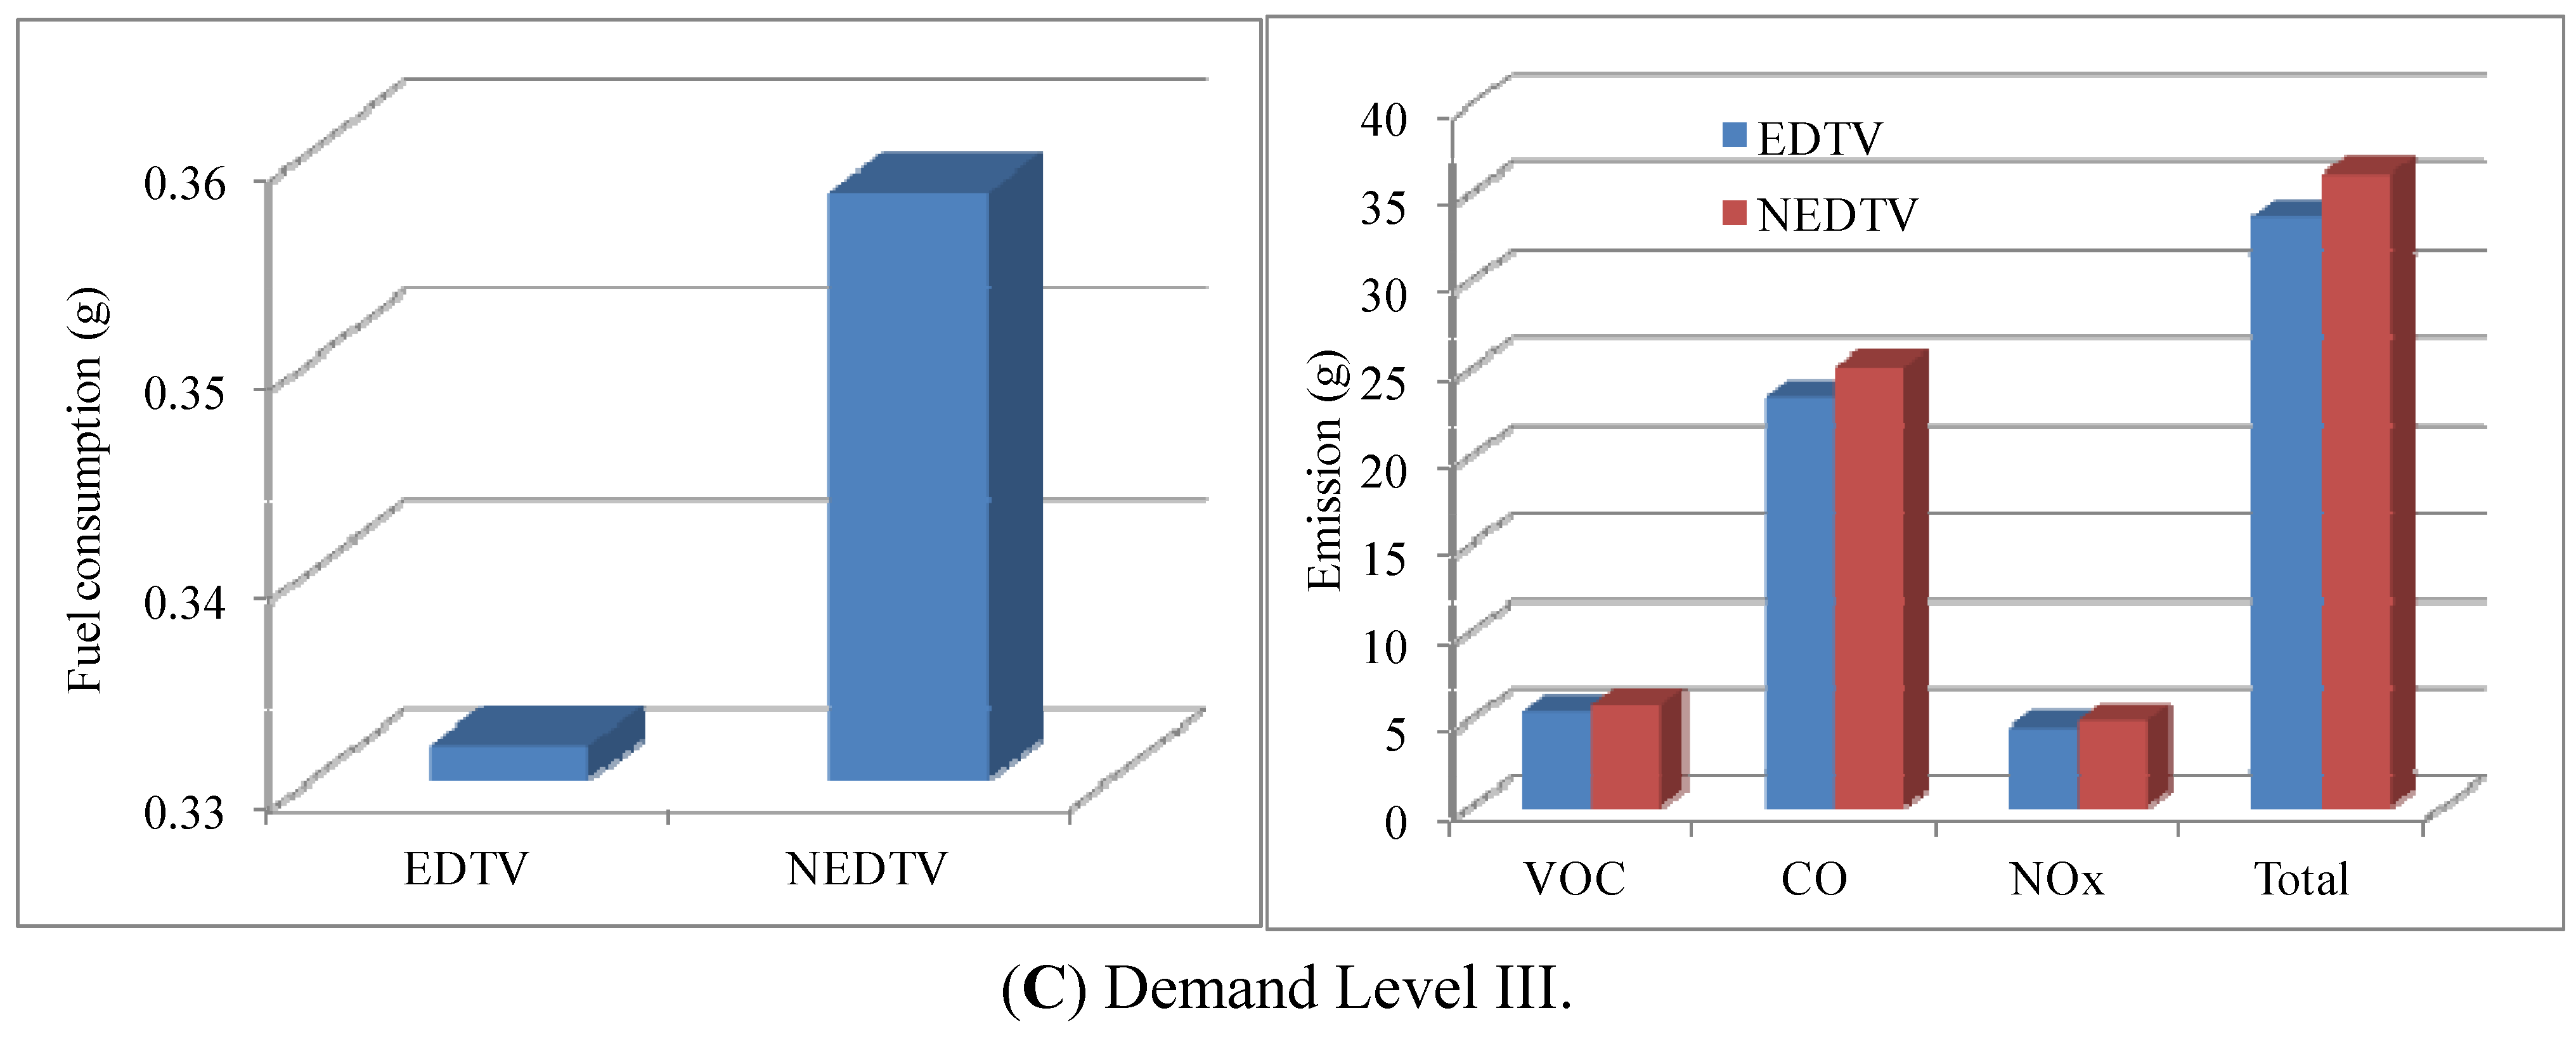
- (1)
- The proposed EDTV outperforms NEDTV in all demand scenarios in terms of reduction in bus fuel consumption (7.3%–9.5% savings over NEDTV). Such results clearly demonstrate the advantages of the proposed model in saving energy.
- (2)
- Recommended bus speed and holding time plans generated by the proposed EDTV will also contribute a significant decrease of air pollution emission of buses. Compared with NEDTV, the decrease in average is about 3.7%–10%.
- (1)
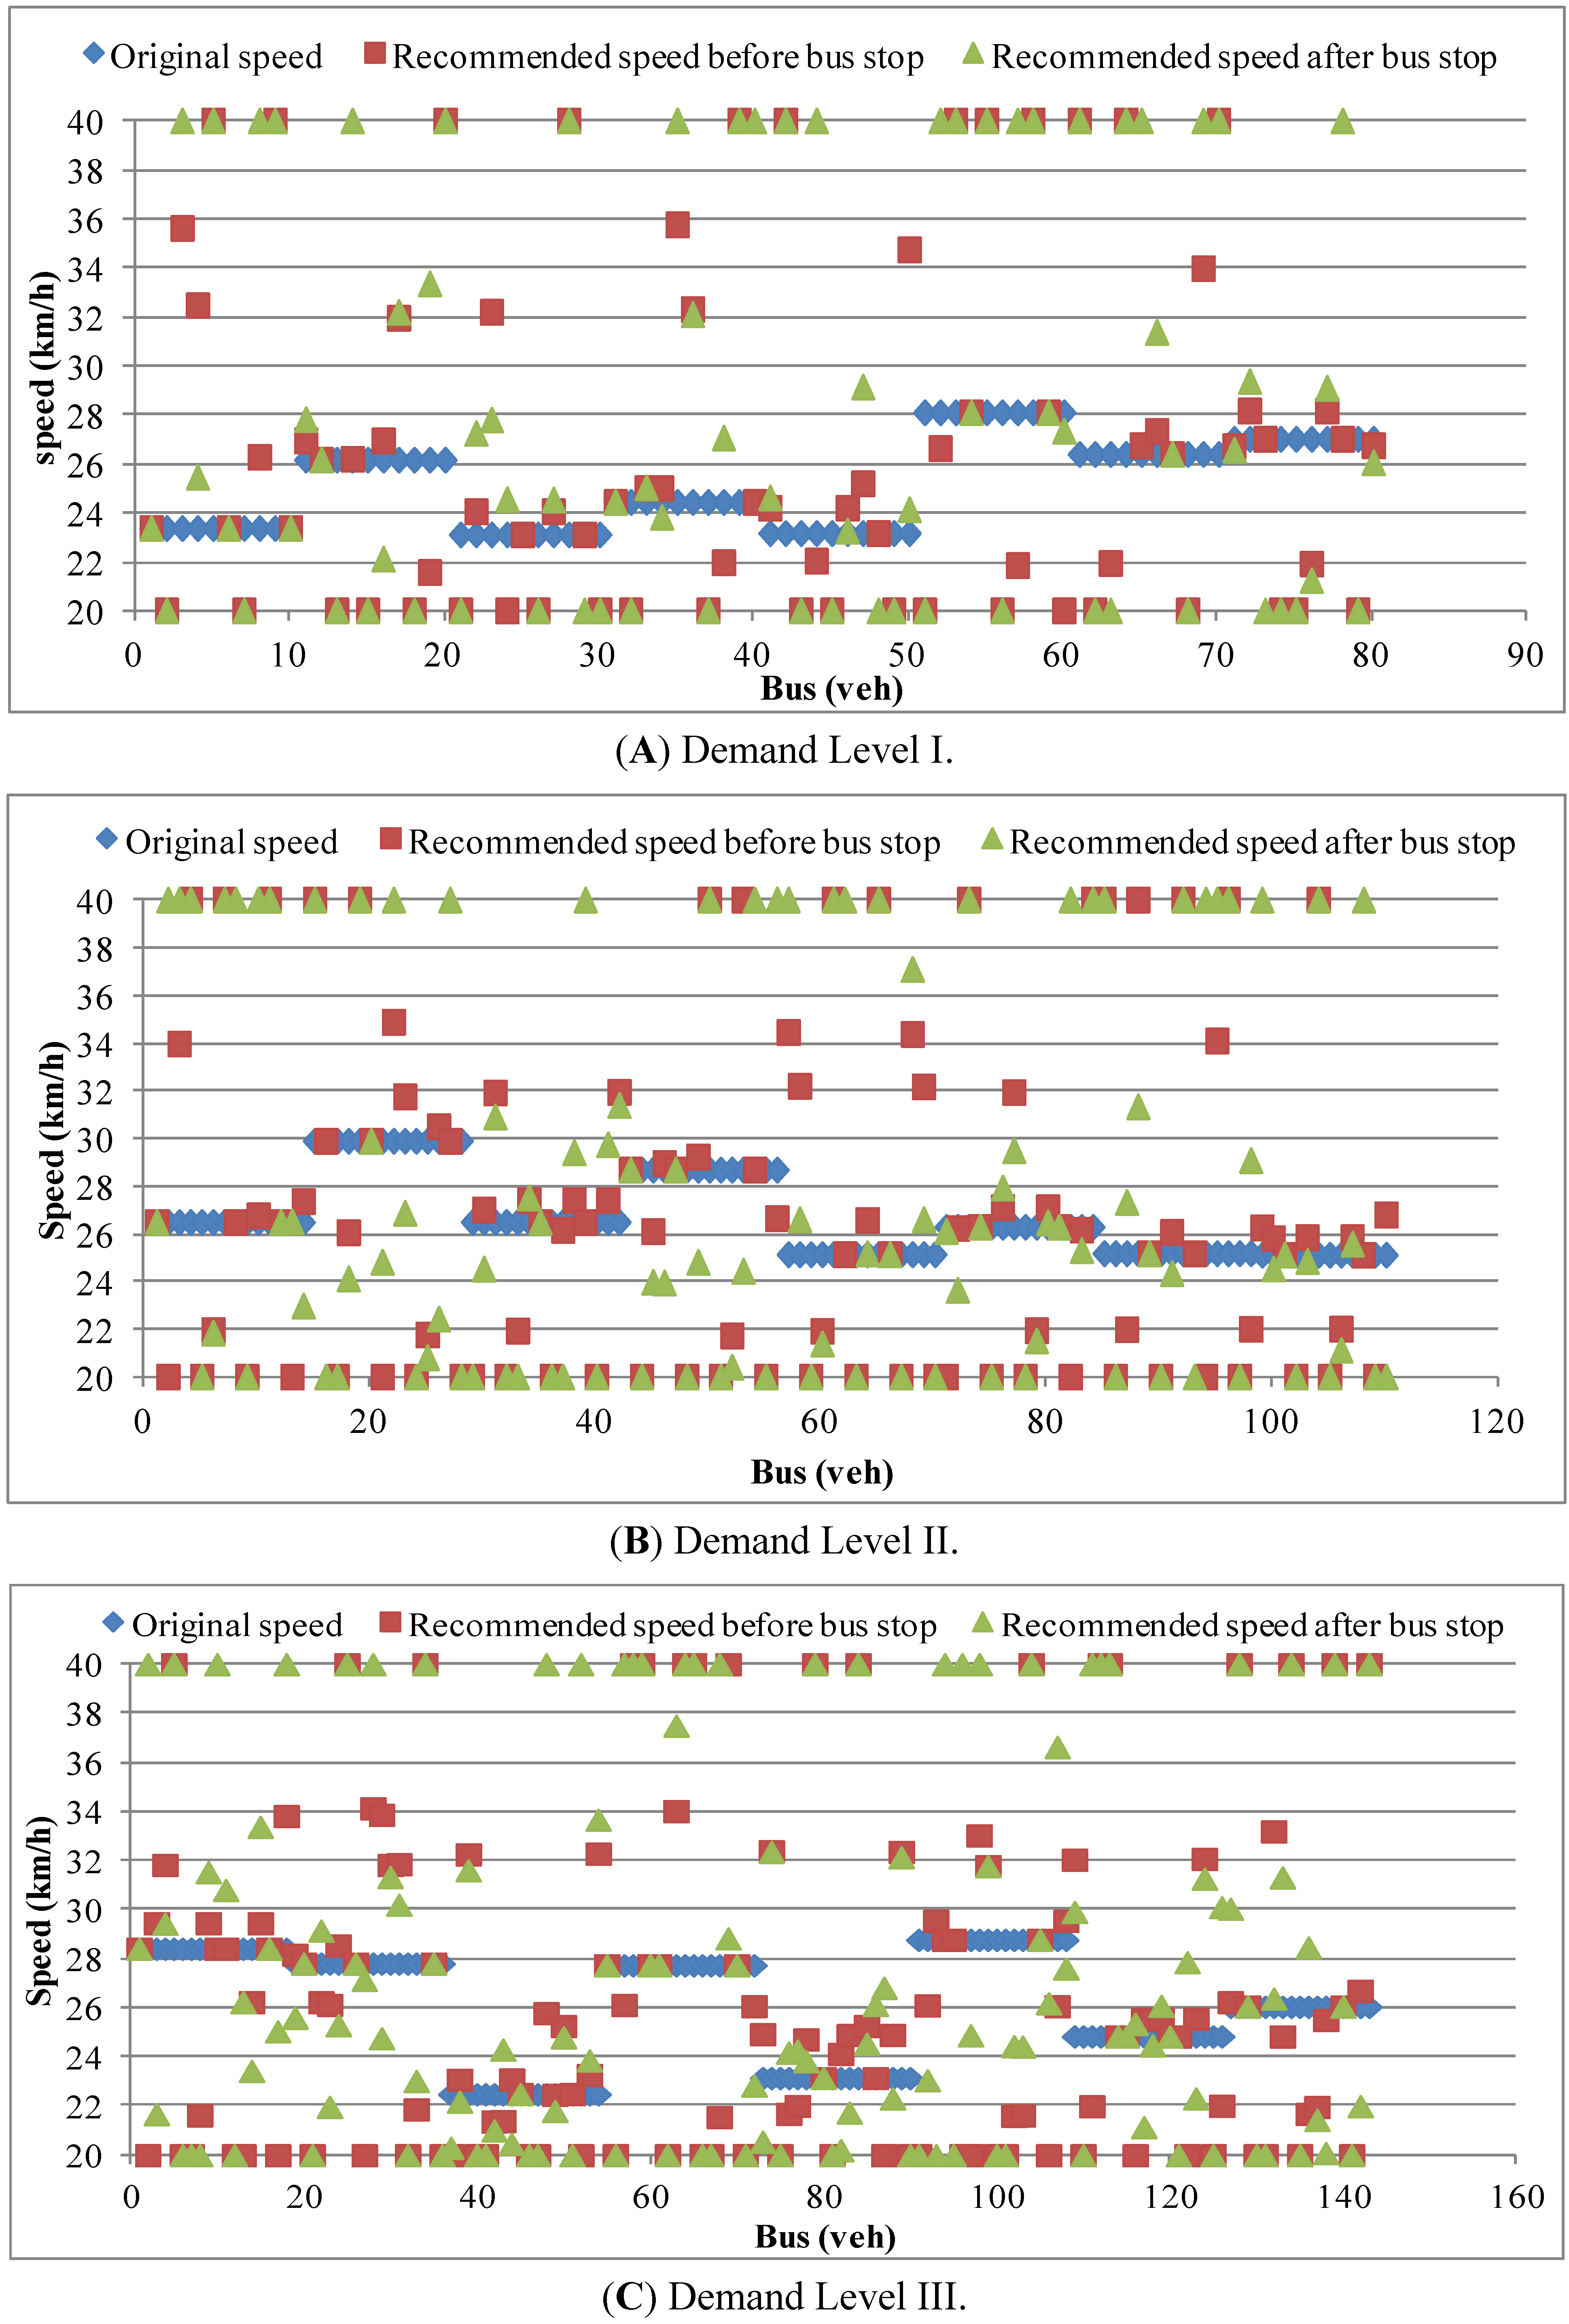
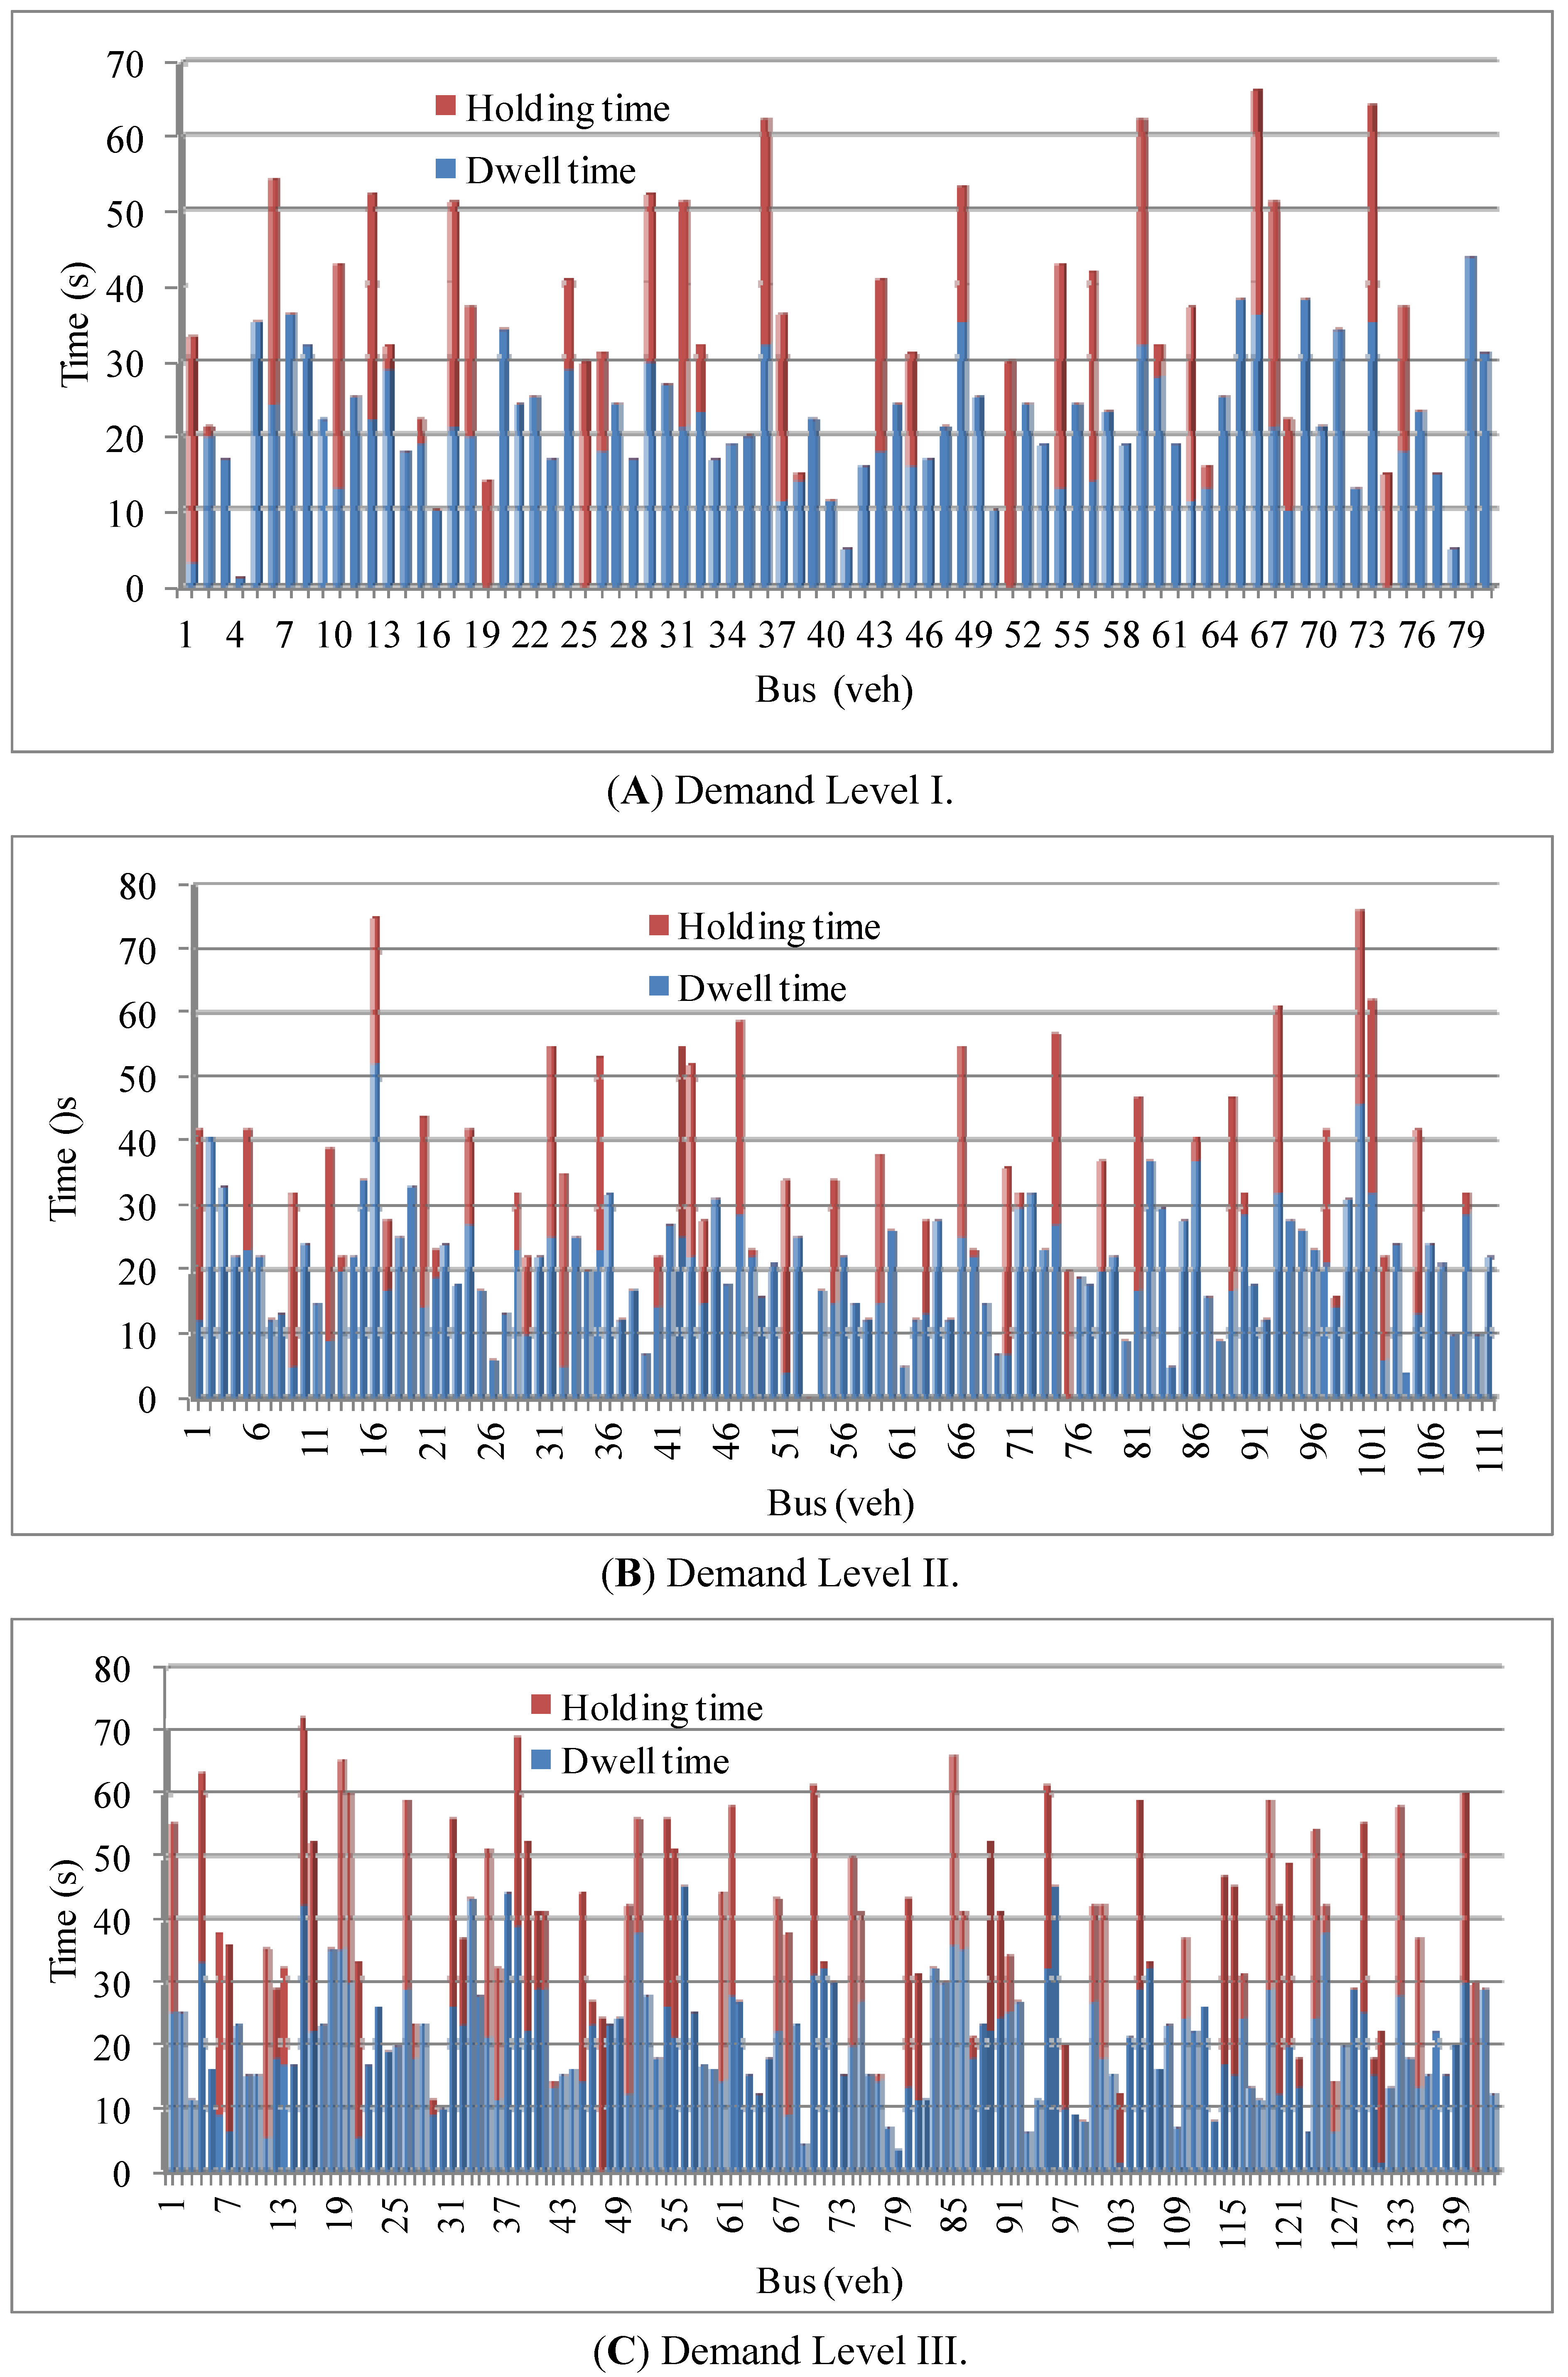
- The proposed EDTV system can generate a recommended bus speed and bus holding time at near side bus stops for all buses. Moreover, the recommended bus speed upstream of the bus stop and downstream of the bus stop (Figure 7) is different among different vehicles, as is the recommended holding time (Figure 8);
- (2)
- (3)
- Since the recommended bus speed and bus holding time should satisfy the constraints of minimum and maximum bus speed and maximum holding time, respectively, these constraints are very important factors which have significant impacts on the performance of the proposed EDTV method.
5. Conclusions
Acknowledgments
References
- Noland, R.B.; Cowart, W.A.; Fulton, L.M. Travel demand policies for saving oil during a supply emergency. Energy Policy 2006, 34, 2994–3005. [Google Scholar]
- Abkowitz, M.D.; Engelstein, I. Temporal and spatial dimensions of running time in transit system. Transp. Res. Rec. 1982, 877, 64–67. [Google Scholar]
- Levinson, H.S. Analysis transit travel time performance. Transp. Res. Rec. 1983, 915, l–6. [Google Scholar]
- Ngan, V.; Sayed, T.; Abdelfatah, A. Impacts of various traffic para meters on transit signal priority effectiveness. J. Public Transp. 2004, 7, 71–93. [Google Scholar] [CrossRef]
- Ma, W.; Yang, X.; Liu, Y. Development and Evaluation of a Coordinated and Conditional Bus Signal Priority Approach. Transp. Res. Rec. 2010, 2145, 49–58. [Google Scholar] [CrossRef]
- Ghanim, M.; Dion, F.; Abu-Lebdeh, G. Integration of signal control and transit signal priority optimization in coordinated network using genetic algorithms and artificial neural networks. In Presented at the 88th Annual Meeting of the Transportation Research Board, Washington, DC, USA; 2009. [Google Scholar]
- Lowrie, P.R. The Sydney coordinated adaptive traffic system (scats): Principles, methodology, algorithms. In Presented at the International Conference on Road Traffic Signaling, London, UK; 1982. [Google Scholar]
- Hunt, P.B.; Robertson, D.I.; Bretherton, R.D.; Winton, R.I. SCOOT: A Traffic-Responsive Method of Coordinating Signals; TRL Report 1014; Transport and Road Research Laboratory: Wokingham, UK, 1981. [Google Scholar]
- Ahn, K.; Rakha, H. System-Wide Impacts of Green Extension Transit Signal Priority. Presented at Intelligent Transportation Systems Conference, Toronto, Canada, 2006. [Google Scholar]
- Nelson, J.T. Provision of Priority for Public Transport at Traffic Signals: A European Perspective. Traffic Eng. Contr. 1993, 34, 426–428. [Google Scholar]
- Abu-Lebdeh, G. Integrated adaptive-signal dynamic-speed control of signalized arterials. J. Transp. Eng. 2002, 128, 447–451. [Google Scholar] [CrossRef]
- Abu-Lebdeh, G.; Chen, H. Exploring the potential benefits of intellidrive-enabled dynamic speed control in signalized networks. In Proceedings of the 89th Transportation Research Board Annual Meeting, Washington, DC, USA; 2010. [Google Scholar]
- FHWA (Federal Highway Administration). Final Report: Vehicle Infrastructure Integration; Proof of Concept Results and Findings Summary—Vehicle; FHWA-JPO-09-043. Available online: http://ntl.bts.gov/lib/31000/31100/31135/14477.htm (accessed on 21 February 2012).
- Delgado, O.; Clark, N.; Thompson, G. Modeling transit bus fuel consumption on the basis of cycle properties. J. Air Waste Manag. Assoc. 2011, 61, 443–452. [Google Scholar] [CrossRef] [PubMed]
- Coelho, M.C.; Farias, T.L.; Rouphail, N.M. Impact of speed control traffic signals on pollutant emissions. Transp. Res. D 2005, 10, 323–340. [Google Scholar] [CrossRef]
- VISSIM 5.10. PTV Planung Transport Verkehr AG.: Karlsruhe, Germany, 2008.
© 2012 by the authors; licensee MDPI, Basel, Switzerland. This article is an open access article distributed under the terms and conditions of the Creative Commons Attribution license (http://creativecommons.org/licenses/by/3.0/).
Share and Cite
Ma, W.; Xie, H.; Han, B. Development and Evaluation of an Economic-Driving Assistance Program for Transit Vehicles. Energies 2012, 5, 371-385. https://doi.org/10.3390/en5020371
Ma W, Xie H, Han B. Development and Evaluation of an Economic-Driving Assistance Program for Transit Vehicles. Energies. 2012; 5(2):371-385. https://doi.org/10.3390/en5020371
Chicago/Turabian StyleMa, Wanjing, Hanzhou Xie, and Baoxin Han. 2012. "Development and Evaluation of an Economic-Driving Assistance Program for Transit Vehicles" Energies 5, no. 2: 371-385. https://doi.org/10.3390/en5020371
APA StyleMa, W., Xie, H., & Han, B. (2012). Development and Evaluation of an Economic-Driving Assistance Program for Transit Vehicles. Energies, 5(2), 371-385. https://doi.org/10.3390/en5020371


