Article

A Fuzzy Logic Global Power Management Strategy for Hybrid Electric Vehicles Based on a Permanent Magnet Electric Variable Transmission

by
Abdelsalam Ahmed Abdelsalam
* and
Shumei Cui
Department of Electrical Machines and Automation, Harbin Institute of Technology, Harbin 150001, China
*
Author to whom correspondence should be addressed.
Energies 2012, 5(4), 1175-1198; https://doi.org/10.3390/en5041175
Submission received: 30 January 2012 / Revised: 9 April 2012 / Accepted: 12 April 2012 / Published: 23 April 2012

Abstract

:
The major contribution of this paper is to propose a Fuzzy Logic Global Power Management Strategy for Hybrid Electric Vehicles (HEVs) that are driven by the PM-EVT (PM machine—Electric Variable Transmission) powertrain, such that the PM-EVT will have superior advantages over other types of powertrains, including the current Toyota Prius powertrain for series-parallel HEVs. This has been investigated throughout three aspects. The first is the optimum power splitting between the Internal Combustion Engine (ICE) and the PM-EVT. The second is maximizing the vehicle’s energy capture during the braking process. Finally, sustaining the State of Charge (SOC) of the battery is adopted by a robust ON/OFF controller of the ICE. These goals have been accomplished by developing three fuzzy logic (FL) controllers. The FL controllers are designed based on the state of charge of the battery, vehicle’s velocity, traction torque, and the vehicle’s requested power. The integration of the studied system is accomplished via the Energetic Macroscopic Representation (EMR) simulation model strategy based on the software Matlab/Simulink. The PM-EVT based HEV system with the proposed power management strategy is validated by comparing to the Toyota Prius HEV. The vehicle’s performances have been analyzed throughout a combined long-trip driving cycle that represents the normal and the worst operating conditions. The simulation results show that global control system is effective to control the engine’s operating points within the highest efficiency region, exploiting of EVT machines for capturing maximum braking energy, as well as to sustain the SOC of the battery while satisfy the drive ability. The proposed control strategy for the studied HEVs sounds interesting and feasible as supported by a large amount of simulation results.

1. Introduction

Energy management in vehicles is an important issue because it can significantly influence the performance of the vehicles and component sizing. Improving energy management in Hybrid Electric Vehicles (HEVs) can deliver important benefits, such as reducing fuel consumption, decreasing emissions, lower running cost, reducing noise pollution, and improving driving performance and ease of use. In addition, the intelligent energy management methods can observe and learn driver behavior, environmental and vehicle conditions, and intelligently control the operation of the HEV.
The Dual Mechanical Ports Machine (DMPM), as an Electric Variable Transmission (EVT), is the powertrain of the studied HEV. Many efforts have been developed for researching and discussing different aspects of this series/parallel HEV using Induction Machines (IM-EVT) [1,2,3,4,5]. Permanent Magnet Synchronous Machines (PMSM) have been researched as the strongest candidate for an EVT power train for the HEV [6,7,8,9,10,11]. Also, the PMSM-DMP, as an energy conversion device, has been introduced as an alternative to the Toyota Hybrid System (THS) transmission in [4]. In which a comparison between the two kinds of series-parallel HEVs was presented. In [11], the parametric design and robust rule-based control strategy for the PM-EVT based HEV have been presented, in which the power ratings of the PM-EVT machines are designed via the union of the mathematical calculations according to the function rules of the power plants and the simulation results with the aid of the rule-based strategy.
Since driving conditions and vehicle loads are highly nonlinear and cannot be explicitly described, intelligent controllers have been proposed in several studies for HEVs’ control. There have been two general trends dealing with control strategies: rule-based and optimization strategies [12]. Rule-based power follower control strategy was presented and simulated for the EVT-based HEV in [3,10,13]. The rule-based revised control strategy has been used to coordinate the power distribution process between the components of HEV. On this strategy, the Internal Combustion Engine (ICE) operates on its maximum efficiency region and drives the vehicle with the base required power such that the ICE turns ON and OFF depending on the terminate limits of the State of Charge (SOC) of the battery.
Due to the multi-domain, nonlinear, and time-varying nature of the HEV’s powertrain, many researchers have investigated the implementation of Fuzzy Logic Control (FLC) as a solution. Instead of using deterministic rules, the decision making property of the FLC can be adopted to realize a real-time power-split controller [11,12]. The FLC has been successfully applied in HEV areas of energy management strategy [14,15,16,17,18,19,20].
When a vehicle drives in heavy traffic, more than half of the total energy is dissipated in the brakes. Therefore, recovering braking energy is an effective approach for improving the driving range of EV and the energy efficiency of HEV [21,22]. FLC was applied in regenerative braking distribution in different types of HEVs [23,24,25].
In this paper, PMSM-EVT, ICE, battery, and final gear are the main components of the studied HEV, as shown in Figure 1. Double rotor PMSM (EM1), normal PMSM (EM2) and two power converters are the components of the split PMSM-EVT unit. The inner rotor of EM1 is connected mechanically to the ICE and has distributed windings (stator1) that are connected to battery via inverter 1 across the brushes and slip-rings. The rotor of EM2 is connected to the final gear of the vehicle and to the outer rotor of EM1; while the windings of stator (2) are connected to the battery via inverter 2. Vector control with field weakening strategy is used to drive the PMSM-EVT machines. More details about the local control strategy for the PMSM-EVT have been presented on the previous research work [10,11]. Therefore, using the global intelligent power management strategy, the PMSM-EVT machines can be exploited to optimize the ICE operation. The EVT machines are robustly controlled to cover the difference between the vehicle requirements (speed and torque) and the optimized output operating points (speed and torque) of the engine. In such an HEV architecture, increasing the toque rating of the EM2 strongly guarantees coverage of hard driving conditions and at the same time permits the regenerative control strategy to maximize the captured energy exploiting the maximum amount of the braking energy to charge the battery.
Figure 1. Hybrid electric vehicle driven with PMSM-EVT.
Energies 05 01175 g001
In this paper, a fuzzy logic global control strategy for PMSM-EVT-HEV system has been developed. This is considered as an initiative research work about using FLC controllers for that system. These strategies guarantee the operations of the ICE within its maximum efficiency region, save the power ratings of the PMSM-EVT machines and battery below the maximum limits, and sustain the battery’s SOC at the predefined target range. Also at braking, maximum power has been captured by using a robust regenerative strategy. Finally, the requirements of the driver at normal and hard driving conditions have been accomplished. To validate the robustness of the developed global FL control strategy for the HEV with the PM-EVT, a comparison to the well-known Toyota Prius HEV is performed with combined reference long-trip driving cycle, incorporating the modified Prius 1015, UDDS, and US06HWY is derived.
The paper is organized as follows: implementation of the developed power management strategy is presented in Section 2. First, the FL regenerative braking system is designed; second, a robust SOC controller is adopted via FL ON/OFF switching controller of the ICE; and third, the vehicle’s driving force is distributed between the ICE and the EVT machines by the third FL strategy. Simulation and integration of the studied PM-EVT based HEV system is modeled using the Energetic Macroscopic Representation (EMR) in Section 3. In Section 4, the regenerative strategy is presented and analyzed at fixed regenerative factor and with FLC strategy. Finally, the vehicle performance and the power flow through the ICE, PMSM-EVT machines, and the battery are analyzed and discussed via the simulation results at different driving cycles in Section 5.

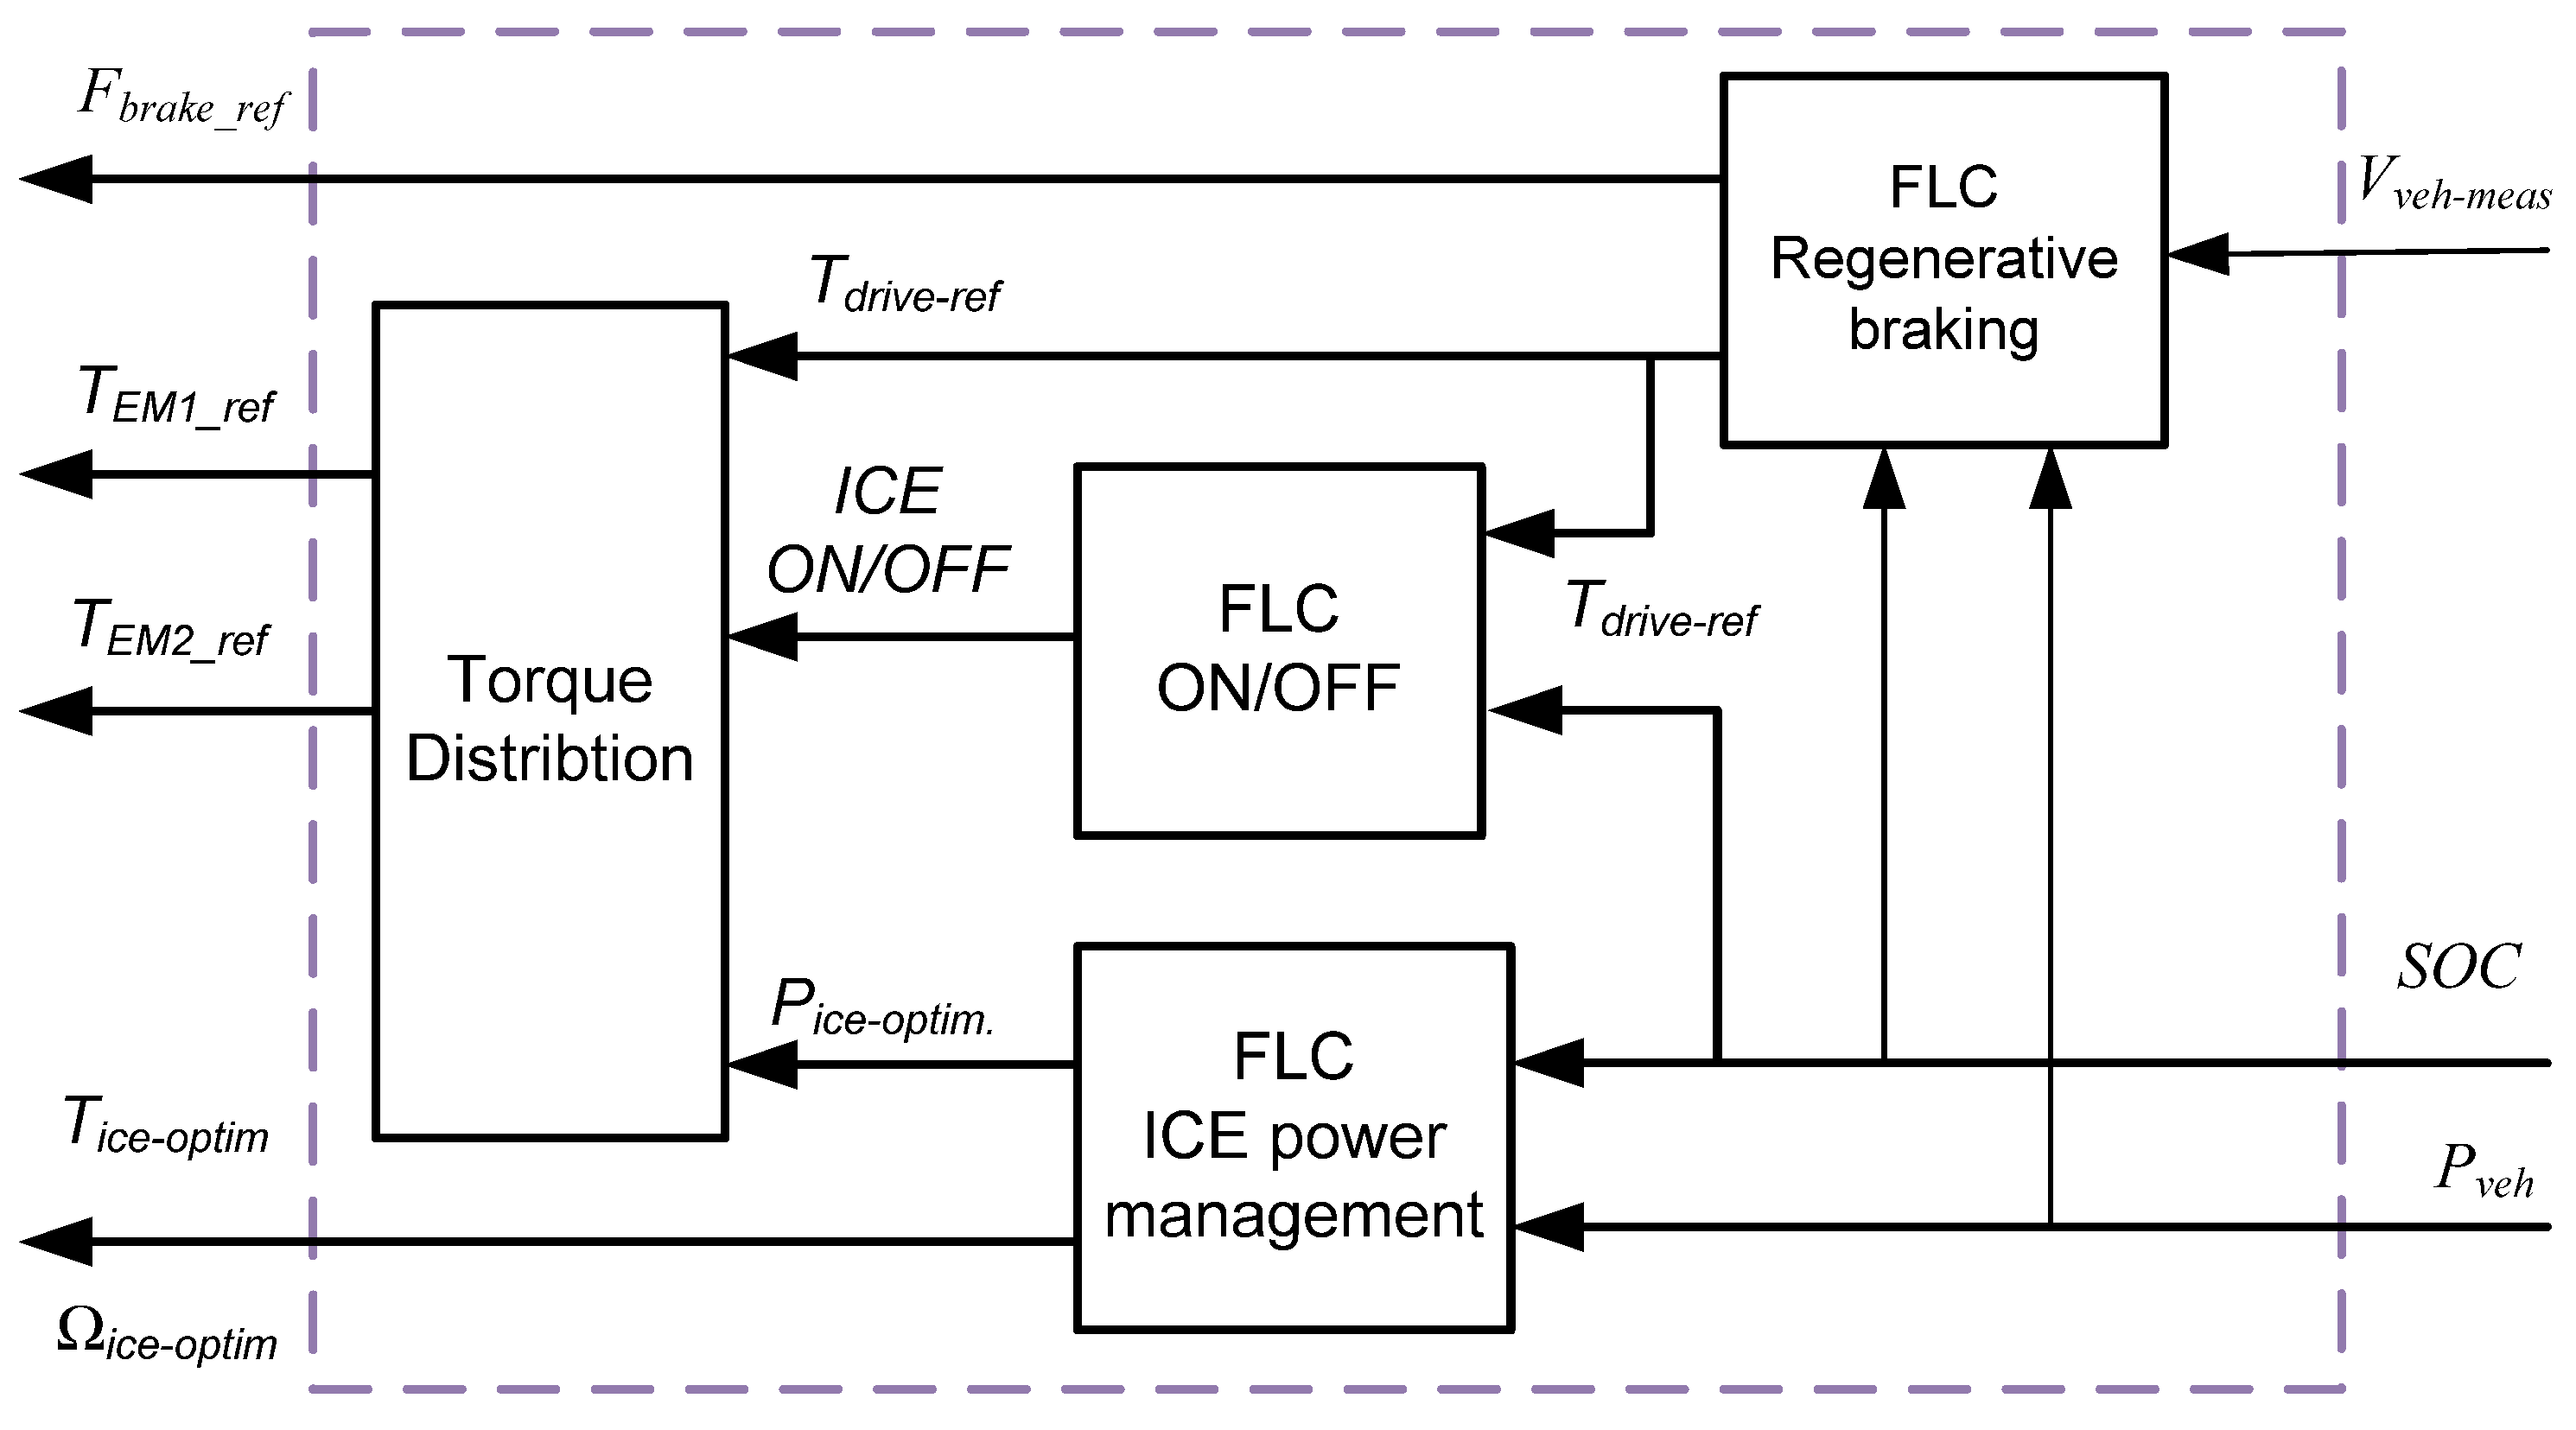
2. Fuzzy Logic Global Power Management Strategy

The EVT based HEV system is too complex, especially from points of nonlinearity, functionality, and switching structure. Also, it needs to be controlled by an intelligent controller accurately to meet vehicle’s needs with smooth operation, guaranteeing stability, and saving the power sizing of the system’s components. The proposed FLC strategy for this system is different because of the structure and functionality of the PMSM-EVT based HEV is different to the other types of HEVs. The whole strategy’s FL controllers are shown in Figure 2. The vehicle velocity, environmental resistance forces, the power required at the wheels and the state of charge of the battery are the input variables for the management system; whereas the electrical and mechanical braking forces, required torque of both EM1 and EM2, and also the operating points of the ICE within maximum efficiency region are the output of the proposed strategy. The FL regenerative strategy level defines the regenerative distribution factor K d   which distributes the braking torque between the mechanical and electrical. The FL ICE power management strategy level defines the ICE torque reference T i c e _ r e f and the ICE speed   N i c e _ r e f . Turning the engine ON or/and OFF is defined by the FL ON/OFF controller. Finally, the reference torques for EM1 and EM2 are defined according to the torque distribution strategy which will be explained later.
Figure 2. Diagram for the global FLC strategy of the HEV with PM-EVT.
Energies 05 01175 g002

2.1. Implementation of Regenerative Braking Fuzzy Logic Control Strategy

One of the inherent advantages of the HEVs is the possibility of recovering vehicle kinetic energy. Maximizing the amount of the regenerative energy decreases the usage of the ICE and then reduces the fuel consumption and emissions. Regenerative braking is commanded whenever the torque is less than zero across the vehicle speed range and the battery SOC range. Therefore, it is important to properly distribute the braking force between regenerative and friction braking to maximize energy capture while maintaining safety of the vehicle and healthy operation of components (motors, inverters, and battery). In order to achieve this goal, this section uses the fuzzy logic control strategy to distribute braking torque to regenerative braking as much as possible.
The ratio of captured force, as regenerative part, to the total brake force is defined as a regenerative braking factor   K d . If the required tractive power is positive,   K d = 1 (i.e., there is no type of braking). If the vehicle’s power is negative (braking state), K d is determined by the regenerative controller such that: when only the electrical braking is used K d = 1. When the hybrid braking is used, 0 < K d < 1 . When only mechanical braking is used, K d = 0 . The drivers’ total braking force demand is calculated from the pedal stroke which is measured by the stroke sensor. Then under the braking force distribution strategy, the electric machine braking force and hydraulic braking force can be calculated. The total vehicle reference force F t r a n s _ r e f is estimated from the velocity reference   v v e h r e f and the environmental forces FRes_mes as described in (1):
F t r a n s _ r e f = C ( t ) ( v v e h r e f v v e h m e s ) + F R e s _ m e s
with C(t) the velocity controller. The output of fuzzy controller is the regenerative braking factor   K d , so the regenerative braking force F m o t _ r e f and friction braking force in the axle F b r a k e _ r e f can be obtained as:
F m o t _ r e f = K d F t r a n s _ r e f
F b r a k e _ r e f = ( 1 K d ) F t r a n s _ r e f
The membership functions and fuzzy logic rules are designed accurately for enlarging the amount of the energy regenerated by EM2. At the same time, it guarantees the torque and power of EM2 within the designed ratings, charging the battery with enough energy and sustaining the SOC at the target value. Also, maintain the operation of the ICE within its maximum operating region.

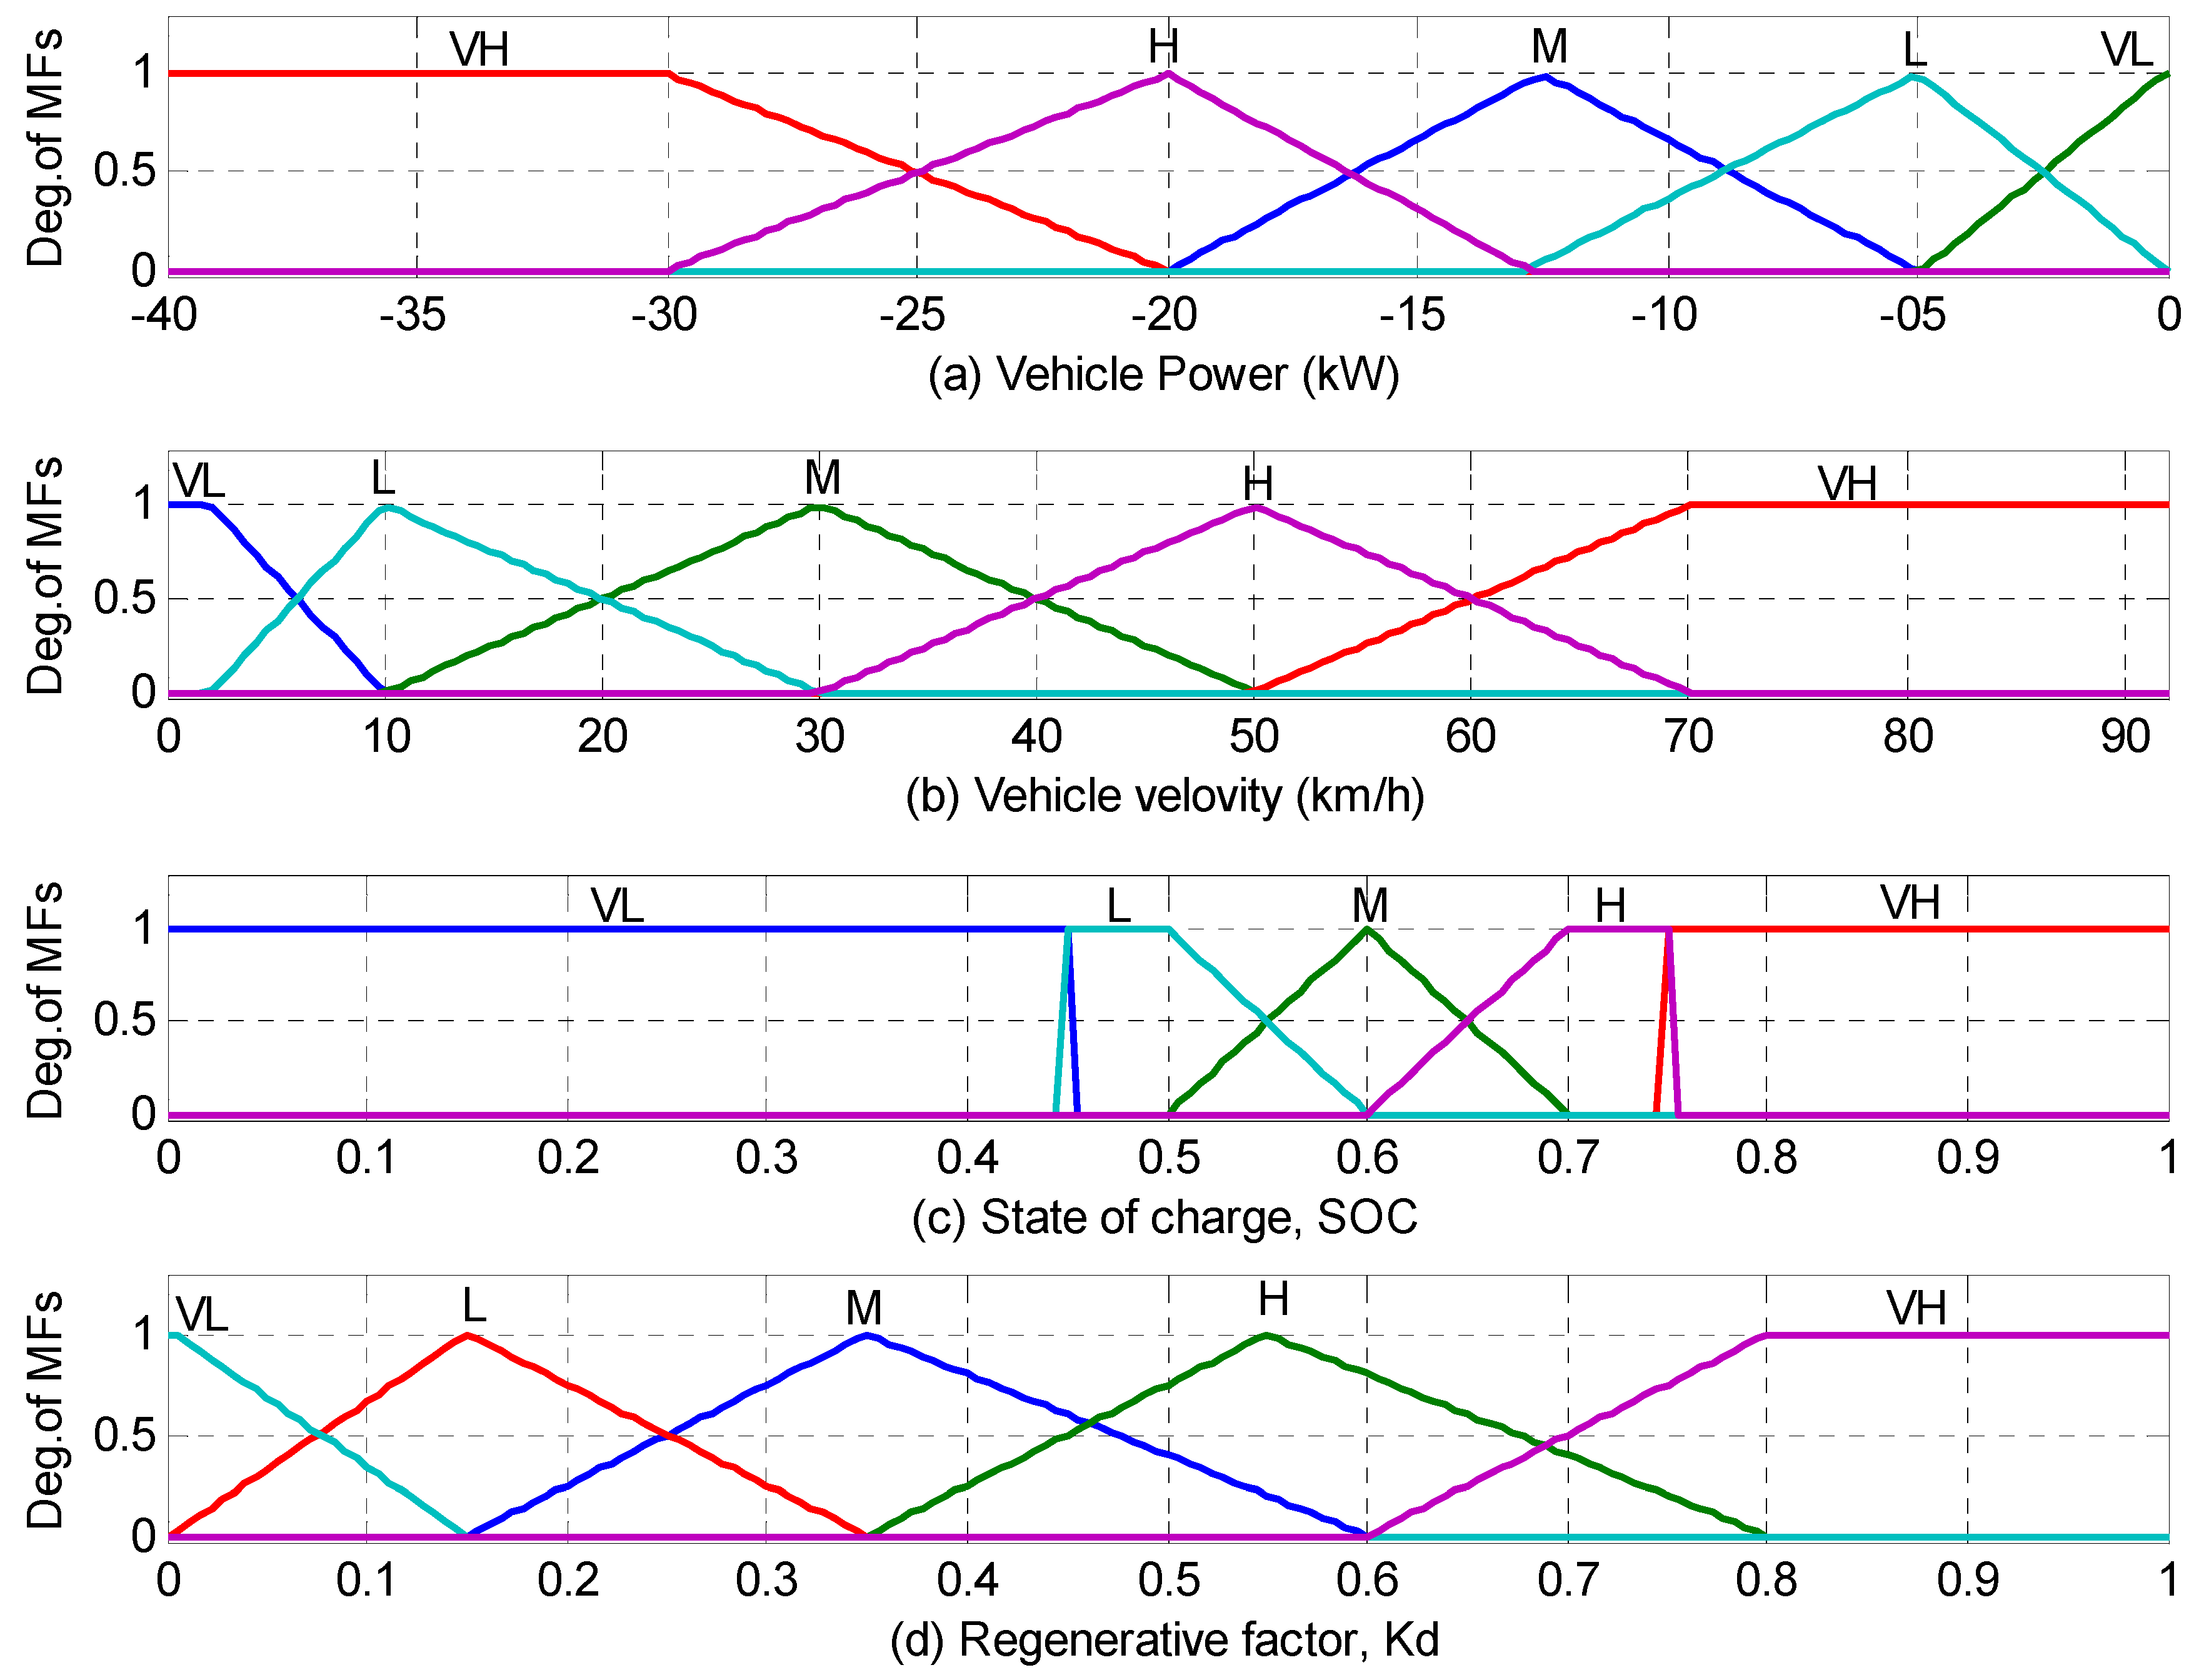
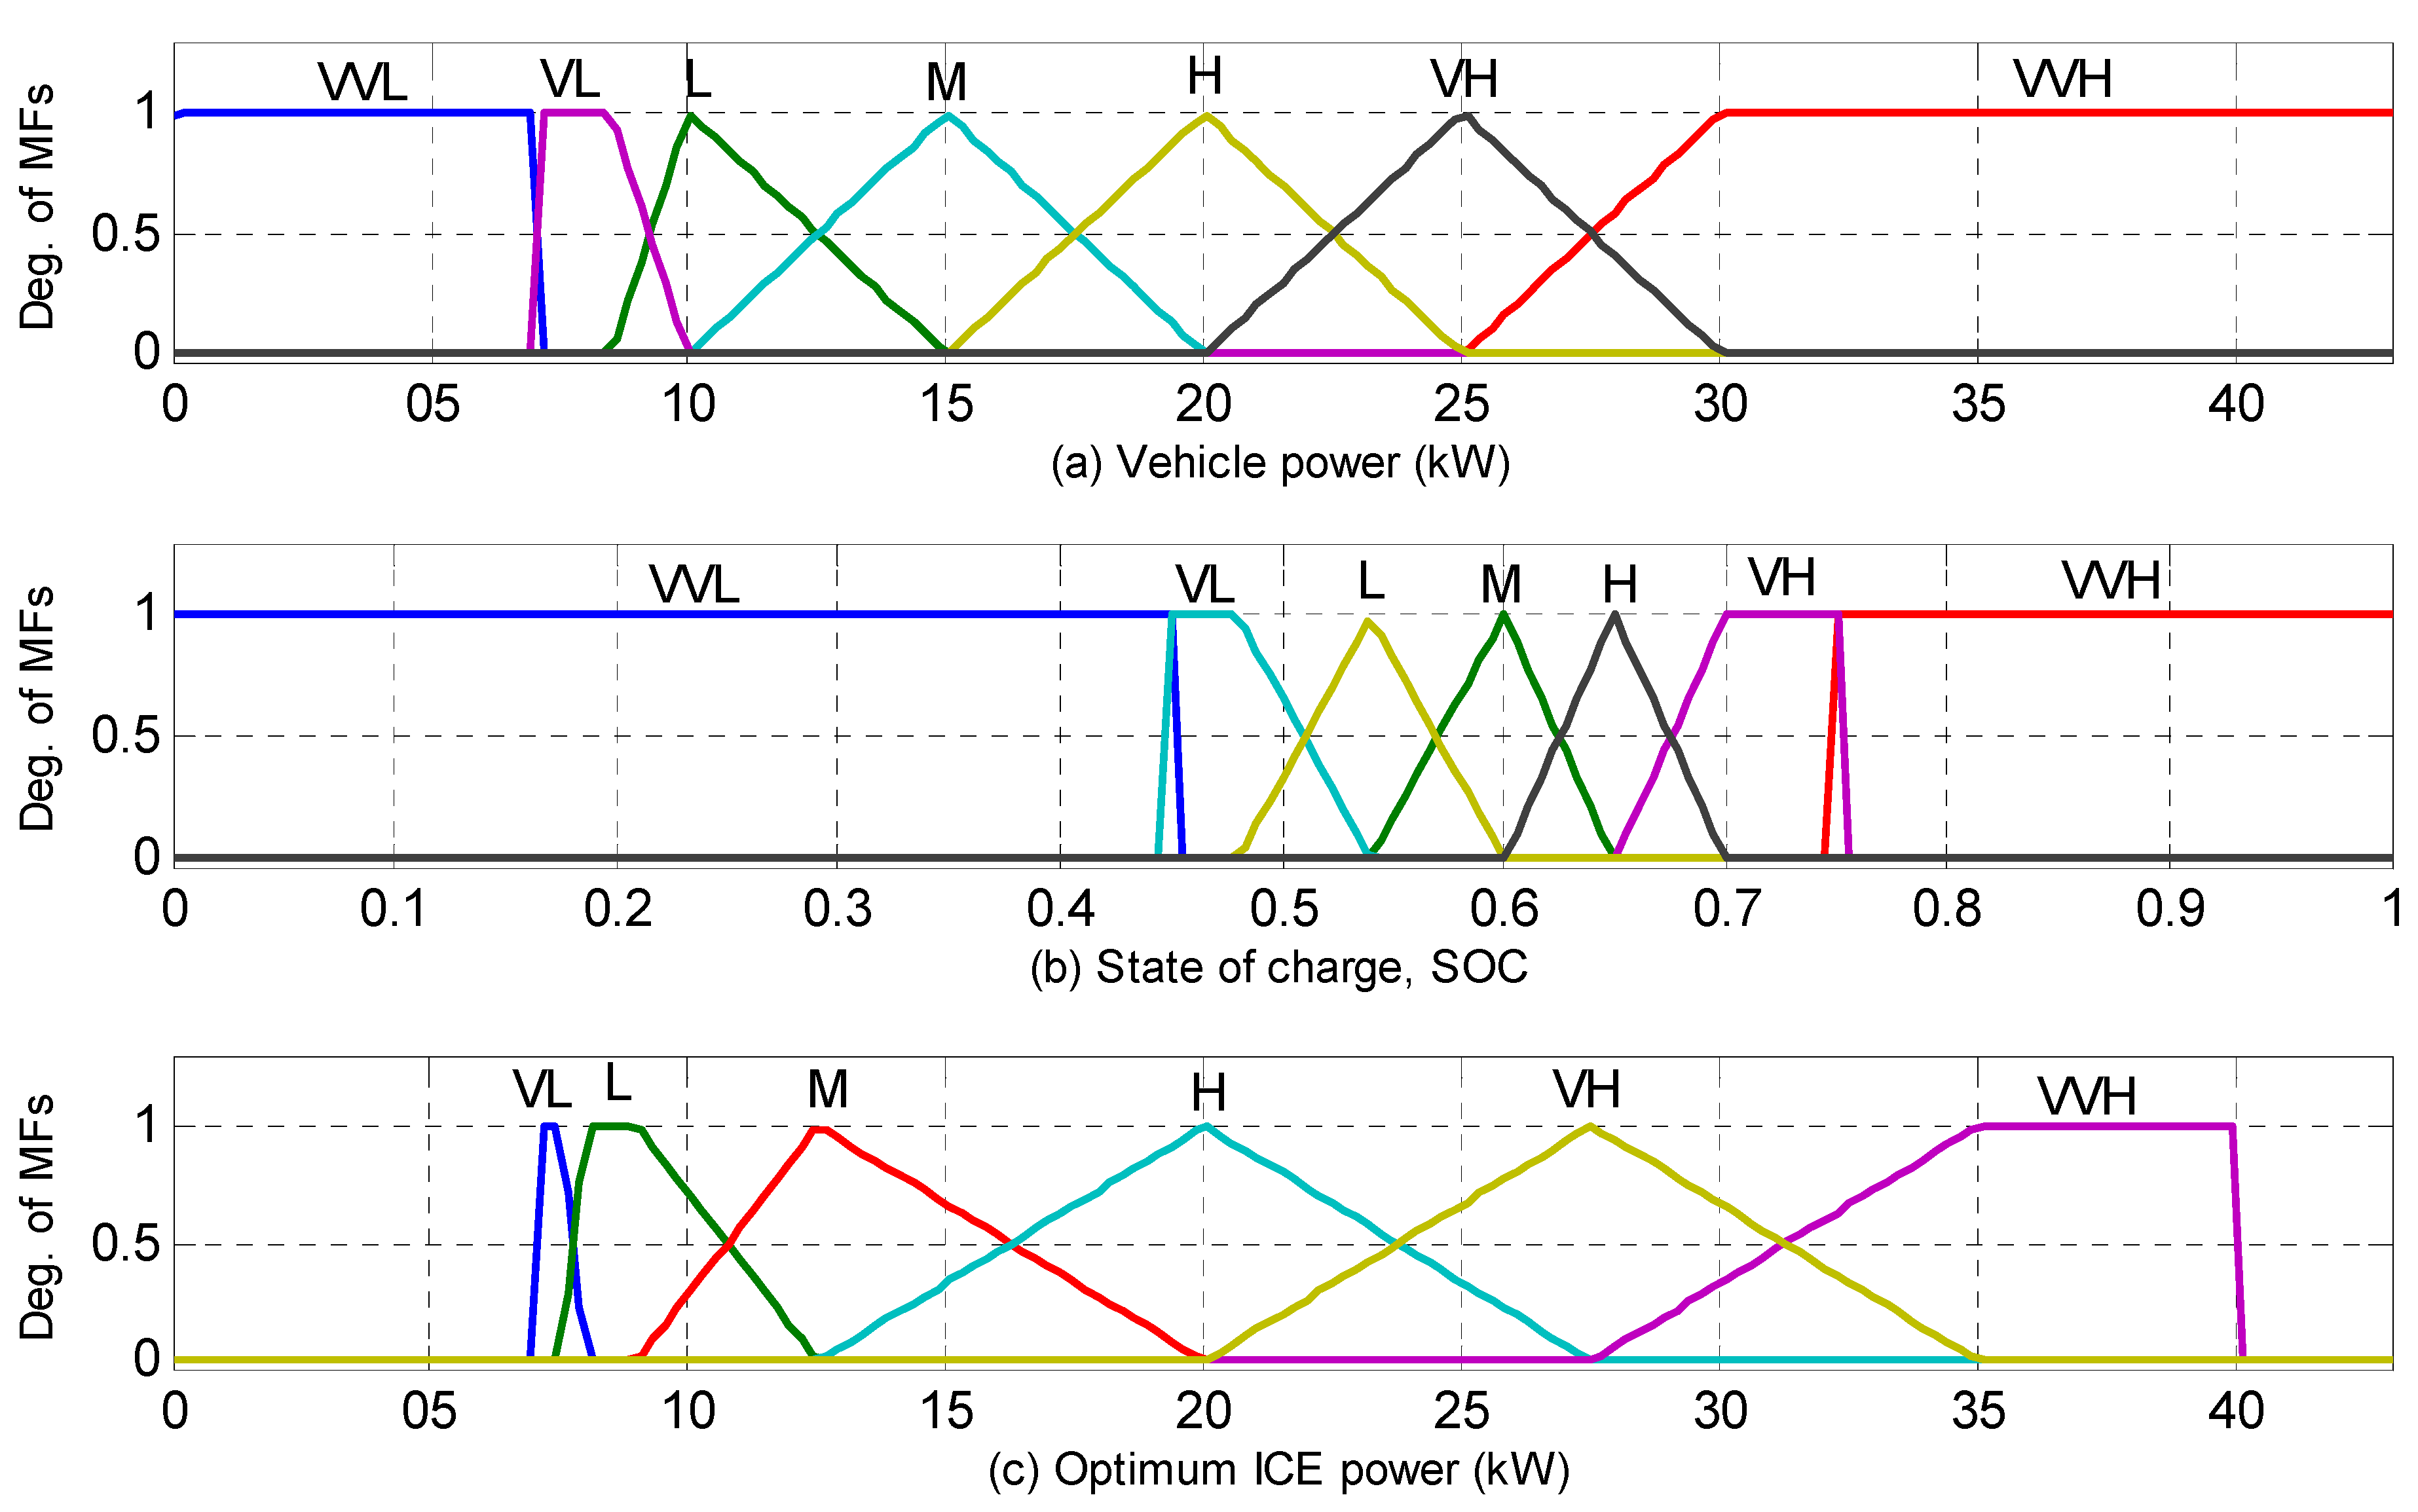
2.1.1. Input/Output Membership Functions

In this paper, the HEV is equipped with a PM-EVT system, so the design of the distribution factor is different from that of conventional HEVs. The proposed Membership Functions (MFs) are developed based on the pre-calculated limits of vehicle components, ICE, PMSM-EVT machines and battery’s SOC. Figure 3 shows the input and output variables describing their boundaries and depicts the shape and ranges of the concourses. Also, the braking power calculated from the vehicle velocity and deceleration is first estimated, and then classified into {VL; L; M; H; VH} which represent the vehicle’s power stored from the minimum value of 0 kW, at stopping, to the maximum negative value of 40 kW as shown in Figure 3a. The vehicle velocity range is divided into five overlapped levels {VL; L; M; H; VH} which represent the velocity from 0 Km/h to the maximum velocity of 92 Km/h as seen in Figure 3b. The battery SOC is classified into {VL; L; M; H; VH}; which could reflect SOC from 0 to 1 dividing the permitted operating range into three concourses starting from the lower value of 0.45 to the higher value of 0.75 with the target value of 0.6 as depicted in Figure 3c. Finally, Figure 3d displays the regenerative braking factor which classified into five concourses {VL; L; M; H; VH}. These concourses represent the range of  K d from the minimum value of 0 to the maximum of 1. For  K d , the concourse VL means minimum regenerative power   K d 0 ; while VH means most of the kinetic stored power on the vehicle ( 60  % ) will be recovered to battery via the EVT machines.
Figure 3. Membership functions of the regenerative fuzzy logic: (a) vehicle braking power; (b) Velocity of vehicle; (c) SOC of battery; (d) Regenerative distribution factor.
Energies 05 01175 g003

2.1.2. Fuzzy Logic Rules

The proposed fuzzy rule base was developed from three inputs: The vehicle speed, the vehicle’s braking power, and the battery SOC. These inputs are fuzzified and then fed into the fuzzy controller. The optimal rule base was found from experimentation with the system. The regenerative factor   K d   is the output variable of the defuzzification process. In turns, this factor determines the magnitude of the regenerative torque for the EVT machines as illustrated in Figure 2. The performance of the FLC depends heavily on its fuzzy rules. The rule base for the 125 rules is built to relate the three inputs with the output factor. Each of the inputs and output has five linguistic variables. The relation between the input and the output variables can be clearly related in the surface plot as shown in Figure 4. These rules for managing the regenerative process are explained below.
Figure 4. Surface plot for the regenerative FLC variables: (a) Effect of SOC and vehicle velocity on Kd; (b) Effect of SOC and vehicle power on Kd; (c) Effect of vehicle power and velocity on Kd.
Energies 05 01175 g004
  • If SOC is very high (VH), i.e.,   S O C S O C h i g h   , the engine is turned OFF and K d is very low (VL) i.e., K d = 0 (no regenerating power required from the EVT machines) whatever the velocity and stored braking power are, see Figure 4a,b.
  • If SOC is (VL), i.e.,   S O C S O C l o w , the engine is turned ON and K d is VH i.e., K d = m a x   (maximum power is recovered from the braking power via the EM2 machine and no friction braking), this for all velocities and for all stored braking power except two cases: The first exception is when the vehicle runs at very low velocity, K d has to be decreased because it is not preferable to operate the EVT machines as generators at very low speeds; the second exception is when the vehicle runs at very high speed, K d has to be changed from H to VL gradually according to the SOC and the braking power, see Figure 4a,b.
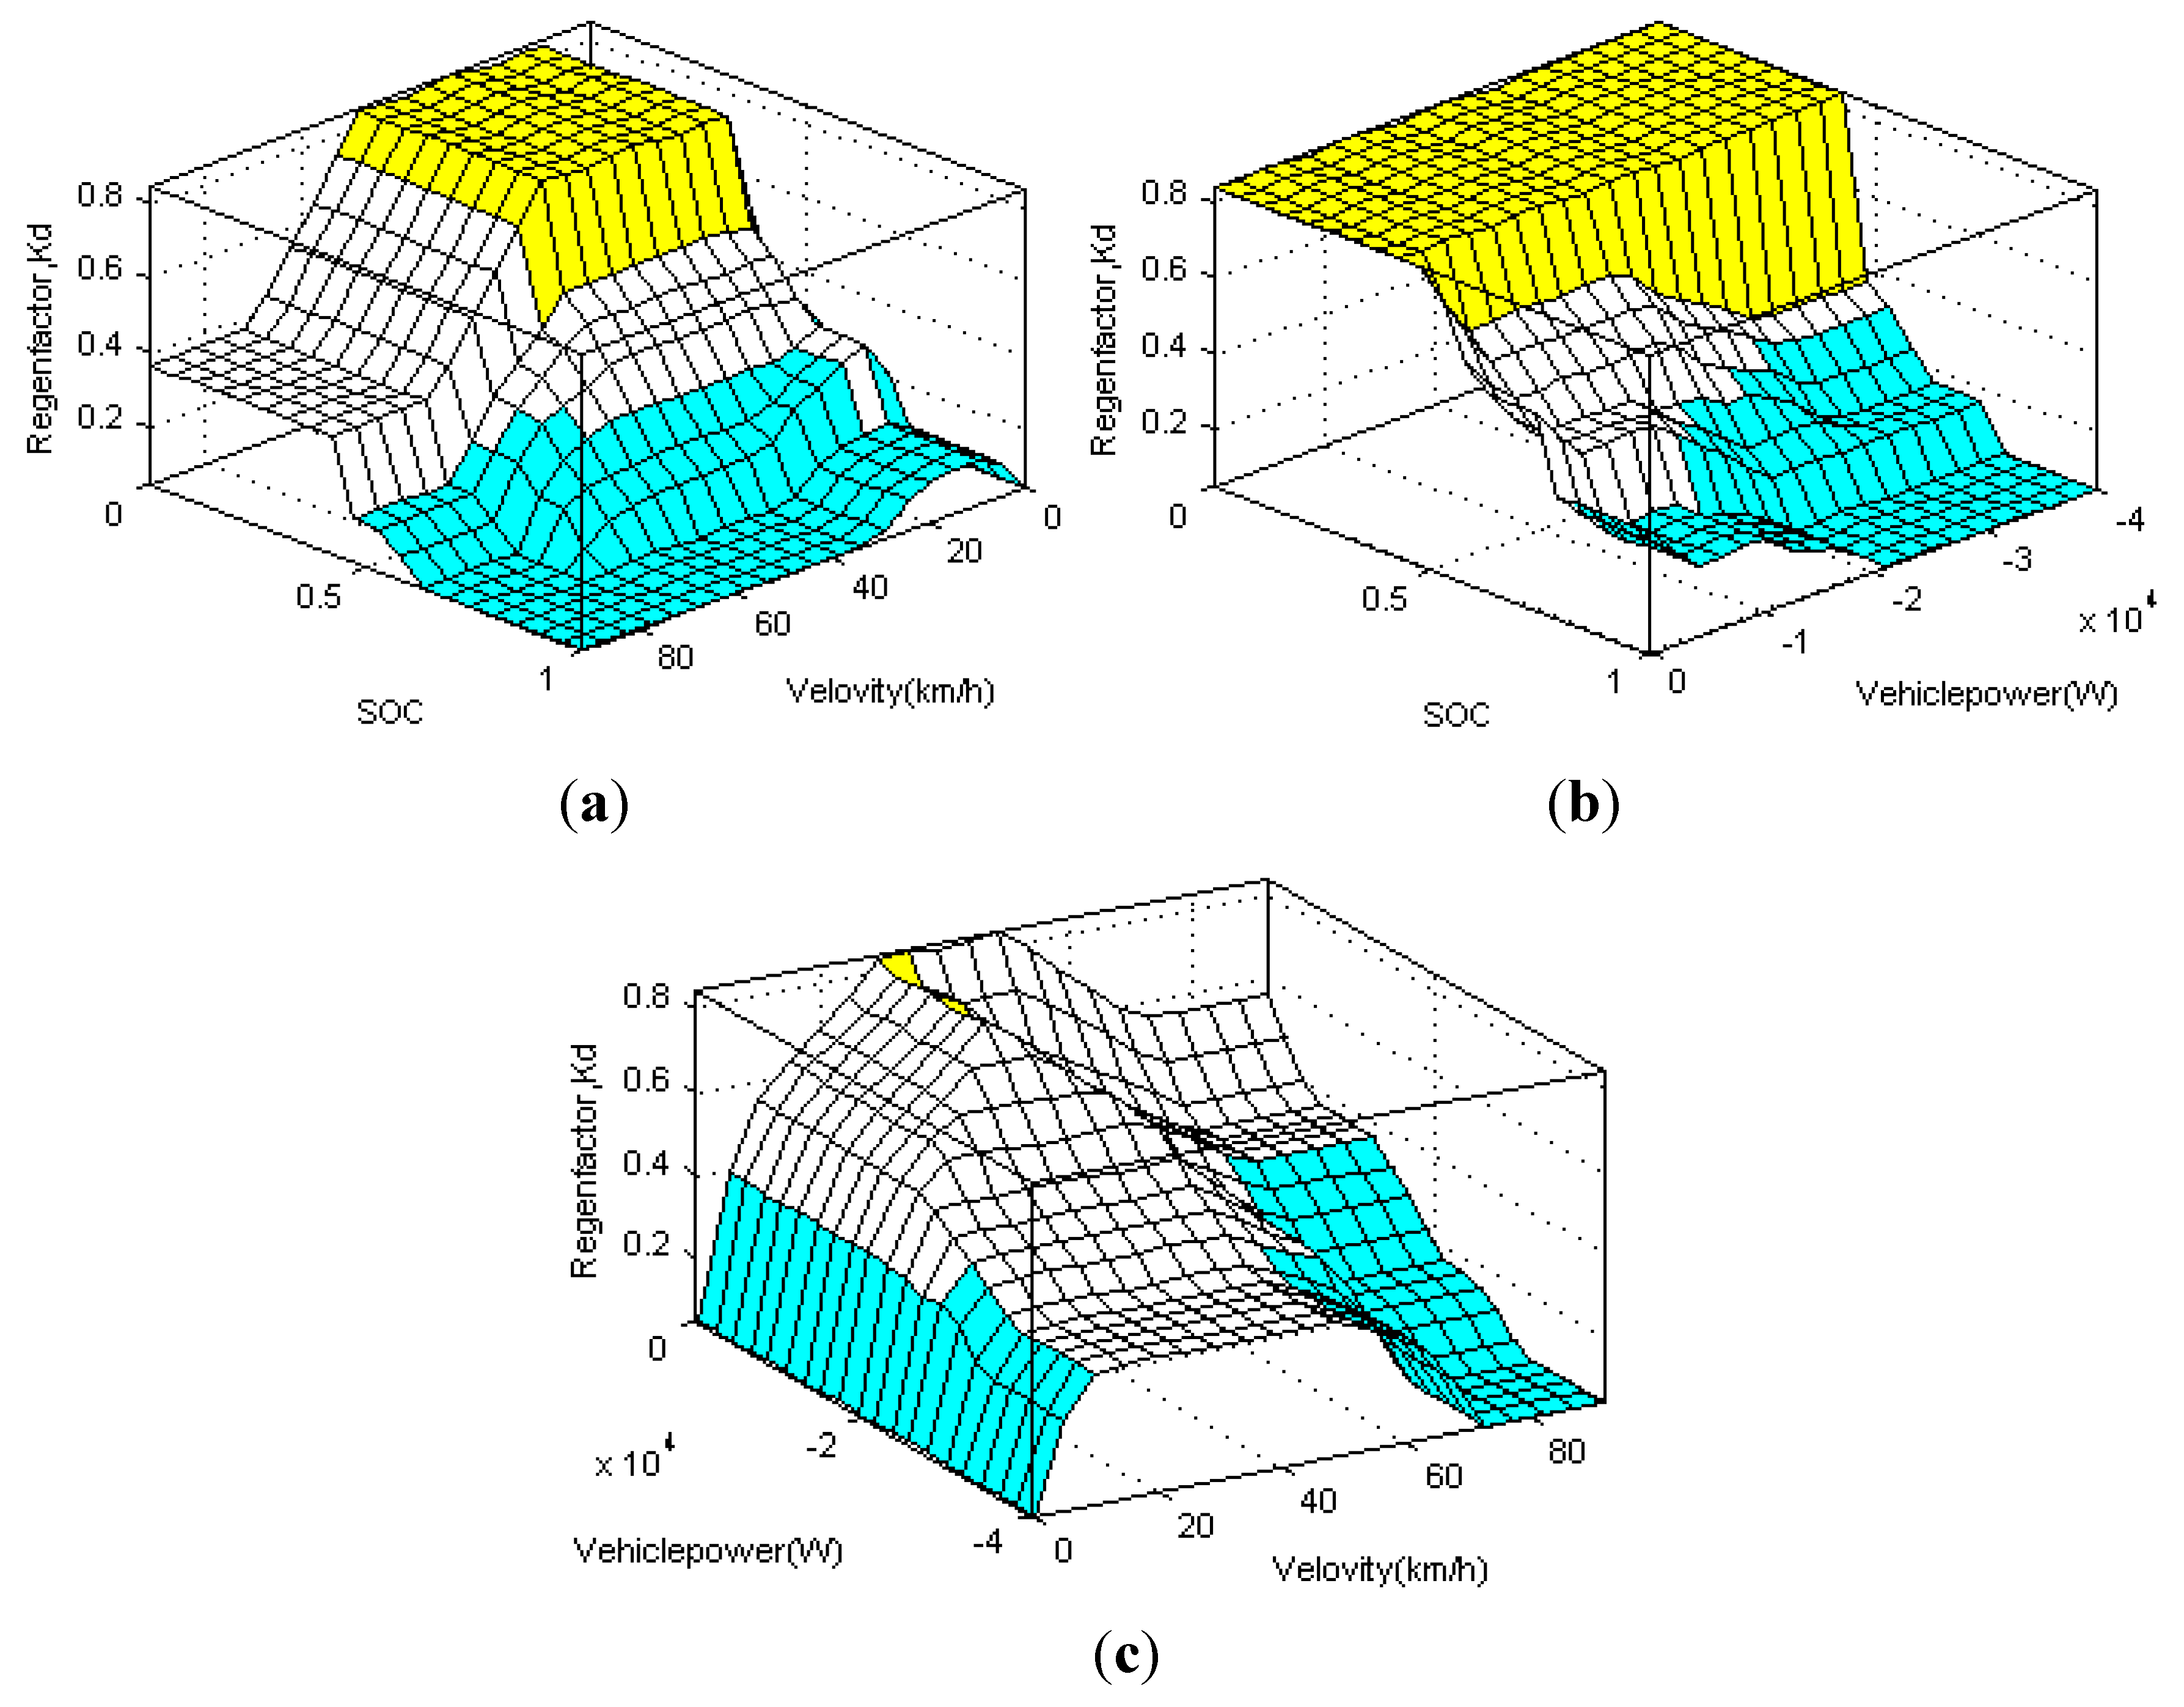
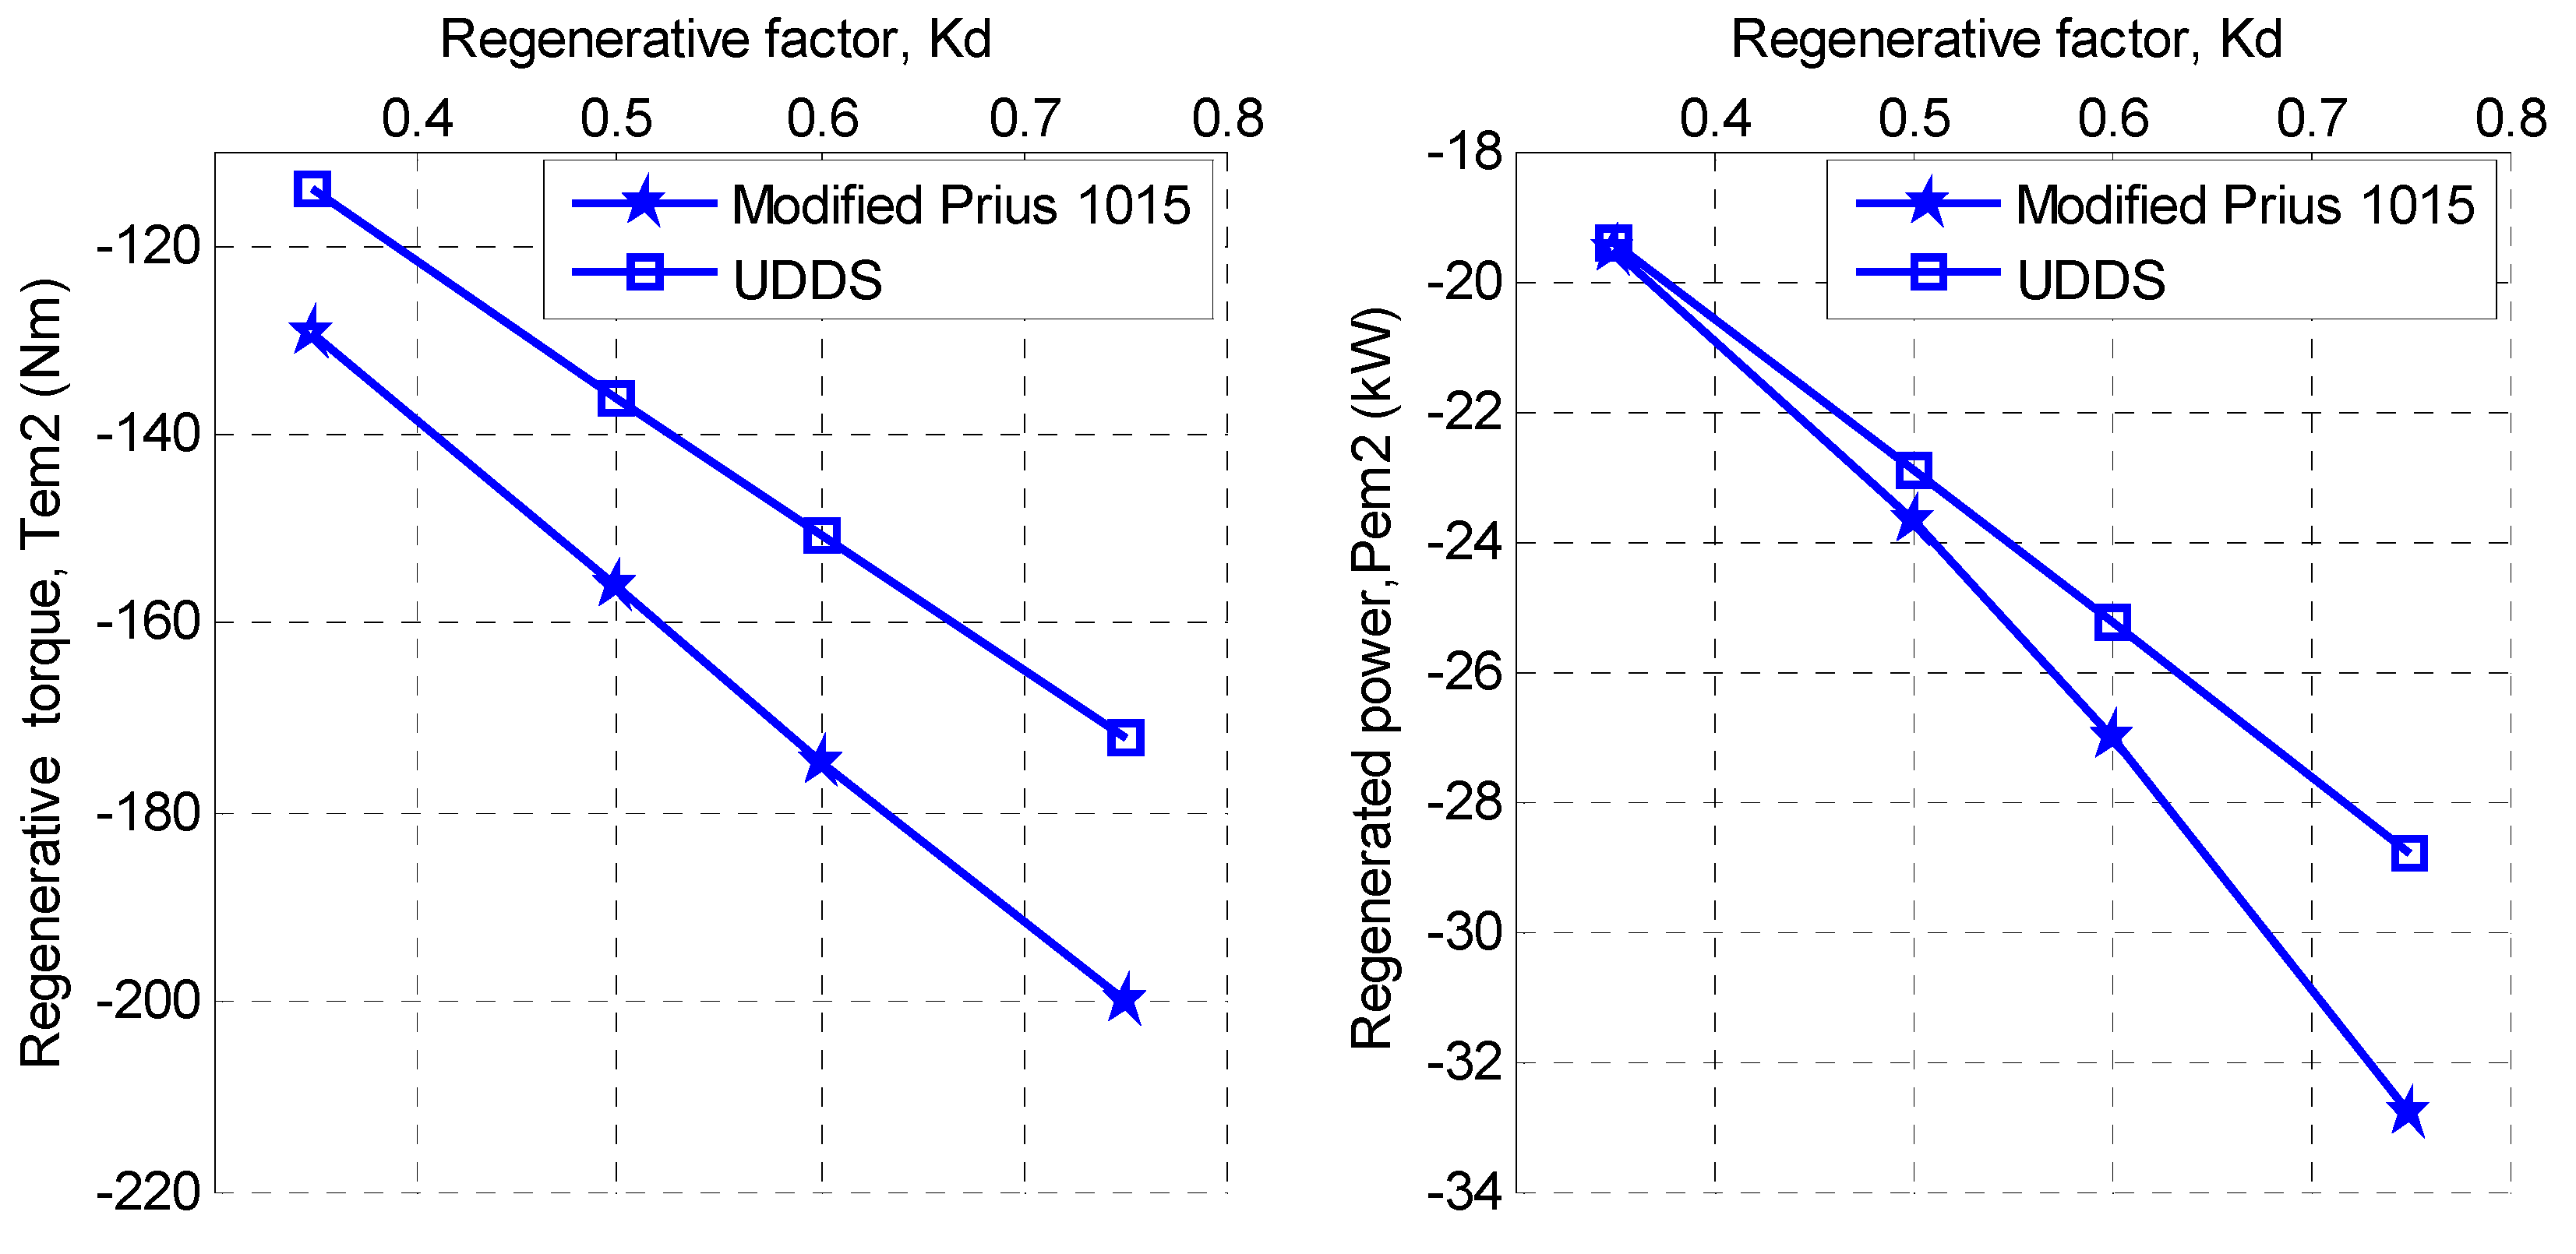
  • At all SOC, when the vehicle velocity increases, the regenerative torque of EM2 decreases (i.e., K d decreases) to save power bounds of the machine as shown in Figure 4a.
  • At all SOC, when the braking power increases, the regenerative factor decreases, as shown in Figure 4b.
  • At all braking power and all velocities, K d decreases with the increase of the SOC above the target value, as shown in Figure 4a,b.
  • Regardless the SOC, the regenerative factor K d is designed such that it increases gradually with the increases both of velocity and braking power, as shown in Figure 4c. Maximum factor can be safely obtained at the rated velocity and rated power of EM2.
  • At very high velocities, K d   has to be decreased to keep the vehicle more stable while the vehicle is broken. Also K d has to be decreased when the braking power exceeds the maximum power of EM2, as shown in Figure 4c.

2.2. Implementation of Fuzzy Logic ON/OFF Control Strategy of the ICE

The ICE ON/OFF FLC strategy guarantees the operation of the battery at the target range of SOC. Also, it switches the engine ON when the required torque at the wheels exceeds the available torque of the EVT machines whatever the SOC is. The membership functions and the fuzzy logic rules are designed carefully according to ratings of the power plants and the proposed driving strategy. There are two basic design elements in fuzzy control, i.e., description of the MFs of the fuzzy variables as shown in Figure 5, and the rule matrix shown in Table 1. The universe of discourse for each one of the fuzzy variables (vehicle’s torque, SOC, and ON/OFF state) spreads in the region that corresponds to its own bounds.
Figure 5. Membership functions of fuzzy ON/OFF controller variables of the ICE: (a) Vehicle torque; (b) SOC of battery; (c) Switching state of the engine (ON/OFF).
Energies 05 01175 g005

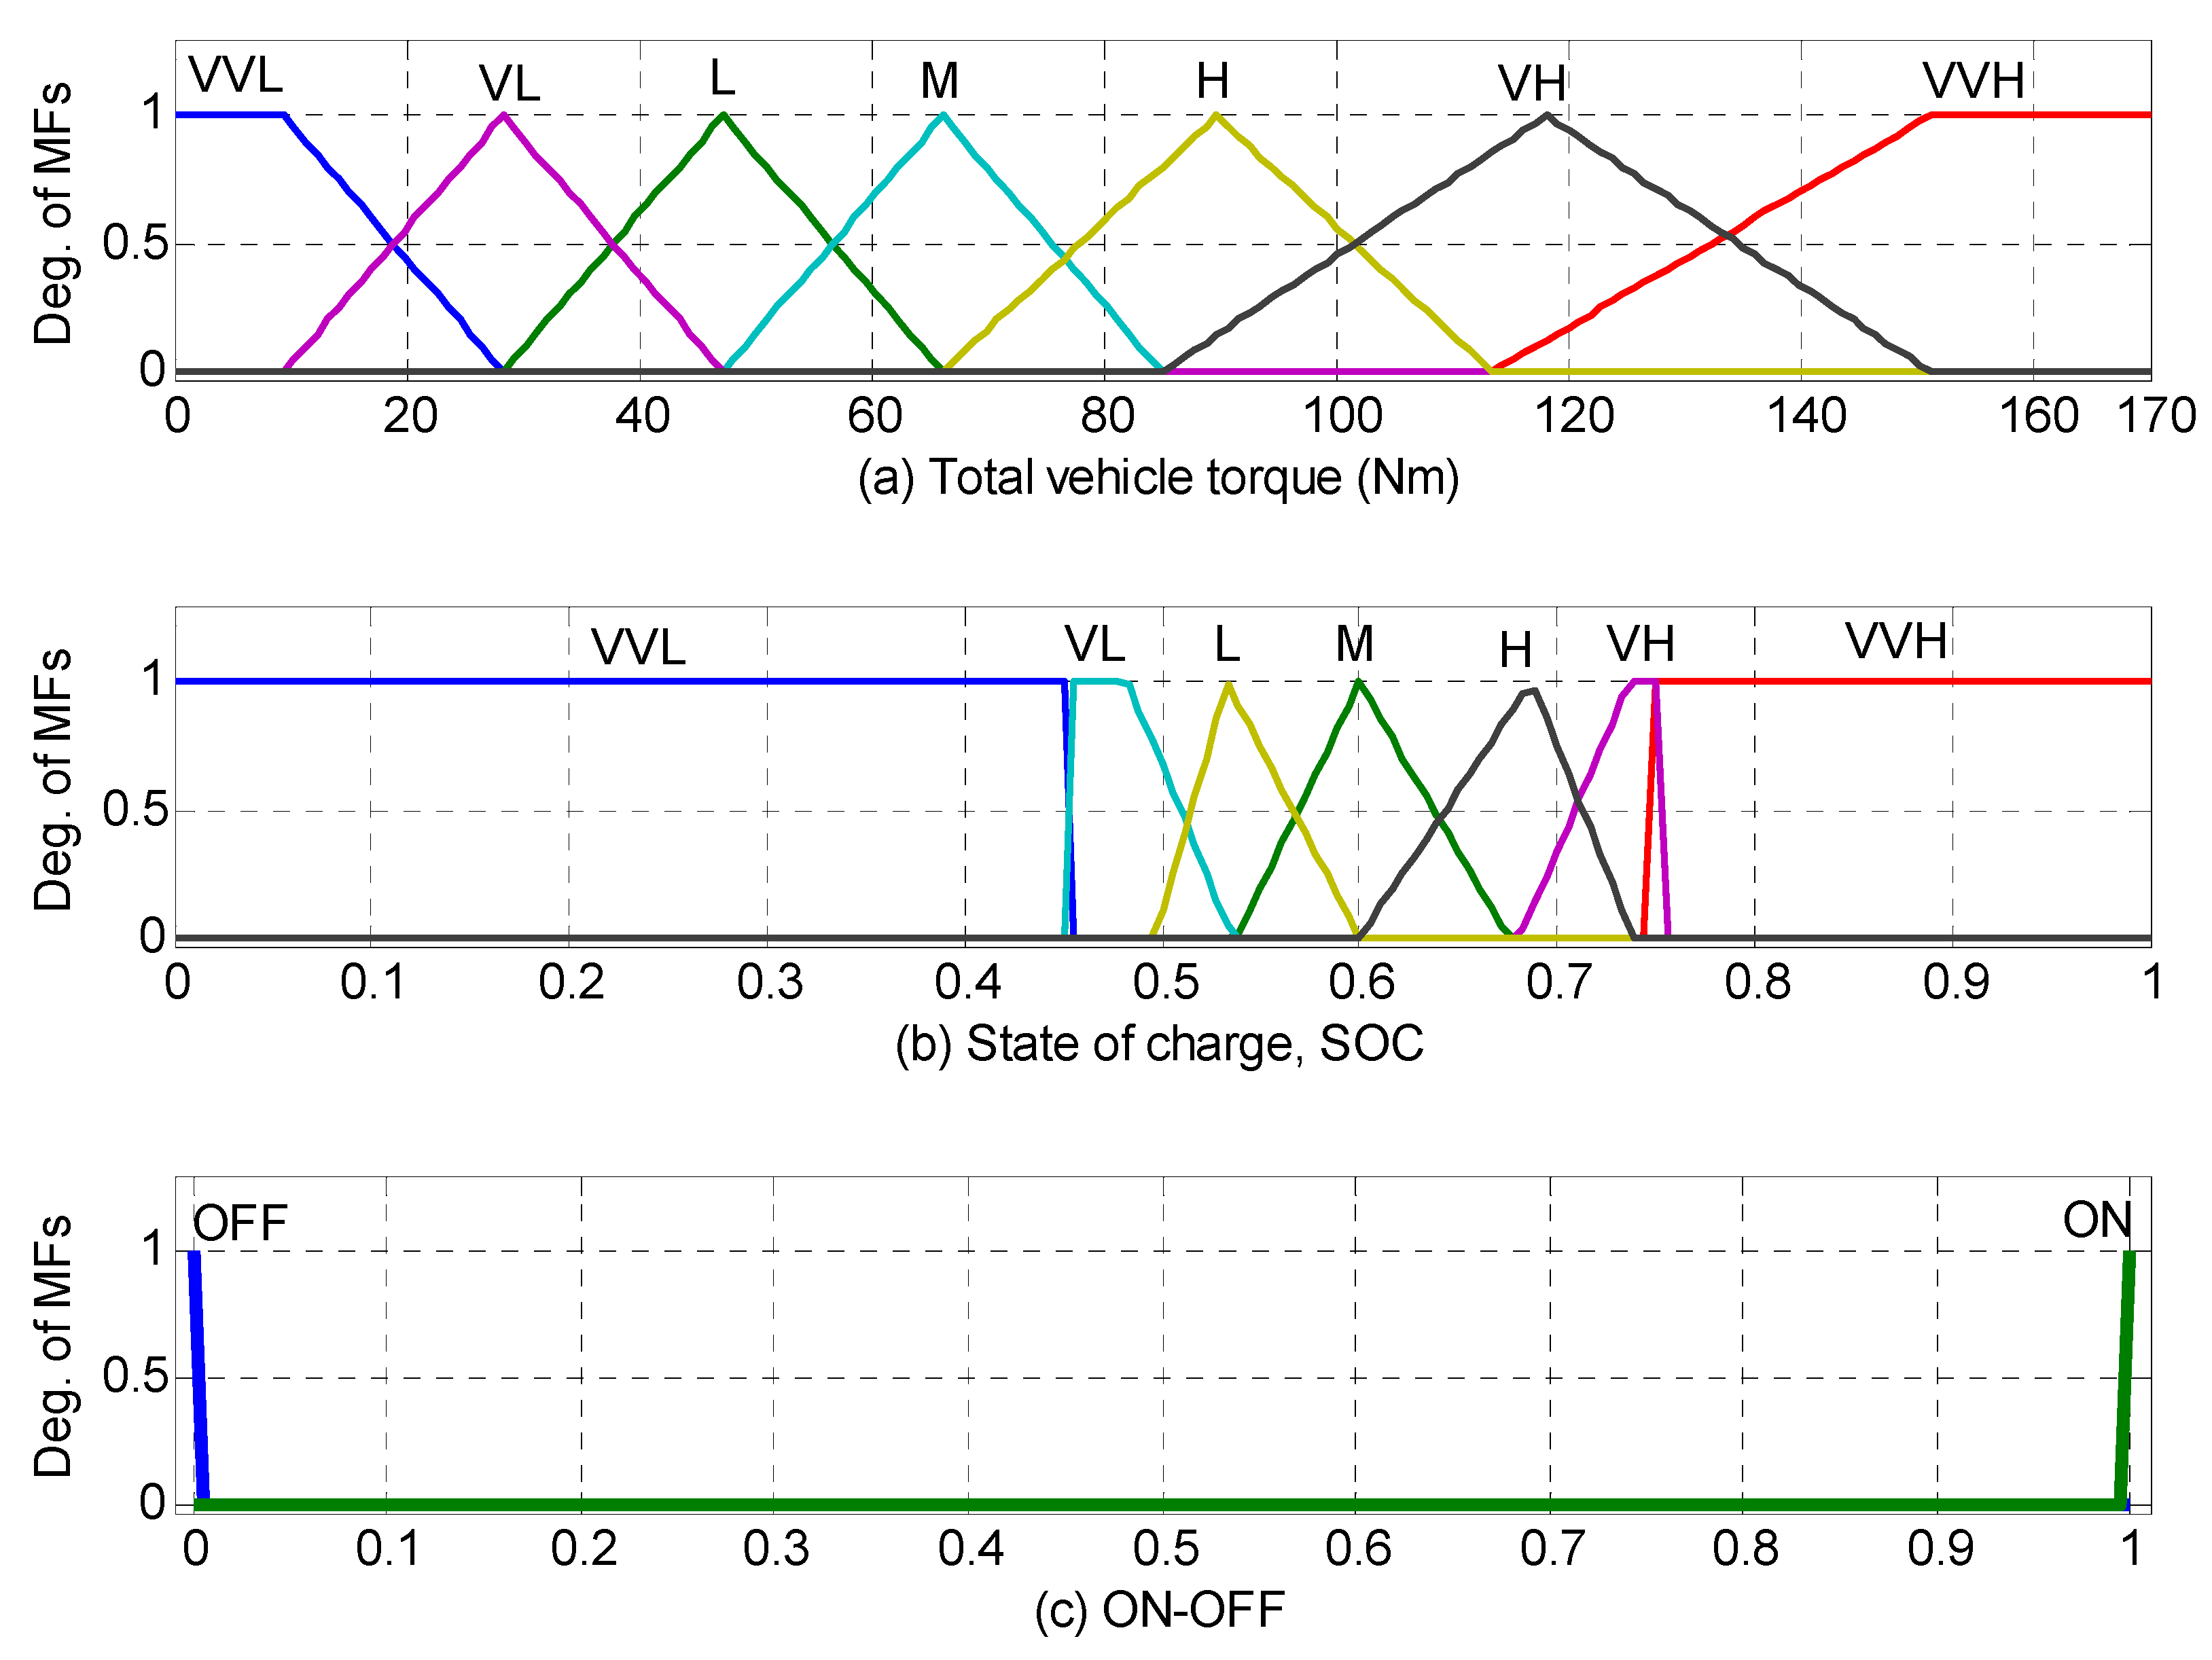
2.2.1. Input/Output Membership Functions

The proposed MFs are developed based on the vehicle specifications and battery’s SOC. The MFs of the input and output variables are described in Figure 5. The input variables have seven MFs, whereas the output variable has two MFs. The demanded torque calculated from the vehicle velocity and acceleration is first estimated, and then classified into {VVL; VL; L; M; H; VH; VVH} which represent the vehicle torque demand from the minimum value of 0 Nm to the maximum value of 170 Nm, as shown in Figure 5a. The battery SOC is classified into {VVL; VL; L; M; H; VH; VVH}; which could reflect SOC from 0 to 1 dividing the permitted operating range into five concourses starting from the lower value of 0.45 to the higher value of 0.75 with the target value of 0.6 as depicted in Figure 5b. Asymmetrical triangular MFs have been selected in this design which causes crowding near the target value of SOC and, therefore, give more precision. Also, the output of the ON/OFF switch of ICE is classified into {ON; OFF}, Figure 5c.

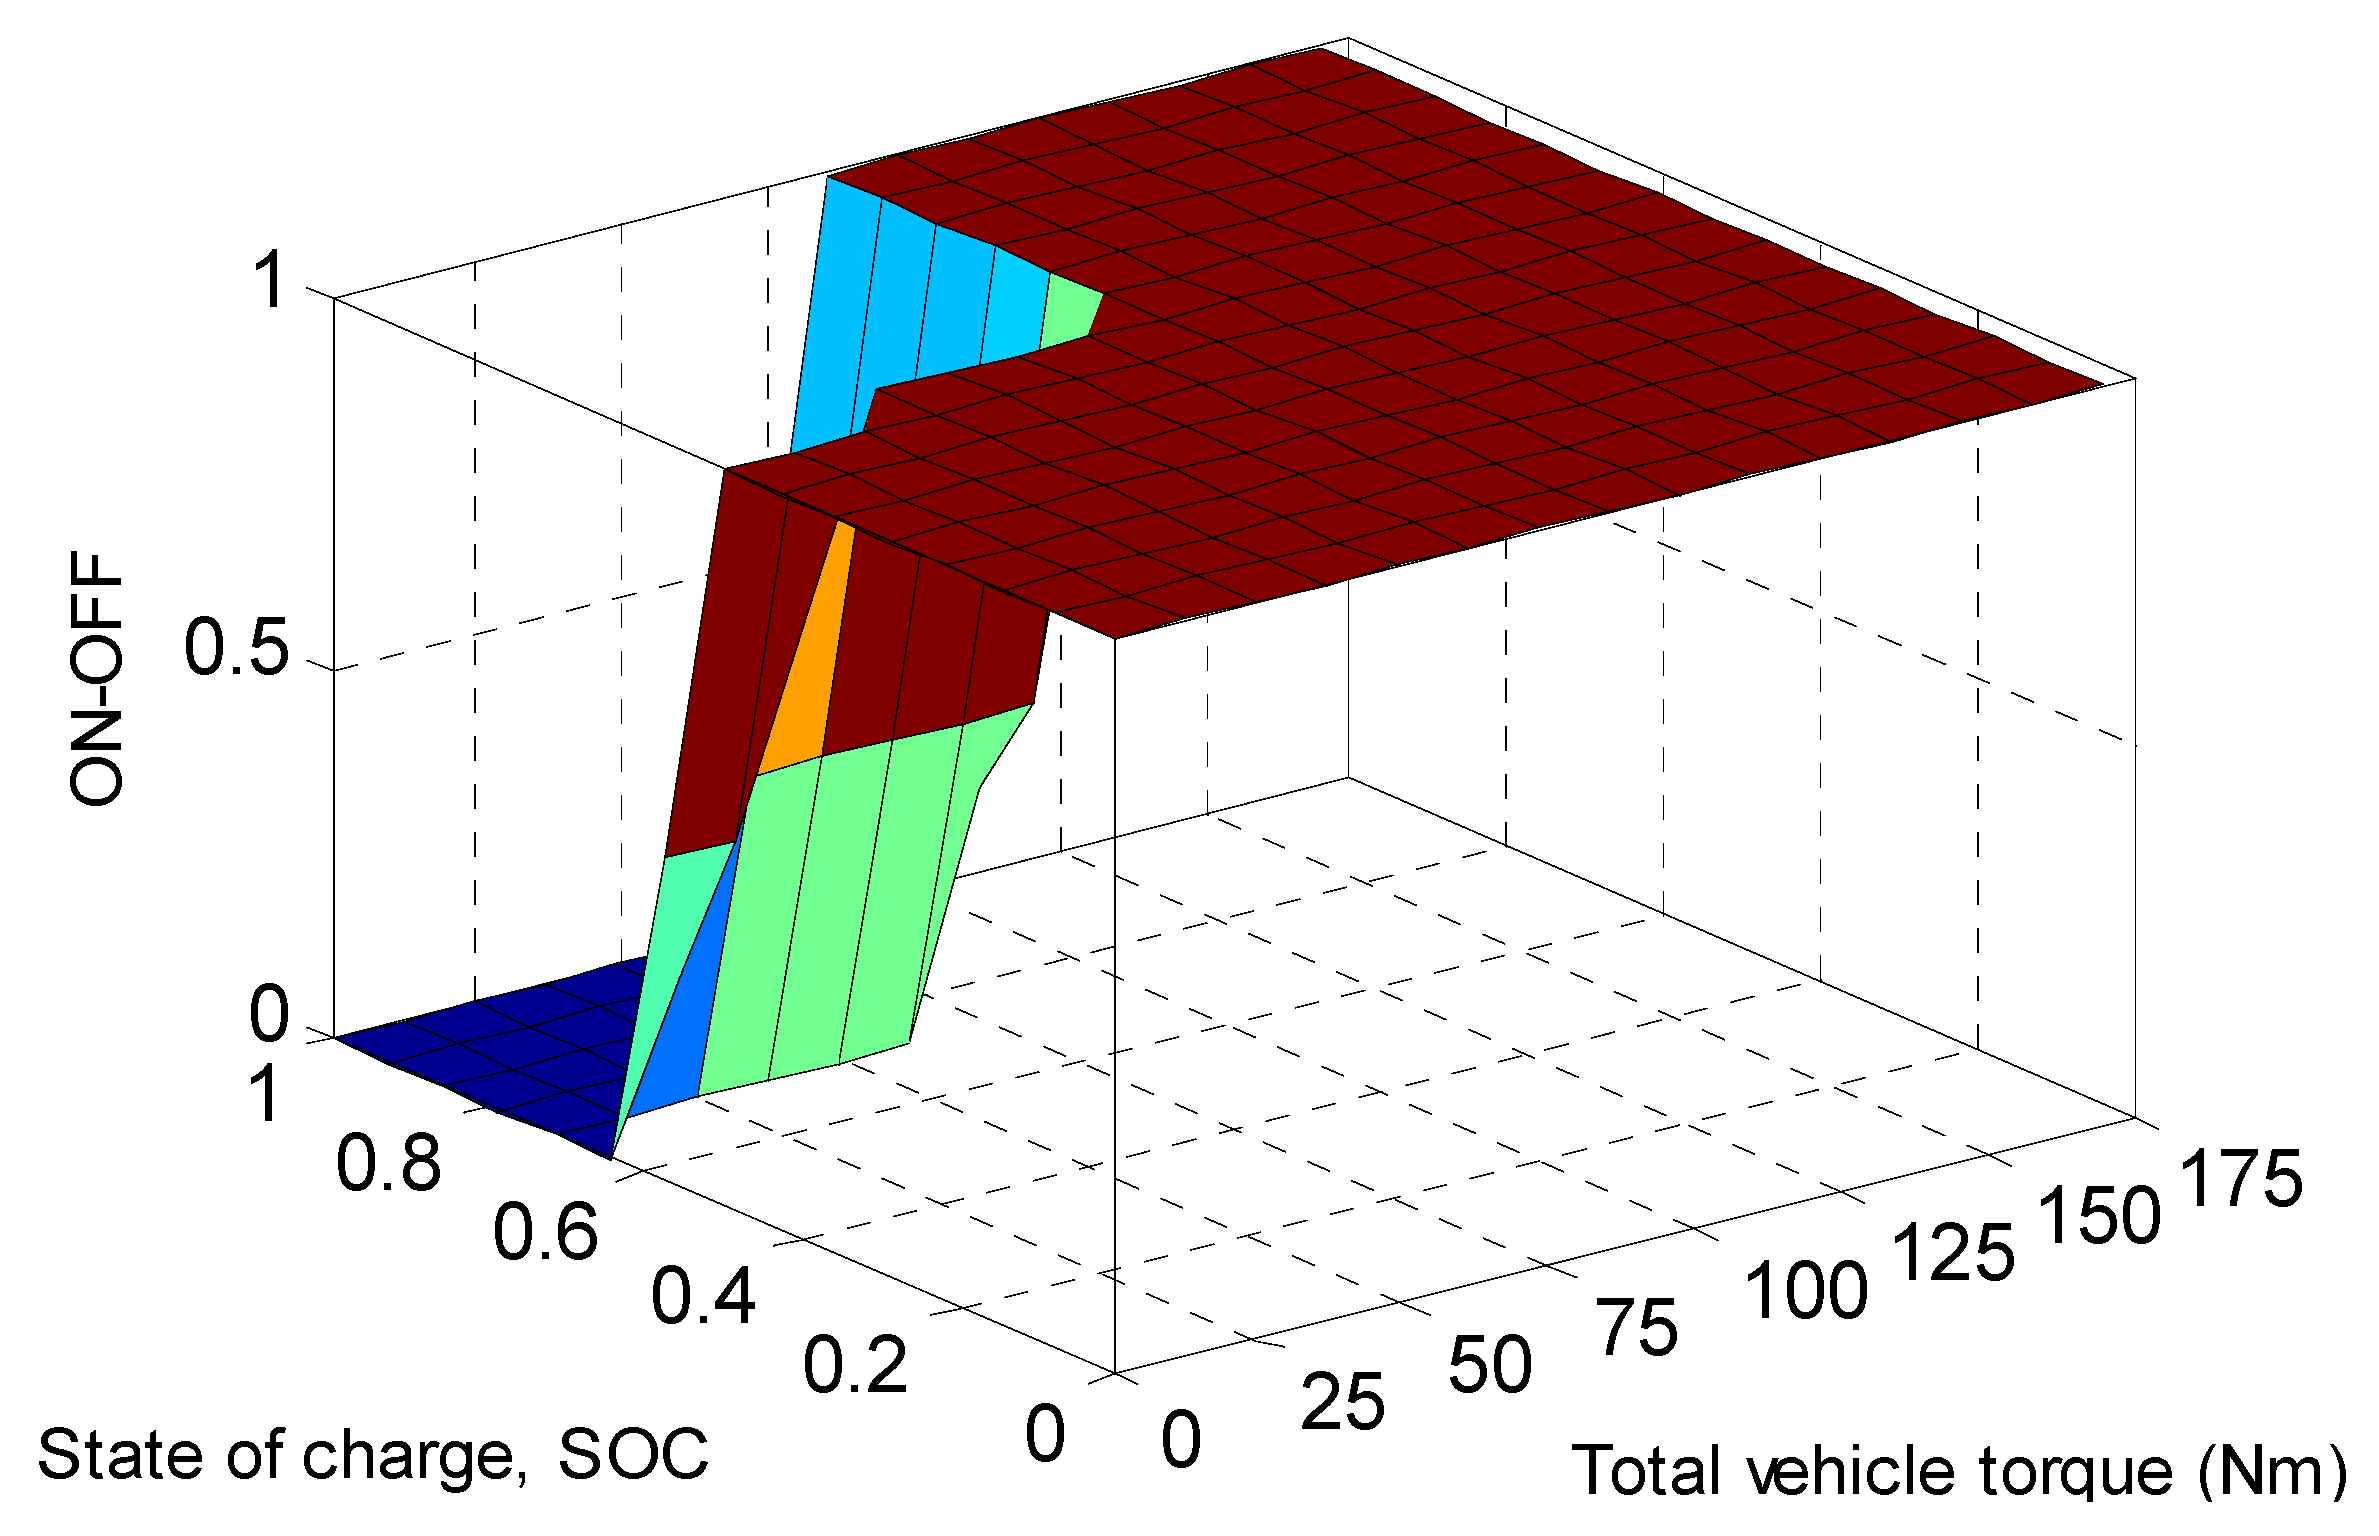
2.2.2. Rule Table for the Fuzzy Logic ON/OFF ICE Controller

A charge sustaining strategy which maintains the battery SOC within a normal range is included in this controller. The principle of this strategy is to prevent battery depletion on the basis of satisfying the driver’s demand, so in this controller, the shapes and boundaries of the MFs are carefully designed to sustain the SOC at its target range. Also, the ICE switches OFF when the vehicle’s torque is within hand of the EVT machines without overload. The fuzzy logic rule bases are presented in Table 1 and the surface plot for the FLC variables is shown in Figure 6.
Table 1. Rule table for fuzzy logic ICE ON/OFF controller.
Vehicle TorqueSOC (State of Charge)
VVL [0–0.45]VL [0.45–0.53]L [0.49–0.6]M [0.53–0.6–0.67]H [0.6–0.74]VH [0.68–0.75]VVH [0.75–1.0]
VVL [0–28]ONONONOFFOFFOFFOFF
VL [10–47]ONONONOFFOFFOFFOFF
L [28–66]ONONONONOFFOFFOFF
M [47–85]ONONONONOFFOFFOFF
H [66–113]ONONONONONONON
VH [85–150]ONONONONONONON
VVH [113–100]ONONONONONONON
Figure 6. Surface plot for the FLC variables: Effect of SOC and vehicle driving torque on the ICE state.
Energies 05 01175 g006
The table describes the rule table for a fuzzy ON/OFF controller in PM-EVT-HEV system. The top row and left column describe the sets for the variables SOC and vehicle’s driving torque, respectively; whereas the body of the table describes the sets of the output variable ON/OFF state of the engine. Because there are seven sets for each input variable, there are altogether 7 × 7 = 49 rules in the table.

2.3. Implementation of ICE Fuzzy Logic Controller

The ICE-FLC strategy is responsible for guaranteeing the operation of the engine in its maximum efficiency region. Using the EVT machines for driving HEVs neglects the proportionality between the operating points of the vehicle and the optimum operating points delivered by the ICE. Hence in this type of vehicles, the optimum power of the engine, as the output of the FLC, is determined only according to the power of the vehicle and SOC of the battery, as the inputs of the controller. The MFs and the fuzzy logic rules are designed carefully according to plants’ ratings and the proposed driving strategy.

2.3.1. Input/Output Membership Functions

The proposed MFs are developed based on the limits of vehicle performance, PMSM-EVT machines and battery’s SOC. The MFs of the input and output variables are described in Figure 7.
Figure 7. MFs of the ICE fuzzy controller: (a) Vehicle power; (b) SOC of battery; (c) Power of ICE.
Energies 05 01175 g007
The demanded power calculated from the vehicle velocity and acceleration is first estimated, and then classified into {VVL; VL; L; M; H; VH; VVH} which represent the vehicle power demand from the minimum value of 0kW to the maximum value of 43 kW. As shown in Figure 7a, the most operating power of the vehicle is divided into five concourses with overlapping starting from 7 kW to 30 kW; whereas the power below 7 kW and the power behind 30 kW represent the lowest and highest requested powers, respectively. These powers can only be used at the emergency cases. The battery SOC is classified into {VVL; VL; L; M; H; VH; VVH}; which could reflect SOC from 0 to 1 dividing the permitted operating range into five concourses starting from the lower value of 0.45 to the higher value of 0.75 with the target value of 0.6 as depicted in Figure 7b. Also, the output optimum power of ICE is classified into {VL; L; M; H; VH; VVH}, Figure 7c. These concourses represent the engine power from the minimum optimal value of 7 kW to the maximum optimal power of 40 kW. The overlapping between the concourses guarantees the smooth transition within the optimum operation region. According to engineering expertise and insight, the fuzzy control rules are constructed as shown in Figure 8.
Figure 8. Surface plot of the ICE fuzzy logic variables.
Energies 05 01175 g008

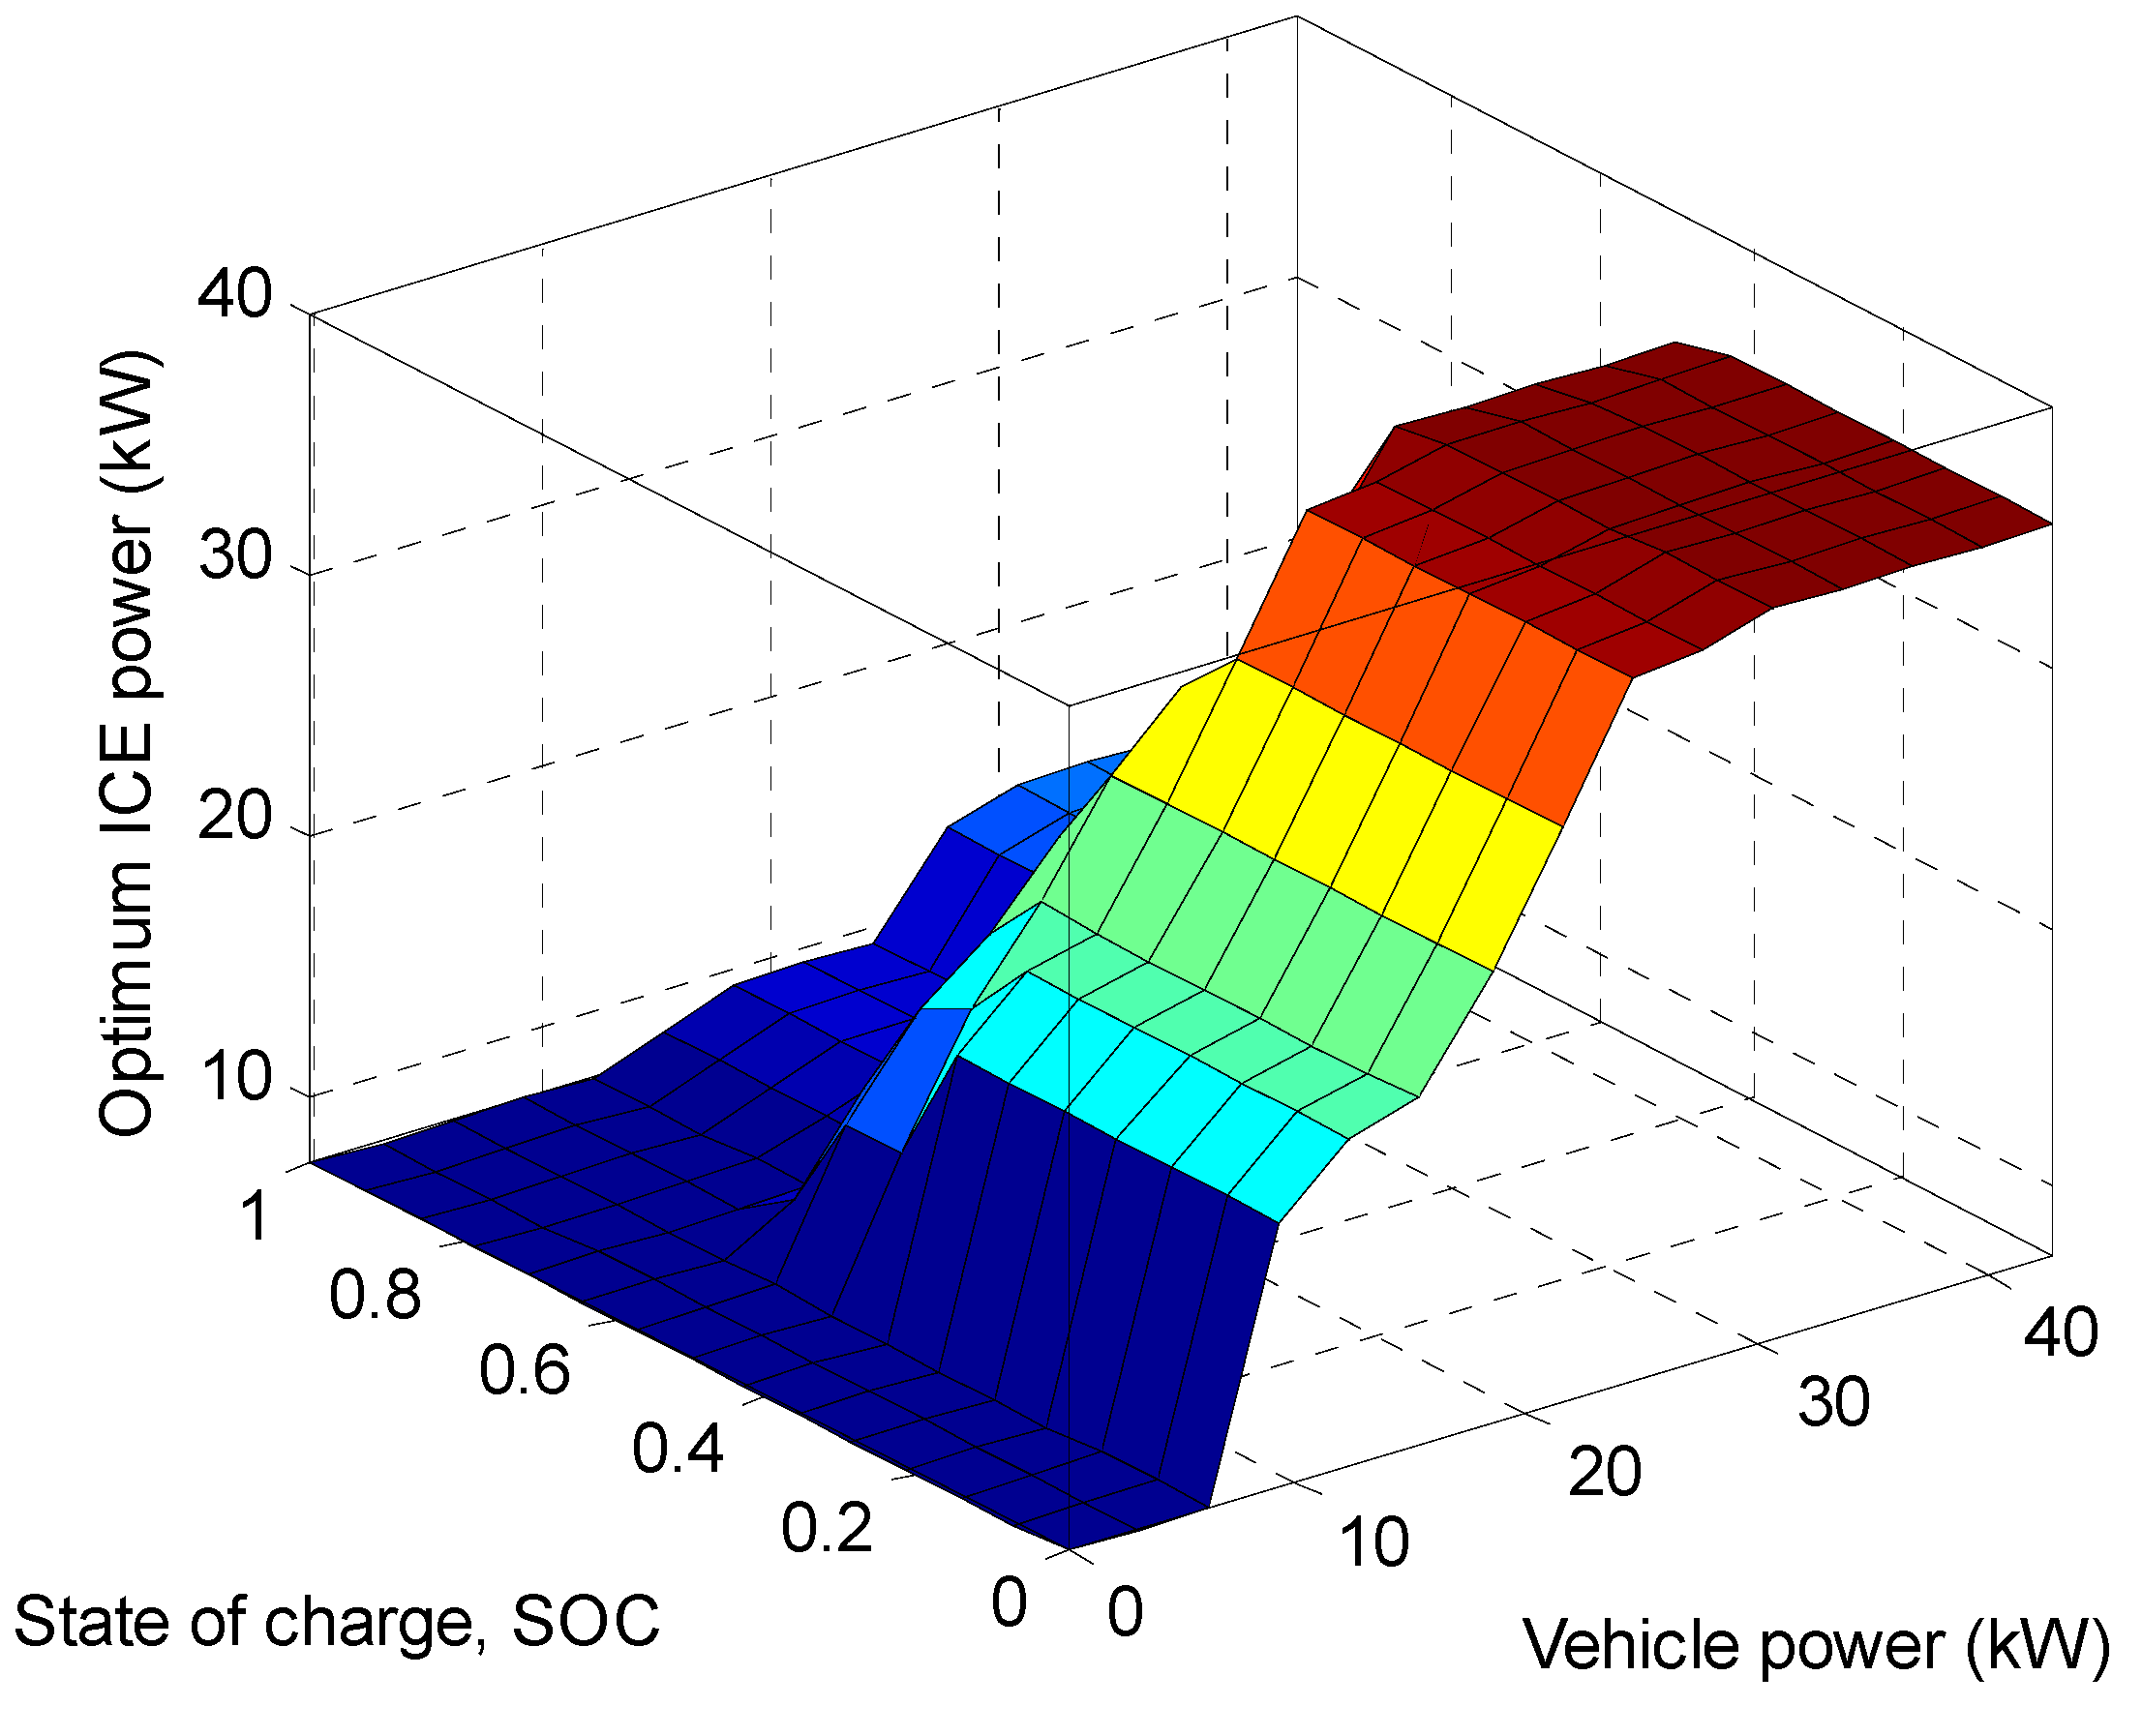
2.3.2. Fuzzy Logic Rules

FLC of the ICE is designed to optimize the power split between the ICE and battery; at the same time, to guarantee the operation of the engine within its optimum power range, form 7 kW to 40 kW. This power is enough to drive the vehicle at cruise velocities, and also for charging the battery at hybrid driving mode. The rule base is presented in Table 2 and it can be described as:
  • At low, medium and high power requested at the vehicle’s wheels, the ICE turns OFF when SOC exceeds the high limit value (0.75) to work as EV mode.
  • At very low power and when the SOC becomes lower than the minimum limit of 0.45, the ICE turns ON and develops at least its minimum optimum vale of 7 KW to work as ICE charging mode.
  • When the vehicle’s power becomes very high, the ICE develops its maximum optimum power and then decreases its output with increasing the SOC of the battery and also with decreasing the vehicle’s power.
The optimum speed and torque of the ICE is estimated from the optimum power of the engine. EM1 is controlled to develop the engine optimum torque at steady state with the same speeds; and the throttle angle of the engine is determined from the optimum engine power.
Table 2. Rule base of the ICE fuzzy logic controller.
Vehicle Power (KW)SOC (State of Charge)
VVL [0–0.45]VL [0.45–0.55]L [0.47–0.6]M [0.55–0.65]H [0.6–0.7]VH [0.65–0.75]VVH [0.75–1.0]
VVL [0–7]LLVLVLVLVLVL
VL [7–10]MLLLVLVLVL
L [8.5–15]HMMLVLVLVL
M [10–20]HHHMVLVLVL
H [15–25]VHVHVHMLLL
VH [20–30]VVHVHVHHMML
VVH [25–43]VVHVVHVVHVHVHHM
Figure 9. The EMR of PMSM-EVT-HEV managed by FL global control strategy.
Energies 05 01175 g009

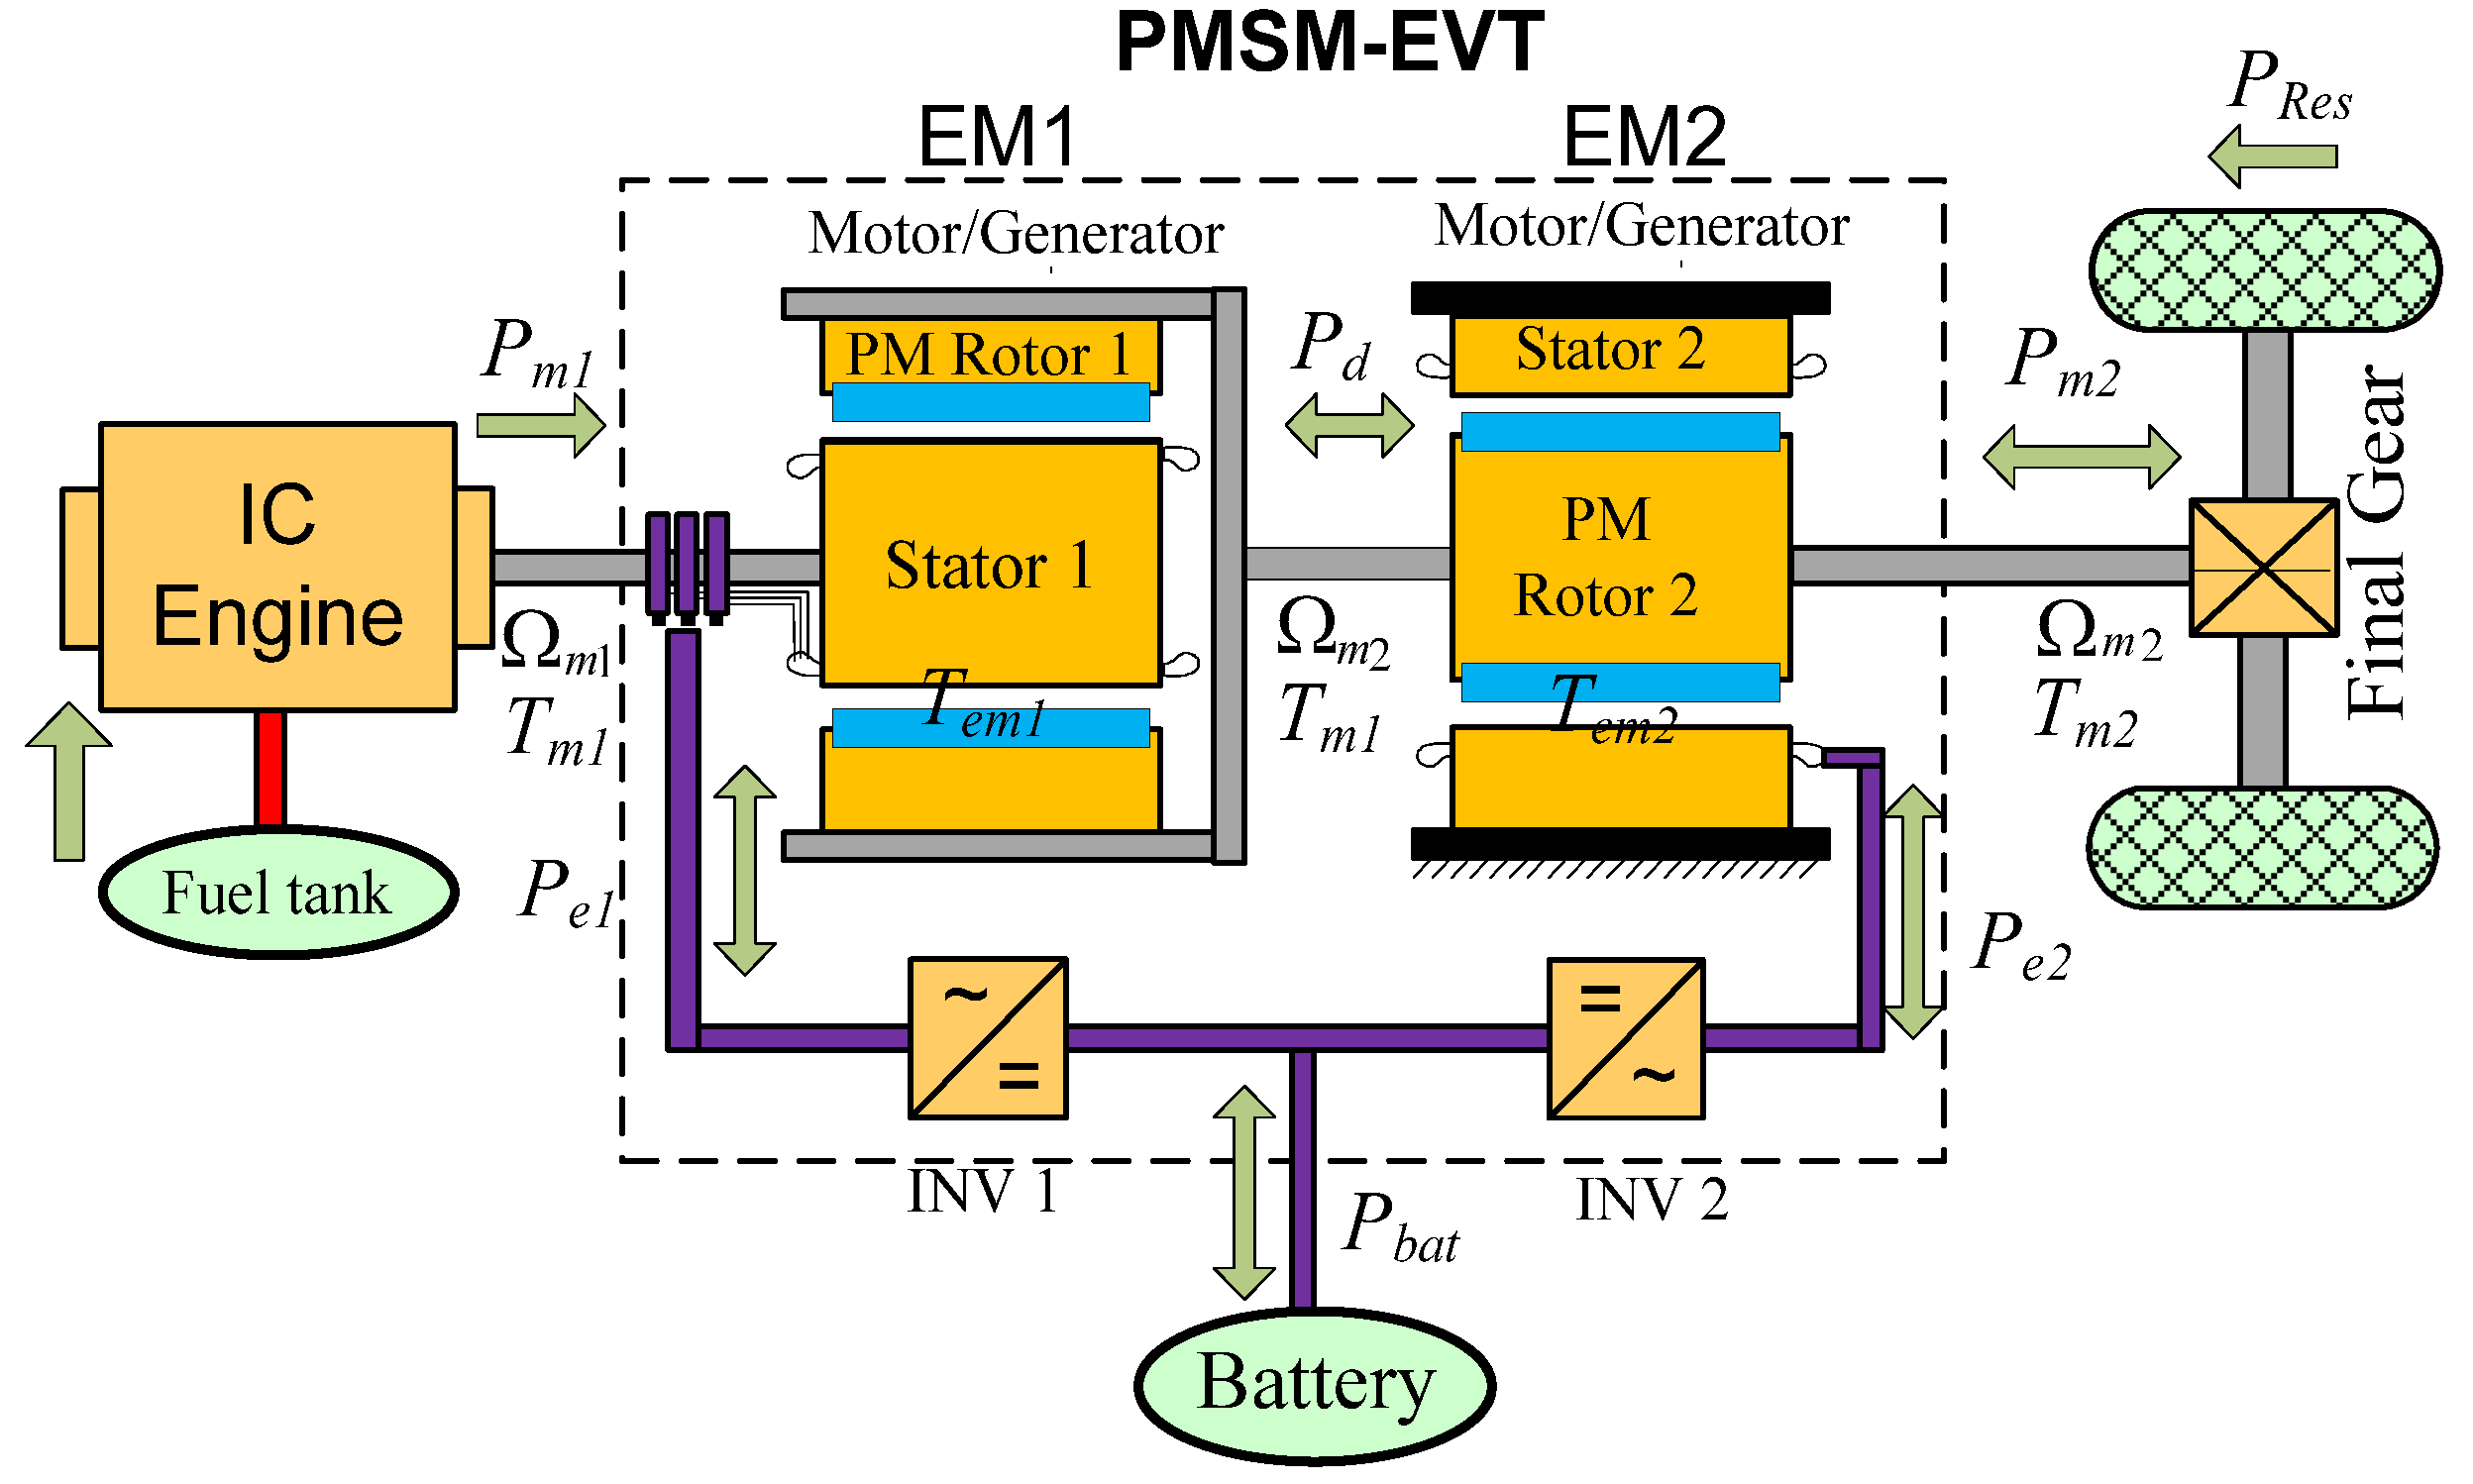
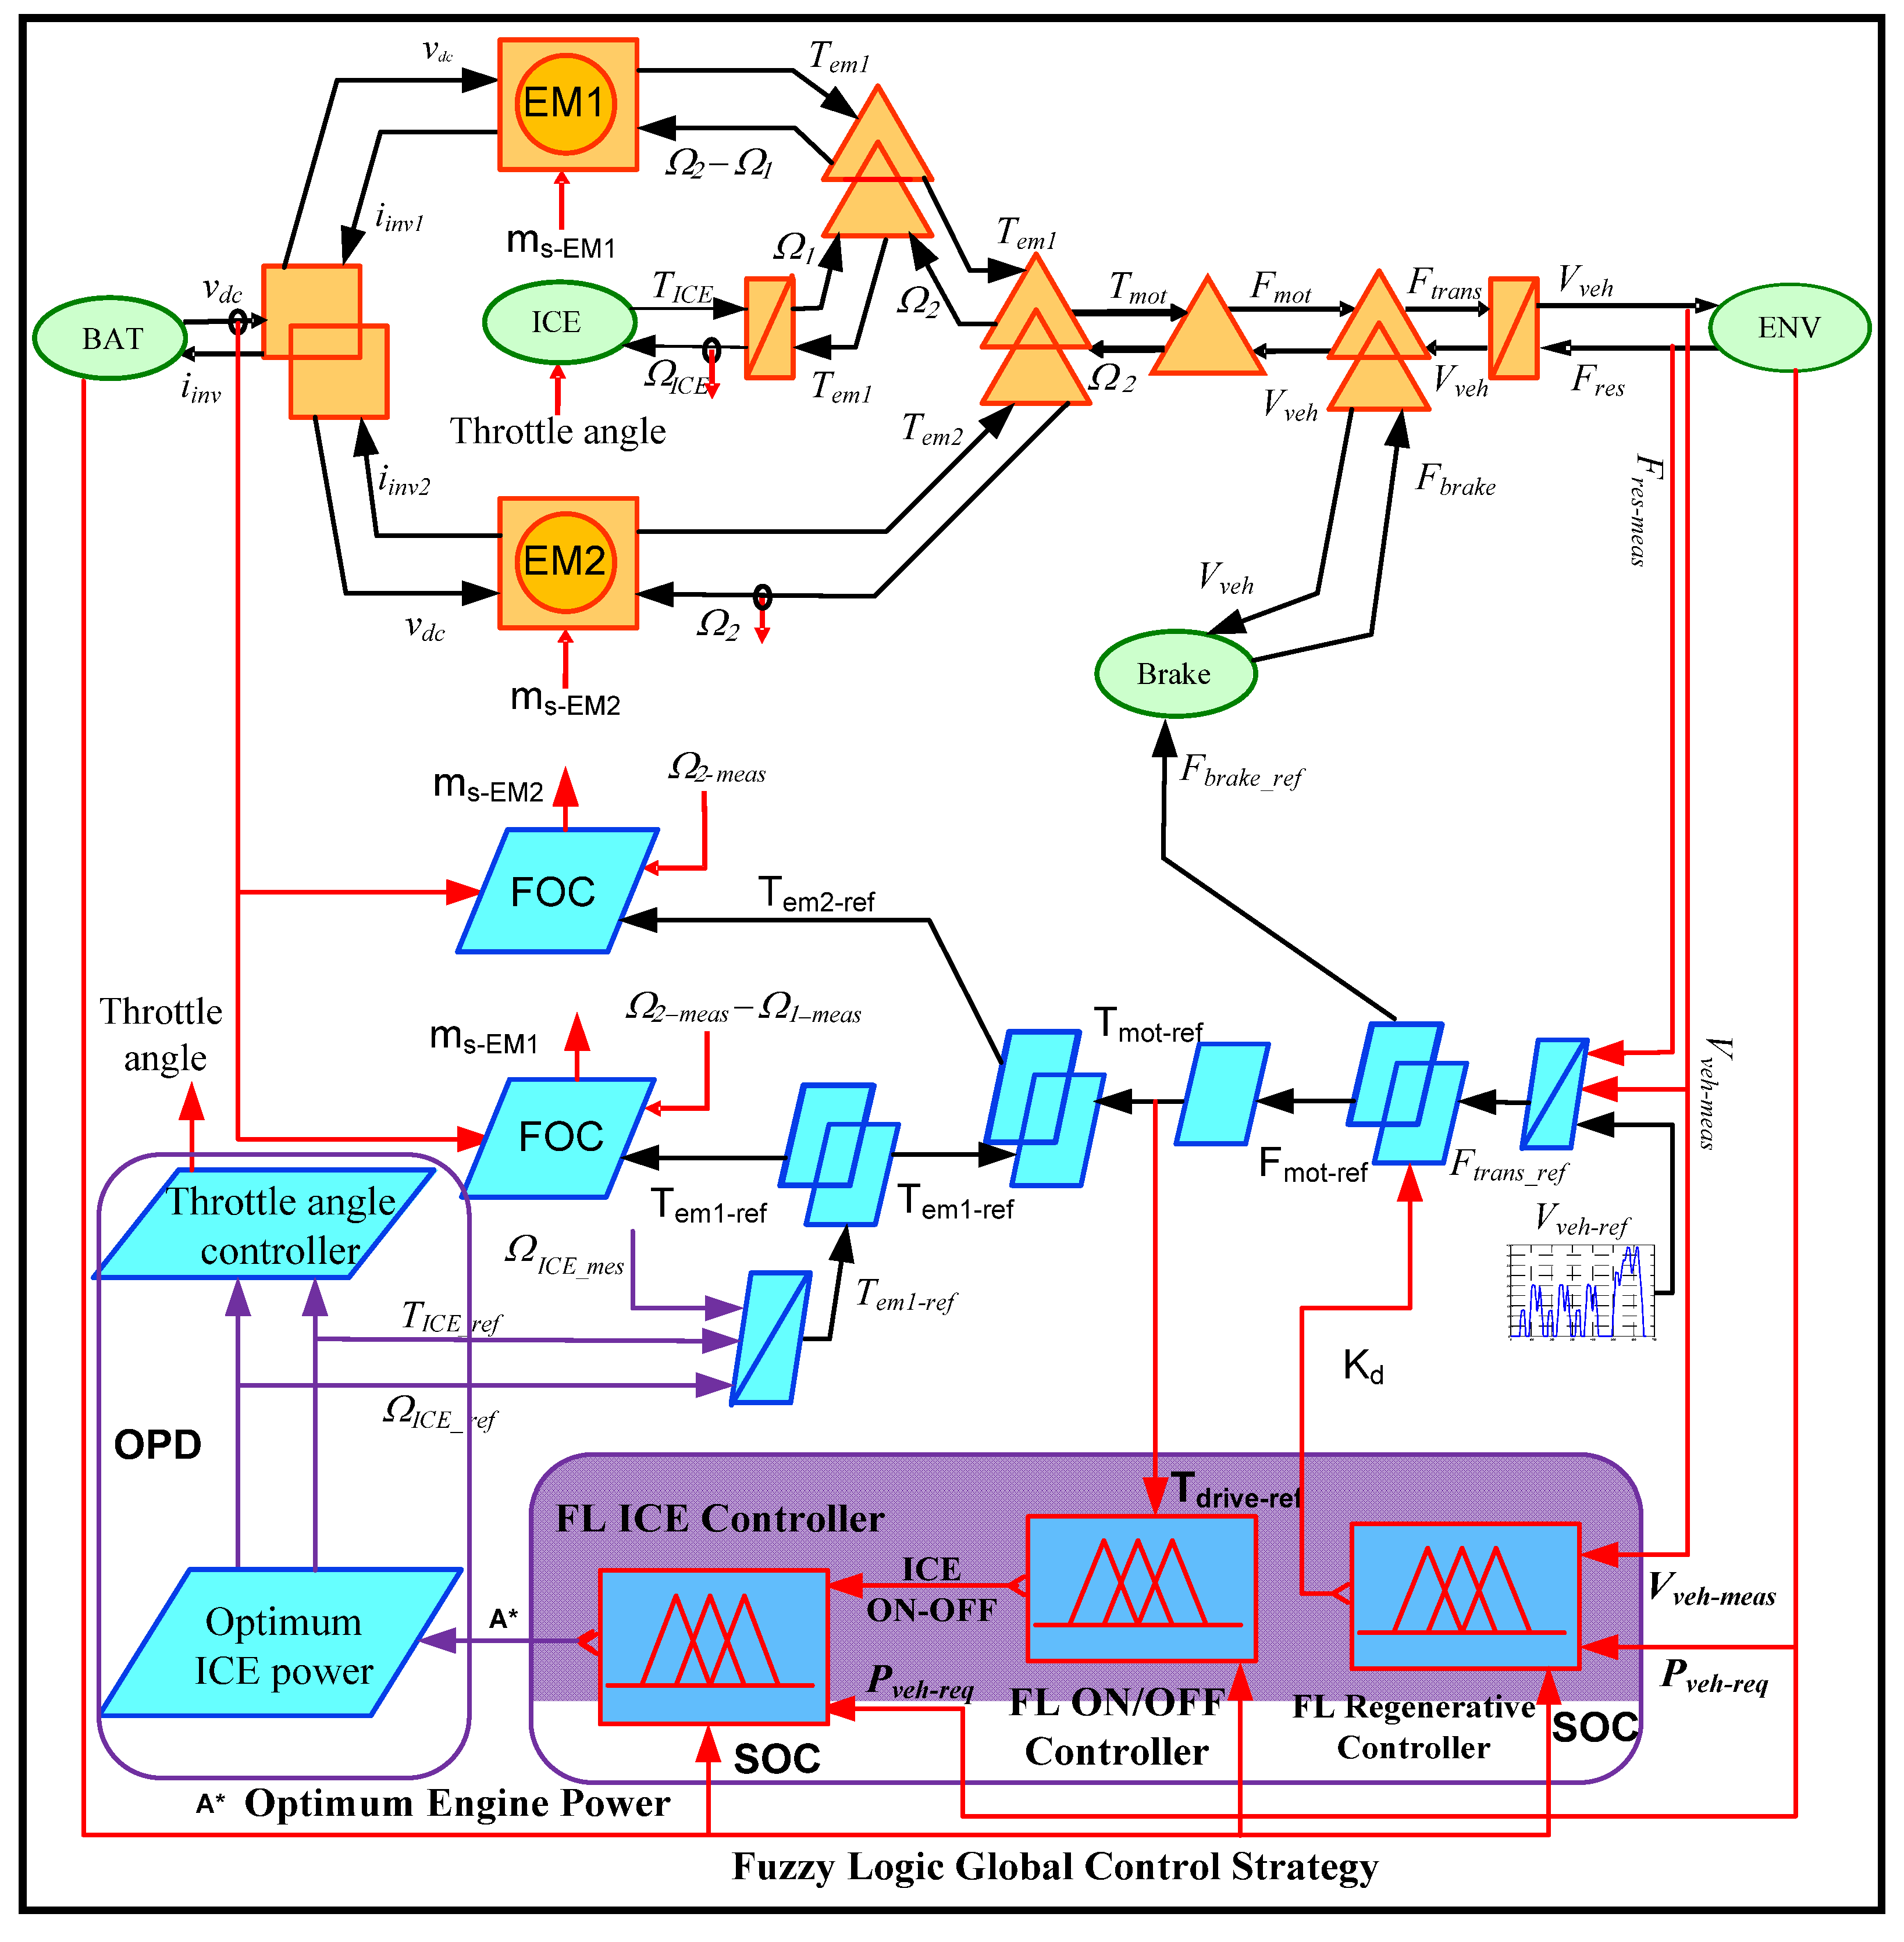
3. EMR Simulation Model and Integration of the PM-EVT-HEV System

Since HEVs are energetic systems, the energy consideration should be emphasized. EMR is an energy-based graphical description that gives insights into the real energy operation of the system and allows a deep understanding of its potentialities from a dynamic point of view [26,27]. EMR is used in the global modeling and strategy simulation for the EVT based HEV system; and a control scheme is deduced from the EMR models using specific inversion rules. The systems’ components, PMSM-EVT machines (EM1 & EM2), ICE, inverters, battery, transmission and vehicle dynamics, are modeled by EMR as depicted in Figure 9. It indicates the global modeling of the PMSM-EVT-HEV components with their local and global controllers. More details about the model of these plants and their controllers could be found in [3,10,11,13]. Also, the proposed control strategy has been modeled and simulated, based on the software Matlab/Simulink as shown in the lower part of Figure 9.
Based on the design and control principles discussed in the previous sections, a Toyota Prius vehicle driven by the PM-EVT instead of THS has been simulated in the combined three driving cycles: a modified Toyota Prius, UDDC, and the US06 HWY as listed in Table 3. It is important to notice that, comparing with the data of Toyota Prius (I) HEV [28], the used trip-cycle has larger velocity, larger acceleration and deceleration to validate the maximum ratings and testing the operation of the power plants at the worst operating conditions. The model of ICE, battery, power inverters, vehicle dynamics and transmission have been accomplished according to the typical data of the well-known Toyota Prius I obtained from the ADVISOR [28]. These plants have been modeled and simulated via EMR; and the parameters of the EVT machines simulated are listed in Table 4.
Table 3. Maximum specifications of the used driving cycles.
CYCVelocity (km/h)Acceleration (m/s2)Deceleration (m/s2)Vehicle Torque (Nm)Vehicle Power (kW)
Prius 101570.751.191.4512020
Modified Prius90.561.51.916028.52
UDDS91.251.481.4816032
Modified US06 701.661.66--
Table 4. Specifications of PM-EVT machines on studied system.
HEVTHS-M/GPMSM-EVT
MG1MG2EM1EM2
Maximum powerkW153015.8826.17
Maximum torqueNm/rpm58 @ 2470305@ (0–940)105 @ 1378160 @ 1720
Maximum speedrpm8000600025784300
Rated powerkW--11.5414.4
Rated torqueNm/rpm--8080
Rated speedrpm--13781720

4. Performance Analysis of the Regenerative Braking System

The braking forces distributed on different wheels vary according to the vehicle’s driving conditions [29]. Since only one equivalent wheel is modeled the braking forces distribution on different wheels is not taken into consideration. In this section, the decelerations of the vehicle in typical urban driving cycles and the influences of regenerative braking strategy have been investigated. The typical driving cycles that are used in this section are: the modified Prius1015 and UDDS. First, the effect of using a constant regenerative ratio is presented. Then, FLC is used to control of this factor adaptively according to system circumstances.

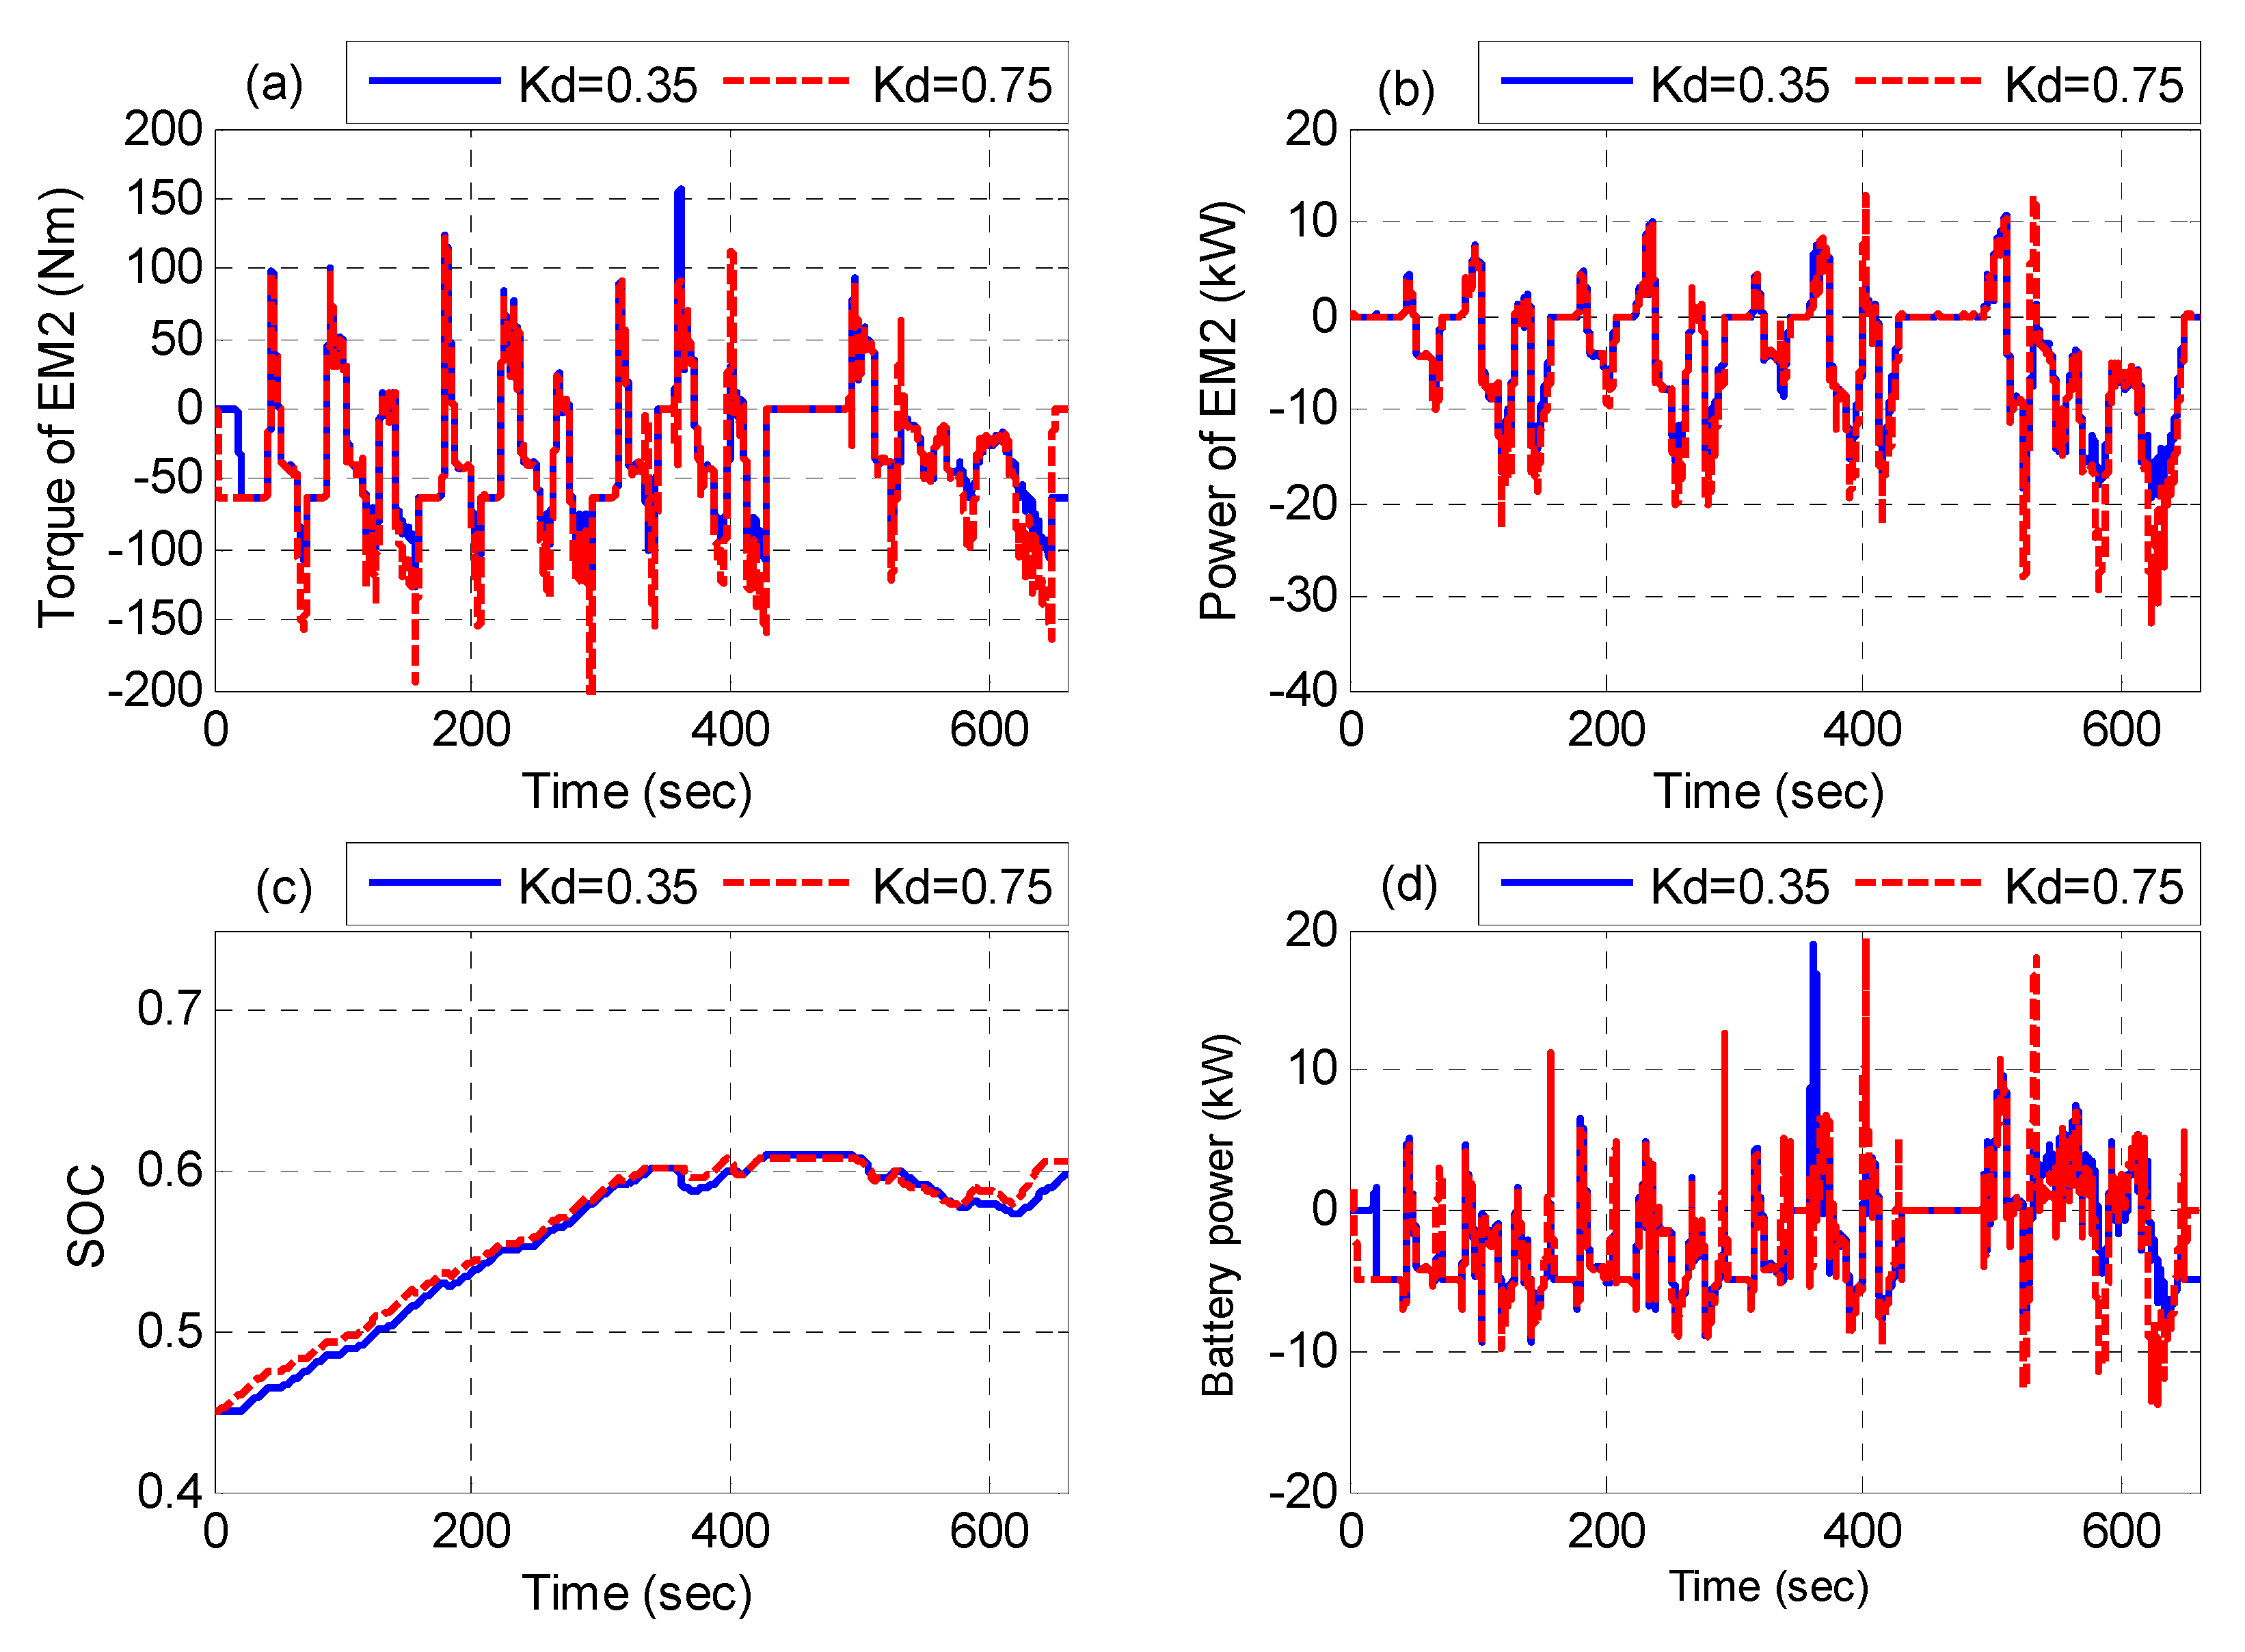
4.1. Analysis at Fixed Regenerative Factors

Figure 10 and Figure 11 refer to the influences of increasing the regenerative factor   K d on the maximum ratings of the EM2 and battery using   K d = 35  % and   K d = 75 % for the Modified Prius 1015 and UDDS driving cycles. As shown in Figure 10a and Figure 11a, the negative torque of EM2 increases when this factor increases from 0.35 to 0.75. Also, the generating power increases with the increase of the   K d as shown in Figure 10b and Figure 11b. The developed control strategy guarantees the SOC to sustain at its target value. However, the charging power of the battery is increased with the increase of the   K d . Applying the same strategy with the UDDS cycle, it is found that the negative power and torque of the EM2 increase extremely at   K d = 0.75 . Finally, with the aid of the simulation results at different values of   K d , the regenerative factor is related to the torque and power of the EM2 as depicted in Figure 12. It can be noted that the values   K d   belong to UDDS driving cycle are smaller than those of the modified prius. This is because of the frequent deceleration times for the UDDS are more than that of the Prius cycle. From this analysis, it is concluded that   K d has to be controlled with the variation of the braking conditions.
Figure 10. Performance of EM2 and battery at Kd = 35 % and Kd = 75 % with the Modified Prius 1015.
Energies 05 01175 g010
Figure 11. Performance of EM2 and the battery at Kd = 35 % and Kd = 75 % with the UDDS cycle.
Energies 05 01175 g011
Figure 12. Effect of the regenerative factor on the power and torque of the EM2.
Energies 05 01175 g012

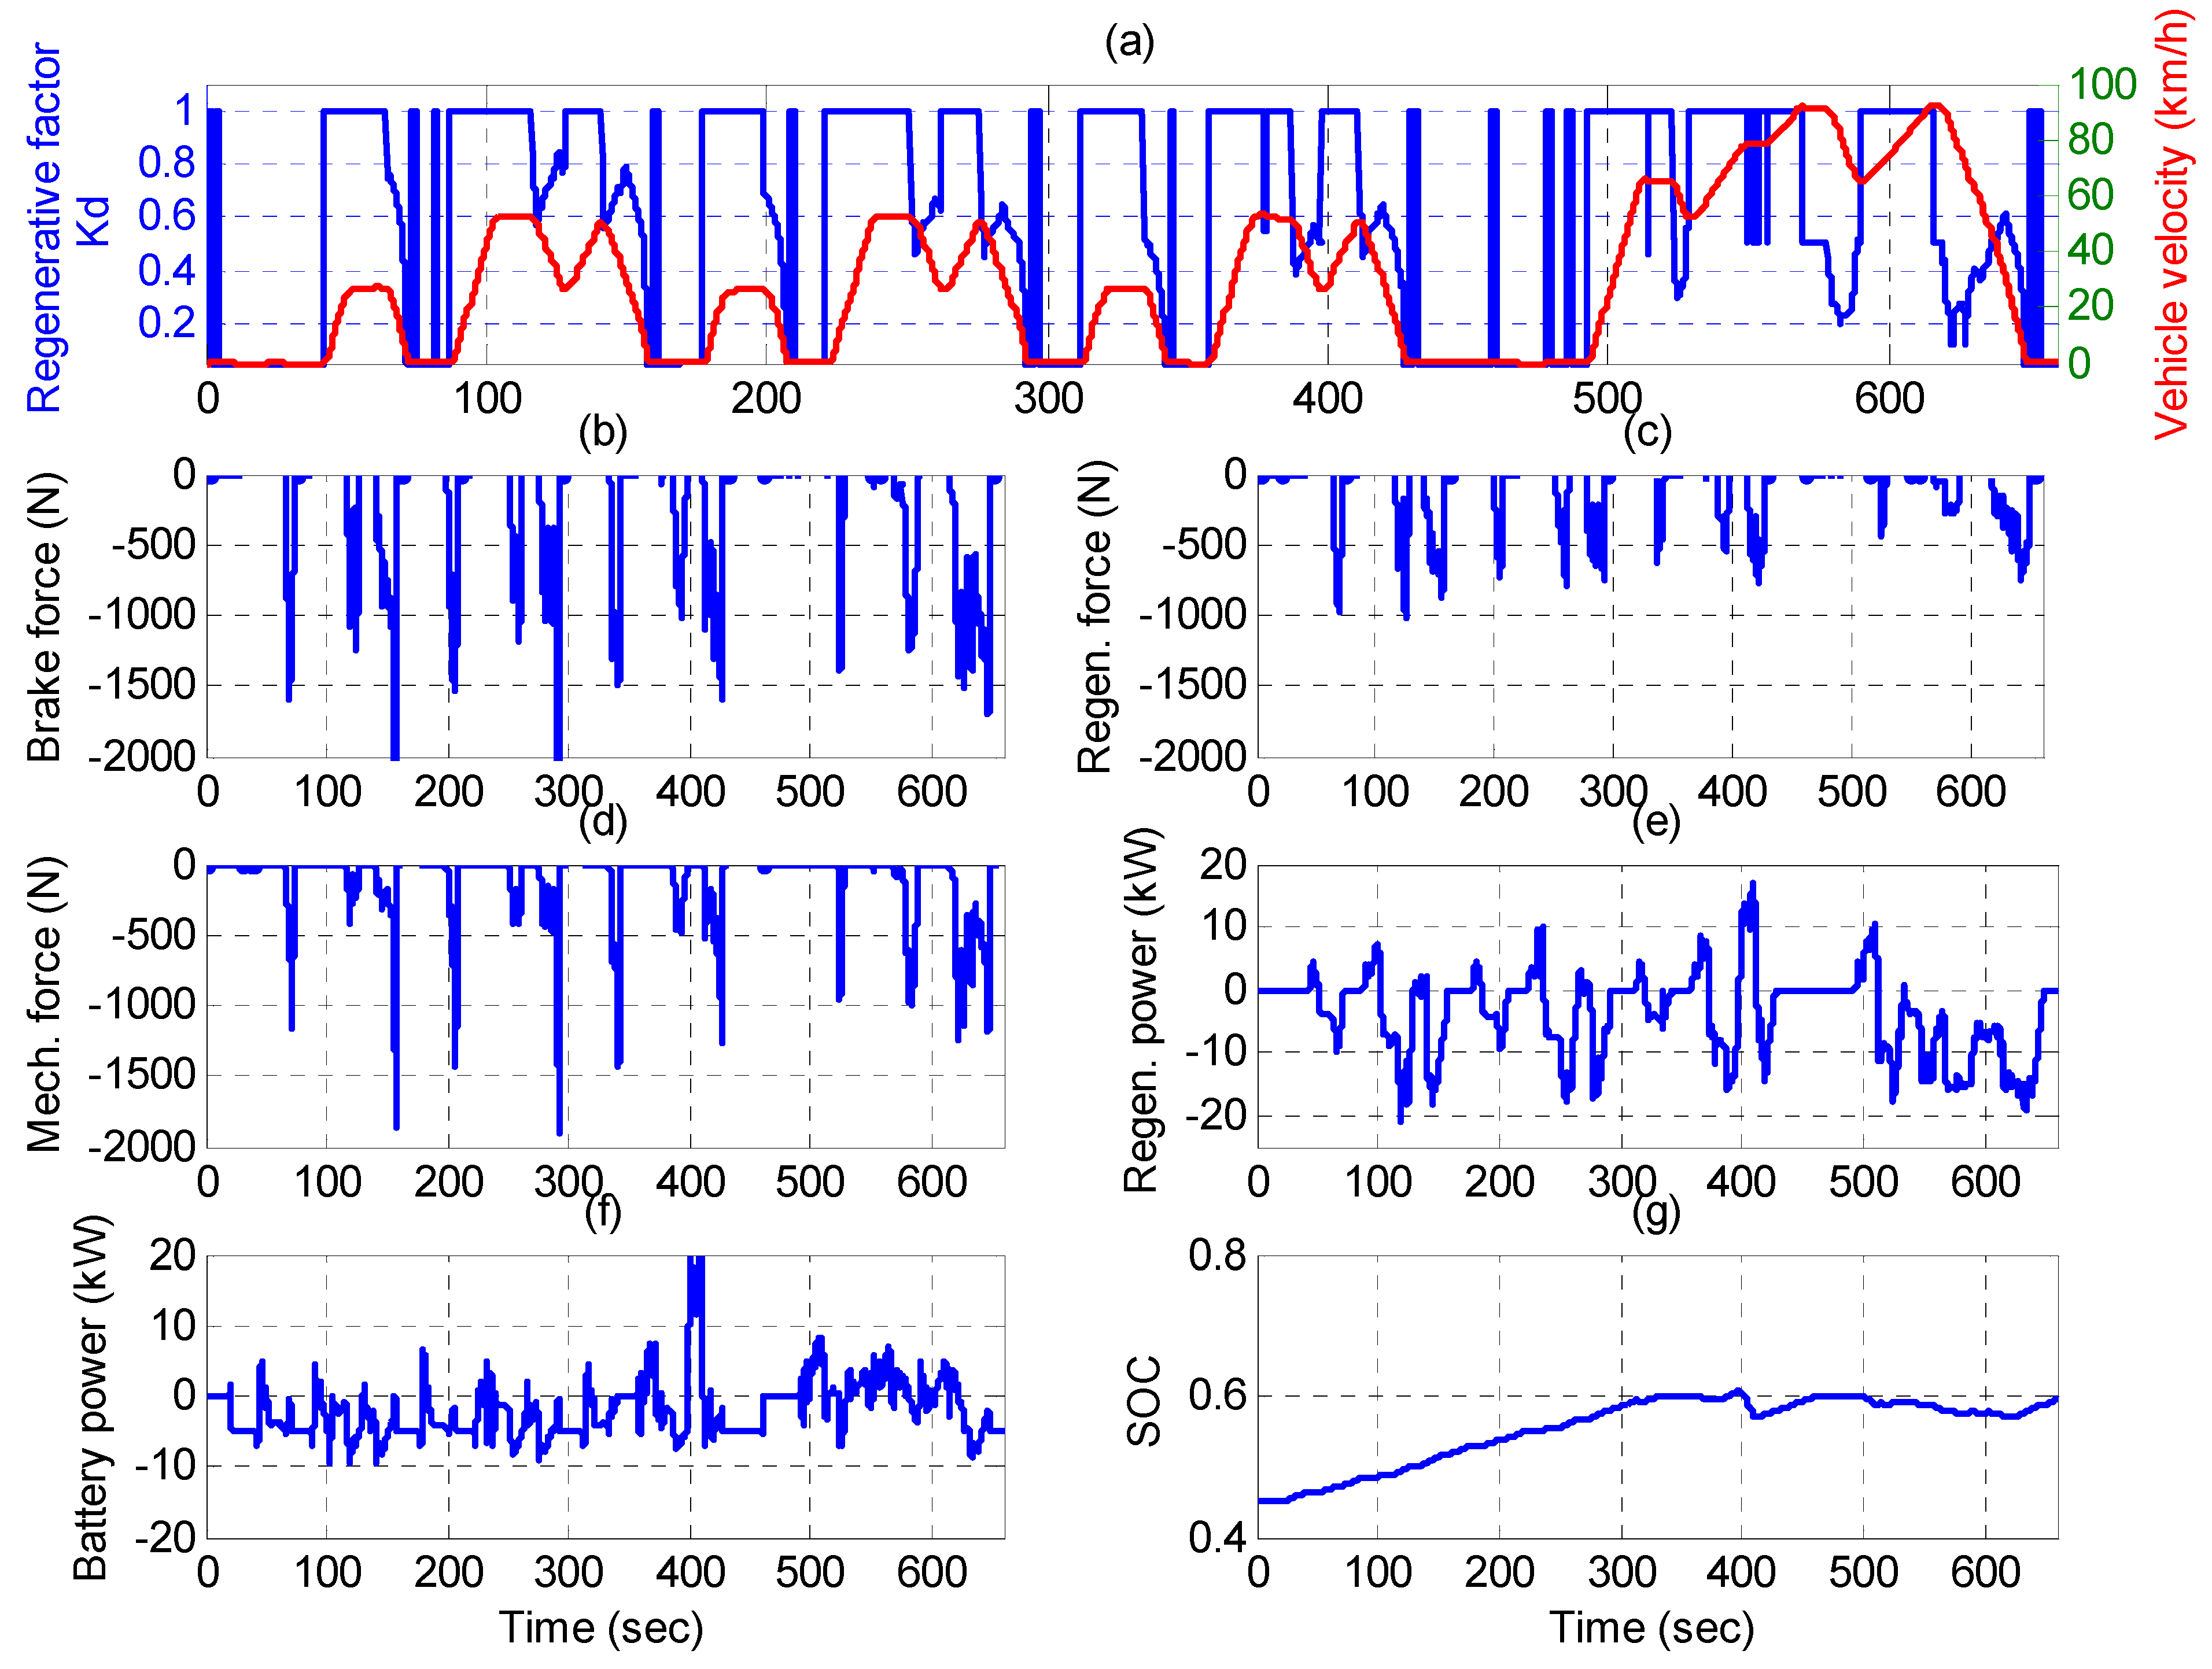
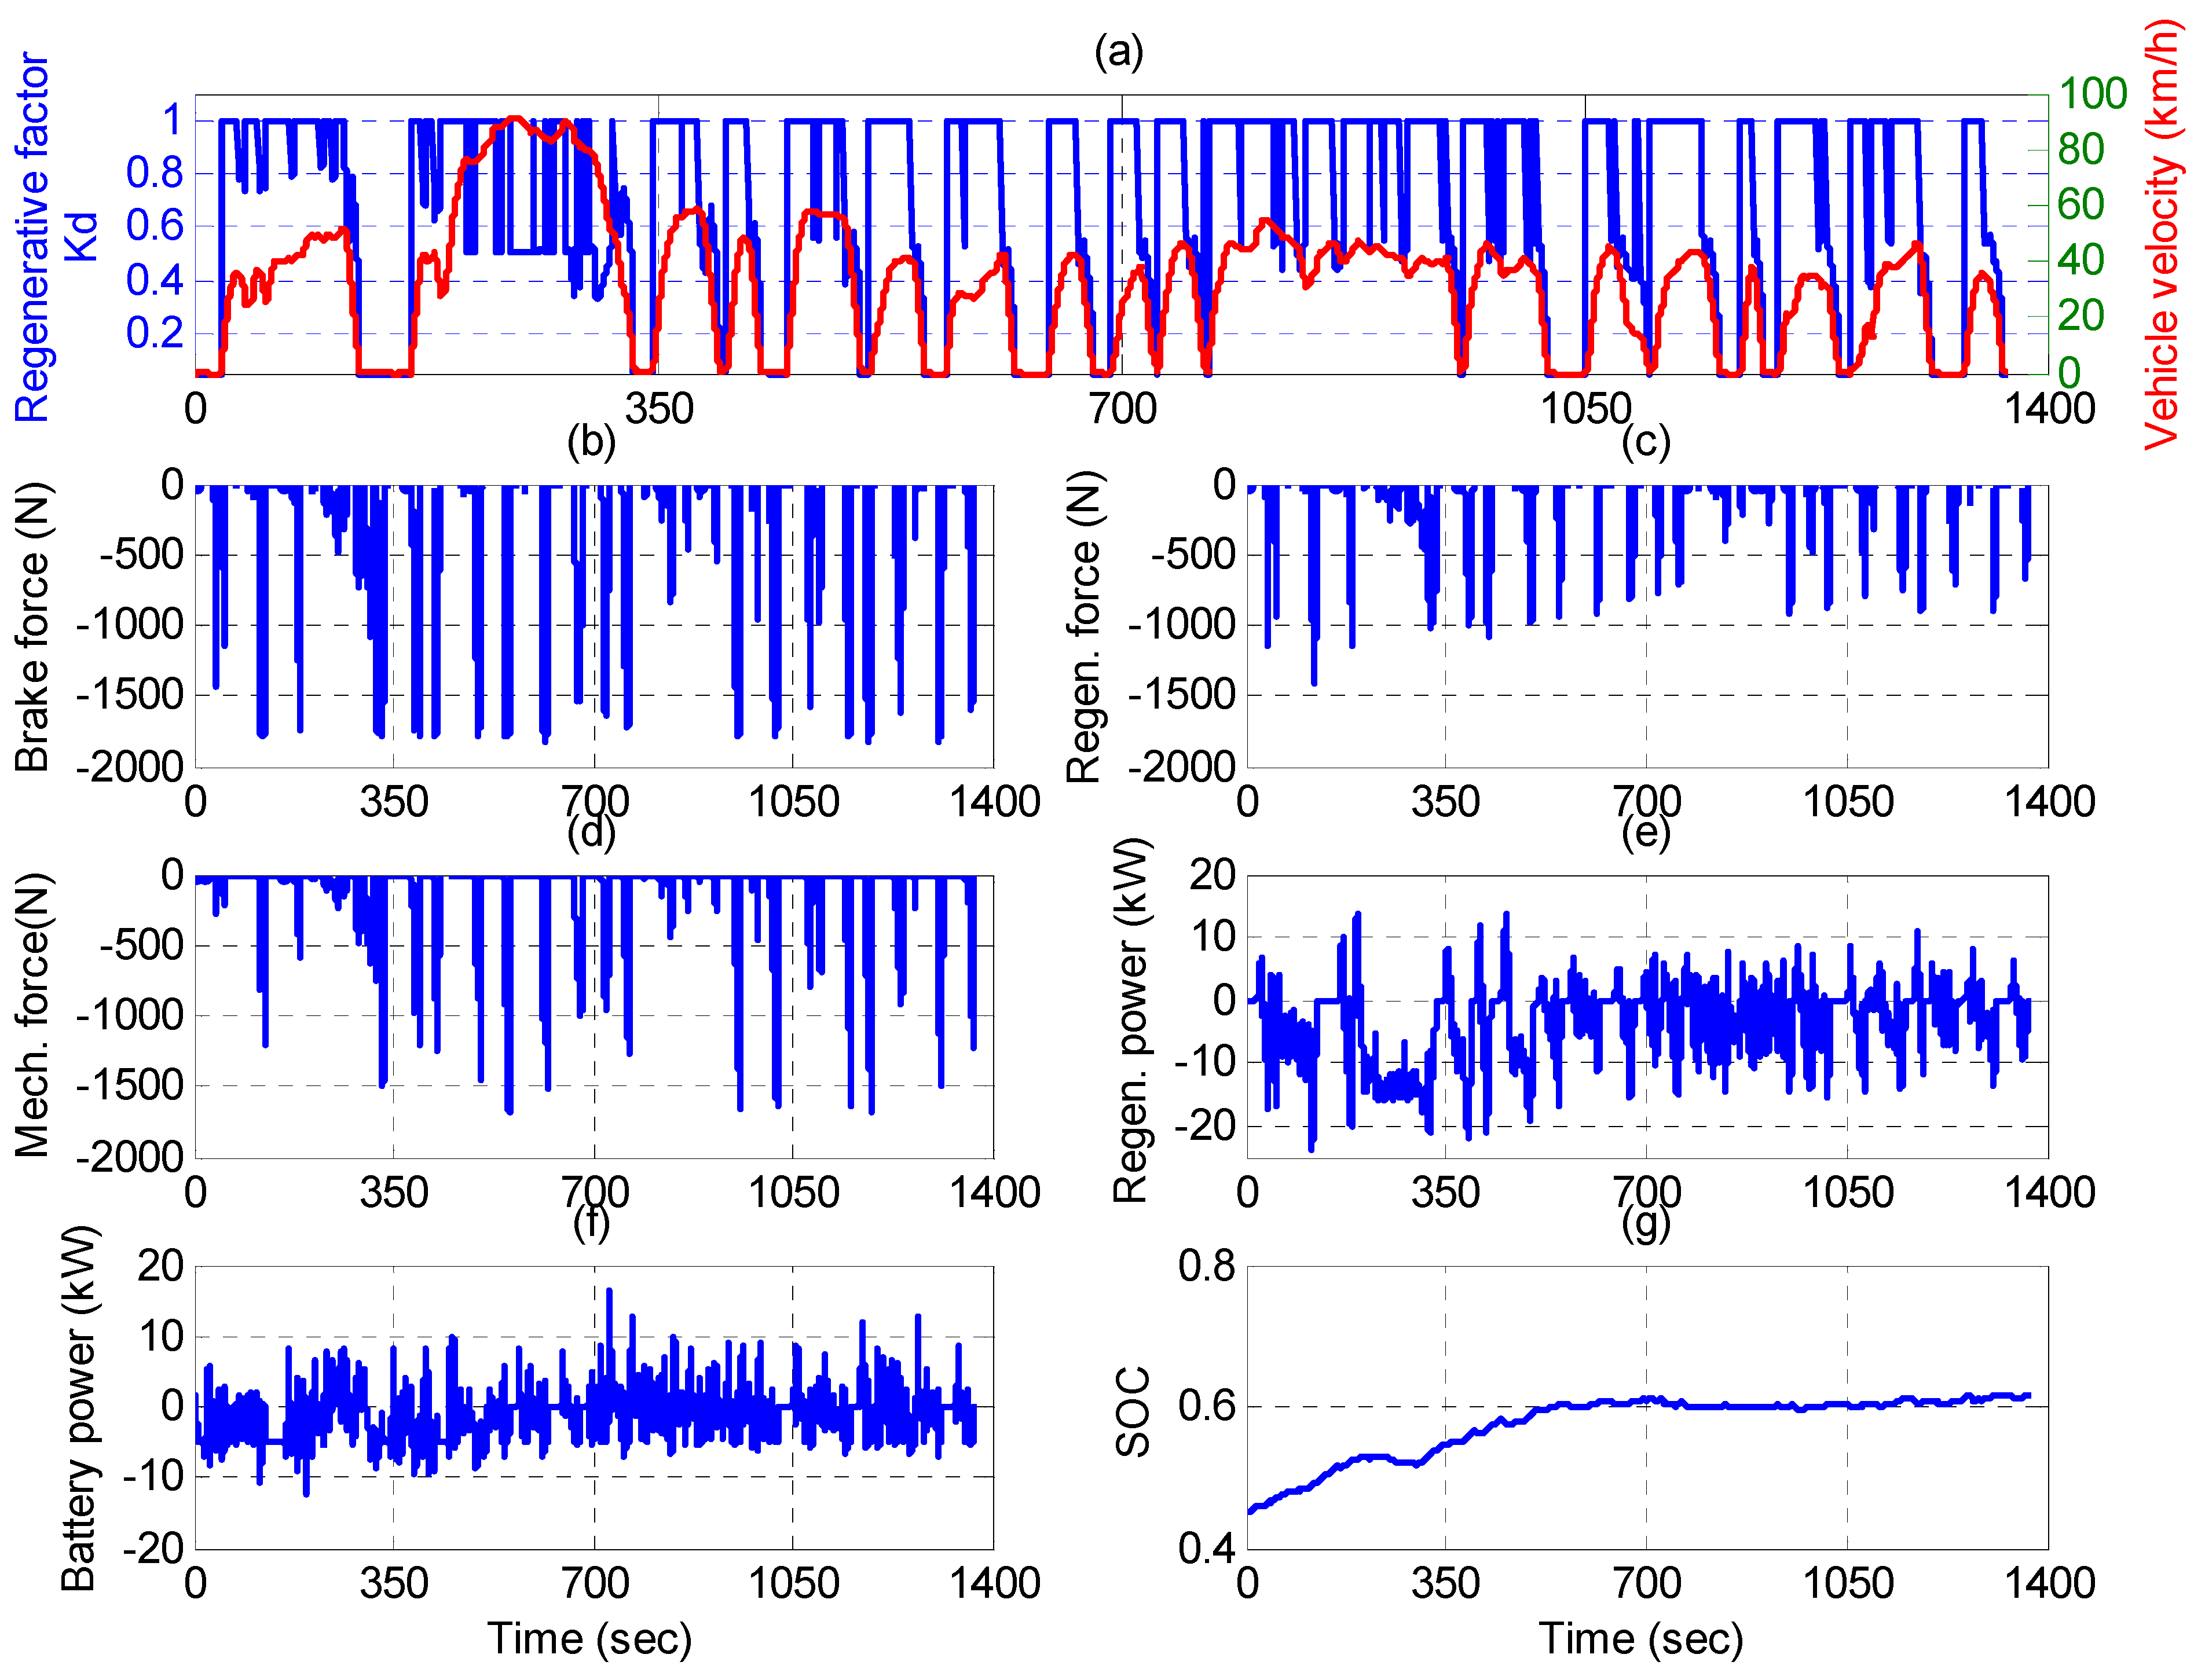
4.2. Analysis of the Regenerative System at FLC Strategy

Using a fixed K d   is not suitable for all driving conditions. At low vehicle speeds, K d has to be increased to charge the battery more. But, at very high speeds, increasing this factor will increase the regenerated power from EM2 and may exceed its power bounds. After the explanation shown previously, it is cleared that the regenerative factor should be controlled according to the required performances (velocity, torque, and SOC) of the vehicle. Therefore, a braking distribution strategy is developed intelligently via FLC which designed carefully to control the regenerated amount of energy according to the effective variables. The SOC of the battery, the total brake power, and the vehicle velocity are the most effective variables used for determining the recovered power from the vehicle. The proposed braking force distribution strategy presented in subsection 2.1 is tested and validated throughout the heavy road loading, the modified Prius 1015 and UDDS driving cycles. With the regenerative FLC, the factor K d   can safely be increased more than 50% up to 80% with saving the bounds of the EM2 and battery ratings.
Simulation results of the FL regenerative braking controller for the PM-EVT-HEV during a Modified Prius1015 and the UDDS are shown in Figure 13 and Figure 14, respectively. Modified Prius 1015 and UDDS driving cycles and the regenerative factor are shown in Figure 13a and Figure 14a.
Figure 13. Simulation results of the FL regenerative braking controller for the PM-EVT-HEV during a Modified Prius1015: (a) Modified Prius1015 and the regenerative factor; (b) Total braking force; (c) Regenerative force by EM2; (d) Mechanical braking force; (e) Regenerative power of EM2; (f) Battery power; (g) State of charge, SOC.
Energies 05 01175 g013
The figures clearly indicate the times of braking and the values of the regenerative factor K d at each instant. It can be seen that K d = 1 at motoring operation and 0 < K d < 1   in the braking periods according to the output of the regenerative controller. According to the value of   K d , the total braking force shown in Figure 13b and Figure 14b, which has been calculated from (1), is divided into regenerative force by EM2 shown in Figure 13c and Figure 14c and mechanical braking force shown in Figure 13d and Figure 14d. Reviewing Figure 10b and Figure 11b at  K d = 35  % , it can be seen that the maximum regenerative power of EM2 is near to 20 kW, and at   K d = 75  % it is near to 32 kW. Whereas in Figure 13e and Figure 14e that power is saved at 20 kW by controlling   K d . The battery power and SOC are depicted in Figure 13f and Figure 14 f and Figure 14g, respectively. It can be noticed that the power is within its ratings and the SOC is successfully sustained at the target value.
Figure 14. Simulation results of the FL regenerative braking controller for the PM-EVT-HEV during a UDDS: (a) UDDS and the regenerative factor; (b) Total braking force; (c) Regenerative force by EM2; (d) Mechanical braking force; (e) Regenerative power of EM2; (f) Battery power; (g) State of charge, SOC.
Energies 05 01175 g014

5. Analysis of System Performance Managed by the Global FL Controllers

According to the developed control strategy, the simulation for the HEV using a PM-EVT in Matlab–Simulink™ is established. To validate the applicability of the proposed strategy, the simulated performances of the system’s components are compared to Toyota Prius (I) HEV during a long-trip driving cycle includes a modified Prius 1015, UDDS, and US06 HWY cycles as shown in the following figures. In the following simulation results, the performance of the vehicle, ICE, battery, and PM machines (EM1&EM2) are illustrated. All simulation results are carried out at initial SOC of 0.45. The blue solid line represents the results performance of the HEV using PM-EVT; whereas the red dashed line represents those of HEV based on the Toyota Prius THS transmission.

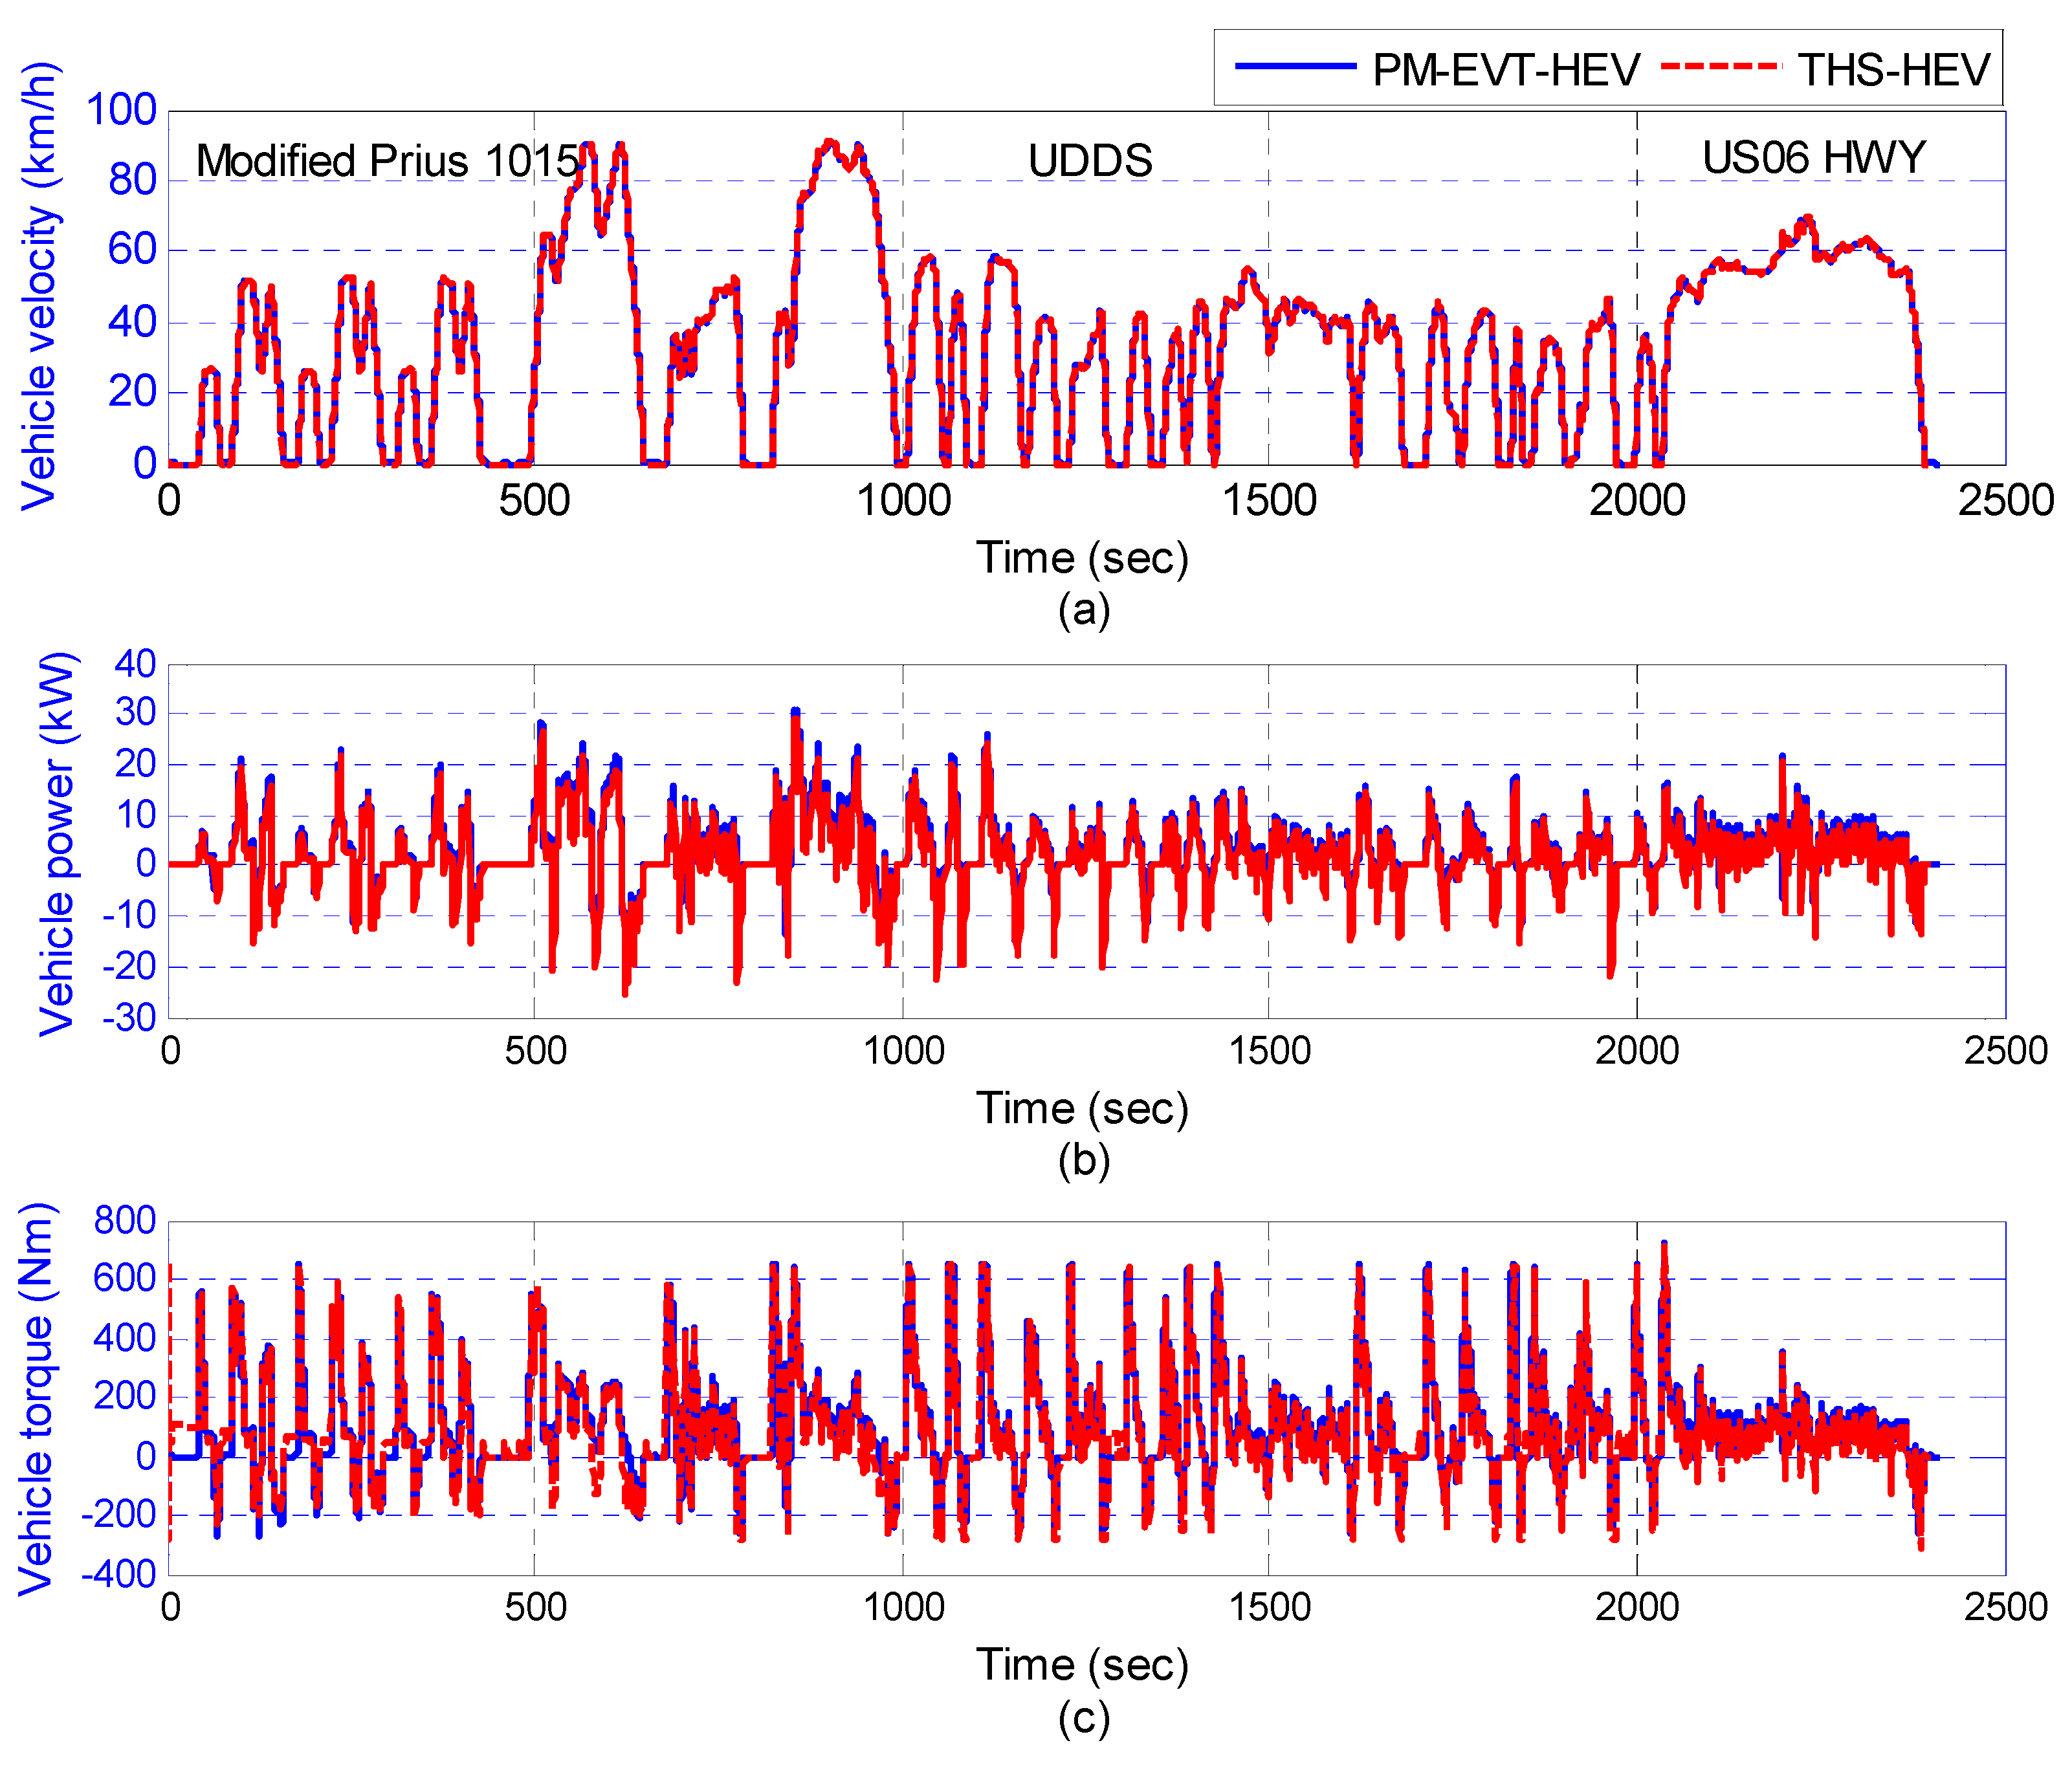
5.1. Vehicle Performance

The simulation results for the vehicle are presented and analyzed through Figure 15. The simulation results show that the vehicle speed can tracking the driving cycle profile, in a way which indicates that the drive ability is satisfied, Figure 15a. In Figure 15b,c, the power requested at the wheels and the vehicle’s torque in the side of final drive, are presented showing the driving and regenerative processes. For EVT and THS HEVs, it has to be noted that the powers and torque are aligned. This is because the same data has been used in the simulation program.
Figure 15. Vehicle performance of PM-EVT-HEV and Prius HEV with combined Modified Prius1015, UDDS, and US06 HWY drive cycles: (a) Vehicle’s velocity; (b) Vehicle’s power; (c) Vehicle’s torque.
Energies 05 01175 g015

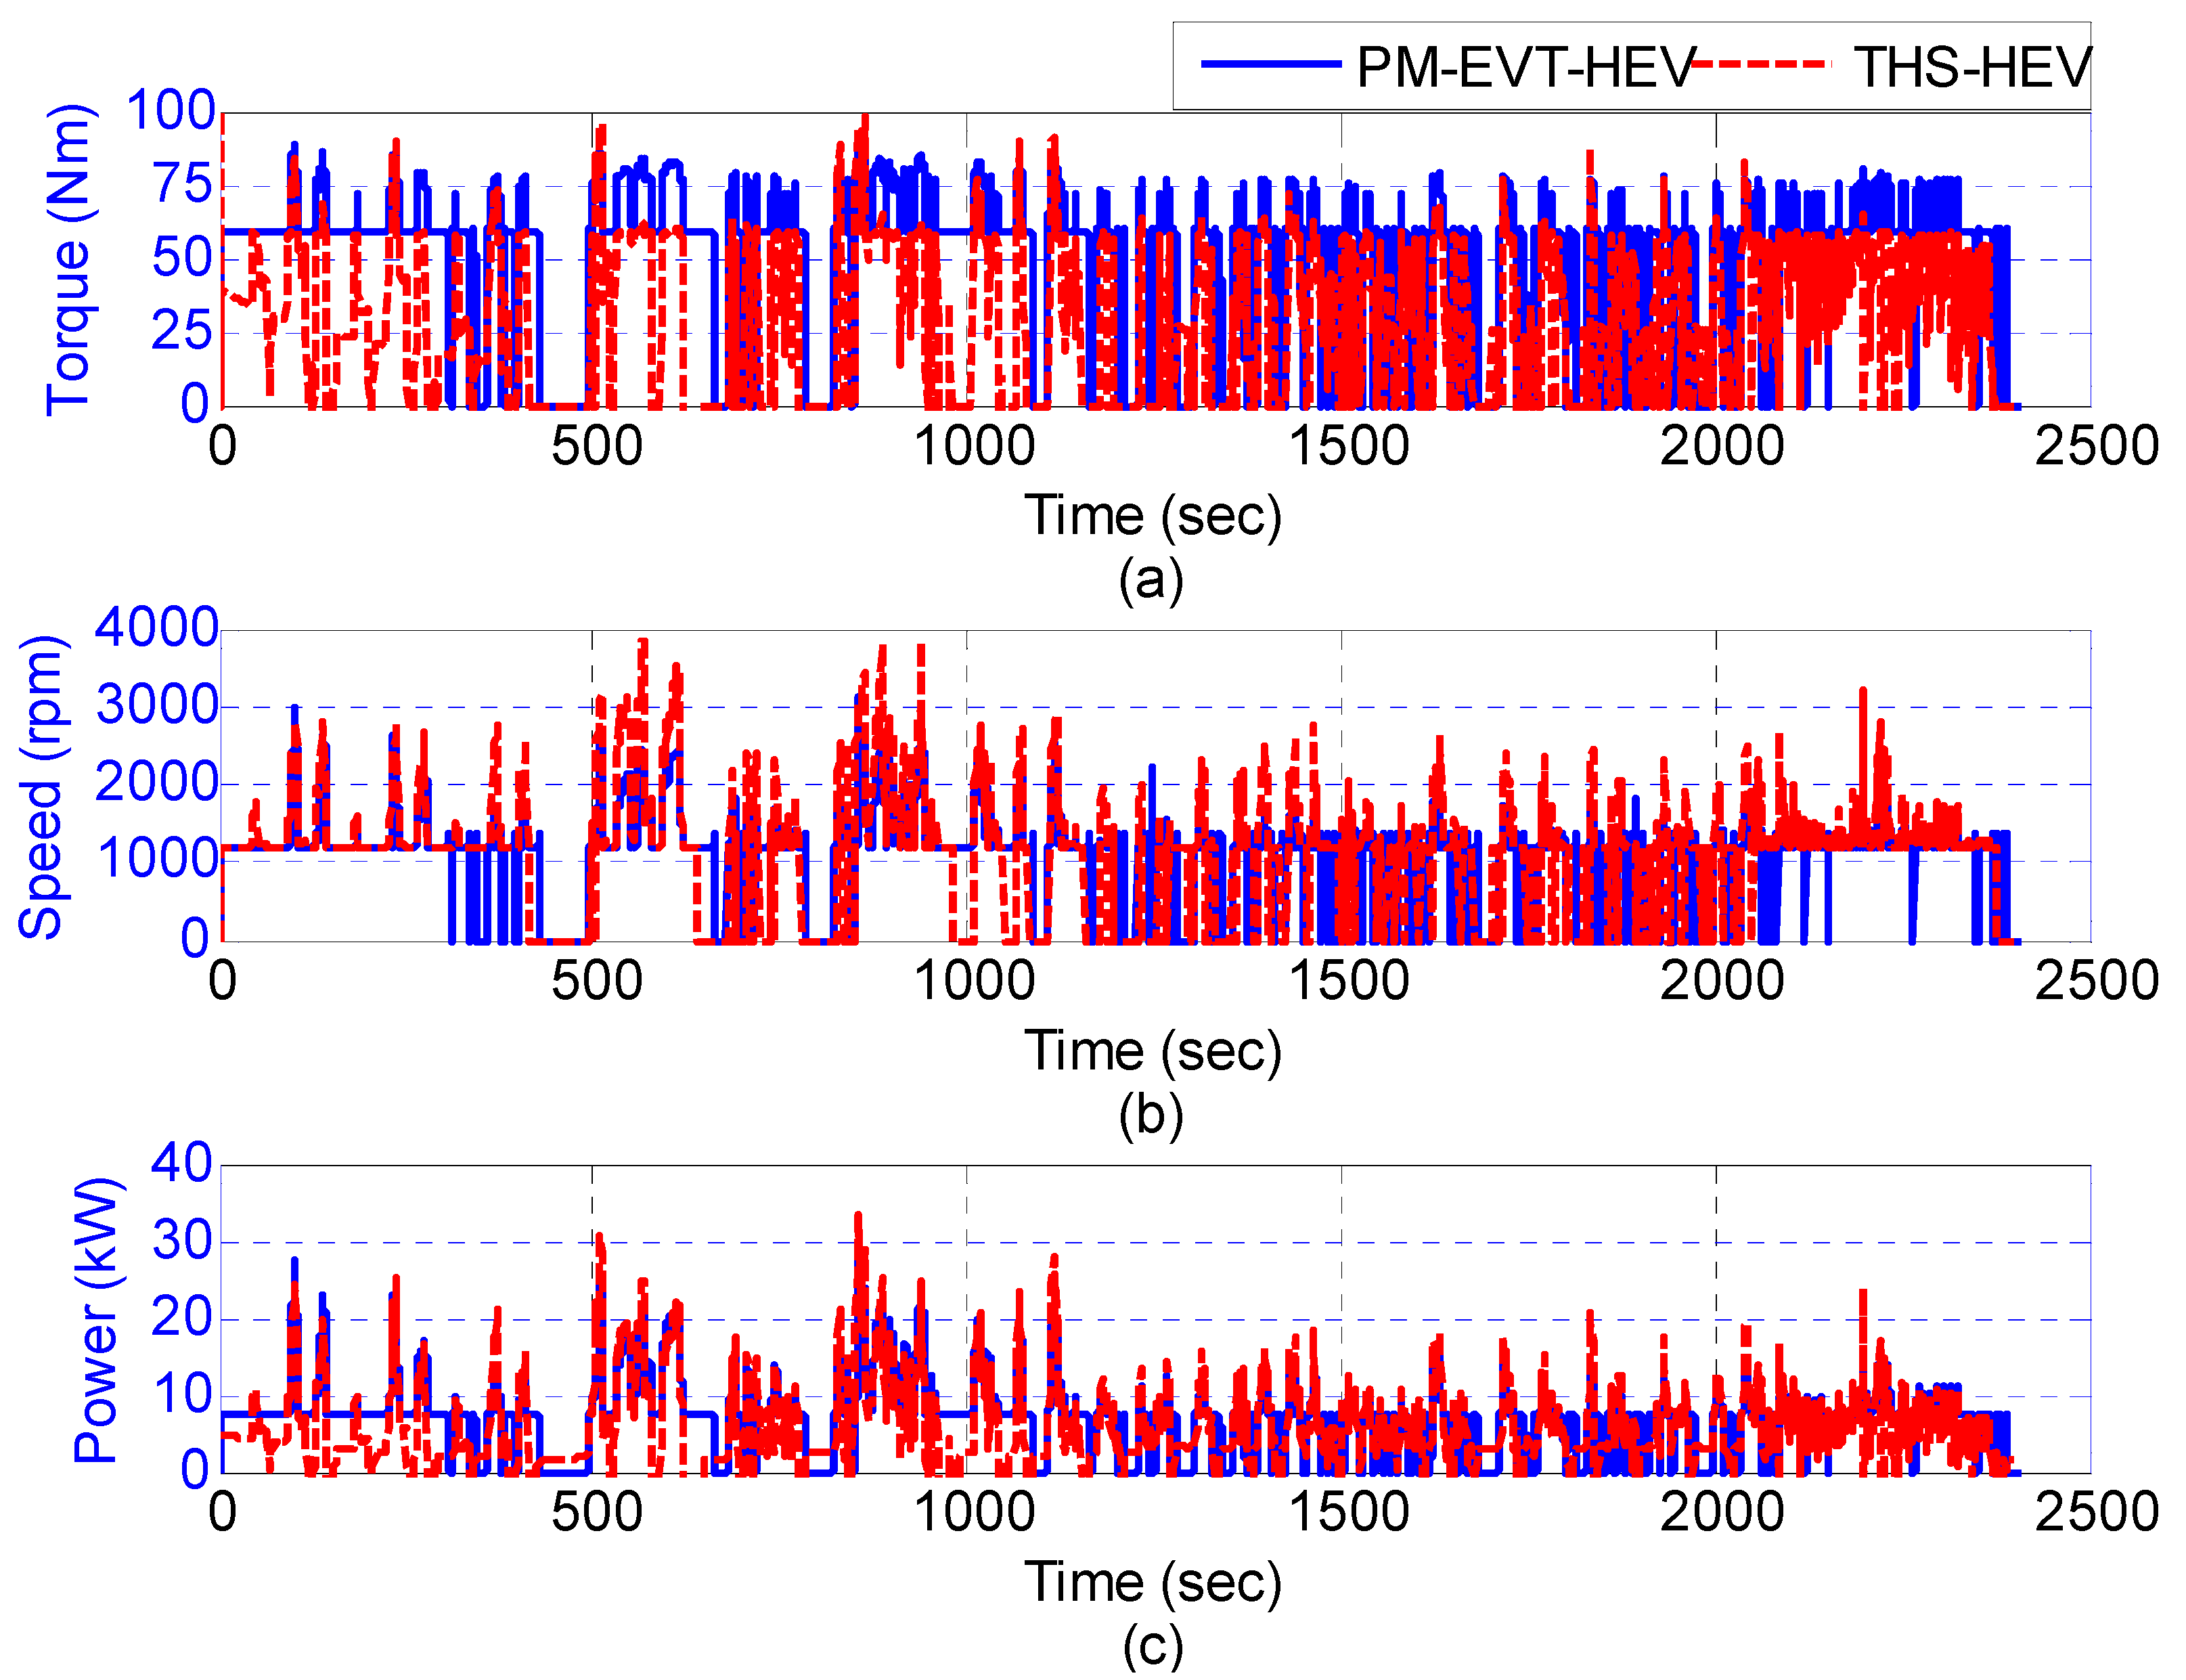
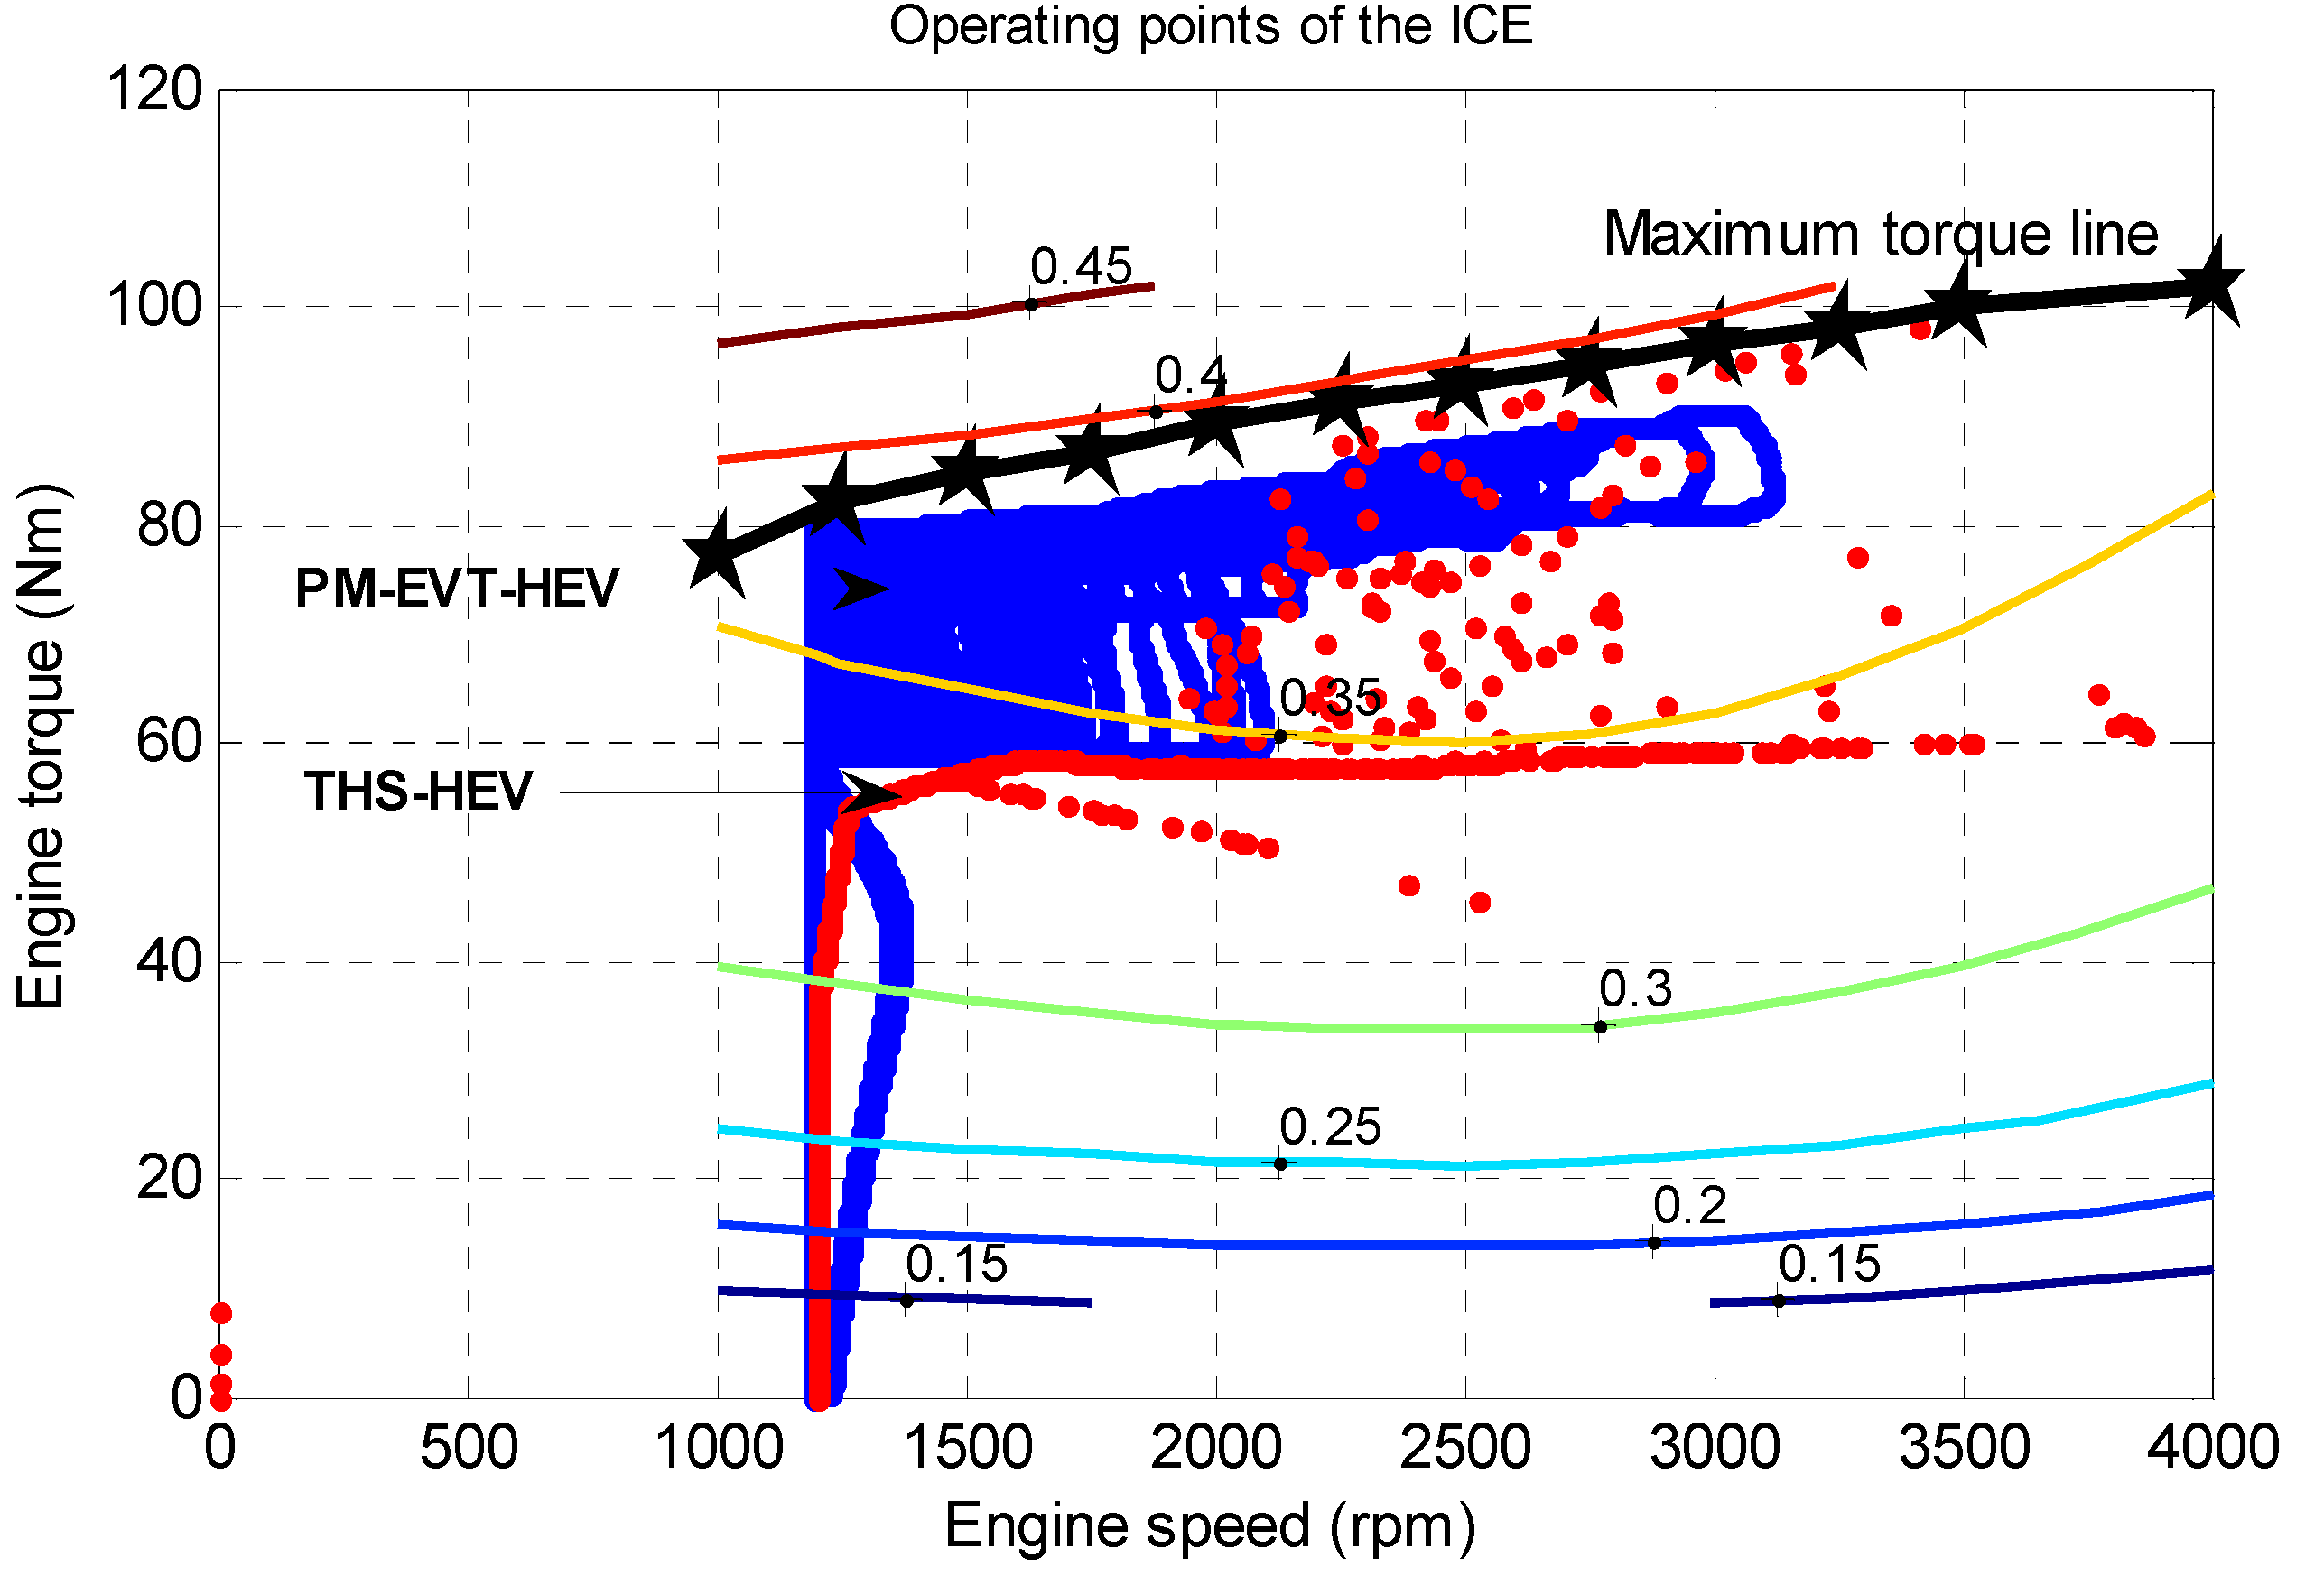
5.2. ICE Performance

Figure 16 shows the simulation results of the engine’s torque, speed and power. It can be seen that these parameters, with the used control strategy, vary within the predefined optimum ranges. The operating points of the engine in both vehicles are shown in Figure 17. It can be seen that the engine operating points concentrate in the high-efficiency region for the EVT-HEV more than that of THS-HEV. With the same data of the ICE, its operating variables (torque and speed) have been changed such these variables just vary within the maximum efficiency region. Also, it can be noticed that: as long as the SOC lesser than that its target value, the ICE is turned ON to propel the vehicle and to charge the battery via EM1. As soon as the SOC equals to the target value and low torque required at the wheels, the ICE shuts down. The engine is ON or/and OFF according to the FL ON/OFF controller such that the SOC sustains at the target value. It is noticed that the ICE has a high ON/OFF frequency in UDDS. This situation can be solved by increasing the OFF time of the engine but increasing the torque of EM2 is strongly required.
Figure 16. ICE Performance of the PM-EVT-HEV and Prius THS-HEV: (a) Torque; (b) Speed; (c) Power.
Energies 05 01175 g016
Figure 17. ICE Performance of PM-EVT-HEV and Prius THS-HEV: The torque/speed characteristics.
Energies 05 01175 g017

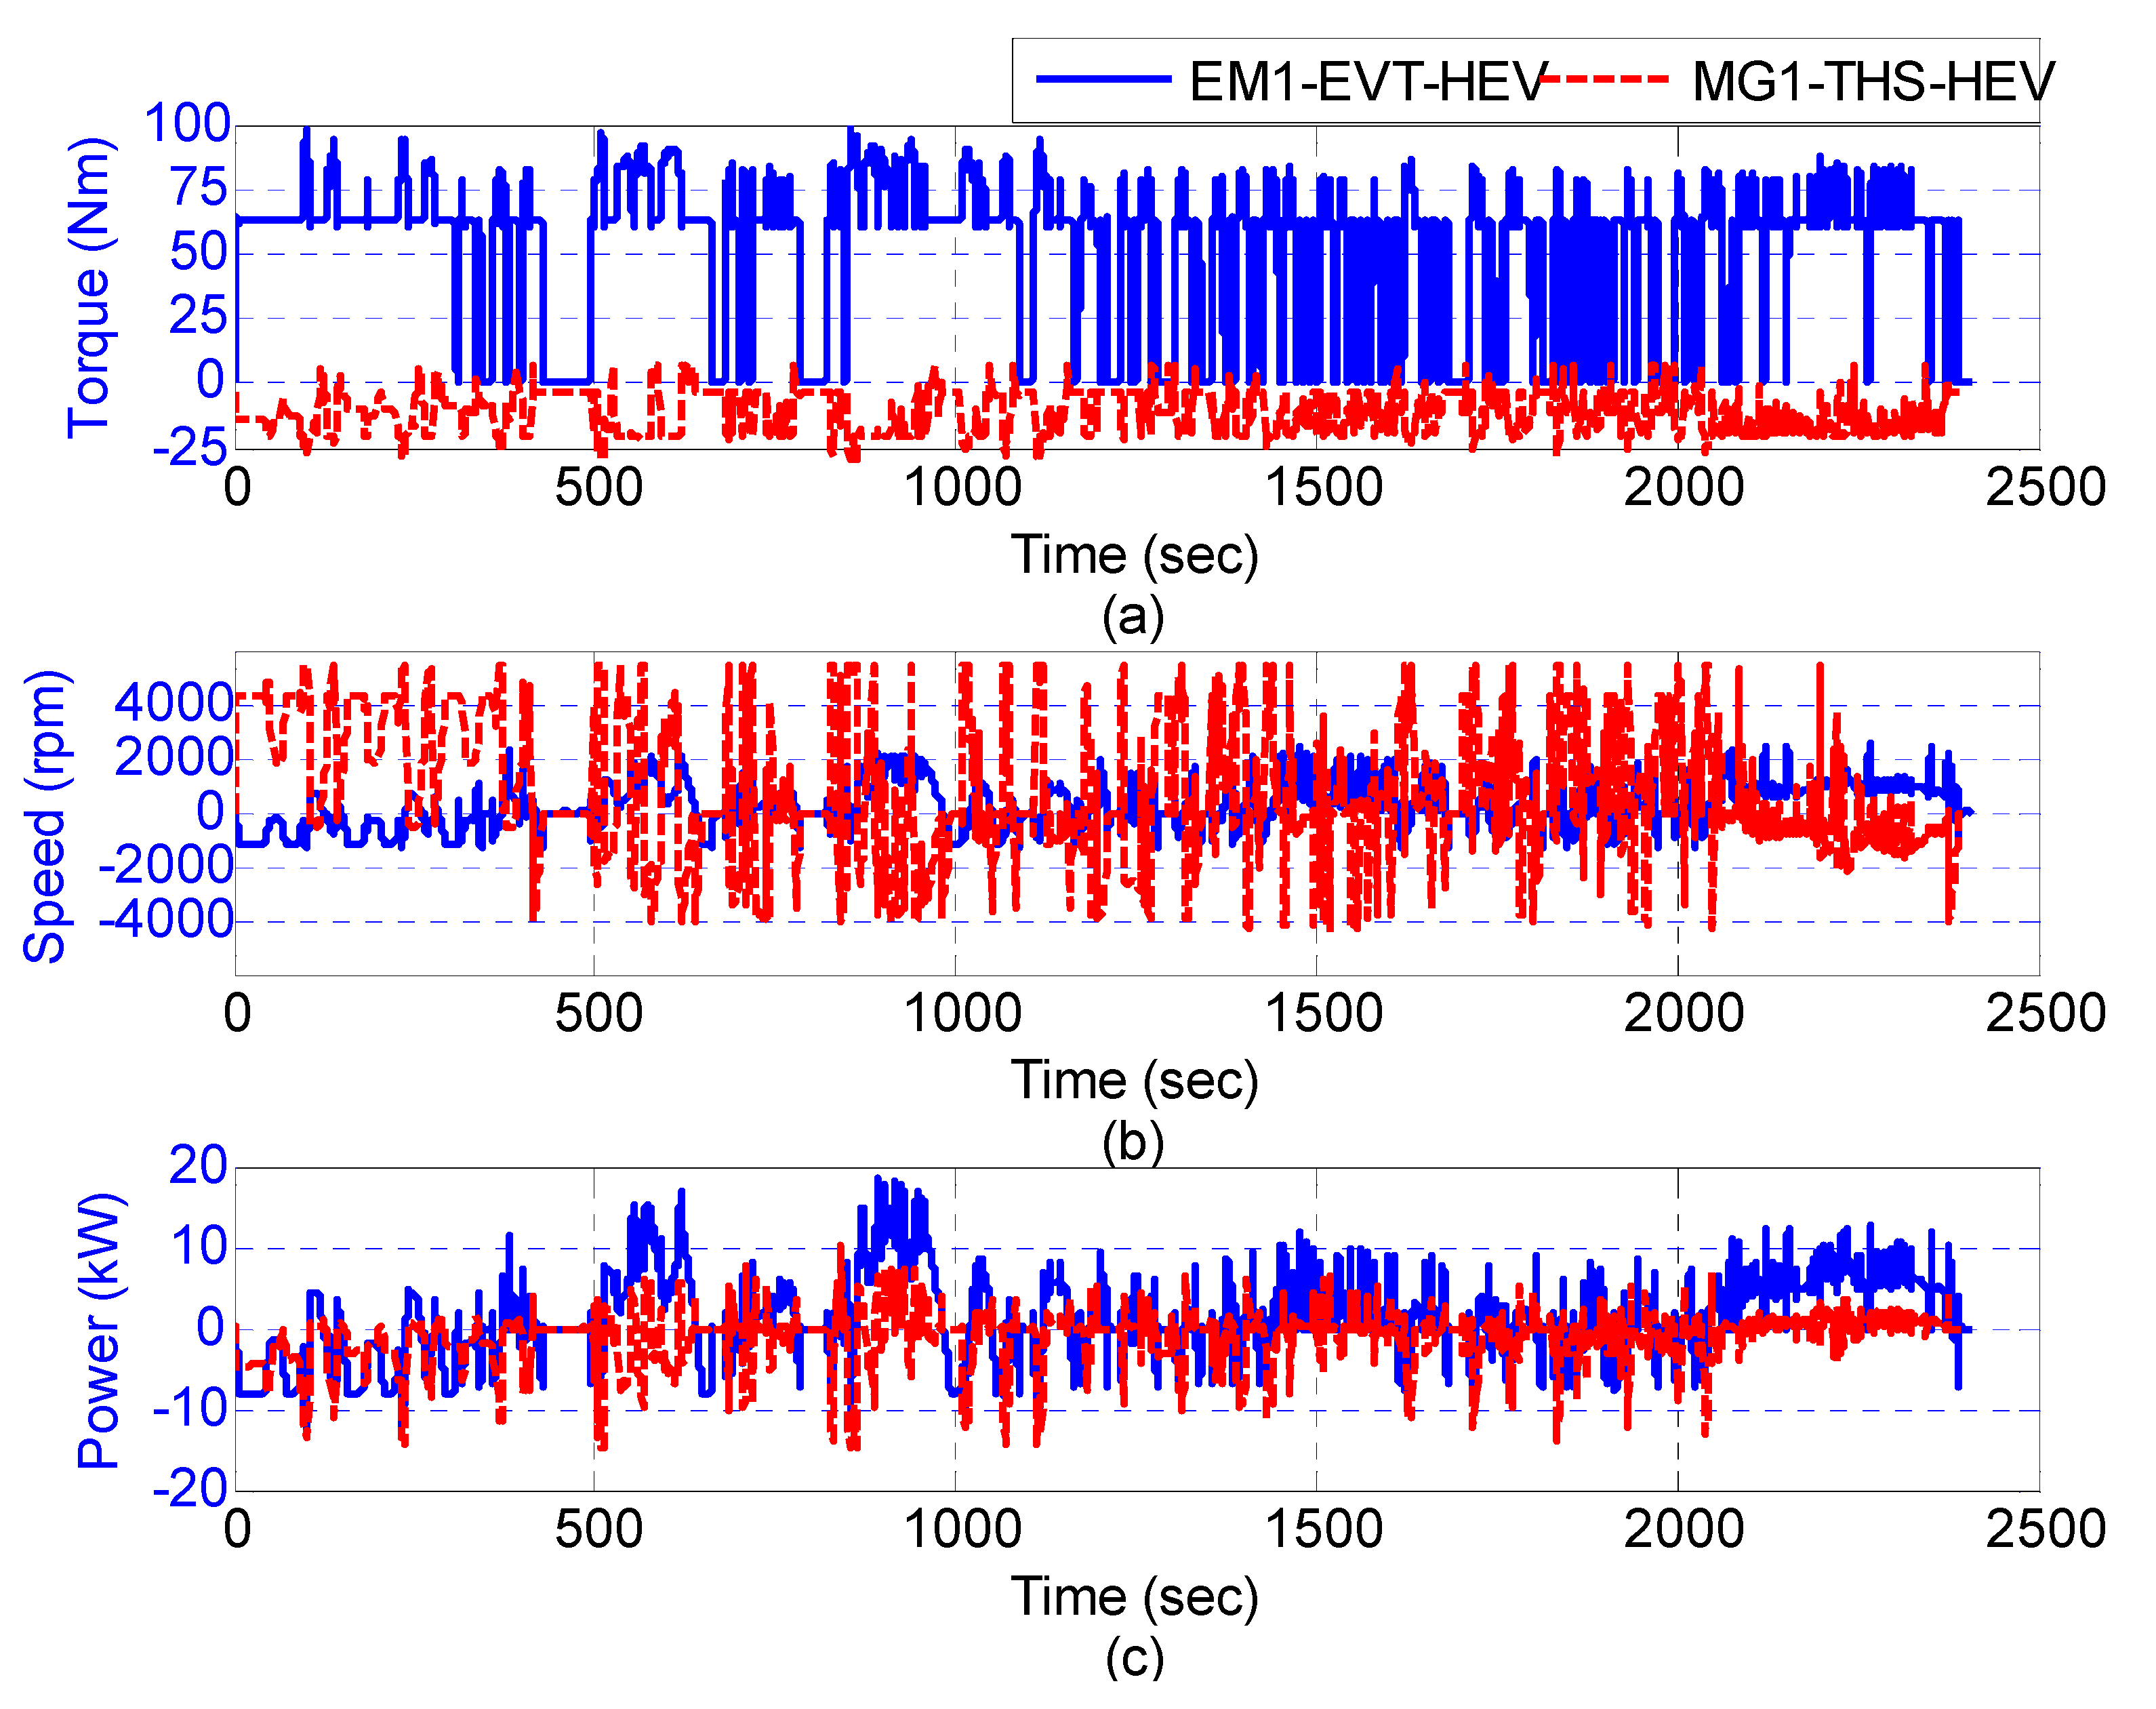
5.3. EM1 Performance

Figure 18 shows the torque, speed, and power of EM1 for the HEV using EVT and MG1 of THS-Prius HEV. In HEV using EVT, EM1 develops the same torque of the engine added to the inertia effect of the shaft; whereas MG1 develops negative torque working as a generator, as shown in Figure 18a. Figure 18b indicates that the speed of both of EM1 and MG1 are different because of different position for each in the HEV system. In Figure 18c, it has to be noted that, the EM1 can work as a generator and also as a motor according to the speed difference between the inner and outer rotors of the EVT.
Figure 18. EM1/MG1 Performances of EVT-HEV and Prius HEV: (a) Torque; (b) Speed; (c) Power.
Energies 05 01175 g018

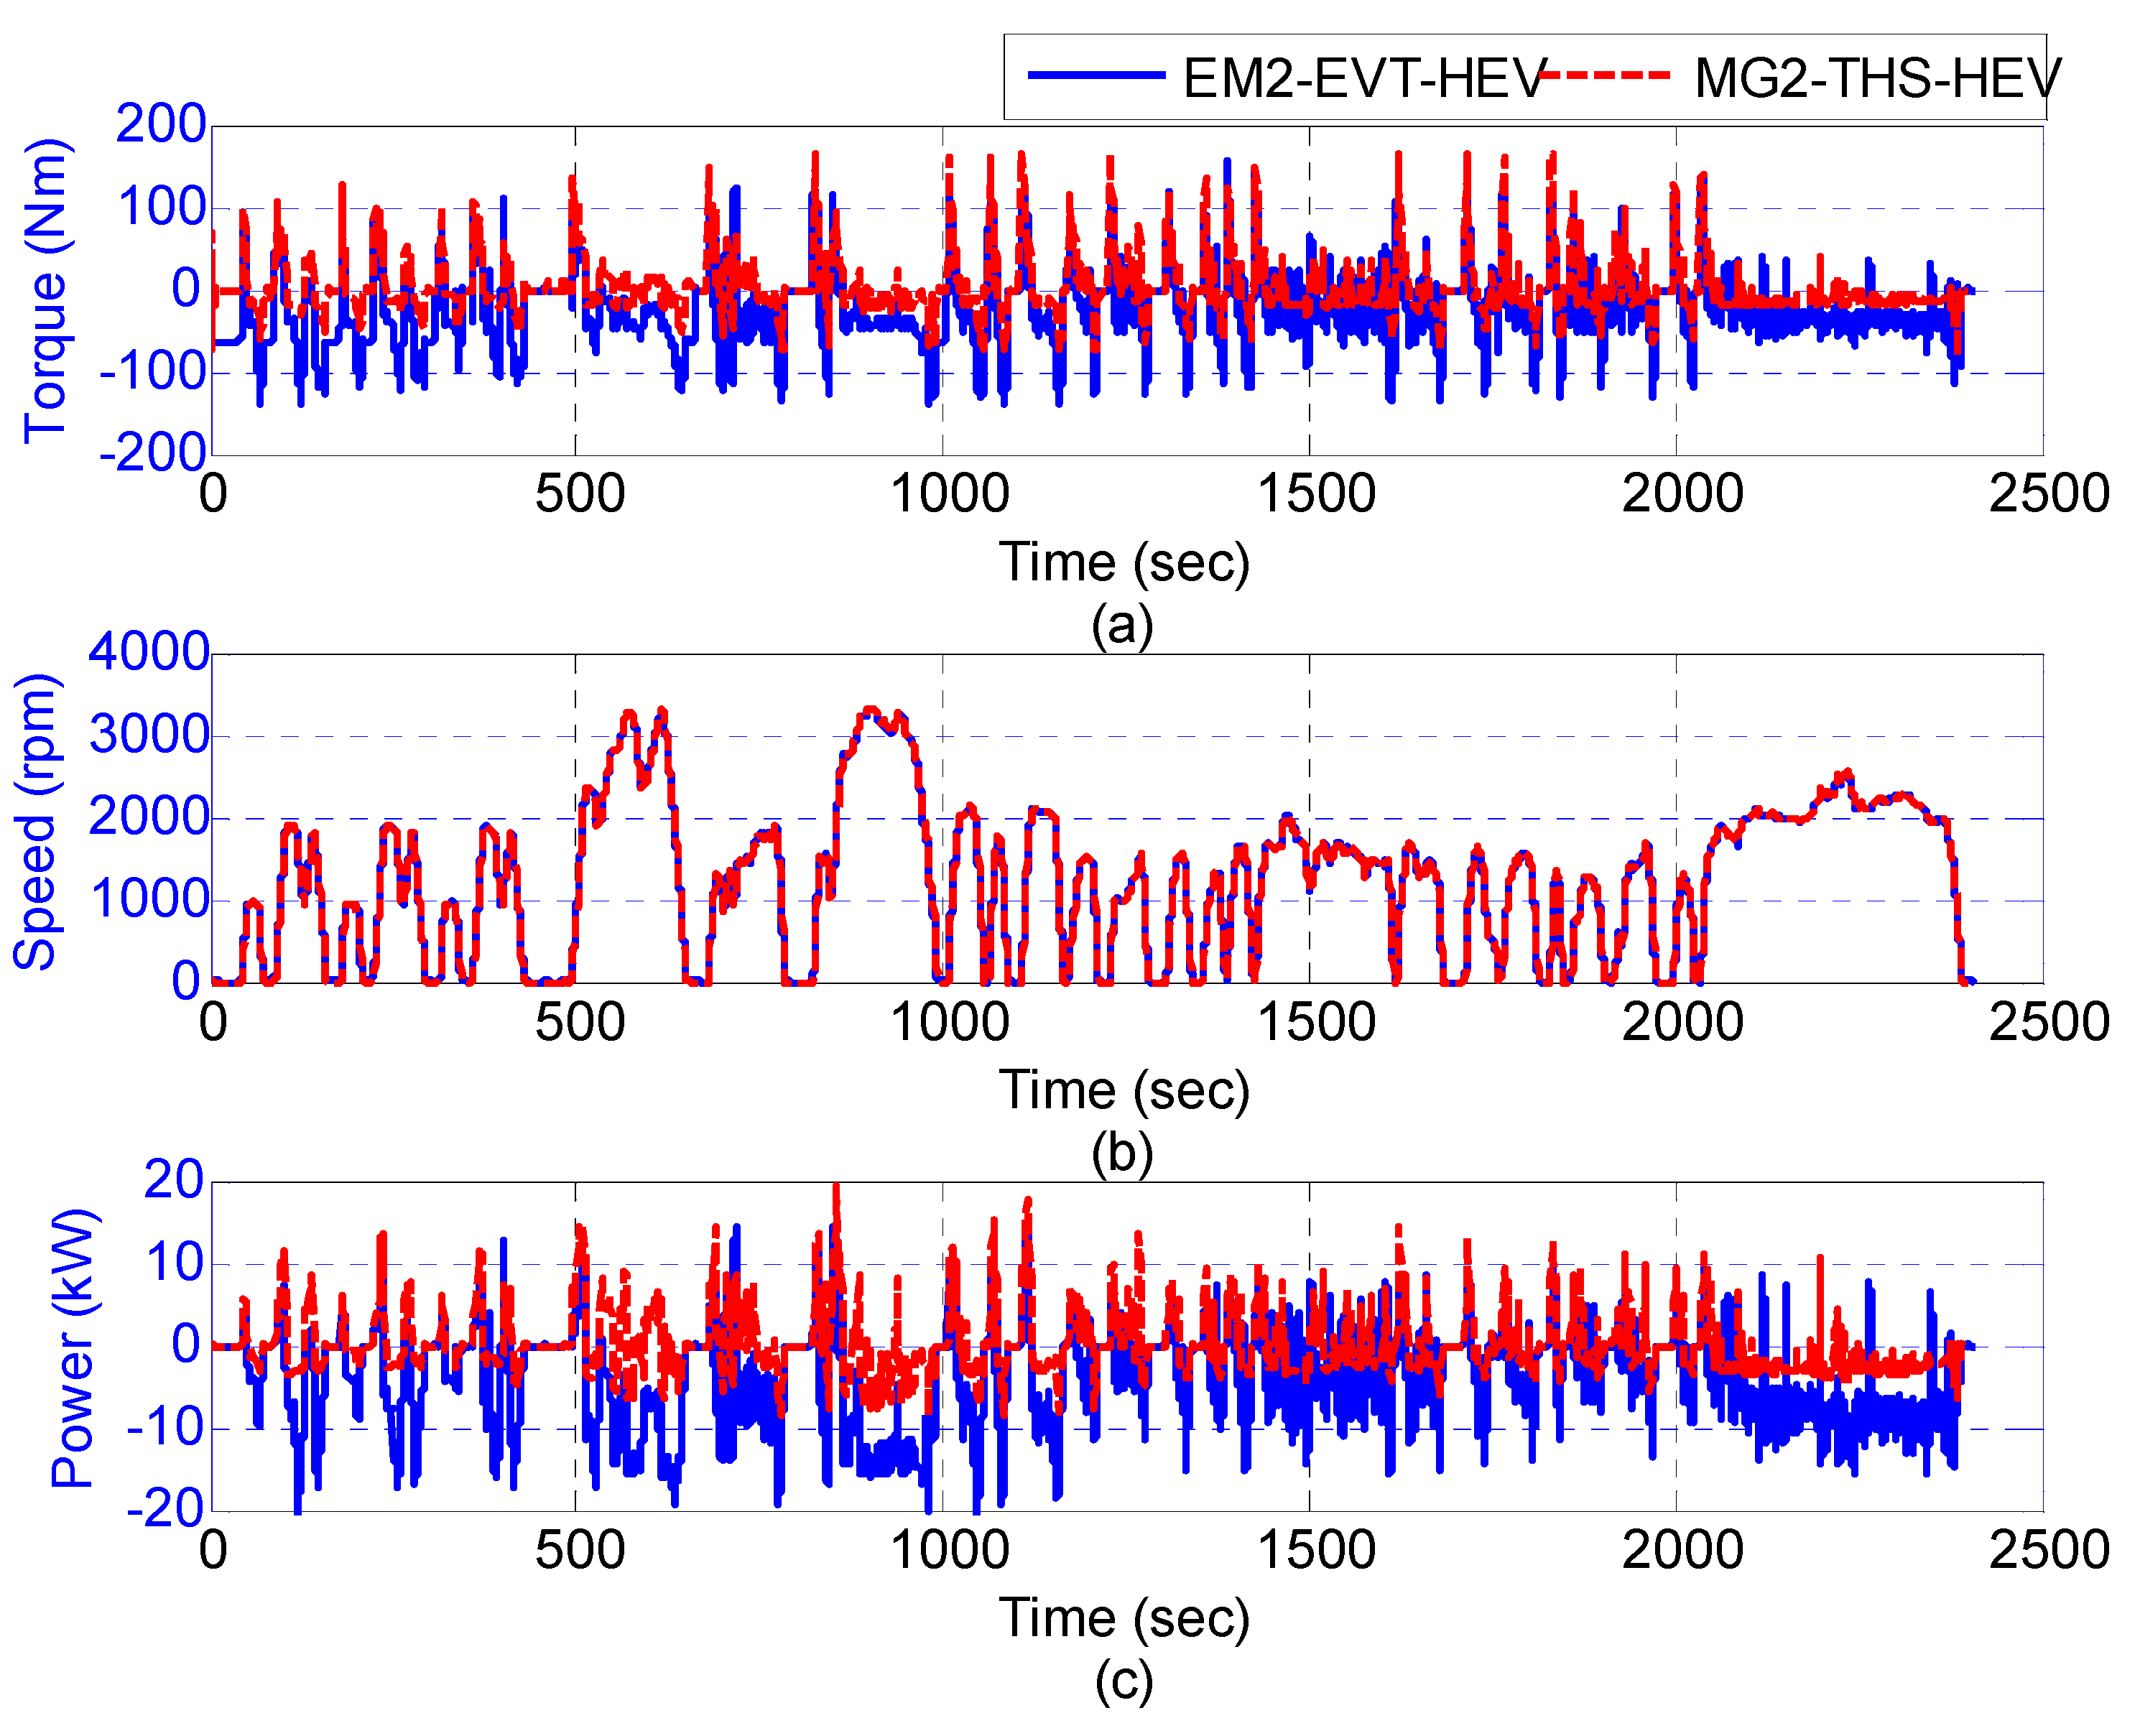
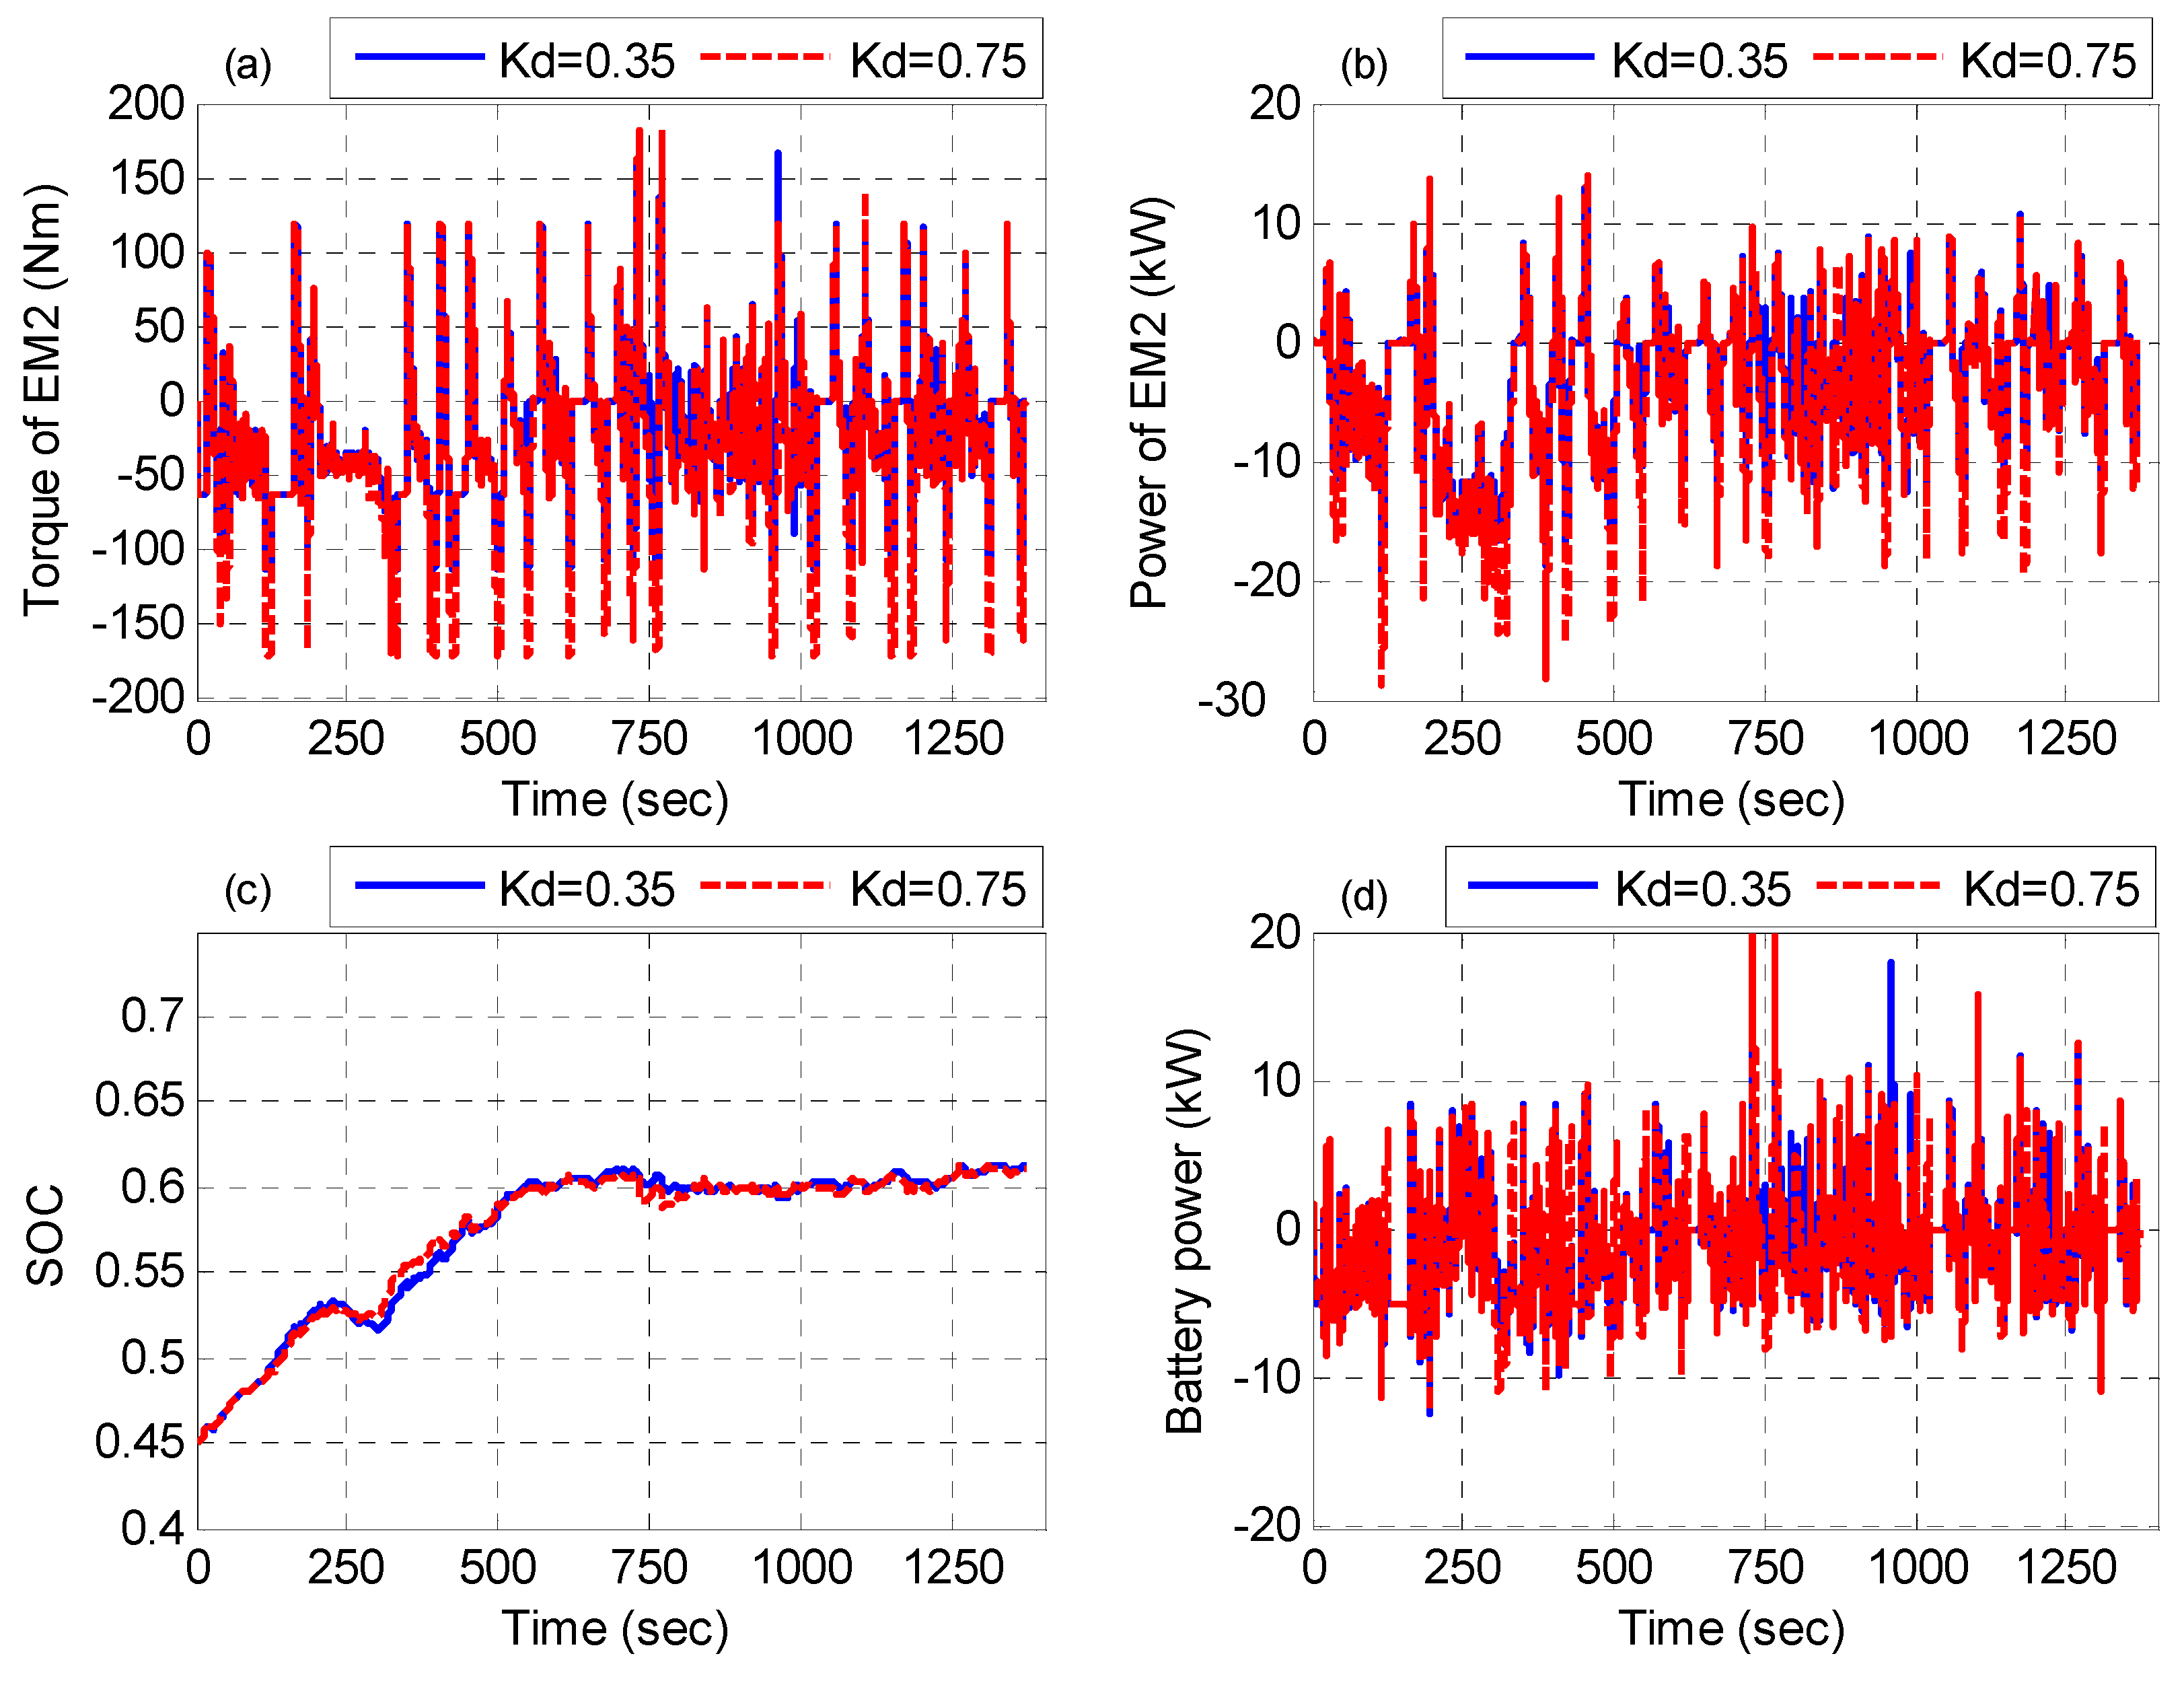
5.4. EM2 Performance

Figure 19 shows the torque, speed, and power of EM2 for the EVT-HEV and MG2 for THS-Prius HEV. At low vehicle torques and high engine torque   T m 1 > T m 2 , the engine’s torque is applied to EM2 with negative sign as shown in Figure 19a. This torque is considered as the base level torque of EM2. Figure 19b indicates that the speed of both of EM2 and MG2 are typical and proportional to the vehicle velocity. In Figure 19c it has to be noted that, most of time, the EM2 works as a generator. In addition, it develops the same positive power as that of MG2 to propel the vehicle at high torque requirements.
Figure 19. EM2/MG2 Performances of EVT-HEV and Prius HEV: (a) torque; (b) Speed; (c) Power.
Energies 05 01175 g019

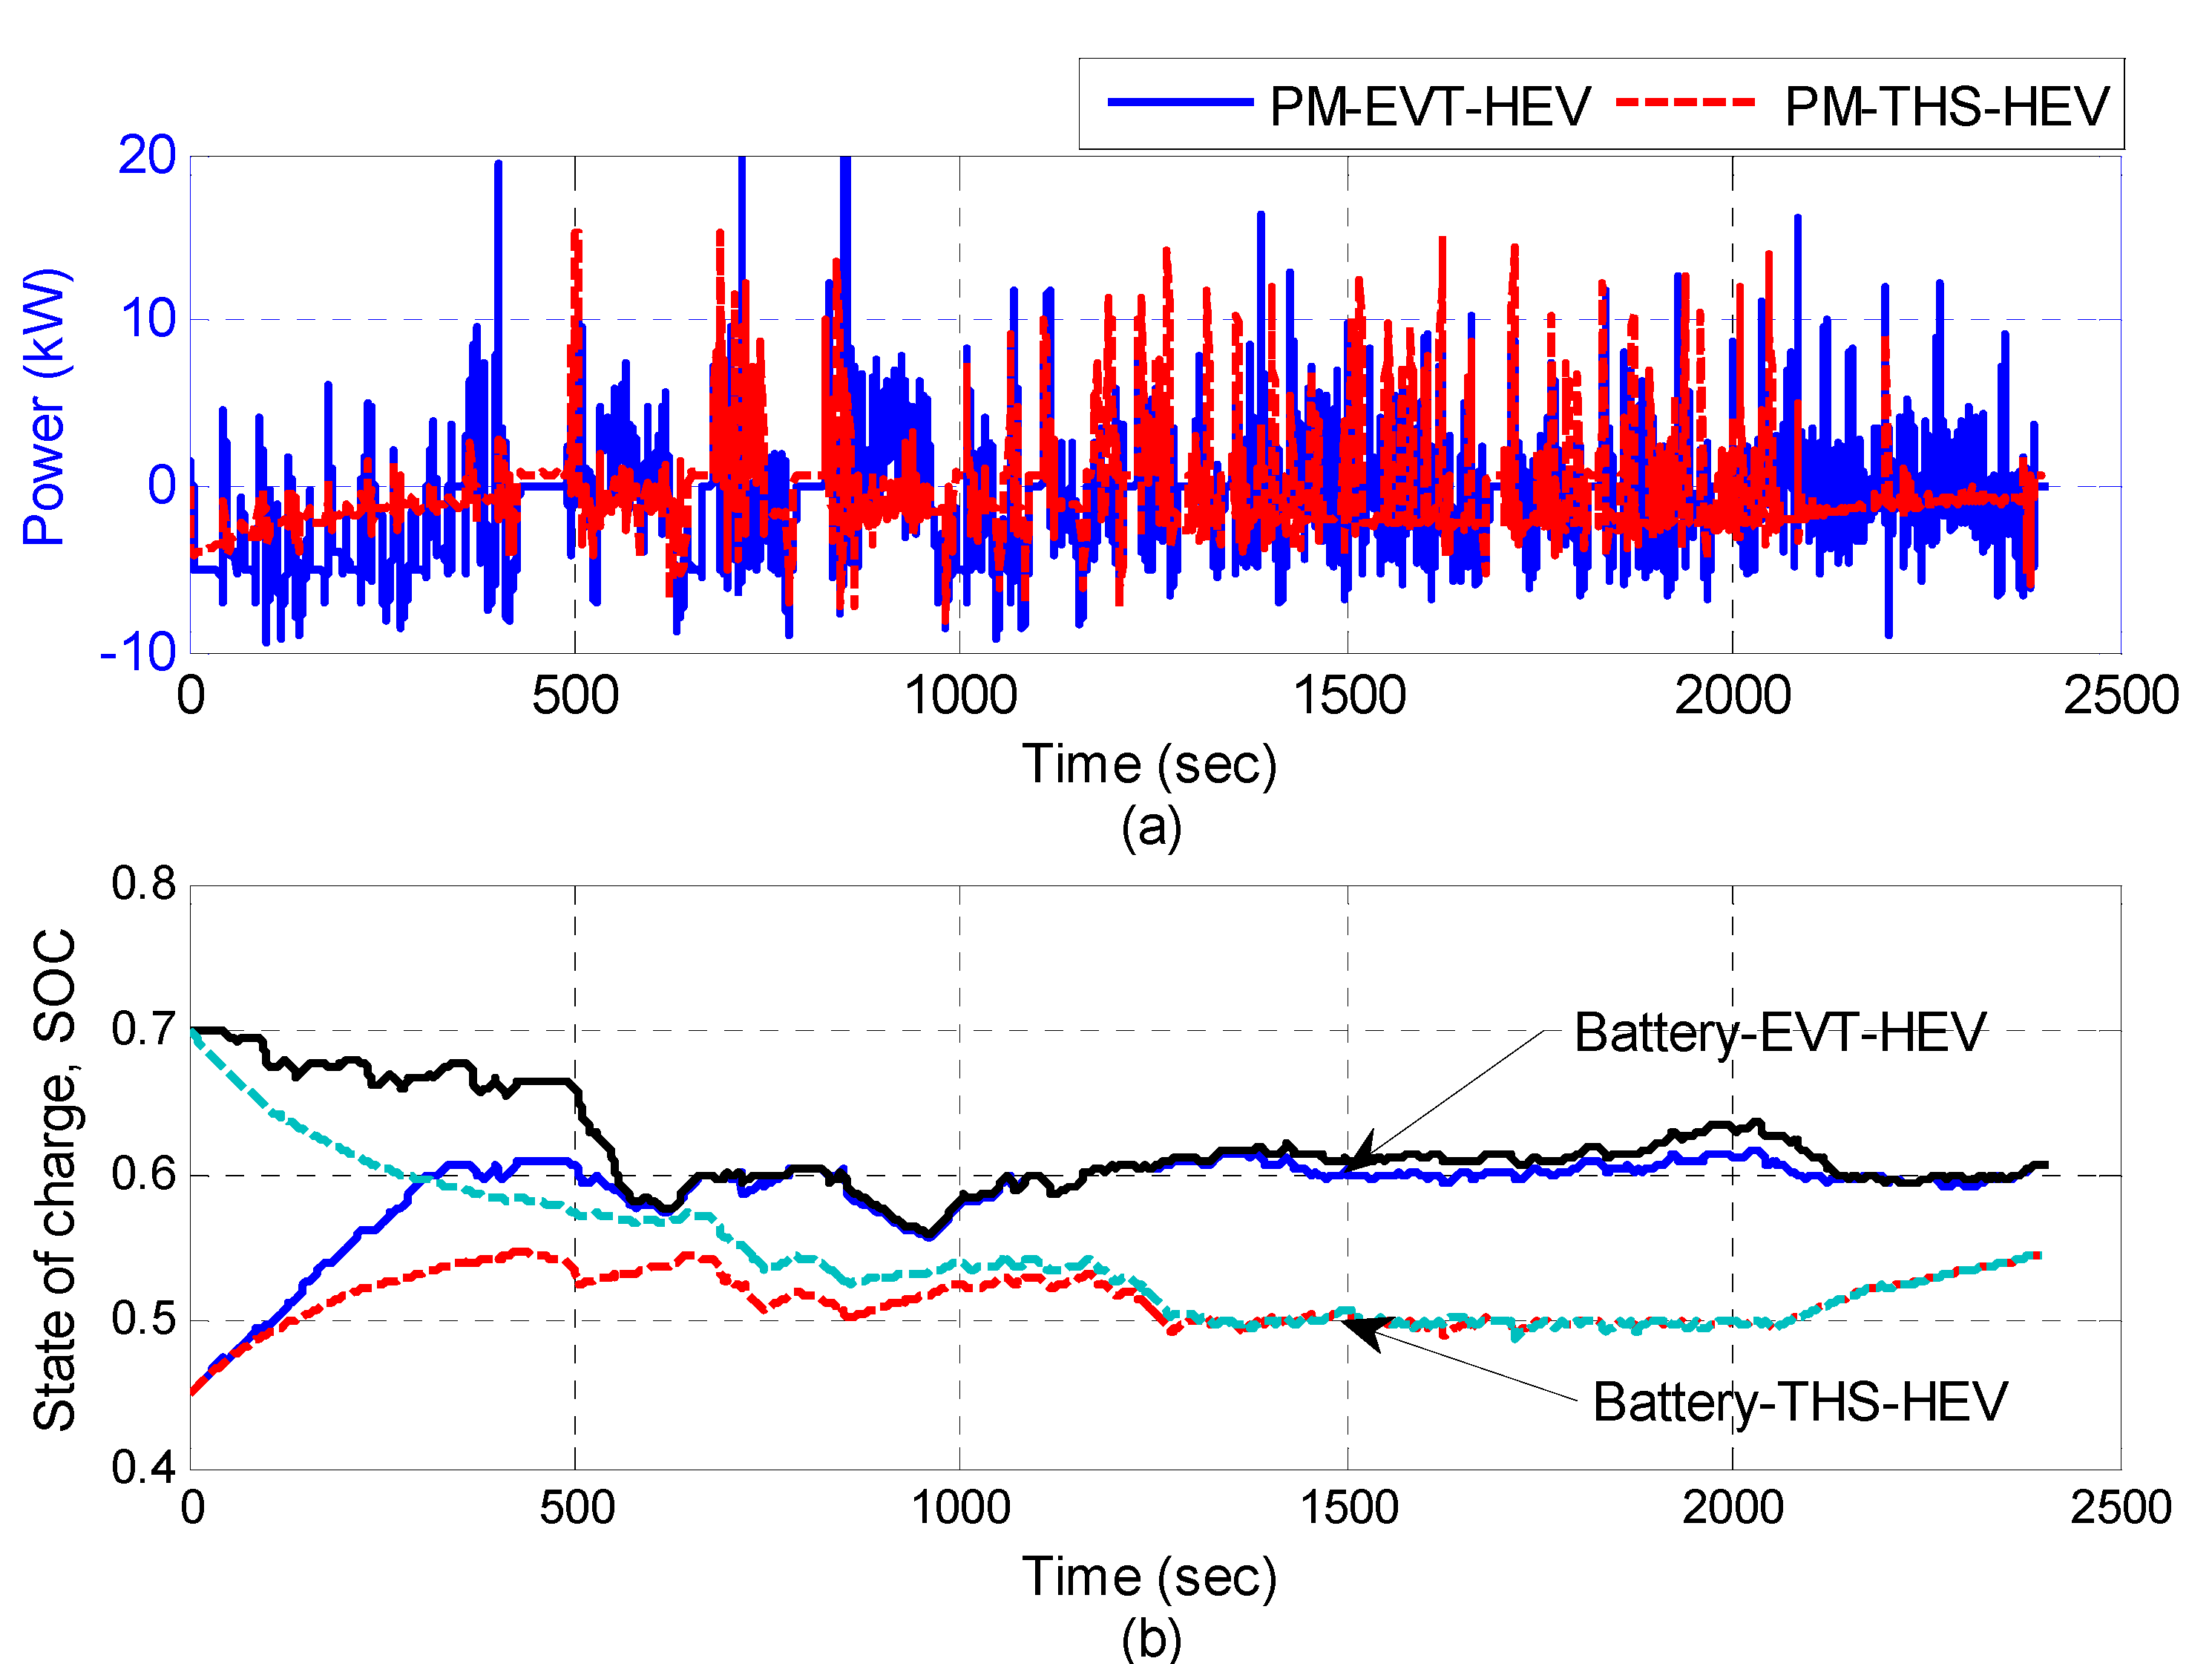
5.5. Battery Performance

The simulation results for the battery are presented and analyzed below. For this simulation, the initial SOC value is set to 0.45 and 0.7.
Figure 20. Battery performances of PM-EVT-HEV and Prius THE-HEV: (a) Power; and (b) SOC of the battery at different initial values.
Energies 05 01175 g020
The favorable value of SOC is 0.6. In Figure 20a, the battery power is presented for both types of HEVs. It has to be noted that the charging and discharging dynamics is high for the EVT-HEV due to the influence of the control strategy to sustain the SOC at its target value. Shown in Figure 20b, the SOC is sustained at the desired value of 0.6 in the EVT-HEV; whereas it is reached to 0.5 in the Prius HEV. The control strategy is validated at different initial values of the SOC.

6. Conclusions

The PM-EVT based HEV has been researched in depth with a fuzzy logic global power management strategy. This paper has attempted to help understand the underlying basis for the special advantages that the PM-EVT enjoys over other types of drivetrain for the series parallel HEVs. It is widely recognized that, with a robust global intelligent power management control strategy, the permanent magnet electric variable transmission may be considered an attractive candidate for driving hybrid electric vehicles that can replace the planetary gear set or other mechanical transmission components in the Toyota Prius HEV. In addition, the power of the electric machines is effectively confined to an acceptable ranges, compared with that in the “Toyota-Prius HEV” machines, which implies ease of manufacture, good sustainability, and low cost. Finally, global improvements in the performances of the Toyota Prius SPHEV with the PM-EVT drivetrain have been achieved. It includes sustaining the SOC of the battery very close to the target value, maximizing the recaptured braking energy, satisfying the driver’s commands, and the ICE working within its maximum efficiency region. This paper is considered a reason to ensure that the trend of energy management of HEVs based on PM-EVT will be continued during the few coming years with more on-line optimization strategies. The simulation results showed the effectiveness and the validity of the proposed strategy. It is interesting as an application of fuzzy control strategies.

References

  1. Hoeijmakers, M.J.; Ferreira, J.A. The Electric Variable transmission. IEEE Trans. Ind. Appl. 2006, 42, 1092–1100. [Google Scholar] [CrossRef]
  2. Cui, S.; Huang, W.; Zhang, Q. Research on Power Density Improvement Design of a HEV using Induction Machine based Electrical Variable Transmission. In Proceedings of IEEE Vehicle Power and Propulsion Conference, Harbin, China, September 2008; pp. 812–815.
  3. Cheng, Y.; Chen, K.; Chan, C.C.; Bouscayrol, A.; Cui, S. Global Modelling and Control Strategy Simulation for a Hybrid Electric Vehicle Using Electrical Variable Transmission. In Proceedings of IEEE Vehicle Power and Propulsion Conference, Harbin, China, September 2008.
  4. Chen, K.; Lhomme, W.; Bouscayrol, A.; Berthon, A. Comparison of Two Series-Parallel Hybrid Electric Vehicles Focusing on Control Structures and Operation Modes. In Proceedings of IEEE Vehicle Power and Propulsion Conference, Dearborn, MI, USA, September 2009; pp. 1308–1315.
  5. Cheng, Y.; Cui, S.; Chan, C.C. A Novel series-parallel power train for hybrid electric vehicle applications. J. Asian Electr. Veh. 2009, 7, 1239–1244. [Google Scholar] [CrossRef]
  6. Xu, L.Y. Breed of Electric Machines-Basic Analysis and Applications of Dual Mechanical Port Electric Machines. In Proceedings of the Eighth International Conference on Electrical Machines and Systems, Nanjing, China, September 2005; pp. 24–29.
  7. Fan, T.; Wen, X.; Chen, J.; Guo, X. Permanent Magnet Dual Mechanical Port Machine Design for Hybrid Electric Vehicle Application. In Proceedings of IEEE International Conference on Industrial Technology, Chengdu, China, April 2008.
  8. Cheng, Y.; Espanet, C.; Trigui, R.; Bouscayrol, A.; Cui, S. Design of a Permanent Magnet Electric Variable Transmission for HEV Applications. In Proceedings of IEEE Vehicle Power and Propulsion Conference, Lille, France, September 2010.
  9. Cheng, Y.; Rochdi, T.; Christophe, E.; Bouscayrol, A.; Cui, S. Specifications and design of a PM electric variable transmission for Toyota Prius II. IEEE Trans. Veh. Technol. 2011, 60, 4106–4114. [Google Scholar] [CrossRef]
  10. Abdelsalam, A.A.; Cui, S. Control and Analysis of Regenerative Power Distribution on Electrical Variable Transmission Using Fuzzy Logic on HEV System. In Proceedings of the International Conference on Electrical Machines and Systems, Beijing, China, August 2011.
  11. Abdelsalam, A.A.; Cui, S. Parametric design and robust control strategy for HEV based on permanent magnet electrical variable transmission. Res. J. Appl. Sci. Eng. Technol. 2012. accepted. [Google Scholar]
  12. Salmasi, F.R. Control strategies for hybrid vehicles: Evolution, classification, comparison and future trends. IEEE Trans. Veh. Technol. 2007, 56, 2393–2397. [Google Scholar] [CrossRef]
  13. Chen, K.; Cheng, Y.; Bouscayrol, A.; Chan, C.C.; Berthon, A.; Cui, S. Inversion-Based Control of a Hybrid Electric Vehicle Using a Split Electrical Variable Transmission. In Proceedings of IEEE Vehicle Power and Propulsion Conference, Harbin, China, September 2008.
  14. Hyeoun, D.L.; Seung-Ki, S. Fuzzy Logic-based torque control strategy for parallel-type hybrid electric vehicle. IEEE Trans. Ind. Electron. 1998, 45, 625–632. [Google Scholar] [CrossRef]
  15. Schouten, N.J.; Salman, M.A.; Kheir, N.A. Fuzzy logic control for parallel hybrid vehicles. IEEE Trans. Control Syst. Technol. 2002, 10, 460–468. [Google Scholar] [CrossRef]
  16. Bai, Z.; Wang, Y. Research on Modeling and Simulation of Hybrid Electric Vehicle Energy Control Systems. In Proceedings of the Eighth International Conference on Electrical Machines and Systems, Nanjing, China, September 2005; pp. 849–852.
  17. Anderson, T.A.; Barkman, J.M.; Mi, C. Design and Optimization of a Fuzzy-Rule Based Hybrid Electric Vehicle Controller. In Proceedings of IEEE Vehicle Power and Propulsion Conference, Harbin China, September 2008.
  18. Zhang, D.; Zhou, Y.; Lui, K.-P.; Chen, Q.-Q. A Study on Fuzzy Control of Energy Management System in Hybrid Electric Vehicle. In Proceedings of Power and Energy Engineering Conference, APPEEC Asia-Pacific, Wuhan, China, March 2009.
  19. Khoucha, F.; Benbouzid, M.E.H.; Kheloui, A. An Optimal Fuzzy Logic Power Sharing Strategy for Parallel Hybrid Electric Vehicles. In Proceedings of IEEE Vehicle Power and Propulsion Conference, Lille, France, September 2010.
  20. Chen, Z.; Zhang, X.; Mi, C. Slide mode and fuzzy logic based powertrain controller for the energy management and battery lifetime extension of series hybrid electric vehicles. J. Asian Electr. Veh. 2010, 8, 1425–1432. [Google Scholar] [CrossRef]
  21. Gao, Y.; Chen, L.; Ehsani, M. Investigation of the effectiveness of regenerative braking for EV and HEV. SAE 1999. 1999–01–2910. [Google Scholar]
  22. Gao, Y.; Chu, L.; Ehsani, M. Design and control principles of hybrid braking system for EV, HEV and FCV. IEEE Trans. Veh. Technol. 2008, 54, 384–391. [Google Scholar]
  23. Li, X.; Xu, L.; Li, J.; Hua, J.; Ouyang, M. Regenerative Braking Control Strategy for Fuel Cell Hybrid Vehicles using Fuzzy Logic. In Proceedings of International Conference on Electrical Machines and Systems, Wuhan, China, October 2008; pp. 2712–2716.
  24. Zhang, J.; Song, B.; Cui, S.; Ren, D. Fuzzy Logic Approach to Regenerative Braking System. In Proceedings of the International Conference on Intelligent Human-Machine Systems and Cybernetics, IHMSC, Hangzhou, China, August 2009; pp. 451–454.
  25. Zhang, Z.; Xu, G.; Li, W.; Zheng, L. The Application of Fuzzy Logic in Regenerative Braking of EV. In Proceedings of Second International Conference on Intelligent Human-Machine Systems and Cybernetics, Nanjing, China, May 2010; pp. 124–128.
  26. Chen, K.; Bouscayrol, A.; Berthon, A.; Delarue, P.; Hissel, D.; Trigui, R. Global modeling of different vehicles using energetic macroscopic representation to focus on system functions and system energy properties. IEEE Veh. Technol. Mag. 2009, 4, 73–79. [Google Scholar] [CrossRef]
  27. Chen, K. Common Energetic Macroscopic Representation and Unified Control Structure for Different Hybrid Electric Vehicles. Ph.D. Thesis, University of Lille 1, Lille, France, May 2010. [Google Scholar]
  28. Advanced Vehicle Simulator, ADVISOR; National Renewable Energy Laboratory (NREL) of U.S. Department of Energy: Washington, DC, USA, 2002.
  29. Ehsani, M.; Gao, Y.; Emadi, A. Modern Electric, Hybrid Electric and Fuel Cell Vehicles: Fundamental, Theory and Design, 2nd ed.; CRC Press: Boca Raton, FL, USA, 2010. [Google Scholar]

