H∞ Based Control for Load Mitigation in Wind Turbines

Abstract
:1. Introduction
2. Wind Turbine Model
2.1. Non-Linear Model
2.2. Linear Models


| Elem. | Mode | Freq. (Hz) | Abbrev. |
|---|---|---|---|
| Rotor | In plane 1st | 3.68 | MR1ip |
| In plane 1st FW | 1.31 | MR1ipfw | |
| In plane 1st BW | 0.89 | MR1ipbw | |
| In plane 2st | 7.85 | MR2ip | |
| In plane 2nd FW | 4.30 | MR2ipfw | |
| In plane 2nd BW | 3.88 | MR2ipbw | |
| Out of Plane 1st FW | 0.93 | MR1opfw | |
| Out of Plane 1st | 0.73 | MR1op | |
| Out of Plane 1st BW | 0.52 | MR1opbw | |
| Out of Plane 2nd FW | 2.20 | MR2opfw | |
| Out of Plane 2nd | 2.00 | MR2op | |
| Out of Plane 2st BW | 1.80 | MR2opbw | |
| Drive Train | Drive Train | 1.66 | MDT |
| Tower | 1st tower side-to-side | 0.28 | MT1ss |
| 1st tower fore-aft | 0.28 | MT1fa | |
| 2nd tower side-to-side | 2.85 | MT2ss | |
| 2nd tower fore-aft | 3.05 | MT2fa | |
| Non-str. | 1P | 0.2 | 1P |
| 3P | 0.6 | 3P |
3. Baseline Classical Control Strategy (C1)


- Output sensitivity peak: 6 dB approximately.
- Open loop phase margin between 30 and 60 degrees.
- Open loop gain margin between 6 and 12 dB.
- To maintain constant the PI zero frequency.


4. Objectives for Designing the New Proposed Control Strategy
- Generator speed control (increase of the output sensitivity bandwidth and reduction of the peak in comparison with the baseline controller).
- To mitigate the load on the drive train reducing the wind effect on the drive train mode.
- To mitigate the load on the tower reducing the wind effect on the tower first modes (side-to-side and fore-aft).
- To improve the load mitigation in comparison to a baseline controller based on the classical baseline control strategy.
5. New Proposed Control Strategy Based on H∞ Norm Reduction (C2)
5.1. Design of Control Strategy Based on H∞ Norm Reduction

- To extract the wind turbine linear models from the GH Bladed non-linear model. The wind turbine used for this design is the 5 MW Upwind model.
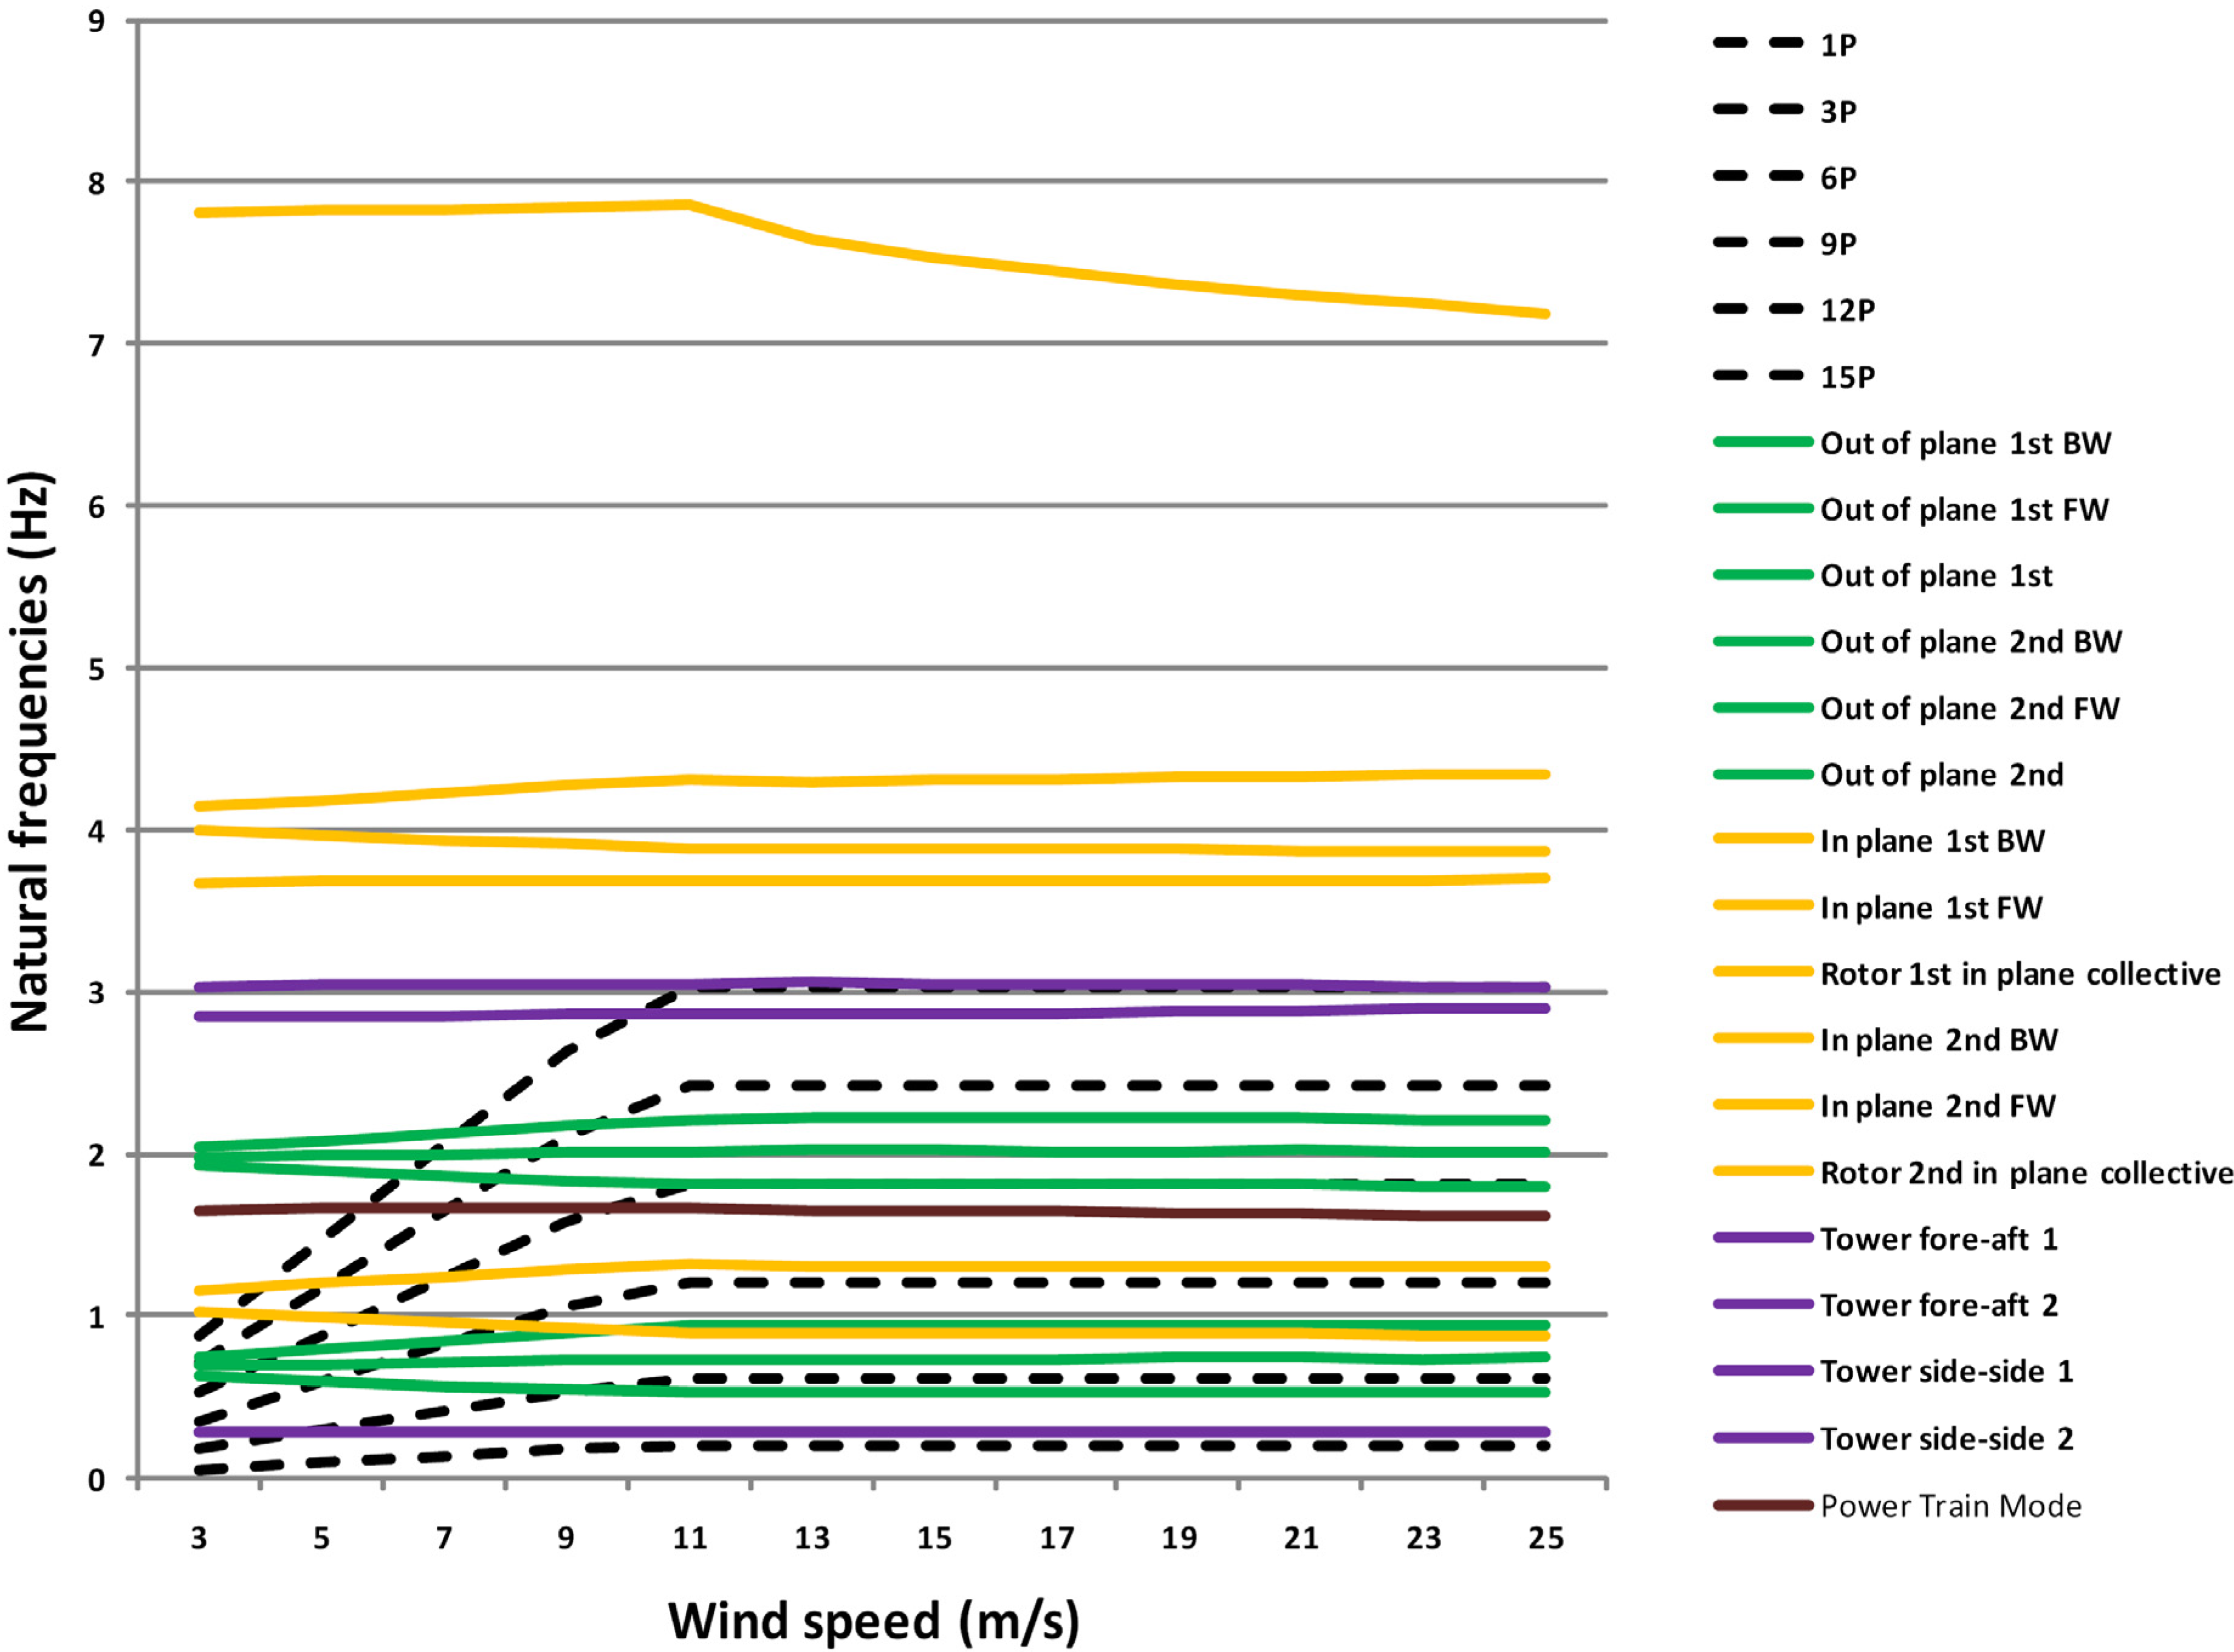
- To analyze the linear models in Simulink extracting the Campbell Diagram.
- To design the torque H∞ controller in MATLAB.
- To design the pitch H∞ controller in MATLAB taking into account the previous designed H∞ torque controller.
- To analyze the controller robustness in MATLAB.
- To test the controllers in Simulink.
- To include the controllers in the GH Bladed External Controller.
- To simulate the GH Bladed non-linear model using the designed two MISO H∞ controllers.
- To compare the time domain and frequency domain results to the baseline classical controller.
- To analyze the fatigue loads and extreme loads reduction of the proposed control strategy compared to the baseline control strategy.
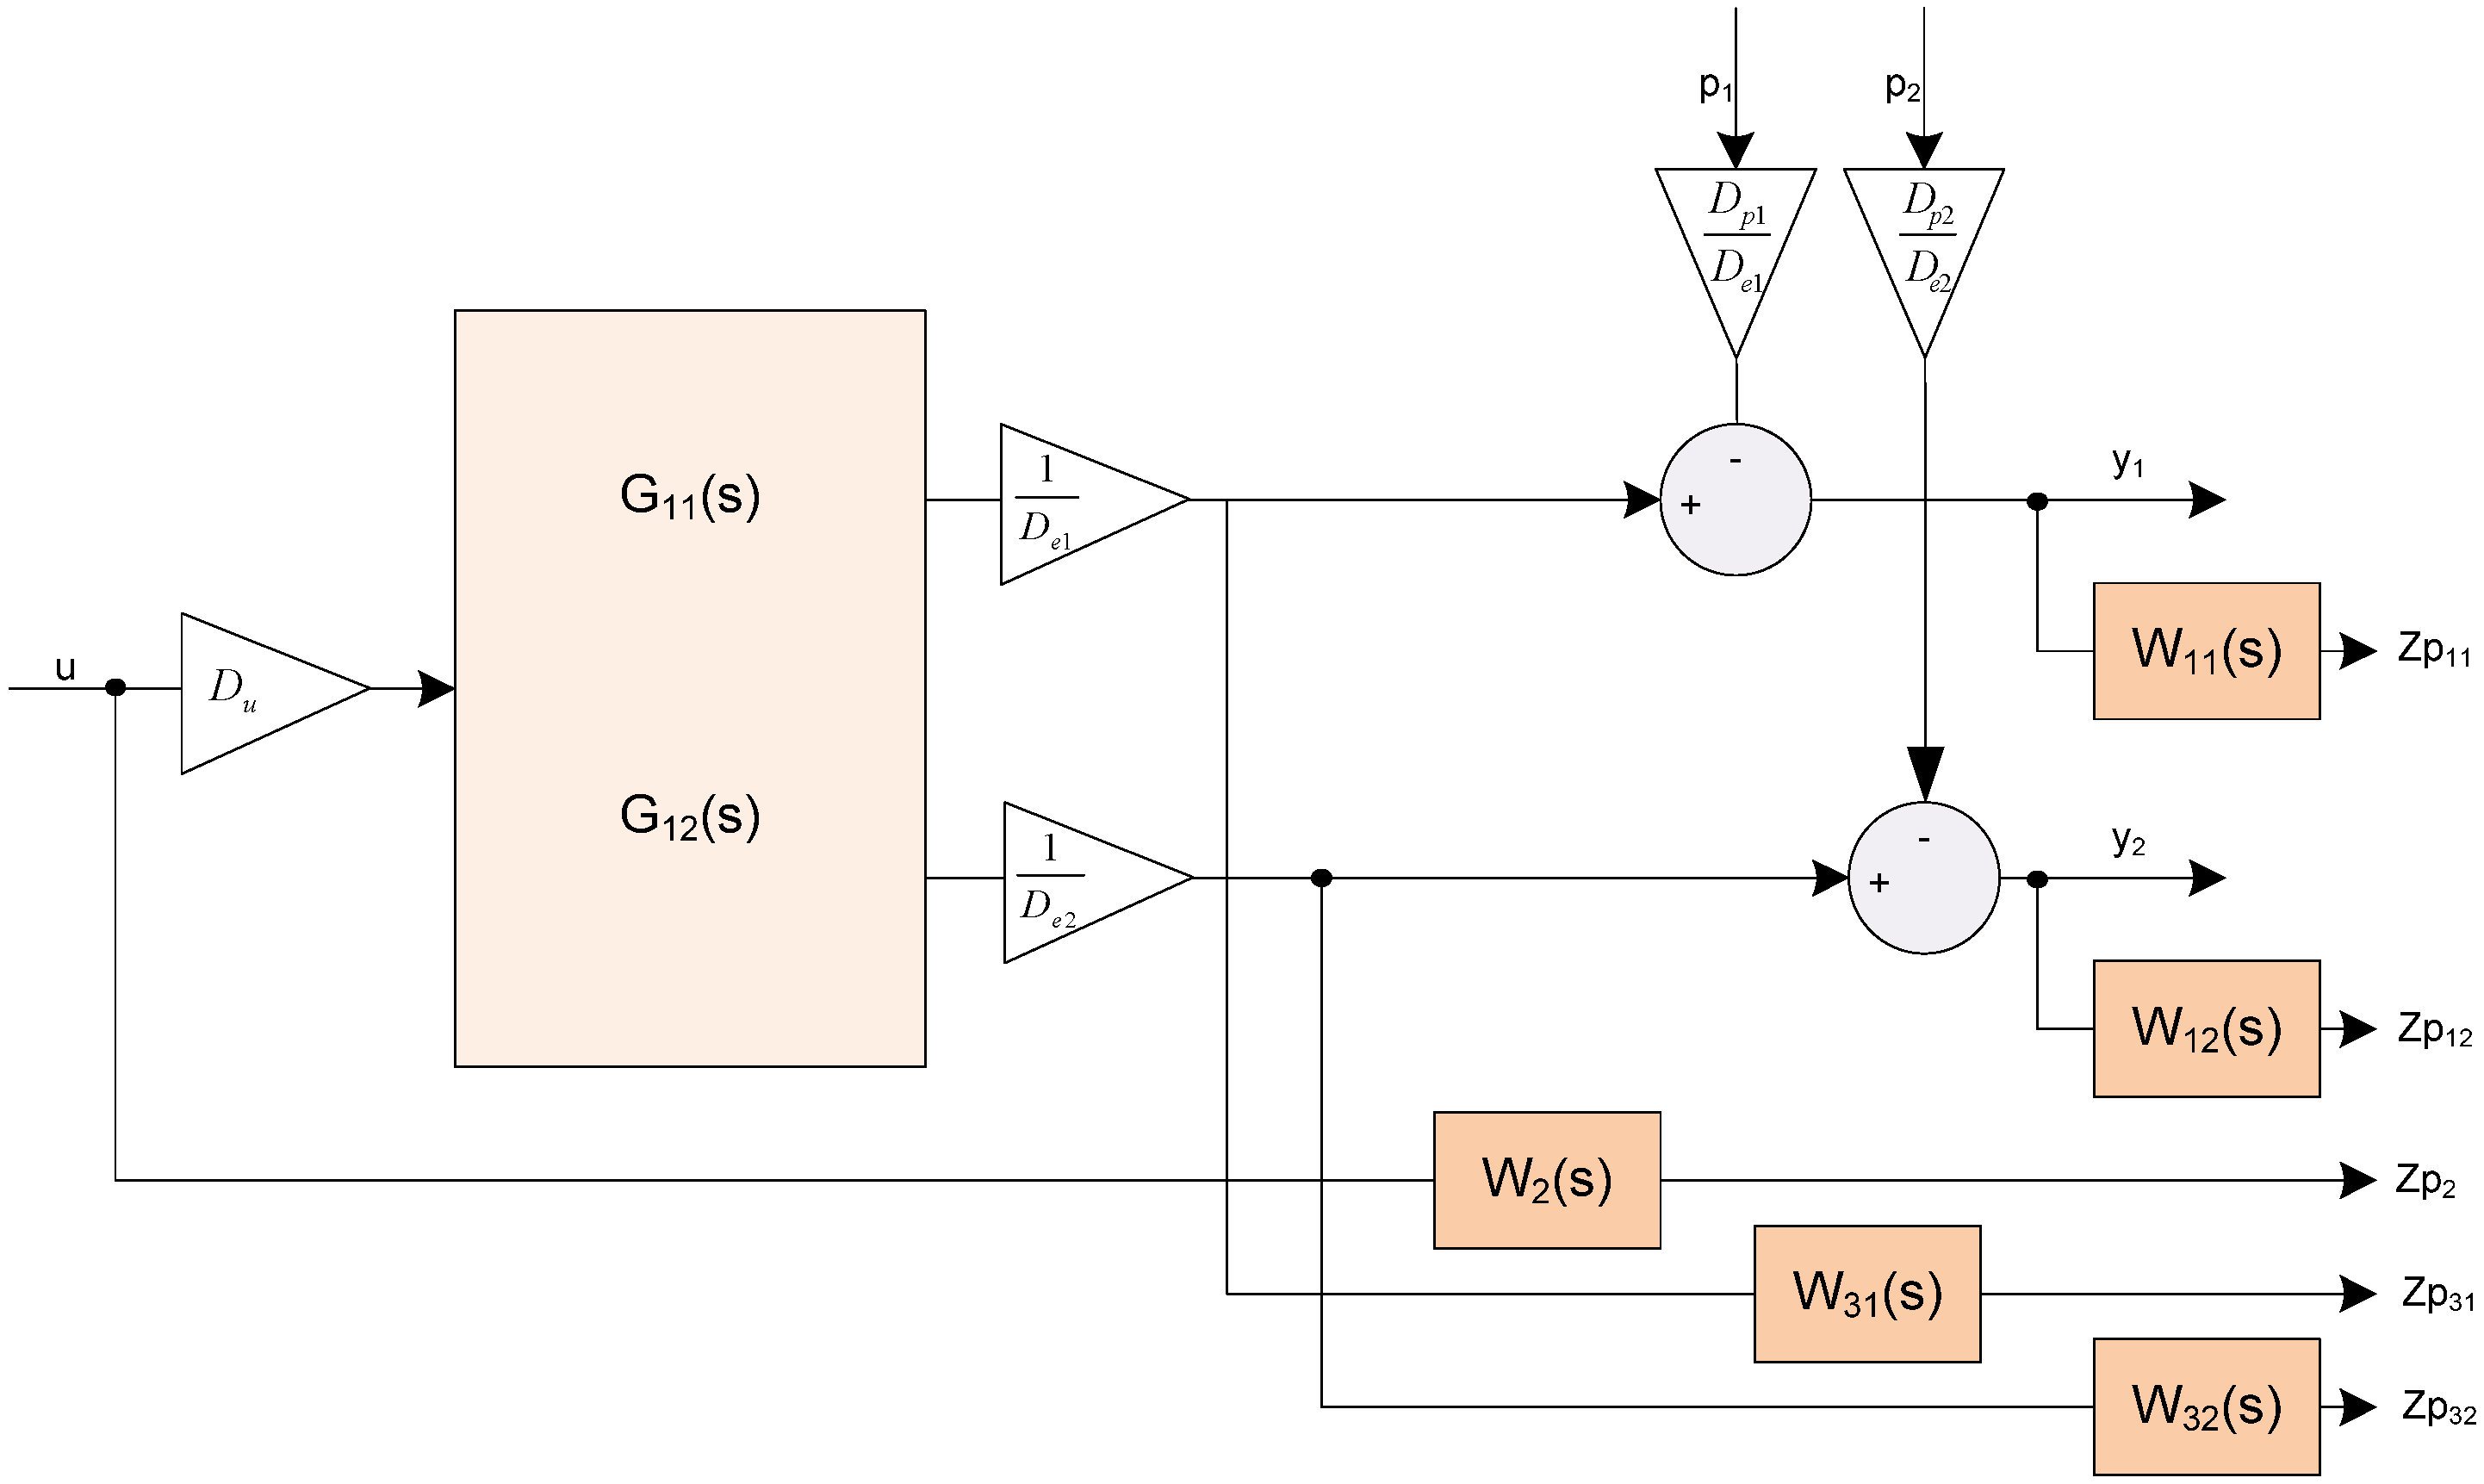
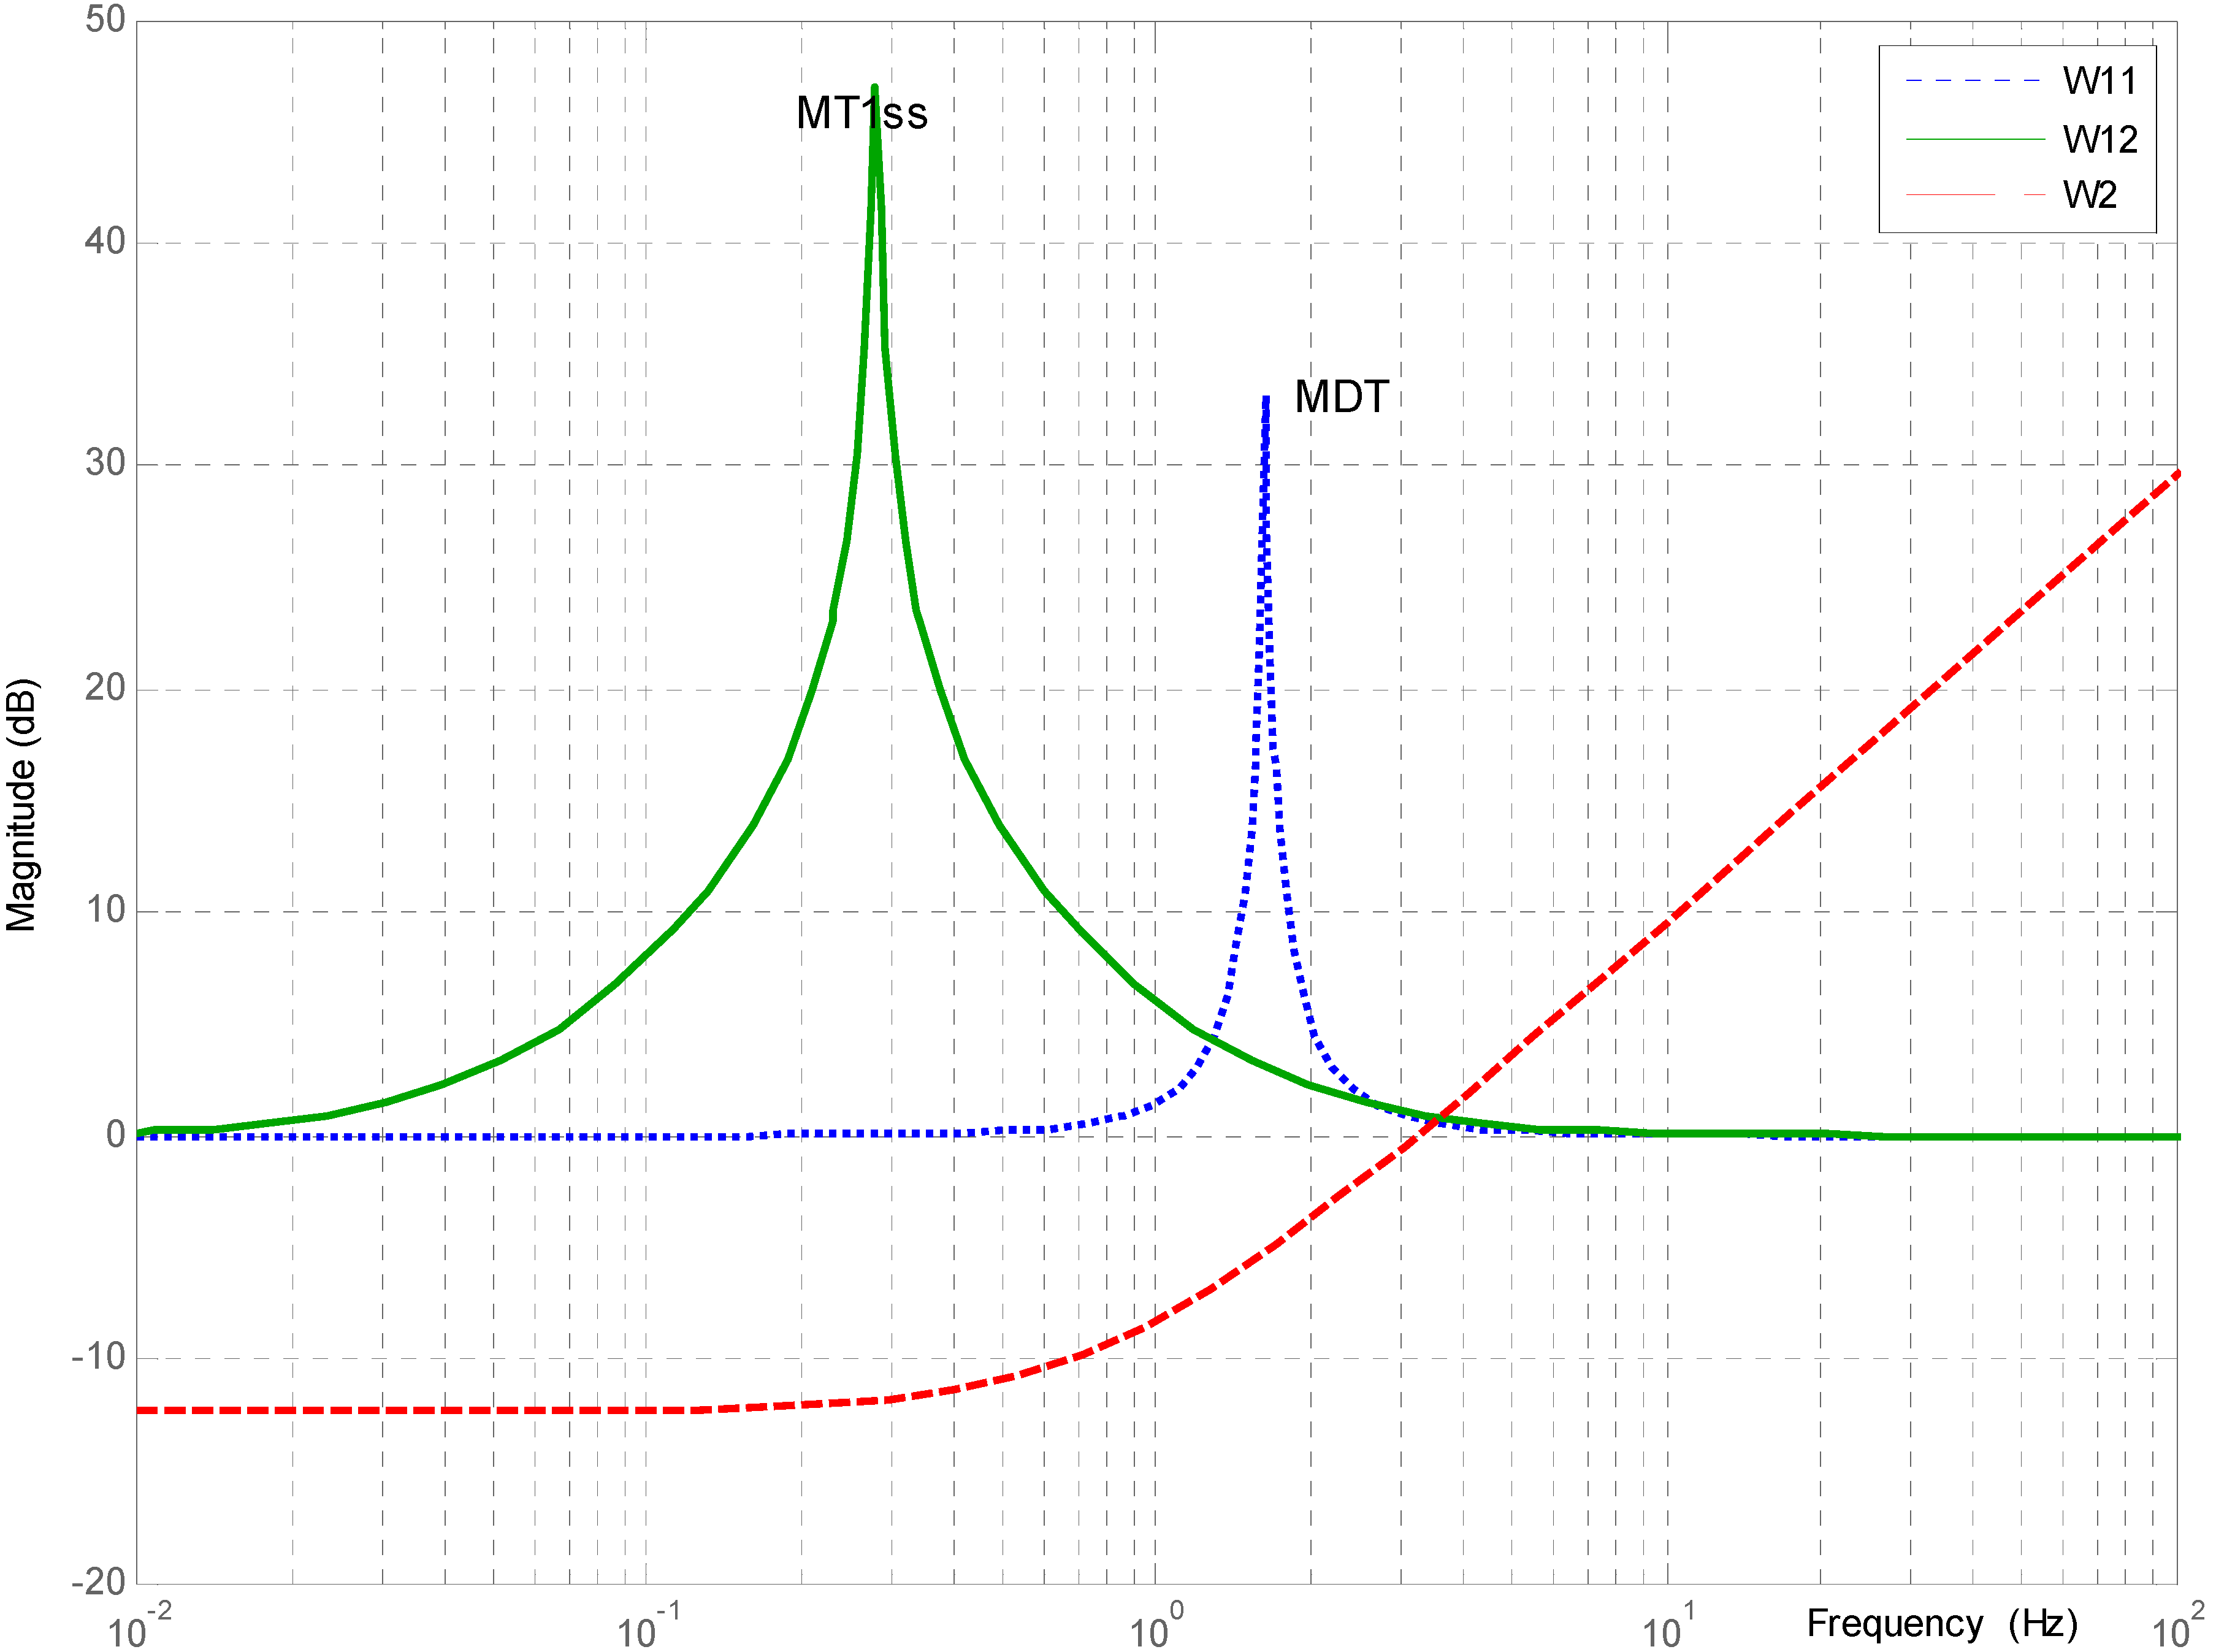
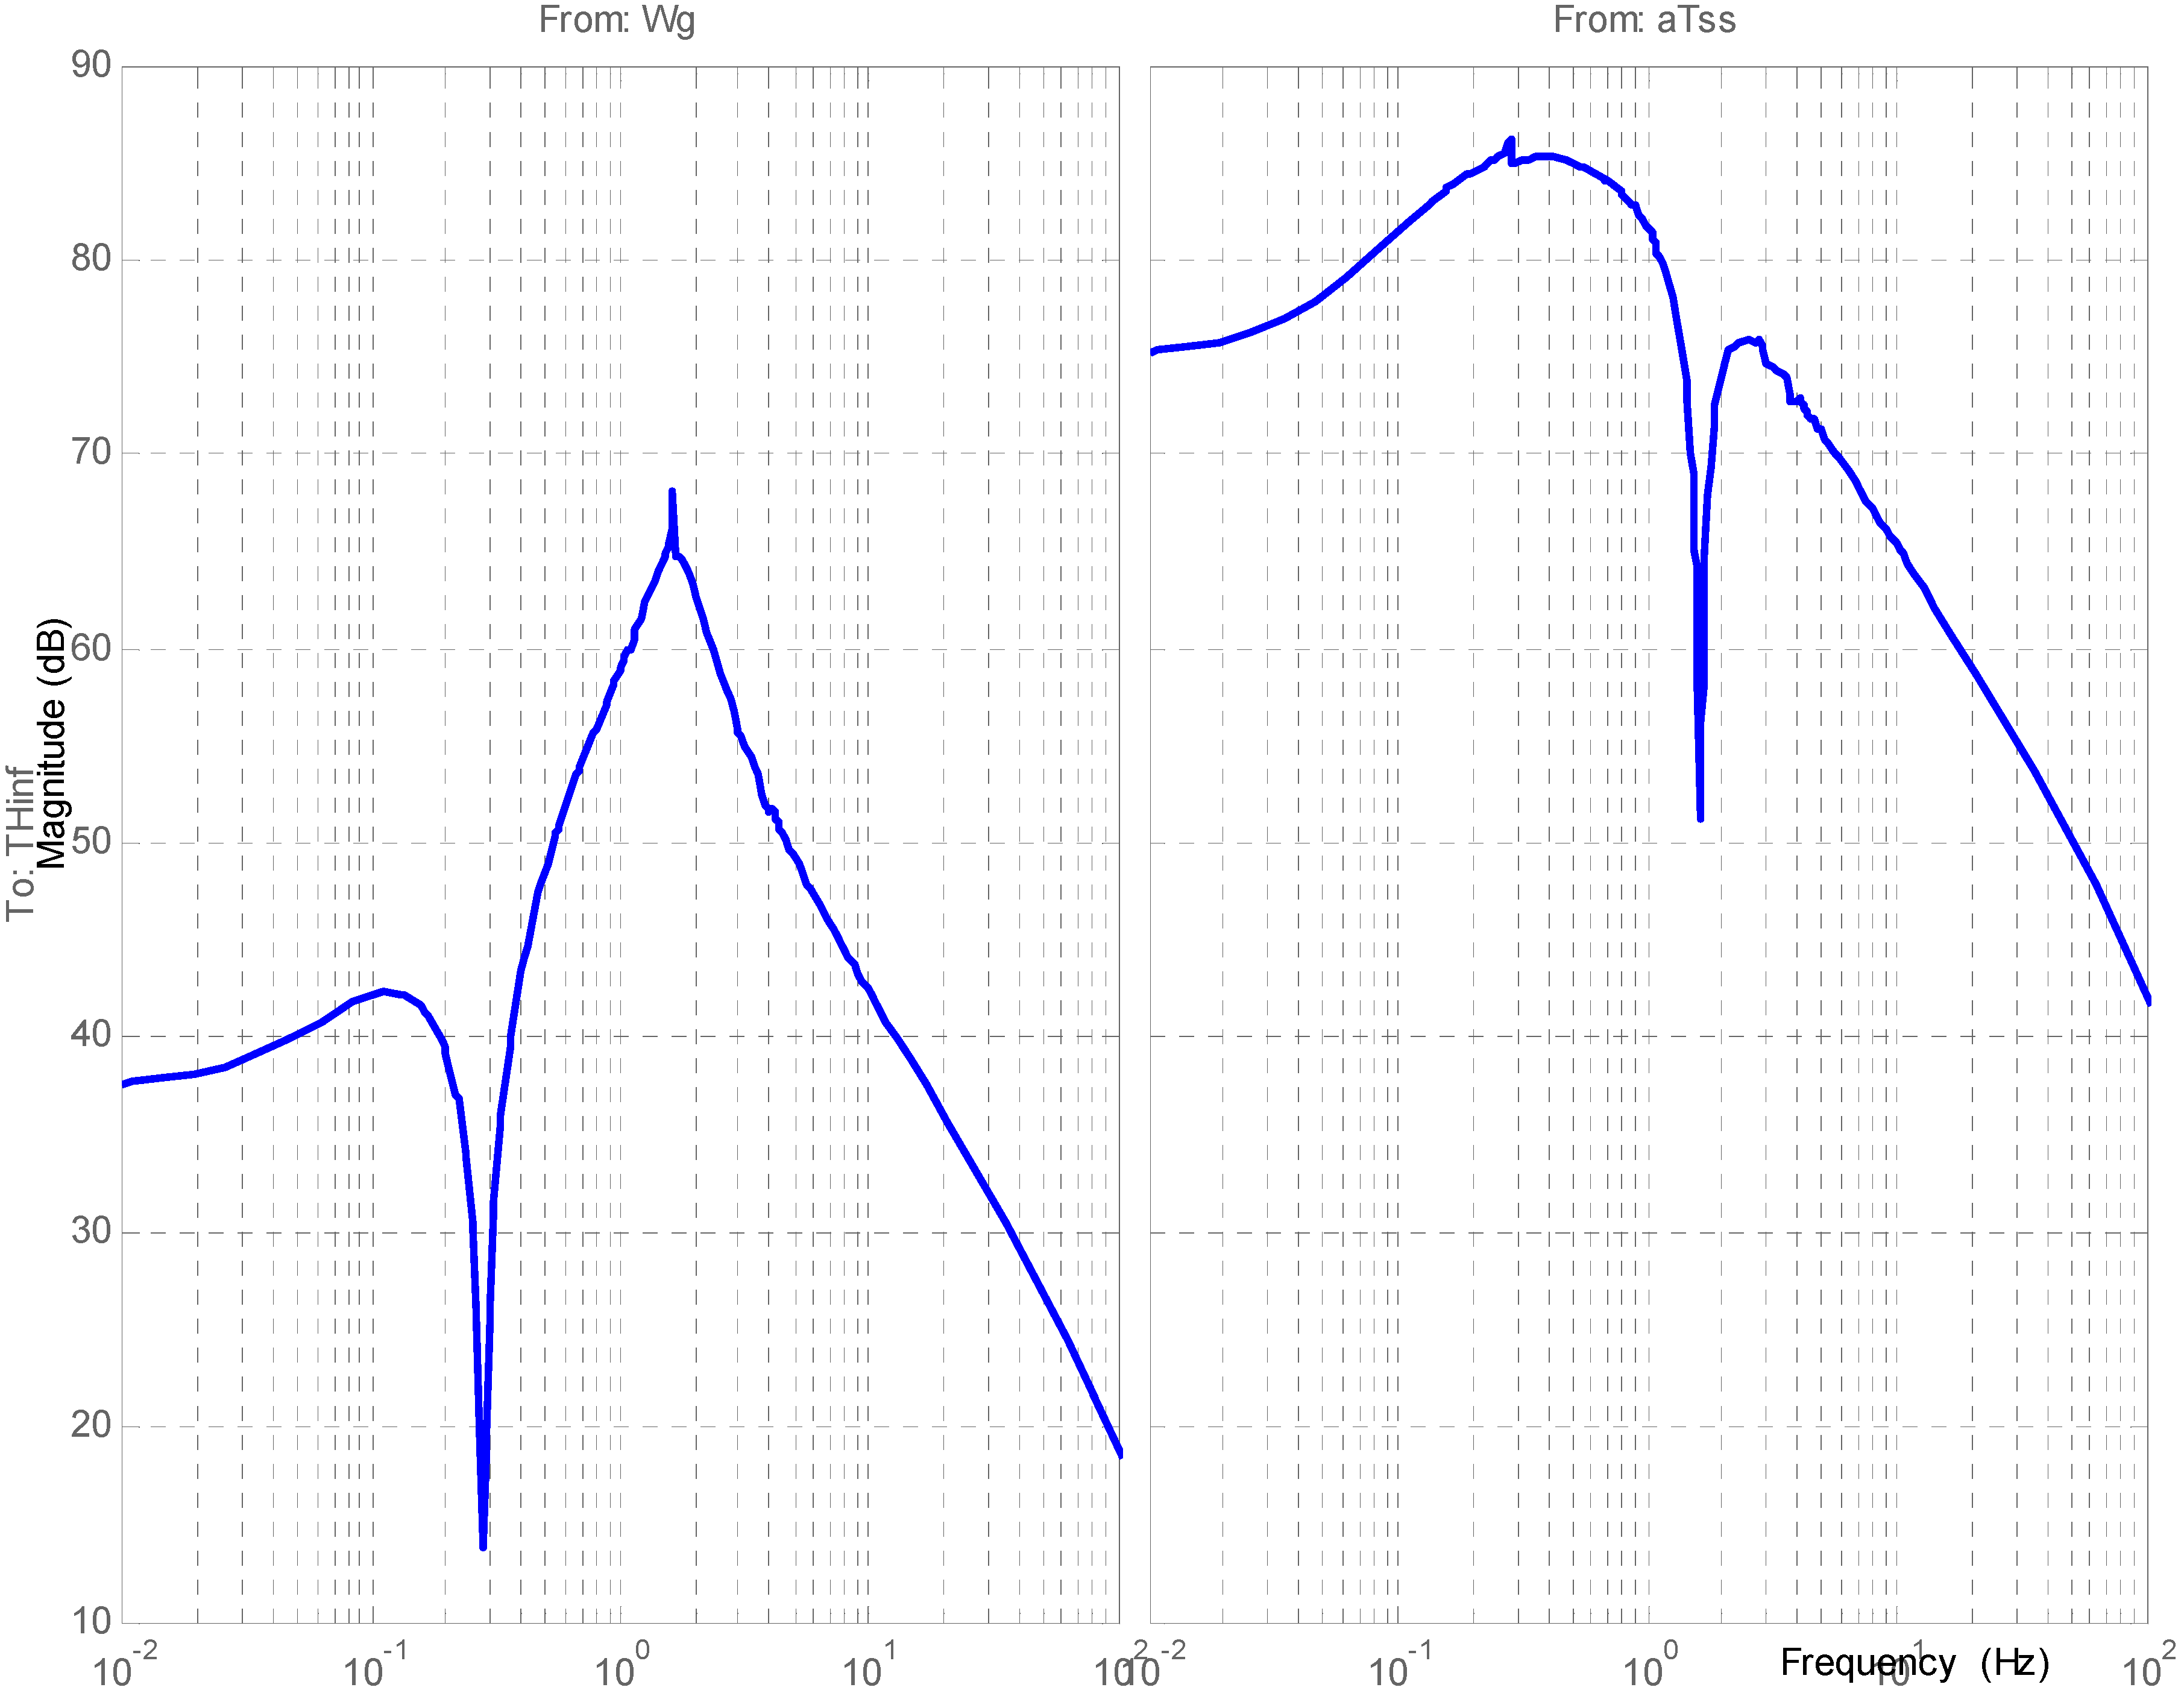
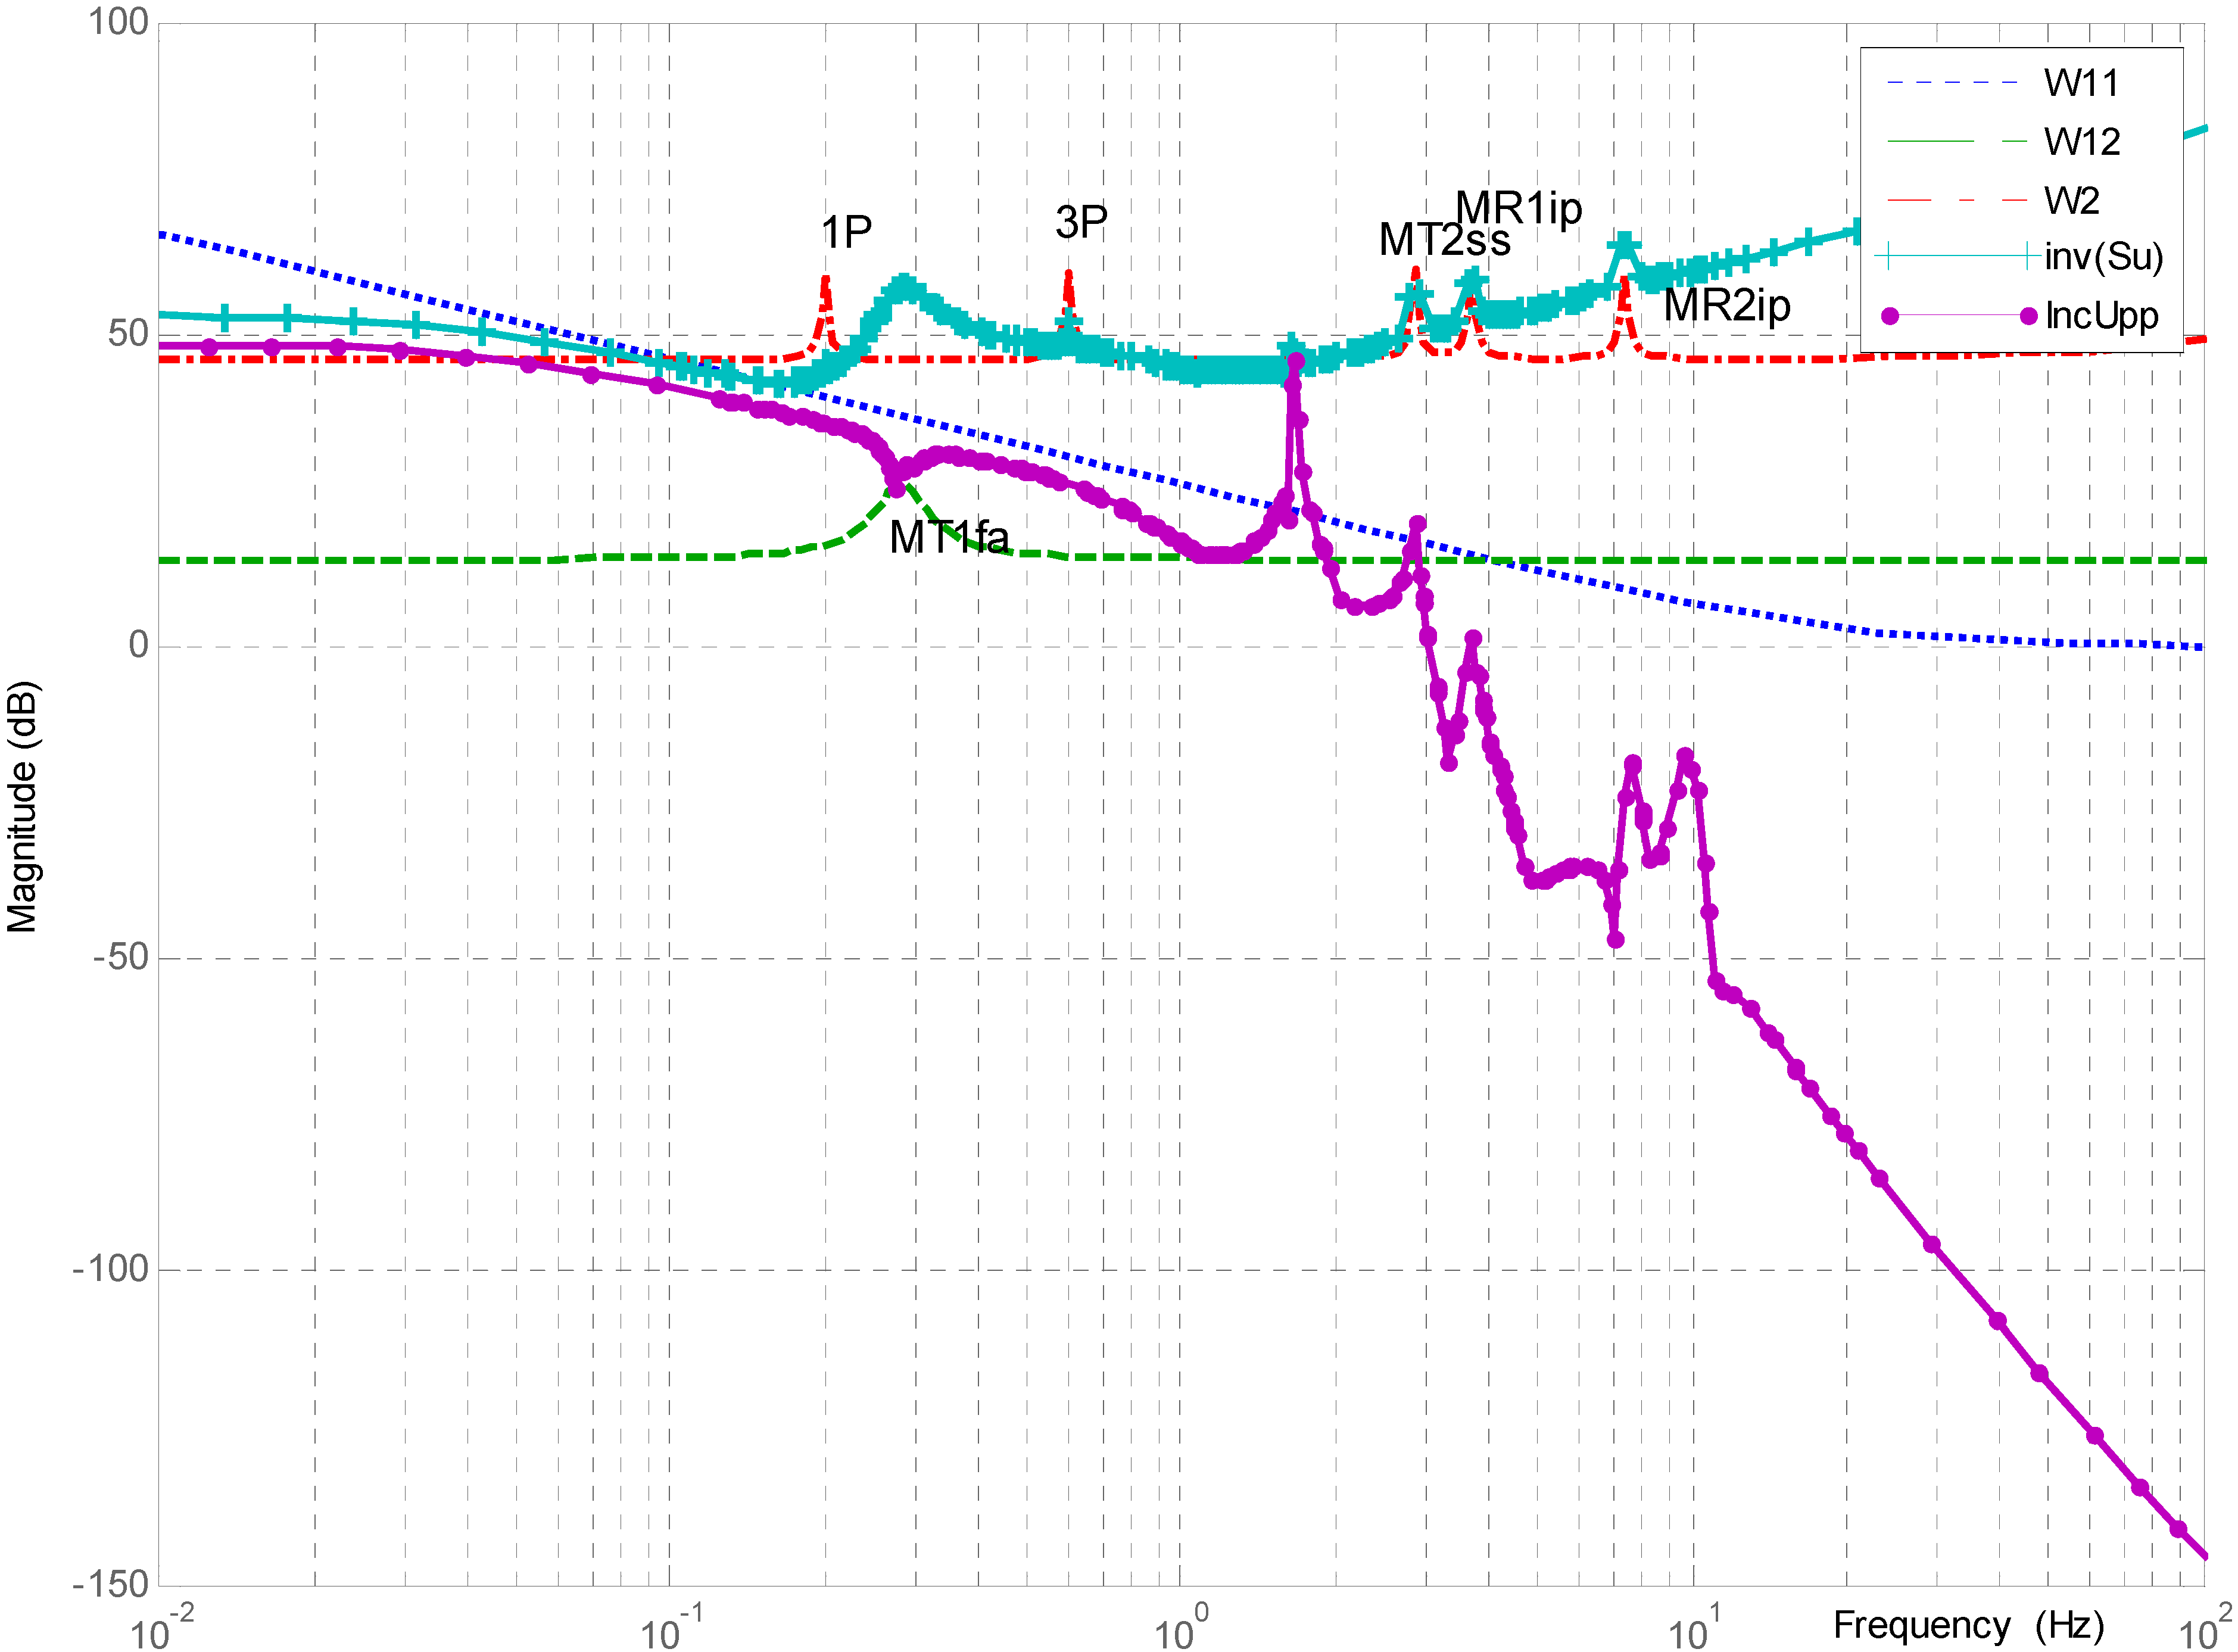
5.2. Generator Torque Controller (H∞ Torque Controller)
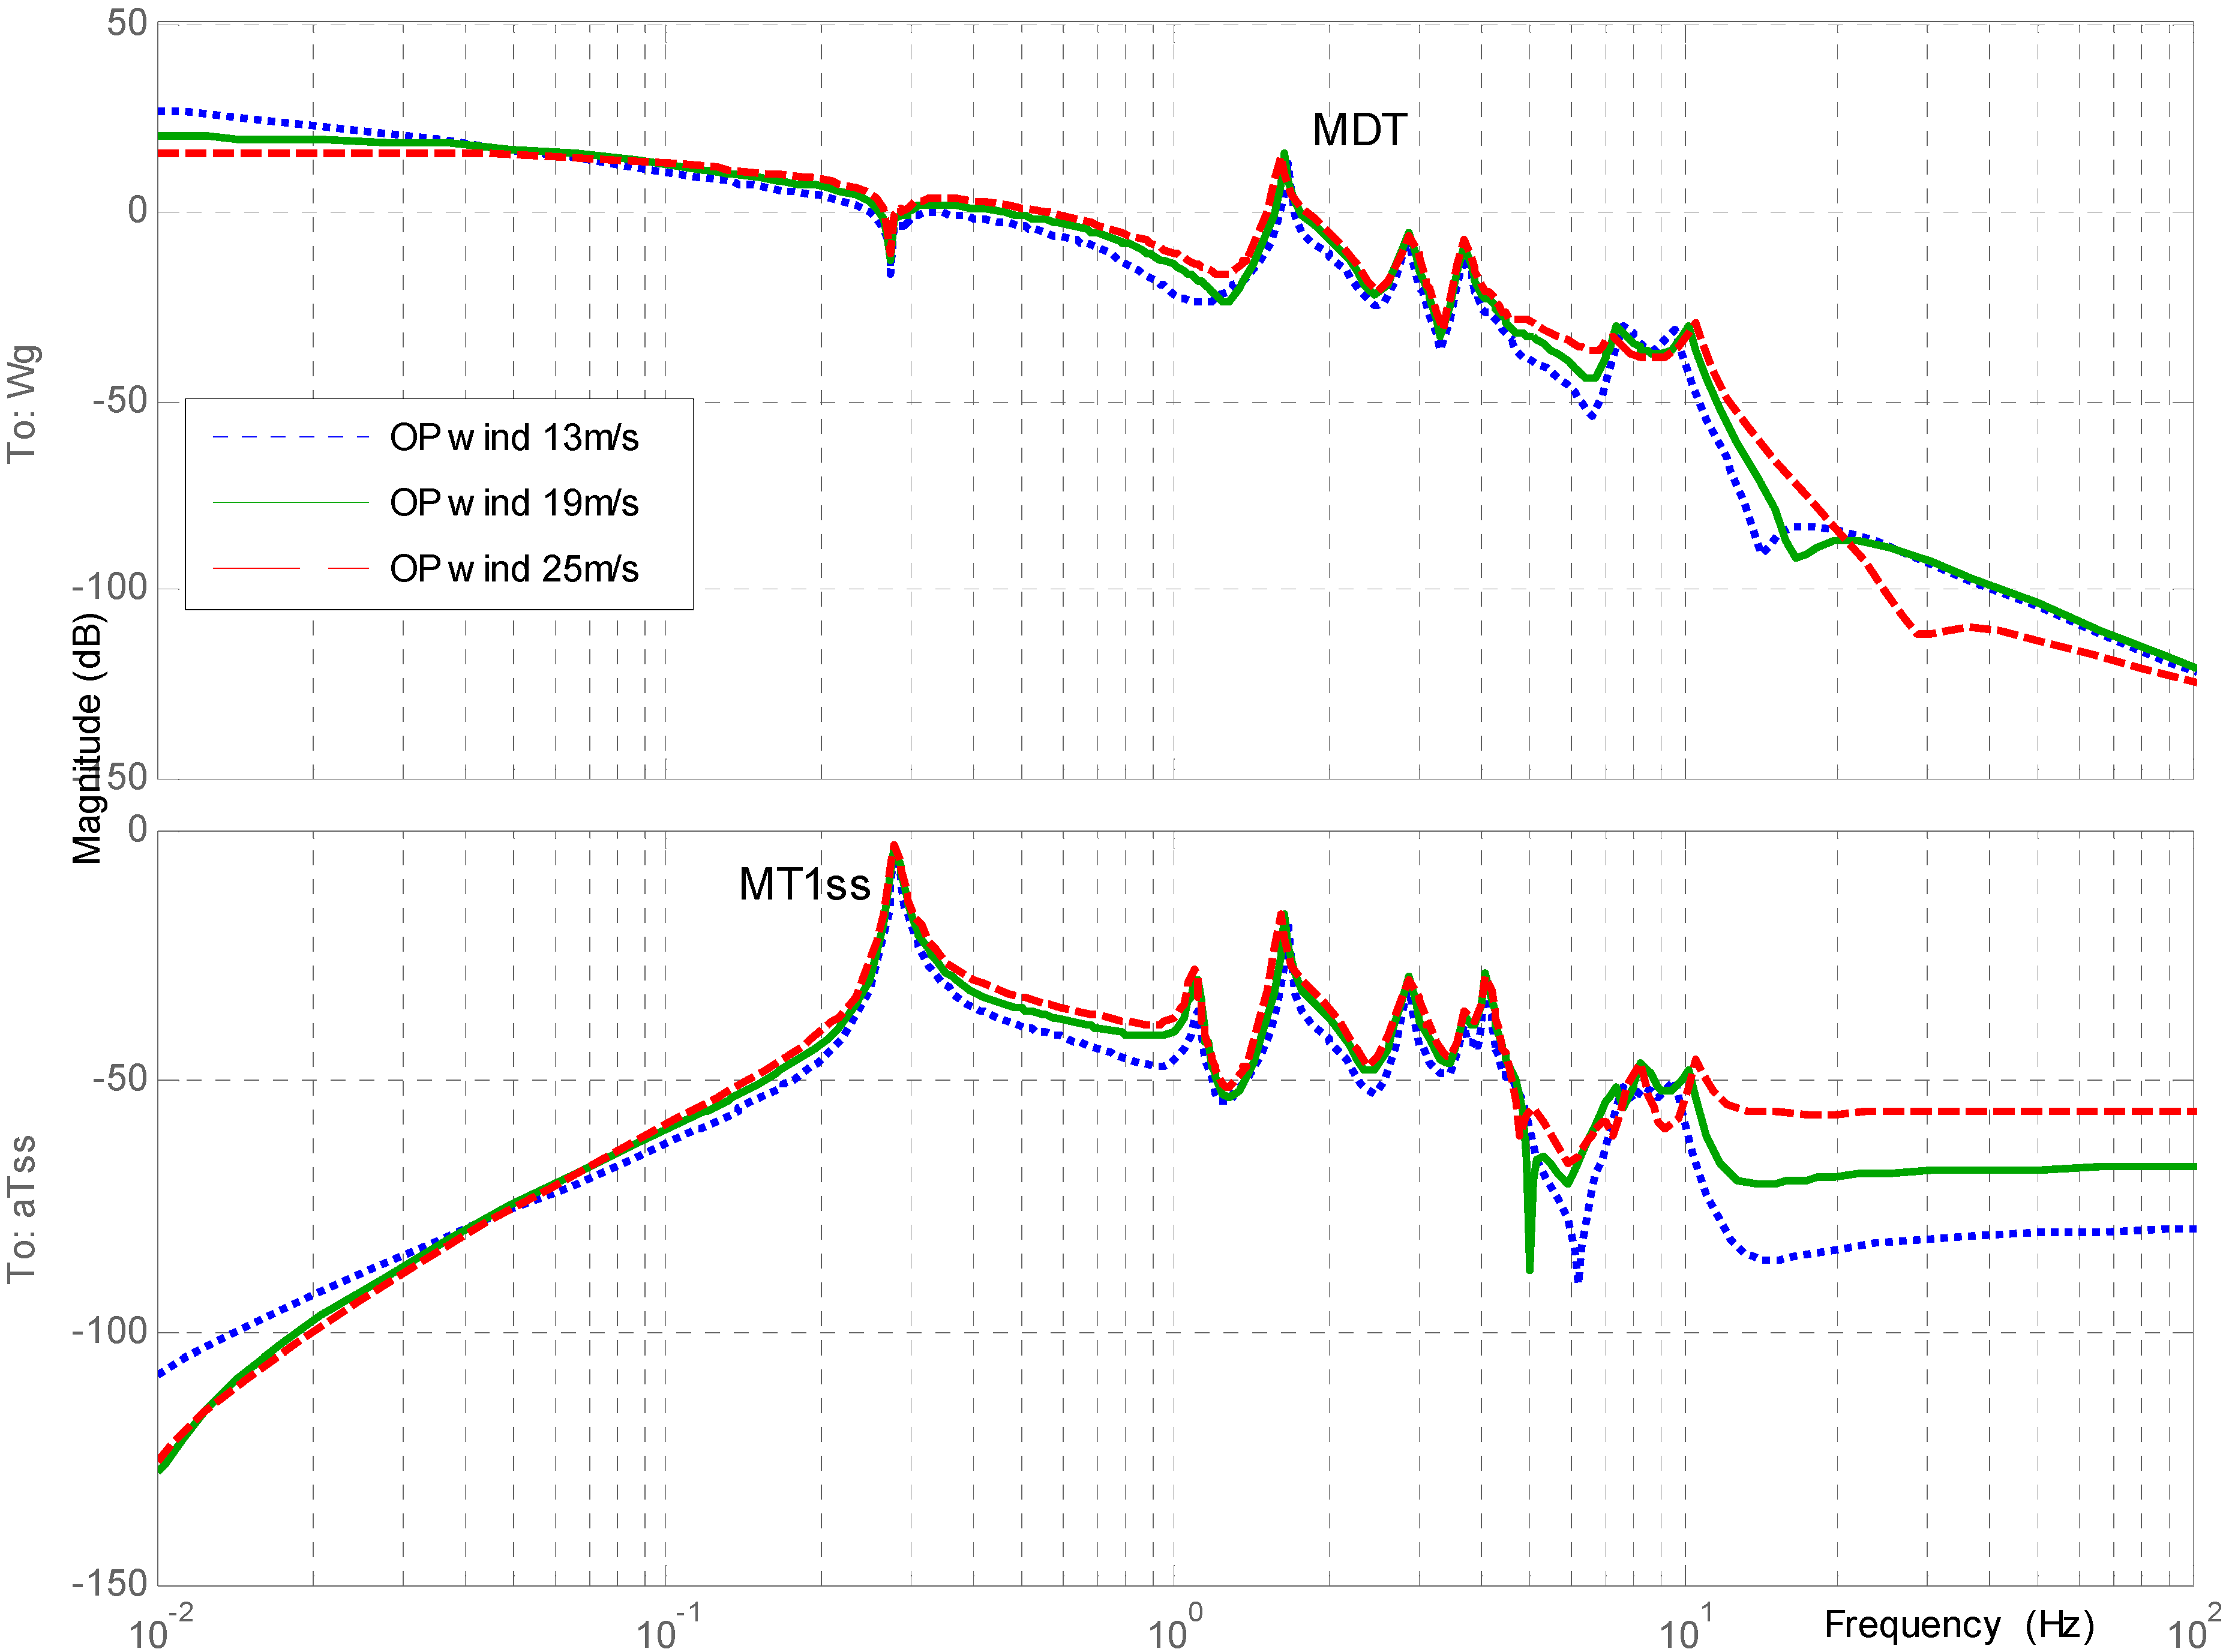
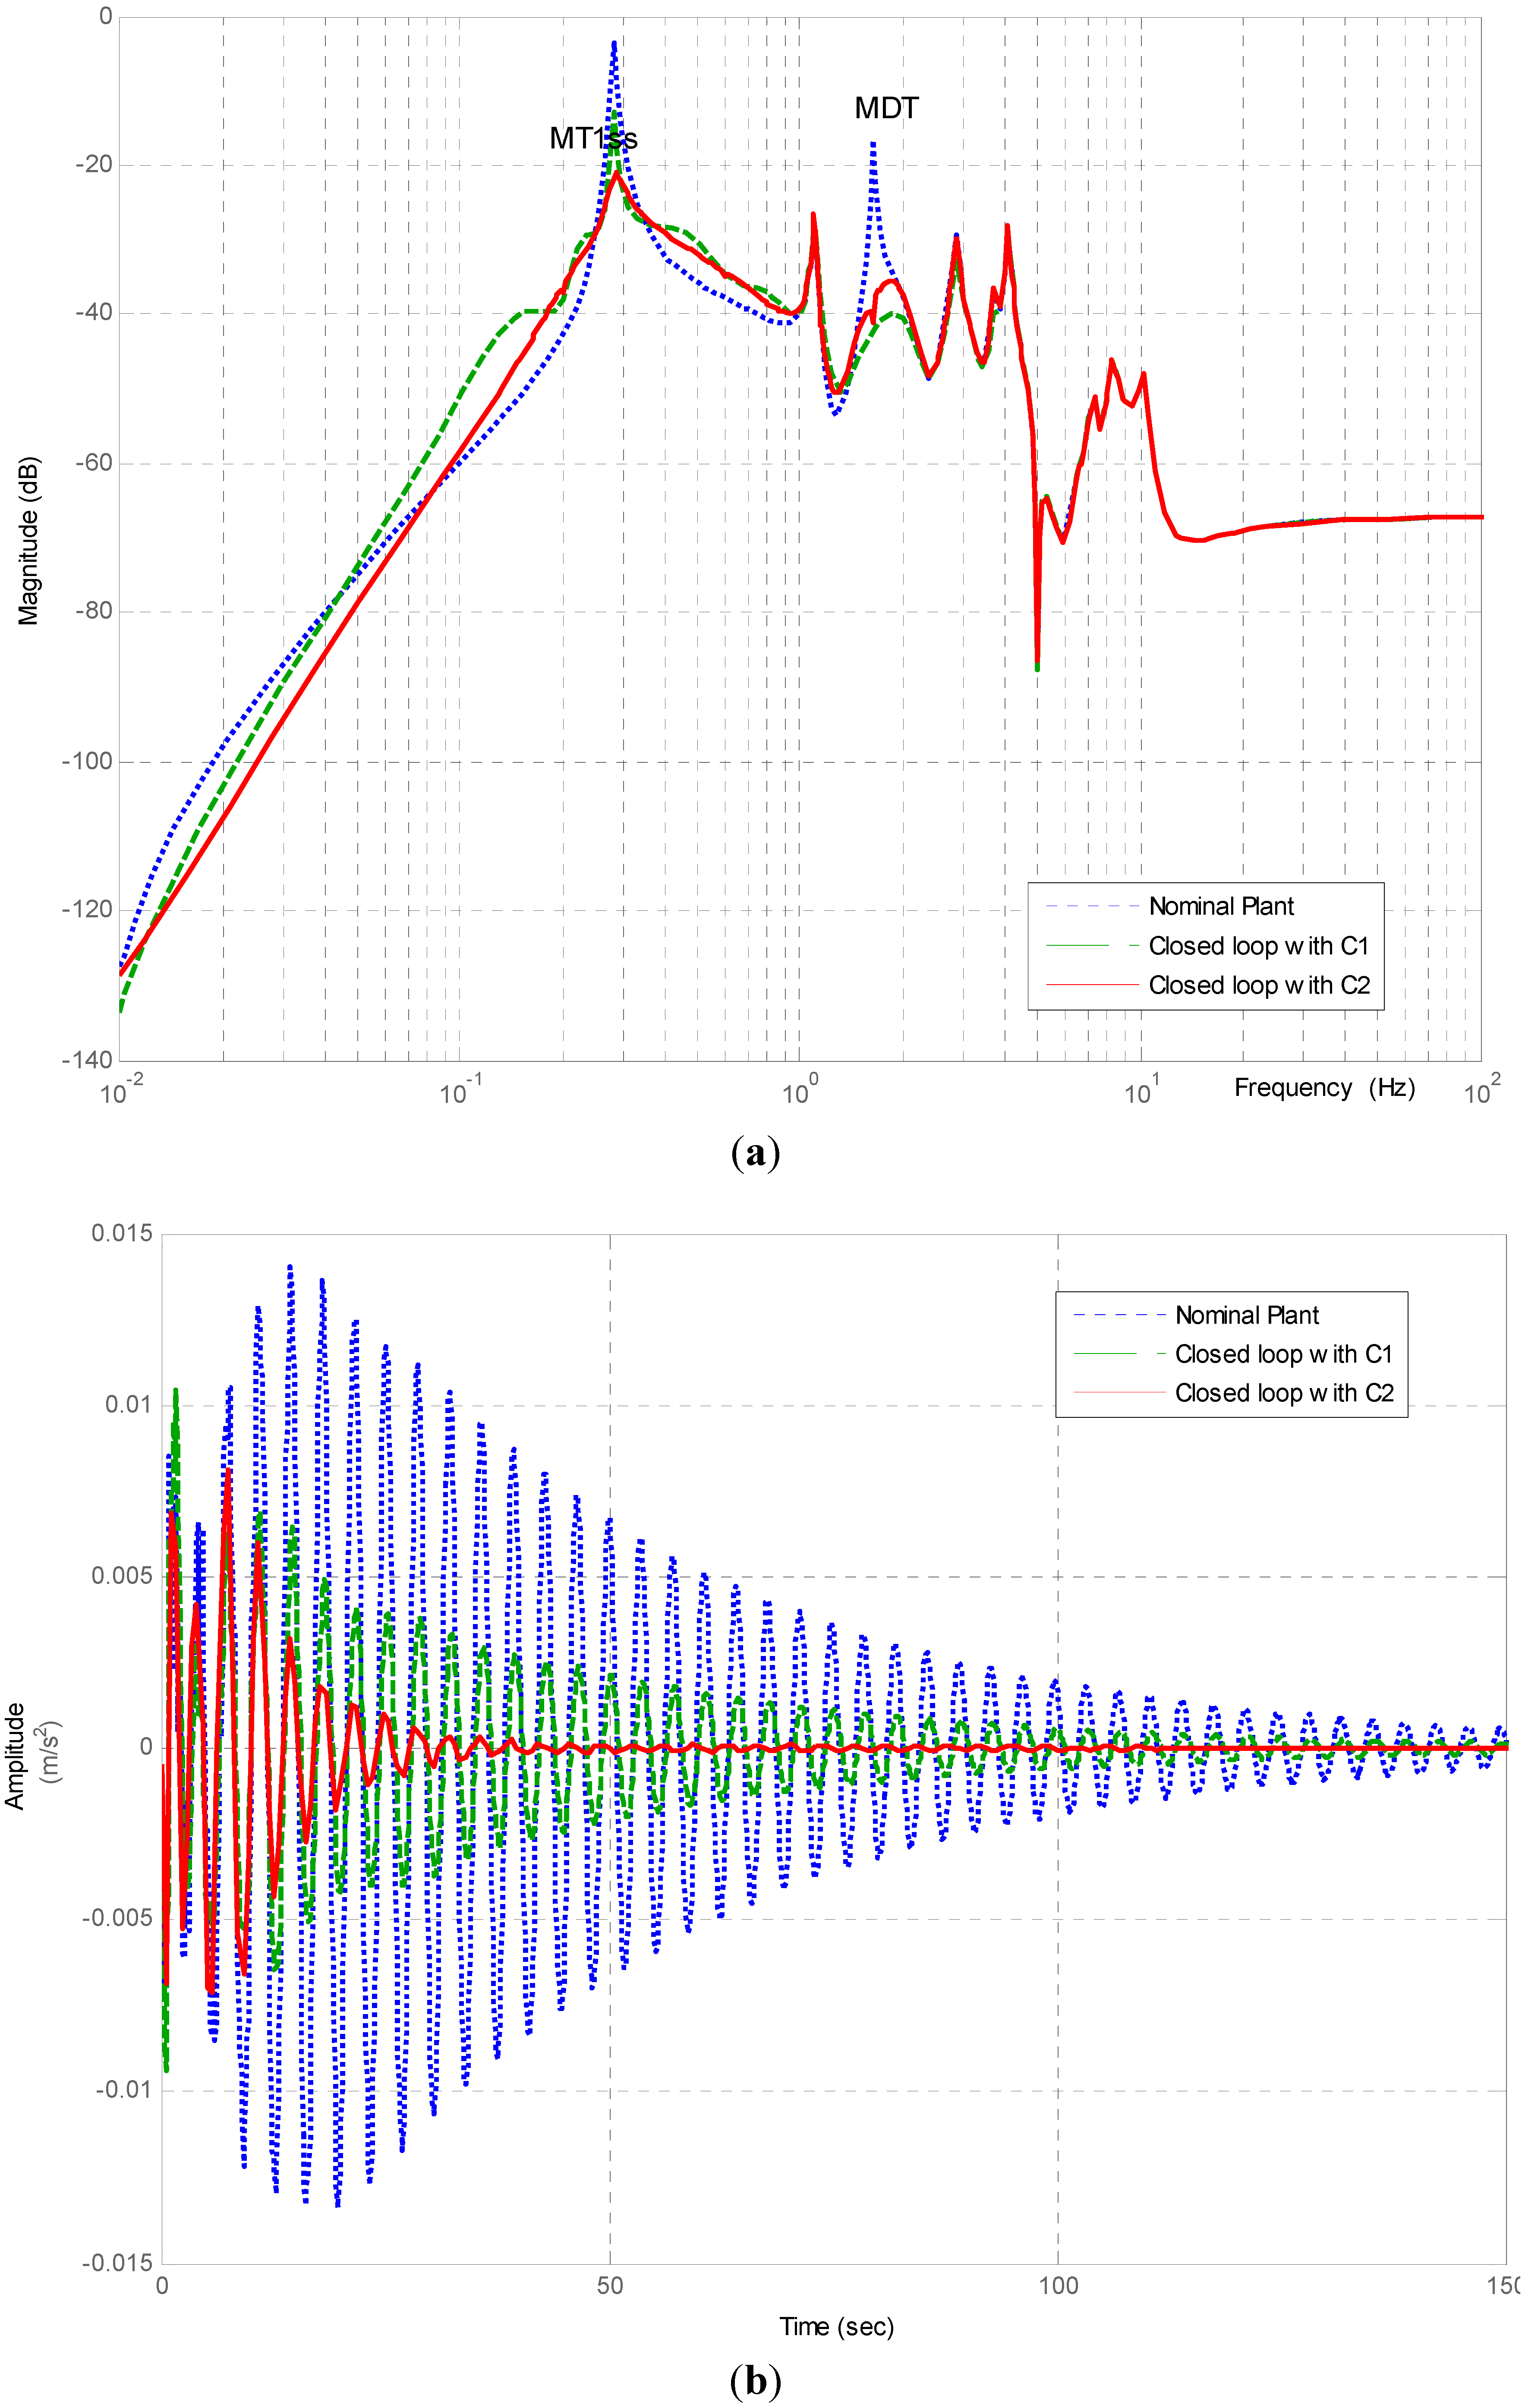
- To reduce the wind effect on the drive train mode MDT.
- To reduce the wind effect on the tower side-to-side mode MT1ss.


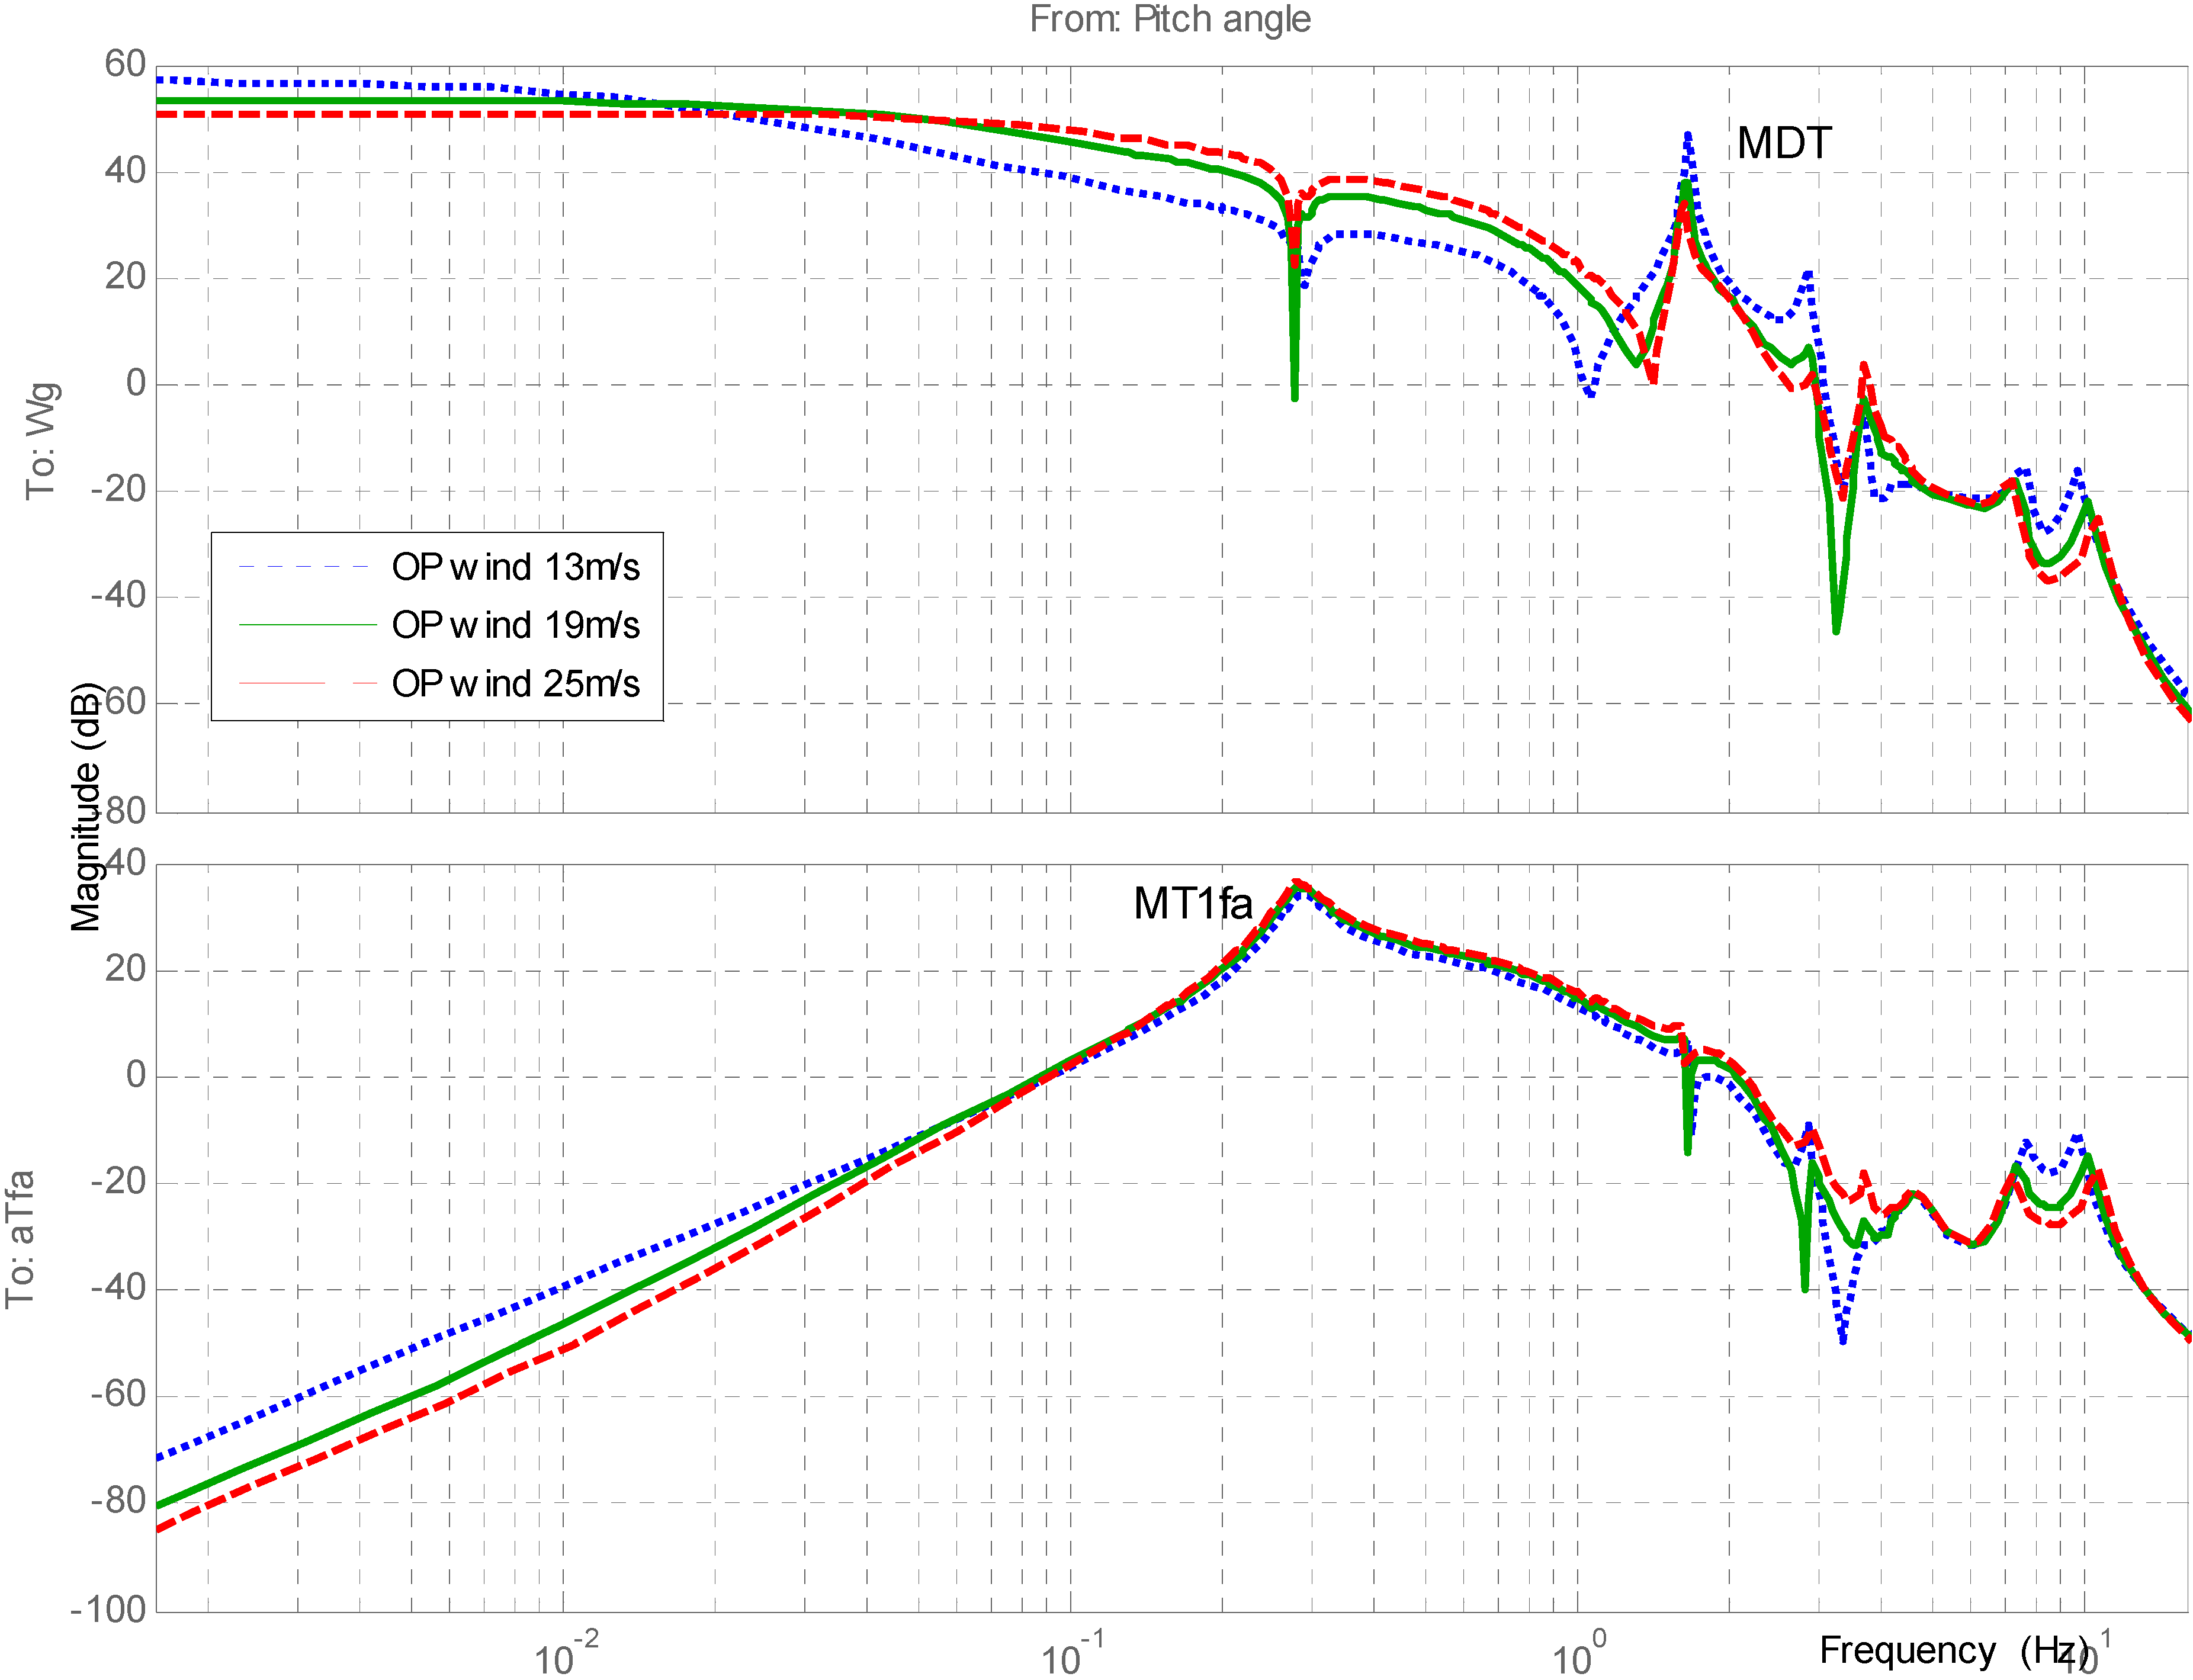
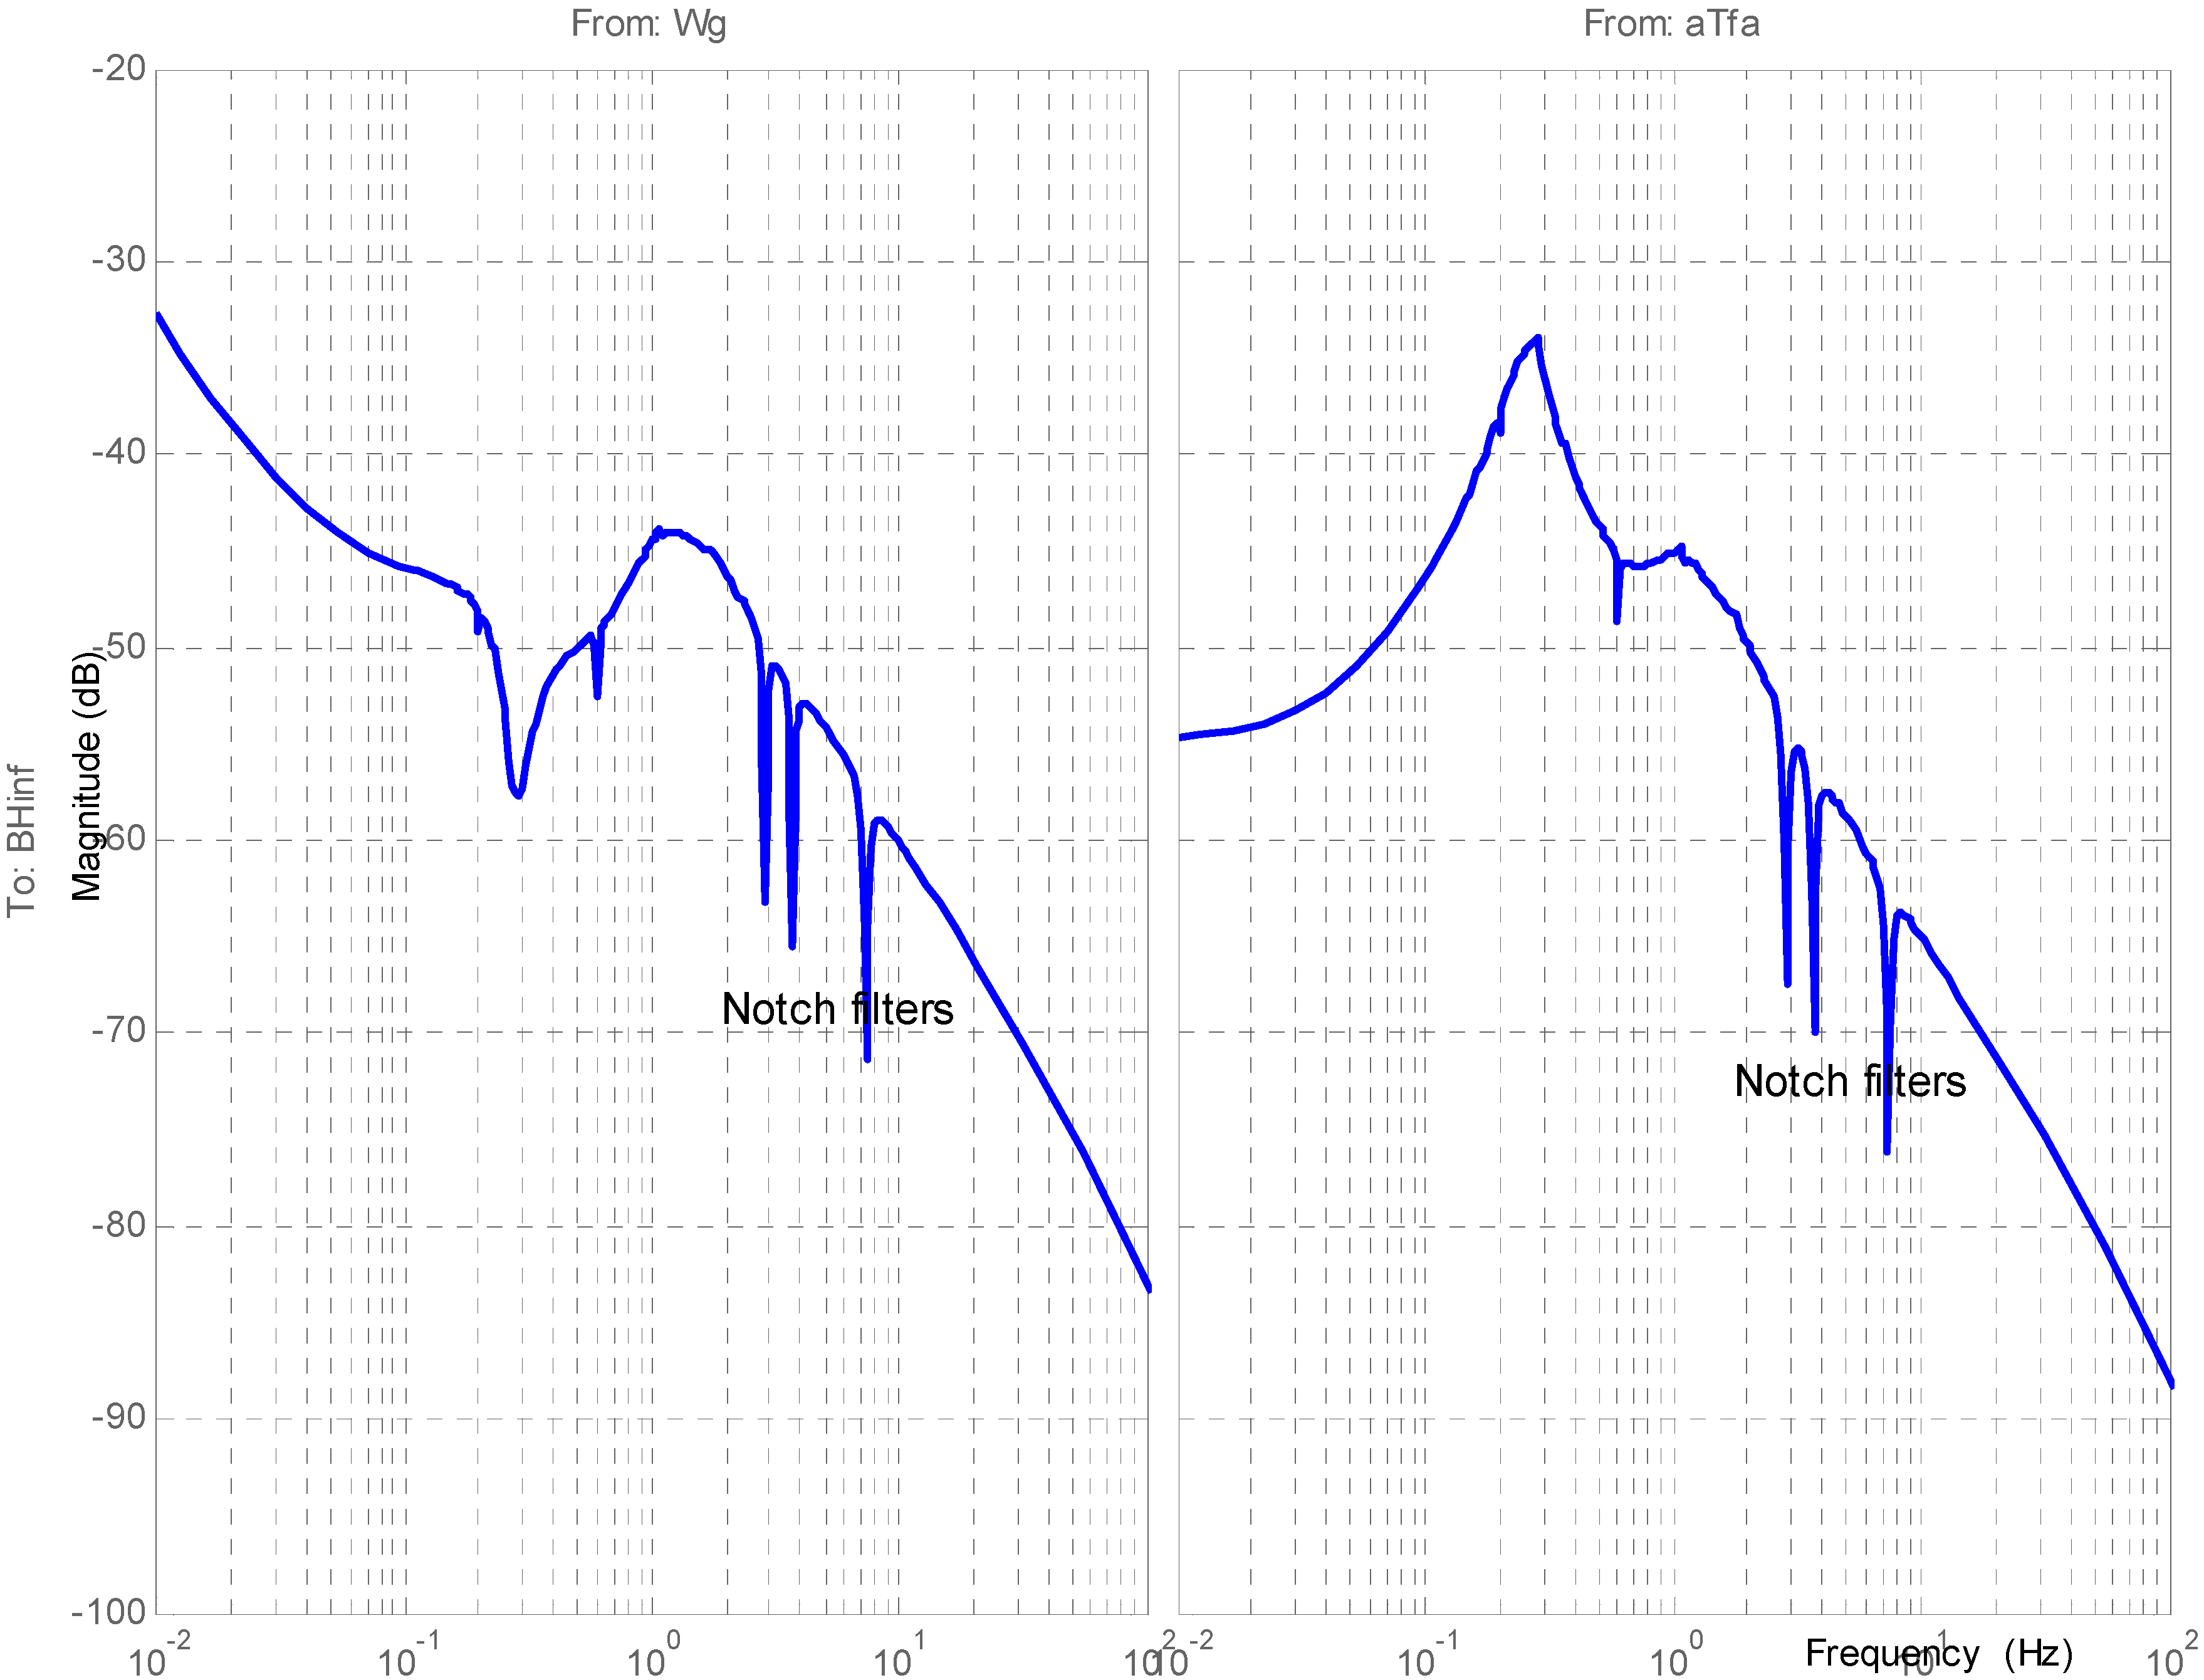
5.3. Collective Pitch Angle Controller (H∞ Pitch Controller)
- Generator speed control increasing the closed loop disturbance attenuation bandwidth.
- Reduction of the wind effect on the tower fore-aft mode.
- Inclusion of notch filters at particular frequencies in the controller dynamics to mitigate other excited frequencies (see Table 2) in the nominal plant.
| Mode | Freq. (Hz) |
|---|---|
| 1P | 0.20 |
| 3P | 0.60 |
| MT2ss | 2.86 |
| MR1ip | 3.69 |
| MR2ip | 7.36 |


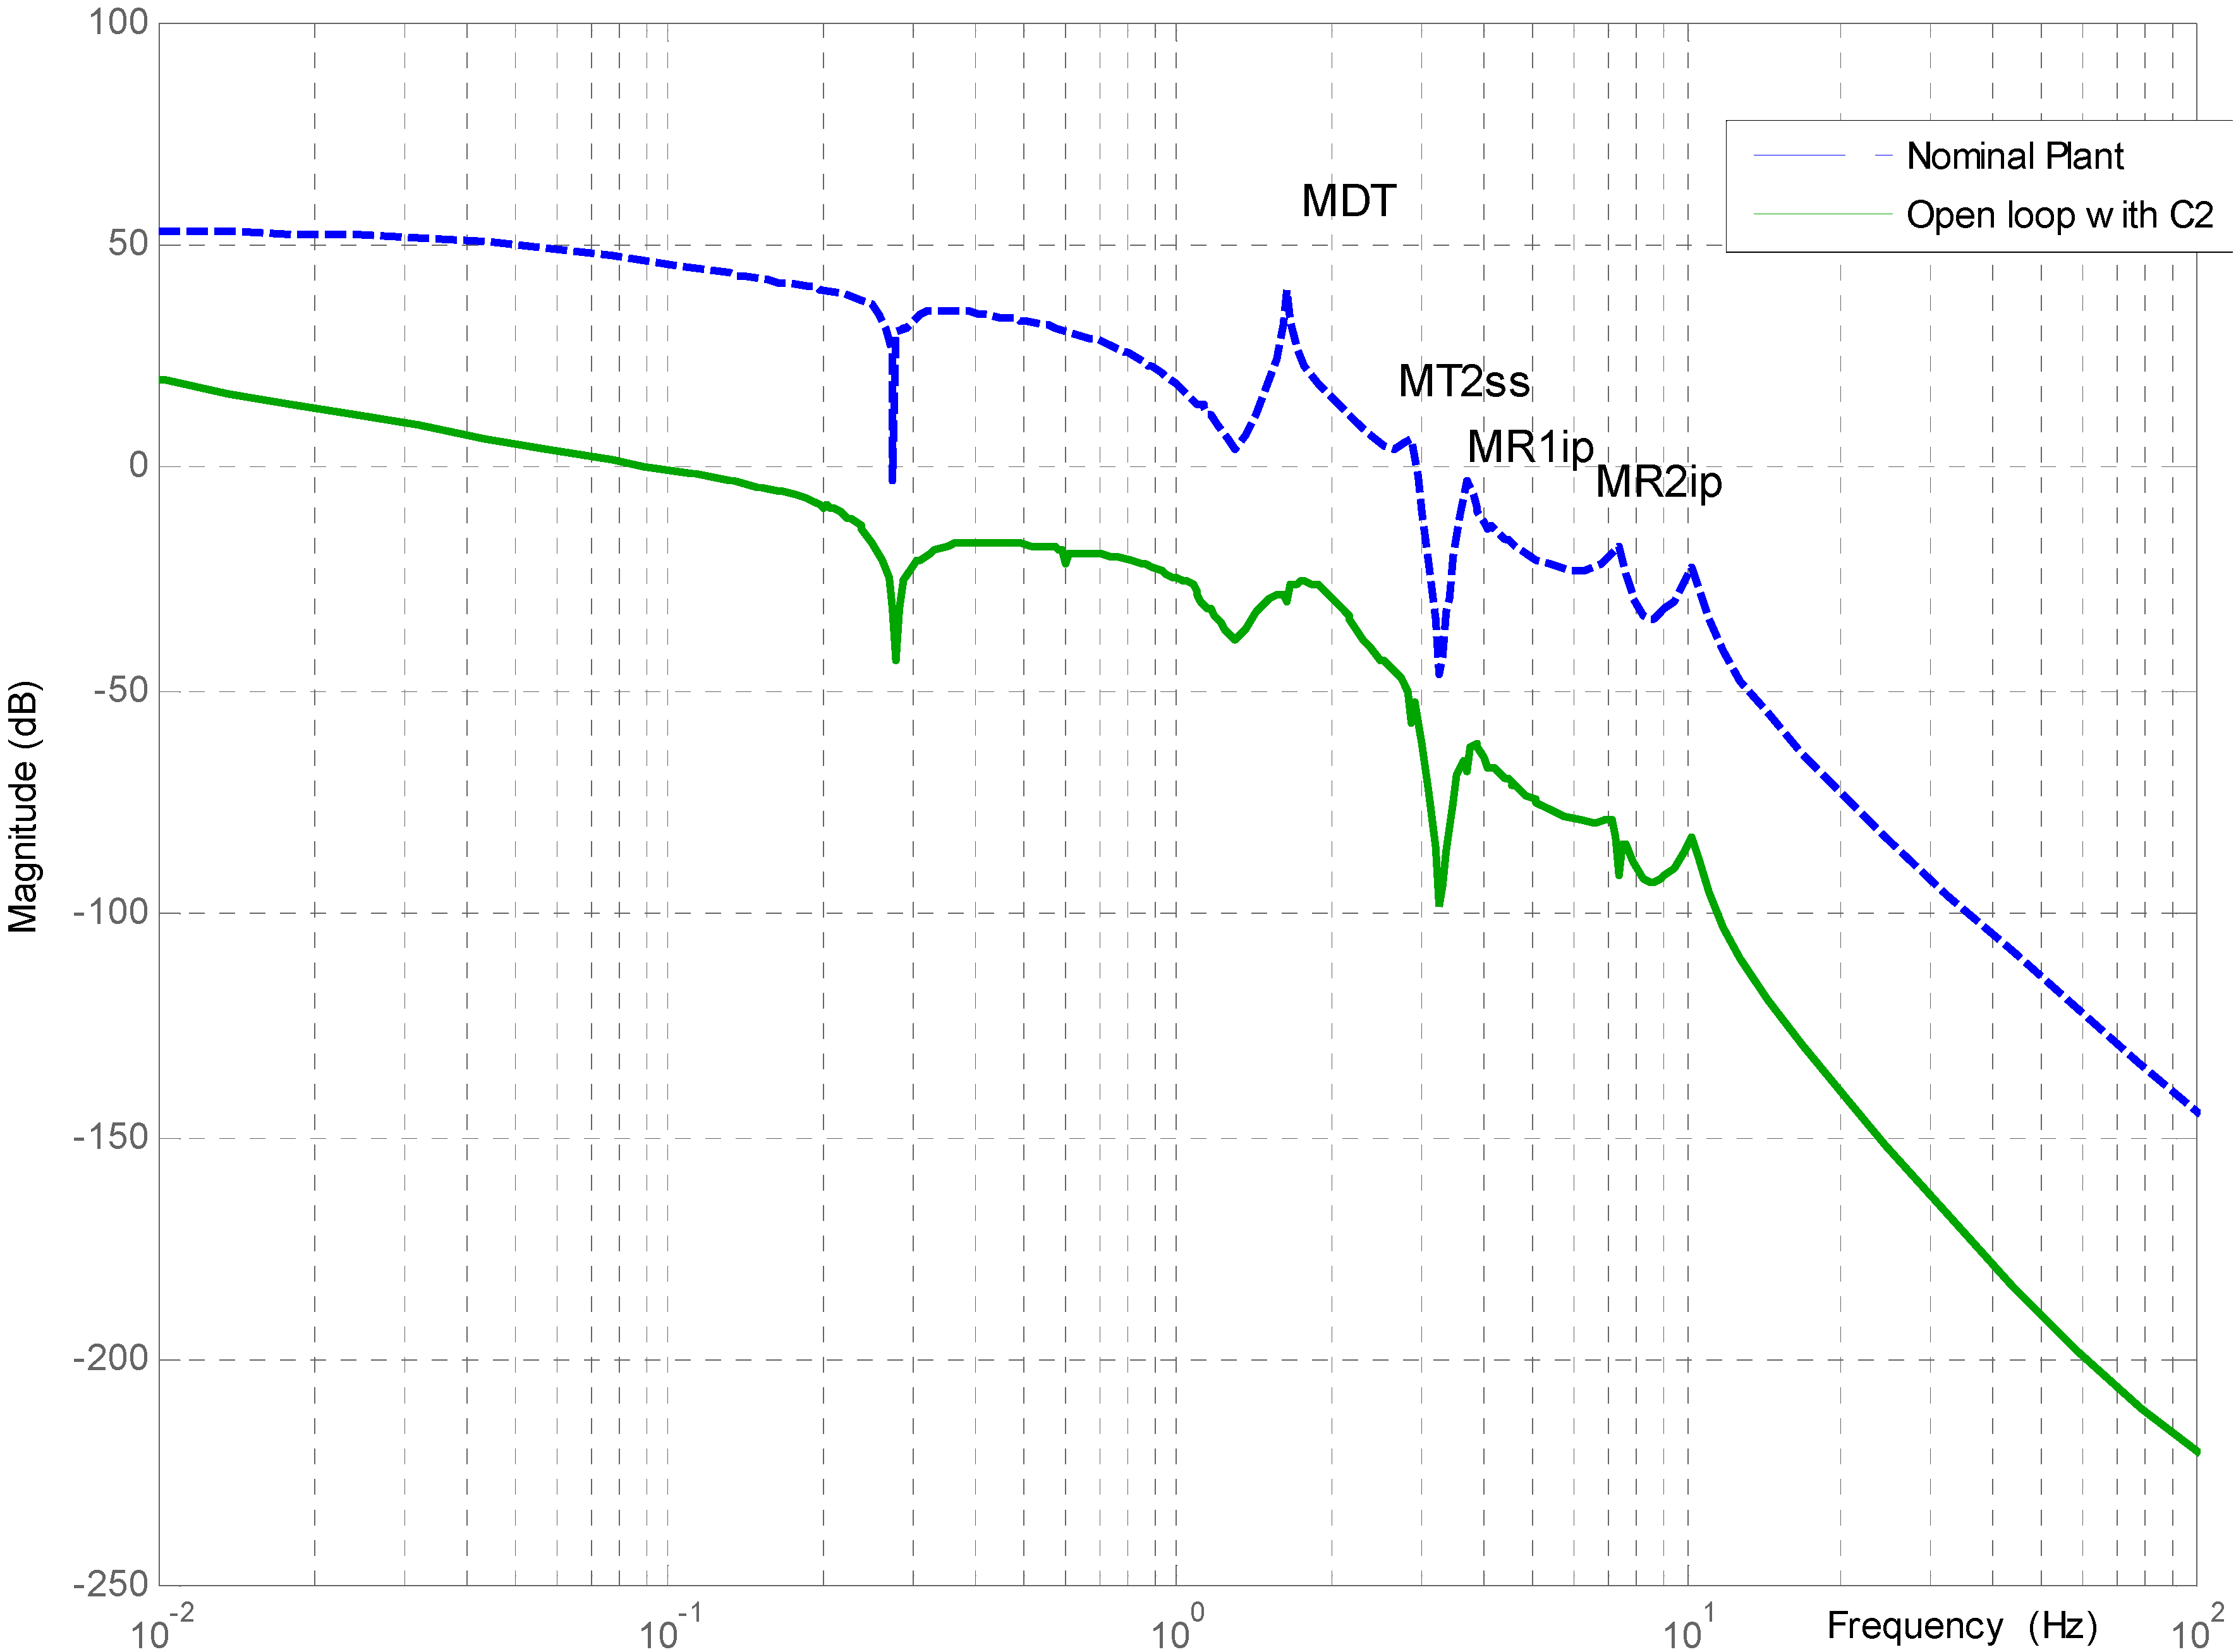
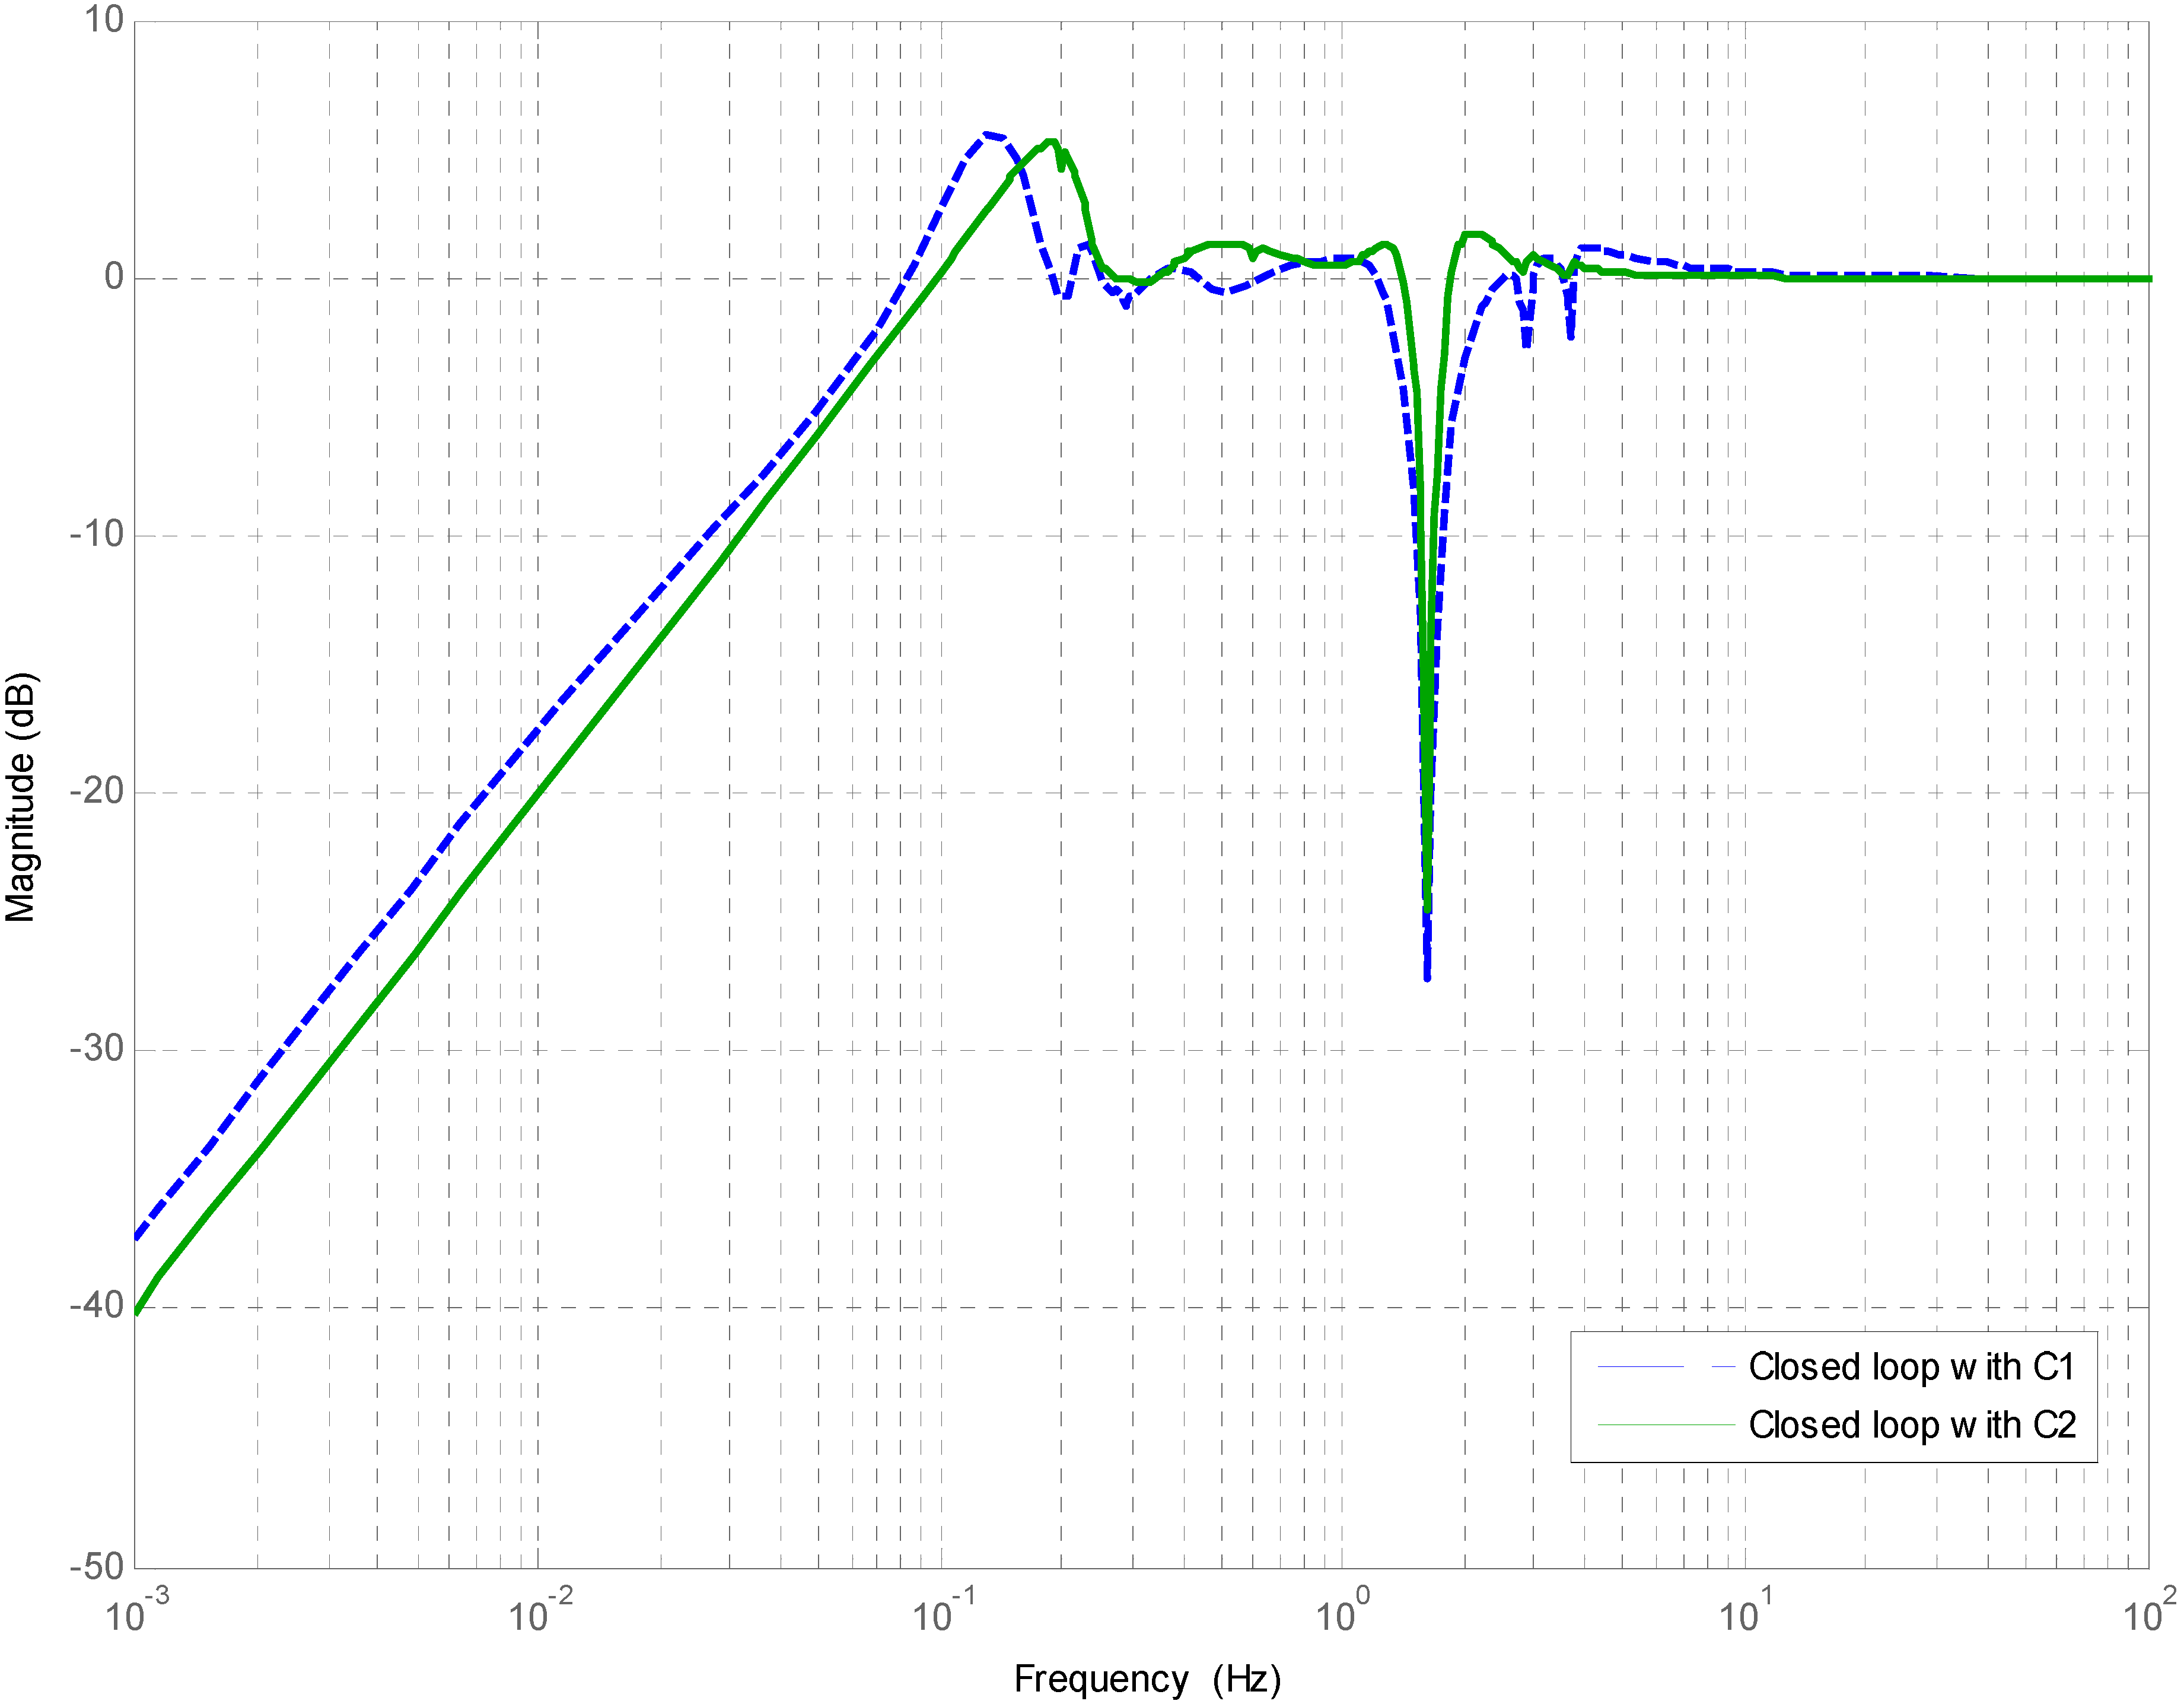
5.4. Analysis of the H∞ Control Strategy
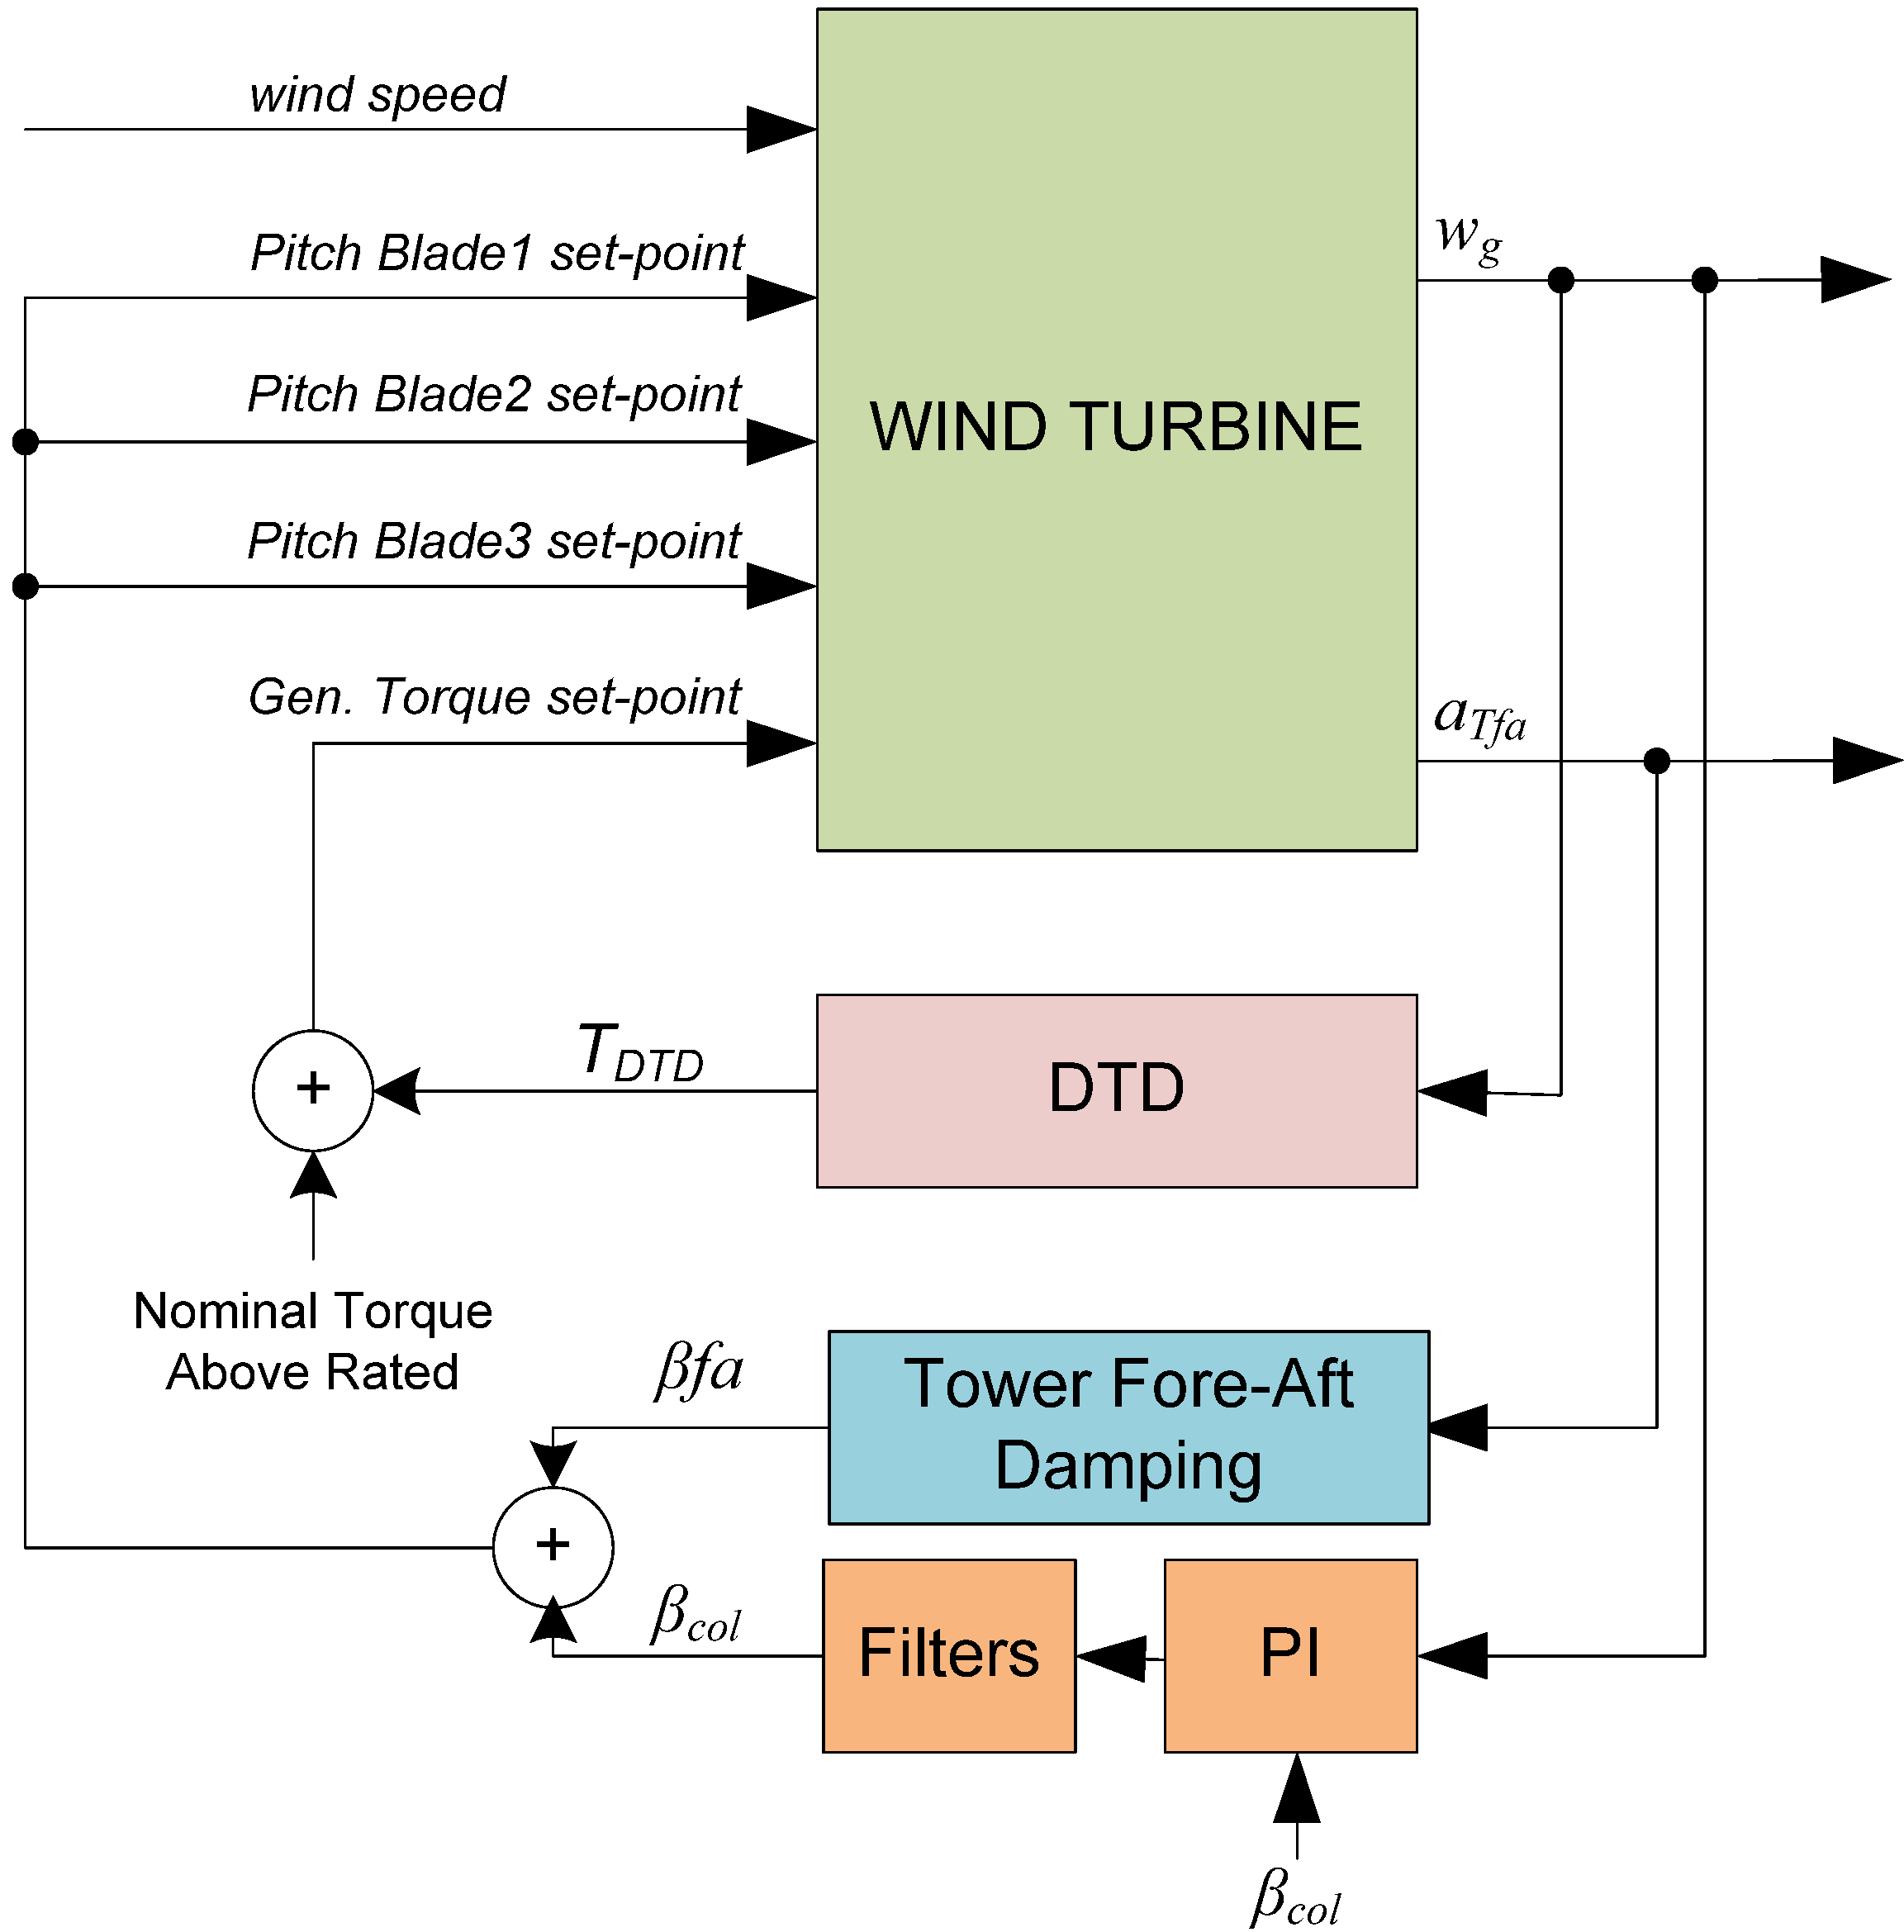
- C1: Baseline control strategy with drive train damping filter and tower fore-aft damping filter activated (see Figure 3).
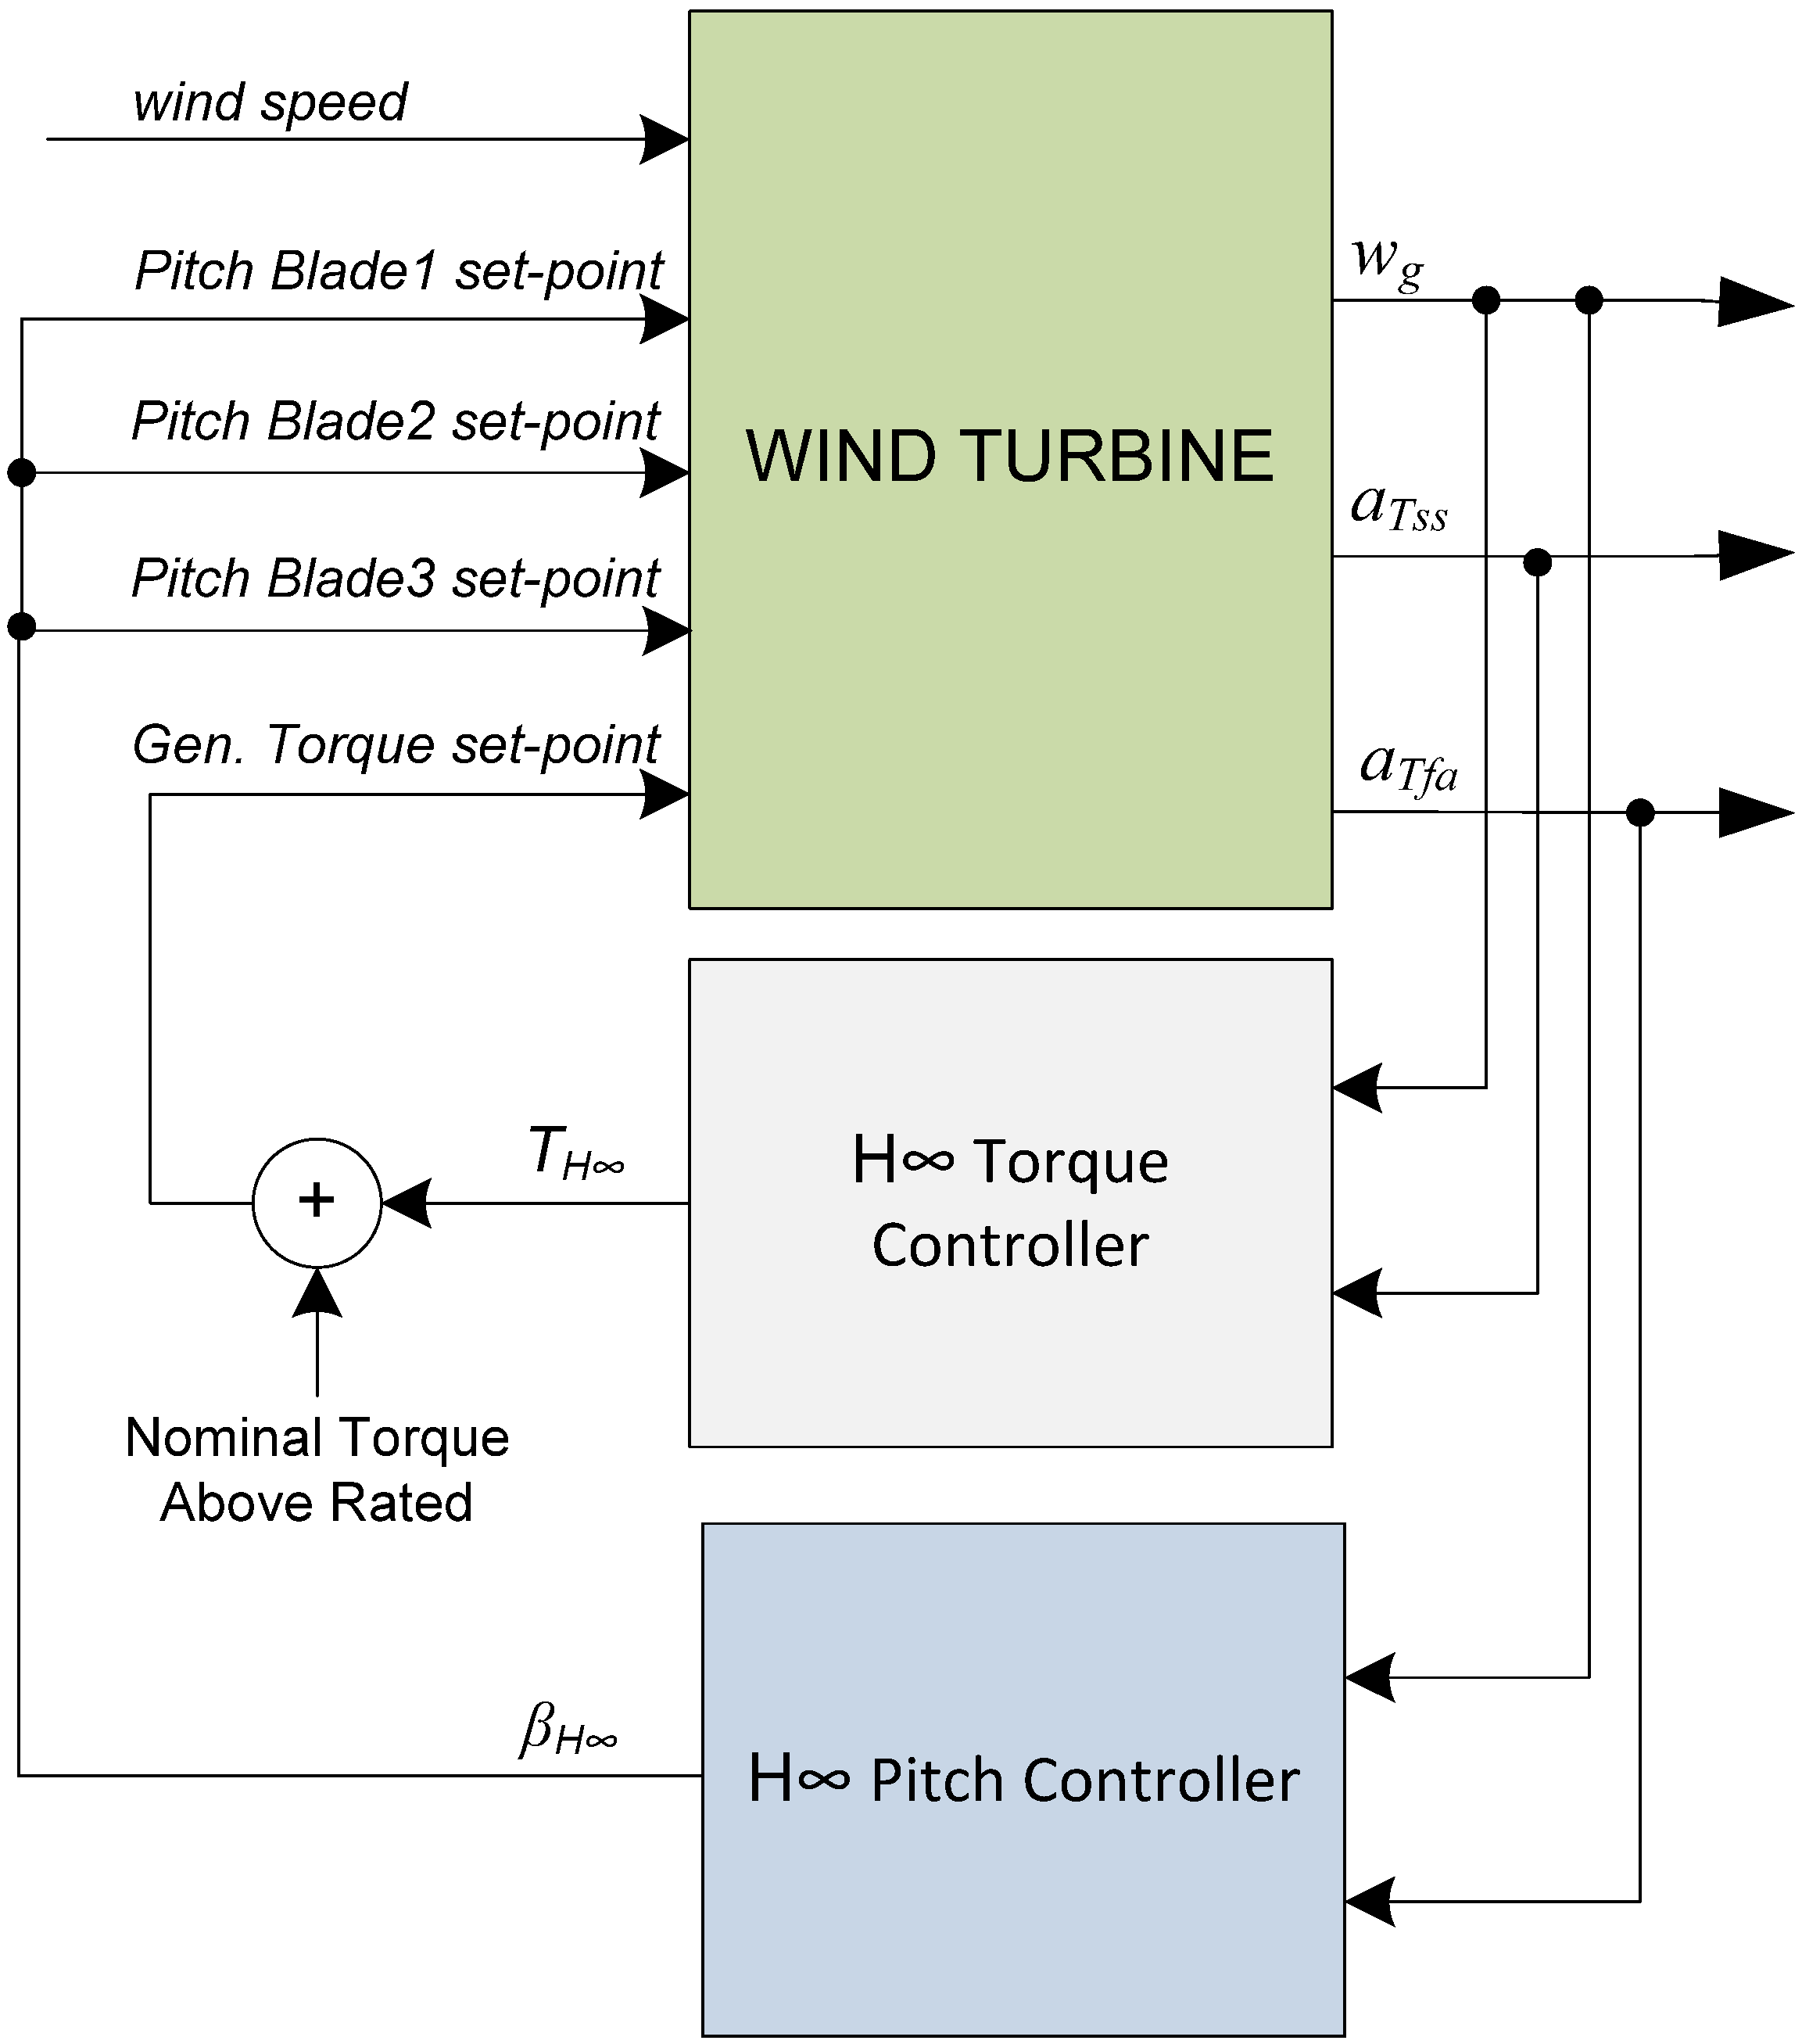
- C2: Proposed control strategy with two H∞ MISO controllers.
| OP (m/s) | C1 | C2 | ||
|---|---|---|---|---|
| DABW (Hz) | DAP (dB) | DABW (Hz) | DAP (dB) | |
| 13 | 0.037 | 6.06 | 0.035 | 3.35 |
| 15 | 0.045 | 6.06 | 0.044 | 3.59 |
| 17 | 0.052 | 6.09 | 0.057 | 4.31 |
| 19 | 0.058 | 6.31 | 0.070 | 5.29 |
| 21 | 0.061 | 6.00 | 0.078 | 5.78 |
| 23 | 0.065 | 6.05 | 0.089 | 6.70 |
| 25 | 0.069 | 6.04 | 0.10 | 7.84 |


6. Results in GH Bladed
6.1. External Controller in GH Bladed
- C2.1: The accelerometer to measure the tower top side-to-side acceleration is disabled. This is done to compare C1 and C2 control strategies without tower side-to-side damping.
- C2.2: The tower top side-to-side accelerometer is activated and C2 control strategy works without sensor signals restrictions (see Figure 4).
- To initialize the controller state-space matrices A, B, C, and D from a static library and initialize the actual state vector X(k).
- To update the present vector of controller inputs e(k) reading the wind turbine measurements from the sensors.
- To calculate the vector of present controller outputs u(k) using matrices C, D and the current vectors of controller inputs e(k) and states X(k).
- To calculate the vector of the next sample time controller states X(k) using matrices A and B and the actual vectors of controller inputs e(k)and states X(k). In the next sample time this vector of controller states will be the current vector of controller states.

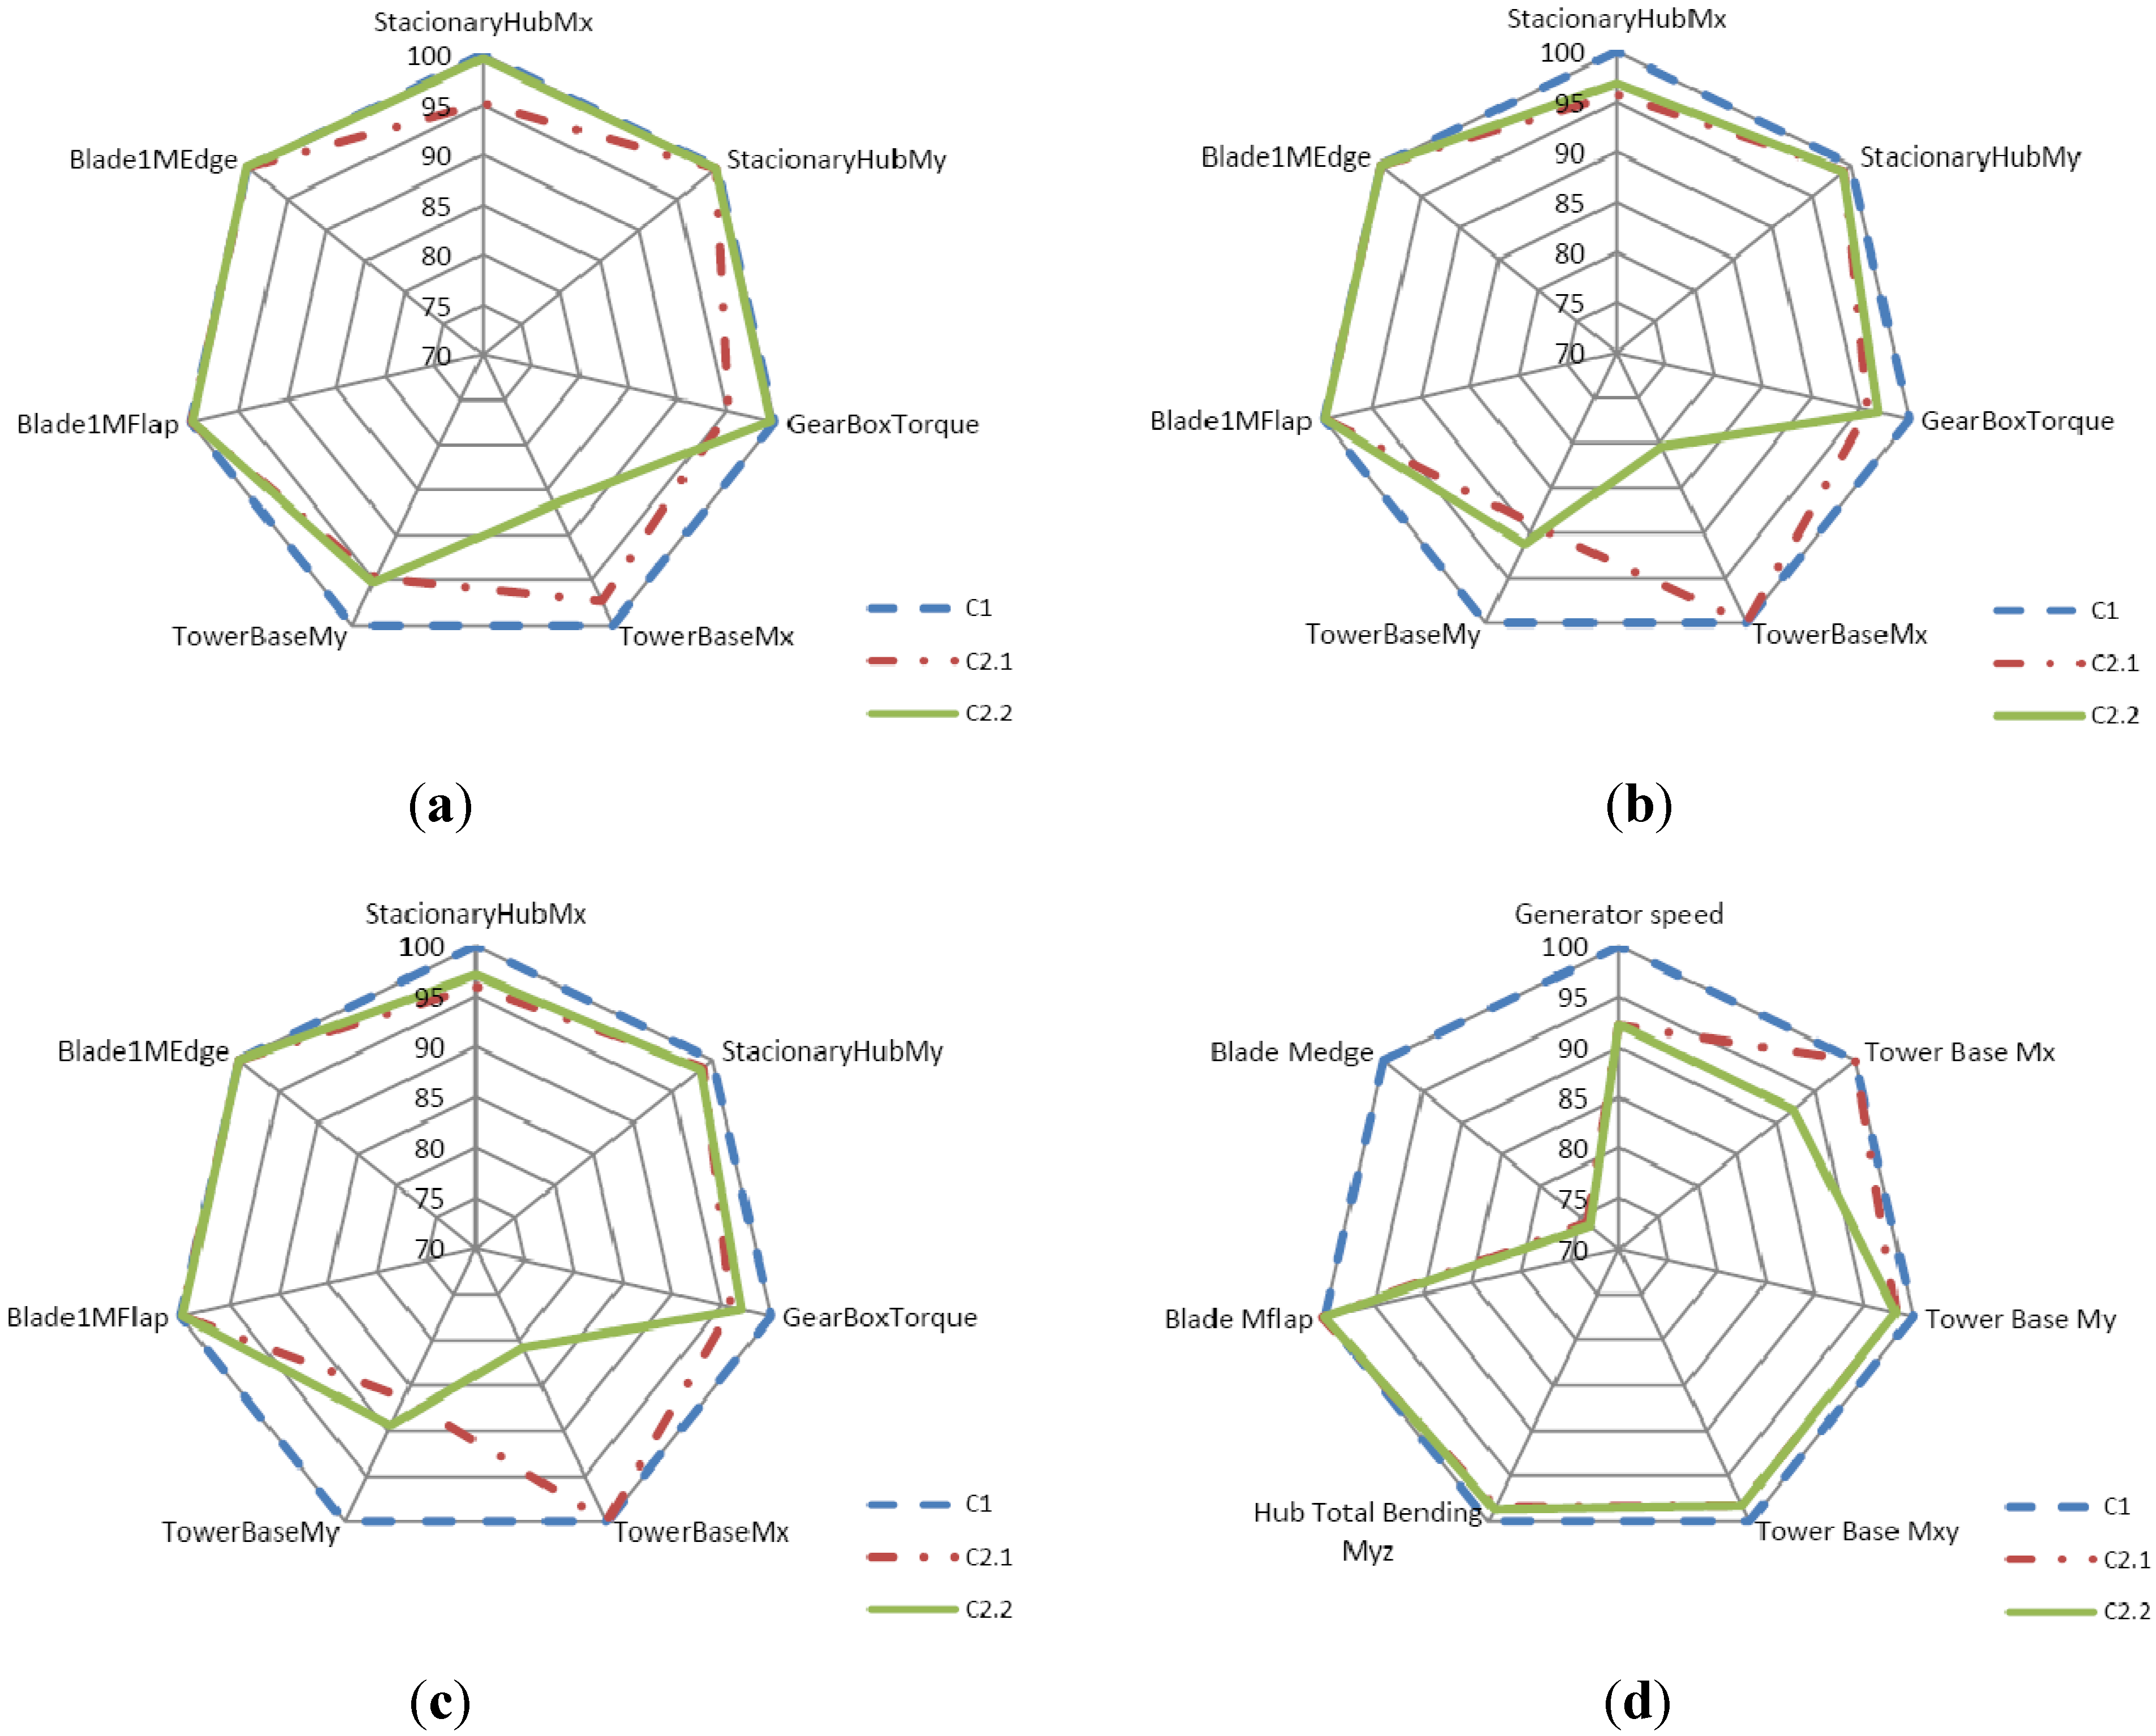
6.2. Fatigue Analysis (DLC1.2 in IEC61400-1 Second Edition)
- To carry out time domain simulations using the non-linear wind turbine model and the designed controller. Twelve simulations of 600 s have been carried out using odd production winds from mean speeds from 3 m/s to 25 m/s.
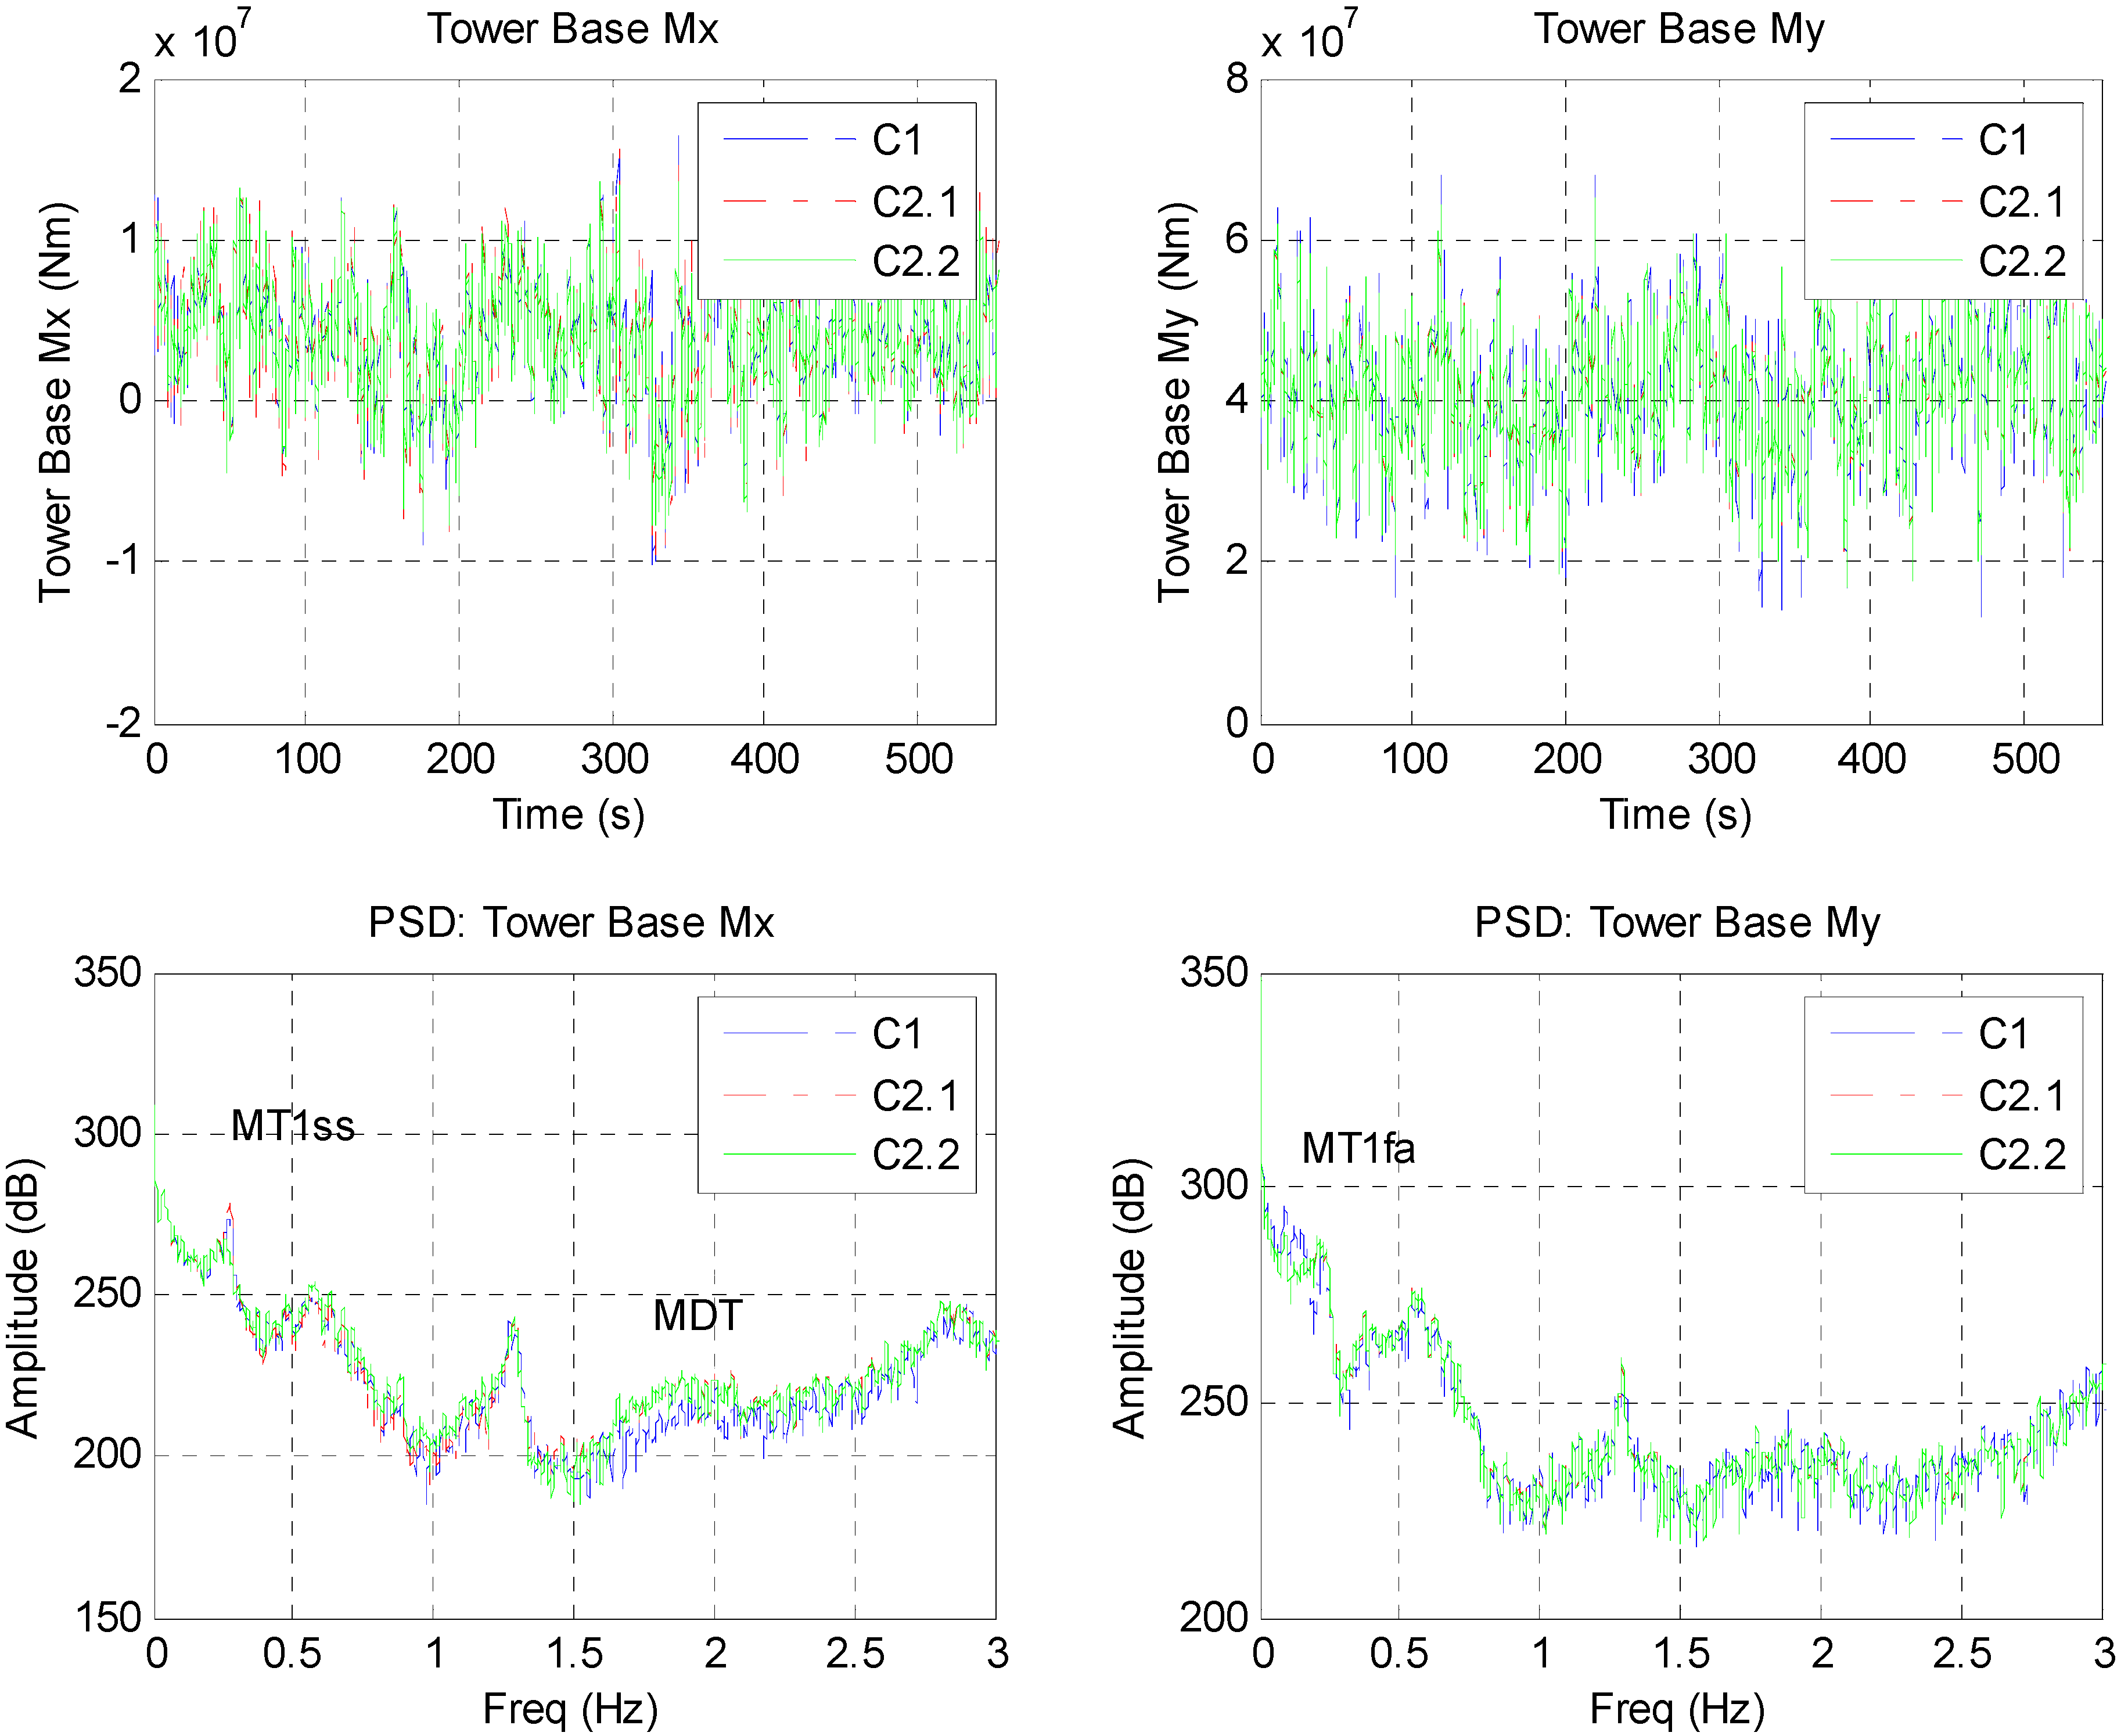
- To subject some signals of loads in time simulations (stationary hub Mx, stationary hub My, tower base Mx, tower base My, blade MFlap and blade MEdge) to the rain flow counting algorithm (one for each measured variable) using the toolbox in MATLAB [25] to carry out this analysis.
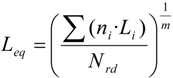
- To obtain the load equivalent Leq (14) for each kind of material and for each simulated wind. The material is defined by the m value. m is the slope of the SN curve of the material, where S is the fatigue strength and N the number of cycles to failure. Ni, the number of cycles, and Li, the cycles amplitudes, are extracted from the rainflow counting and Nrd is the number of points of the time domain simulation. For glass fibre m = 10, for cast modular iron m = 7 and for welded steel m = 3:
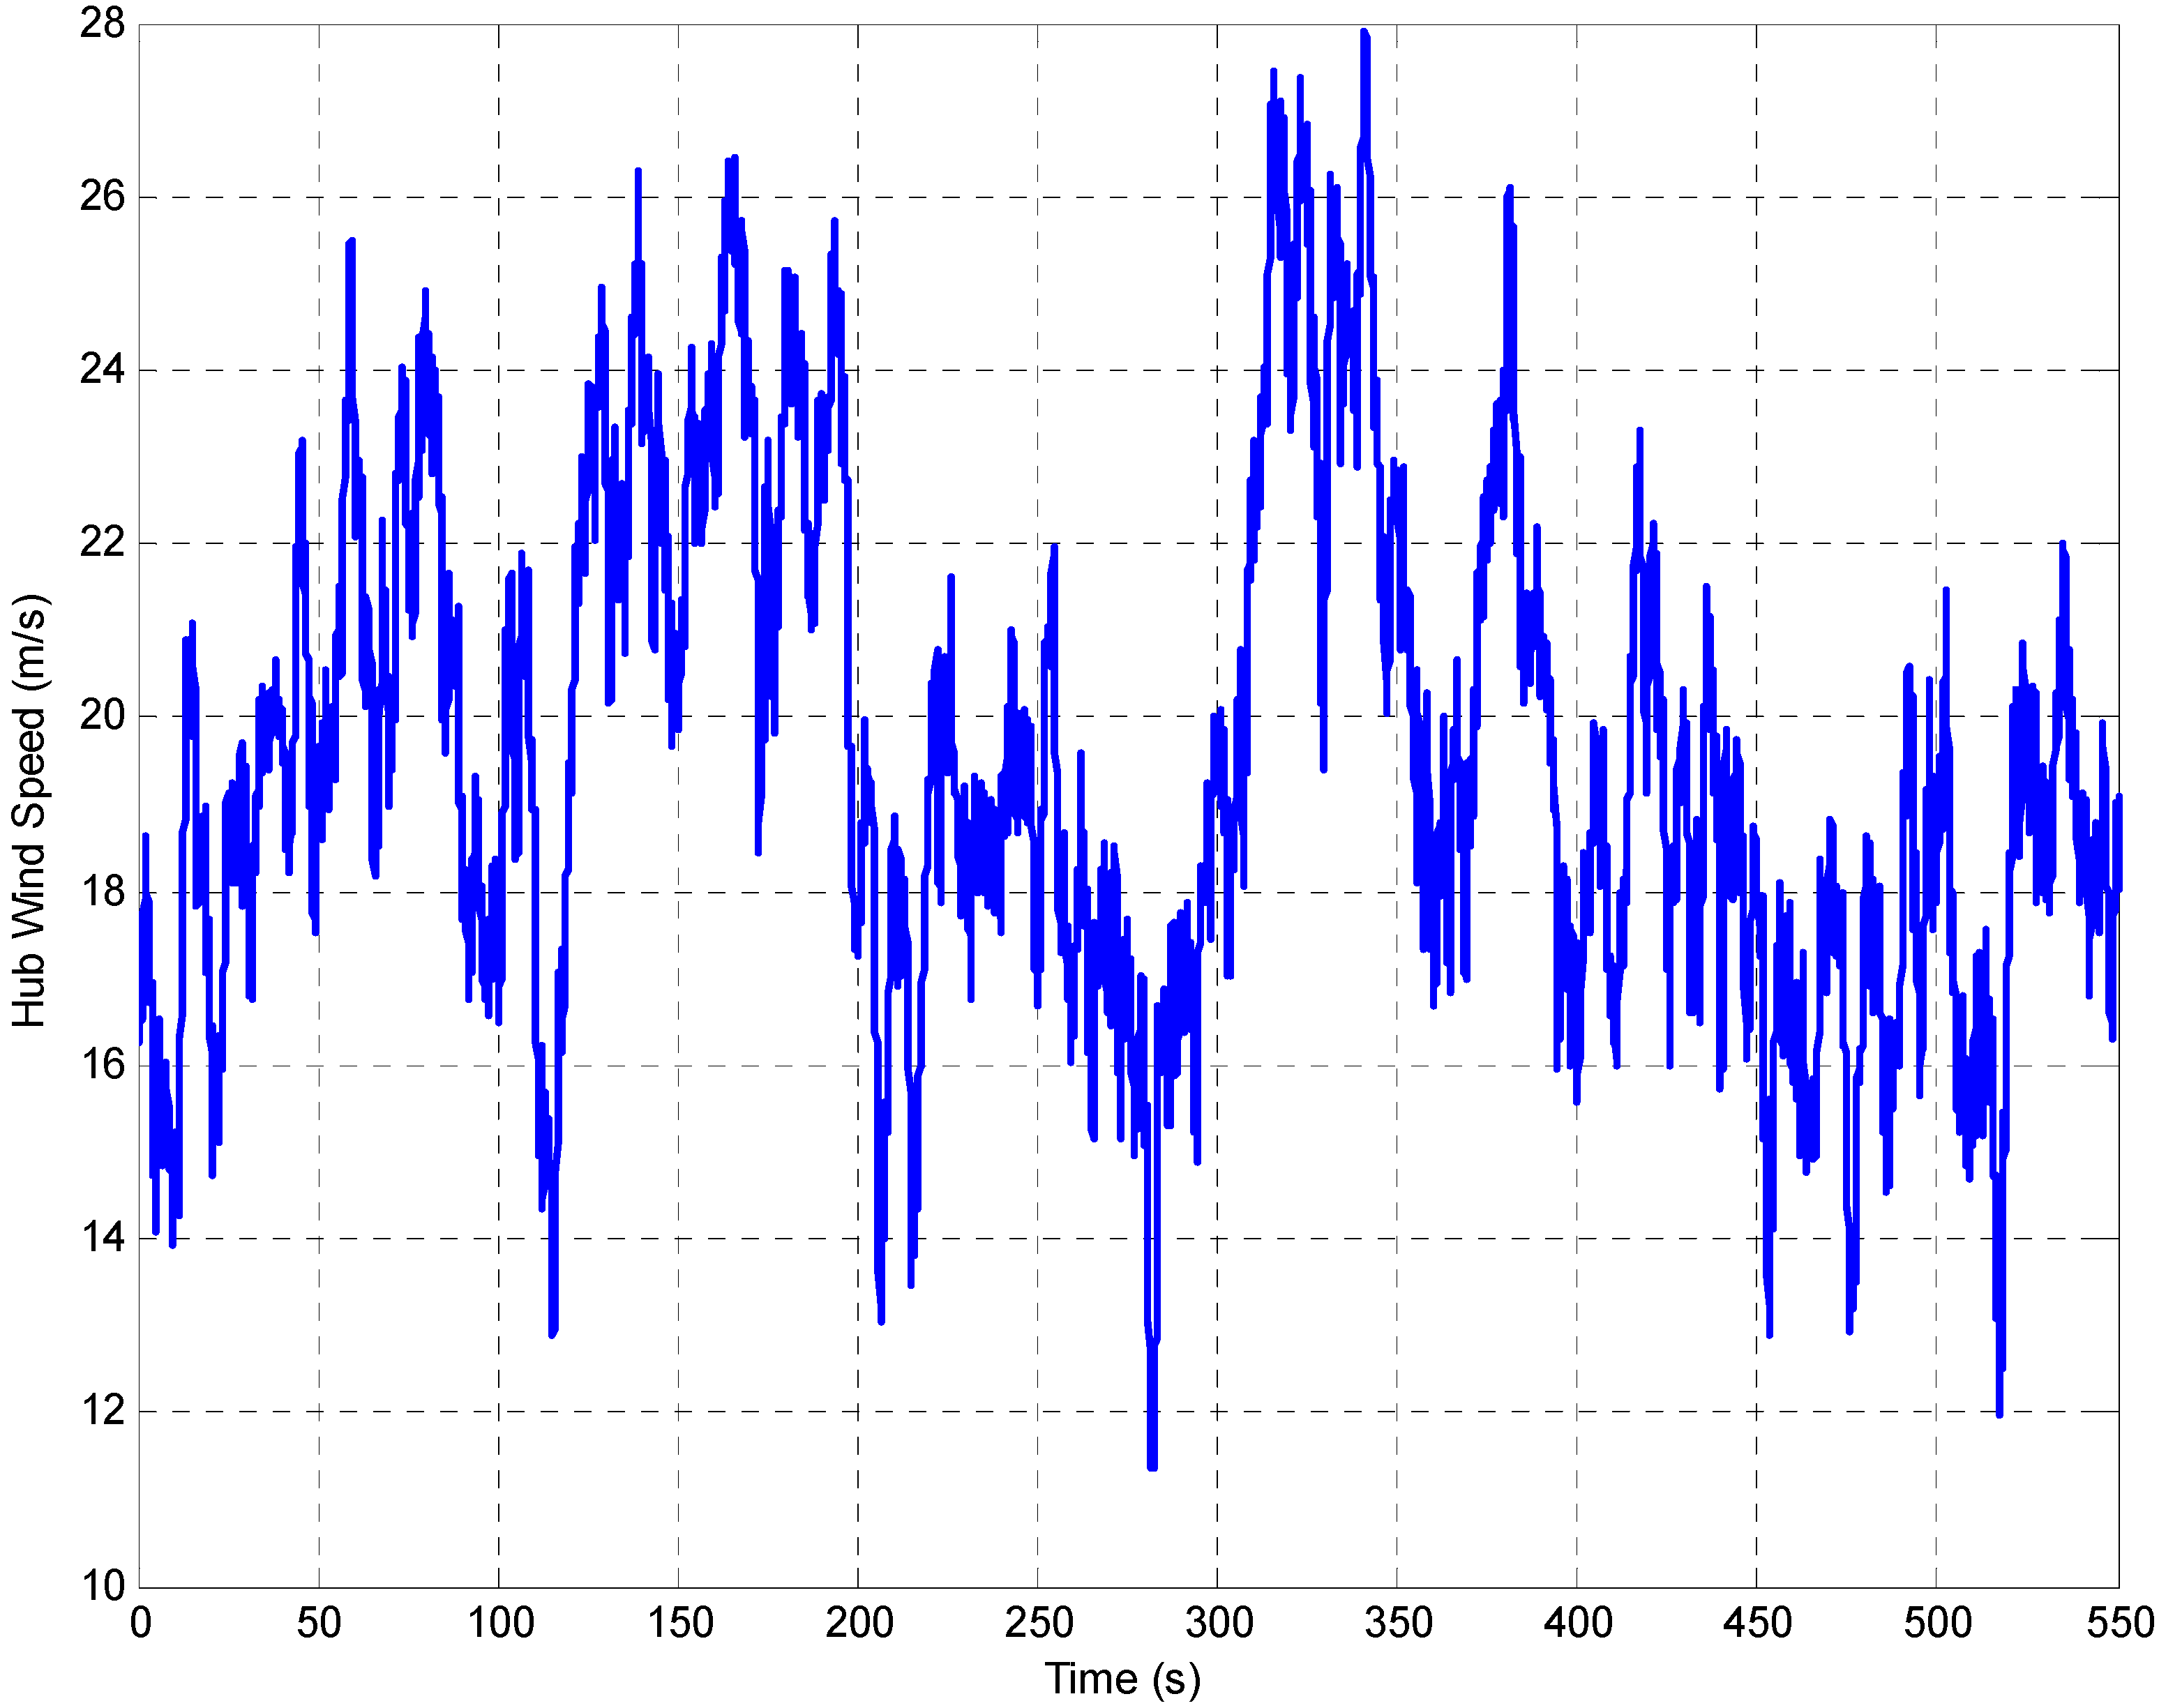
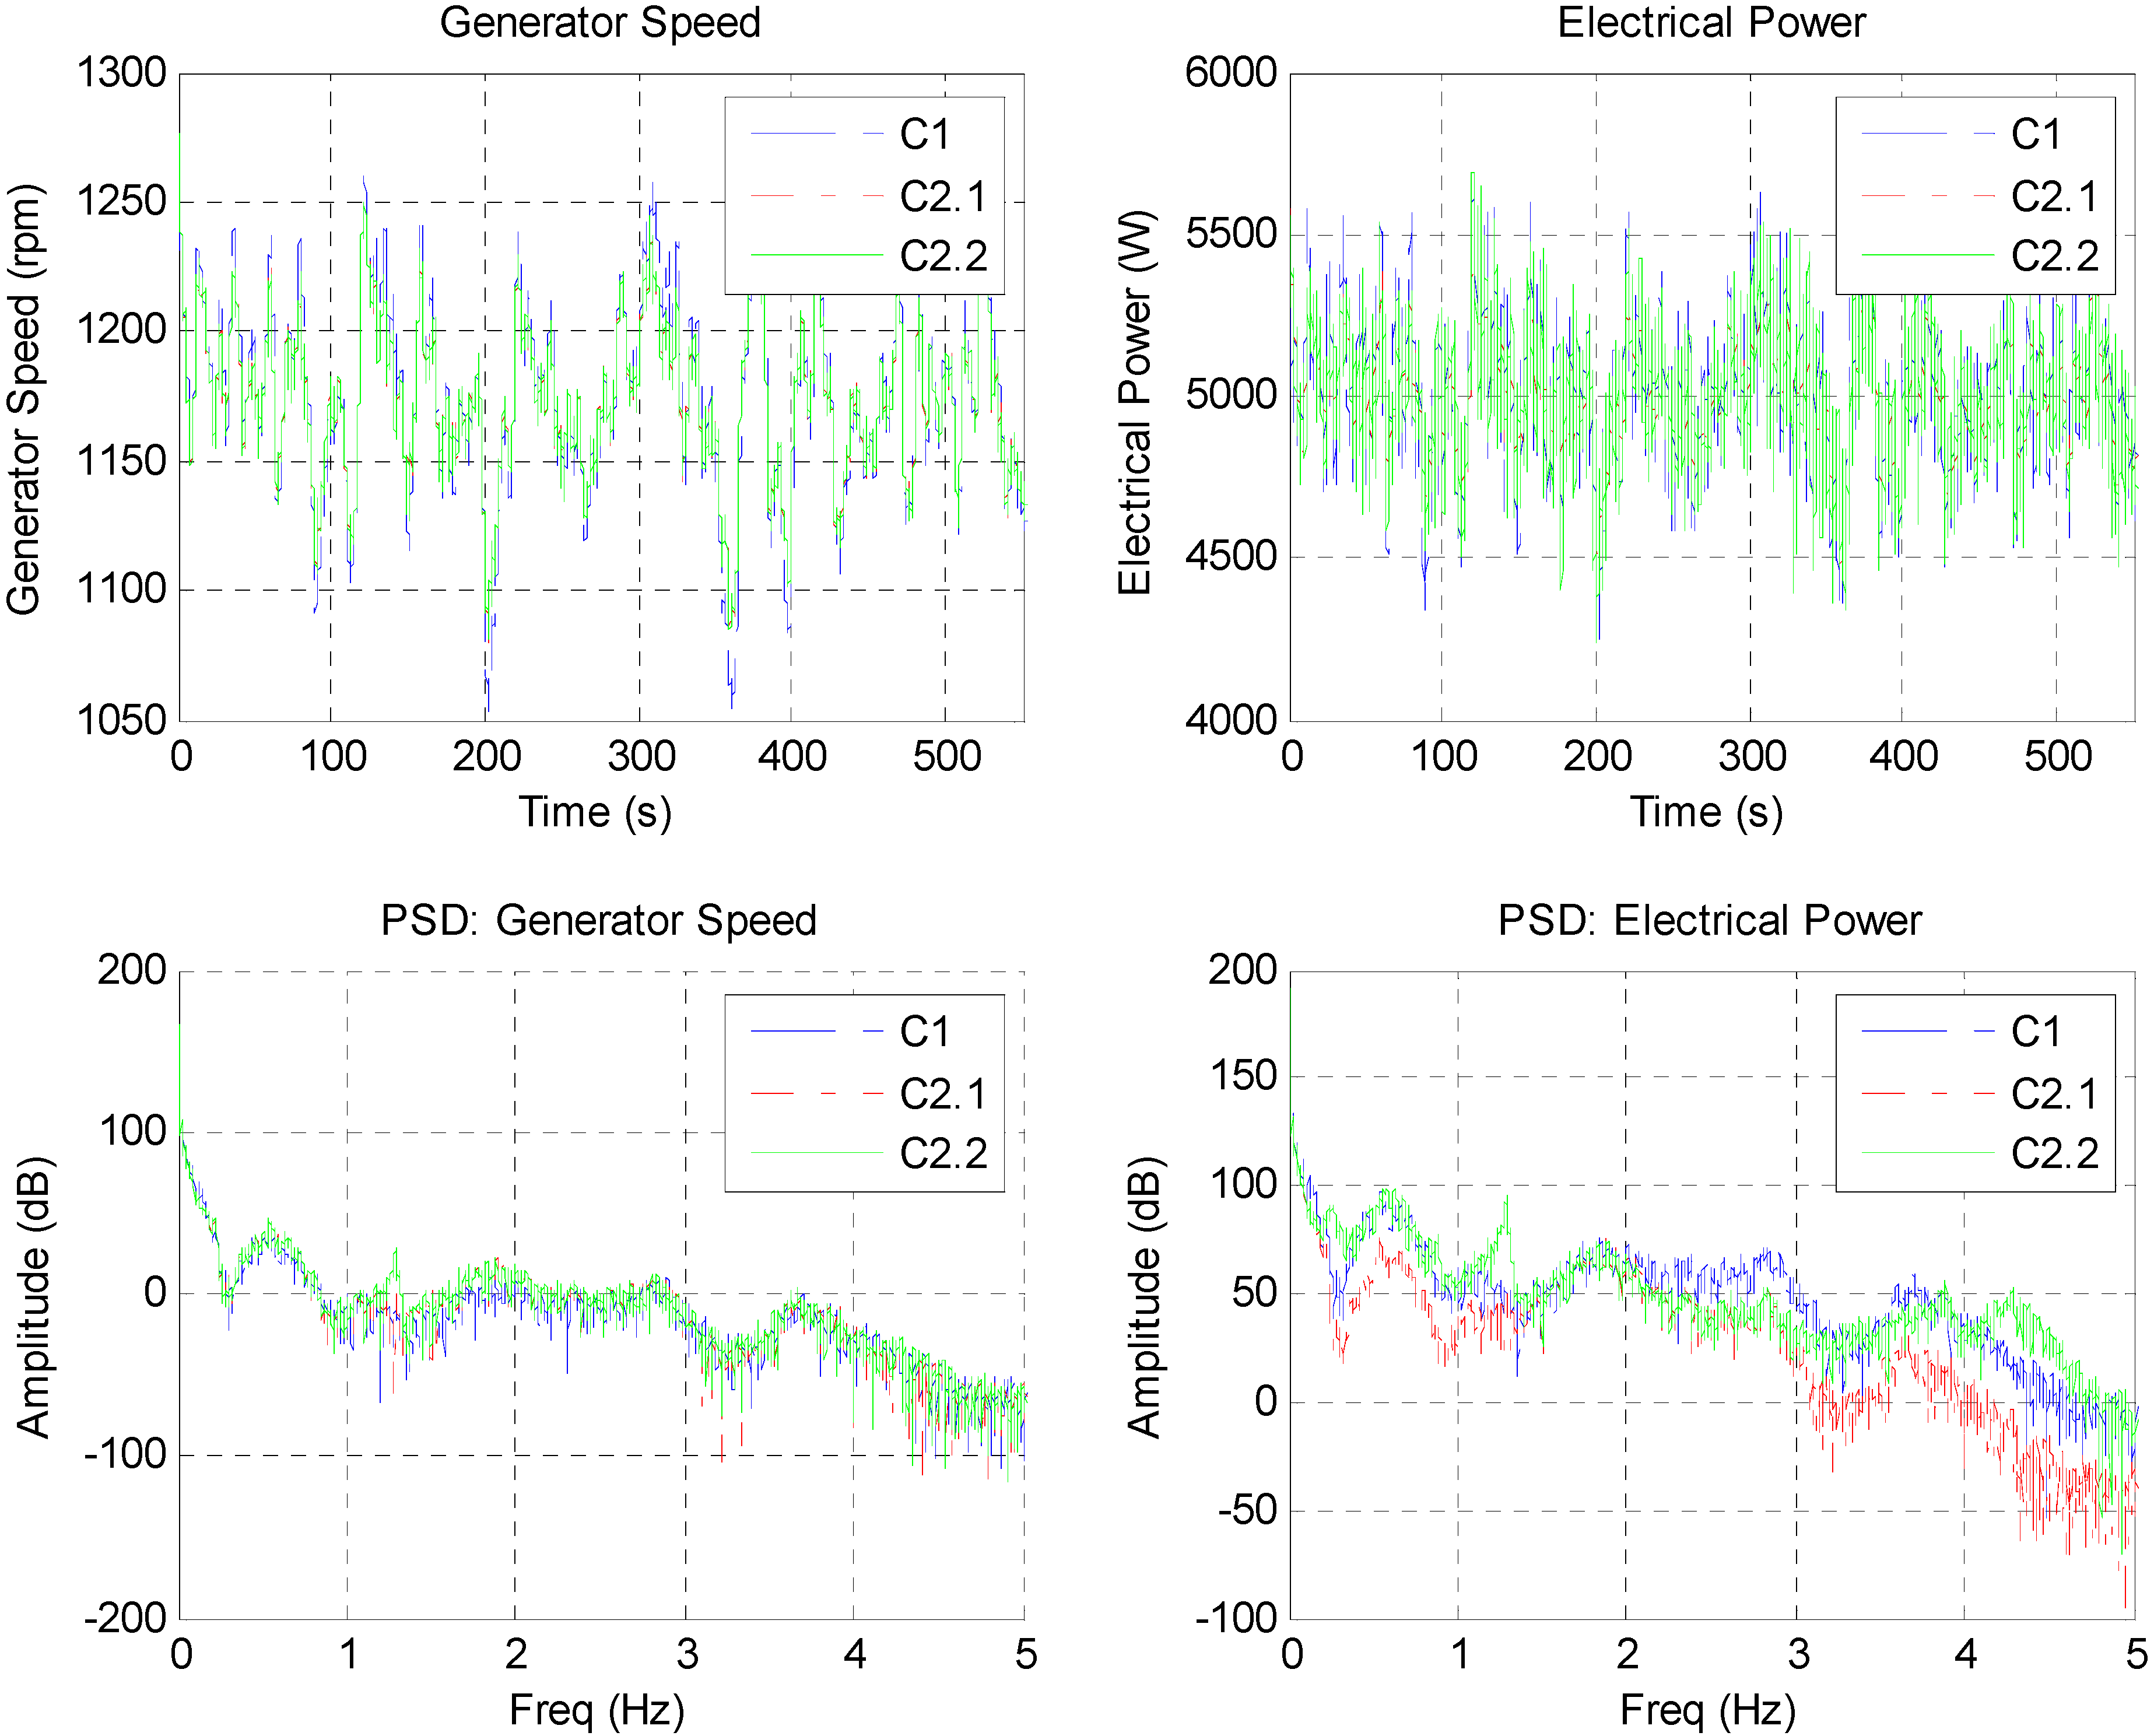
![Energies 05 00938 i014]() Figure 17. Generator speed and electrical power with a turbulent production wind of 19 m/s.
Figure 17. Generator speed and electrical power with a turbulent production wind of 19 m/s.![Energies 05 00938 g017]()
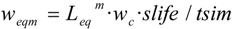
- The twelve simulations must be taken into account to calculate the total load equivalent for each material. The load equivalent referring to the Weibull distribution weqm (15) is calculated for each wind and each material. The total load equivalent for one material Leqw (16) referring to the Weibull distribution is calculated with the summation of the weqm. wc is a parameter of the Weibull distribution, slife is the standard life of wind turbines (20 years) and tsim is the simulated time of the considered variable in this load equivalent analysis:
![Energies 05 00938 i015]()
![Energies 05 00938 i016]()
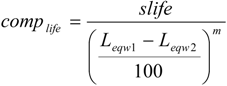
- To compare the wind turbine life variations complife (17) between two compared load equivalent analysis. Leqw1 is the total load equivalent value for twelve simulations and Leqw2 is the other total load equivalent value for the other twelve simulations:
![Energies 05 00938 i017]()


| m | C1-C2.1 (%) | C1-C2.2 (%) | |
|---|---|---|---|
| Stationary Hub Mx | 3 | 4.8 | 0.4 |
| 9 | 4.2 | 3.1 | |
| 12 | 4.0 | 2.9 | |
| Stationary Hub My | 3 | 0.2 | 0.2 |
| 9 | 0.9 | 1 | |
| 12 | 1.2 | 1.5 | |
| Gearbox Torque | 3 | 4.8 | 0.4 |
| 9 | 4.2 | 3.1 | |
| 12 | 4.0 | 2.9 | |
| Tower Base Mx | 3 | 2.6 | 13.4 |
| 9 | −0.1 | 19.6 | |
| 12 | −0.2 | 19.2 | |
| Tower Base My | 3 | 5.2 | 4.7 |
| 9 | 10.9 | 8.8 | |
| 12 | 13.6 | 10.6 | |
| Blade1 MFlap | 3 | 0.1 | −0.2 |
| 9 | 0.1 | −0.1 | |
| 12 | 0.1 | −0.2 | |
| Blade1 MEdge | 3 | 0 | 0.1 |
| 9 | 0 | 0 | |
| 12 | 0 | 0 |
6.3. Extreme Load Analysis (DLC1.6 in IEC61400-1 Second Edition)
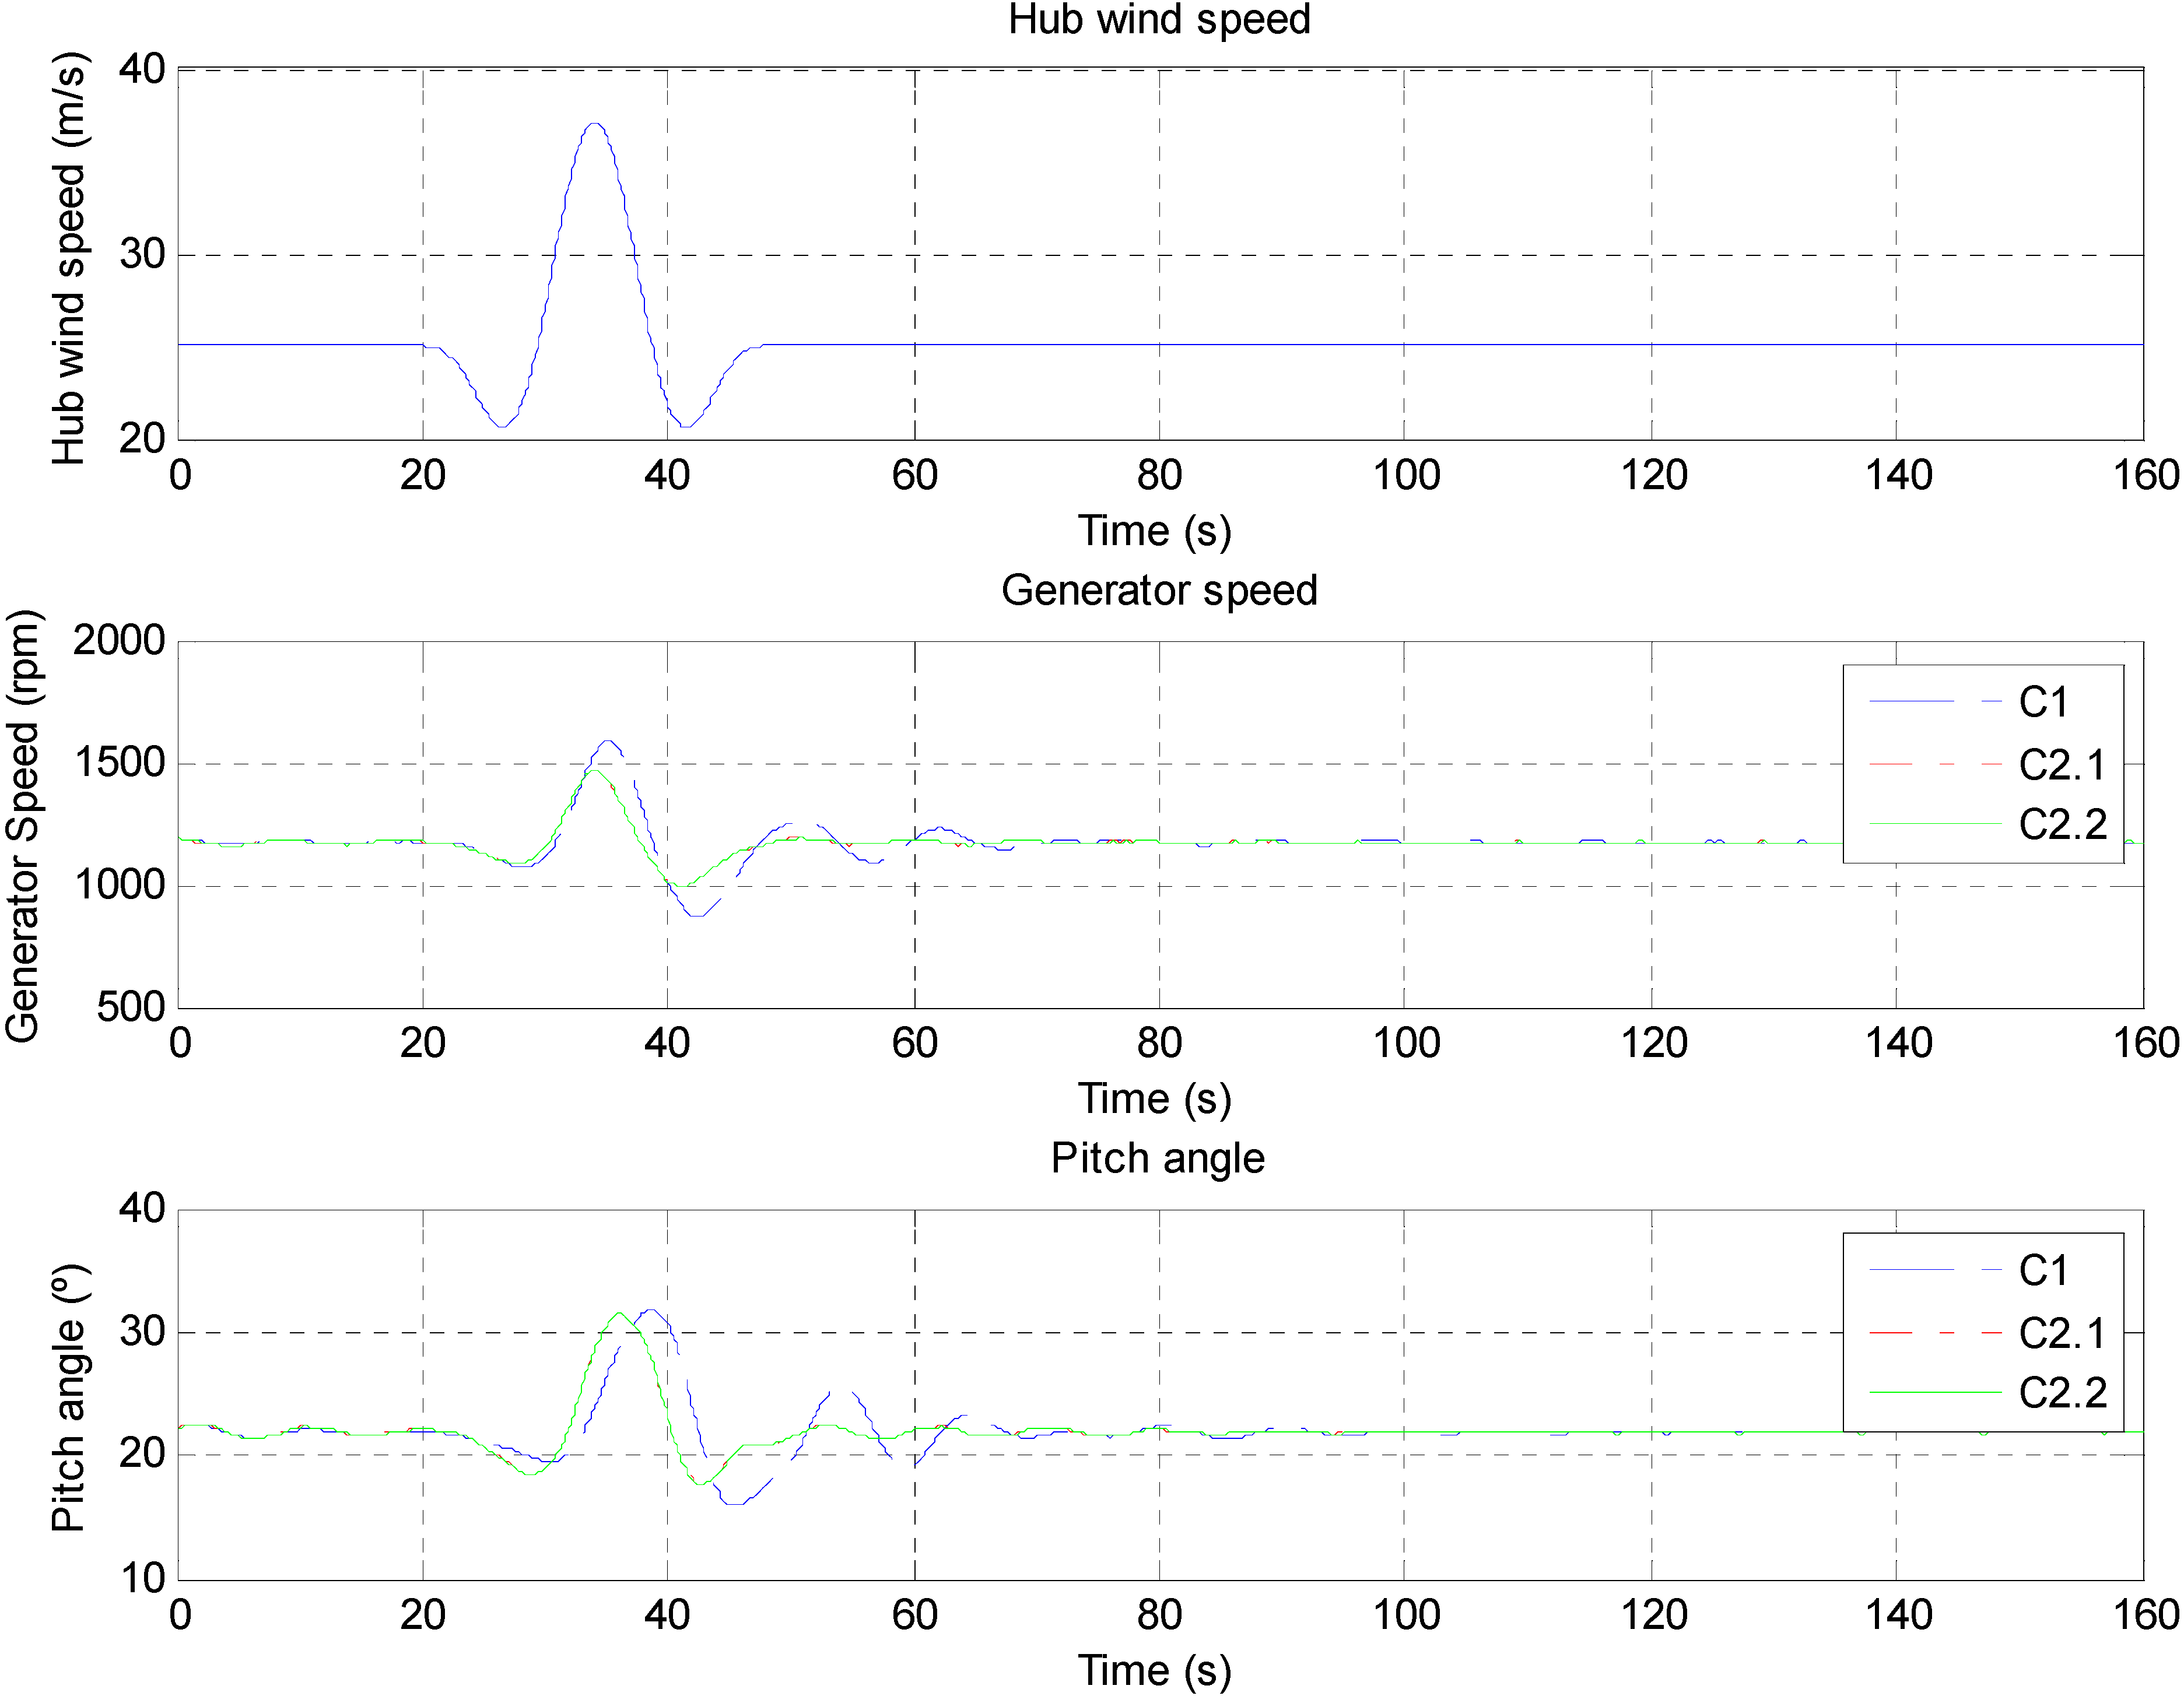
- To carry out time domain simulations using the non-linear wind turbine model and the C1 and C2 different control strategies. Six simulations of different kinds of gusts have been carried out. The gusts are called Vr-0, Vr-p, Vr-n, Vout-0, Vout-p, Vout-n.
- To analyze the six simulations and extract the maximum value of the generator speed signal and some momentums (tower base Mx, tower base My, tower base Mxy, hub total bending Myz, blade MFlap and blade MEdge).
- To compare these maximum values using the C2 control strategy with regard to the baseline C1 control strategy.

| C1 | C2.1 | C1-C2.1 (%) | C2.2 | C1-C2.2 (%) | |
|---|---|---|---|---|---|
| Generator Speed | 1589 rpm | 1464 rpm | 7.86 | 1465 rpm | 7.8 |
| Tower Base Mx | 29278 KNm | 29285 KNm | 0.02 | 26983 KNm | 7.8 |
| Tower Base My | 158258 KNm | 155500 KNm | 1.74 | 155473 KNm | 1.7 |
| Tower Base Mxy | 158311 KNm | 155500 KNm | 1.77 | 155555 KNm | 1.7 |
| Hub total bending Myz | 12991 KNm | 12780 KNm | 1.62 | 12817 KNm | 1.3 |
| Blade MFlap | 18341 KNm | 18400 KNm | −0.32 | 18355 KNm | −0.07 |
| Blade MEdge | 9946 KNm | 7366 KNm | 25.94 | 7327 KNm | 26.3 |
7. Conclusions
- The offshore Upwind 5 MW wind turbine model is developed using the GH Bladed 4.0 software package.
- A classical control strategy for wind turbines is defined and it is considered the baseline controller for comparing with the new developed control strategies.
- New design process of a control strategy based on H∞ controllers is defined and validated in GH Bladed. The new strategies are applied in above rated power production zone in wind turbines. The results obtained in the closed loop simulations using GH Bladed 4.0 software package show the fatigue load reduction on the desired components (tower and drive train) compared to the classical baseline control strategy (see Figure 21). Using the designed H∞ controllers, the extreme load reduction in case DLC1.6 does not appear only in the tower, but also in the three blades. Results obtained using H∞ controllers have these outstanding benefits from the load reduction point of view due to some interesting properties:

- The attenuation of the generator speed output disturbance bandwidth is higher than that obtained using the classical control strategy.
- The attenuation of the generator speed output disturbance peak is higher than that obtained using the classical control strategy.
- The proposed control strategy based on the H∞ norm reduction takes into account the coupling between variables in the wind turbine system. The designed controller is multivariable and multi-objective.
- The controller robustness is guaranteed due to the small gain theorem properties applied to the H∞ controller synthesis.
- Some notch filters can be included in the controller dynamics using a correct definition of the mixed sensitivity problem. This is very useful for reducing excited modes on non-desired frequencies.
Acknowledgements
References
- Caselitz, P.; Geyler, M.; Giebhardt, J.; Panahandeh, B. Hardware-in-the-Loop development and testing of new pitch control algorithms. In Proceeding of European Wind Energy Conference and Exhibition (EWEC), Brussels, Belgium, March 2011; pp. 14–17.
- Johnson, K.E.; Pao, L.Y.; Balas, M.J.; Kulkarni, V.; Fingersh, L.J. Stability analysis of an adaptive torque controller for variable speed wind turbines. In Proceeding of IEEE Conference on Decision and Control, Atlantis, Bahamas, December 2004; pp. 14–17.
- Nourdine, S.; Díaz de Corcuera, A.; Camblong, H.; Landaluze, J.; Vechiu, I.; Tapia, G. Control of wind turbines for frequency regulation and fatigue loads reduction. In Proceeding of 6th Dubrovnik Conference on Sustainable Development of Energy, Water and Environment Systems, Dubrovnik, Croatia, September 2011; pp. 25–29.
- Wright, A.D. Modern Control Design for Flexible Wind Turbines; Technical Report for NREL; NREL/TP-500-35816; Colorado, CO, USA, July 2004. [Google Scholar]
- Wright, A.D.; Fingersh, L.J.; Balas, M.J. Testing state-space controls for the controls advanced research turbine. In Proceeding of 44th AIAA Aerospace Sciences Meeting and Exhibit, Reno, NV, USA, January 2006; pp. 9–12.
- Sanz, M.G.; Torres, M. Aerogenerador síncrono multipolar de velocidad variable y 1.5 MW de potencia: TWT1500. Rev. Iberoamer. Autom. Informát. 2004, 1, 53–64. [Google Scholar]
- Bianchi, F.D.; Battista, H.D.; Mantz, R.J. Wind turbine control systems. In Principles, Modelling and Gain Scheduling Design; Springer-Verlag: London, UK, 2007. [Google Scholar]
- Geyler, M.; Caselitz, P. Robust multivariable pitch control design for load reduction on large wind turbines. J. Sol. Energy Eng. 2008, 130, 12. [Google Scholar] [CrossRef]
- Fleming, P.A.; van Wingerden, J.W.; Wright, A.D. Comparing state-space multivariable controls to multi-siso controls for load reduction of drivetrain-coupled modes on wind turbines through field-testing; NREL/CP-5000-53500; NREL: Colorado, CO, USA, 2011. [Google Scholar]
- Jonkman, J.; Butterfield, S.; Musial, W.; Scott, G. Definition of a 5 MW Reference Wind Turbine for Offshore System Development; NREL/TP-500-38060; Technical Report for NREL: Colorado, CO, USA, February 3806. [Google Scholar]
- Upwind Home page. Available online: http://www.upwind.eu (accessed on 12 December 2011).
- Bossanyi, E.A. The design of closed loop controllers for wind turbines. Wind Energy 2000, 3, 149–163. [Google Scholar] [CrossRef]
- Bossanyi, E.A. Controller for 5 MW reference turbine. European Upwind Project Report; Garrad Hassan & Partners Ltd.: Bristol, UK, 2009. Available online: http://www.upwind.eu (accessed on 12 December 2011).
- Wright, A.D.; Fingersh, L.J. Advanced Control Design for Wind Turbines Part I: Control Design, Implementation, and Initial Tests; NREL/TP-500-42437; NREL: Colorado, CO, USA, 2008. [Google Scholar]
- Bossanyi, E.A. Wind turbine control for load reduction. Wind Energy 2003, 6, 229–244. [Google Scholar] [CrossRef]
- Van der Hooft, E.L.; Schaak, P.; van Engelen, T.G. Wind Turbine Control Algorithms; DOWEC-F1W1-EH-03094/0; Technical Report for ECN: Petten, The Netherlands, 2003. [Google Scholar]
- Wright, A.D.; Balas, M.J. Design of controls to attenuate loads in the controls advanced research turbine. J. Sol. Energy Eng. 2004, 126, 1083. [Google Scholar] [CrossRef]
- Hau, M. Promising Load Estimation Methodologies for Wind Turbine Components. Technical Report for European Upwind Project. ISET: Kassel, Germany, 2009. Available online: http: //www.upwind.eu (accessed on 12 December 2012).
- Bossanyi, E.A.; Ramtharan, G.; Savini, B. The importance of control in wind turbines design and loading. In Proceedings of the 17th Mediterranean Conference on Control & Automation, Thessaloniki, Greece, June 2009; pp. 24–26.
- Balas, G.; Chiang, R.; Packard, A.; Safonov, M. MATLAB robust control toolbox. In Getting Started Guide; The MathWorks, Inc.: Natick, MA, USA, 2009. [Google Scholar]
- Doyle, J.C.; Francis, B.A.; Tannenbaum, A.R. Feedback Control Theory; MacMillan: Toronto, Canada, 1992. [Google Scholar]
- Bossanyi, E.A. Bladed User Manual; Garrad Hassan & Partners Ltd.: Bristol, UK, 2009. [Google Scholar]
- Frandsen, S.T. Turbulence and Turbulence Generated Structural Loading in Wind Turbine Clusters. Ph.D. Thesis, Technical University of Denmark, Roskilde, Denmark, 2007. [Google Scholar]
- Söker, H.; Kaufeld, N. Introducing low cycle fatigue in IEC standard range pair spectra. In Proceeding of 7th German Wind Energy Conference, Wilhelmshaven, Germany, October 2004; pp. 20–21.
- MATLAB Rainflow Counting Algorithm Toolbox. Available online: http://www.mathworks.com/MATLABcentral/fileexchange/3026 (accessed on 12 December 2011).
© 2012 by the authors; licensee MDPI, Basel, Switzerland. This article is an open access article distributed under the terms and conditions of the Creative Commons Attribution license (http://creativecommons.org/licenses/by/3.0/).
Share and Cite
De Corcuera, A.D.; Pujana-Arrese, A.; Ezquerra, J.M.; Segurola, E.; Landaluze, J. H∞ Based Control for Load Mitigation in Wind Turbines. Energies 2012, 5, 938-967. https://doi.org/10.3390/en5040938
De Corcuera AD, Pujana-Arrese A, Ezquerra JM, Segurola E, Landaluze J. H∞ Based Control for Load Mitigation in Wind Turbines. Energies. 2012; 5(4):938-967. https://doi.org/10.3390/en5040938
Chicago/Turabian StyleDe Corcuera, Asier Diaz, Aron Pujana-Arrese, Jose M. Ezquerra, Edurne Segurola, and Joseba Landaluze. 2012. "H∞ Based Control for Load Mitigation in Wind Turbines" Energies 5, no. 4: 938-967. https://doi.org/10.3390/en5040938