2.2.1. Discharge
In plug-in hybrid electric vehicles, the power and energy densities are the most relevant key issues for assessment of the static parameters. However, there are many variables that should be considered for evaluation of an appropriate energy storage system. Some of these variables are the impact of the working temperature and discharge rate currents on the battery performances. Based on such test, the RESS performances among the whole depth of discharge (DoD) window can be analyzed. Furthermore, the thermal behaviour of the RESS can be mapped out in function of the applied current. In this section, only the current rates abilities have been considered. The temperature impact will be discussed later.
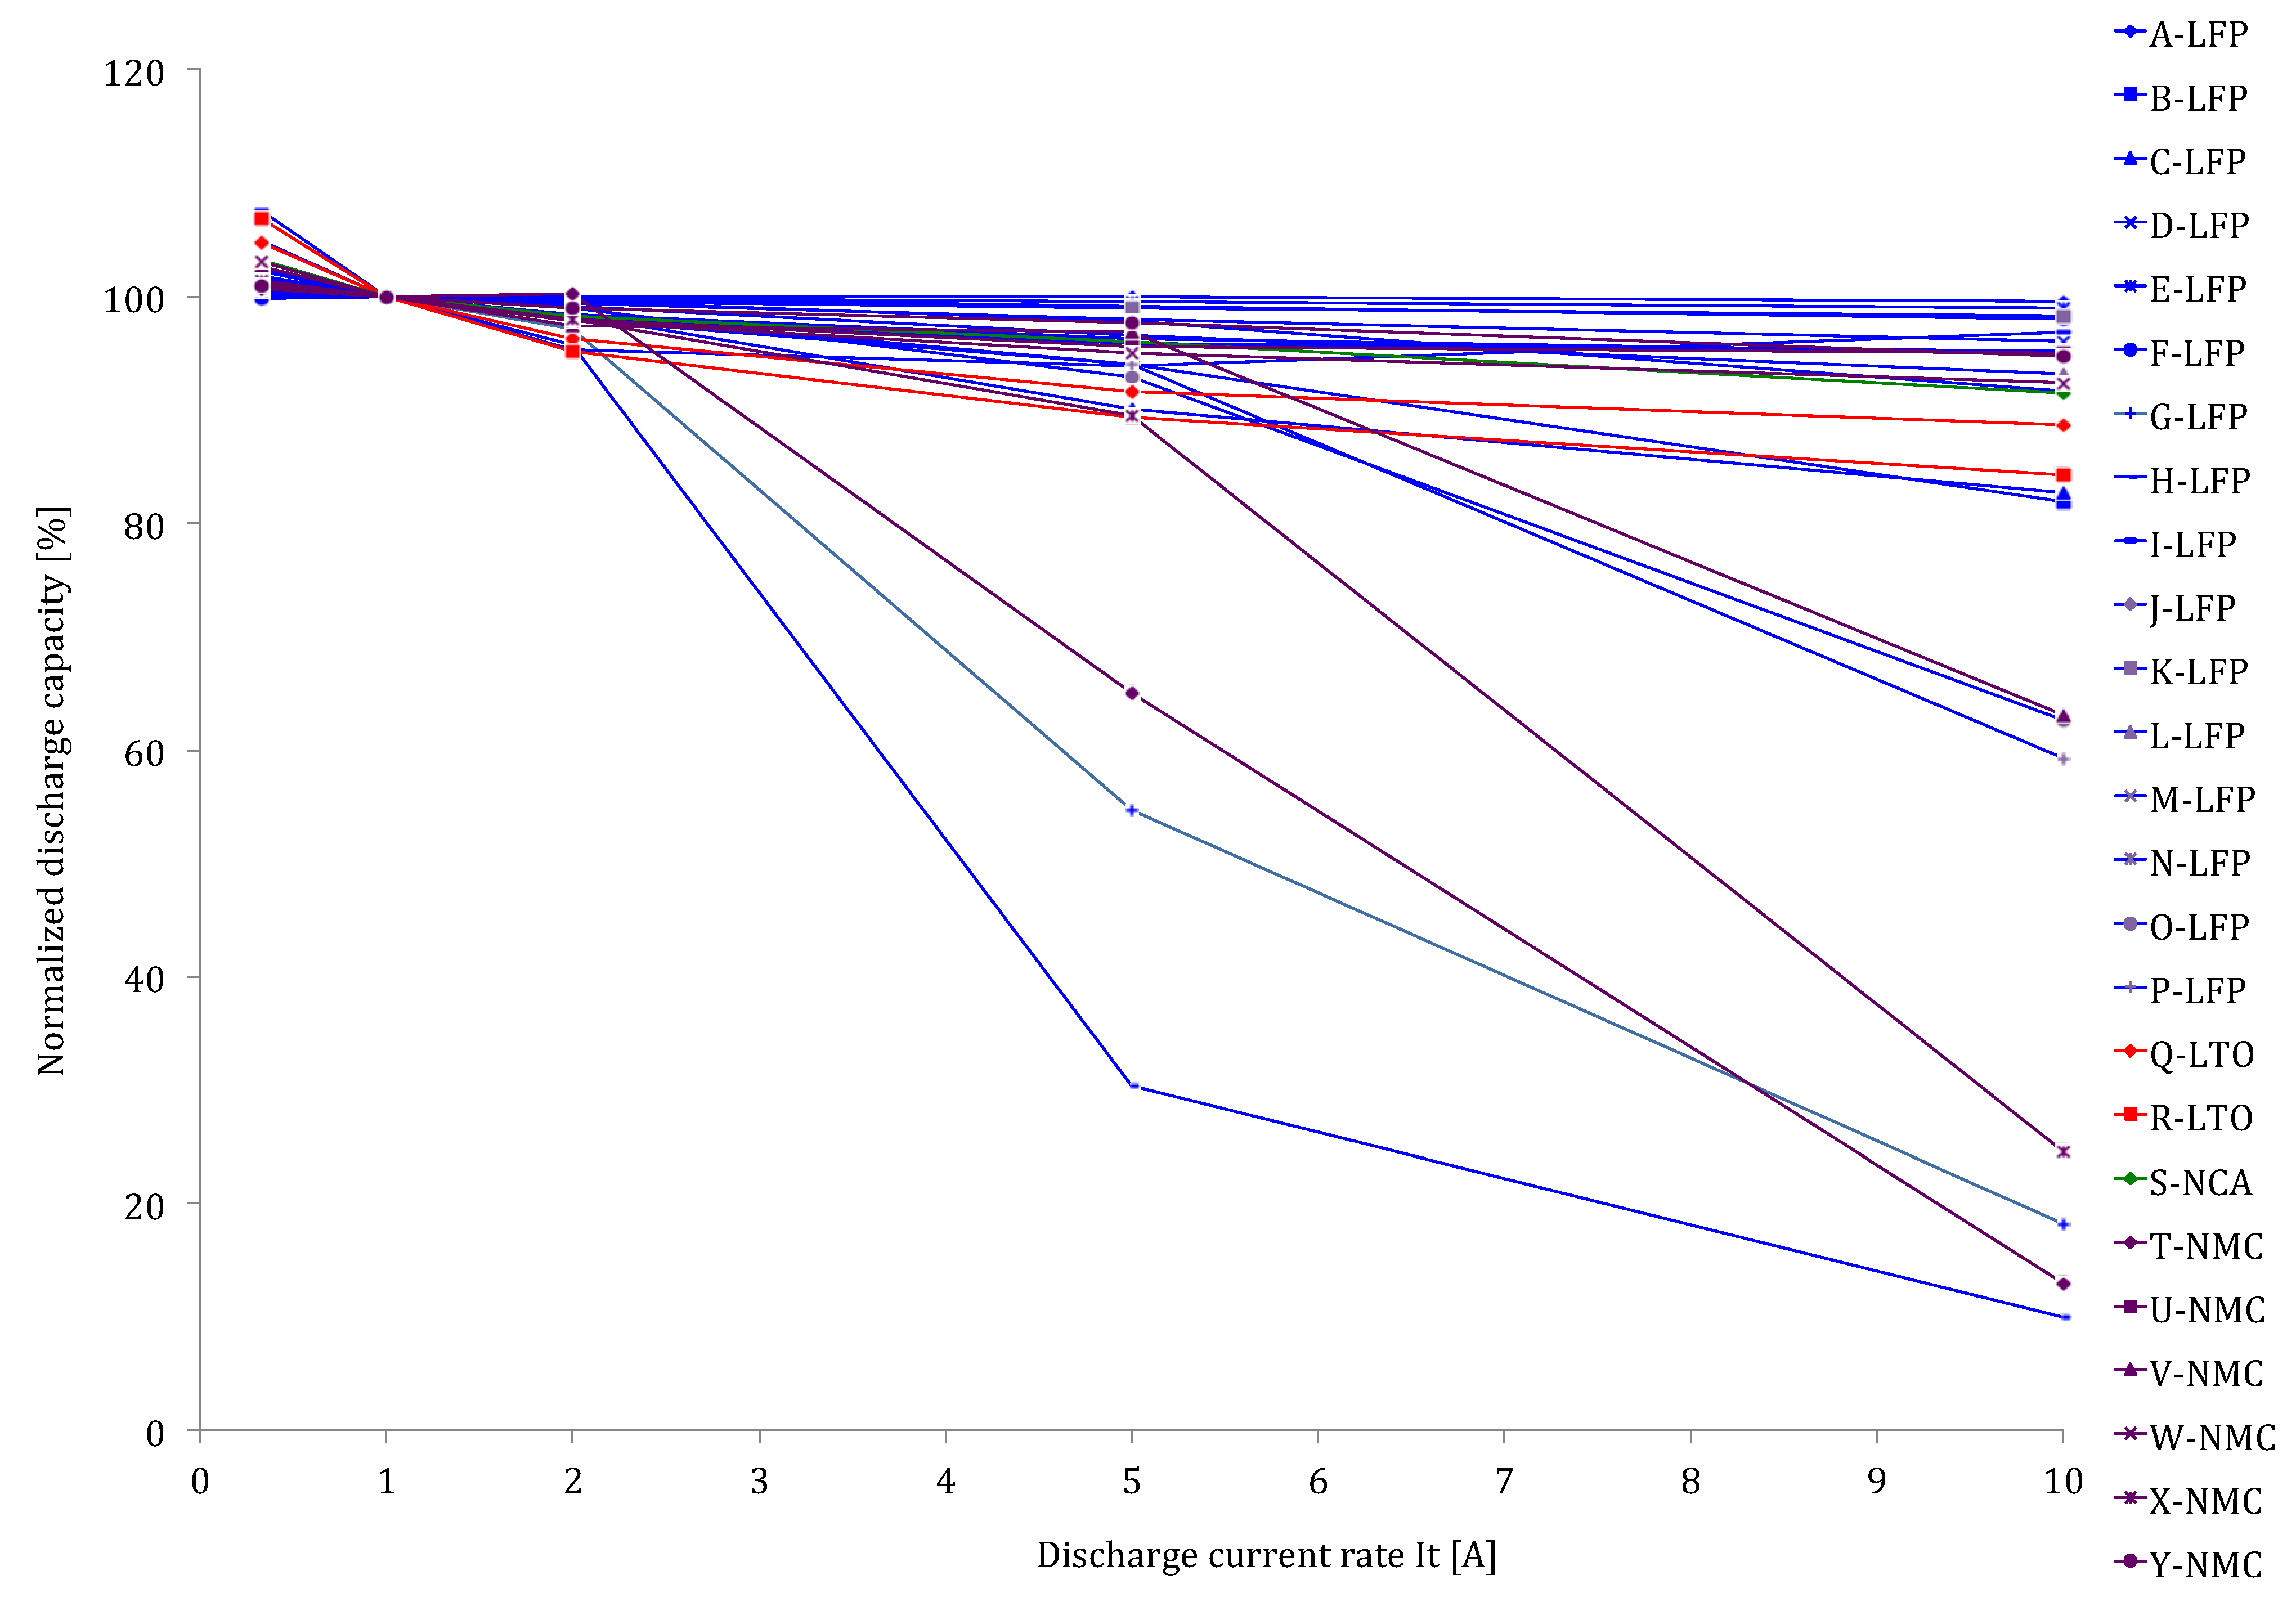
In the world of battery testing, the capacity test can be considered as one of the key test regimes, allowing one to map out the battery behaviour at different discharge current rates.
In
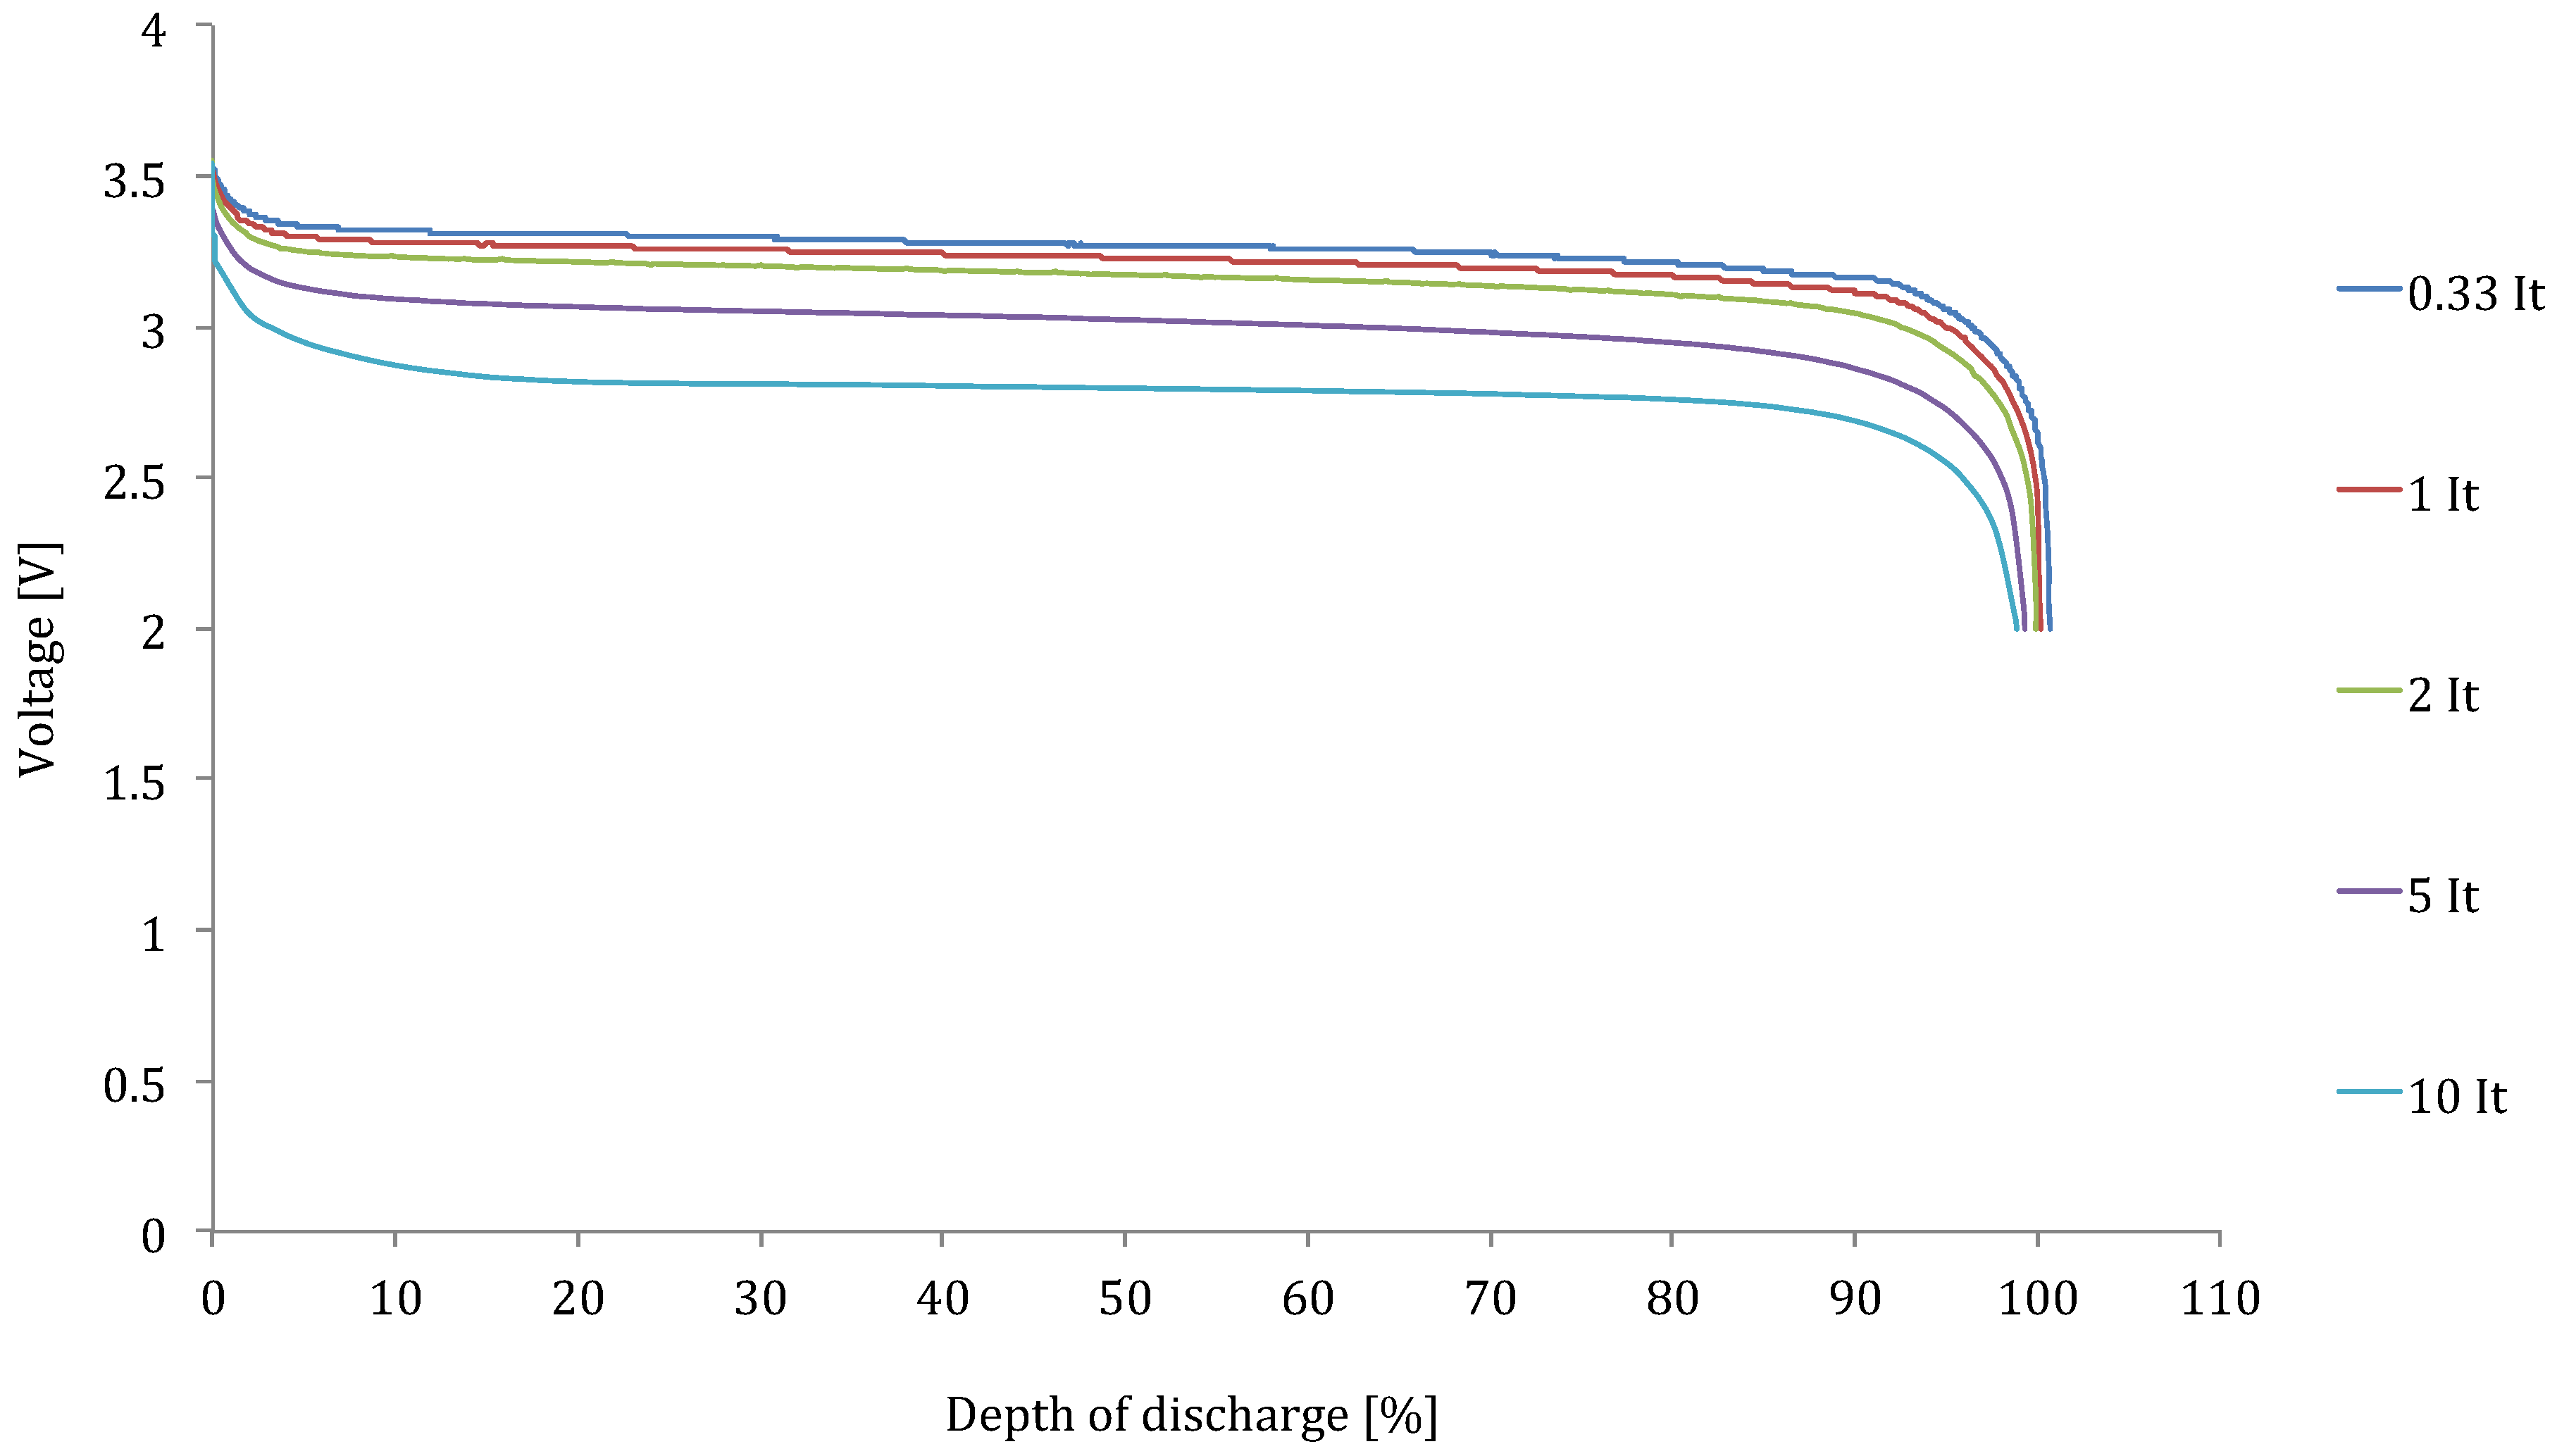
Figure 11 an example is presented of the capacity test at0.33I
t, 1I
t, 2I
t, 5I
t and 10I
t. As we can see in
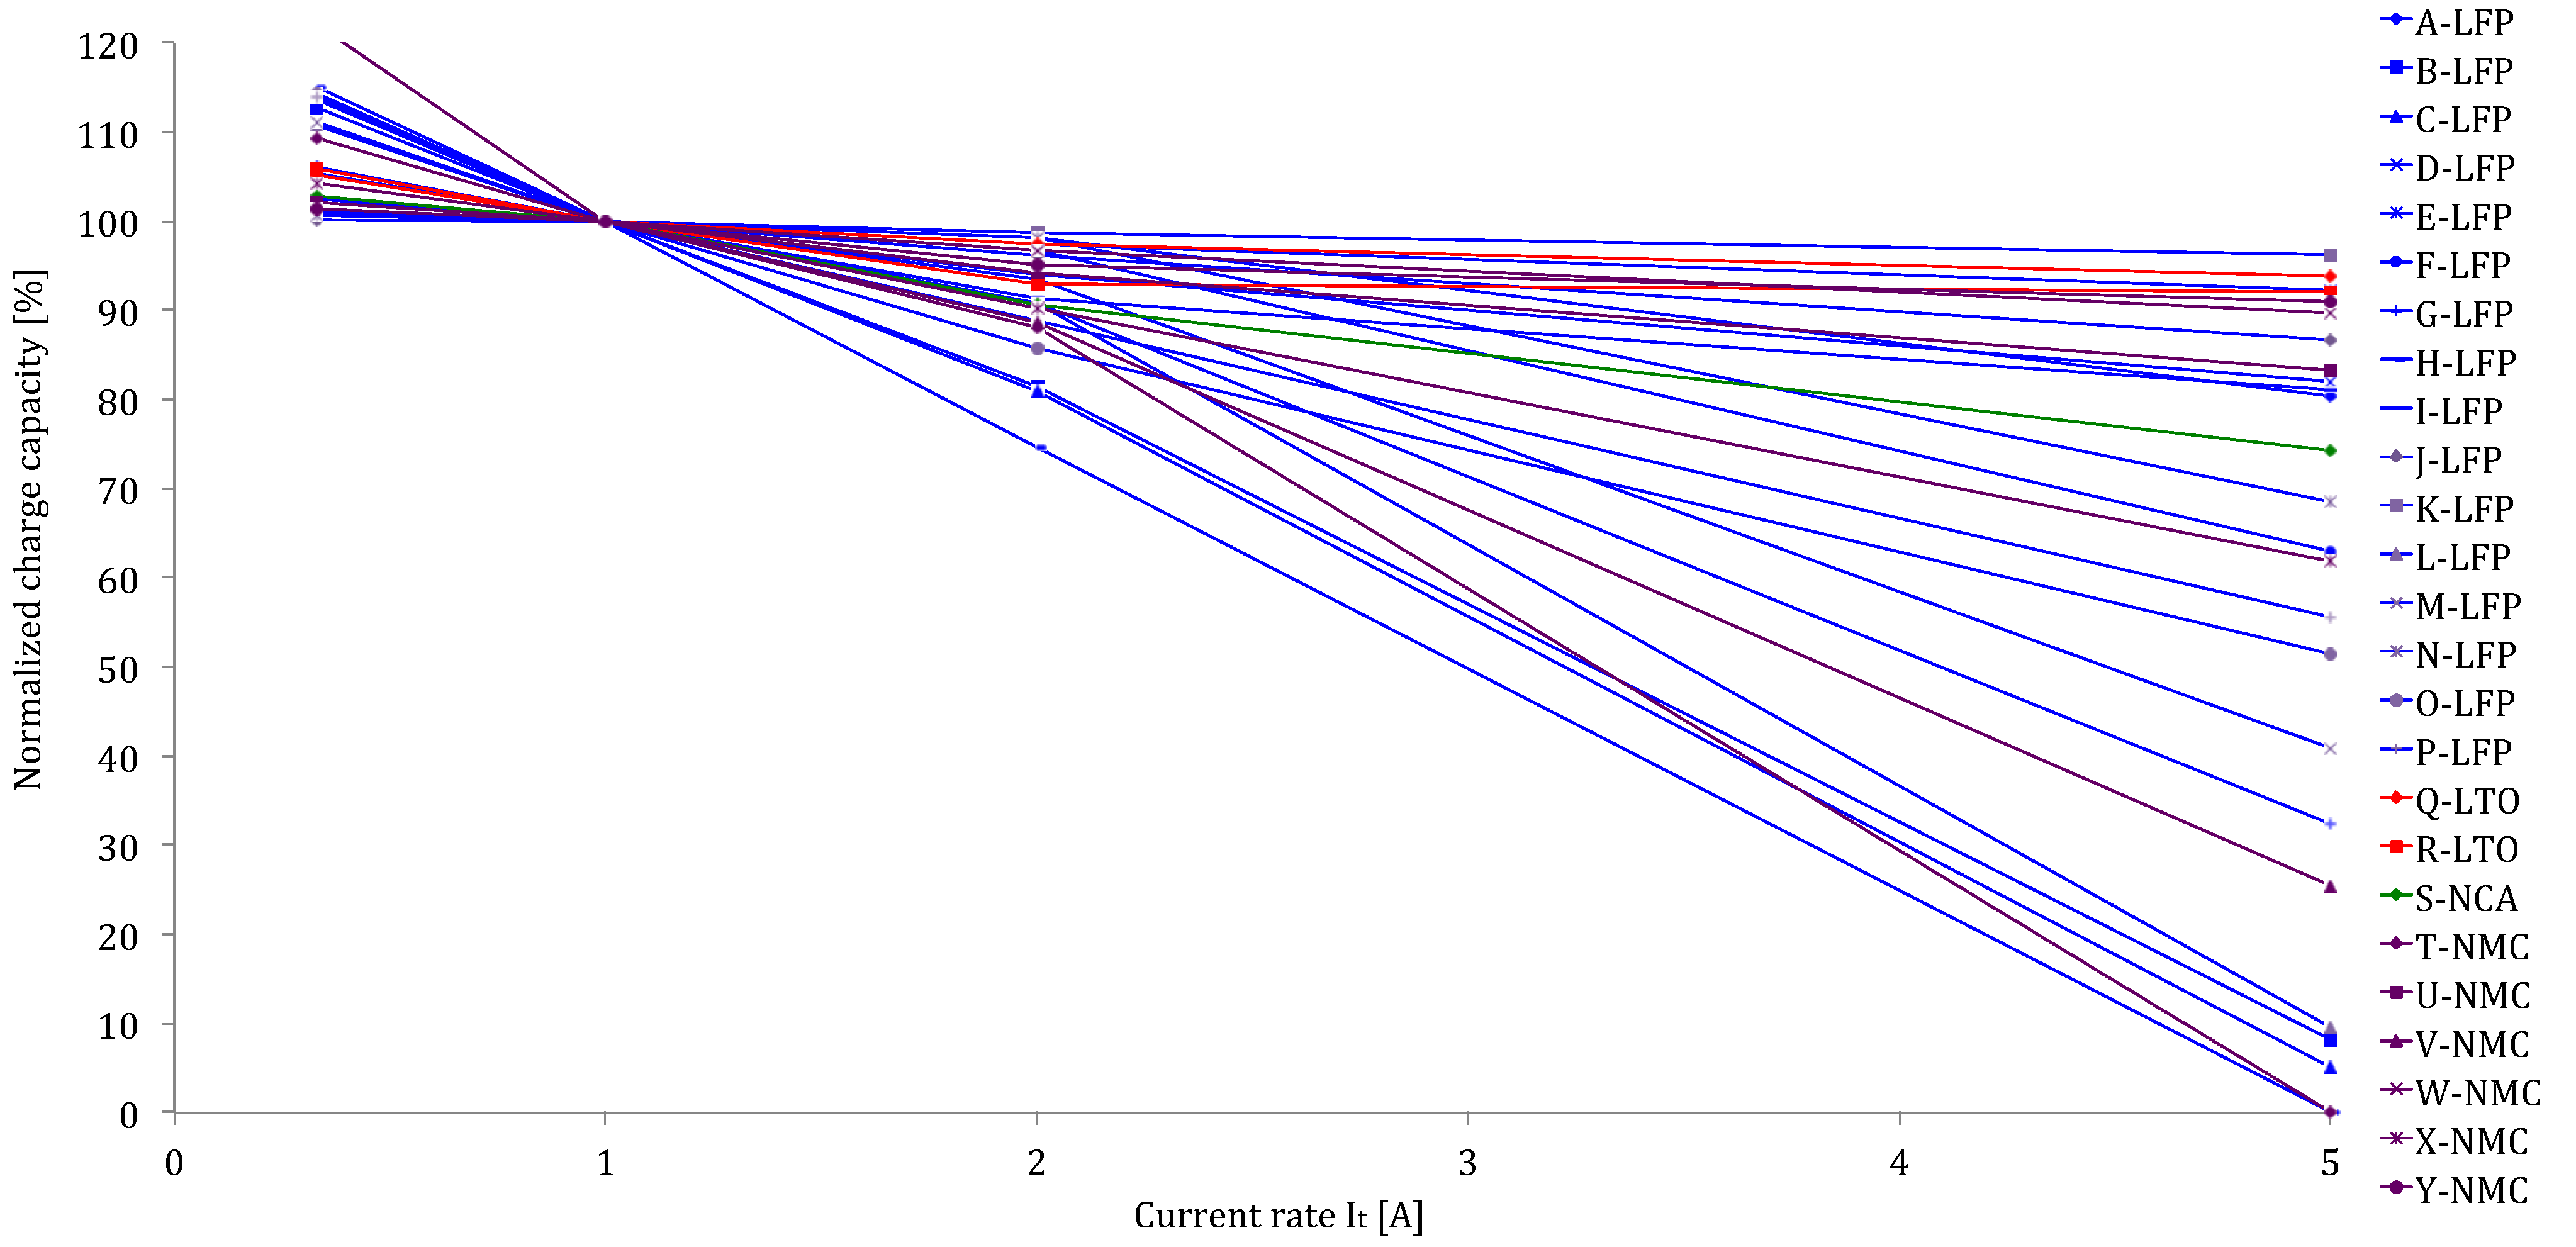
Figure 12 the delivered capacity is almost equal, independent of the applied current rates. However, the results of the various lithium-ion brands in
Figure 12 reveal that this characteristic does not occur for all batteries such as for the battery types with high energy density: G-LFP, H-LFP, O-LFP, P-LFP, T-NMC, V-NMC and X-NMC (see
Figure 12). This is due to the fact that these batteries have been dimensioned for a specific working envelope (0.33I
t–3I
t). Unlike the high power based battery cells, the supplied capacity is less independent of the imposed current rates. The latter one can be explained by the geometry of the used electrodes. In high power applications, such as in HEVs, the batteries should be able to be charged and discharged very quickly for acceleration and braking phases. This can be made by construction thin electrodes with a large surface area. So, the lithium ions can be ionized in the electrolyte, transferred from one electrode and intercalated into another. While the energy based batteries have a low surface area to volume ratio due to the thicker electrodes for storing much amount quantities of charge. According to Tahil, it is the volume that determines the storage capacity and surface area the maximum discharge rate [
71]. According to the Equation (2), we can conclude that the thicker electrodes increase the internal resistance of the battery cell:
Figure 11.
Discharge behaviour of battery brand A-LFP (high power).
Figure 11.
Discharge behaviour of battery brand A-LFP (high power).
Figure 12.
Discharge capabilities at different current rates.
Figure 12.
Discharge capabilities at different current rates.
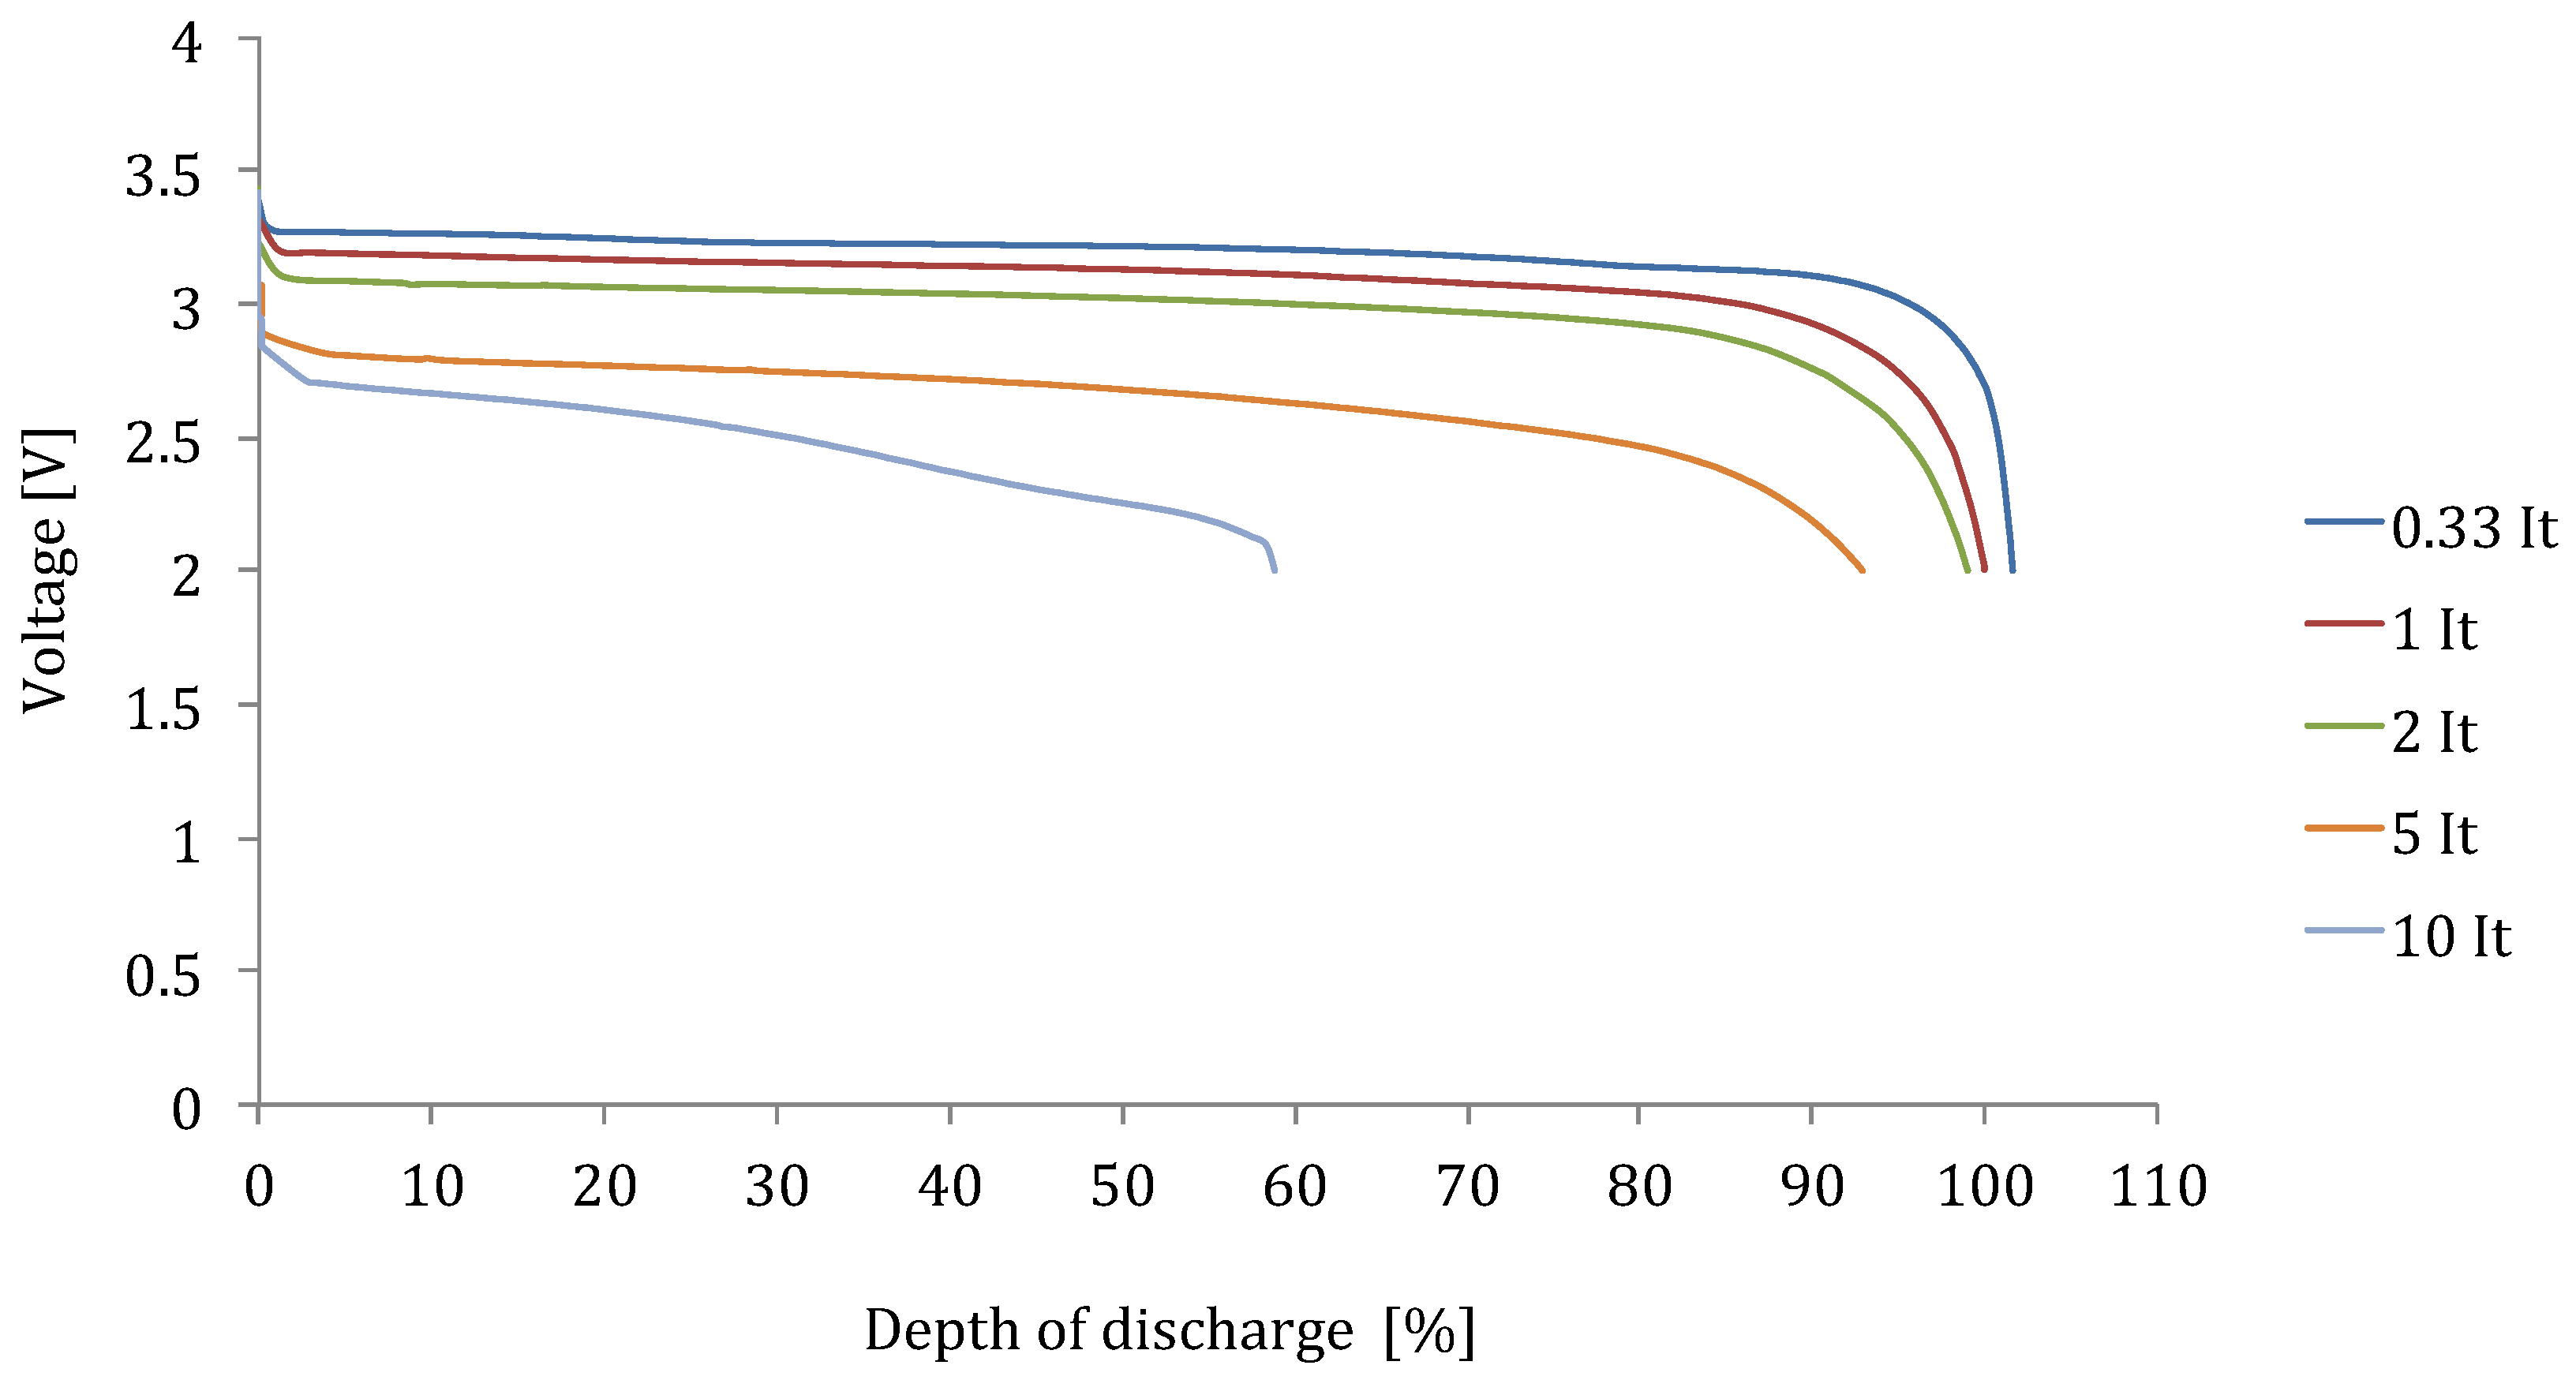
For high energy batteries, the voltage drop due to the ohmic resistance can be considered as the major parameter for the poor discharge rate capabilities as it is presented for in
Figure 13.
Figure 13.
Discharge behaviour of battery brand O-LFP (high energy).
Figure 13.
Discharge behaviour of battery brand O-LFP (high energy).
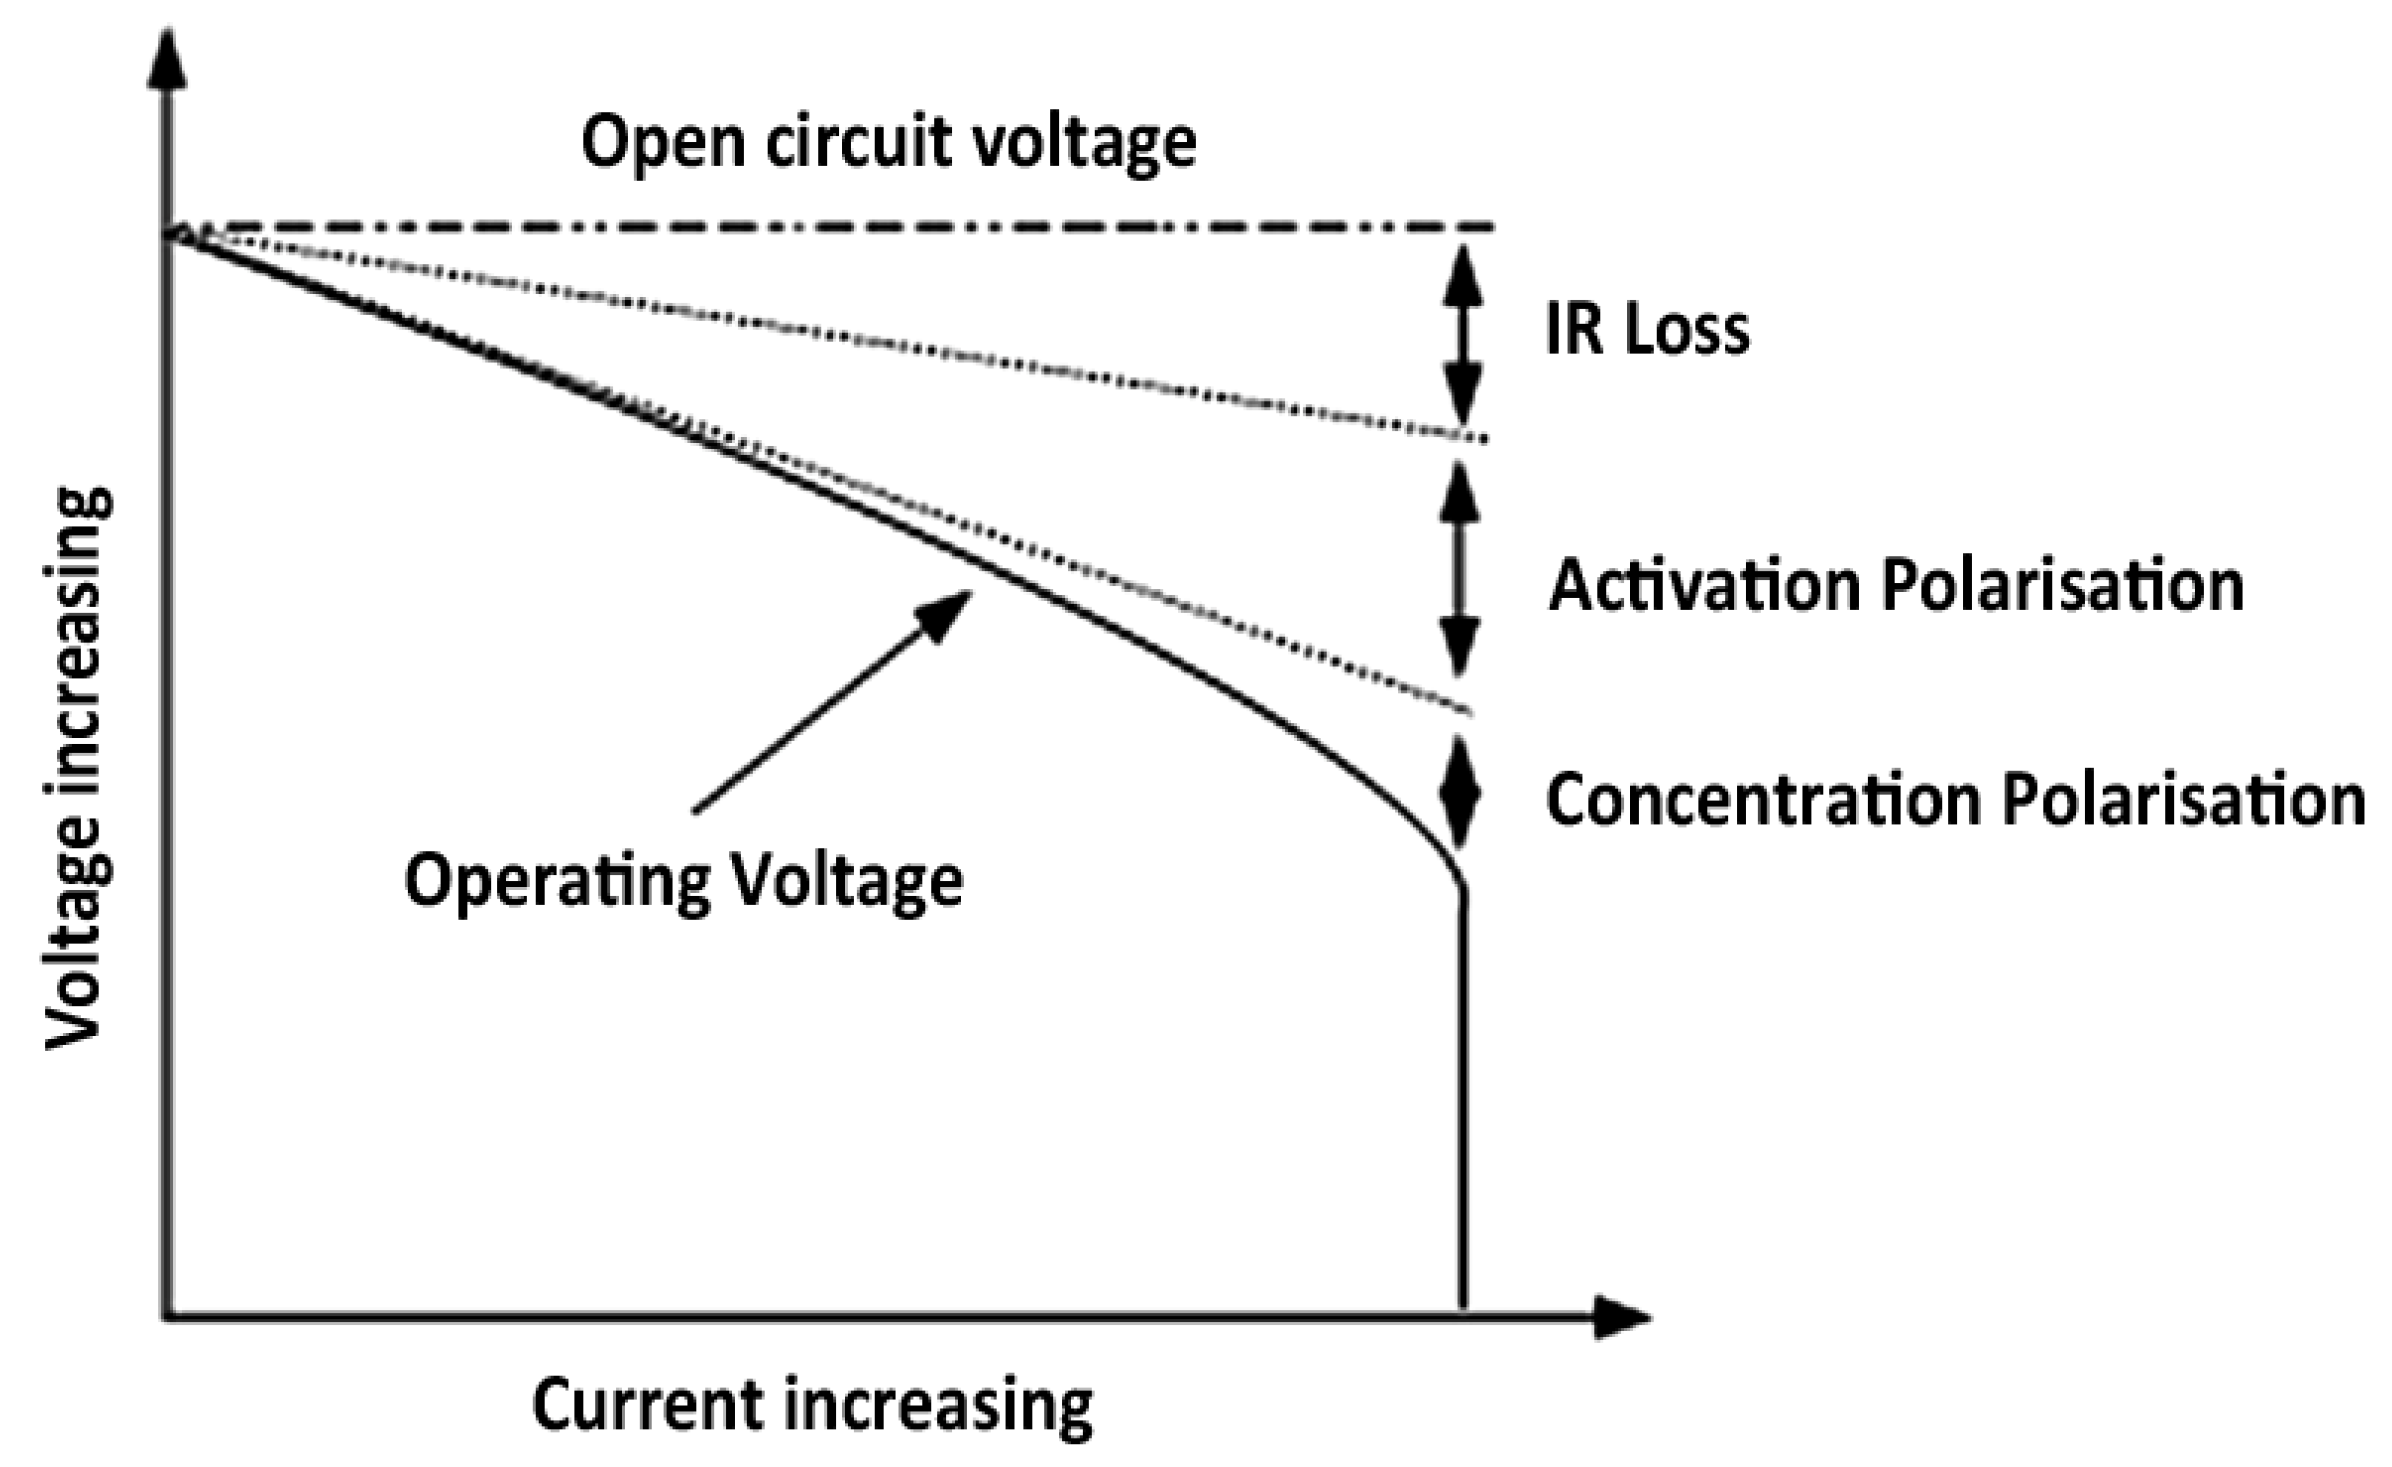
However, the capacity fade in batteries can be further related to the ohmic activation and concentration polarization phenomena (see
Figure 14).
The activation polarization occurs when the reactions of the electrodes do not perform perfectly. In order to make this possible, there is a need for some energy.
The effect of the concentration polarization is due to the concentration differences of the reactants at the electrode surface area. At higher current rates, the reactions in the battery cell should proceed very fast and therefore there is less time for the reactants to mix. Thus, a big difference in the concentration increases the internal resistance and energy losses. The influence of all these factors combined with the geometry of the electrodes in the high energy based battery cells result in the fact that battery falls to provide sufficient capacity at high current rates.
Figure 14.
Cell polarization in function of current rate [
71].
Figure 14.
Cell polarization in function of current rate [
71].
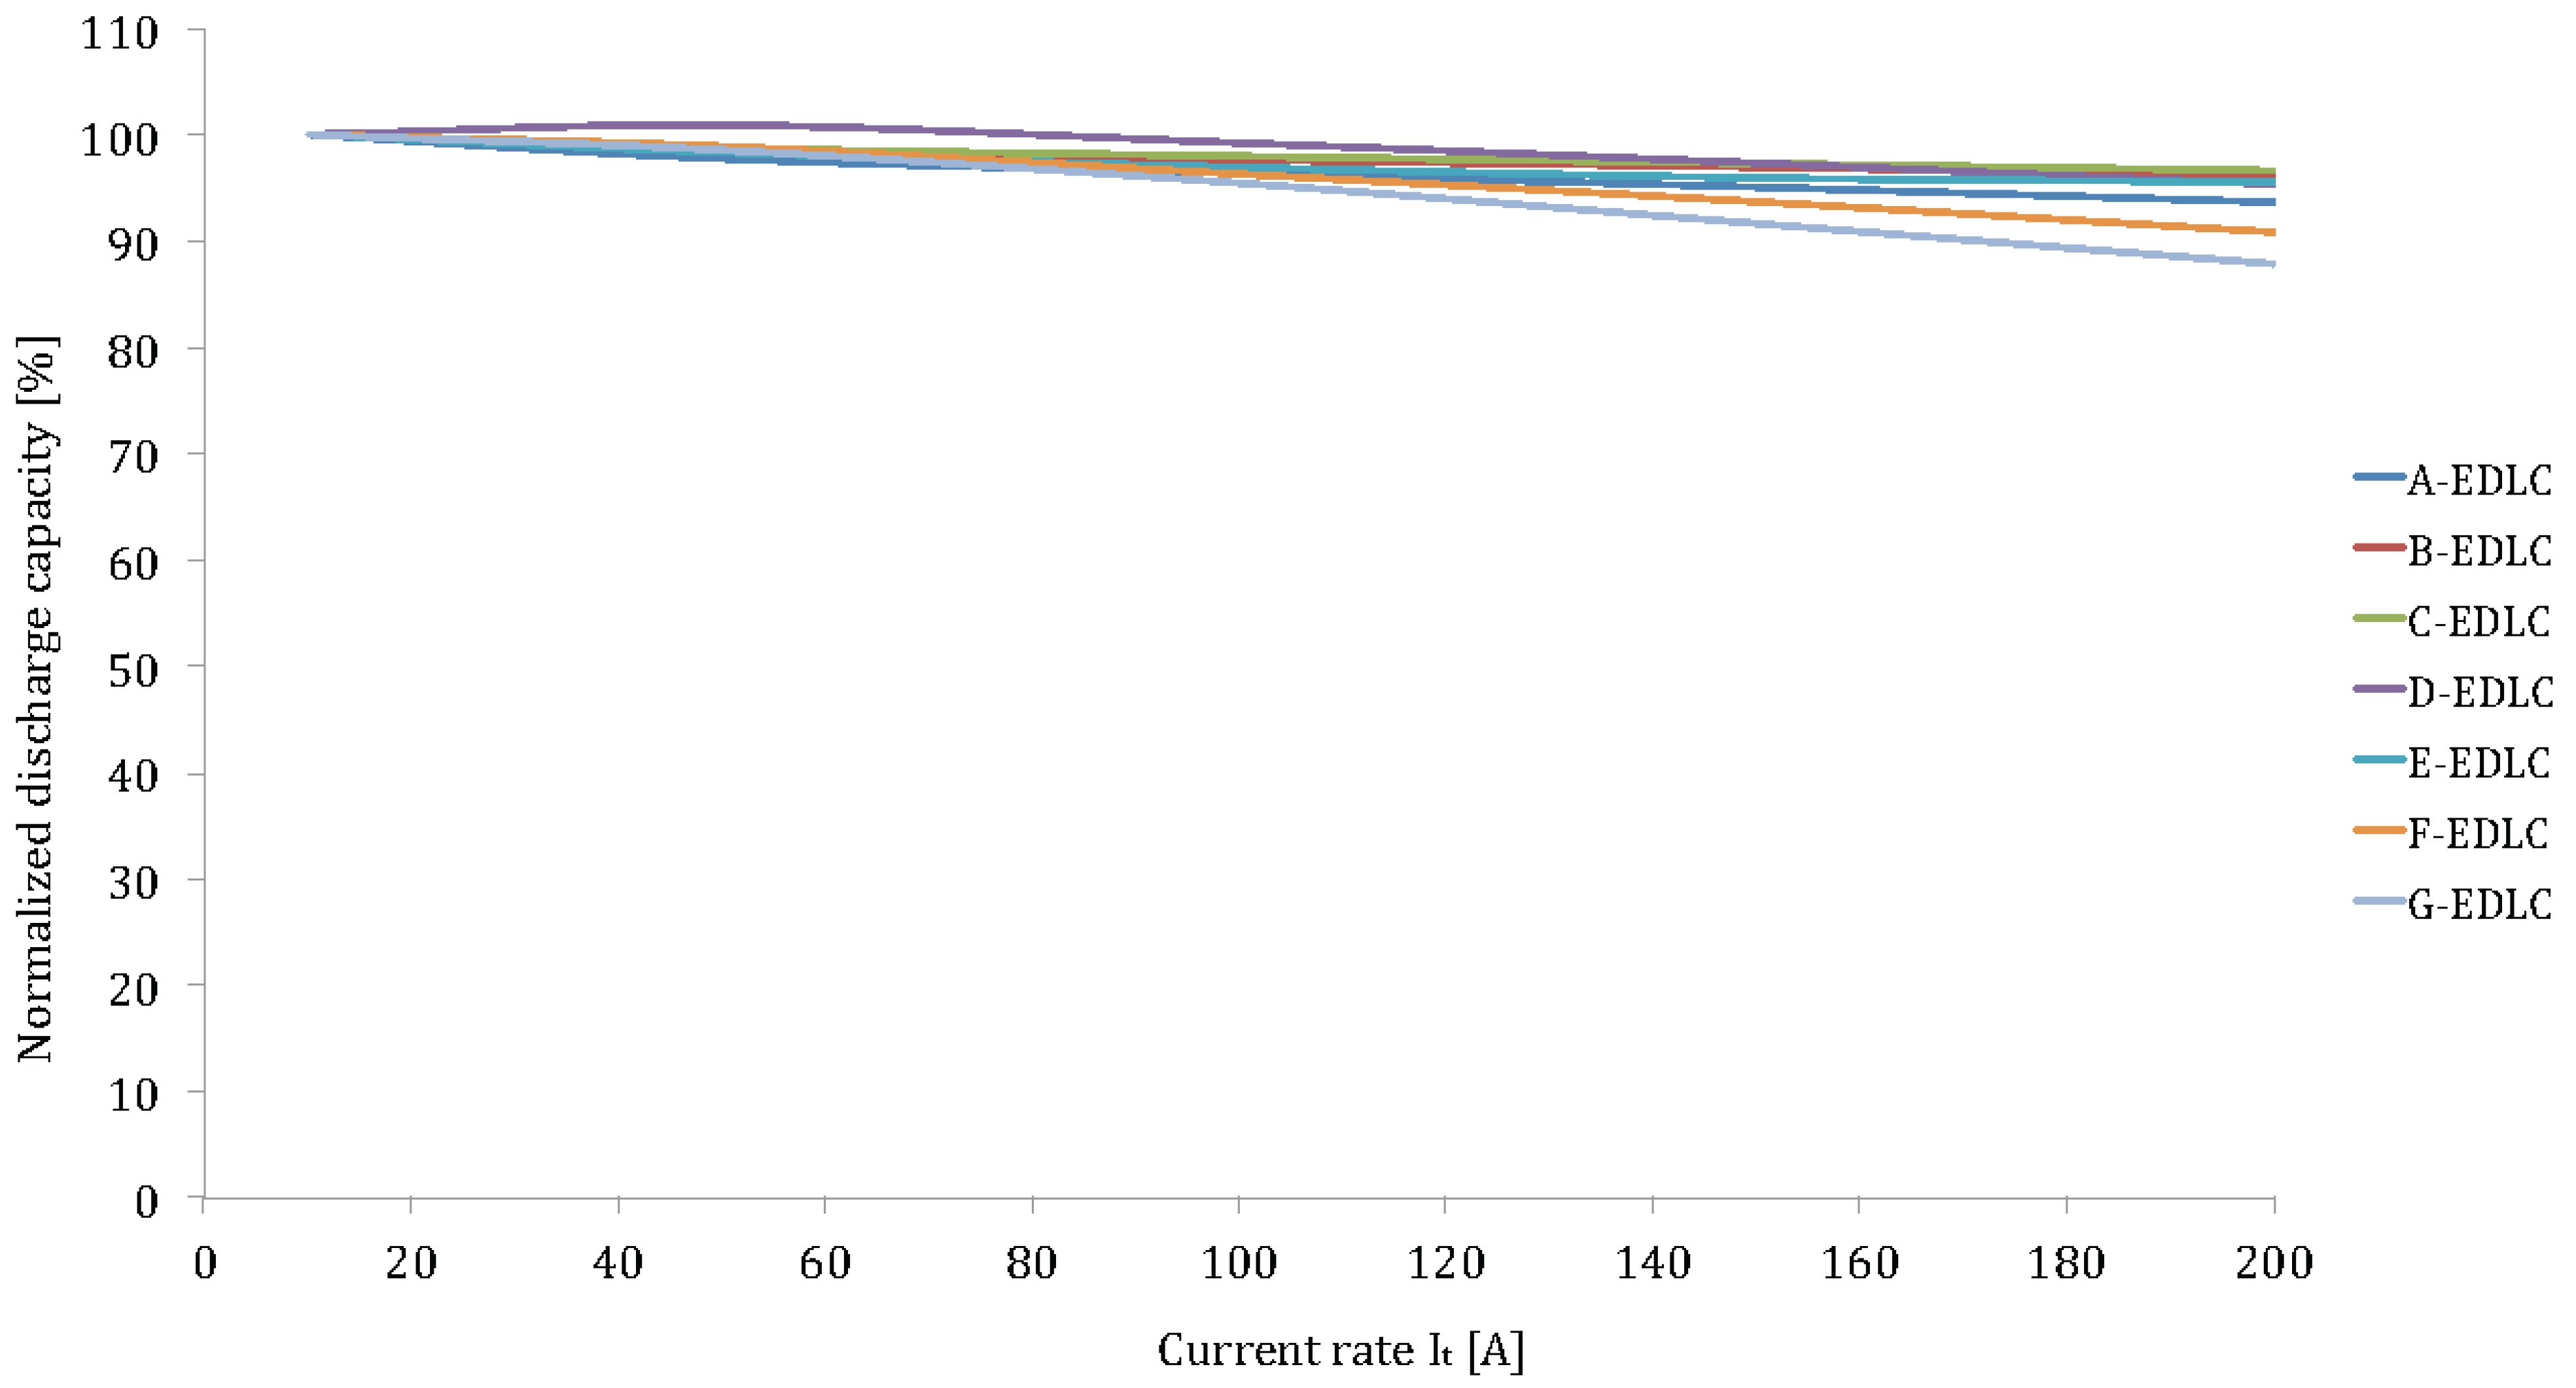
Figure 15.
Discharge rate capabilities of the investigated EDLCs.
Figure 15.
Discharge rate capabilities of the investigated EDLCs.
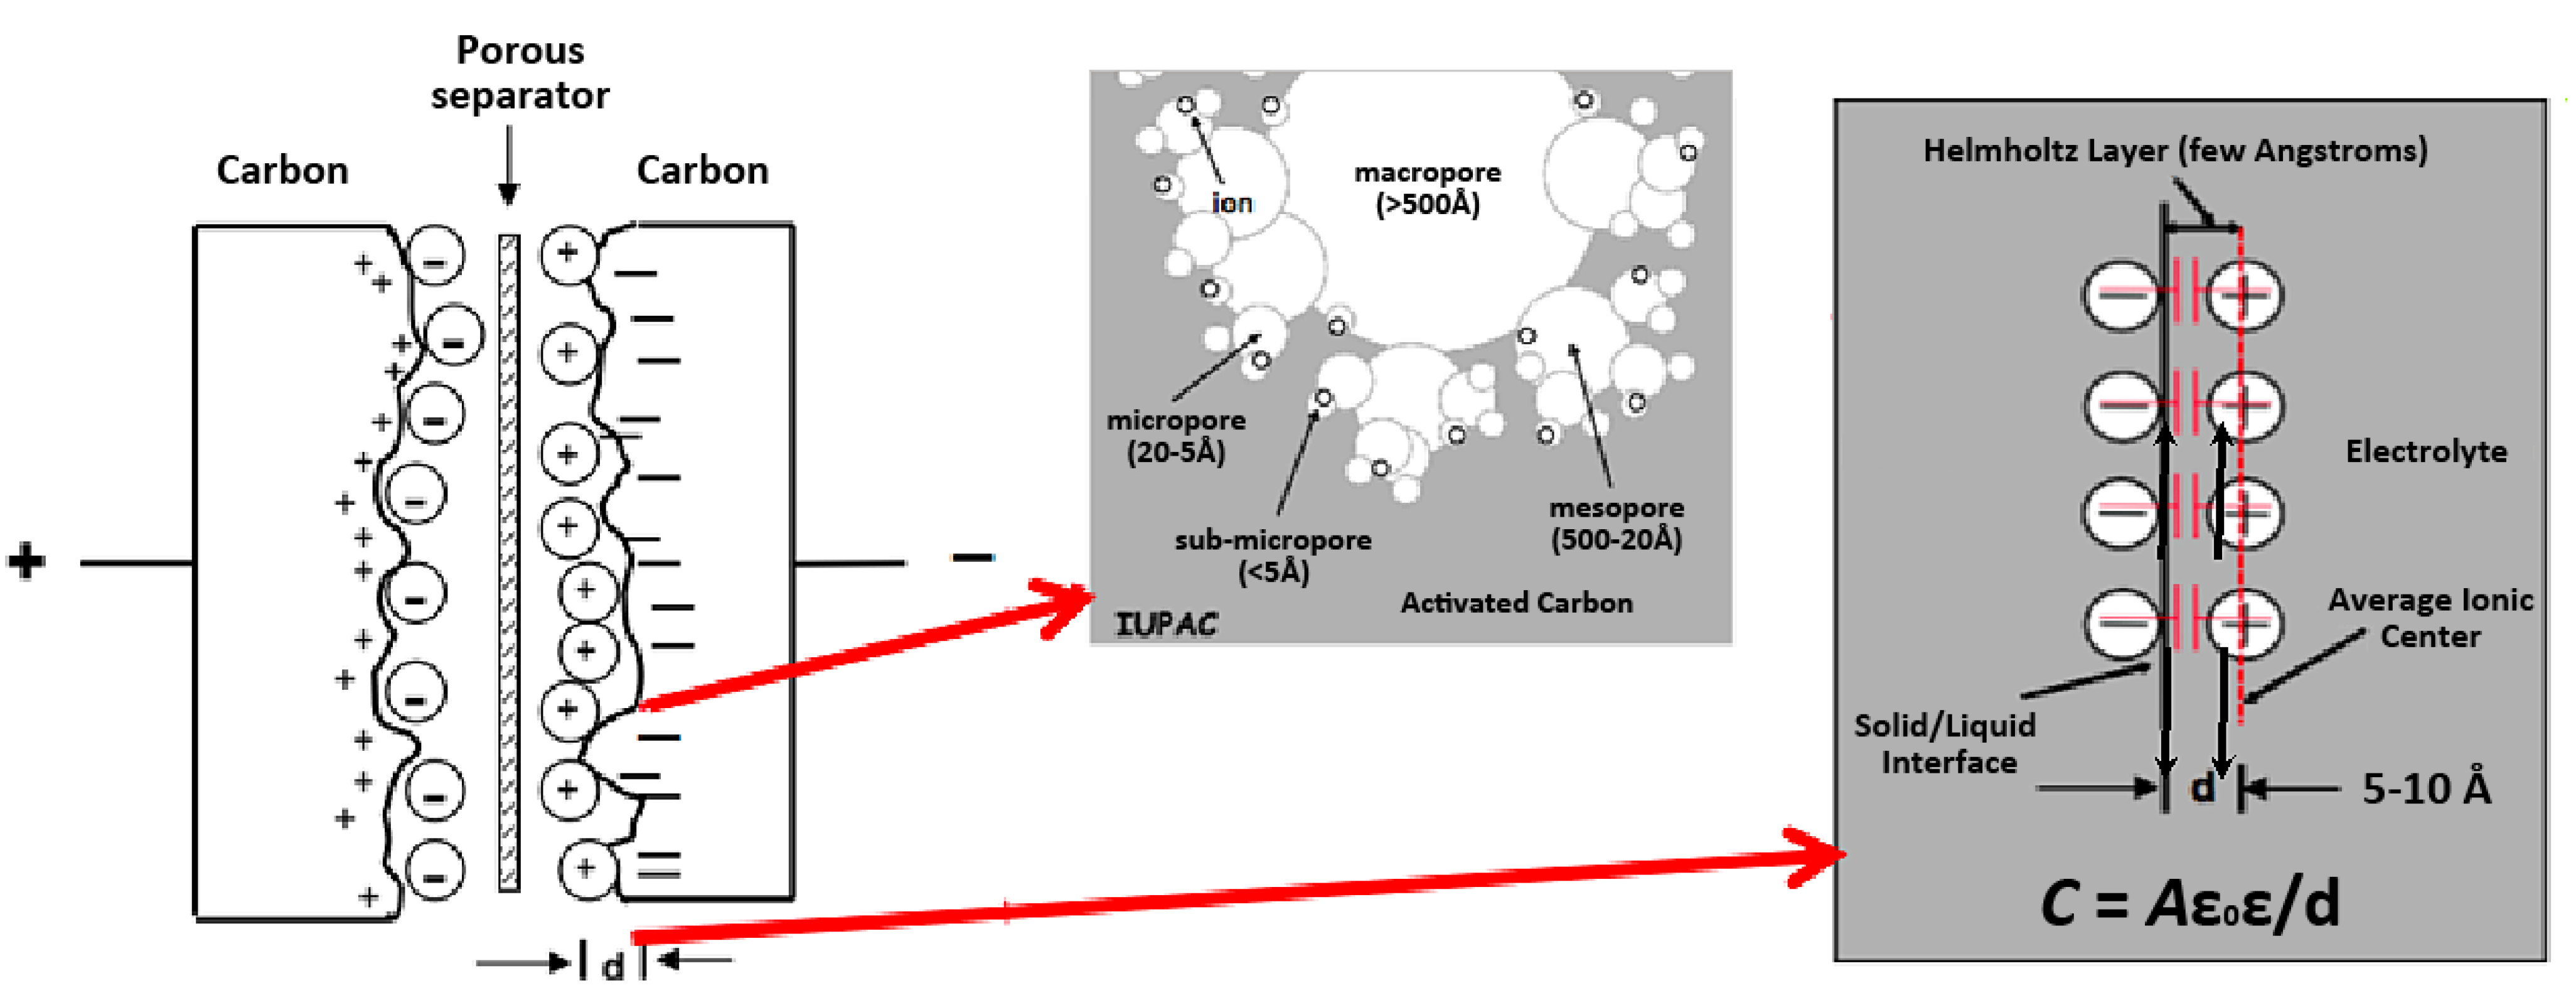
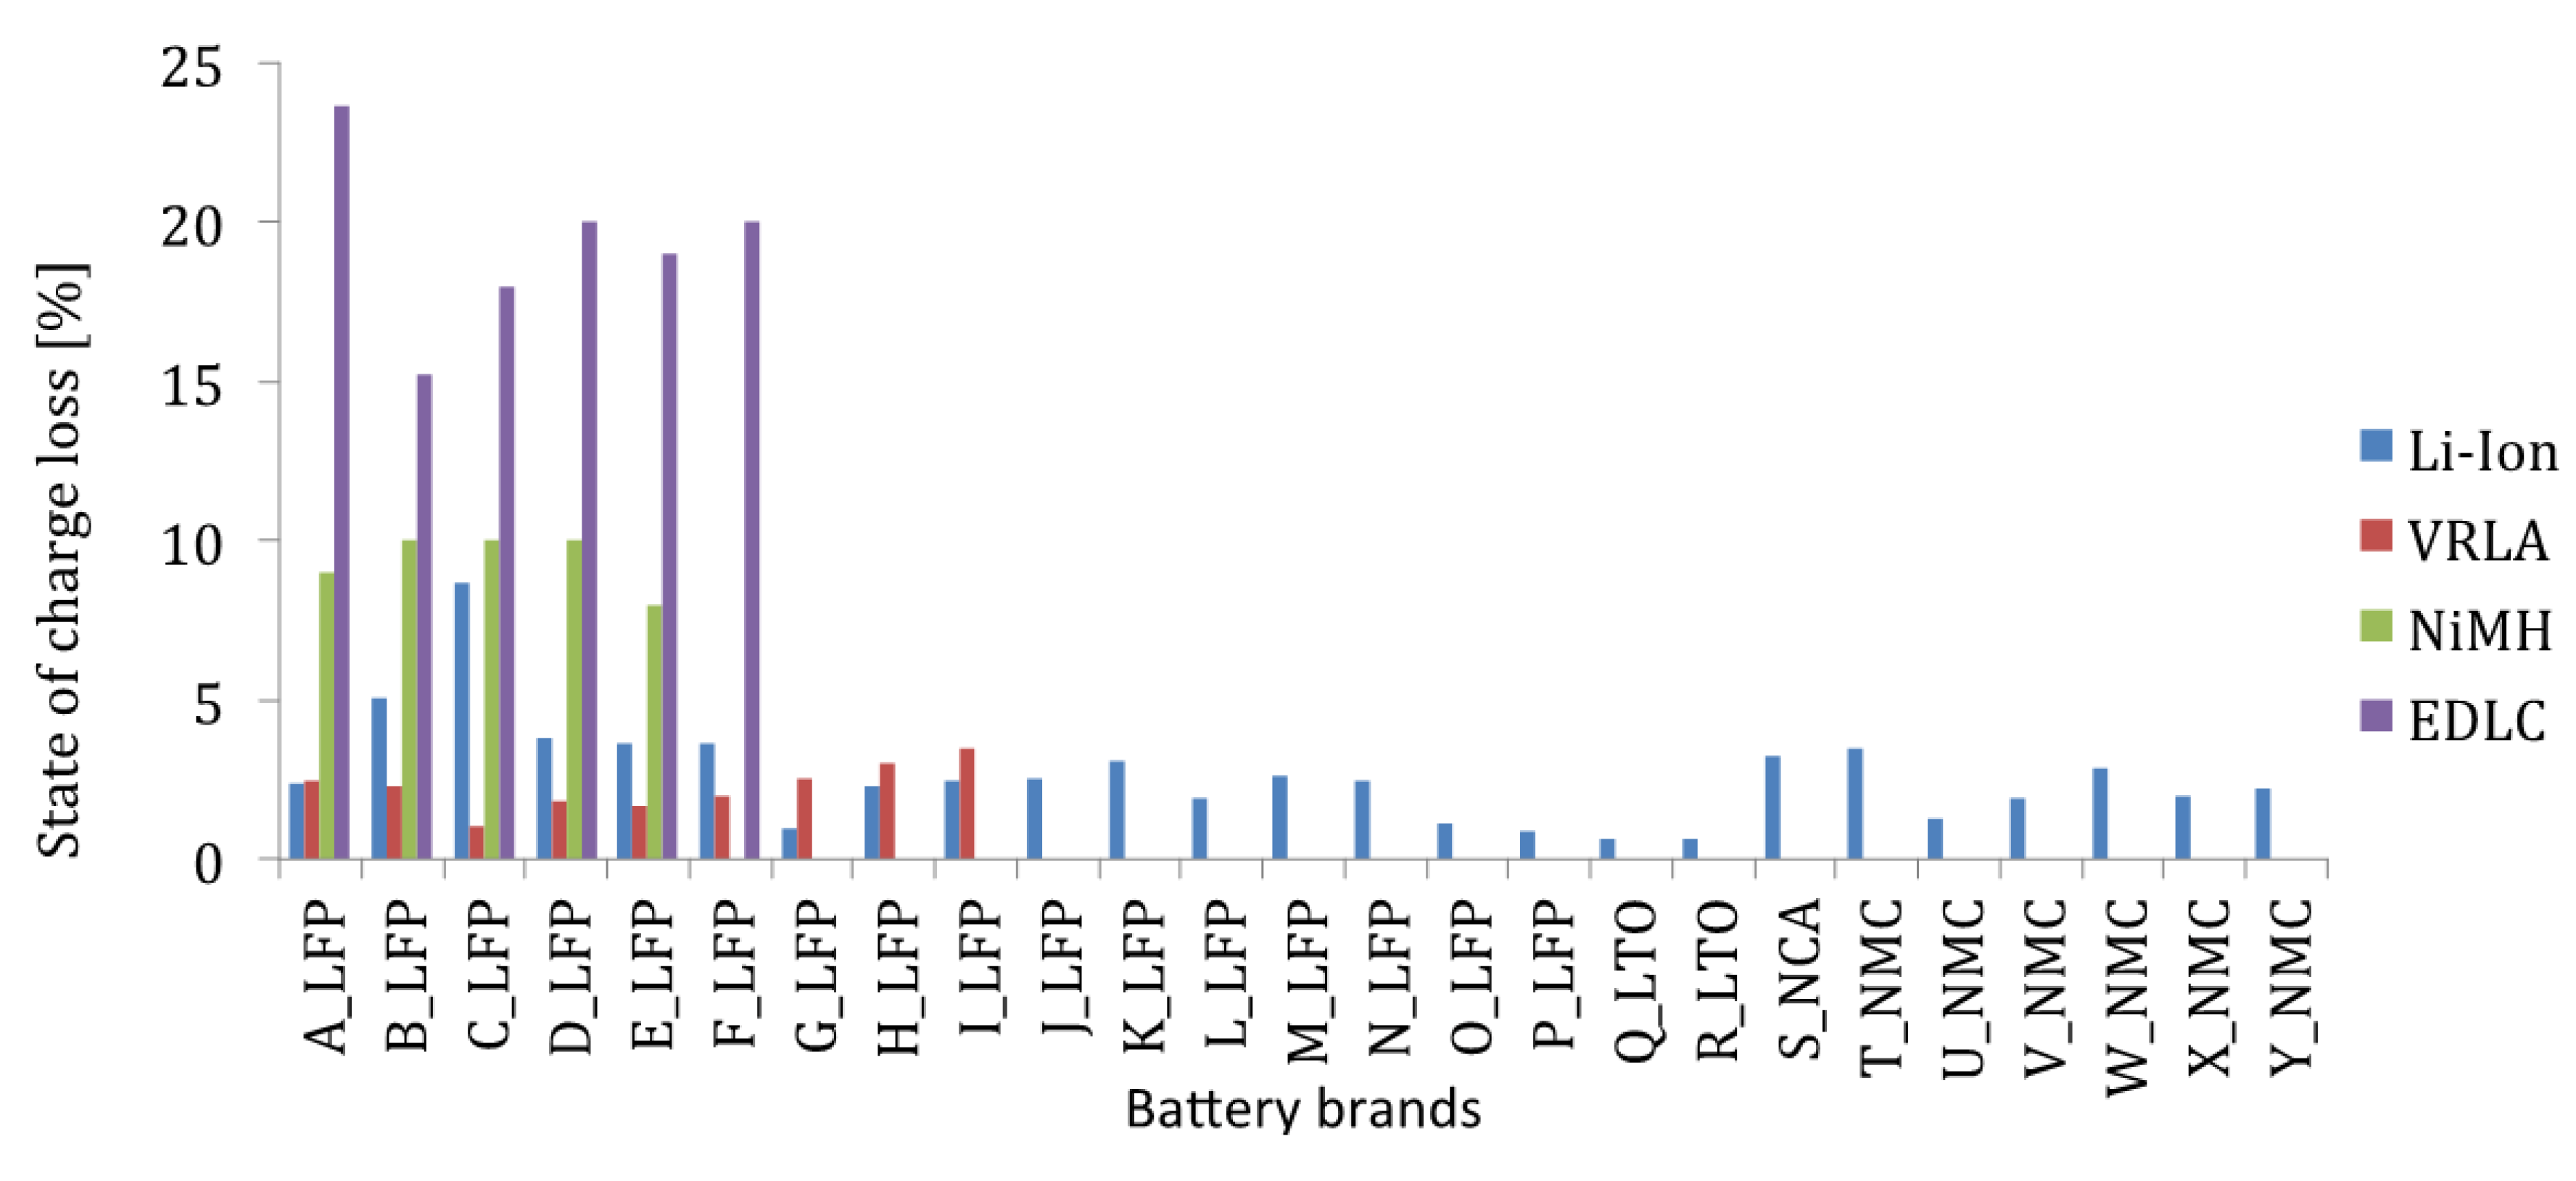
Unlike to lithium-ion batteries, EDLCs do not suffer of the high current rates. The capacity decrease at 200I
t is in the range of 5%–12% (see
Figure 15). This duration is due to the double-layer phenomenon as described before. The internal resistance is much lower and the rate of the reaction is much higher, because no chemical reaction occurs.
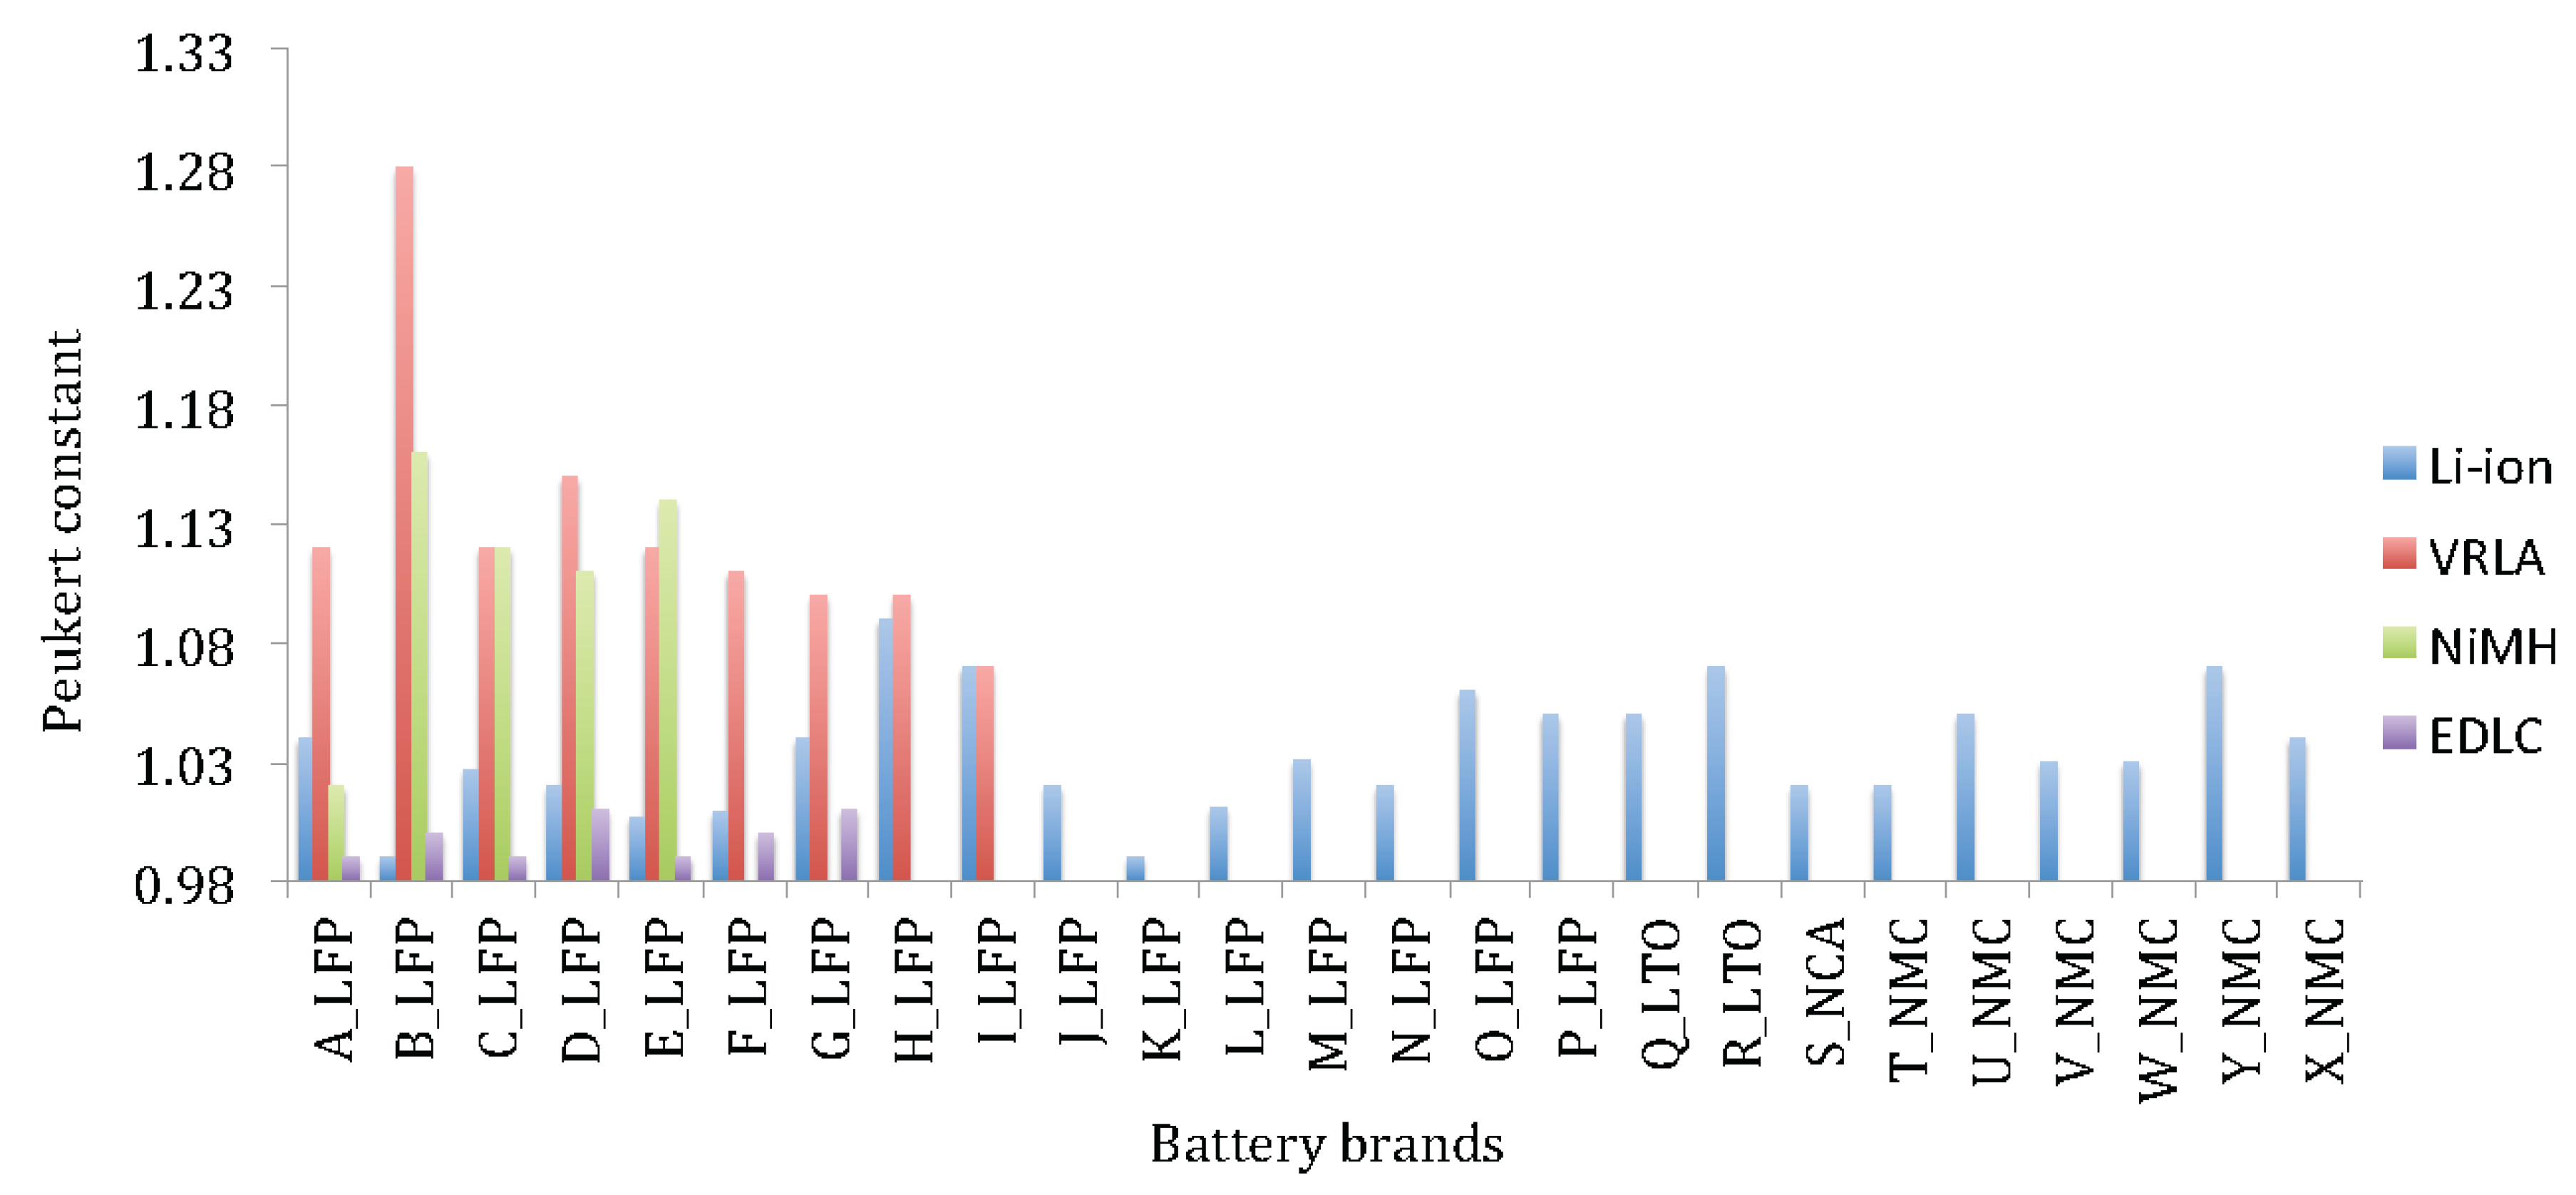
Based on this test, the Peukert value of each battery technology can be calculated. The Peukert equation is an empirical formula, which approximates how the available capacity of a battery changes according to the rate of discharge as expressed in Equation (3) [
72]:
where C
p is the theoretical capacity of the battery expressed in Ah, I
dis is the discharge current, T
dis the discharge time and k is the Peukert constant. This equation shows that at a higher discharge current, there is less capacity available in the battery. The Peukert constant indicates how well a battery performs under continuous heavy discharge current. A value close to 1 indicates that the battery performs well; the higher the value, the more capacity is lost when the battery is discharged at high current.
Figure 16 reveals that the Peukert constant for lithium-ion based batteries varies between 1 and 1.09. Particularly the battery cells with high rated capacity such as H-LFP, O-LFP, P-LFP and X-NMC, indicate the highest values.
Figure 16 exhibits the superior performances of lithium-ion technology against lead-acid and nickel-metal hydride batteries. The Peukert constant for the latter technologies is much higher between1.08 and1.15 with exception of VRLA brand B-VRLA that shows high value 1.28. Here it should be underlined that the Peukert constant has been derived by discharging the batteries at 1 I
t and 2 I
t until 100% DoD.
Figure 16.
Peukert constant of various lithium-ion battery brands.
Figure 16.
Peukert constant of various lithium-ion battery brands.
Furthermore, we can conclude that the current rates have a considerable high impact on the battery performances. This aspect should be taken into account particularly for modeling issues, where the battery models should be related to the current rate.
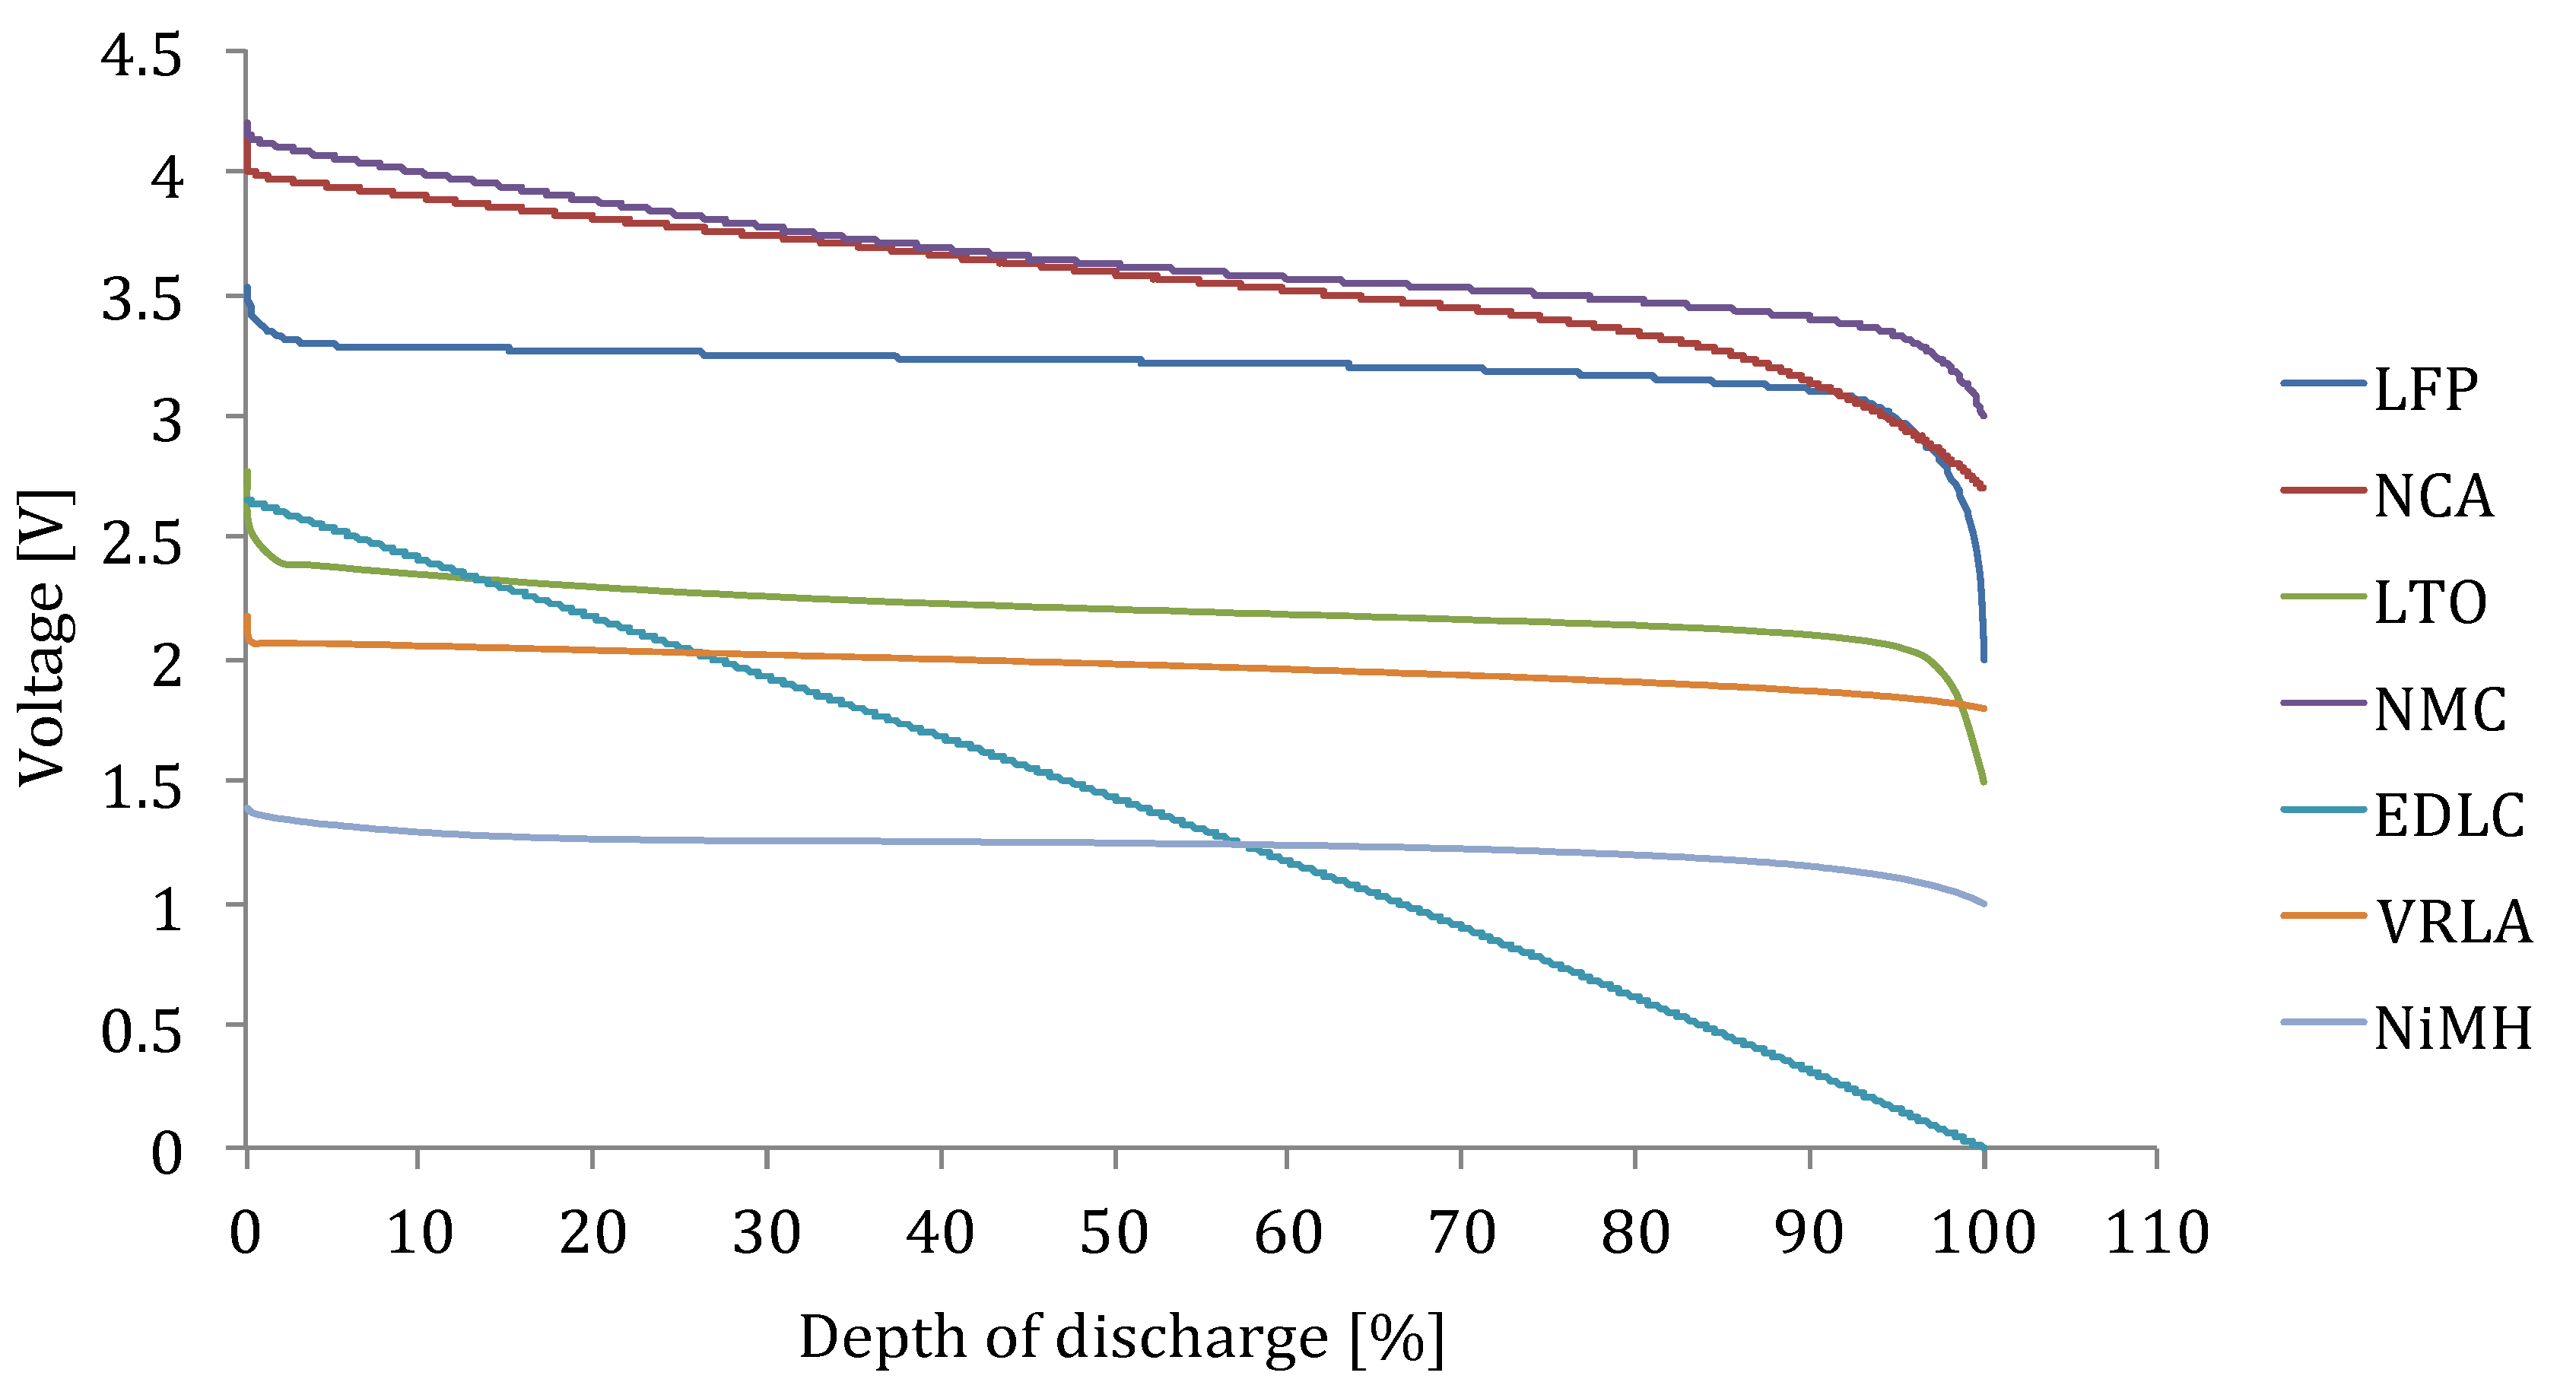
Figure 17 illustrates the discharge curves of the various lithium-ion chemistries, battery technologies and EDLC. Here, we recognize that the voltage shape for lithium iron phosphate based battery cells is different from the lithium titanate oxide, lithium nickel manganese cobalt oxide and lithium nickel cobalt aluminum oxide based cells. This result to the fact that the state of charge estimation based on voltage reading is much easier for NMC, NCA and LTO based battery cells than for LFP, which needs a well-dedicated prediction technique.
Figure 17.
Voltage versus depth of discharge.
Figure 17.
Voltage versus depth of discharge.
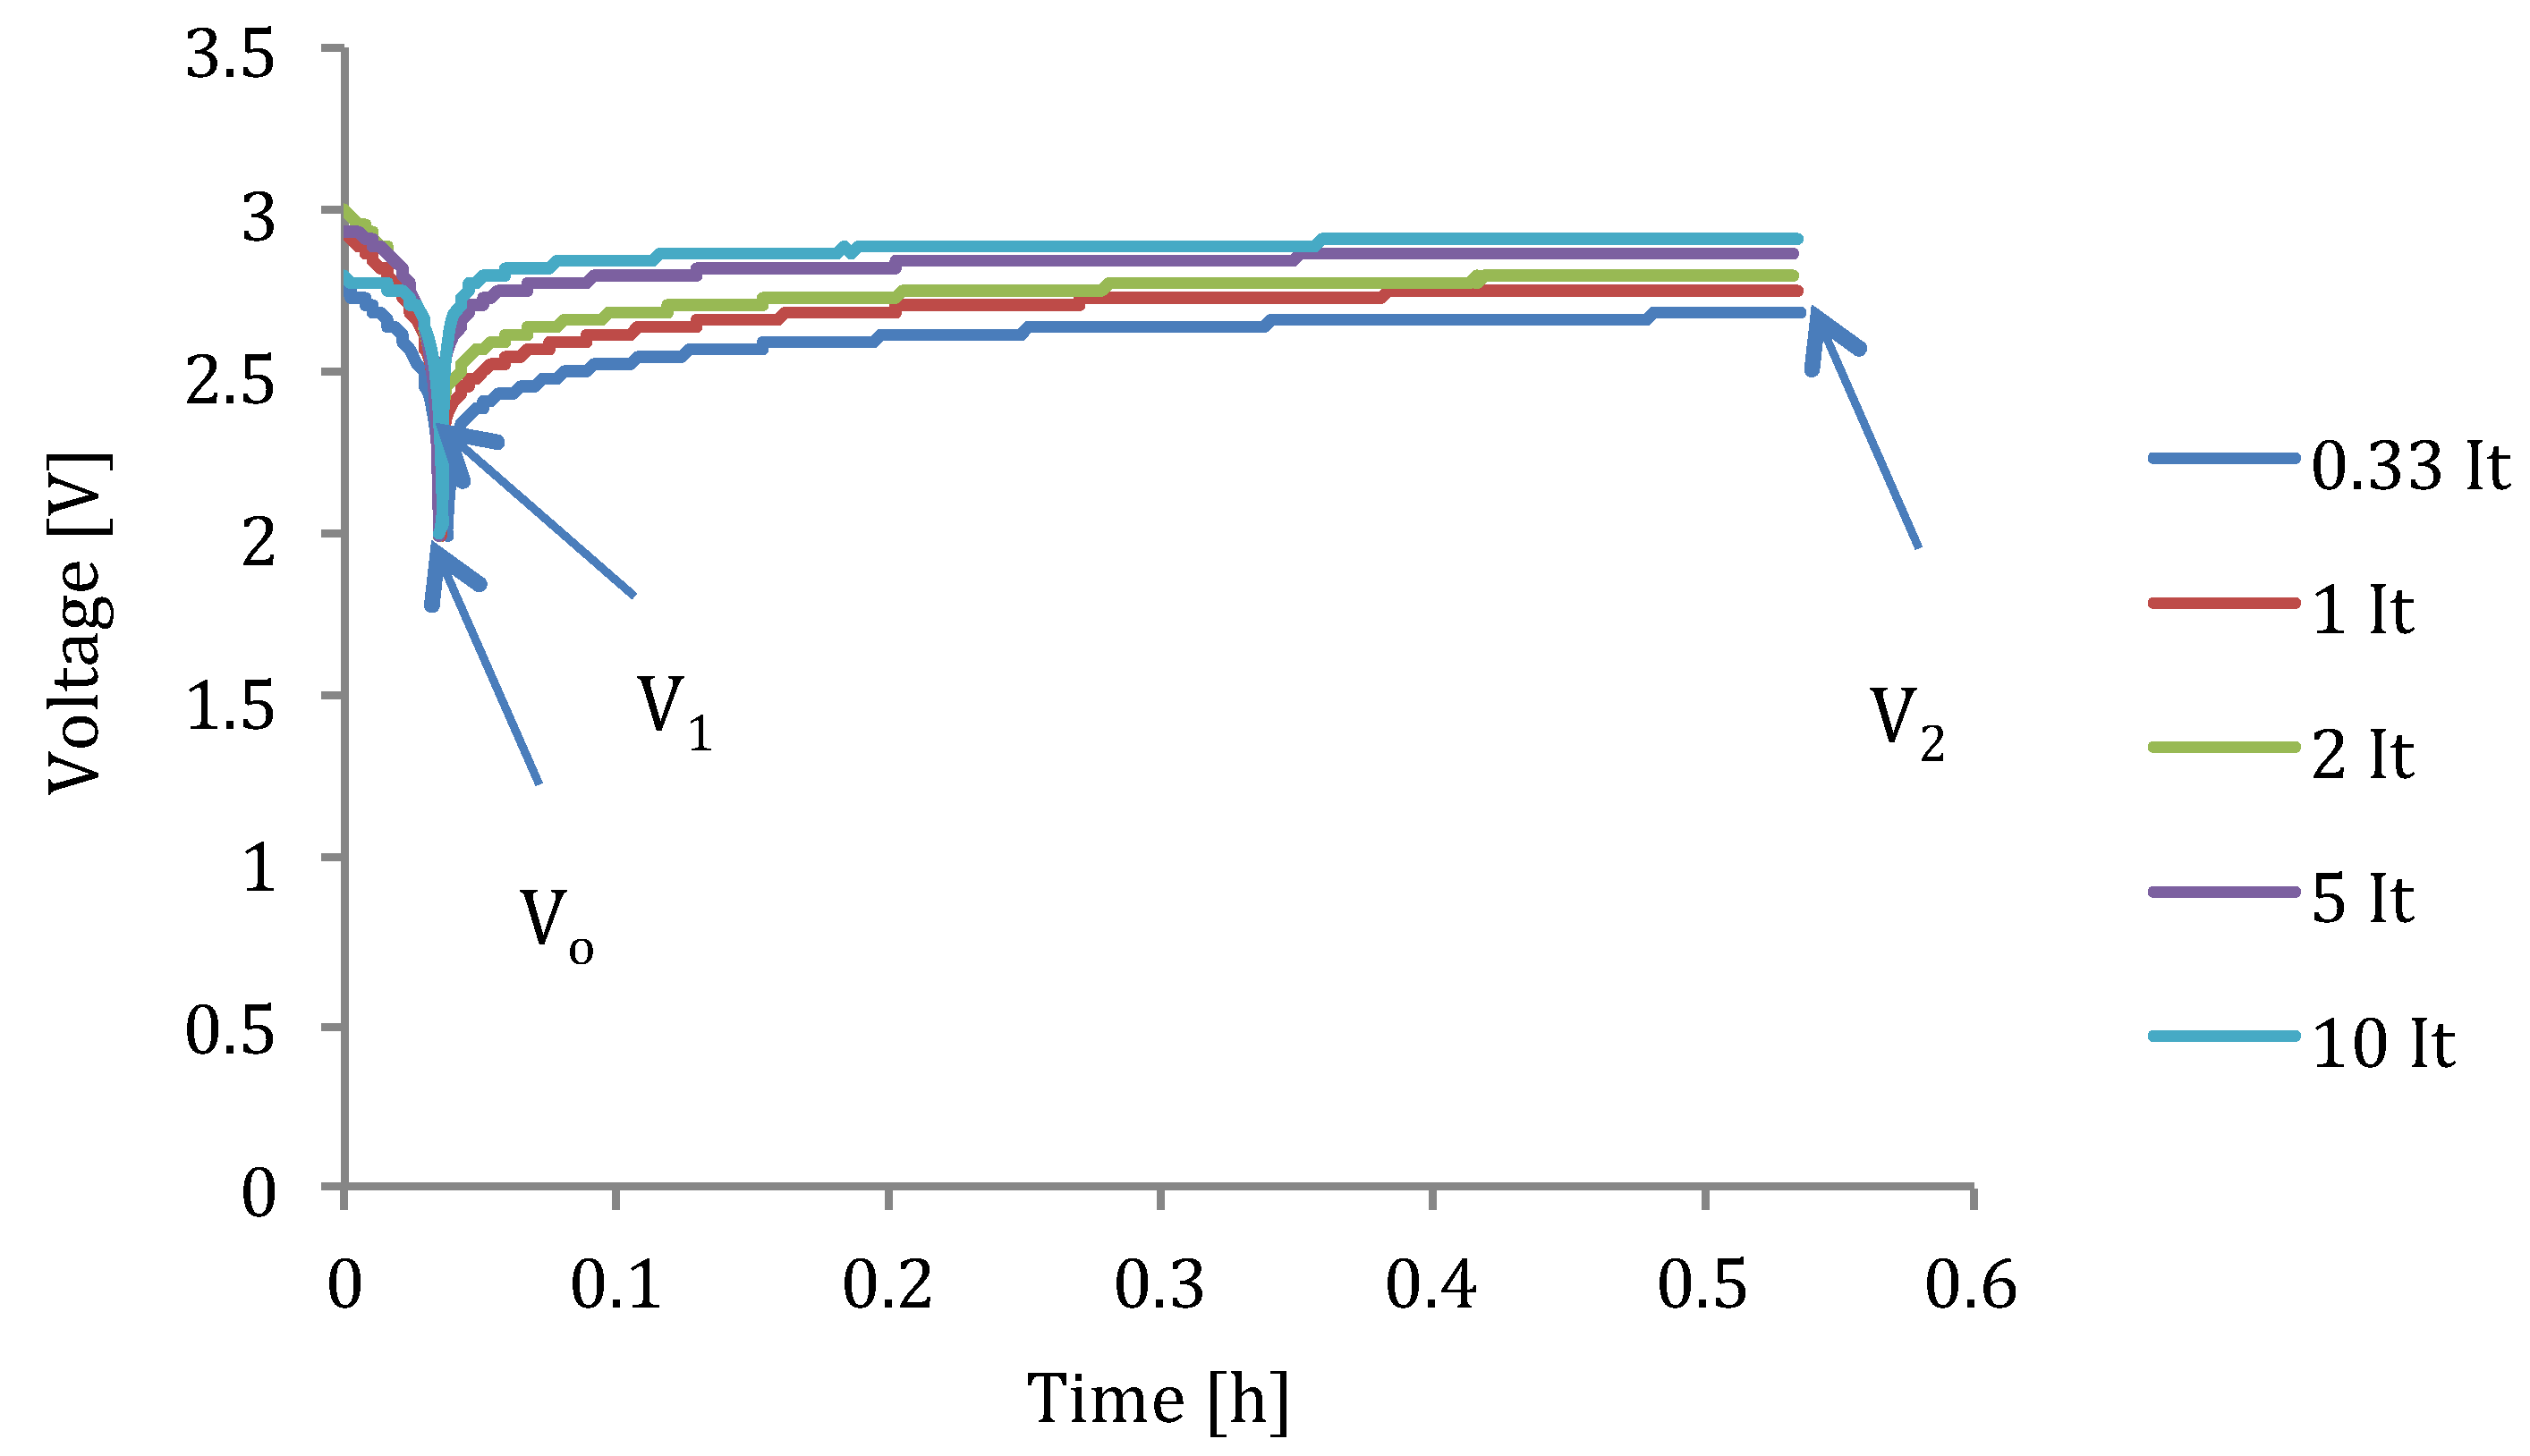
From the discharge capacity test, we assume that the battery is completely empty when the minimal voltage has been reached (V
0). However, at the end of the test, the voltage increases until it has reached the steady state condition (V
2). This issue can be achieved after 30 minutes depending of the current rates. From
Figure 18, we observe that the battery still has some additional capacity due to recovery phenomena. This means that the battery cell has still some capacity that can be provided at low currents. It should be noted that the recovery voltage raises the more the current rate increases. So, in order to include this phenomenon into a mathematical relationship, the following equation can be used:
where I
bat and T
s represent the employed battery current and the sampling time. While I
nom and n stand for the nominal current and Peukert number. For lead-acid batteries, the nominal voltage depends on the manufacturer’s specifications. In some cases, the manufacturer specifies a C
5, C
10 or C
20. The number in this notation stands in for the discharge time in hours. As example the nominal current of a battery with a capacity of 57 Ah (C
5) is 11.4 A. However, for lithium-ion batteries, the nominal current is 1I
t.
One of the challenges in battery modeling is the reflecting of the different relationships inside a battery. In order to represents this characteristic by a mathematical way, the least-square method (LSM) has been used:
According to this method, the logarithmical relationship can be extracted:
with equation coefficients at 0.33 current rate: a: 0.0808; b: 2.7486.
Figure 18.
Recovery phenomenon of LFP based battery cell (A-LFP).
Figure 18.
Recovery phenomenon of LFP based battery cell (A-LFP).
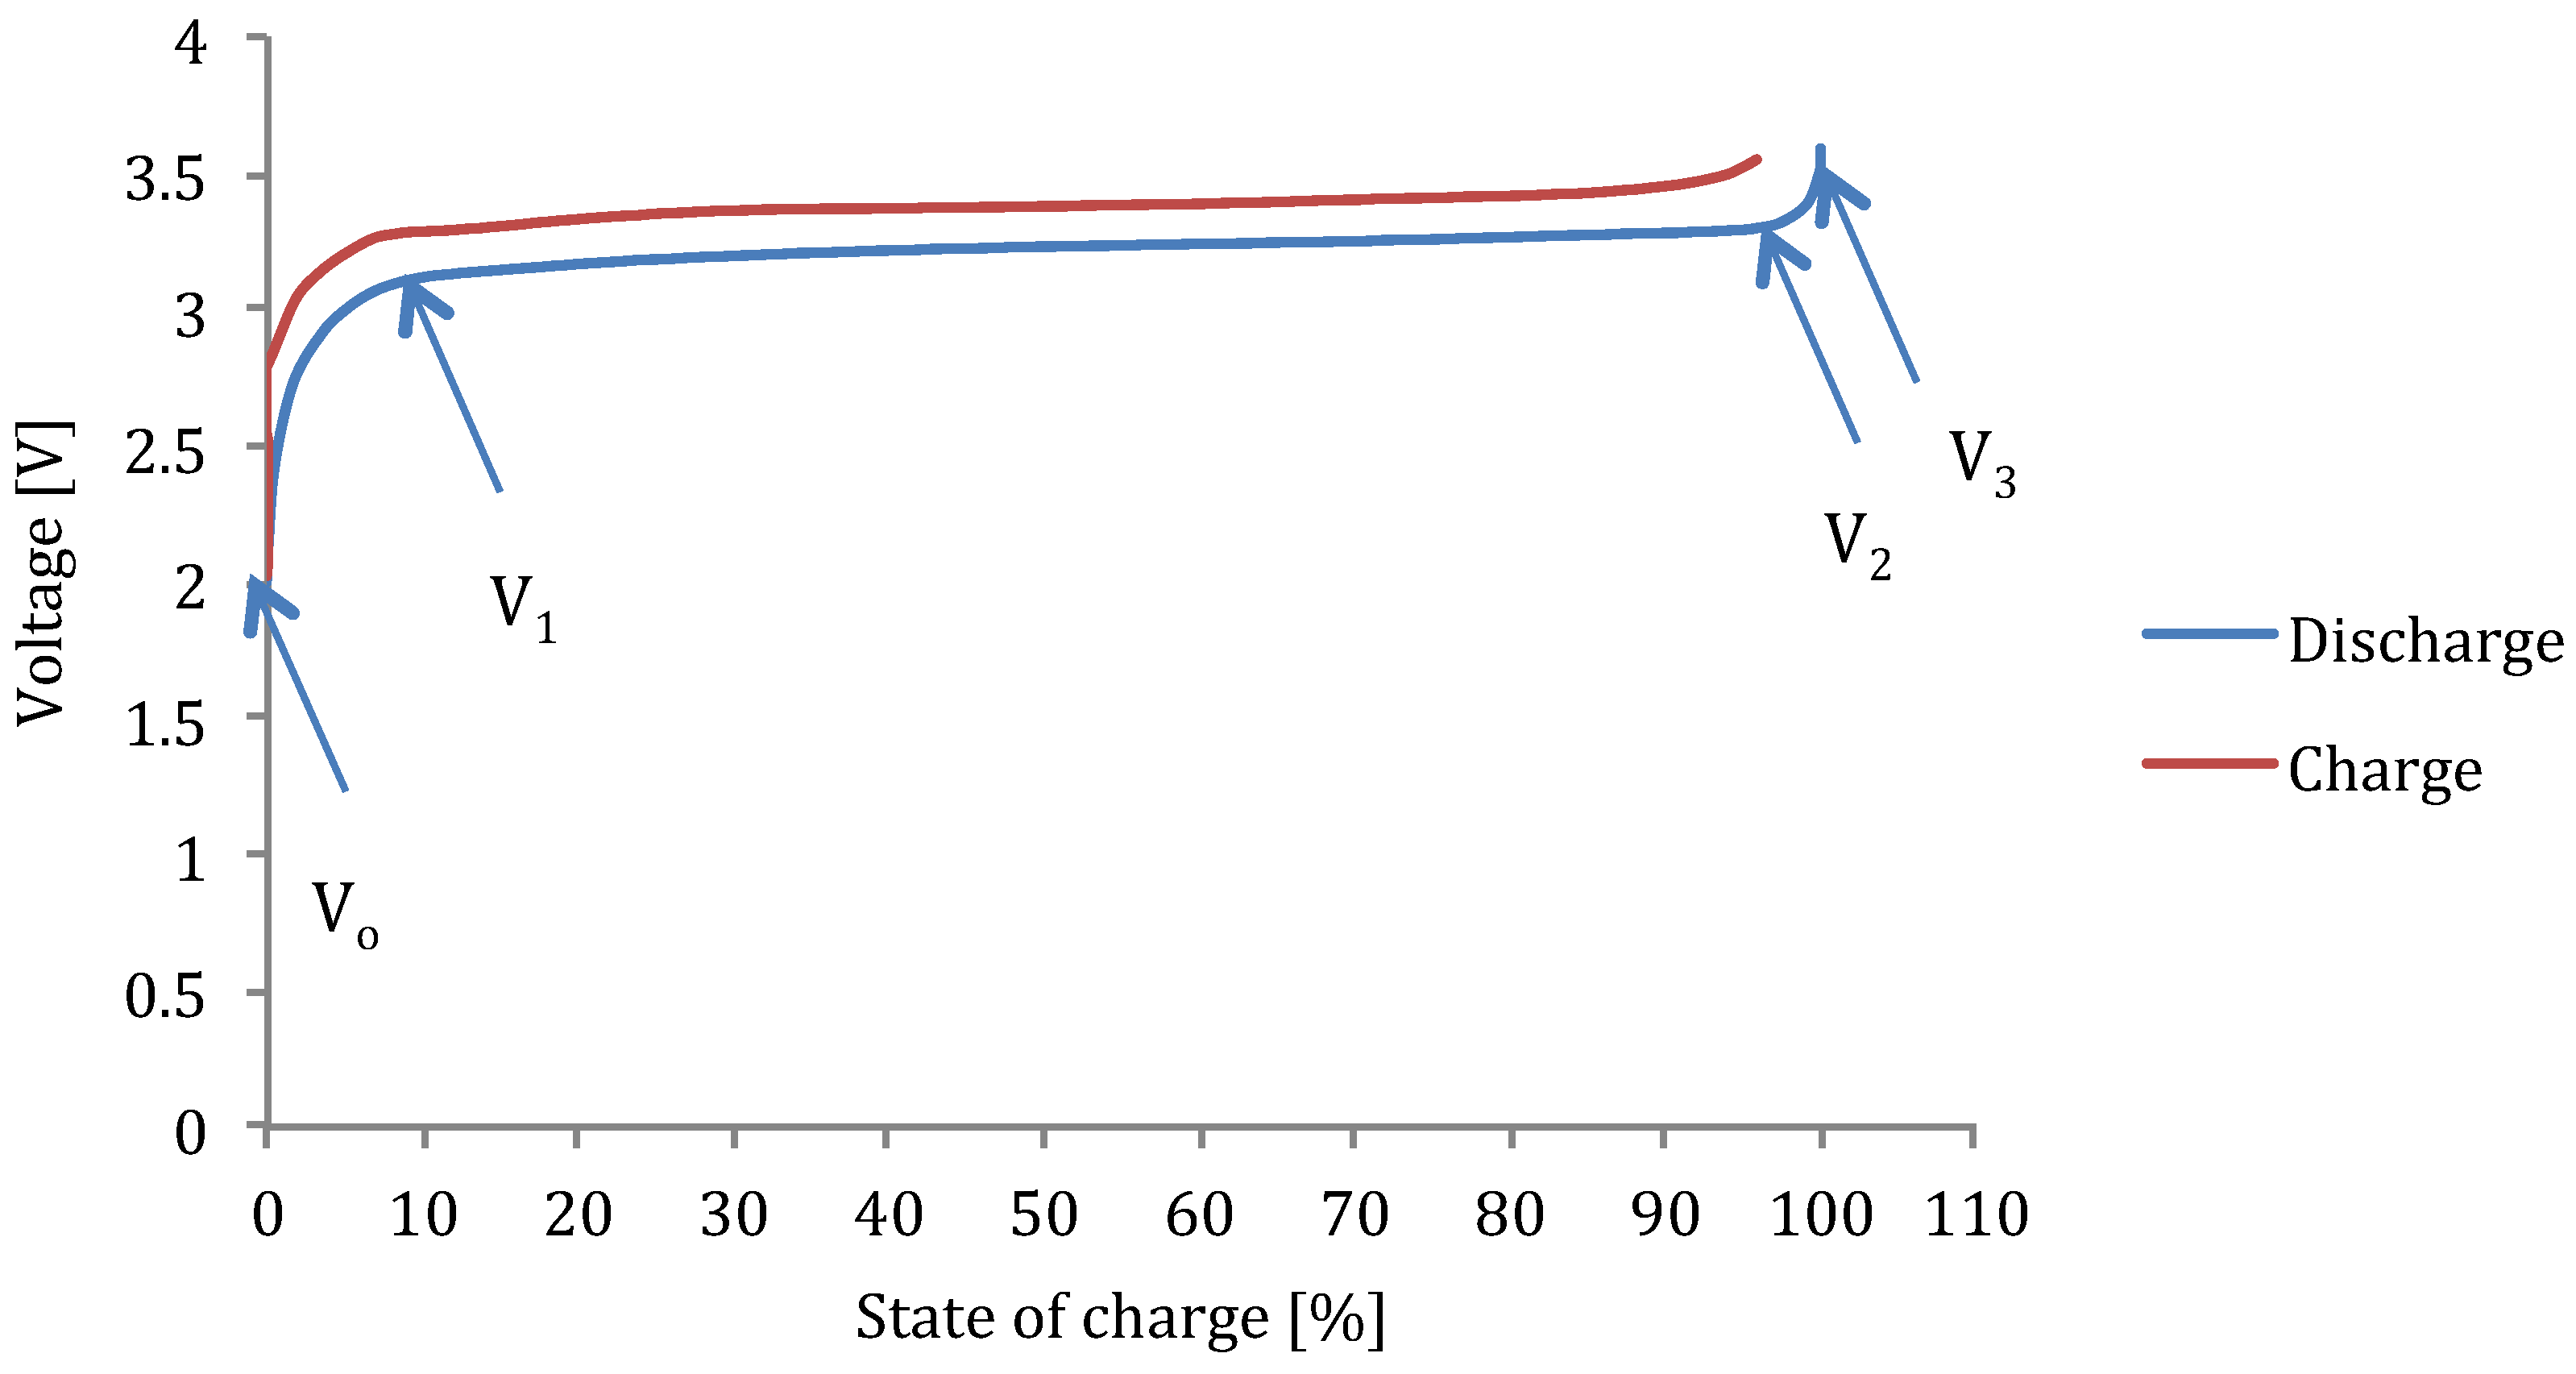
On the other hand, the nonlinear characteristics of a battery become more complex by considering the hysteresis as presented by
Figure 19. As we observe, the voltage evolution during charge differs from the discharge. This means that the charge/discharge reactions do not occur identically. In addition, these curves diverge the more the current rates raises.
Figure 19.
Hysteresis lithium-ion battery brand A-LFP.
Figure 19.
Hysteresis lithium-ion battery brand A-LFP.
In order to represent this by a mathematical relationships, the relationship between V0 and V1, V2 and V3 can be described by first order model or polynomial equation, where the part between V1 and V2 can be considered as a linear equation.
2.2.2. Charge
In order to enhance the suitability of the battery technology in PHEV applications, the battery requires, besides good power, energy and energy efficiency performances, also acceptable fast charging capabilities. Most of the commercial battery electric vehicles are typically charged with a current of 16 A taken from the grid [
73,
74,
75]. This means that the charge process for PHEV applications will take several hours (around 6 to 8) until the battery has been full charged. Van den Bossche defined three charging speed levels [
75]:
Standard charging (3.7 kW);
Semi-fast charging (7.2 kW);
Fast charging (>22 kW);
Ultra-fast charging up to 250 kW).
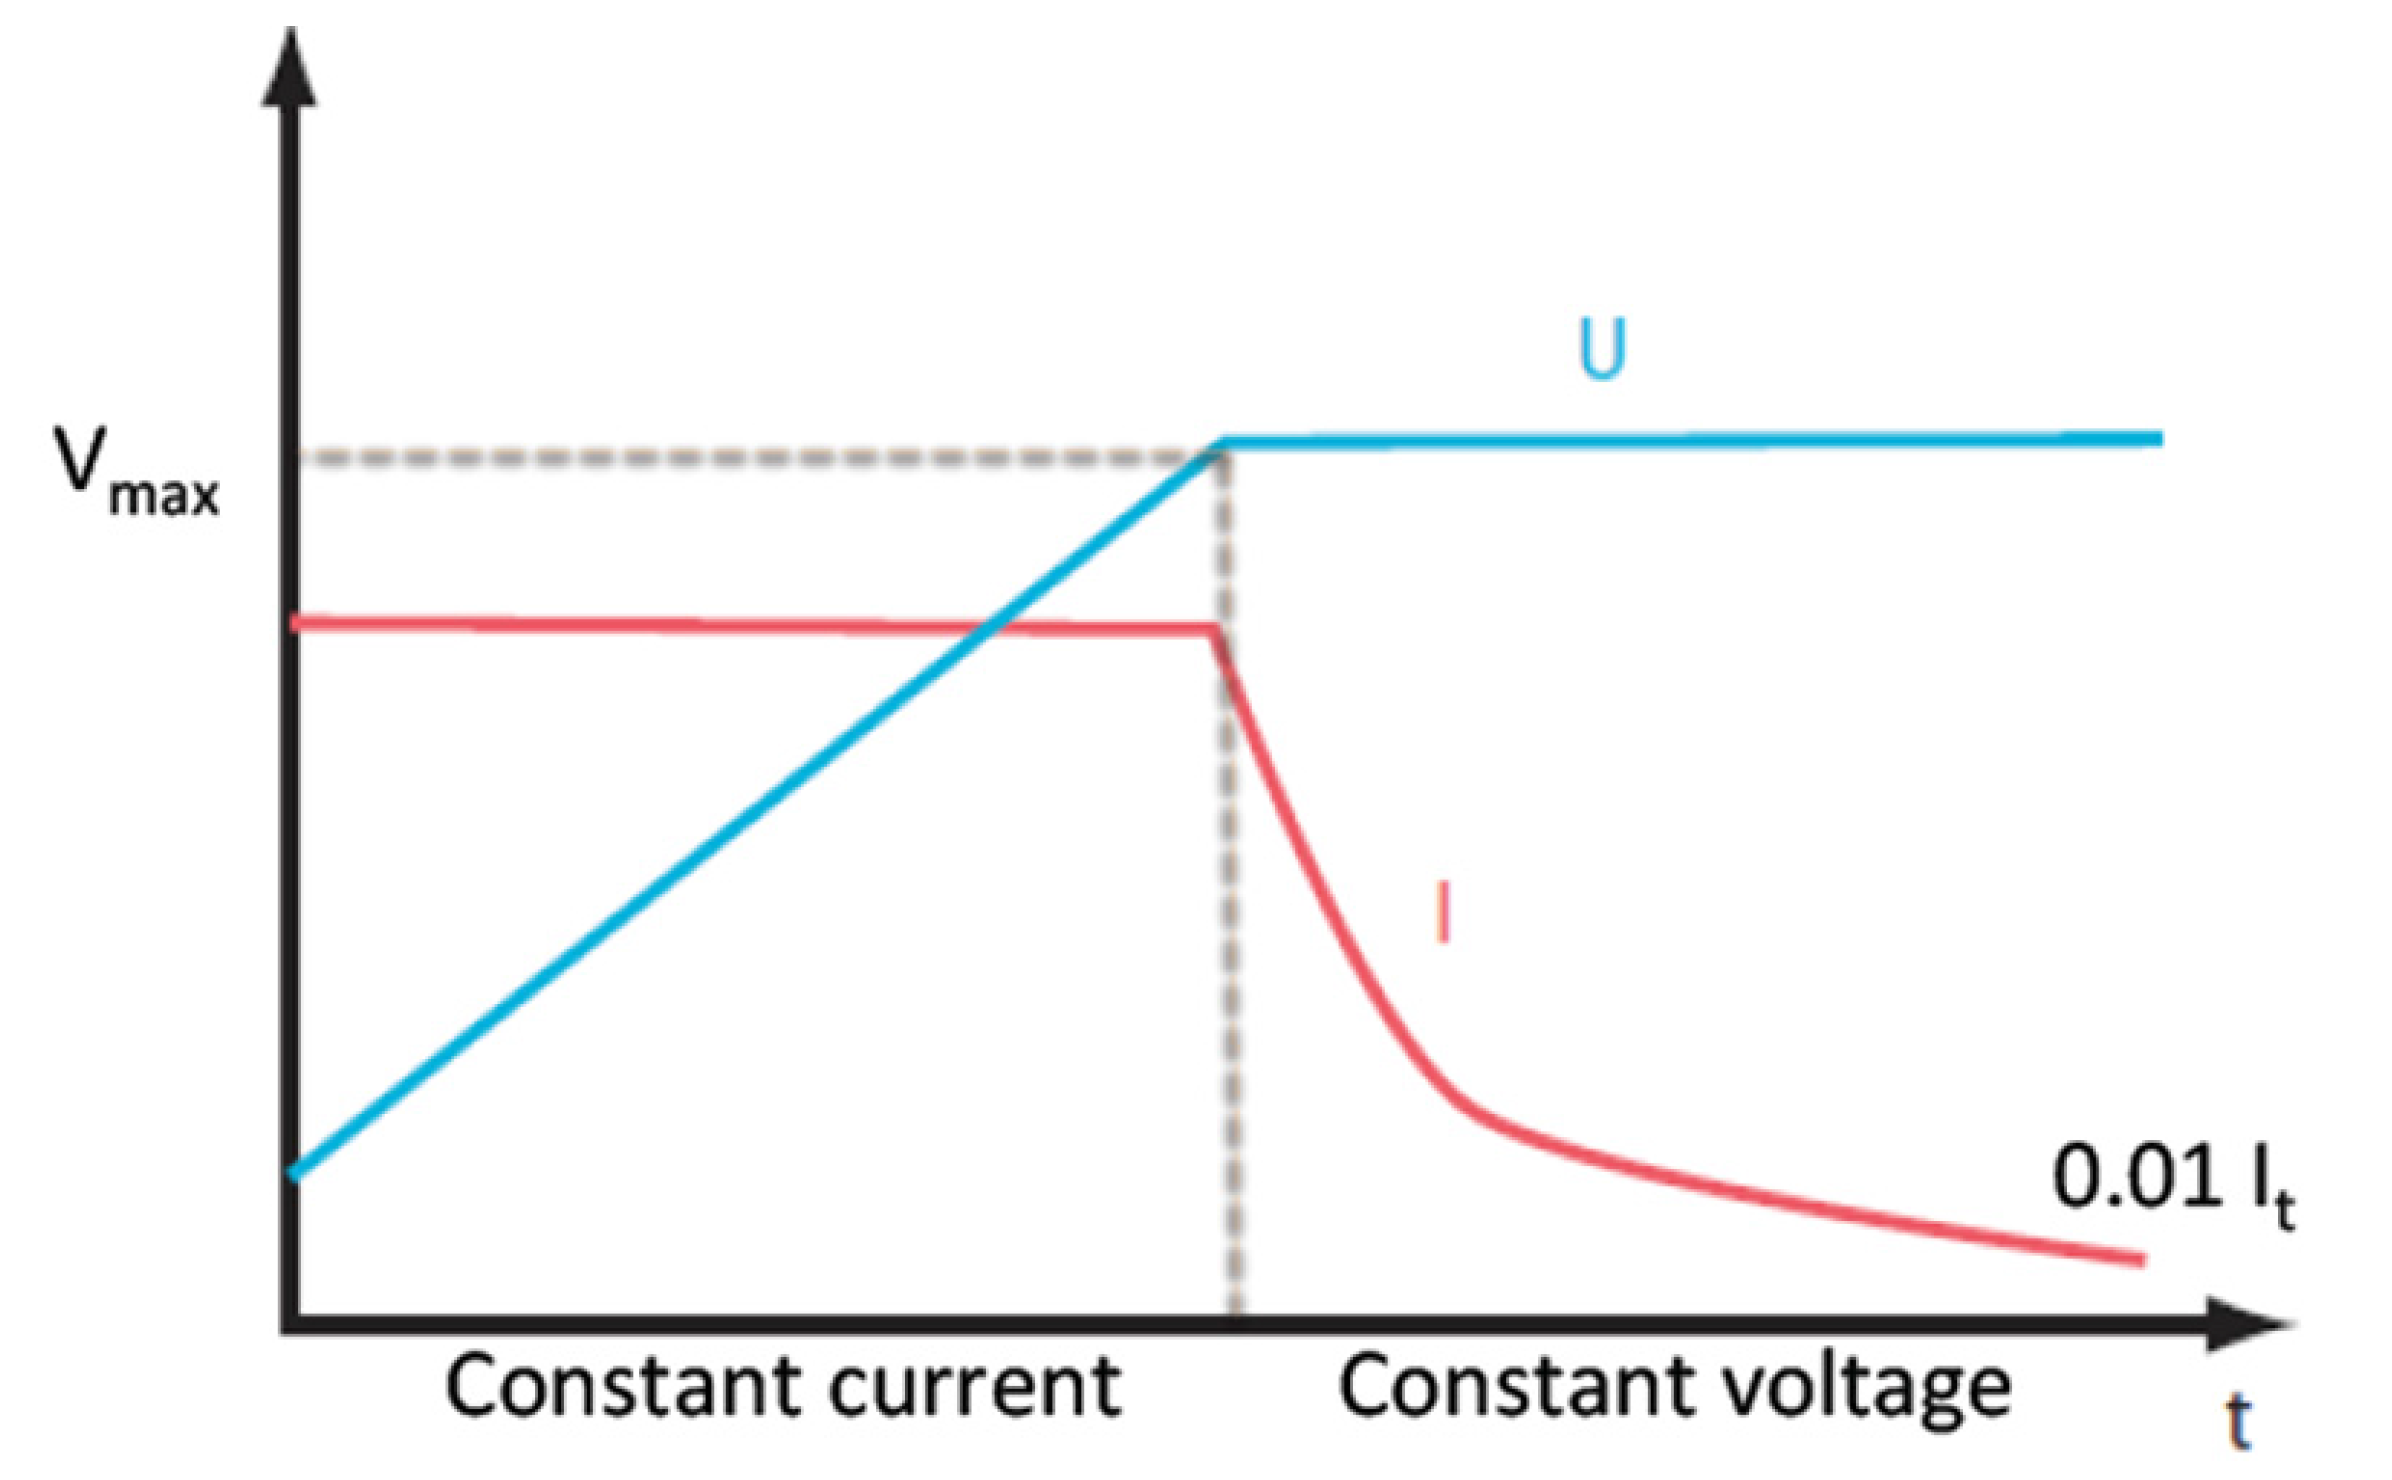
In [
75], it is reported that the charging process of battery typically involves in two phases as it is presented in
Figure 20:
The main charging phase, where the bulk of energy is recharged into the battery;
The final charge phase, where the battery is conditioned and balanced;
Figure 20.
Charging process [
75].
Figure 20.
Charging process [
75].
The standard charging mode uses a power level corresponding to the standard power outlets in residential installations. In most European countries, these outlets are rated at 230 V/16 A.
Semi-fast charging mode still makes use of higher power levels still available in residential settings (corresponding to e.g., and electric range) In USA this is called “Level 2” charging. Higher power can be achieved by a high current single phase connection or with three phase connections, 3 × 400 V, with 16 A per phase yielding up to 11.1 kW at unity power factor:
This power level also can be increased up to 22.2 kW by using 32 A instead of 16 A.
In [
75], several power levels for semi-fast charging are reported with the corresponding rated voltage and current. Fast charging uses specific heavy infrastructures for transfer the high power level. Therefore, the power transfer can be performed by d.c. or a.c. connection between the vehicle and the charging post. Fast charging mode is proposed for power levels up to 250 kW [
73]. According to reference [
74], an electric vehicle can be charged in less than 10 minutes.
Several charging modes have been defined in the standard IEC61851-1 [
76] and are extensively documented in [
76]. In this section, only the main charging phase has been considered at different charge current rates (0.33I
t, 1I
t, 2I
t and 5I
t).
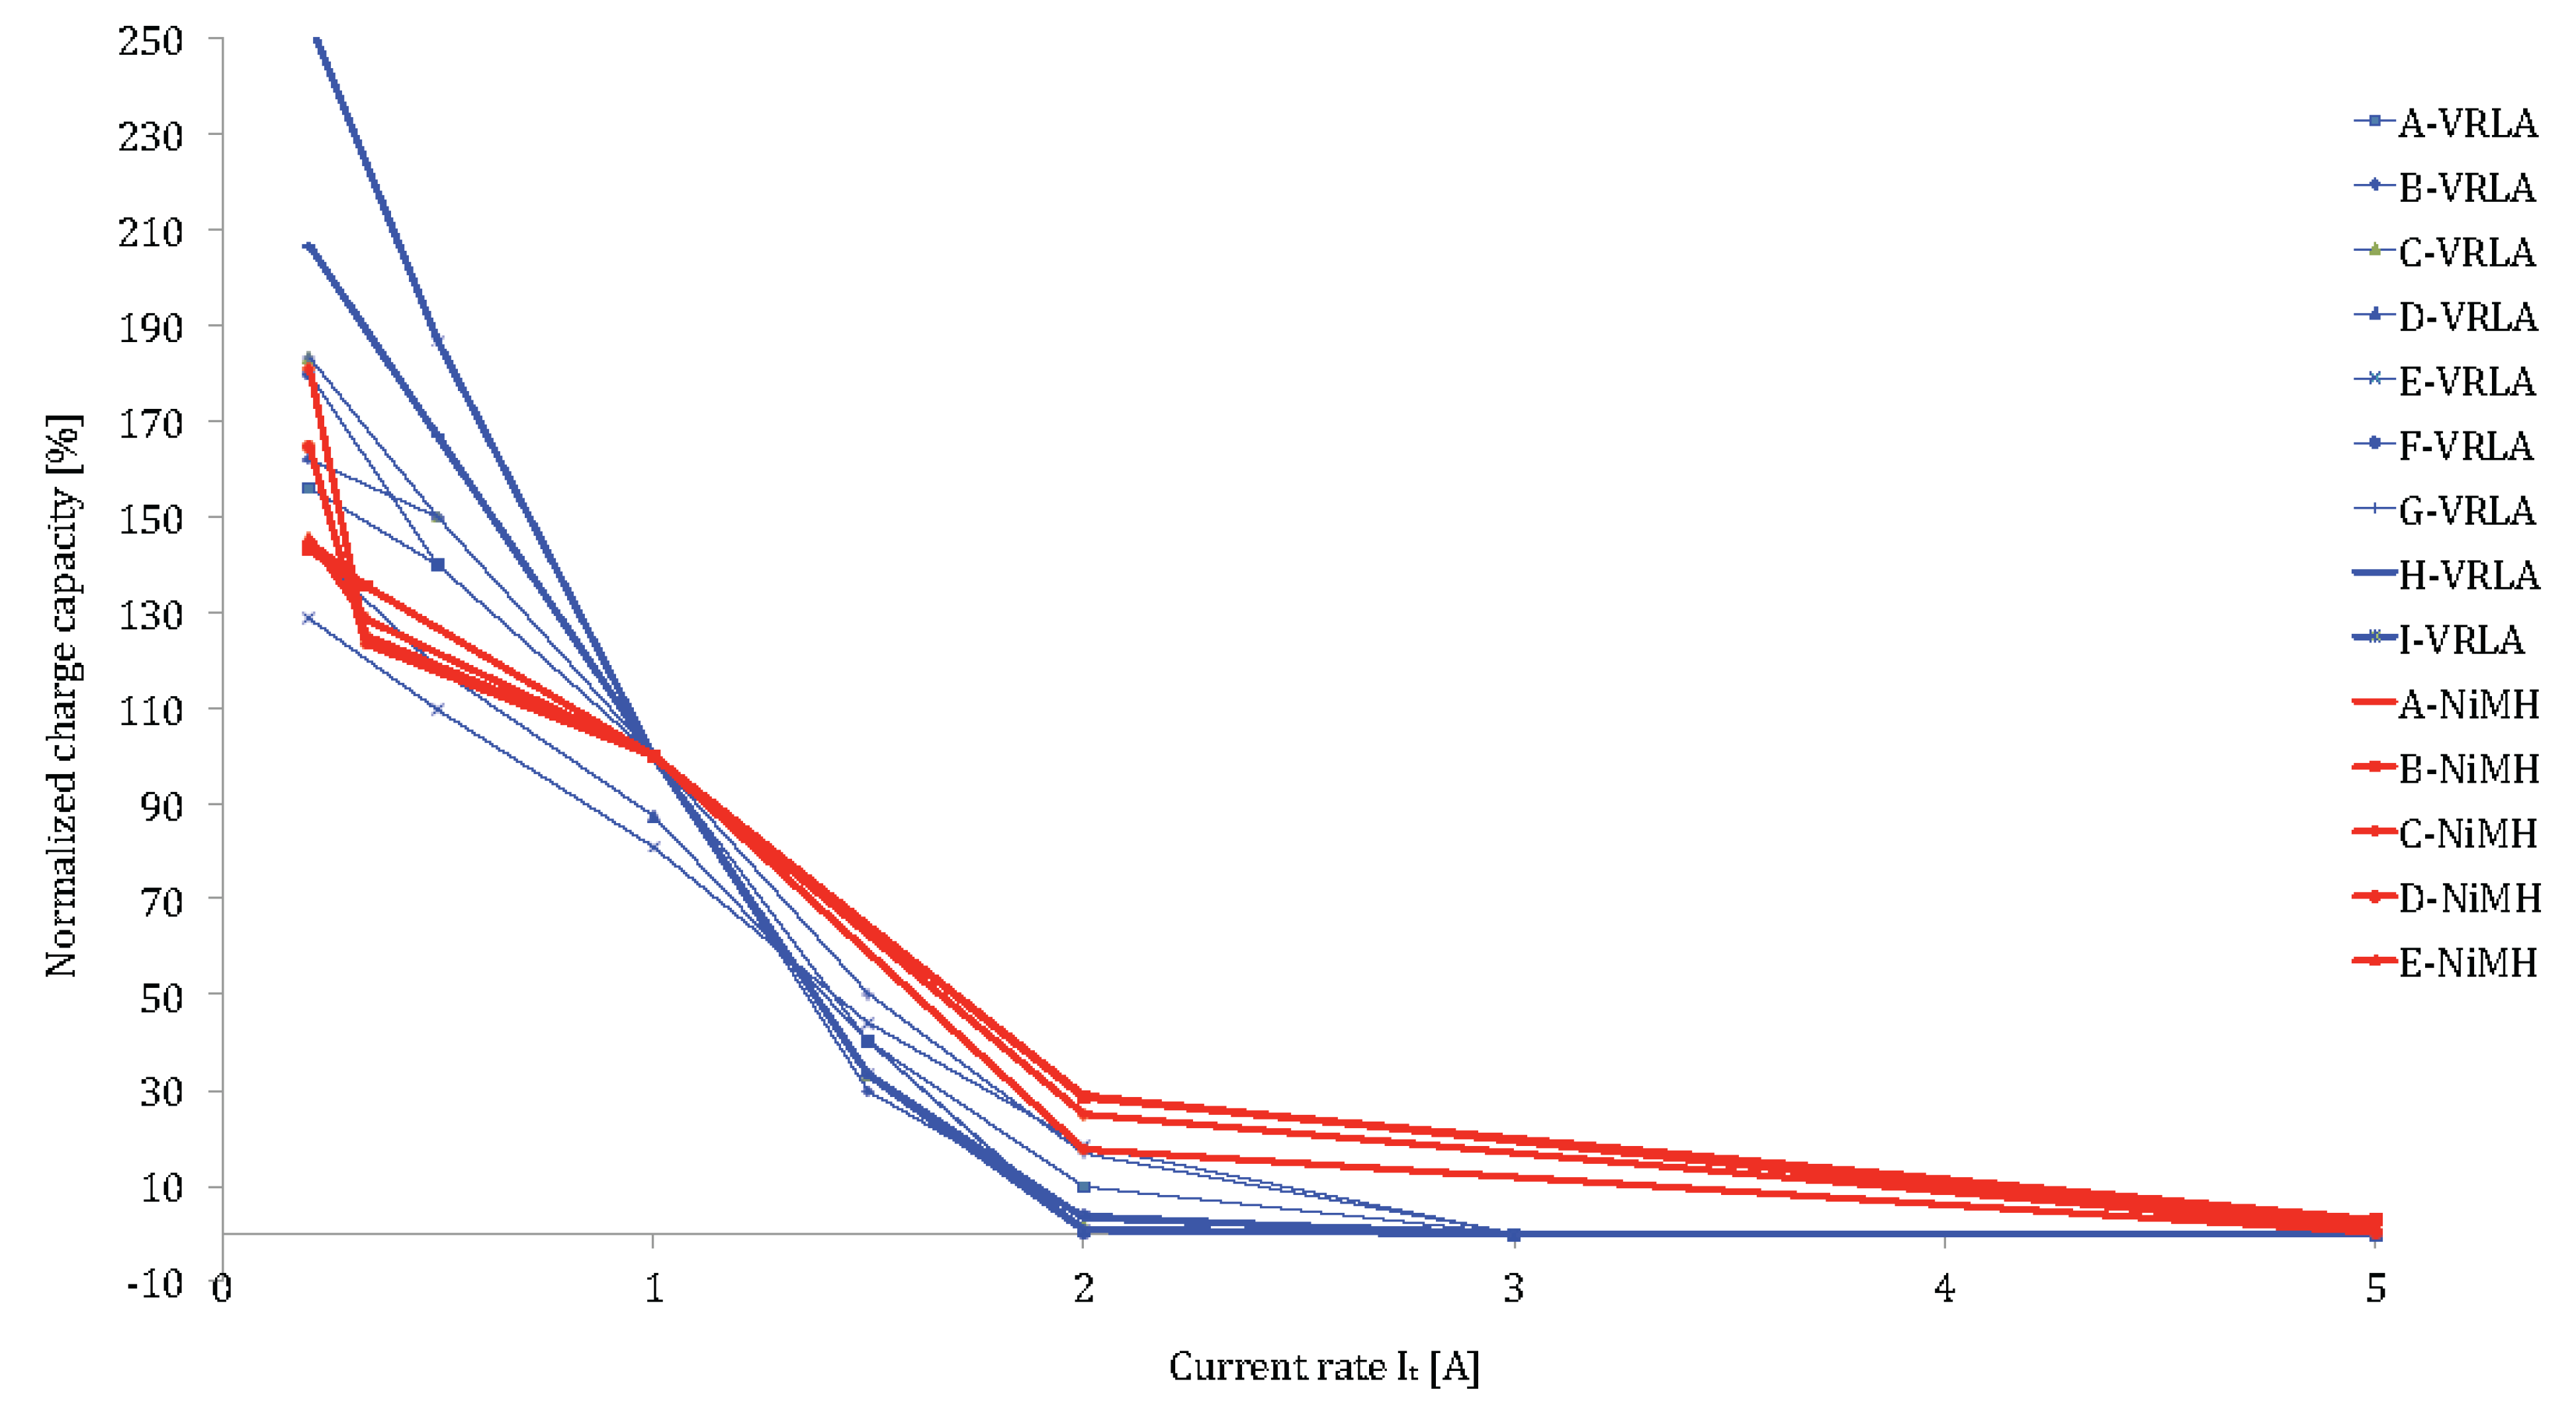
Figure 21 and
Figure 22 show clearly that lithium-ion batteries have much better performances than lead-acid and nickel-metal hydride based batteries. For most lithium-ion batteries, the stored capacity up to V
max is almost 80% at 5I
t. Due to the higher charge current rates, the charge time can be reduced with a factor 10. Thus, the discharge time is less than 1 hour instead of 8 hours as mentioned above. Here, it should be noted that battery cells with high energy, which are designed for PHEVs and BEVS show high performances (85%–100%) between 1I
t and 2I
t but indicate less performances at higher current rates.
By comparing all these lithium-ion chemistries, we can observe that LiTiO
2 have the best performances. The normalized stored capacity at the maximum voltage is higher than 90% independent of the current rates. These results can be explained by the bigger surface area of the anode electrode in LiTiO
2: 100 m
2/g compared to 3 m
2/g for the graphite based electrode in the lithium iron phosphate, lithium nickel manganese cobalt oxide and lithium nickel cobalt aluminum oxide based batteries [
77]. The bigger surface area allows moving the electrical charges quickly. Thus, the lithium titanate oxide does not suffer from high current rates.
Then, the charge time during the constant voltage varies between 0.3 and 1.5 h compared to 5–8 h, typically for lead-acid and nickel-metal hydride technologies.
Figure 21.
Charge performances of lithium-ion brands and chemistries.
Figure 21.
Charge performances of lithium-ion brands and chemistries.
Figure 22.
Charge performances of VRLA and NiMH battery technologies at different current rates.
Figure 22.
Charge performances of VRLA and NiMH battery technologies at different current rates.
However, the impact of fast charging on the cycle life of batteries is a factor that could not be examined from a single fast charging test.
In modeling and assessment of battery technologies, the state of charge estimation also can be considered as a key issue. The most used technique in circulation is the SoC-VoC relationship. However, this technique is not applicable due to the flat voltage duration between 80% and 30% SoC. Thus, the estimation in this region becomes very difficult. Another known technique is based on the ampere-hour counting as presented by Equation (8):
But this technique exhibits some drawbacks since it does not take into account high current behavior and the Peukert phenomenon. However, the battery in reality is continuously subjecting various stress parameters, such as current rates, depth of discharge, temperature and cycle life. In order to overcome these problems, in [
78] an empirical estimation of state of charge is documented [see Equation (9)]. In this equation, the Peukert number is included. But, the Peukert number here is assumed as constant. However, this parameter varies in function of many other parameters (will be contributed in the future research article). Furthermore, the Equation (9) only reflects the battery behaviour during the discharge phase. Equation 10 proposes a modified version whereby; the influence of the recuperated energy is included. In
Figure 22, we recognized that the evolution of the stored capacity in function of current rate is not logarithmical as we have observed during discharge phase, but linear. Thus, instead of a Peukert number, a coulomb efficiency E
ff has been defined as presented by Equation (10).
2.2.3. Power Performances
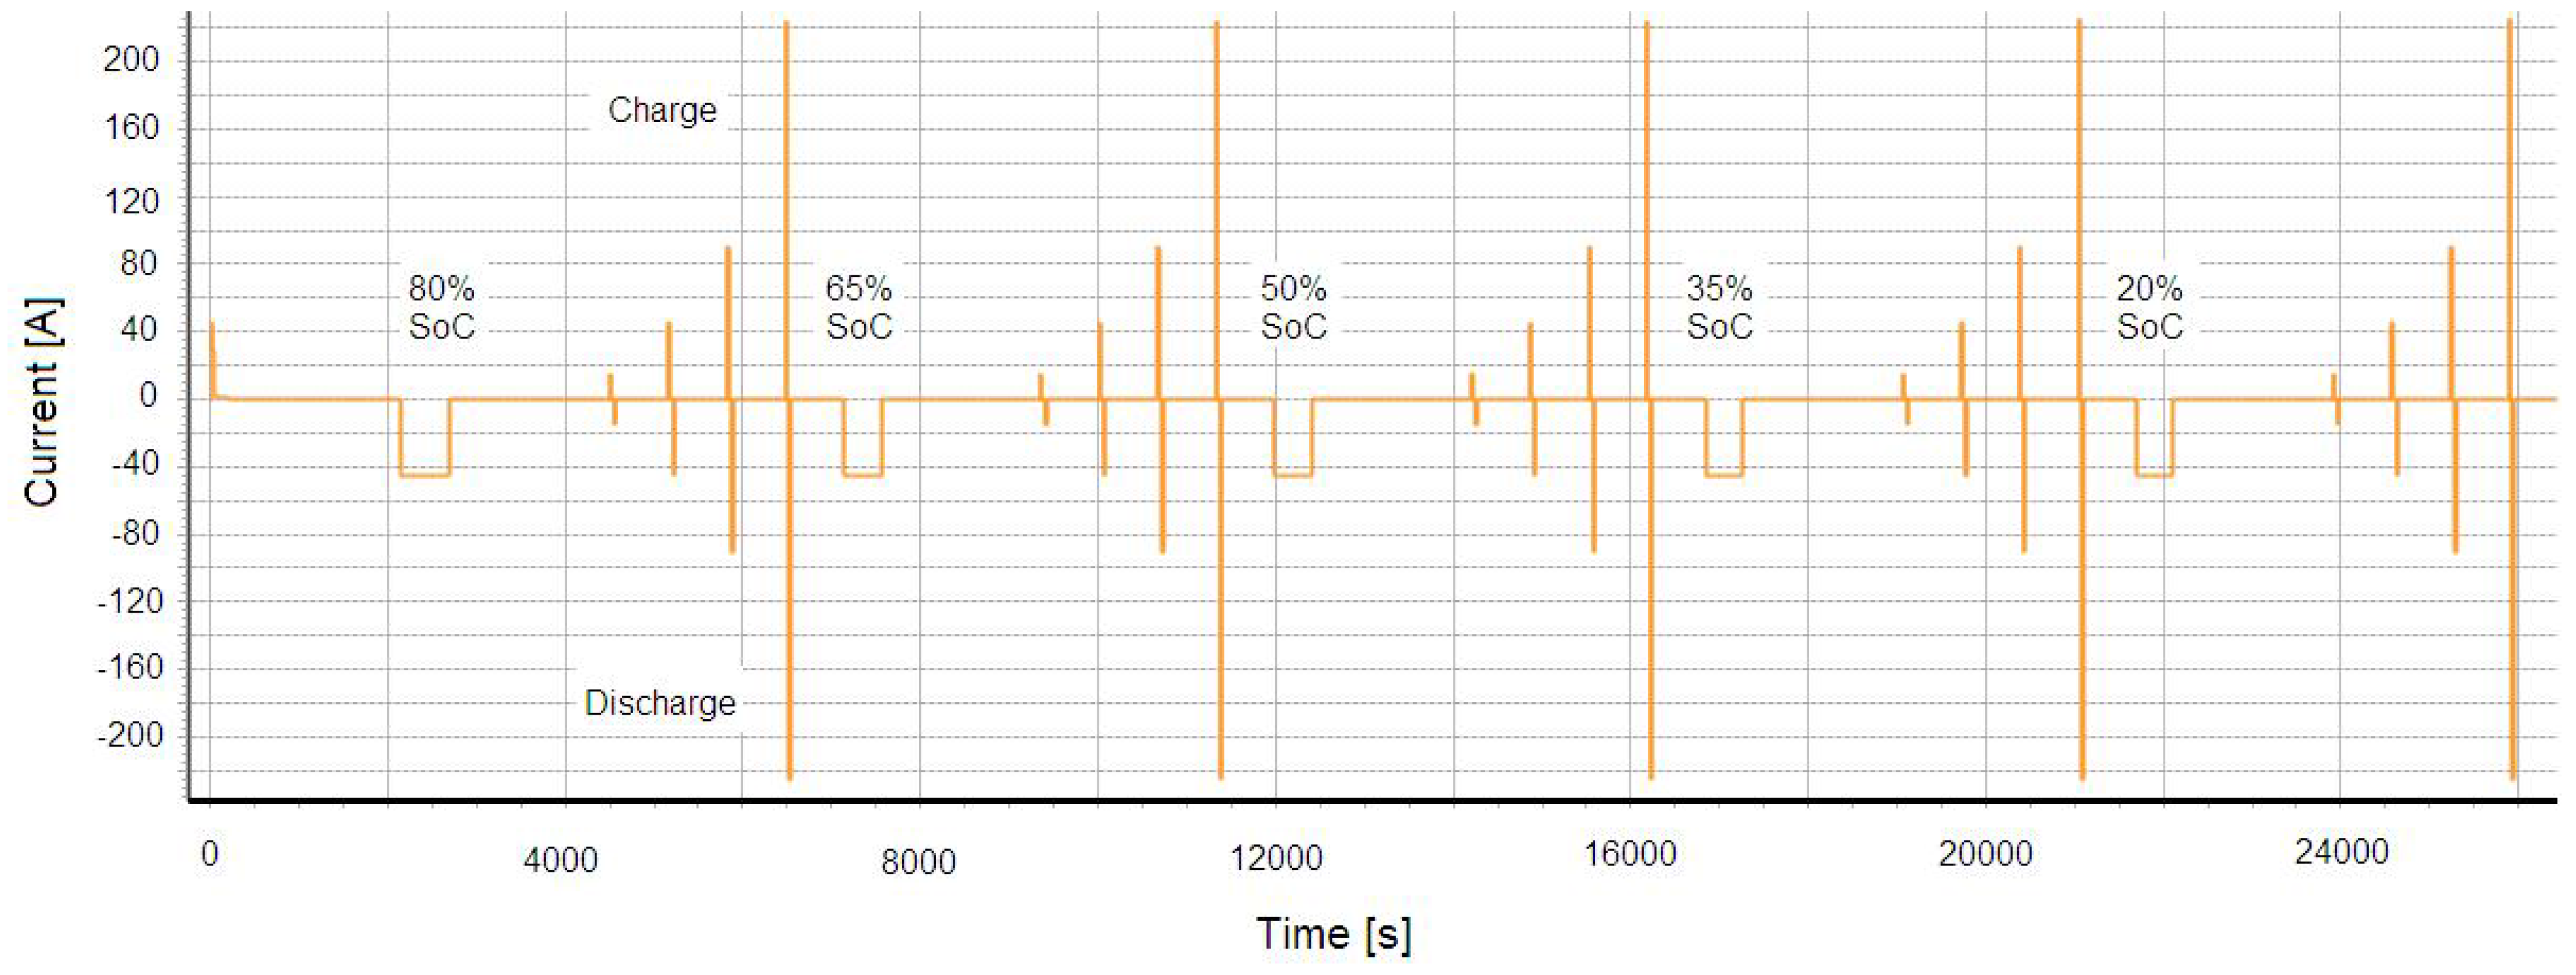
In this test, the batteries discharge and charge power during 10 seconds pulses are determined as a function of depth of discharge at different current rates. The batteries have been charged at 1I
t rate and then discharged at the same current rate till the desired DoD level. The pulse power tests are made at 80%, 65%, 50% 35% and 20% SoC as presented in
Figure 23. The power capabilities of the batteries were determined by the open-circuit voltage and current as presented by Equations (12) and (13). In this study current pulses (0.33I
t 1I
t 2I
t 5I
t 10I
t, 15I
t and I
max have been selected:
In the above equations, Vdis and Vch represent the voltage drop at the end of each pulse during discharge and charge respectively. I and m stand in for imposed current and the battery cell mass.
Figure 23.
Extended HPPC pulse at different SoC level and state of charge.
Figure 23.
Extended HPPC pulse at different SoC level and state of charge.
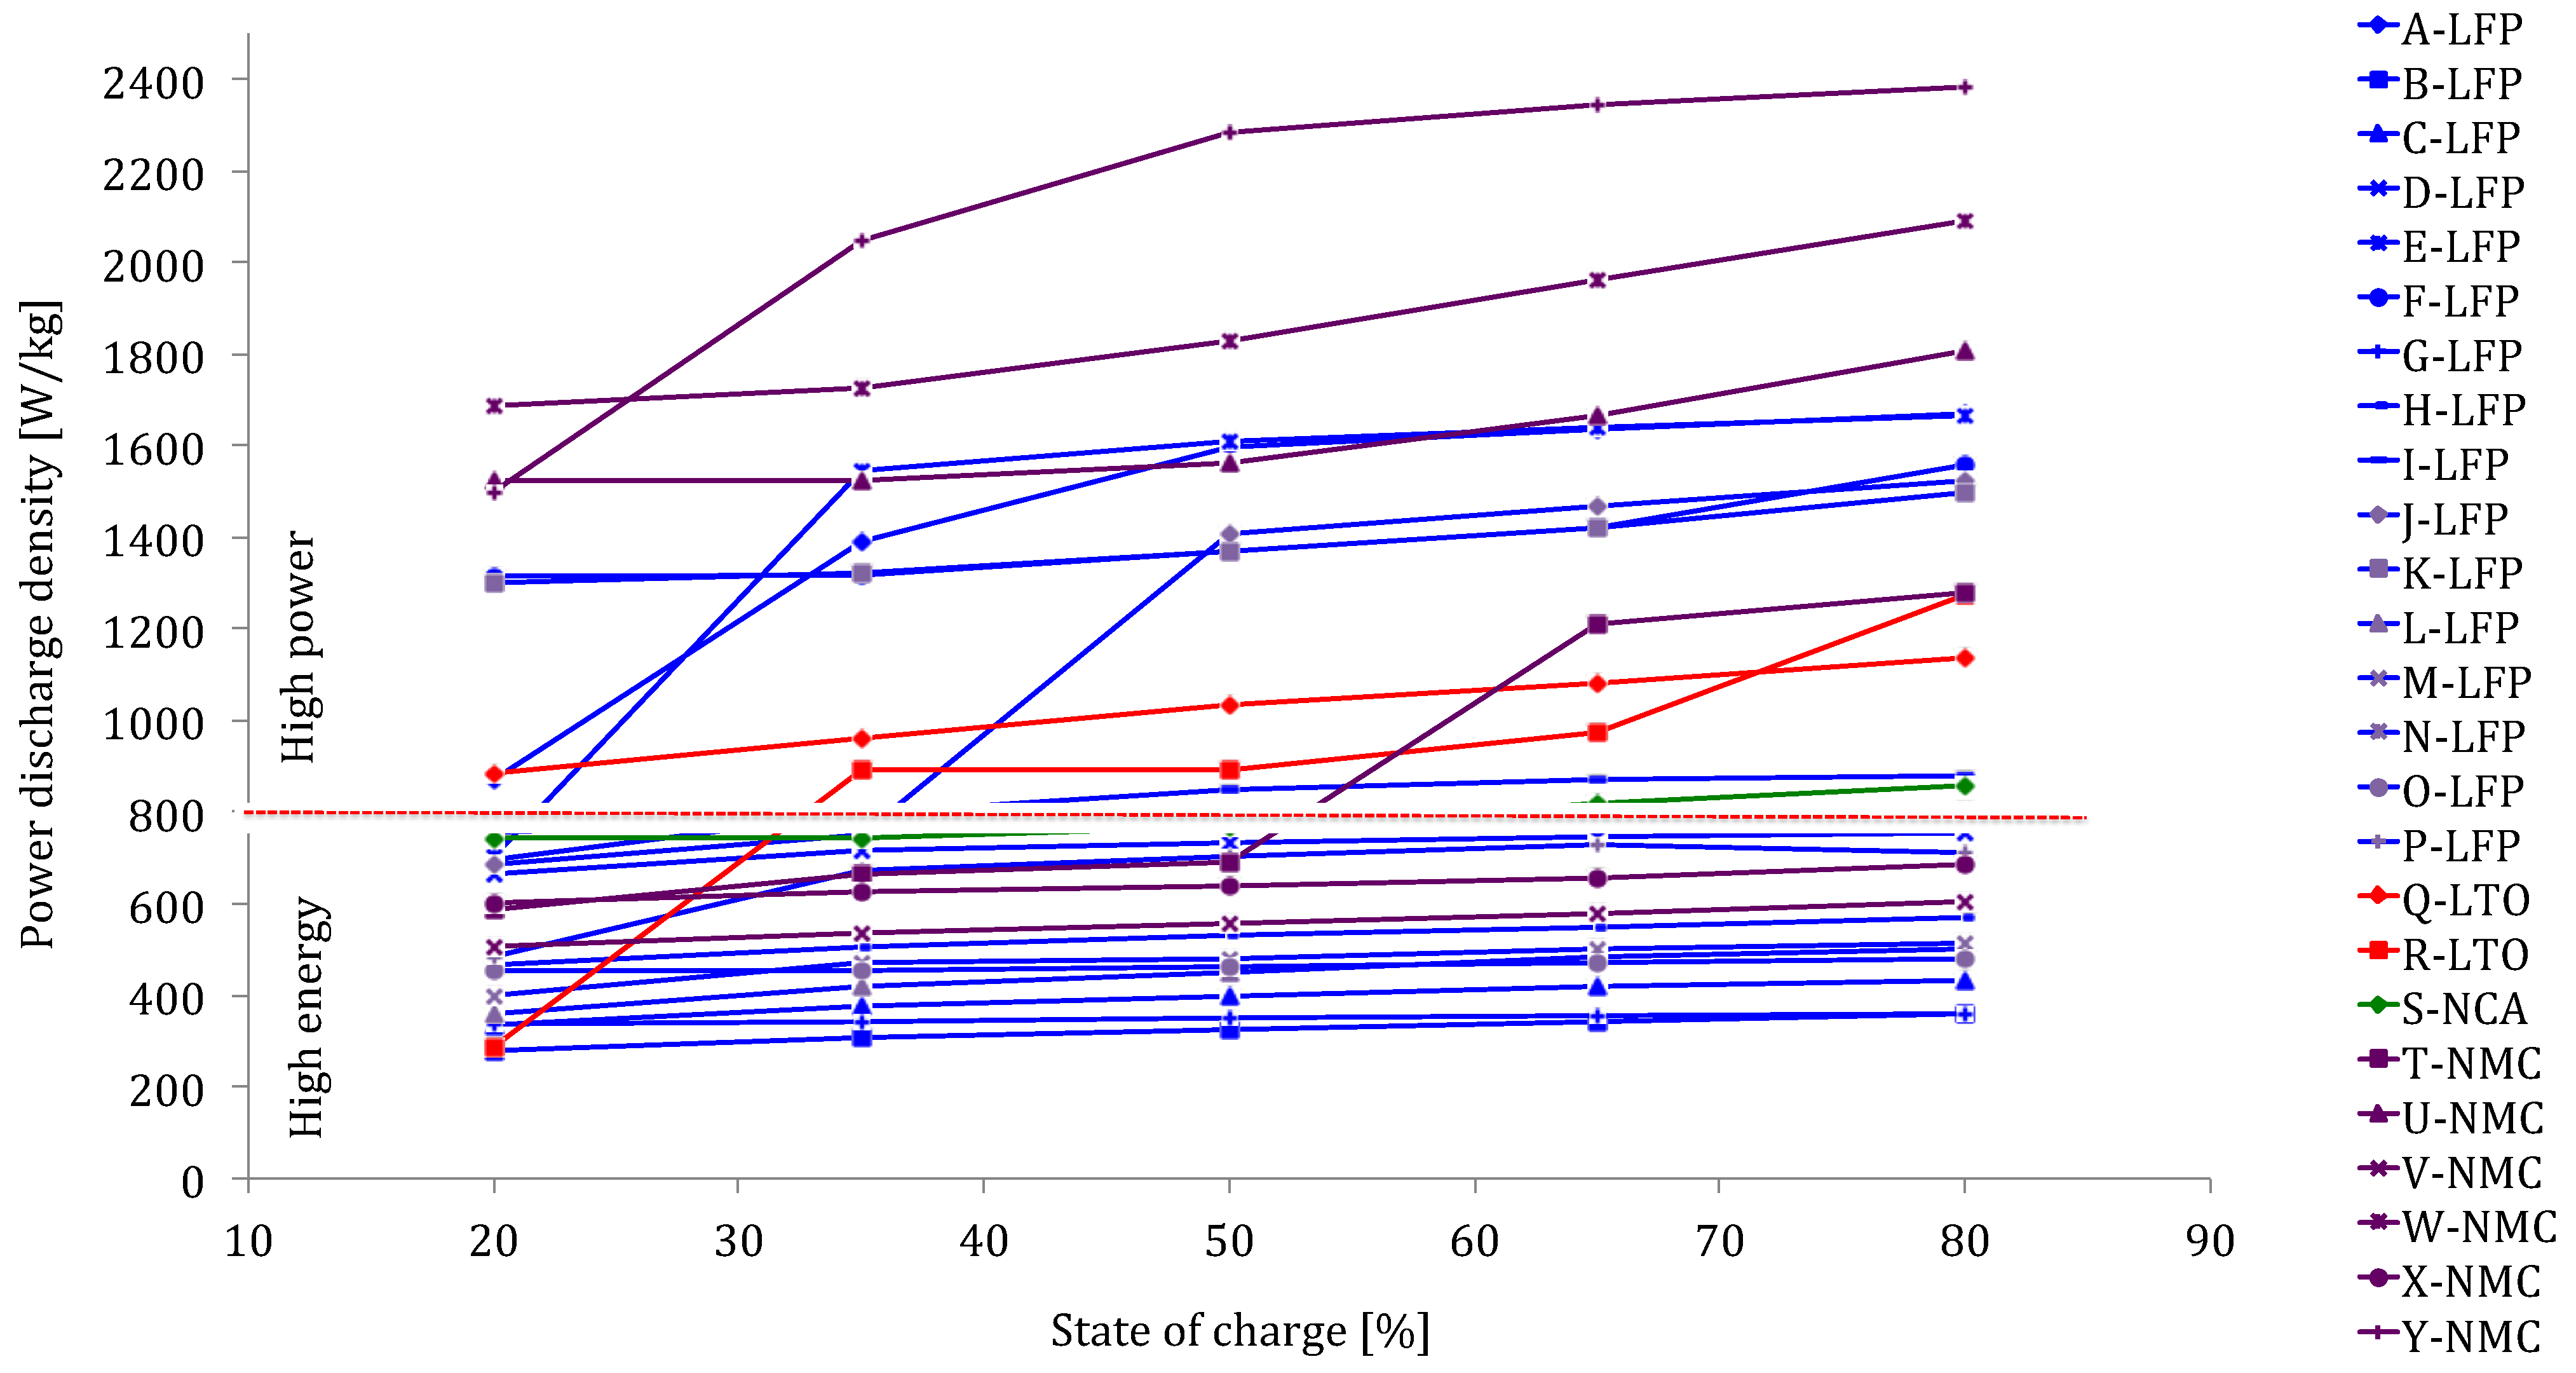
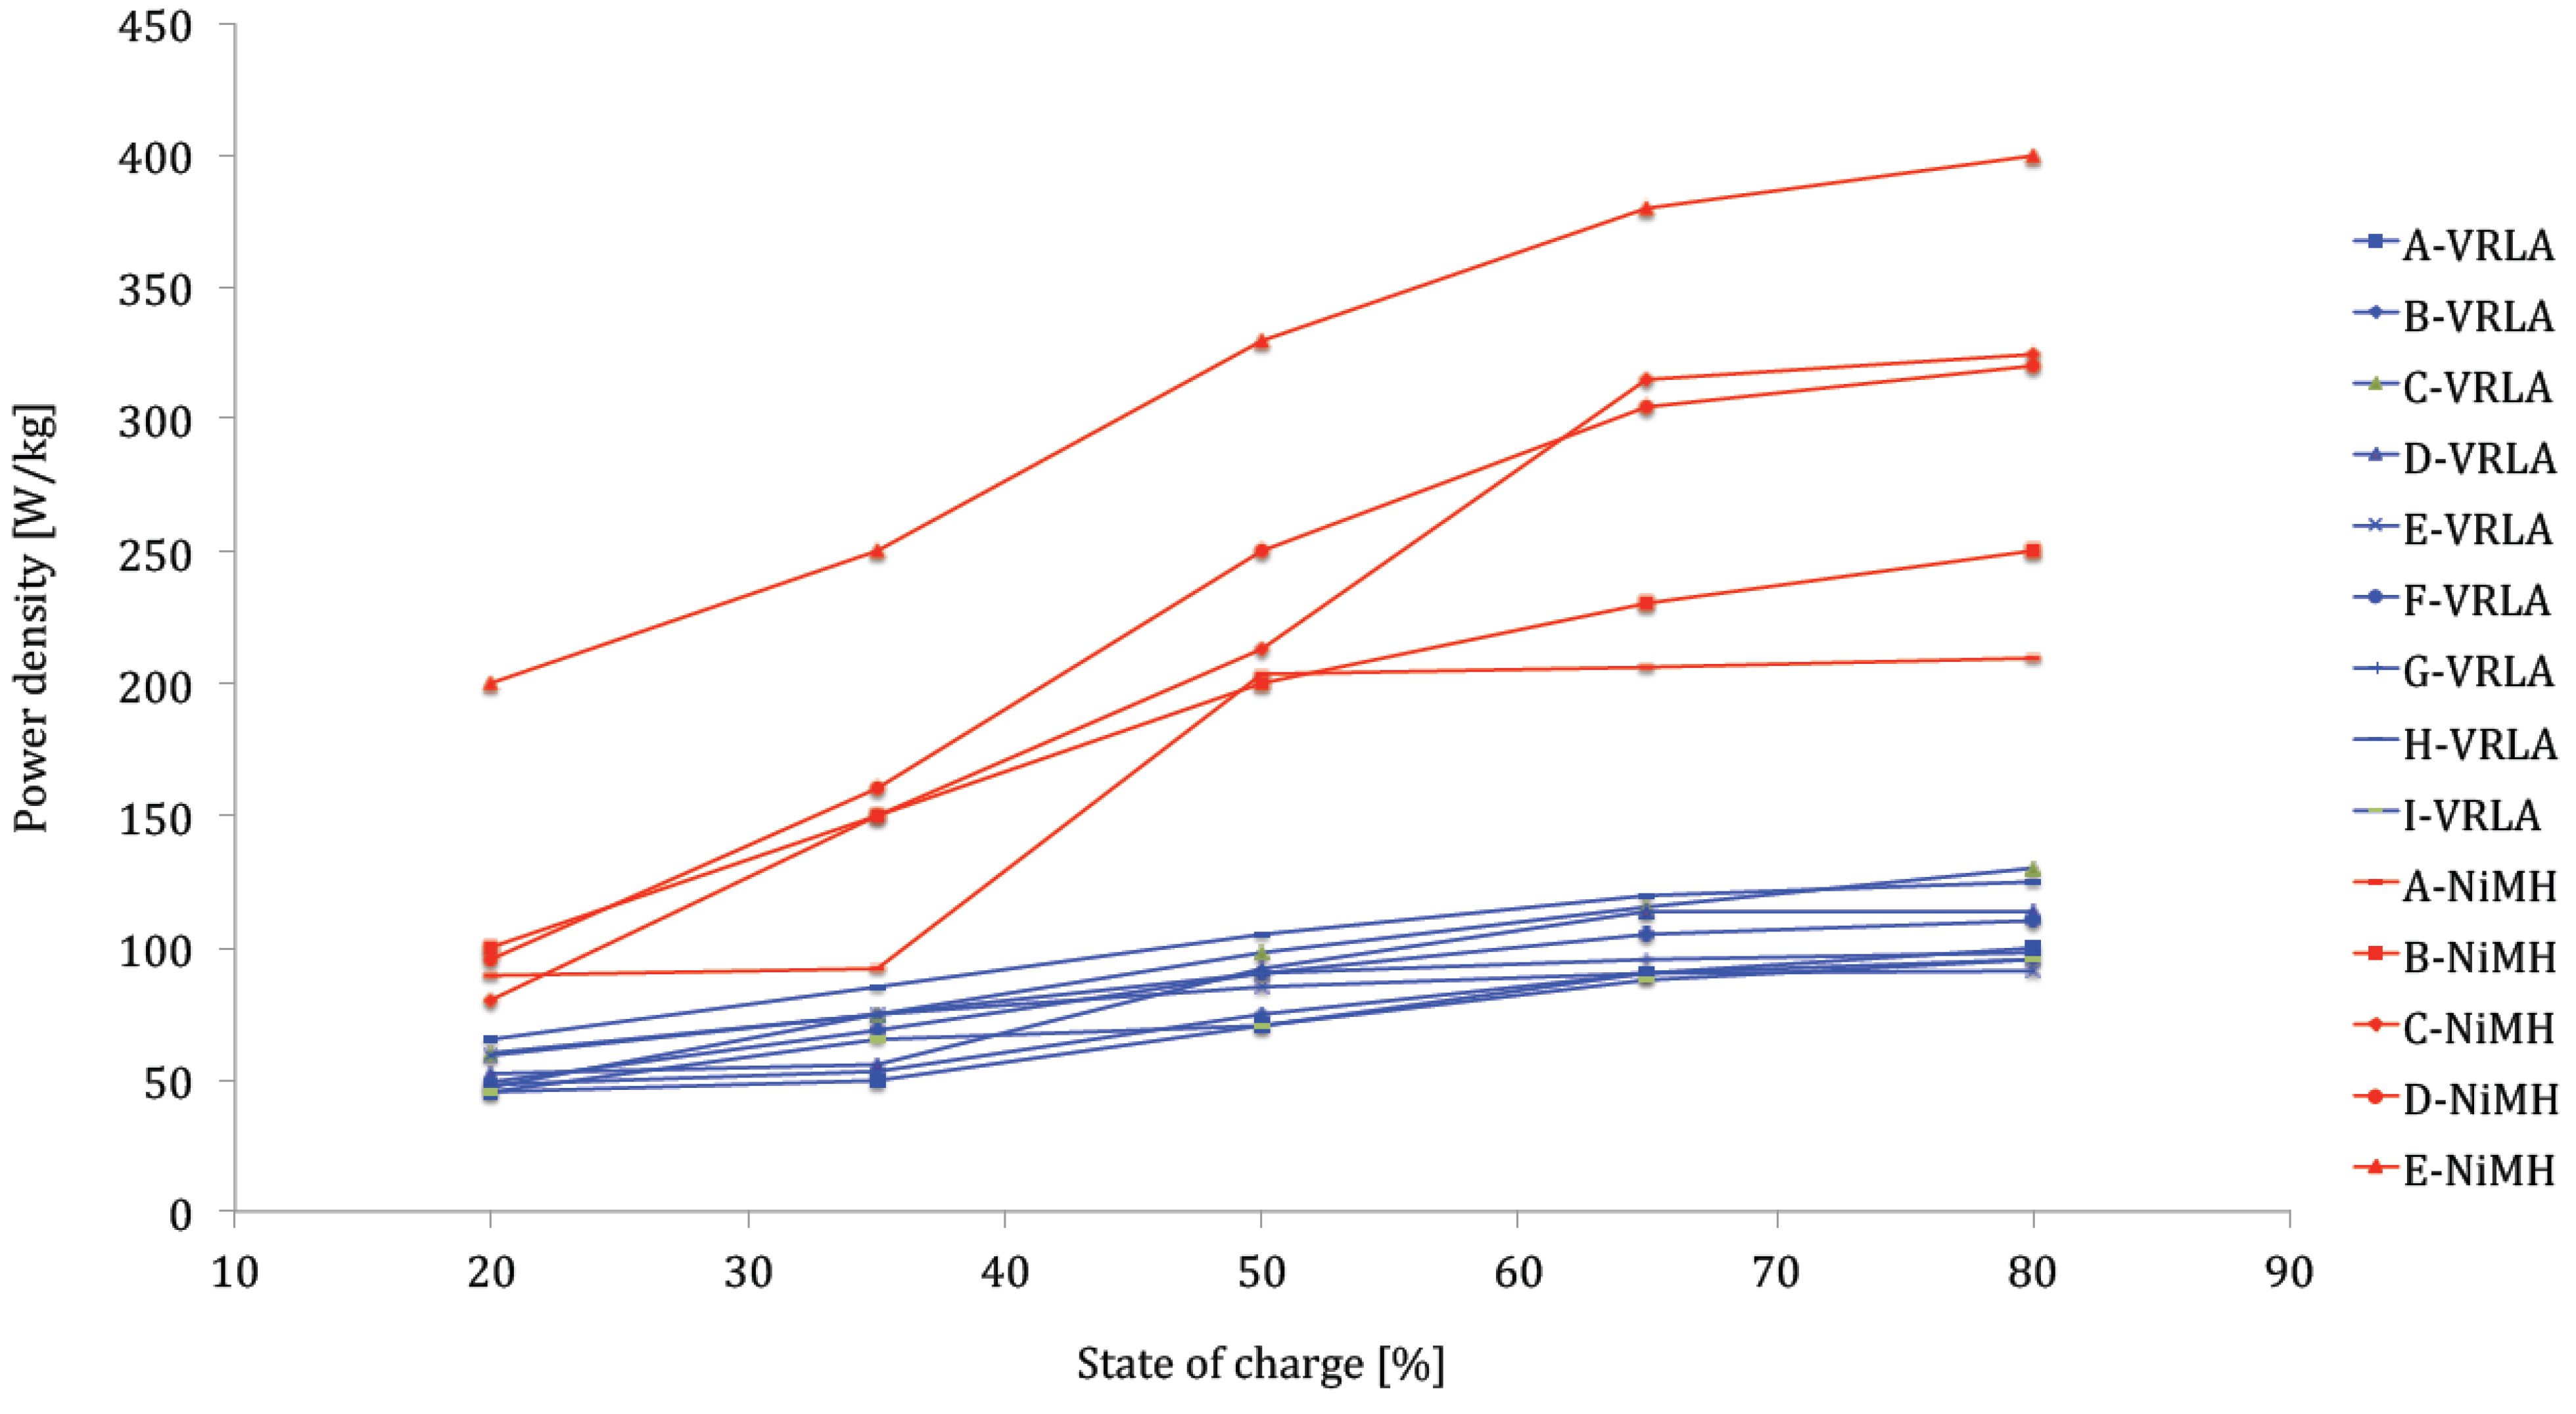
Figure 24 confirms the favorable discharge performances of lithium-ion technology against nickel-metal hydride and VRLA particularly as shown in
Figure 25. The power density of the analyzed lithium-ion battery types varies between 300 and 2400 W/kg compared to 200–400 W/kg for nickel-metal hydride and 90–120 W/kg for lead-acid batteries. Compared to
Figure 8, the power varies in a wide range and is strongly dependent of state of charge. The high values over 700 W/kg show that these batteries are optimized for high power applications. The high power batteries show a more complex relationship between SoC and power, rather than a linear one. This makes the development of a battery model more complicated.
Figure 24.
Power capabilities of lithium-ion batteries at different SoC levels.
Figure 24.
Power capabilities of lithium-ion batteries at different SoC levels.
Figure 25.
Power capabilities of nickel-metal hydride and lead-acid battery technologies.
Figure 25.
Power capabilities of nickel-metal hydride and lead-acid battery technologies.
The proposed method based on the standards ISO 12405-1/2 and IEC 62660-1 for comparison of power capabilities is only suitable when the energy efficiency of the pulse, which is strongly depending of the current rate, will not be taken into account [
79,
80,
81]. Thus for an appropriate comparison, the energy efficiency of the pulse should be considered. Burke
et al. specified that the energy efficiency for lithium-ion technology should be around 90% in order to keep efficiency high and to limit the temperature rising in the battery pack [
21]. The energy efficiency of the pulse can be determined at different ways. In [
21] Burke proposed to use the open circuit voltage and resistance as function of state of charge as presented by Equation (14):
where
.
This presented method assumed that the voltage evolution during a pulse is linear. This method can thus be used for systems such as EDLCs, whereby the relationship state of charge-voltage is linear. For batteries, the situation seems more complicated since the system exhibits a voltage drop due to the ohmic resistance of the electrodes, contacts and electrolytes. The voltage decreases exponentially as presented in
Figure 26.
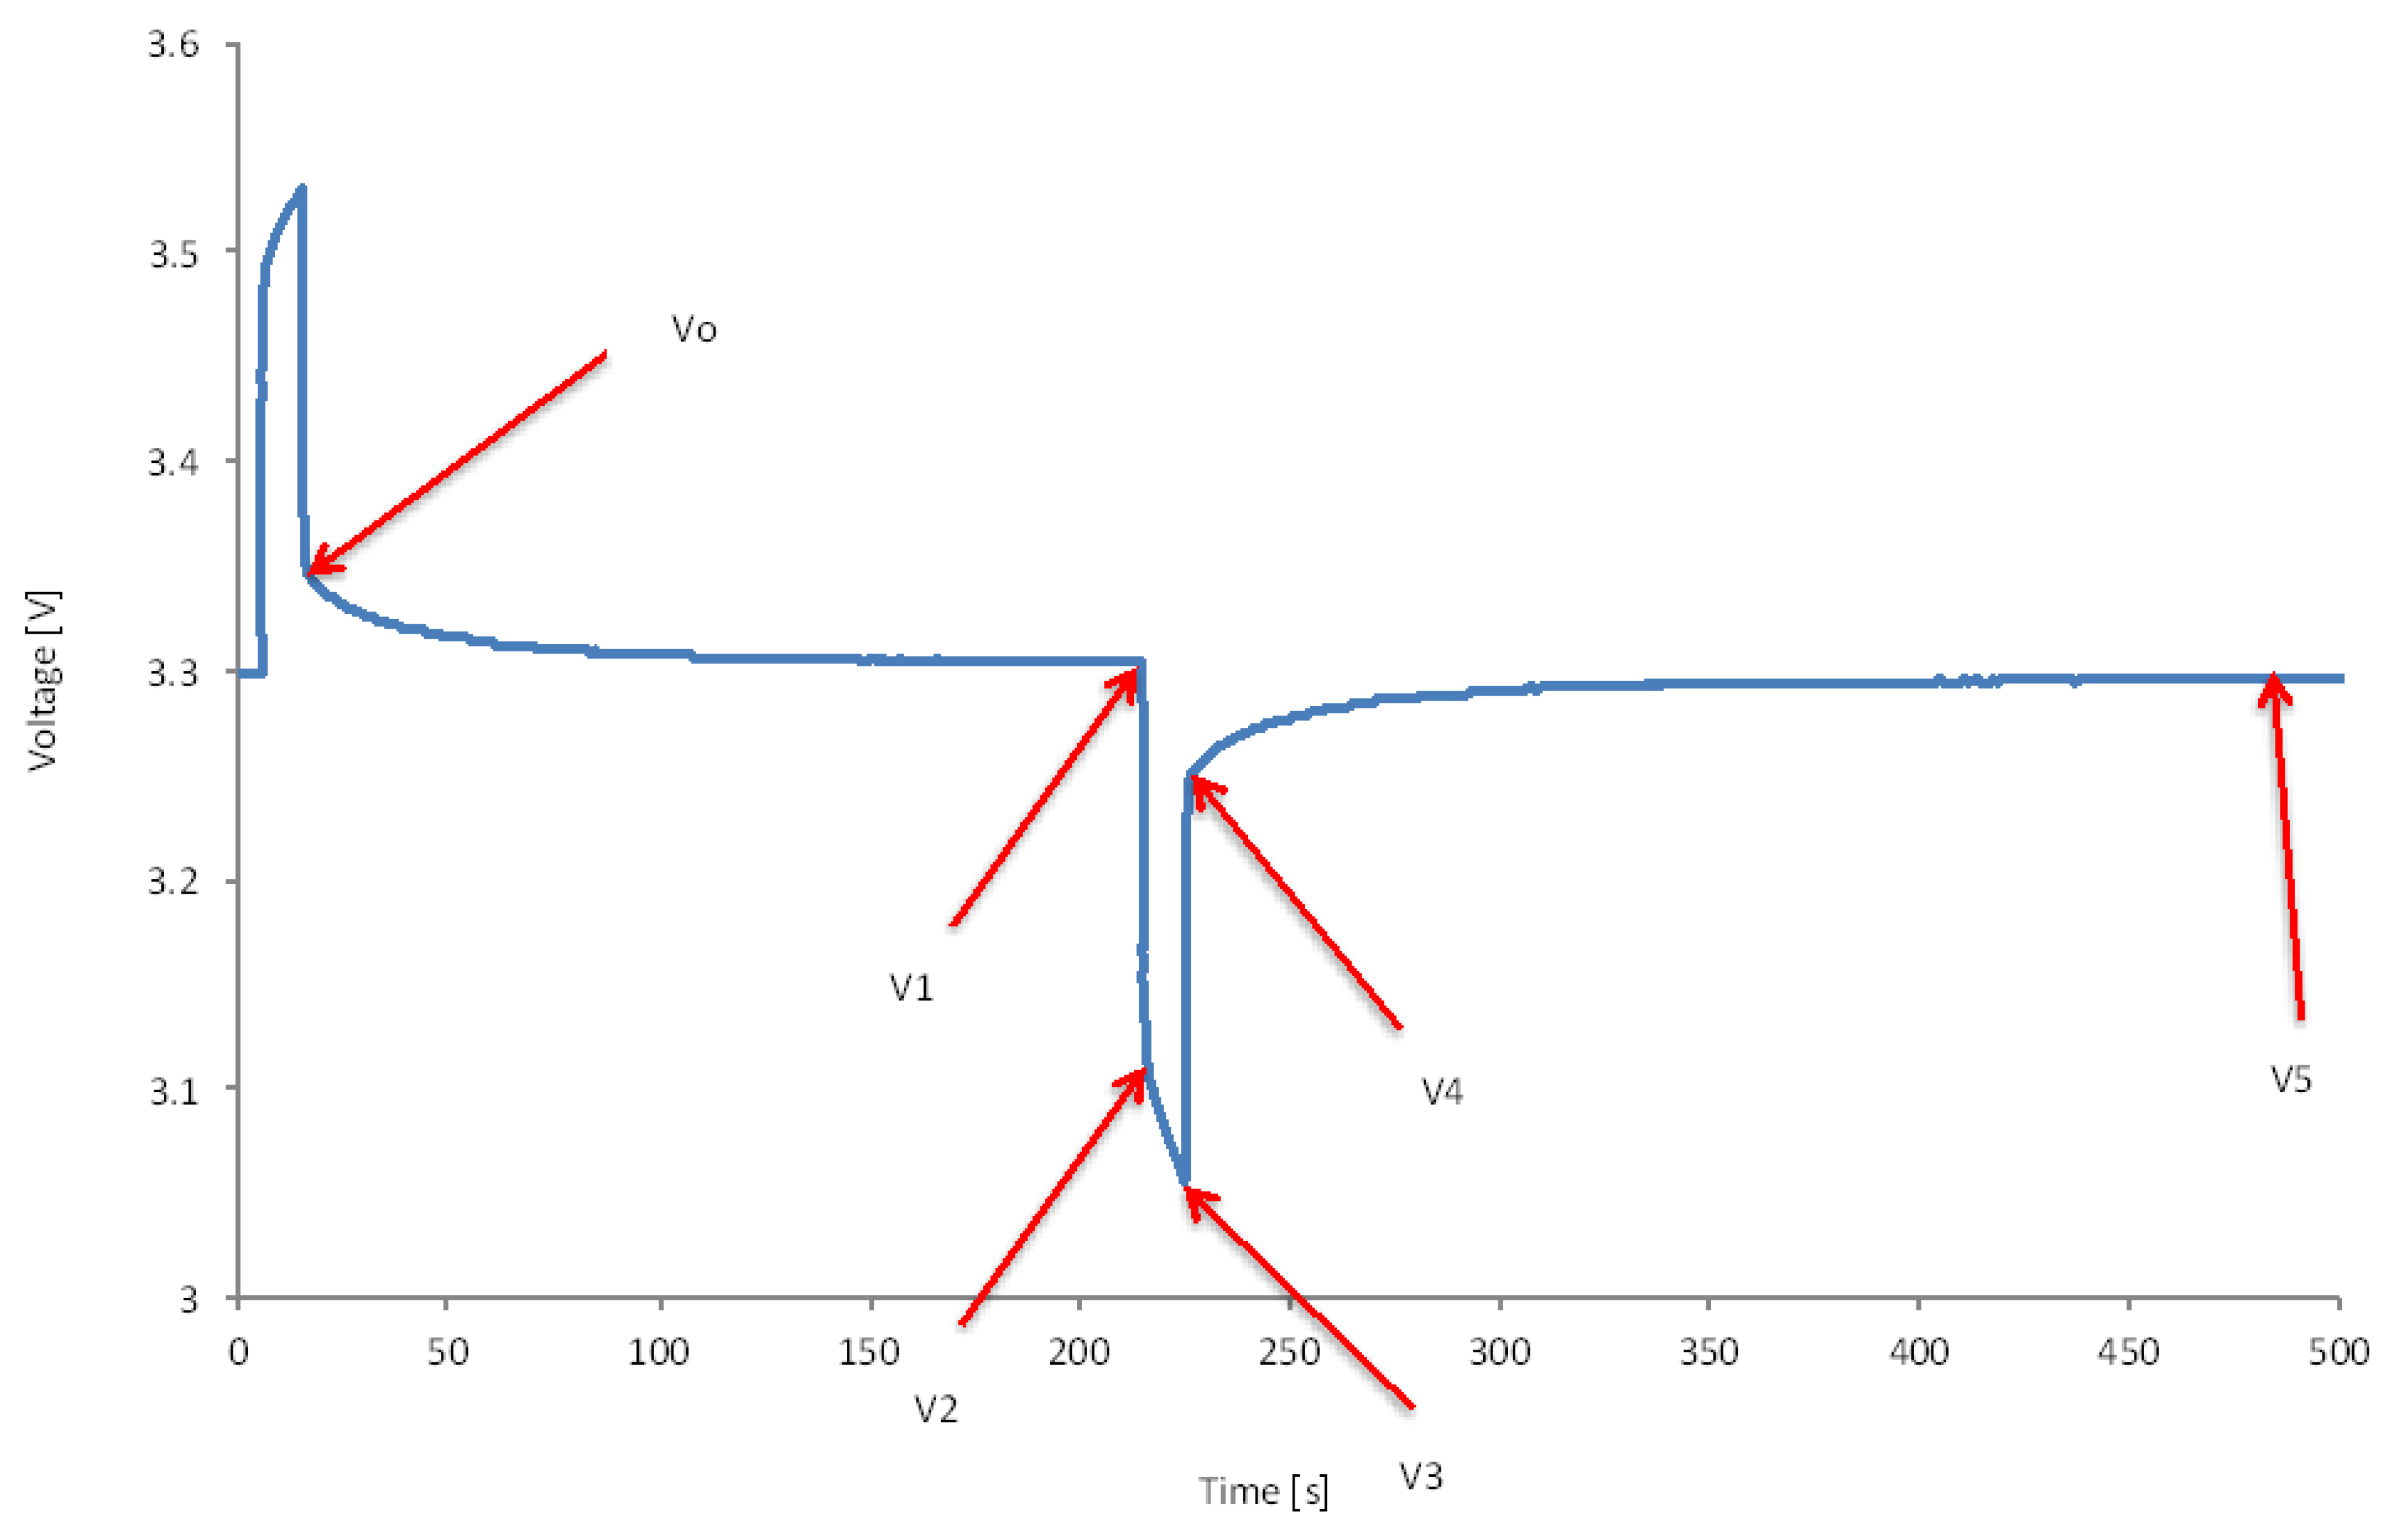
Figure 26.
Voltage duration during HPPC test.
Figure 26.
Voltage duration during HPPC test.
Hereby, we can conclude that the energy efficiency calculation according to Burke is not suitable. The only method that can be used is the ratio of the discharge and charge energy (by using equal pulses) expressed in Wh:
In
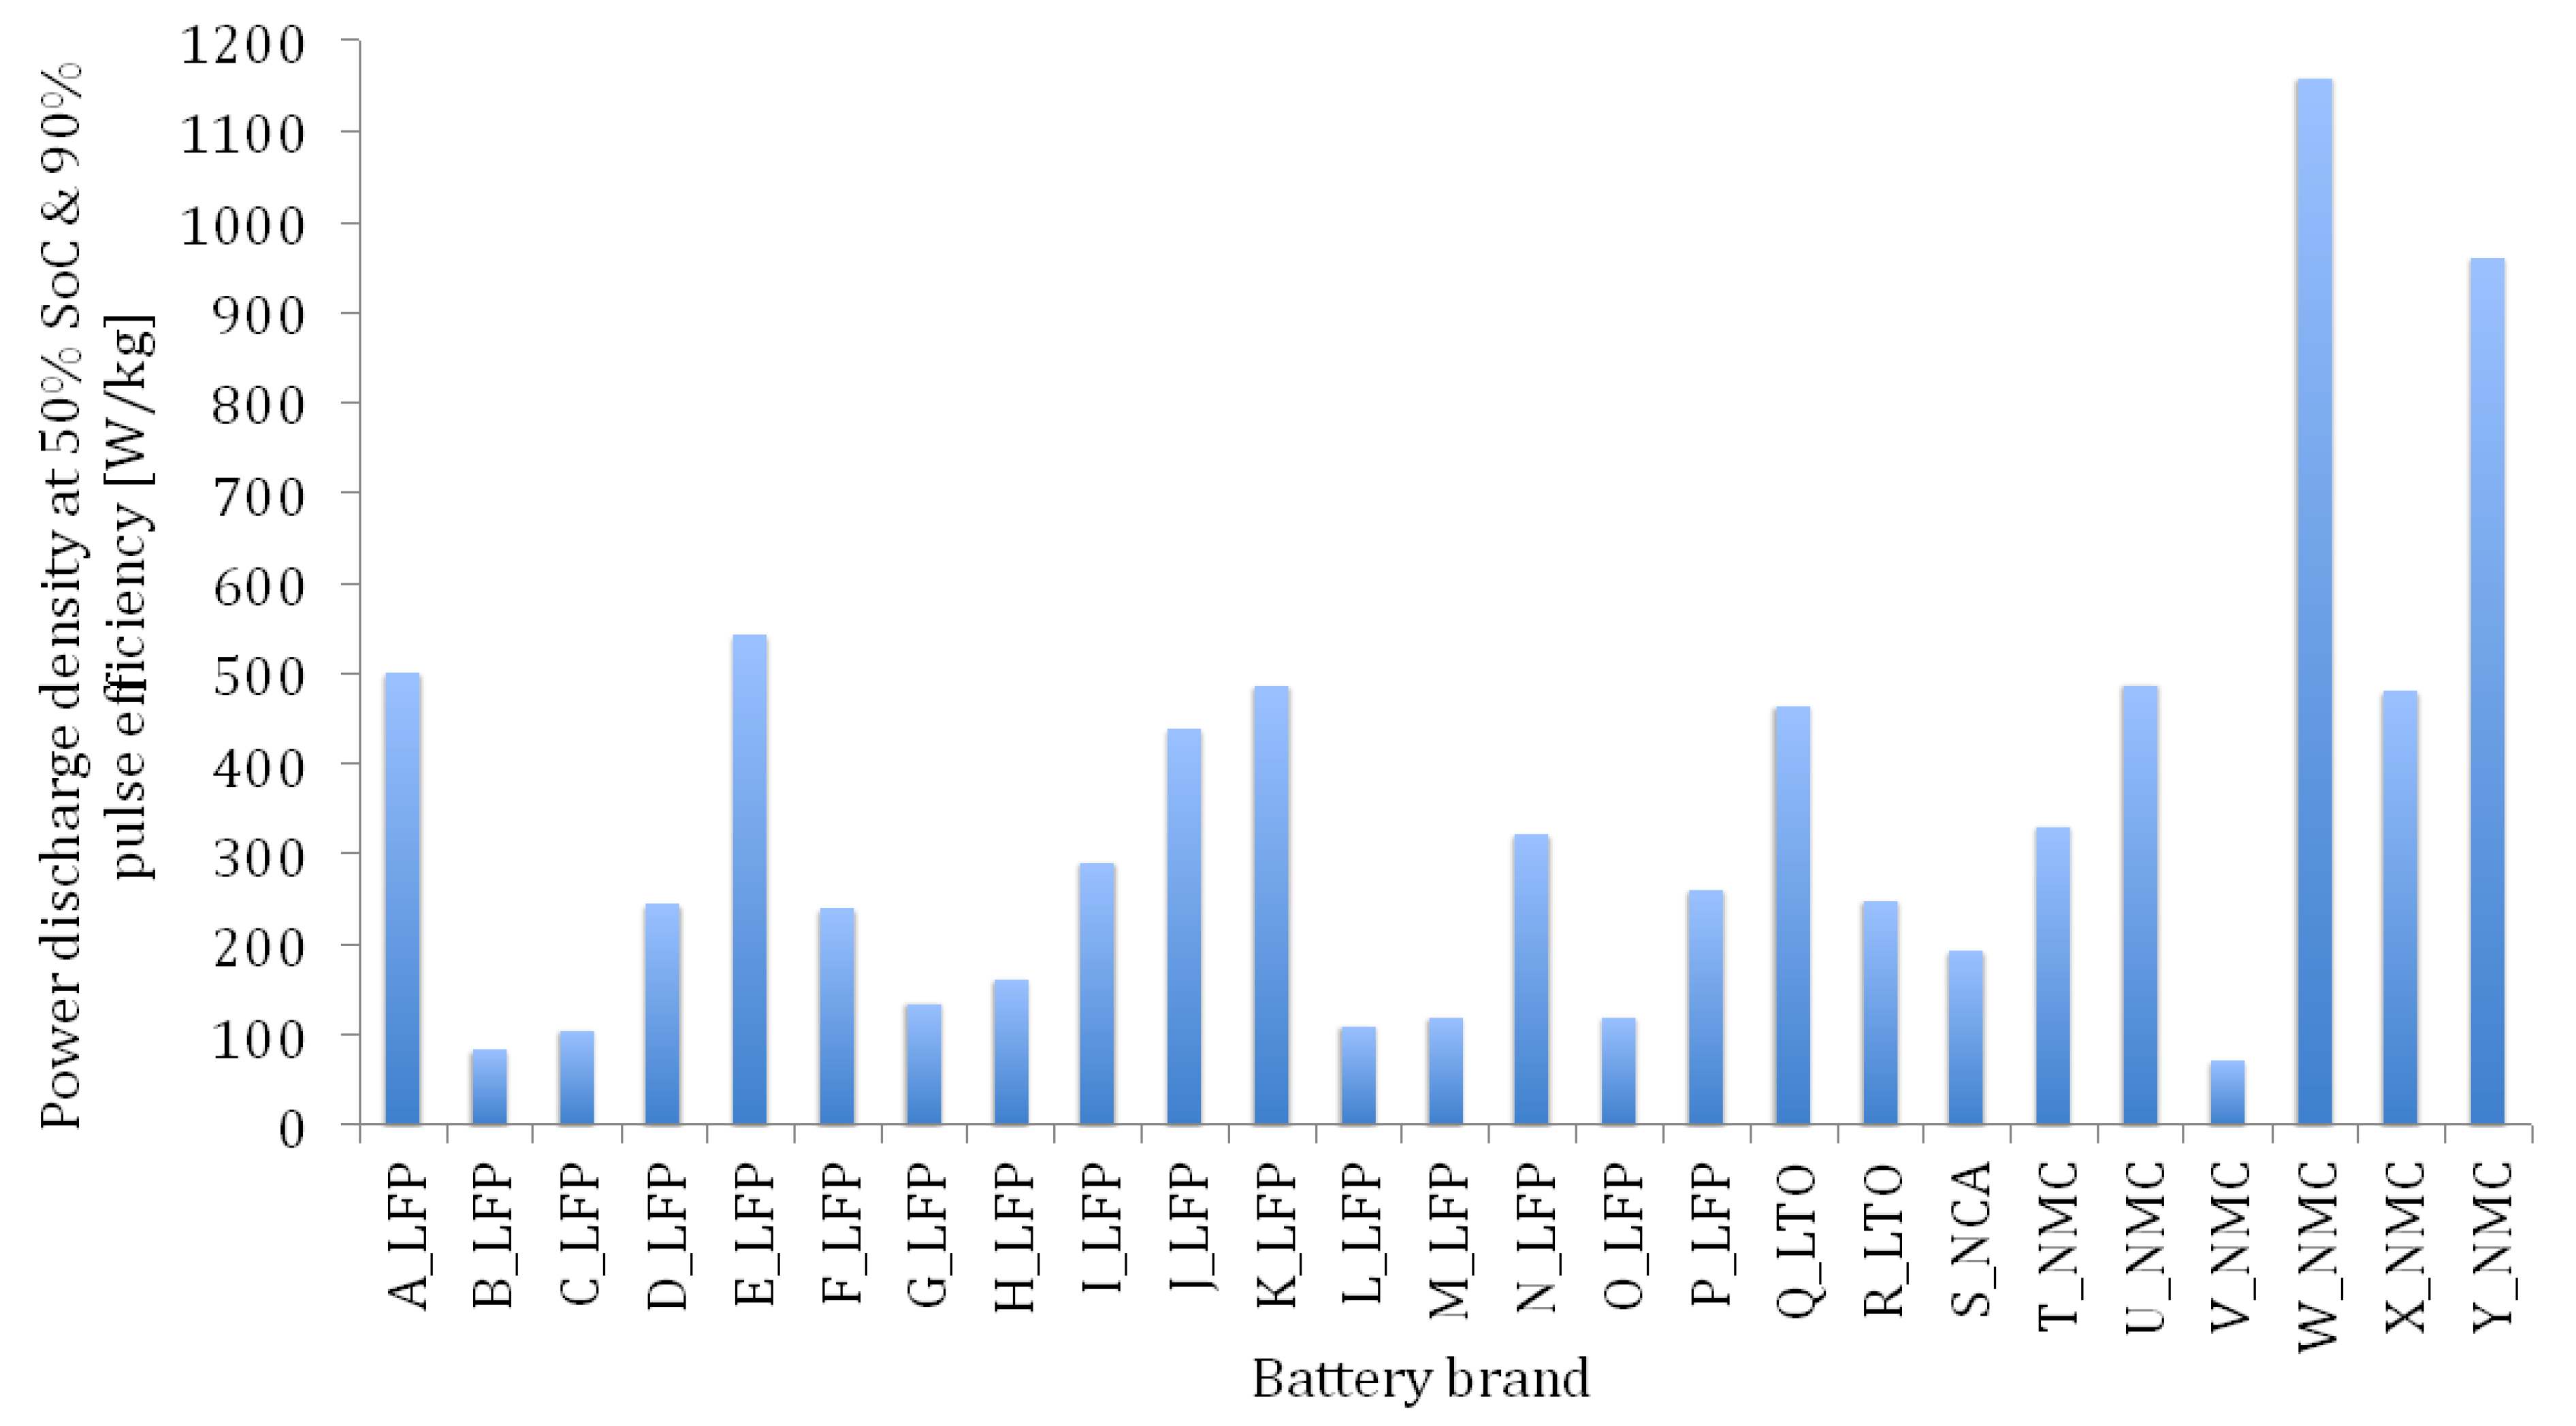
Figure 27 the power density of the different batteries is presented at 90% energy efficiency and 50% SoC. The power density at 90% pulse efficiency is much lower than in
Figure 24. These results are in line with the results shown in
Figure 12.
Due to the bigger surface area the high power battery cells have significantly lower resistance and higher energy efficiency. The high value for battery W-NMC is due to the used anode material, which is hard carbon rather than graphite. Hard carbons are prepared from phenolic resin and can not be graphitized, even when treated at 3000 °C [
82]. On the other hand, materials that can be graphitized by treatment at high temperatures >200 °C are termed soft carbons. According to Patterson, hard carbon has a higher specific capacity 480 mAh/g compared to 370 mAh/g for graphite and 275 mAh/h for soft carbon [
83]. Due to the fact that the layers for hard carbon are not neatly stacked and non-crystalline, the surface area is much bigger. Moreover, there is no volume change upon lithium ion intercalation against 10% for used graphite in commercial lithium-ion batteries [
83]. This means that the cycleability can be enhanced.
Figure 27.
Power density at 50% SoC and 90% pulse energy efficiency.
Figure 27.
Power density at 50% SoC and 90% pulse energy efficiency.
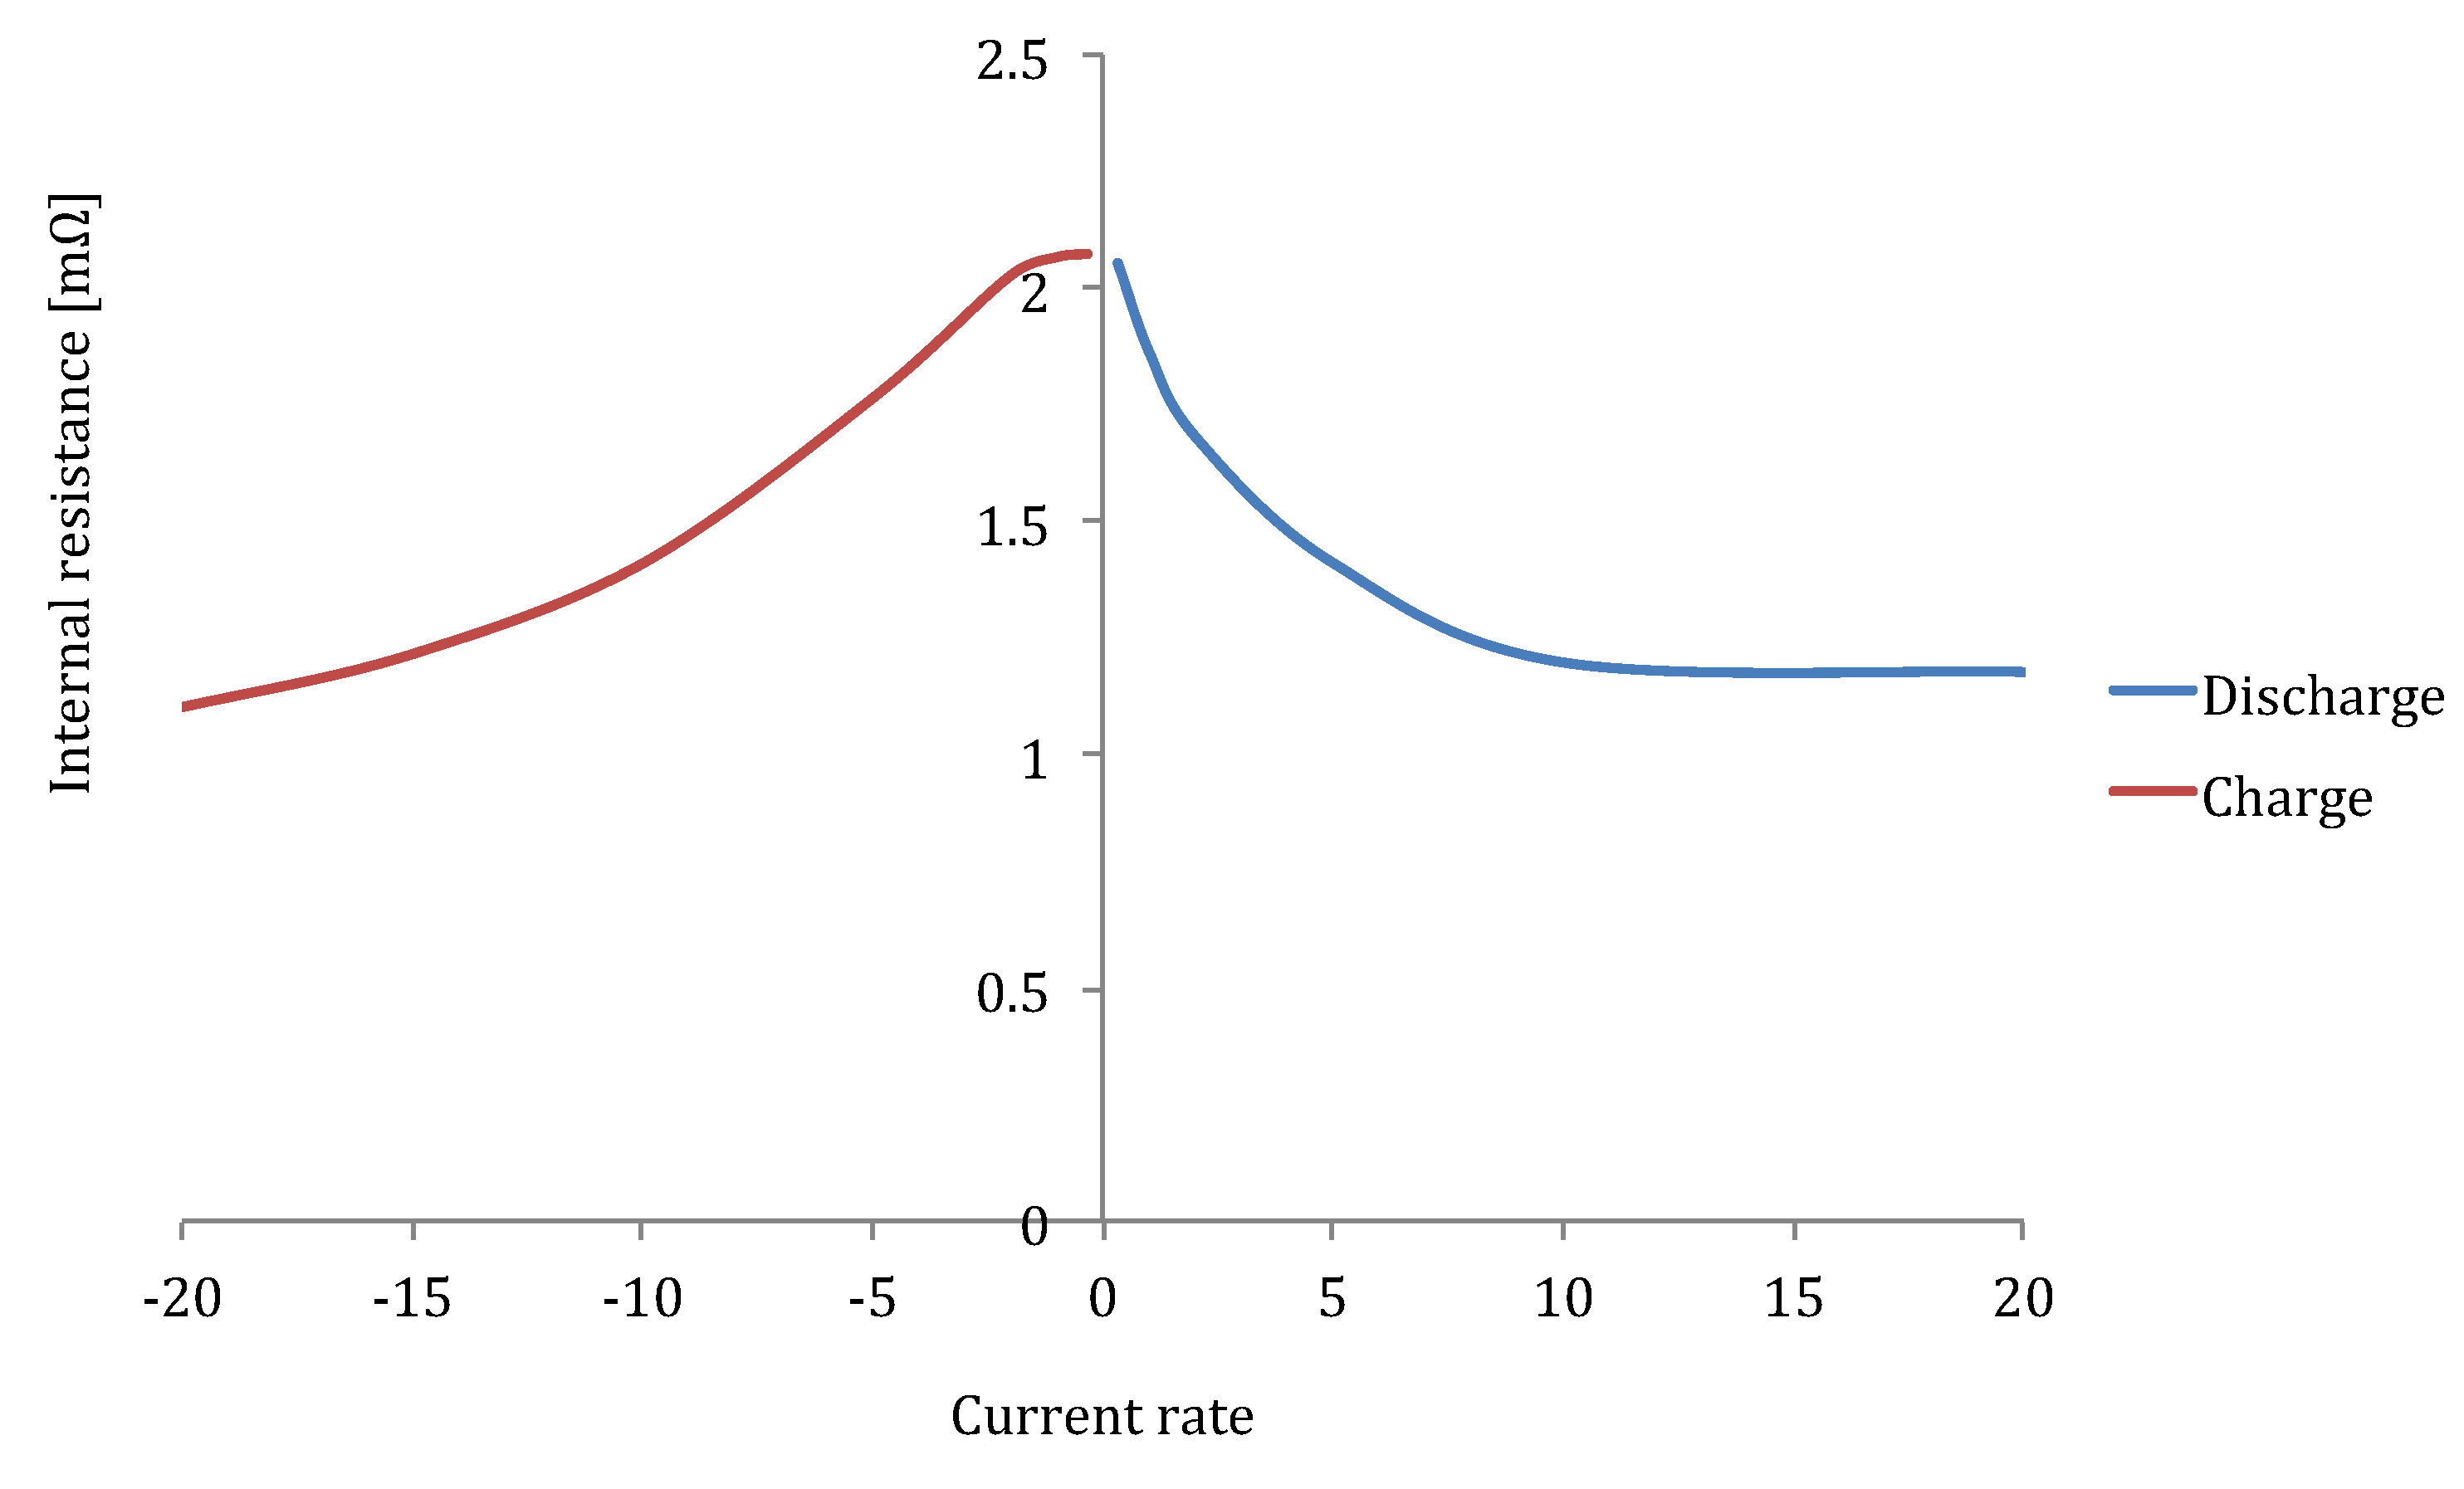
In [
84,
85] it is mentioned that the energy efficiency of electrochemical processes decreases with increasing current rate, due to the increase of the internal resistance. However,
Figure 28 shows the opposite of this explanation. The internal resistance decreases the more the current rate increases.
This phenomenon can be analyzed based on the Butler-Volmer relationship [
86], presented in general form by Equation (16):
with:
I: electrode current [A];
A: electrode active surface area [m2];
Io: exchange current density [A/m2];
U: electrode potential [V];
Uo: equilibrium potential [V];
F: Farady constant;
T: Temperature [K];
R: Universal gas constant;
αa, αc: anodic and cathodic charge transfer coefficient, respectively;
n: activation overpotential.
The first term in the second part represents the rate of the anodic process and the second term corresponds to the rate of the cathodic process. It should be pointed out that the Butler-Volmer equation does not consider the mass transfer phenomena in the system.
Figure 28.
Resistance evolution in function of current rate [
61].
Figure 28.
Resistance evolution in function of current rate [
61].
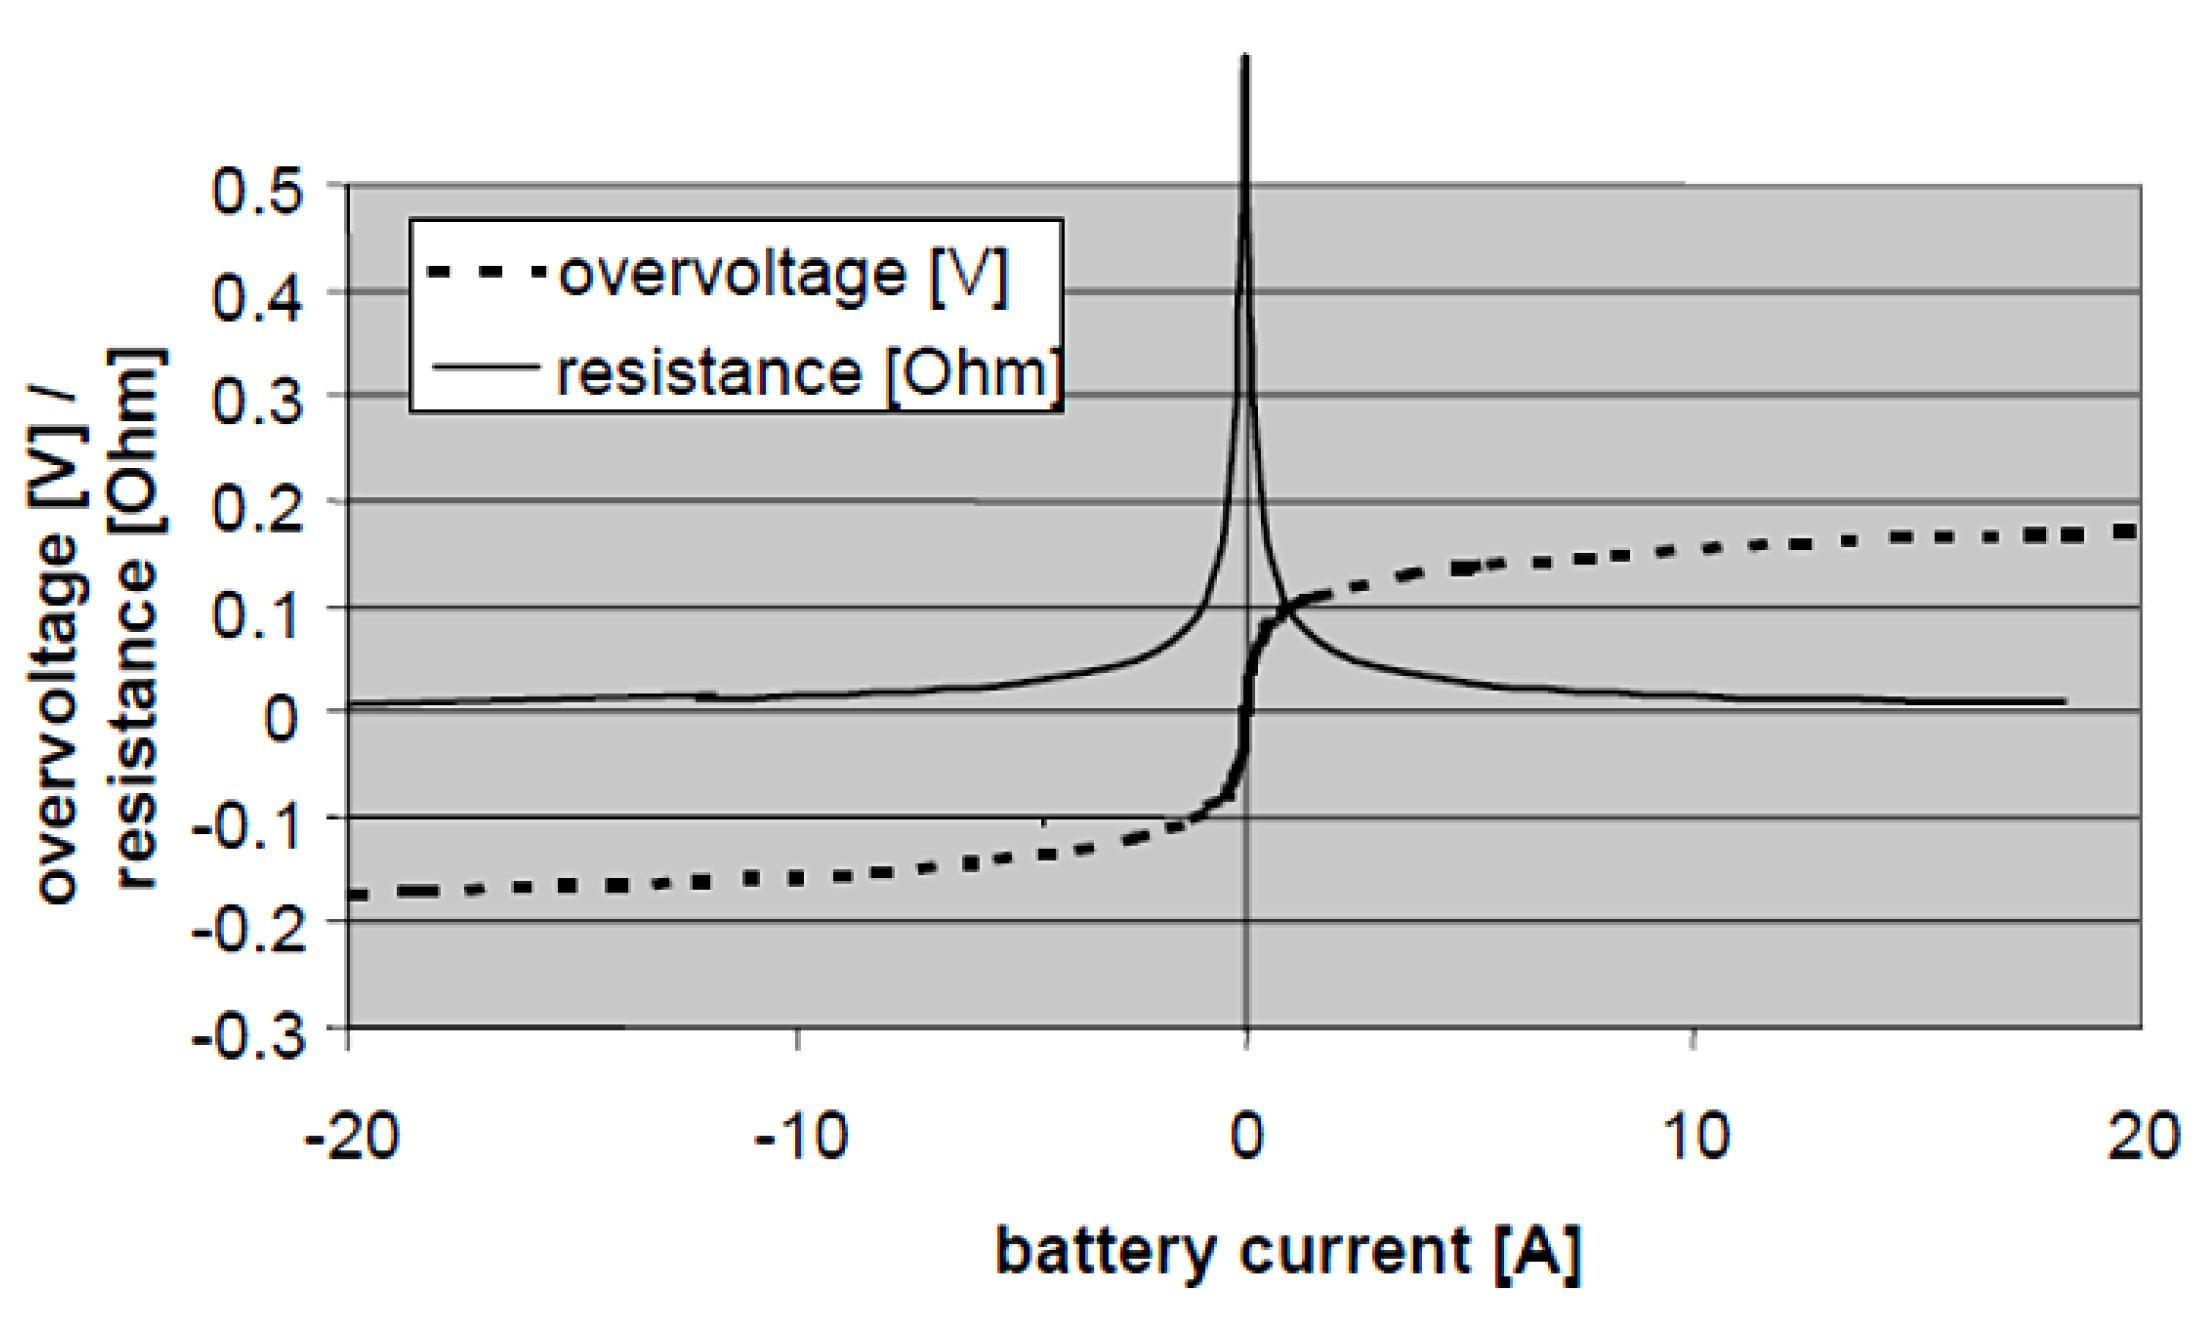
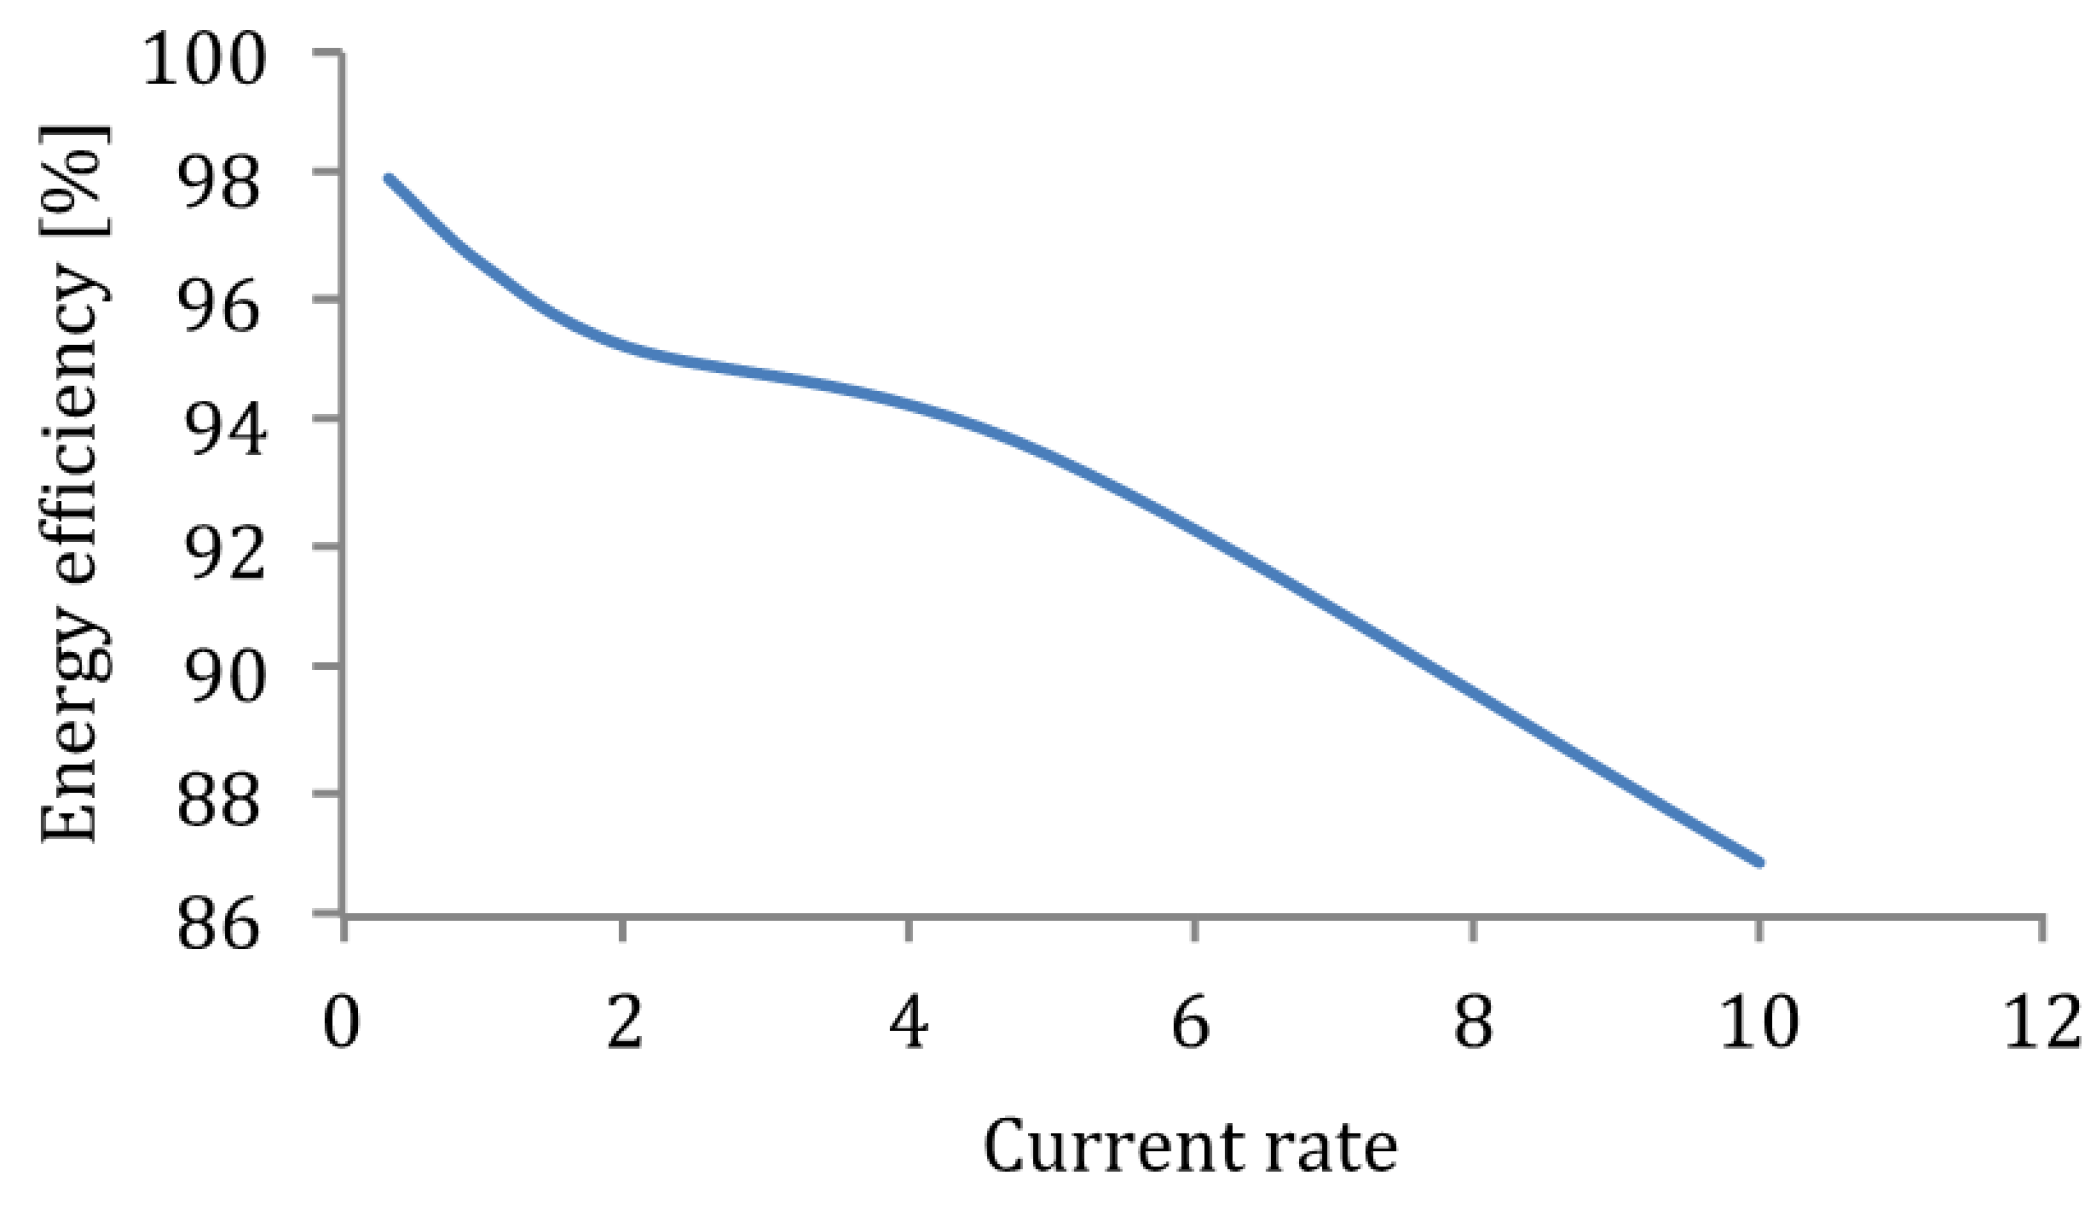
The Butler-Volmer characteristic shows a logarithmical increase of the voltage with increasing current rate rather than a linear relationship
Figure 29. Hence the resistance of this process is decreasing. Nevertheless, the overall voltage drop is still increasing with increasing current rate. Therefore the efficiency will decrease with increasing current rate due to the losses in the resistance R·I
2 (see
Figure 30). Although, the resistance decreases, the impact of current is quadratic.
Figure 29.
Butler-Volmer representation [
87].
Figure 29.
Butler-Volmer representation [
87].
Figure 30.
Energy efficiency versus current rate.
Figure 30.
Energy efficiency versus current rate.
These phenomena only pertain to the voltage response during the polarization part. Thus, the ohmic part which is based on a suddenly voltage drop, is not included. Therefore, there is a need for modification of the Butler-Volmer equation as follows:
The results in
Table 8 of EDLCs reveal the high power capabilities of these devices, with power densities up to 11 kW. This indicates again that these performances are very interesting energy sources for high power applications, where peak power should be supplied during short durations. Here, the power density has been determined based on the calculation as described in the standard IEC 62576, U an R representing the rated voltage and internal resistance of the ELDC cell as illustrated in
Figure 31 [
88]:
In [
85] Burke proposes the introduction of similar energy efficiency calculations for EDLCs. Due to the lower internal resistance, he specified an energy efficiency of 95%. He came to the conclusion that the proposed methodology by IEC does not match the internal resistance, and proposed the empirical Equation (19). According to this method, the power density is in the range of 1000–1200 W/kg, which is much higher than the capabilities of lithium-ion technology. Here, it should be figured out that high energy lithium-ion batteries can be combined with EDLCs in order to enhance the overall battery abilities in the terms of energy, power and efficiency:
Figure 31.
Internal resistance determination method for EDLCs according standard IEC 62576 [
88].
Figure 31.
Internal resistance determination method for EDLCs according standard IEC 62576 [
88].
Table 8.
Power density results of EDLCs.
Table 8.
Power density results of EDLCs.
| | Power density according IEC methodology | Power density according to [85] @ 95% energy efficiency |
|---|
| A-EDLC | 9773 | 1126 |
| B-EDLC | 11054 | 1261 |
| C-EDLC | 8516 | 958 |
| D-EDLC | 4050 | 998 |
| E-EDLC | 9210 | 1000 |
| F-EDLC | 10279 | 1217 |
| G-EDLC | 8877 | 998 |
2.2.3.1. Lithium-Ion Battery Behaviour Description
As reported in [
89,
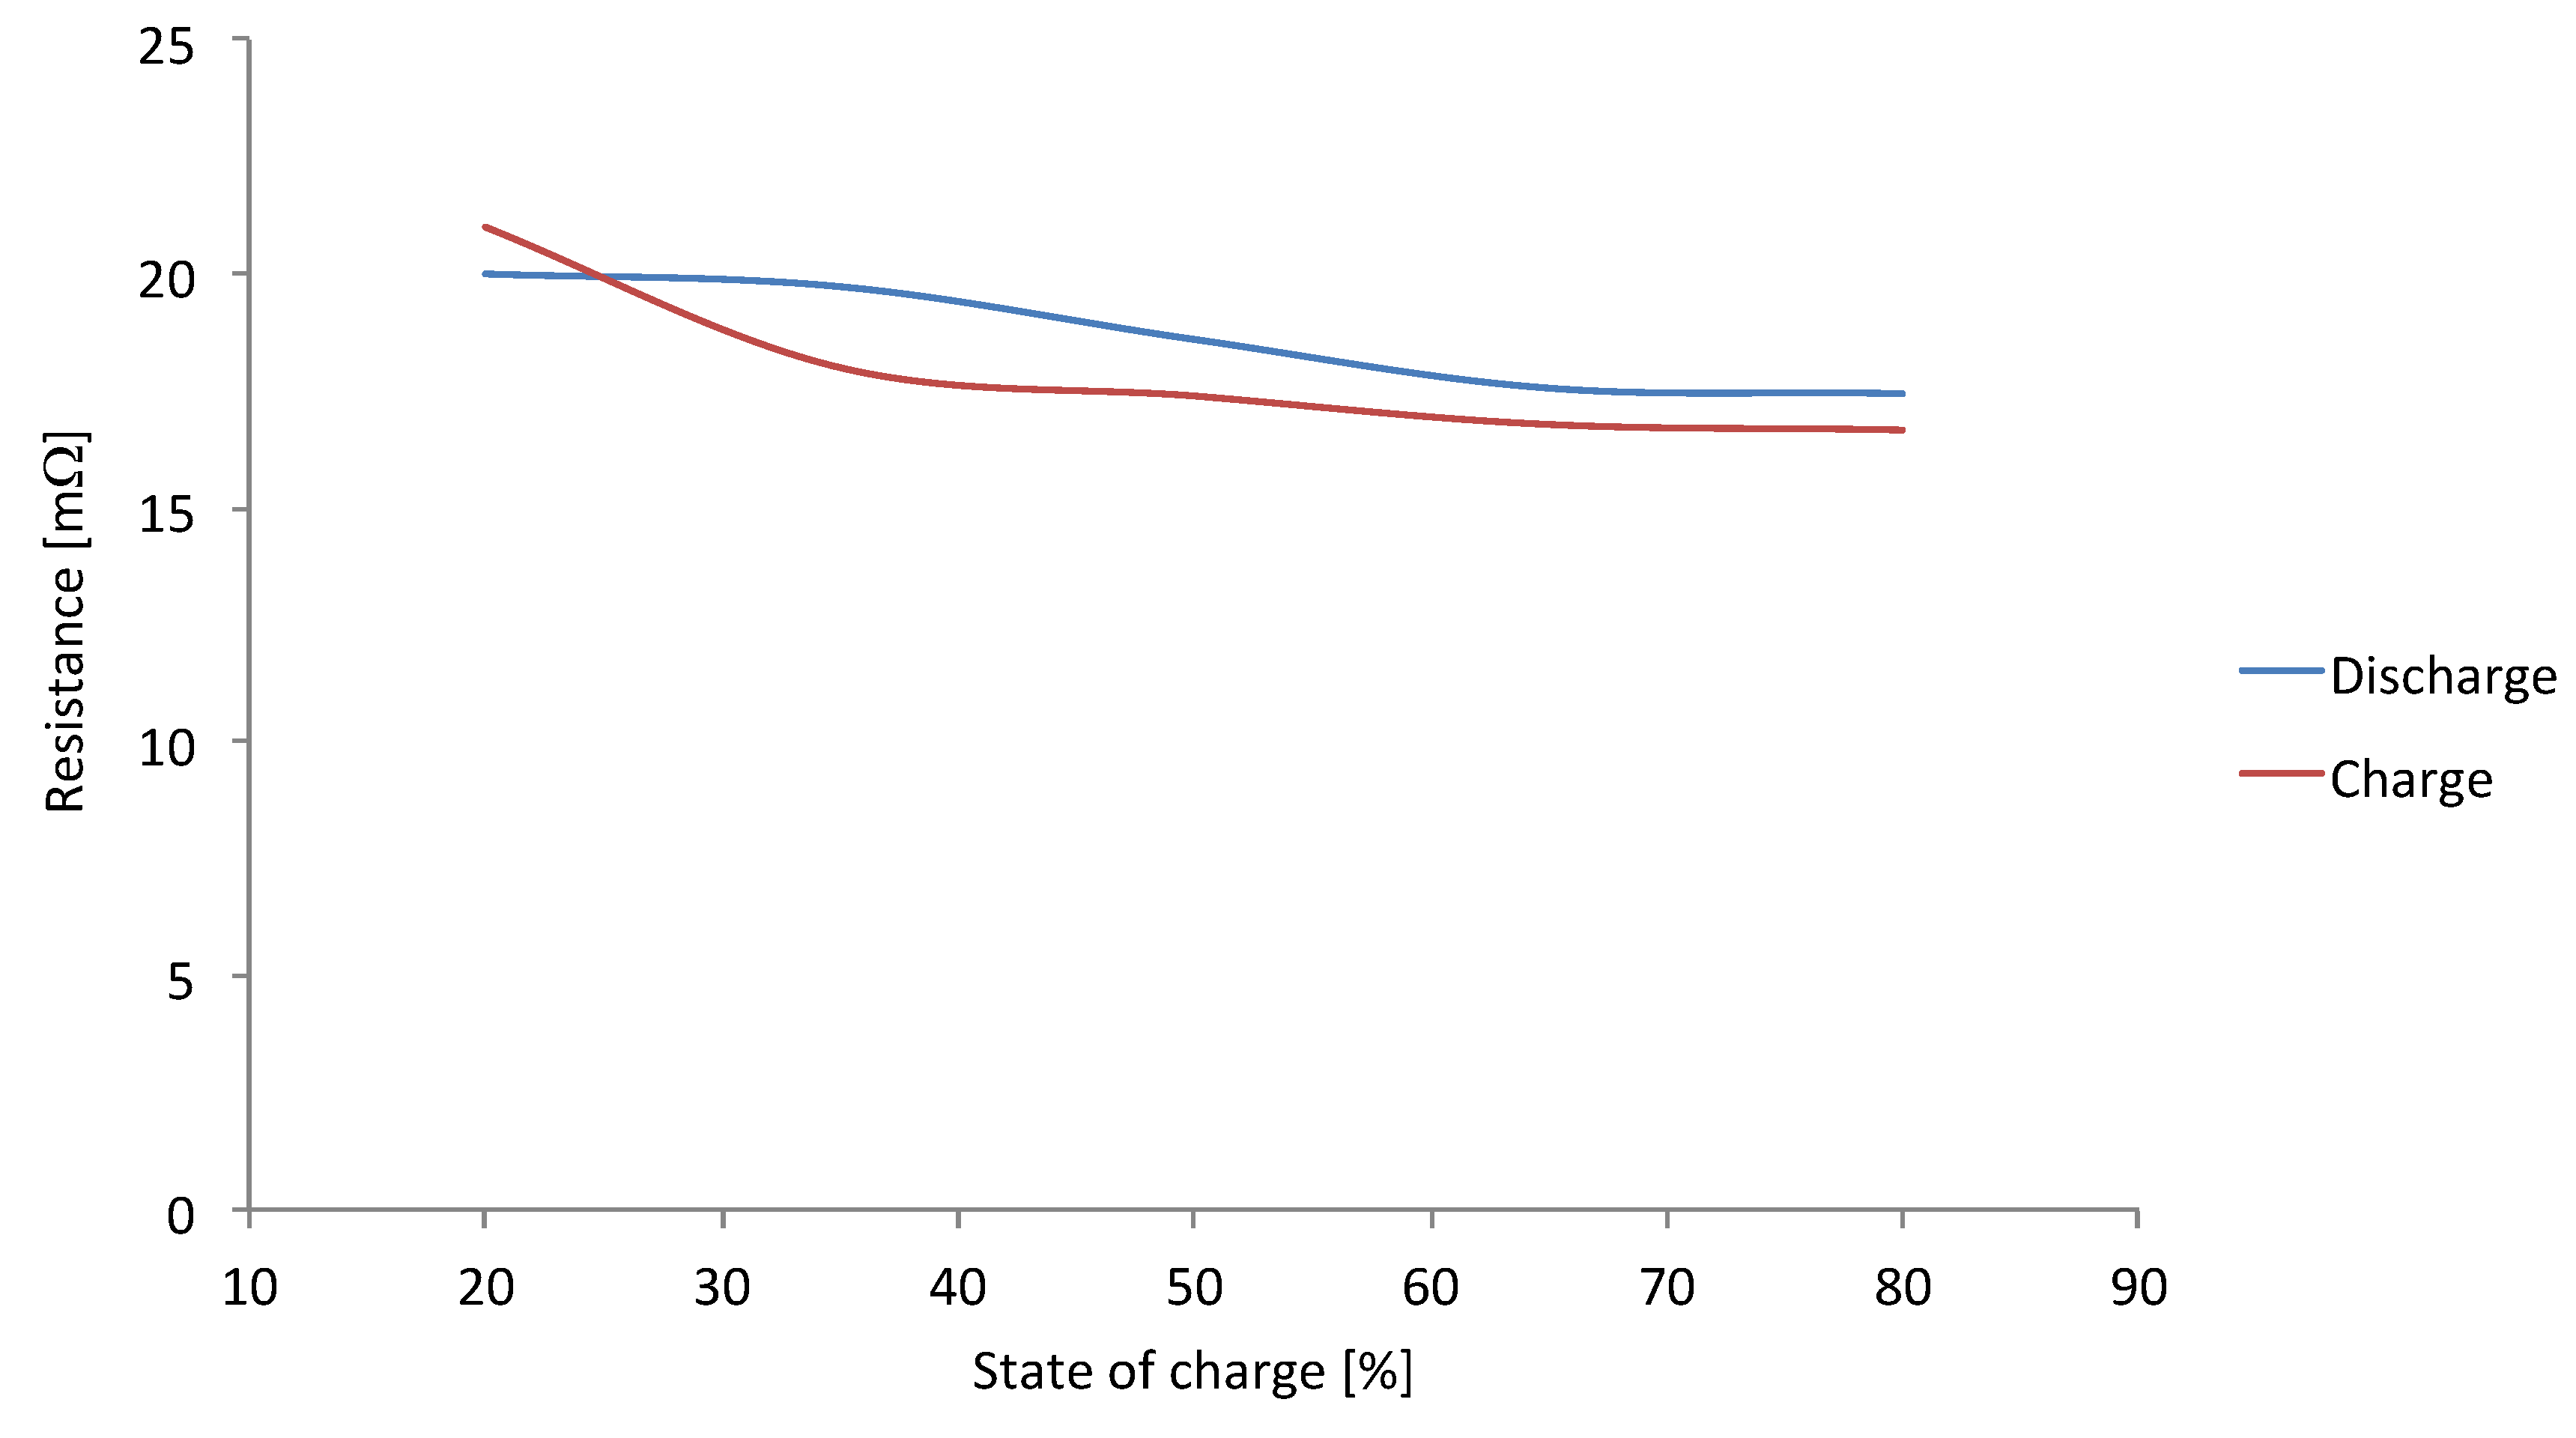
90] the FreedomCar and Thevenin battery models are derived from the HPPC test. The model has been built based on several assumptions. The ohmic resistance R
o supposes that the charge and discharge resistance of a battery are equal, as shown in
Figure 32 however these two resistances are different. Thus, in order to take this issue into account, the ohmic resistance R
o should be divided in two parts: charge resistance R
ch and discharge resistance R
dis. Furthermore, the HPPC pulse assumes a rest time of 40 s between the charge and discharge pulses is not enough for stabilization of the voltage between two consecutive pulses. This aspect is of high importance for modeling purposes, where the battery model parameters should be extracted at high accuracy. Especially, at higher current rates and low temperatures, the voltage disturbance is bigger. Thus, the rest time between the consecutive pulses should be in the range of 150–200 s.
Figure 32.
Evolution of internal resistance during charge and discharge (battery brand A-LFP).
Figure 32.
Evolution of internal resistance during charge and discharge (battery brand A-LFP).
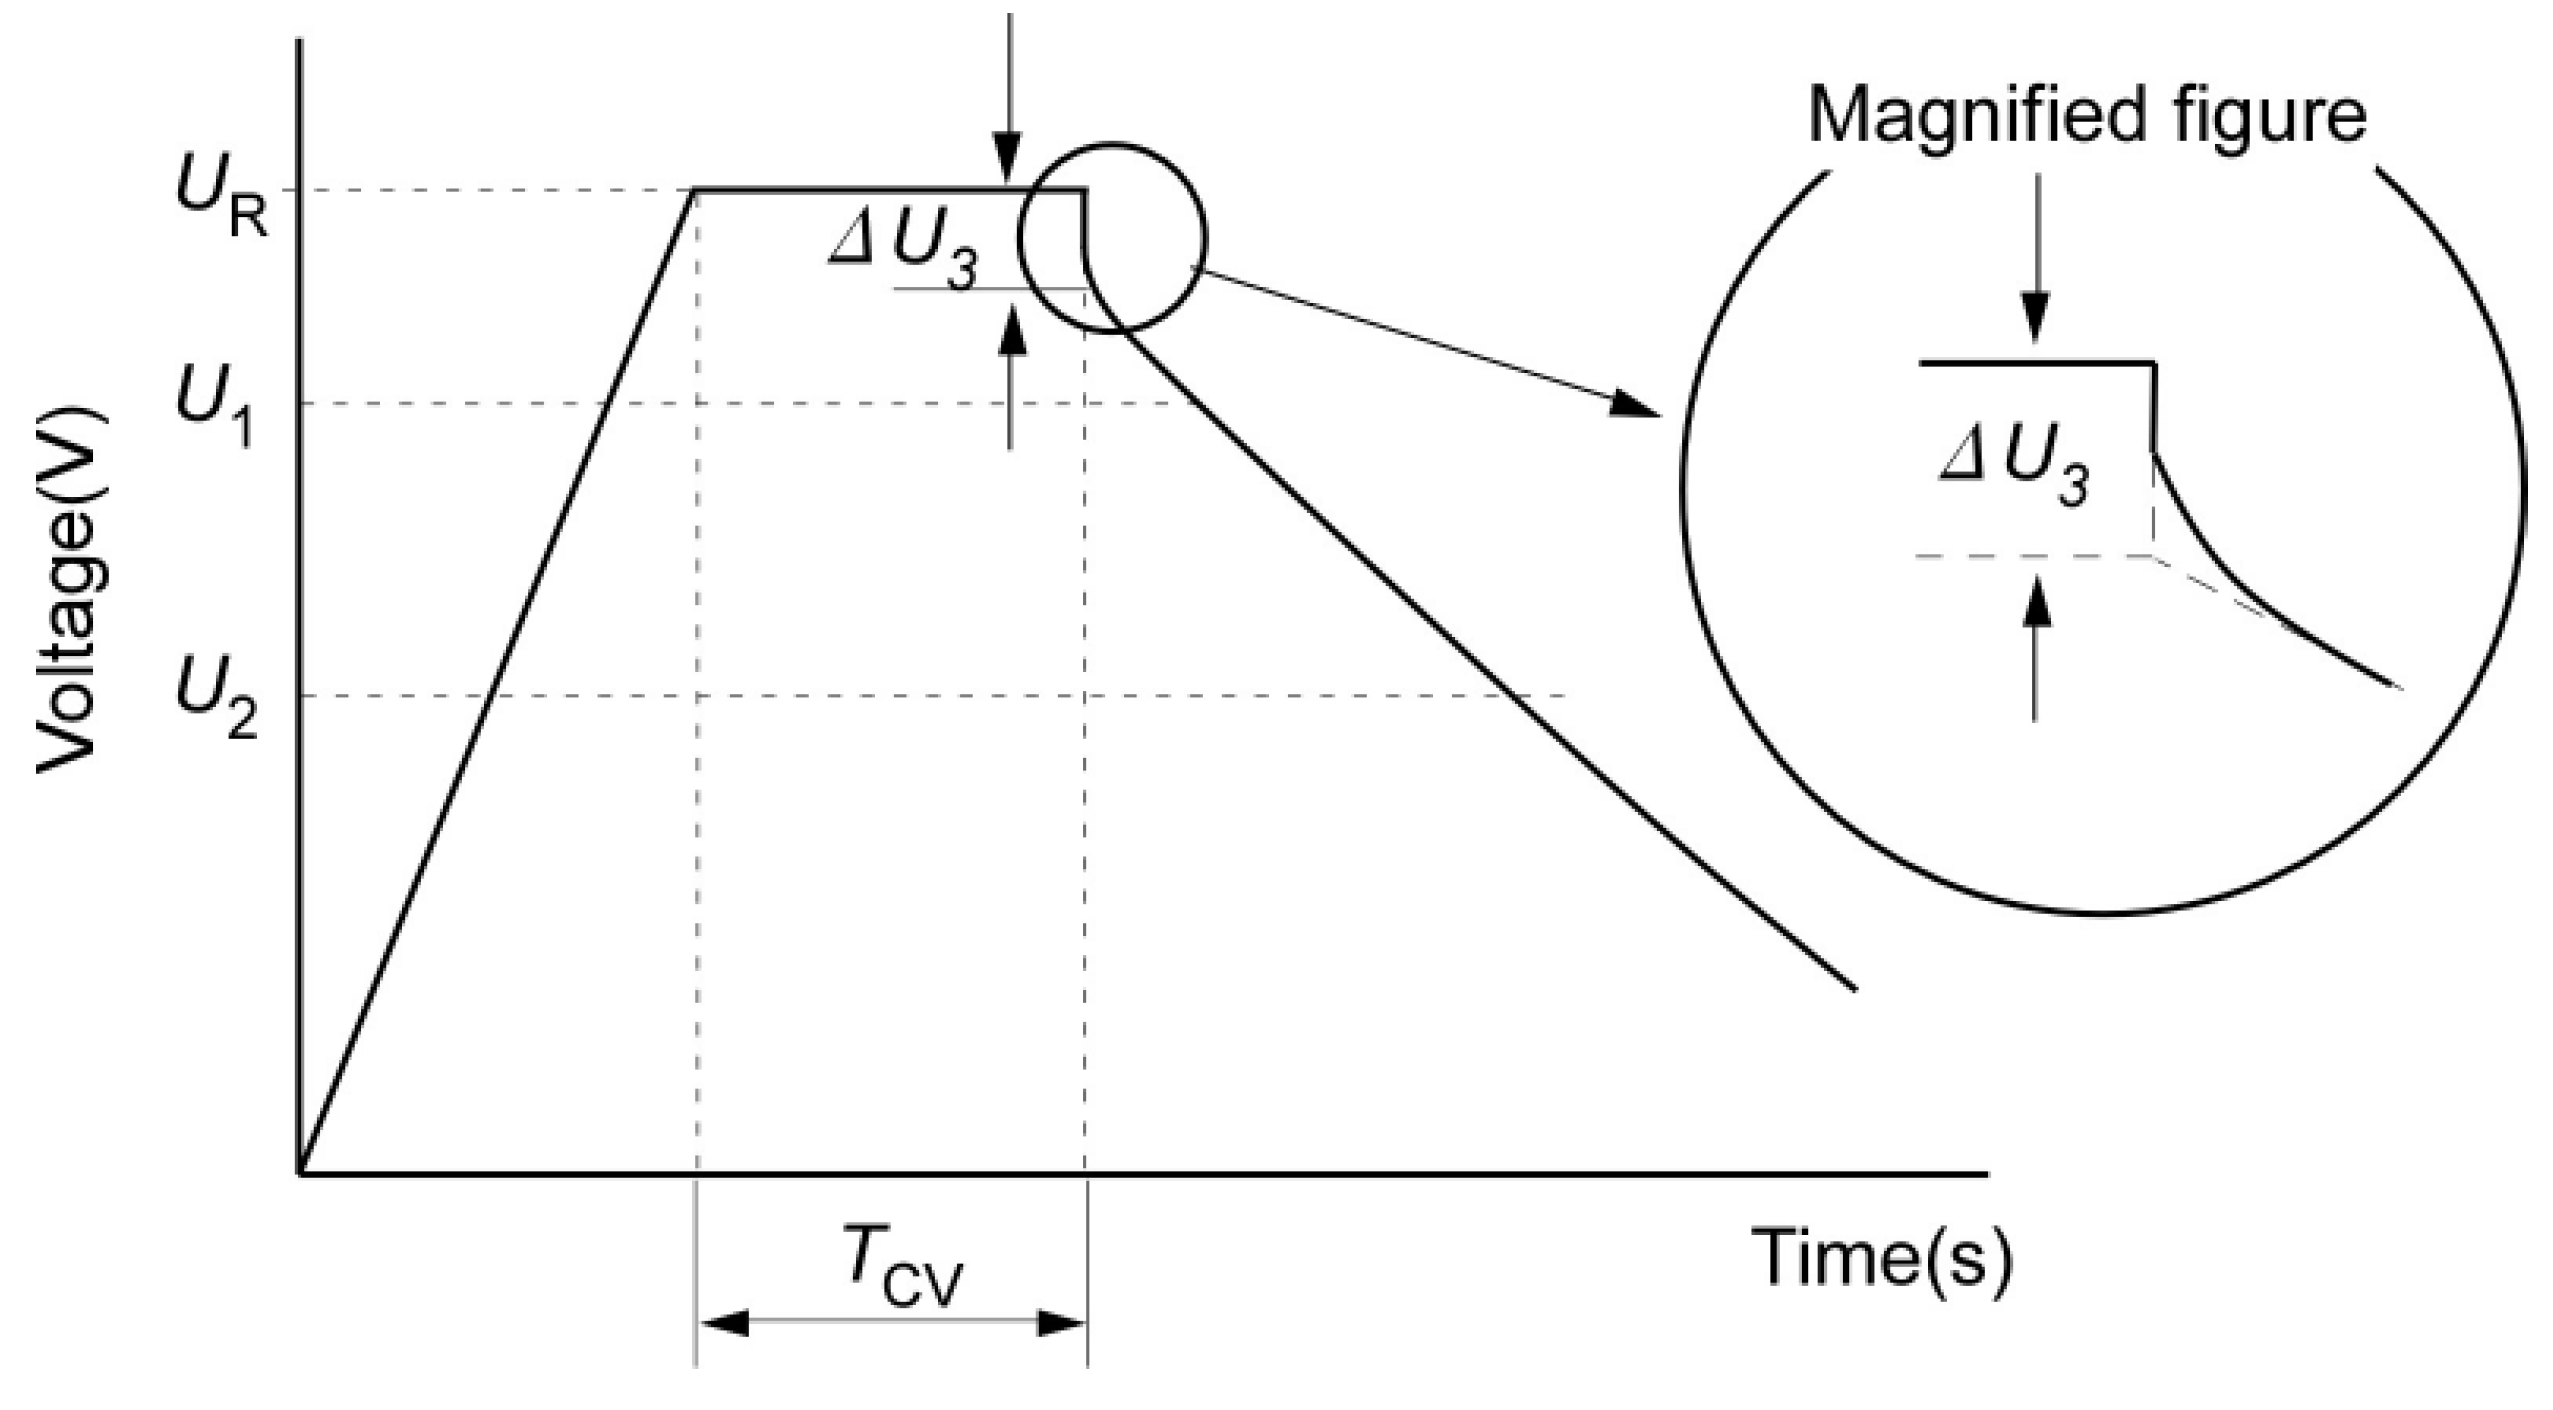
Here, it should be underlined that ohmic resistance represents the sudden voltage drop (from V
1 to V
2 in
Figure 26), while the voltage drop from V
2 to V
3 is the polarization resistance. Moreover, at the end of the pulse, when the load goes to zero, the ohmic resistance seems not equal to the ohmic resistance when the load disappears. As an example the ohmic resistance for both situations has been calculated.
It is clear that these two resistances differ from each other and this impact should also be included in the battery model. Then,
Figure 26 shows the polarization resistance during the recovery process. As mentioned above, this process needs about 200 s until the voltage has been stabilized. Finally, all the mentioned processes depend of the charge and discharge processes and thus should be proposed for charge and discharge.
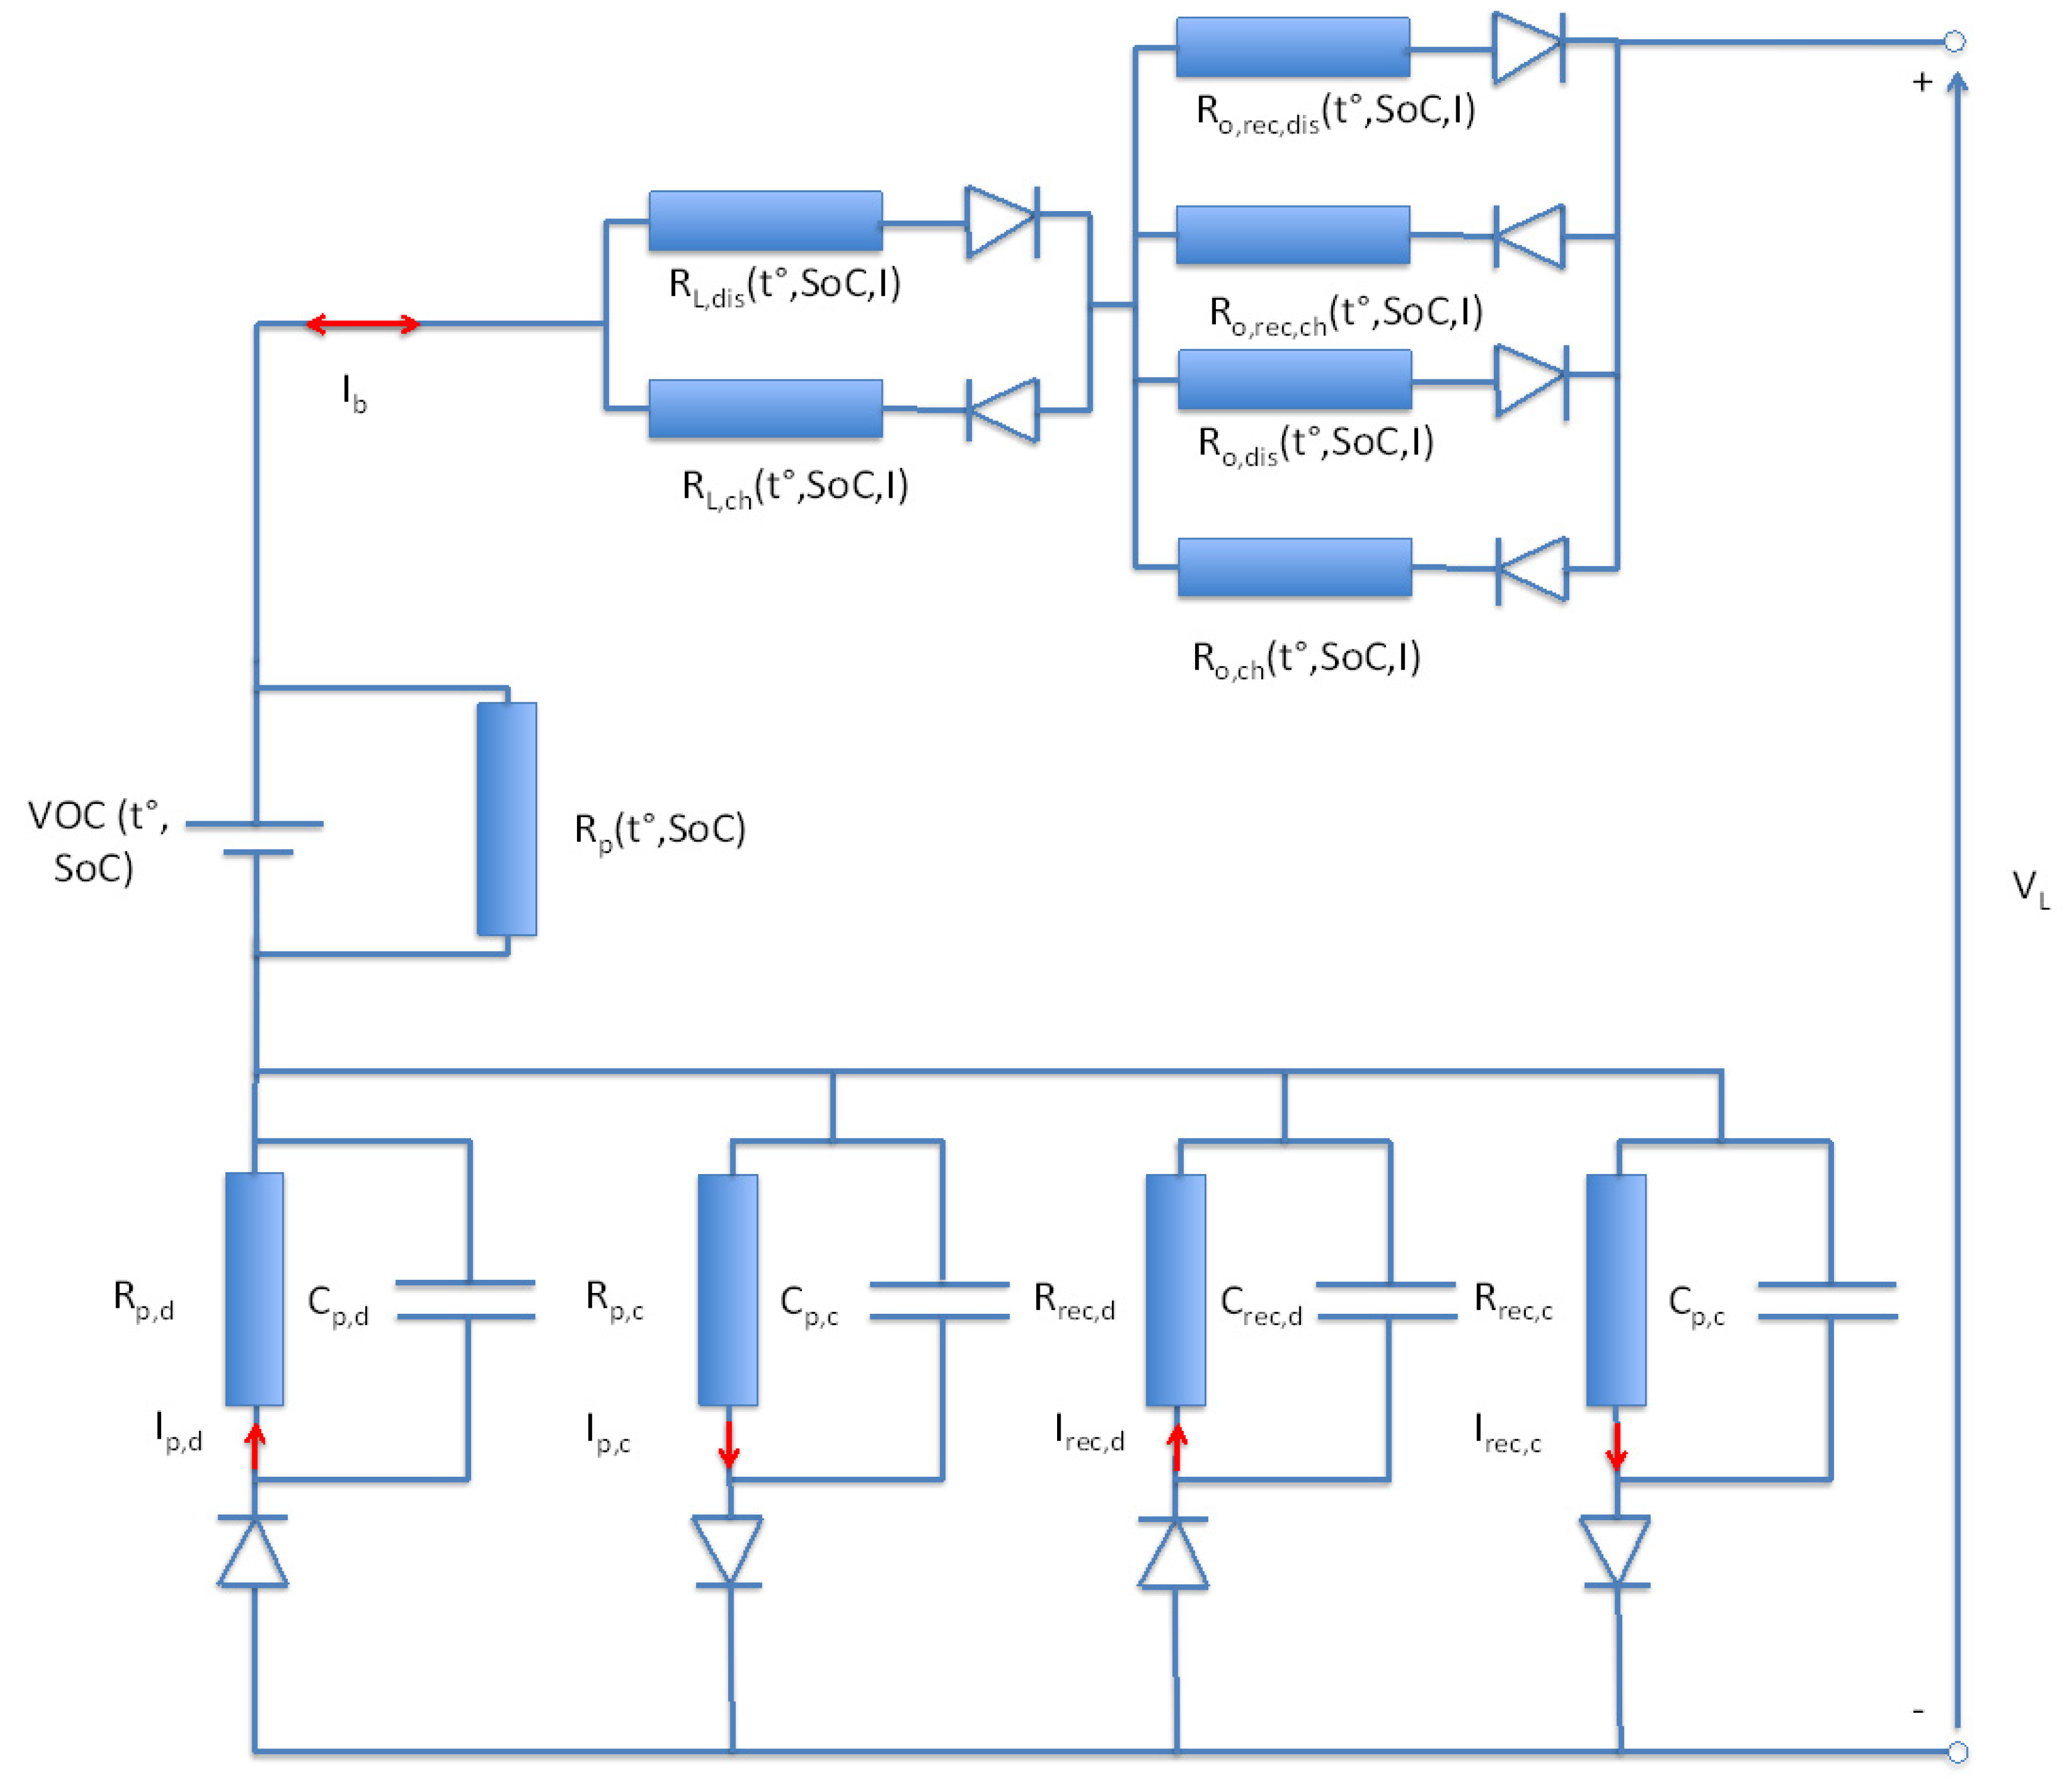
In order to represents all these issue in an electrical circuit, the following model as presented in
Figure 33 is proposed. We call this the advanced Thevenin battery model. It consists of two ohmic resistances R
o,ch, R
o,dis and two resistances R
L,ch, R
L,dis representing the increase of the ohmic resistance in function of cycle life. Furthermore, the model features a self-discharge resistance across the open circuit voltage (VoC). In order to describe the transition phenomena during charge and discharge two RC circuits have been added. Two further RC branches are also added to represent the polarization phenomena when the load disappears. As discussed above, the resistances R
o,rec,ch, R
o,rec,dis representing the resistances when the load disappears, are also included.
In the next contribution, the performances of this model intensively will be analyzed and compared against another battery models.
Figure 33.
New lithium-ion battery model.
Figure 33.
New lithium-ion battery model.


