Article

Exploring Malaysia’s Transformation to Net Oil Importer and Oil Import Dependence

Graduate School of System Design and Management, Keio University, Collaboration Complex, 4-1-1 Hiyoshi, Kohoku-ku, Yokohama, Kanagawa 223-8526, Japan
*
Author to whom correspondence should be addressed.
Energies 2012, 5(8), 2989-3018; https://doi.org/10.3390/en5082989
Submission received: 4 May 2012 / Revised: 26 July 2012 / Accepted: 31 July 2012 / Published: 10 August 2012

Abstract

:
Within ASEAN, Malaysia is a major oil-exporting country; however, it is expected to become a net oil-importing country in the near future. This issue brings concerns over Malaysia’s energy security, particularly on the aspect of oil import dependency. This is because its transportation and industrial sectors are still heavily dependent on oil products. By simulating dynamic interplays between developments in Malaysia’s oil sector and its economy sectors, this study explores the possible years of the transformation and the extent to which it will be dependent on oil import. Four scenarios related to enhanced oil recovery, exploration and production investment, subsidy elimination and technology advances are considered for the simulation. In isolation, the subsidy elimination scenario provides the best result. However, if all scenarios are considered simultaneously, an undesired effect emerges. The earliest that Malaysia is expected to become a net oil-importing country is 2012 and the latest is 2021. Malaysia’s dependence on oil imports is expected to continue increasing. In all scenarios, the shares of oil import in the total supply rise to above 90% in 2030, with the highest share at 97%.

1. Introduction

Among the 10 countries of the Association of South East Asian Nations (ASEAN) there are two major oil exporters: Indonesia and Malaysia. In the last five years, both countries’ annual oil exports were at par with the average of 25 Mtoe per year [1]. However, over the last decade, Indonesia’s oil production has been declining, which eventually led to the country becoming a net oil importer and it withdrew from the Organization of the Petroleum Exporting Countries (OPEC) in 2008. It can be foreseen that Malaysia may experience the same circumstances in the near future. As an energy exporting country, Malaysia’s energy industry is crucial to its economy, especially the oil and gas industries. Although the gas industry is now the largest contributor to the government’s revenue, the oil industry still provides a significant contribution to Malaysia’s economy. The value of oil exports has accounted for approximately 10% of Malaysia’s GDP in the last five years, as shown in Table 1. However, Malaysia’s status as a net oil exporter is at the brink as its oil wells are maturing and oil production is waning. On the other hand, the country’s oil consumption remains on an increasing trend driven by the country’s strong economic development.
Table 1. Oil export value in GDP.
YearGDP (Billion USD) [2]Oil export (Billion USD) *%
2006146.014.49.9%
2007155.515.910.2%
2008163.021.713.3%
2009160.313.88.6%
2010171.817.710.3%
* Authors’ calculation using oil export data from [1] and Tapis oil price from [3].
The above issue did not gain the nation’s attention until 2005, when the deputy prime minister at that time, Datuk Seri Najib Razak, made the startling statement that Malaysia’s cannot continue to rely on the oil sector as it will become a net oil importer in 2009. The statement was then repeated in an article by the National Economic Action Council [4]. Nowadays, the issue has become an increasingly important topic for Malaysia. This is mainly because it is related to a larger issue, namely energy security. However, to the best of our knowledge, there are no particular studies yet on the issue with relation to energy security. Nevertheless, there are some predictions on the year of the transformation, however, they fail to address the approaching energy security concerns.
This paper presents a study which explores the possible years of Malaysia becoming a net oil-importing country and the extent to which its energy security will be changed after the transformation. In the following, first we present a review of predictions on the transformation followed by an overview of Malaysia’s oil sector. We then explain the methodology of the study, followed by the results. The final section contains our discussion and conclusions from the study.

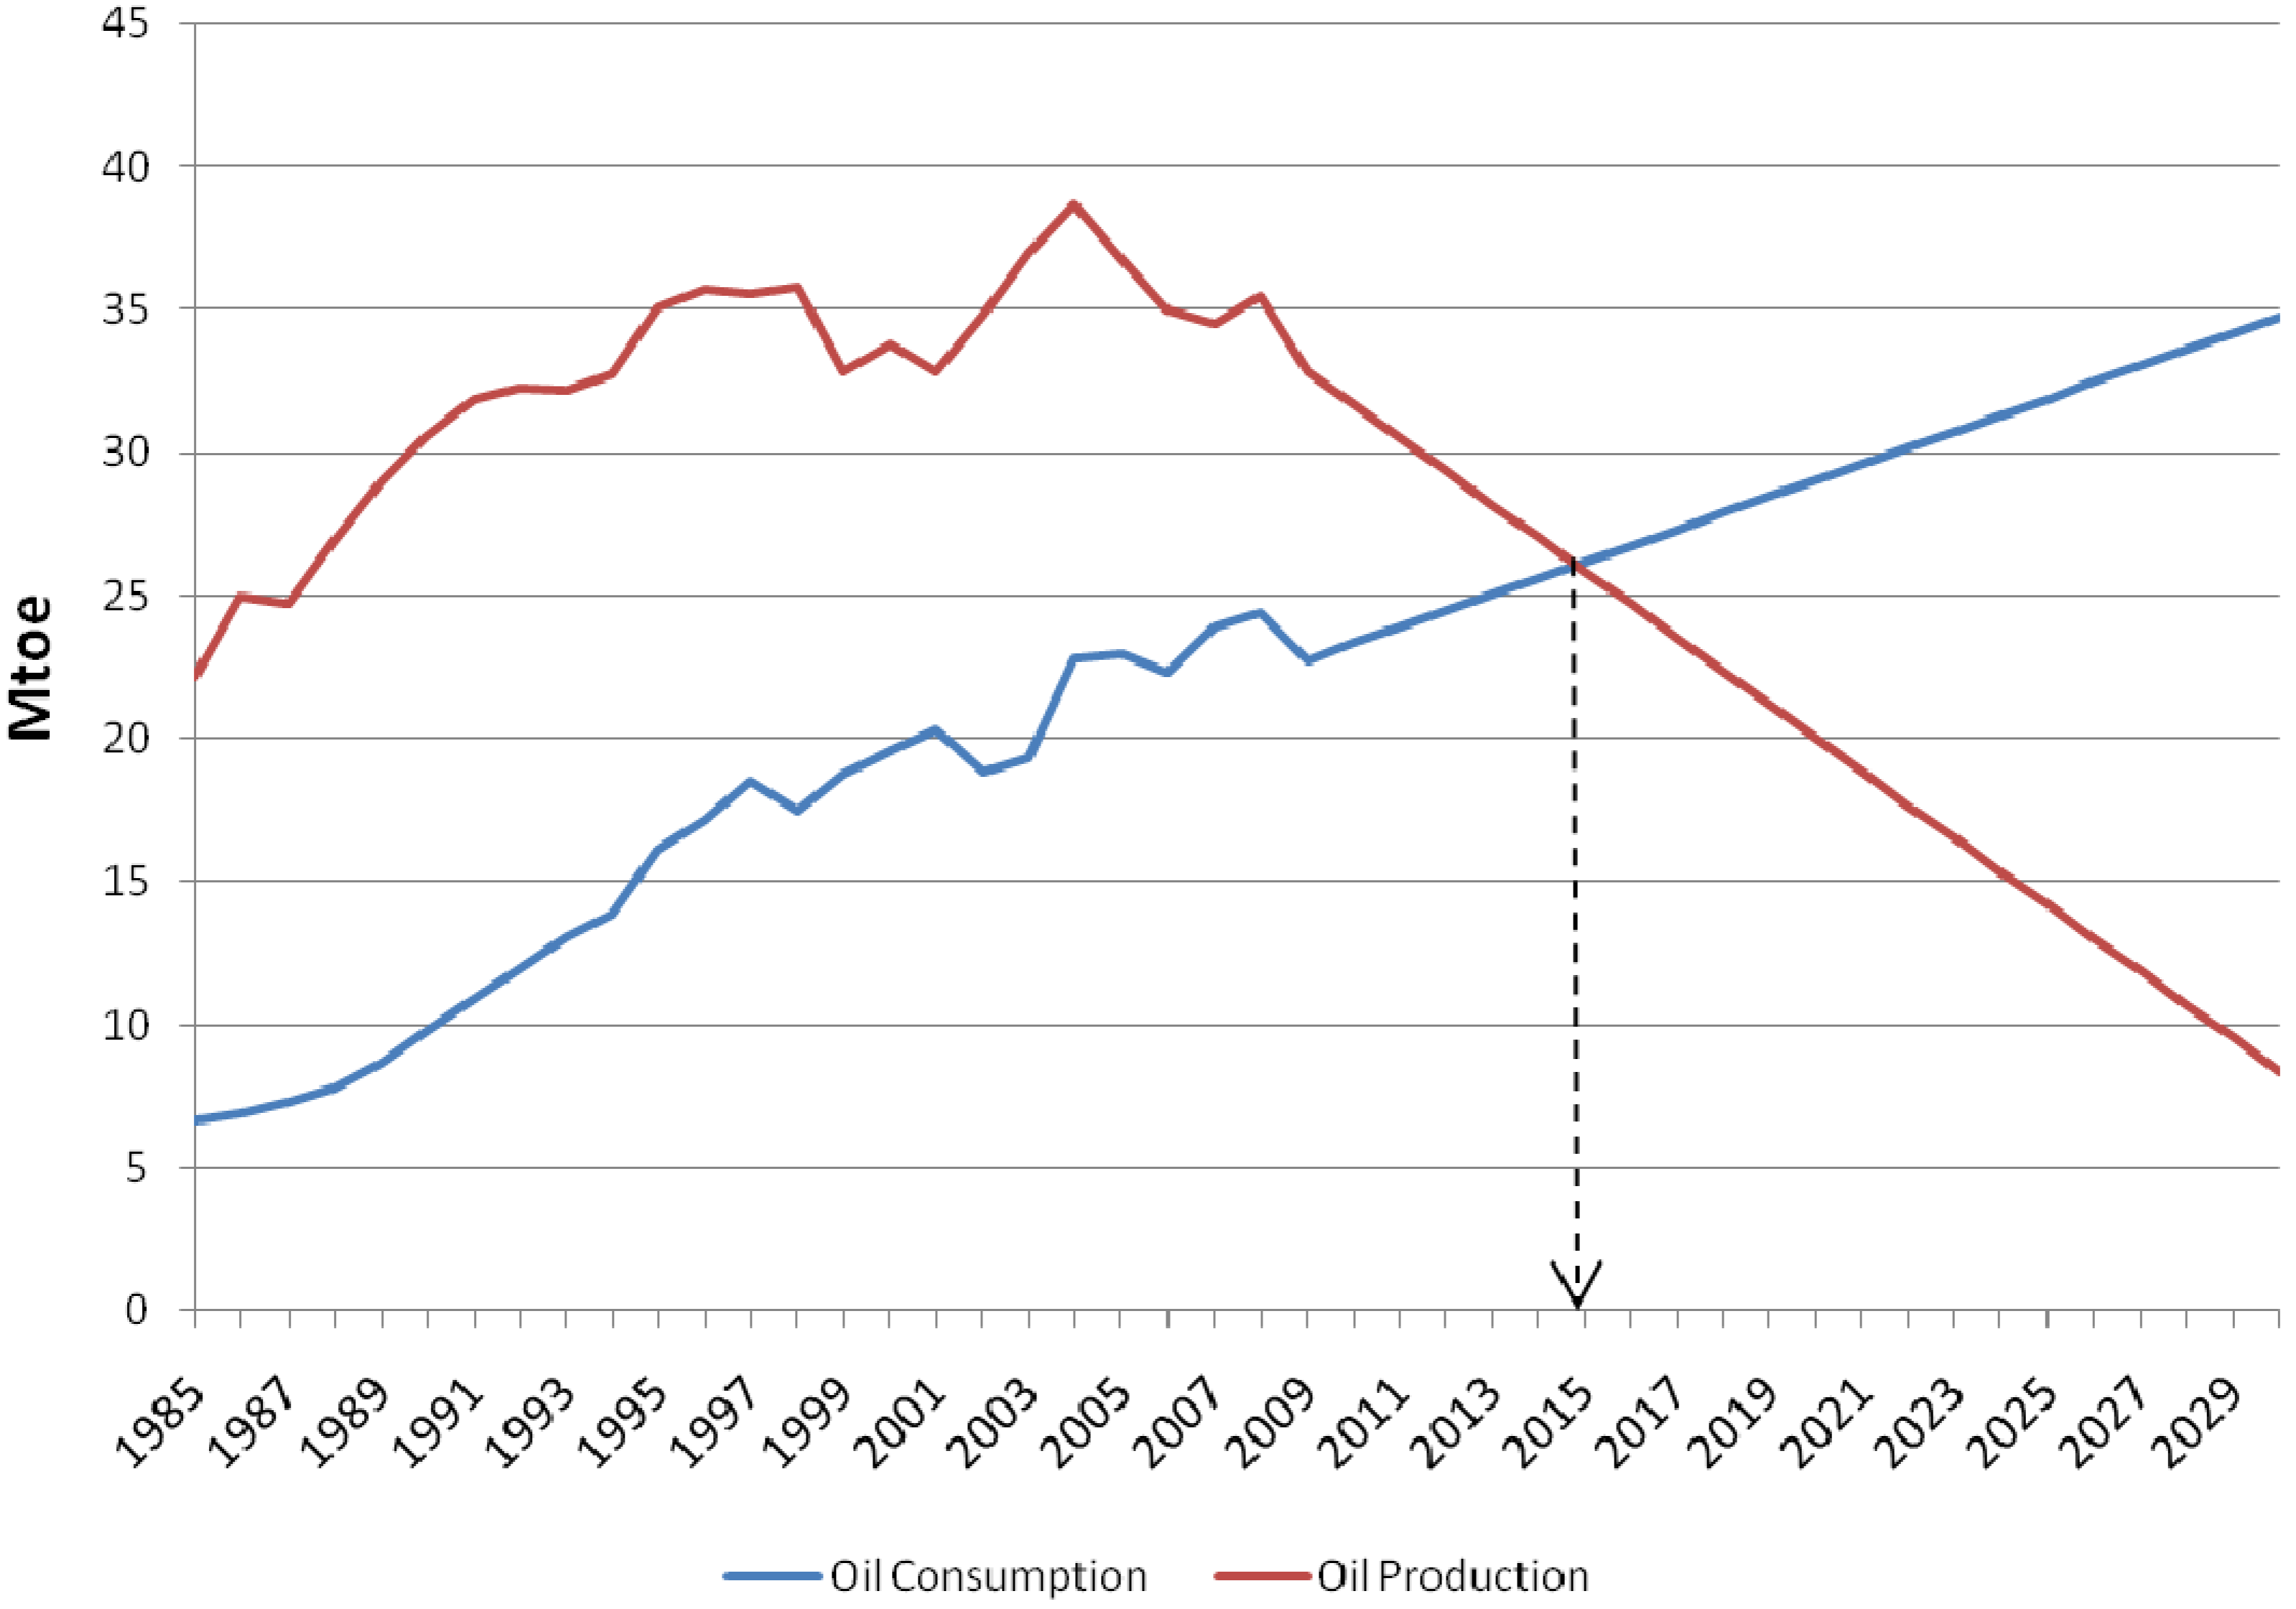
2. Prediction on Malaysia’s Net Oil Import Status

Predictions on when a country will become a net oil importer can be done by simply calculating oil production and consumption with a set of growth assumptions. Figure 1 shows an example of the calculation on Malaysia’s oil production and consumption trajectory based on their respective five years (2004–2009) average growth according to data from [1]. The calculation is best suited for generating quick and practical predictions on the transformation. However, it is only useful for short-term assessment purposes and is often short lived. This is because this type of prediction is disjointed from the economy sector that drives oil production and consumption. Economic factors such as investments, subsidies and energy trade, influence the dynamics of oil production and consumption.
Figure 1. Calculation on Malaysia’s oil production and oil consumption based on 5 years average growth (data source: [1]).
Energies 05 02989 g001
There are studies regarding Malaysia’s energy, such as [5,6,7]. However, these studies are principally based on a set of predetermined energy intensities and assumed economic growth. Therefore, it is rather difficult to maintain consistency between the energy sector and economy data. Moreover, they are not directly addressing the net oil import issue, as it is a relatively new issue. An exception is a recent study from [8] on Malaysia’s energy outlook. They develop an energy-economy model with one feedback from energy to economy sector. They predicted that the transformation will occur in 2013. However, in their study, oil production is exogenous, thus it does not relate to the economic development described in their model. Other predictions of the transformation are mainly based on Malaysia’s national oil company, Petroliam Nasional Berhad (Petronas), view on oil production and consumption. In [4] the transformation is predicted to occur in 2009. In [9], it is predicted to occur in 2012. Later, Petronas announced in [10] that 2011 would be the year of the transformation.
The year of the transformation may indicate a start of a more pressing issue of energy security, in this case oil import dependence. For Malaysia, the prospect of becoming highly dependent on oil imports is looming as its transportation and industry sector are still largely dependent on oil fuels. Increasing dependence on oil import will place Malaysia’s economy at higher risk (i.e., cost of import and supply security) due to the new challenges of meeting World oil demand, such as geo-political turmoil in Middle-East countries [11].
Considering that oil production and consumption are influenced by various economic factors, and that energy security issues will emerge along with the transformation, prediction on the precise year of the transformation is less significant and should only be seen as a part of any analysis. On the other hand, an analysis that explores the possible years under the different influences of various factors and their impacts on energy security is more valuable.

3. Malaysia’s Oil Sector Overview

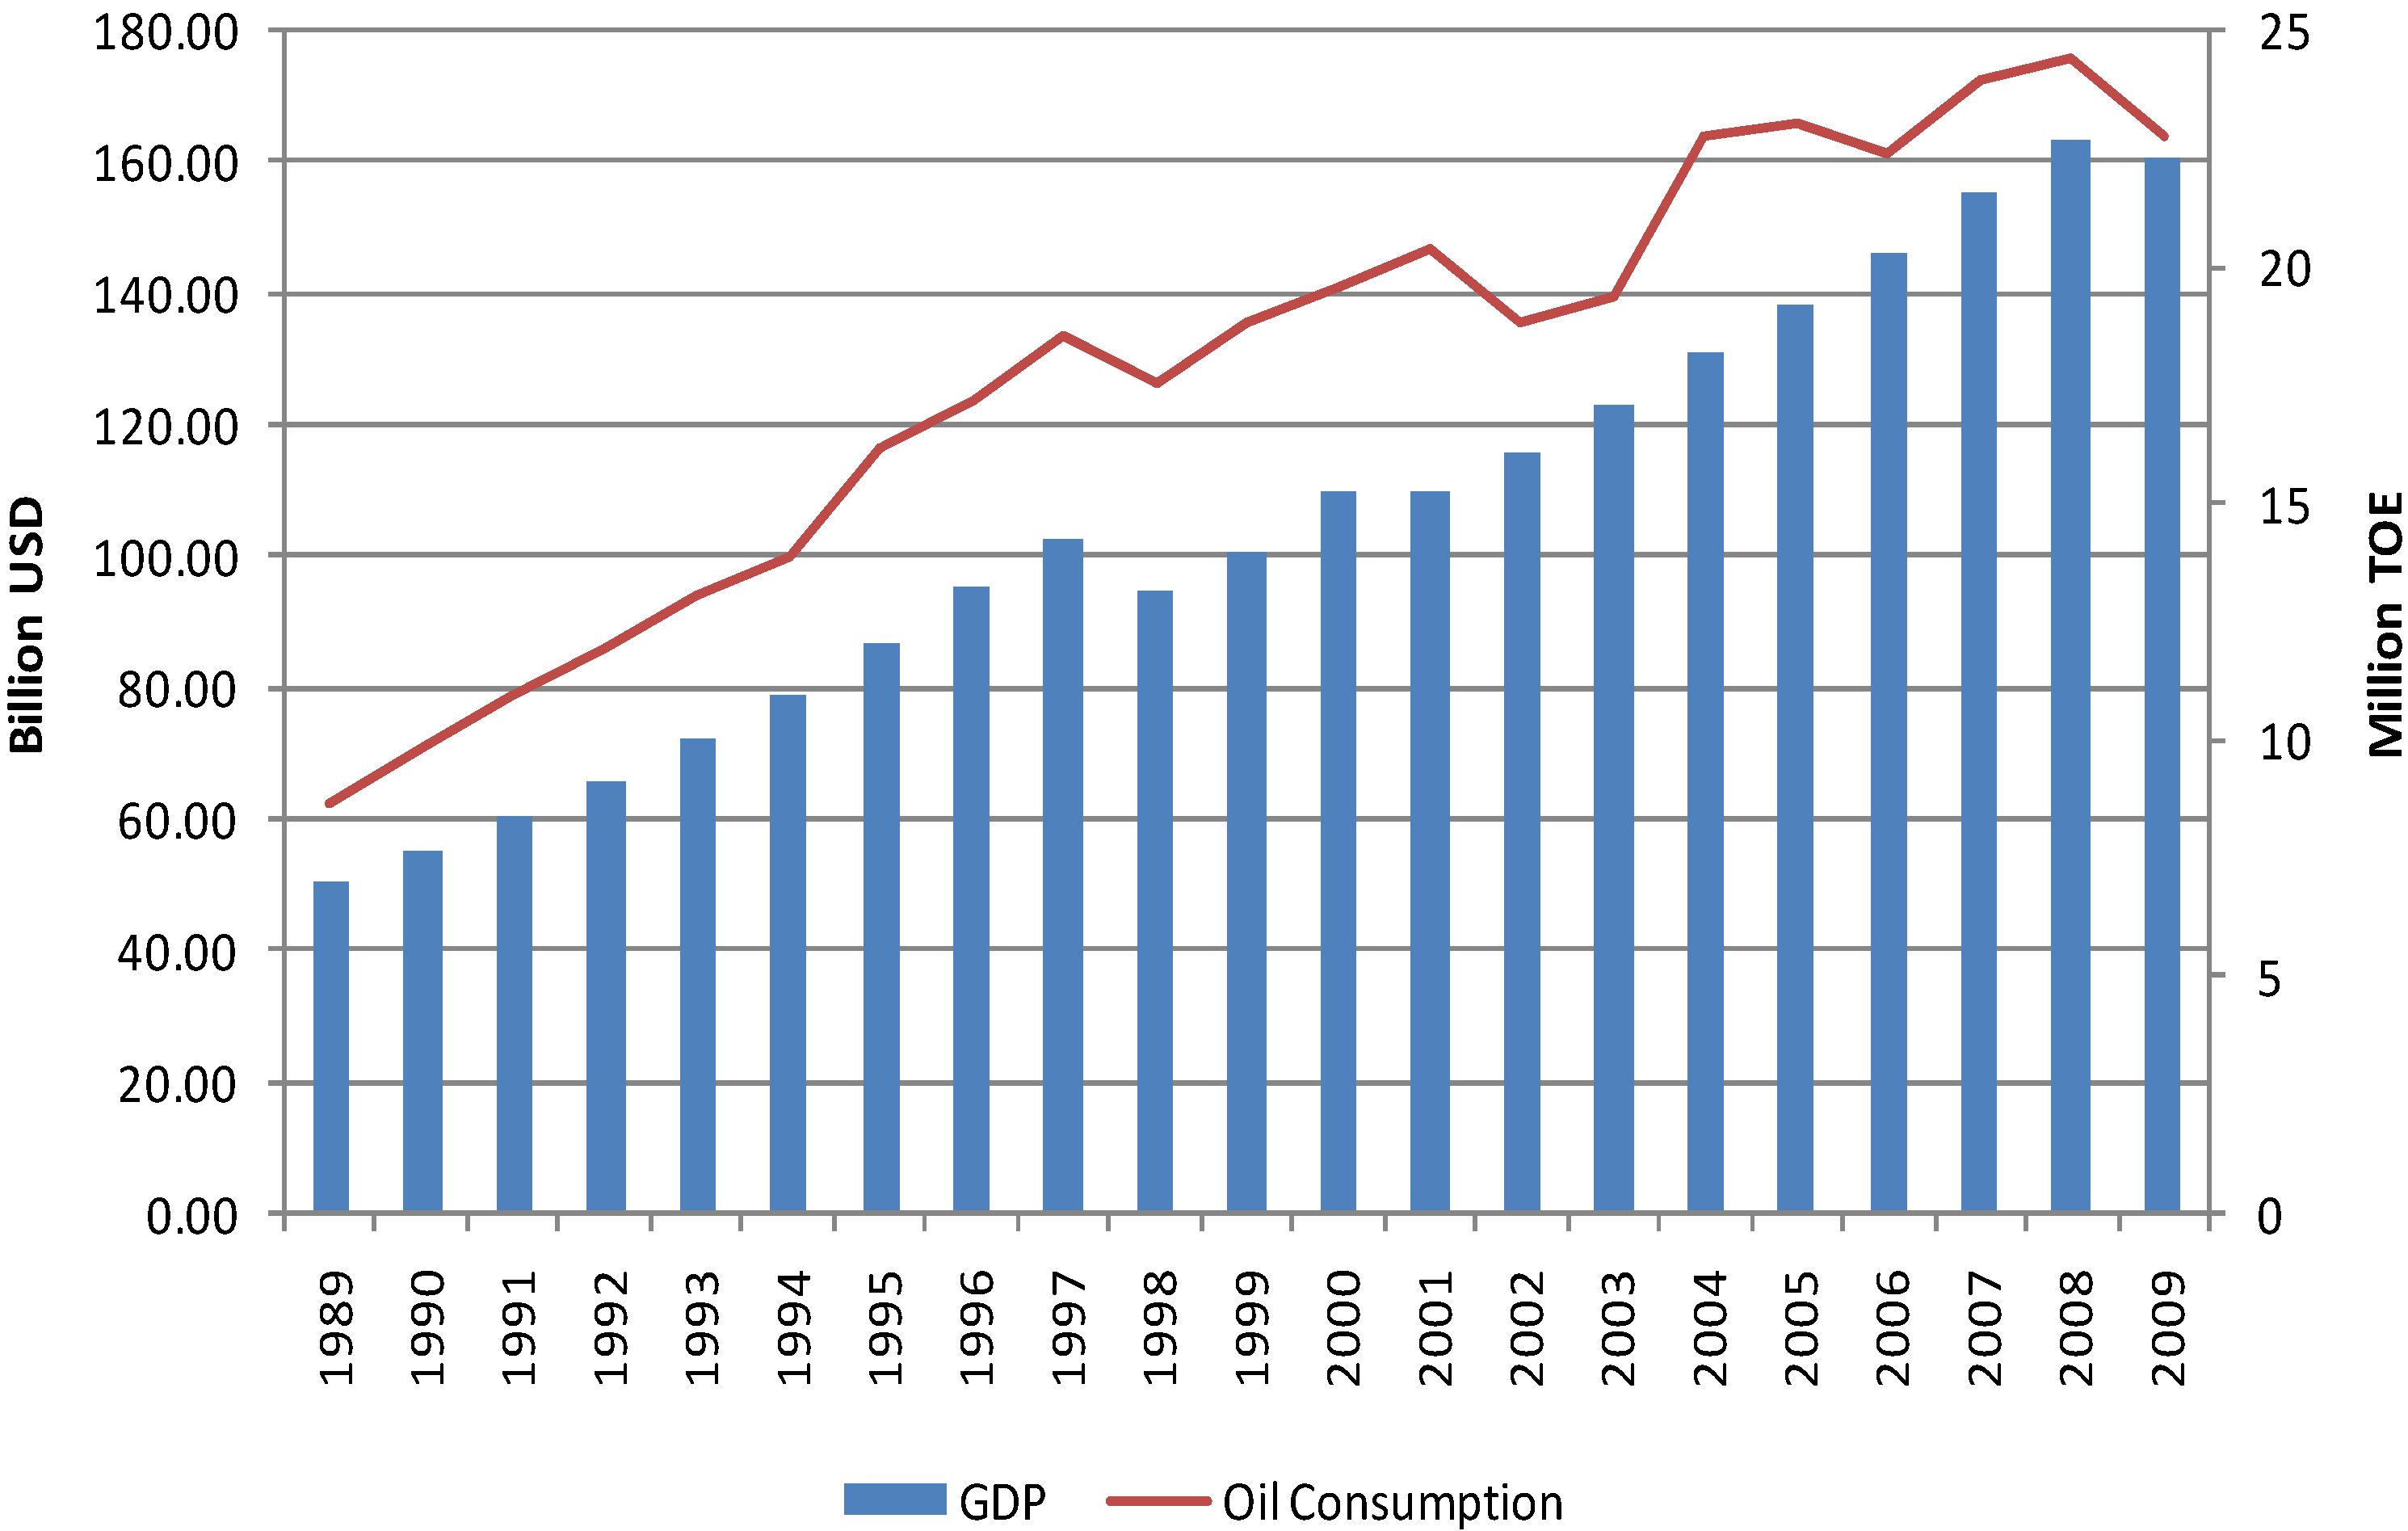
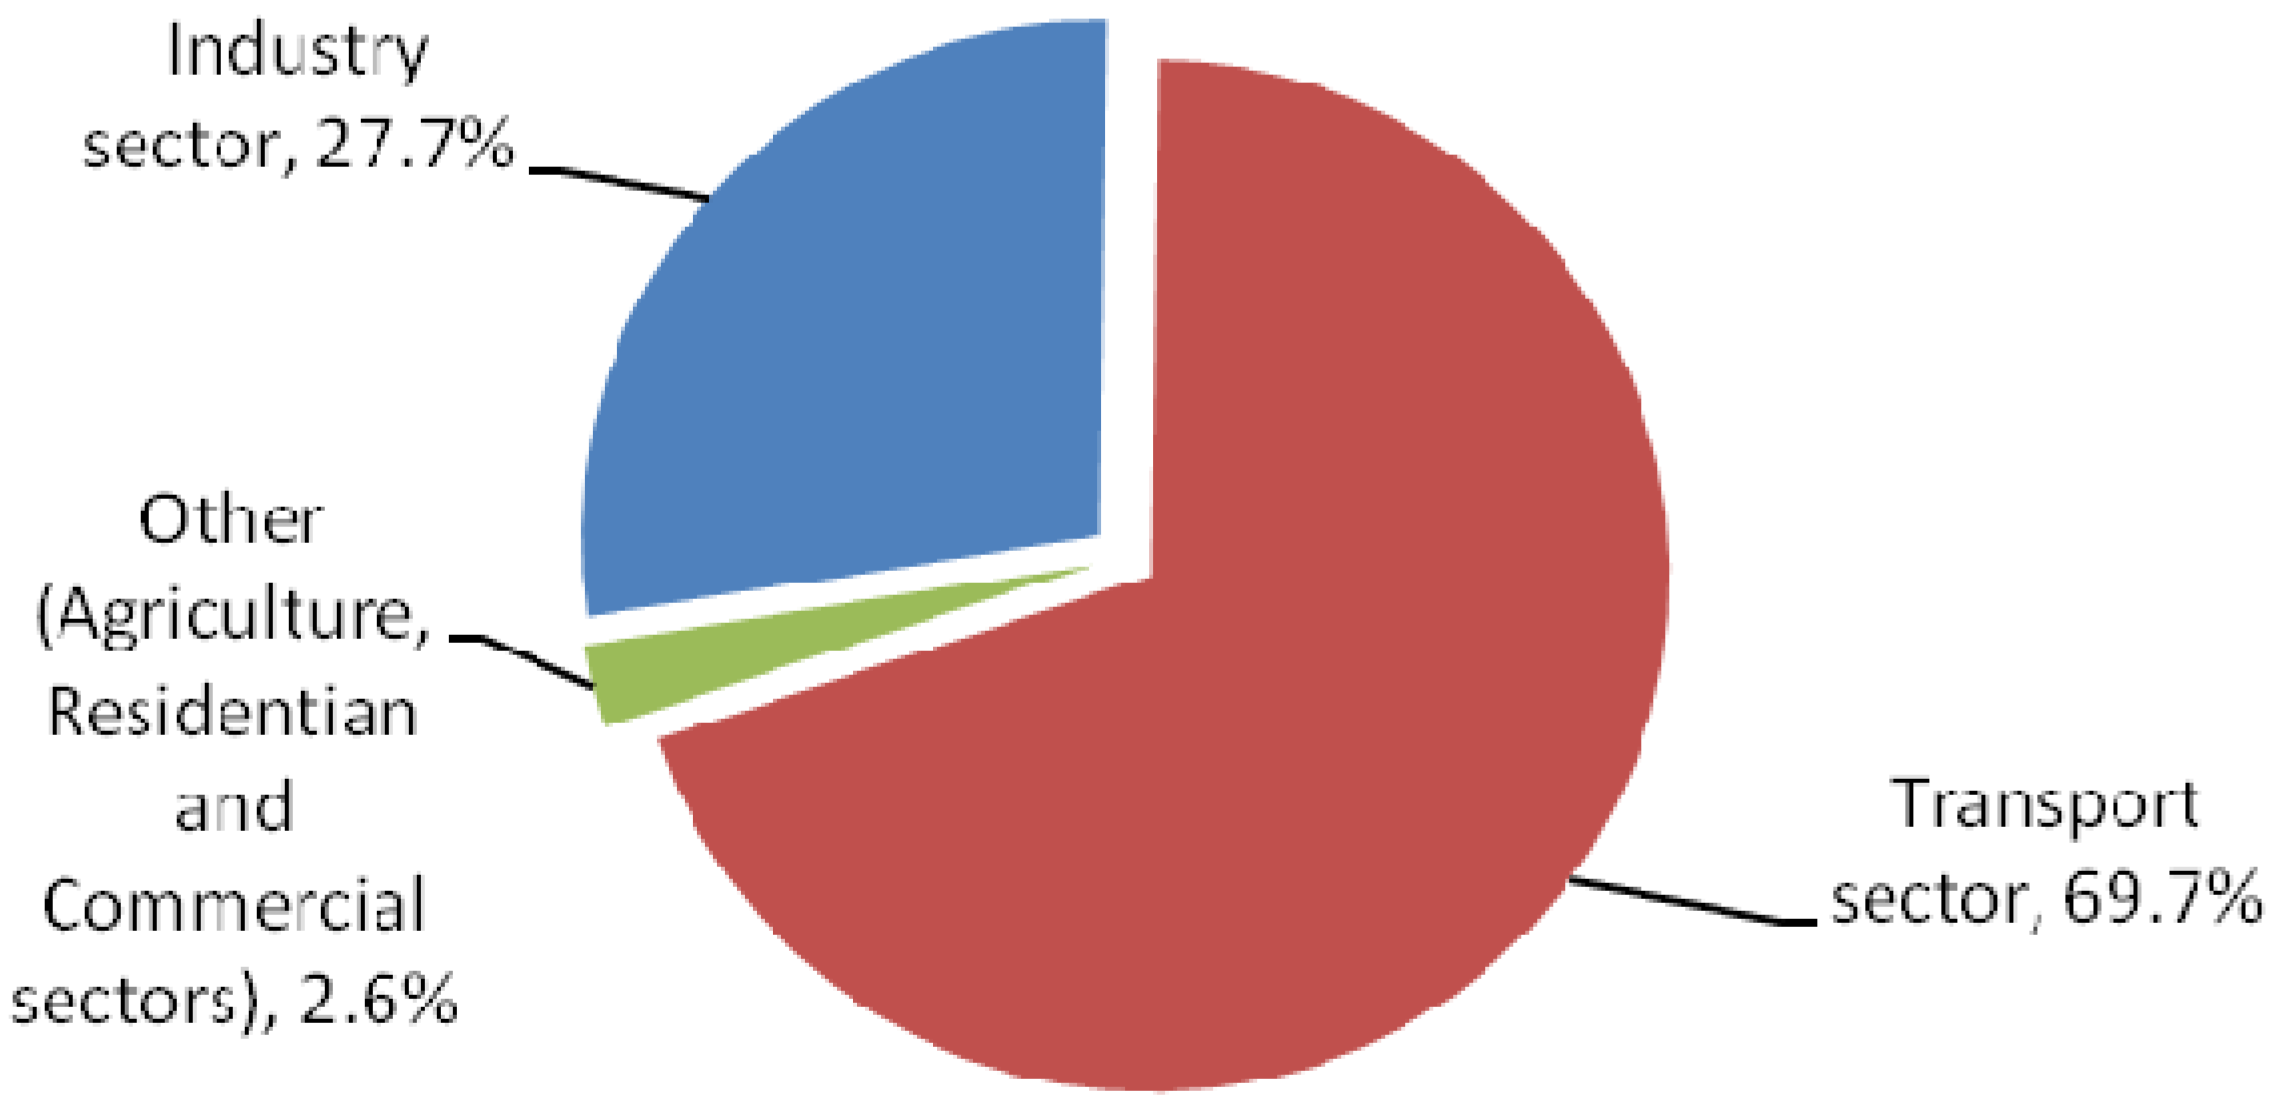
3.1. Oil Consumption

Malaysia’s oil consumption is increasing. During the last two decades, oil consumption rose from 8.6 Mtoe in 1989 to 22.7 Mtoe 2009 [1]. The increase was mainly driven by the nation’s rapid urbanization and industrialization which followed its strong economic growth. Figure 2 shows Malaysia’s GDP and oil consumption over the years. Transportation and industrial sectors are the main oil consumers in Malaysia’s economy [12]. The transportation sector, in particular, relies heavily on oil products, such as gasoline and diesel fuel [13]. In 2009, the transportation sector accounted for 70% of the country’s total oil consumption, while the industry sector was about 28%, as shown in Figure 3.
Figure 2. GDP and oil consumption (data source: [1,2]).
Energies 05 02989 g002
Figure 3. Share of transport, industry and other sectors for crude oil and petroleum product consumption (source: [1]).
Energies 05 02989 g003
The Malaysian government introduced various policies to suppress energy consumption, one of which is by improving the overall energy efficiency of the nation [14]. In relation to oil consumption, technologies that can bring higher consumption efficiency and make way for the use of non-conventional fuels, such as biodiesel [14,15], are highly promoted. Furthermore, subsidies for oil products are being reconsidered. Since the oil price hike in 2008, retail prices for petrol and diesel fuels are becoming more influenced by international oil price movements as the government started to rearrange the fuels pricing mechanism. The highest petrol price was recorded at RM 2.90/L [16], an increase of more than 50% compared to the earlier subsidized price of RM 1.90/L in 2006, as shown in Figure 4.
Figure 4. Malaysia’s petrol and diesel price (data source: various).
Energies 05 02989 g004
For the industrial sector, the government—supported by the United Nations Development Programme (UNDP) and the Global Environmental Facility (GEF)—introduced the Malaysian Industrial Energy Efficiency Improvement Project (MIEEIP), which was launched in 2000 and completed in 2007 [14,17]. The project’s goal was to enhance energy efficiency in the industrial sector with a focus on eight oil-intensive industries (cement, ceramics, food, glass, iron and steel, pulp and paper, rubber, and wood) and an additional three industries (oleochemicals, plastics, and textiles). The project had a target of 10% energy efficiency improvement and mainly provided industries with guidelines on complying with efficiency standards, including a campaign for the adoption of high efficiency boilers and motors.

3.2. Oil Reserve and Production

In recent years, oil production has decreased from 39.7 Mtoe in 2004 to 34.8 Mtoe in 2009 or about 12% [1]. In term of daily production, Malaysia’s oil production was reported to decrease from 861.8 thousand bbl/d in 2004 to 693 thousand bbl/d in 2009 [18]. With proven oil reserves standing at 5.46 billion bbl in 2008 and assuming a constant oil production rate of 700 thousand bbl/d, it is predicted that Malaysia’s oil reserves will be exhausted in about 21 years [19].
As the state-owned national oil company and the resource owner, Petronas dominates both the upstream and downstream activities of the country’s oil sector. In the midst of stagnant oil production, Petronas investments for domestic exploration endeavors, development and production projects continue to increase from about RM 7.9 billion in 2005 to RM 25.1 billion in 2010 [20]. The endeavors proved fruitful in 2011 as Petronas announced their success in discovering new oil reservoir with a potential 227 MMBOE outside the state of Sabah and another 100 MMSTB outside the state of Sarawak [21,22]. However, these discoveries are not large; rather they contribute in a small increment to the oil reserve potential. Combined, these latest discoveries contribute an approximate 5% addition to the 2009 oil reserve levels.
Recovery projects utilizing the enhanced oil recovery (EOR) technology are being pursued to increase production level. Even though this technology has been introduced in Malaysia in 2000, there has not been any full-field application of EOR [23]. Only later in 2005, Petronas made a commitment for a full implementation of EOR in one of its oil fields, Dulang. Followings Dulang’s successful implementation, the company endorsed subsequent comprehensive EOR screening studies for its major oil fields [24]. Petronas announced that fields with EOR technology implementation are expected to begin production by 2014 [25]. Successful EOR projects are expected to provide significant contributions to Malaysia’s oil production.

4. Methodology

4.1. Overview

The methodology of this study can be summarized in four steps as follow. First, we formulate the problem using the following questions: In what year is Malaysia likely to become a net oil-importing country and to what feasible extent will it be dependent on oil imports?
Second, we develop a simulation model to address the problem stated. Considering the interrelations between sectors involved in the problem, we employ system dynamics [26] as a method to develop the simulation. The modeling’s purpose is inherently to answer the above questions. In order to address the first question we compare oil production and its consumption. The year which Malaysia’s oil production becomes lower than its consumption is the year it becomes a net oil importing country. For the second question, we use a concept for evaluating energy security. Among many, dependency is one important component in evaluating energy security [27]. It can be measured by the share of energy demand fulfilled by domestic energy production; the higher the share, the lower the dependency is. In terms of oil import dependency, we apply the same principle but in reverse to make it more sensible. Oil import dependency is measured by the share of oil demand fulfilled by imported oil, therefore the higher the share, the higher the dependency is. In this study, total oil supply is assumed to be equivalent to oil demand. The total oil supply is the amount of oil production plus imported oil and then subtracted by the amount of exported oil.
Thirdly, to explore Malaysia’s oil future, we develop some scenarios. A business-as-usual scenario (BAU) is developed as a reference scenario. It is developed based on available data and assumes that the results of policies implemented and events occurred within the period of available data are embodied within the data. On the other hand, alternative scenarios are developed to describe different possible situations on the basis of expected policies and events. Finally, we simulate the model and analyze the results. The analysis is done by comparing the results of the alternative scenarios to the BAU scenario.

4.2. Model

This study views the oil and economic sectors as two interacting systems. In this view, the relationship between the two systems is modeled to have feedback loops. Therefore, changes in one sector will affect the other and vice versa. In addition to the first two sectors, population growth and the technology sector are also considered important in explaining the dynamics of the economy and oil sectors, and are therefore included in the model. Population growth is considered important as it is the main driver of economic growth, while technology improvement is believed to have an important role in the dynamics of the oil sector, particularly oil consumption. The conceptual framework of the model is presented in Figure 5.
Figure 5. The conceptual framework of the model.
Energies 05 02989 g005
The study takes simulation approach to investigate Malaysia’s oil transformation. Simulation approach has distinct features from other approaches such as optimization and econometric. Optimization is inherently prescriptive. Models using this approach provide the best action to take in order to achieved goals. Optimization models are generally linear, lack of feedback and lack of dynamics [28]. Econometric is a very rigid approach. Econometric models rely heavily on historical data. Due to this, unexpected events which may deviate the future from historical data projections, can generate the issue of uncertainty [28]. On the other hand, simulation is descriptive and focuses on causal relationships that construct the dynamics of the issue at hand [28]. These features enable us to perform “what if” analysis to learn the impacts of events (i.e., policy implementation) on the problem being investigated. This characteristic is invaluable for exploring Malaysia’s oil transformation. However, it should be noticed that determining the boundaries of the simulation model and the causal relationships characterizing the mechanisms of the systems being analyzed are difficult. These are the potential limitations of the approach [28].
As mentioned in the previous section, system dynamics is employed to develop the simulation. It is an established method that has been utilized in studying the dynamics of fossil energy resources [29]. Applications of this method to oil sector can be found in [30,31,32].
In developing the model, we consider procedures suggested in [26,33]. Using these procedures, each sector is modeled by identifying its relevant factors and defining the causal relationships between the factors. These factors are further presented as system dynamics variables (stock, flow, and converter). Relationships between variables are mainly established by employing regression techniques, with some exceptions to logically explainable relationships or known concepts.

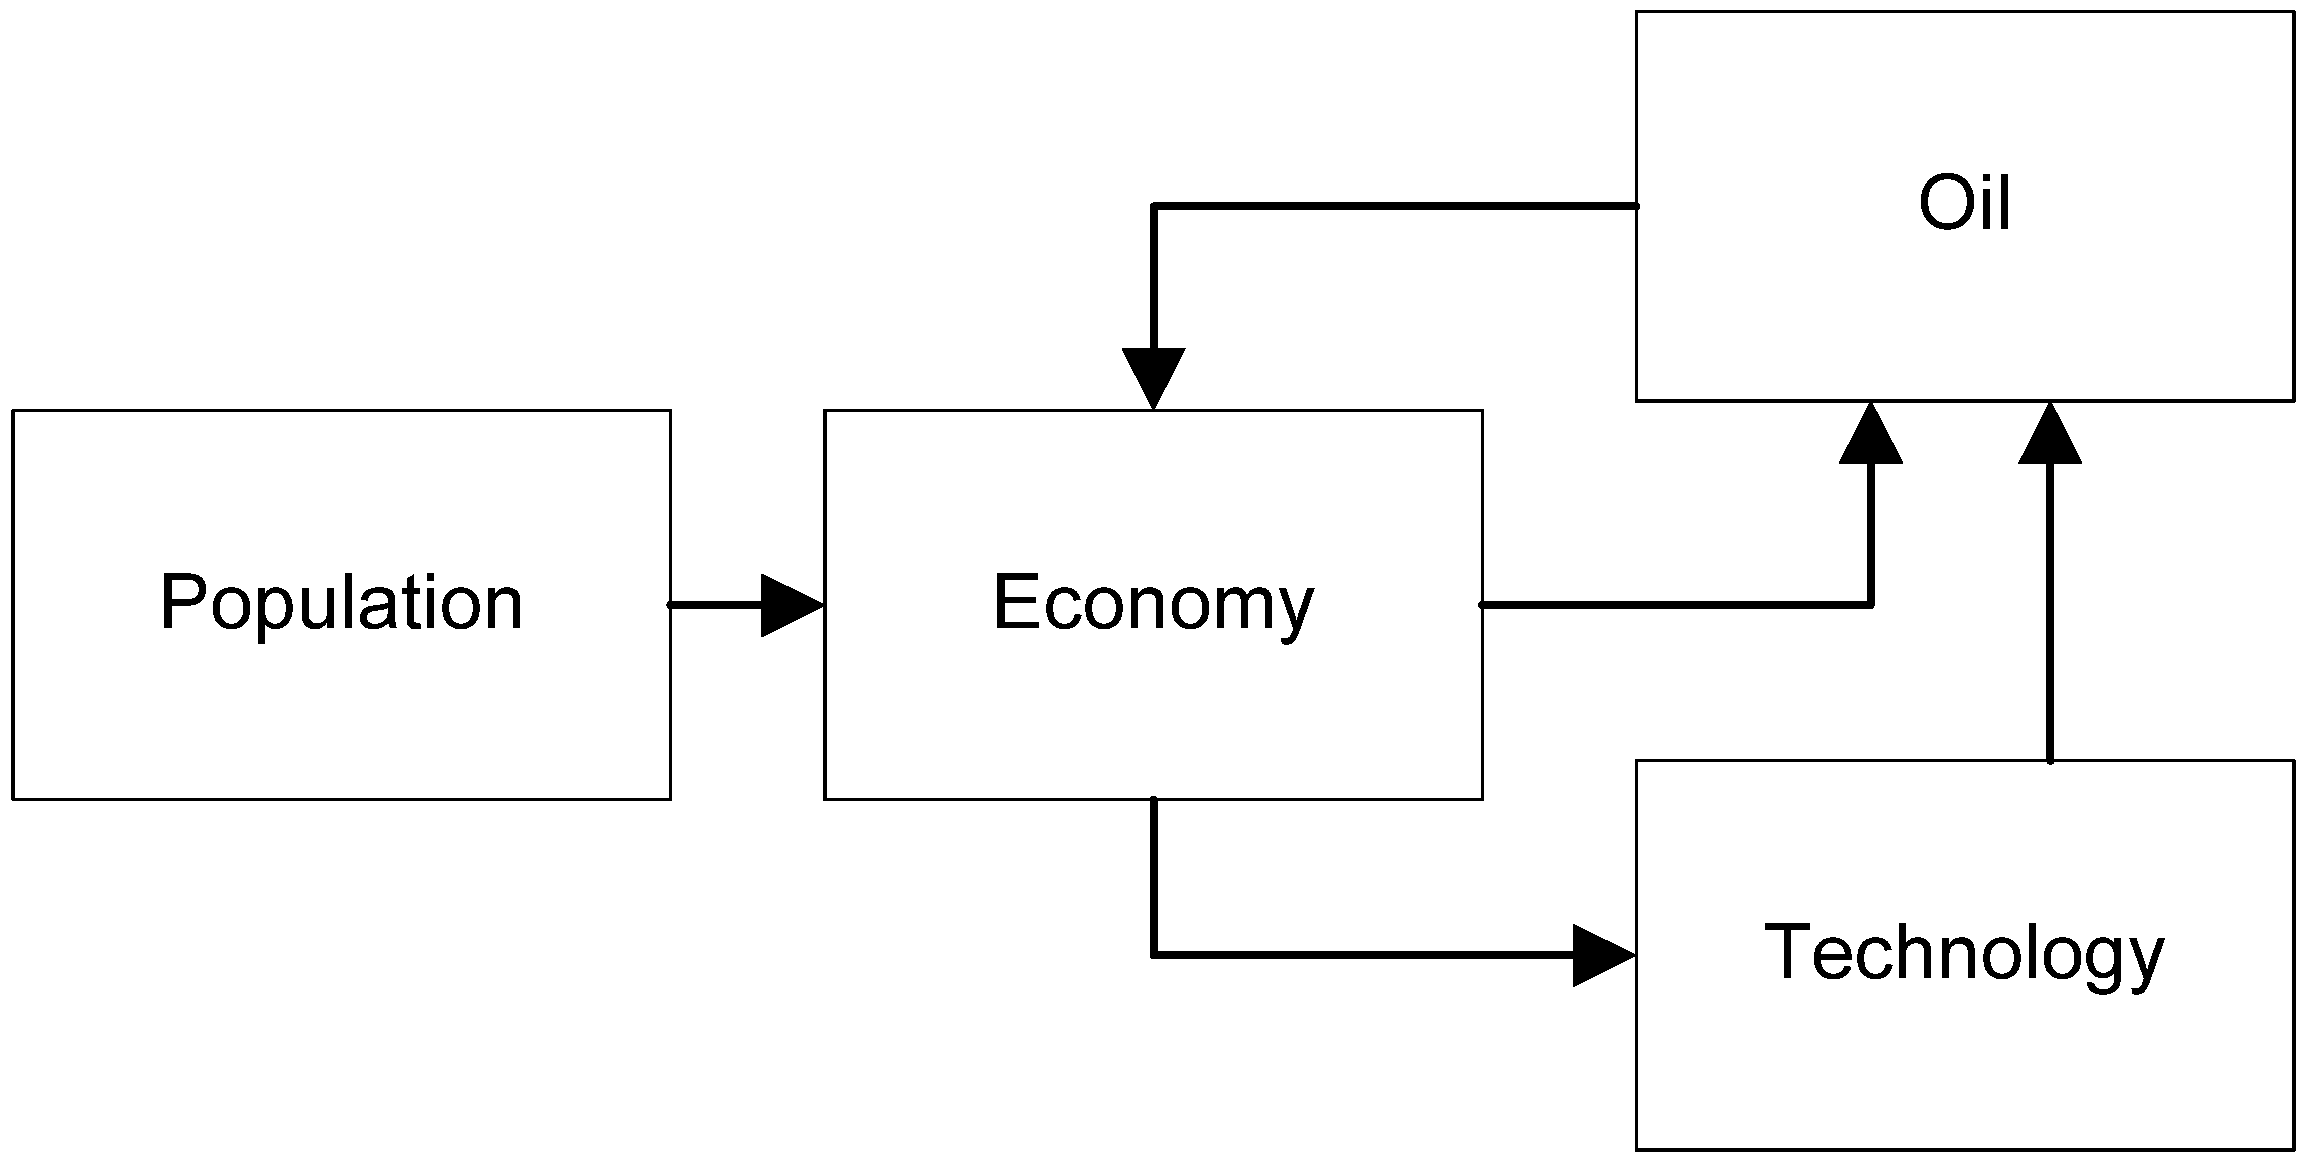
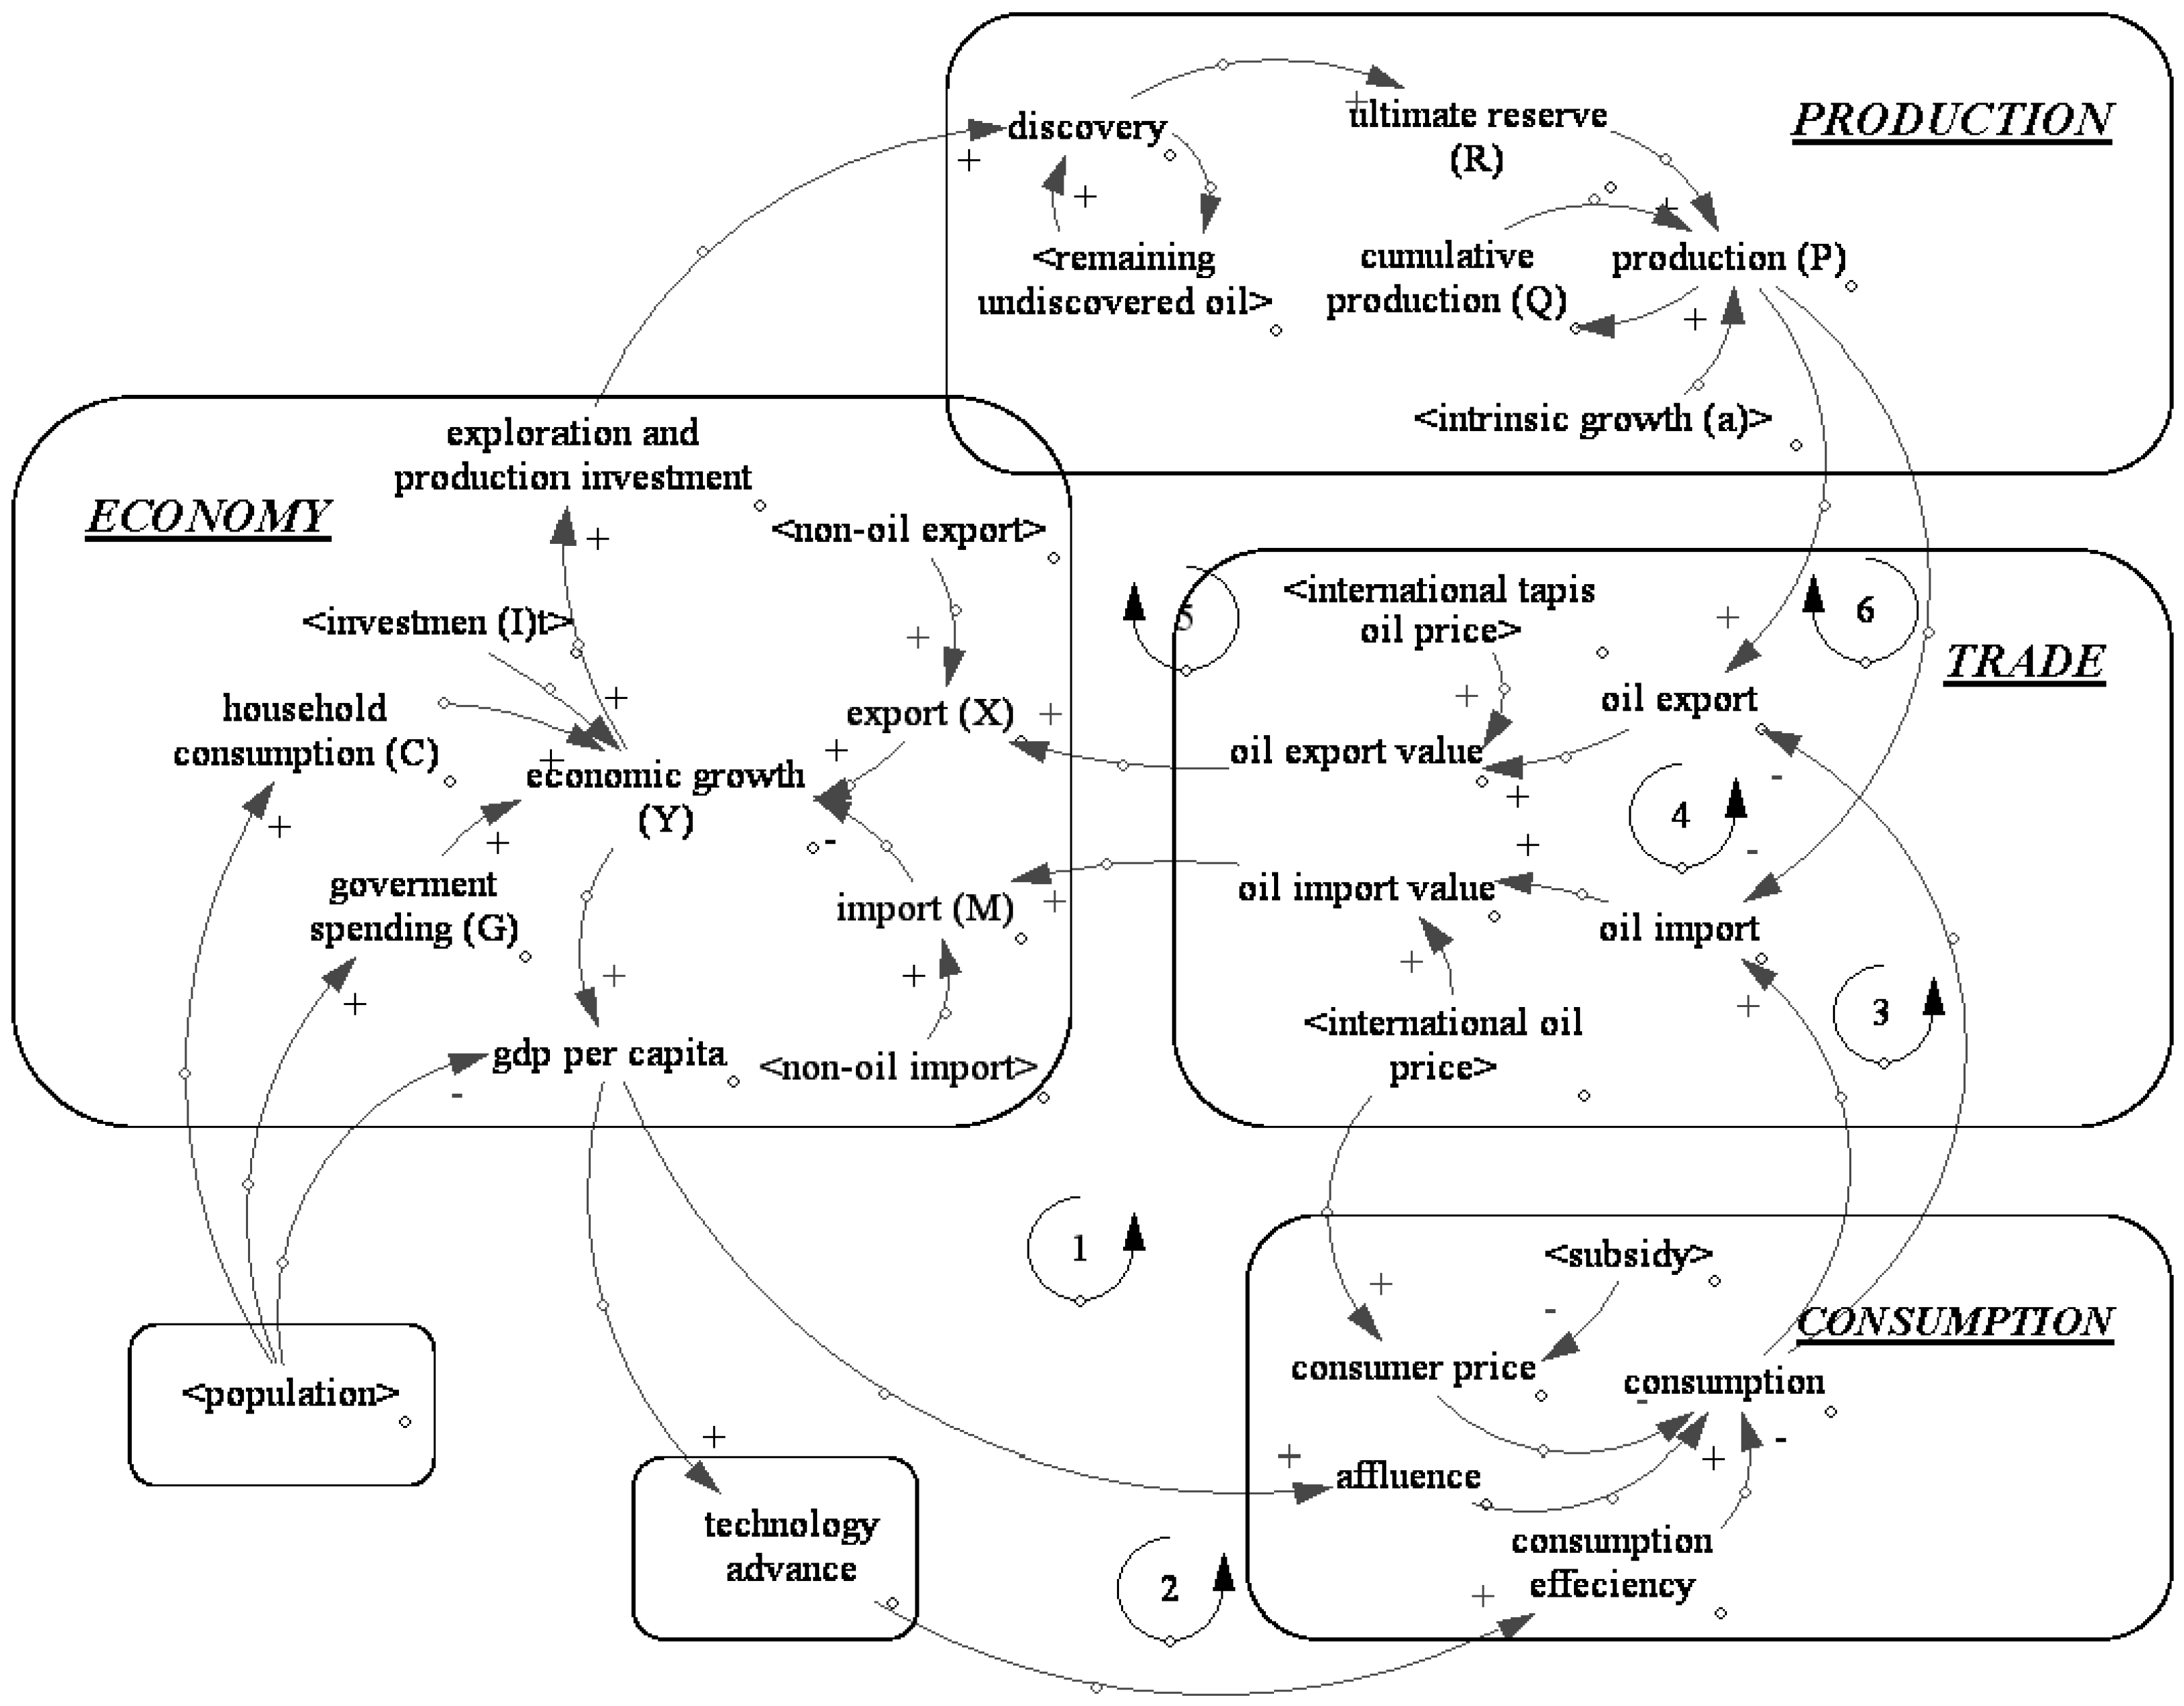
4.2.1. Structure and Basic Assumptions

4.2.1.1. Oil Sector

The oil sector is segregated to three subsectors: production, consumption and trade. The oil production subsector consists of ultimate reserves, production, cumulative production, production growth and addition-to-reserves. This sub sector is modeled following Hubert’s model for oil production [34,35].
It should be noticed that Hubert’s production model applied in this study is ideally used when distribution of oil fields is symmetrical (normal) [36]. Due to a lack of data, our model assumed that Malaysia’s oil fields are uniform in size (no giant oil fields) and normal in distribution. The assumption is based on Malaysia’s geological formation which is not conducive for the formation of a larger pools of hydrocarbons [37]. However, it is worth mentioning that our model takes into account two conditions which may increase confidence on the oil production simulation results. First, according to [36] a good result from Hubert’s model can be achieved when production has passed its peak. Our data shows that Malaysia’s oil production has its highest level in 2004 during the last ten years which is then followed by decreasing trend. Therefore, we believe that Malaysia’s oil production has passed its peak, thus our model concord with Laherrere’s criteria. Second, our model relates discovery with production using a discovery curve to represent incremental addition to reserve. Therefore, it is in accordance with Laherrere’s view [36] about the importance of relating discovery with production to obtain reliable forecast.
Hubert’s production model can be described by the following equation:
P = a Q ( 1 Q R )
where, P is the annual production of oil; Q is the cumulative oil production; R is constant representing the ultimate reserve, that is the total amount of oil in the ground including extracted, reserve and potential resources. R can also be seen as the cumulative oil production after all the recoverable oil has been produced. The a is constant called intrinsic growth rate. For Malaysia, we found that the best value of a is 0.079.
Hubert’s production model is sensitive to changes in intrinsic growth rate and the ultimate reserves. For this study we applied some modifications to Hubbert’s model. Firstly, we assumed that rapid change in production capacity can be represented by changing the intrinsic growth parameter. We make use of this parameter to represent the impact of major production technology changes such as EOR implementation. Secondly, we assumed that the ultimate reserve is influenced by investment in the oil sector. We believed that the assumption is closer to reality than having a constant value of ultimate reserve. It is in line with reports from German Federal Institute for Geosciences and Natural Resources, that Malaysia’s estimated oil ultimate recovery (term used by BGR for the amounts extracted up to now plus the reserves and the resources) is changing over time [38,39,40,41,42,43]. Figure 6 shows the growth of exploration and production (E & P) investment [44,45,46,47,48] and estimated ultimate recovery of Malaysia.
Figure 6. Investment and ultimate reserve growth (data source: BGR and Petronas reports).
Energies 05 02989 g006
In our model, investment drives discoveries of new oil reservoirs, however, although investment may increase continuously, we assumed that the total amount of oil under Malaysia’s soil remains the same. Therefore, discovery is constrained by this assumption and will become less frequent as the remaining undiscovered oil reservoirs are declining. Using the latest estimated oil potential of 850 Mtoe [43] as the current total amount of oil underground, and the annual addition to the proven reserve data from [49], we assumed the percentage of remaining undiscovered oil can be determined using the following equation:
y = 0.011 x + 22.53
where, y is the percentage of remaining undiscovered oil underground and x is year. Figure 7 shows the percentage of remaining undiscovered oil underground.
Figure 7. Percentage of remaining undiscovered oil underground (source: authors’ calculations).
Energies 05 02989 g007
The oil consumption subsector consists of consumption, consumer price, subsidy, and consumption efficiency variables. We assumed that oil consumption is determined by two factors: the affordability to buy oil products and technical efficiency of oil consuming technologies. Affordability is represented by interaction between affluence and oil product price at consumer level. The affluence level is proxied by GDP per capita, as shown in Figure 8.
Figure 8. Relationship between affluence and GDP per capita.
Energies 05 02989 g008
Consumer price is determined by considering the international oil price and the amount of subsidies. It is calculated using the following equation:
C P = P S U B
where, CP is consumer price, P is retail price derived from oil international price, and SUB is subsidy on oil products. P is calculated using an equation yielded from regression on international oil price, as follow:
P = 0.016 × I P + 0.793
where, IP is the international price of oil. The international oil price we consider is the average of the Middle Eastern oil price. The use of oil prices will be explained more in the oil trade section. The subsidy level is exogenous to the model and used as a parameter.
Consumption efficiency in this model is used to represent the effect of advancements in technical efficiency of oil-consuming product technologies (e.g., vehicle fuel economy, hybrid engine etc.) on oil consumption. We assumed that it is determined only by the nation’s technological advances. Explanation of the method used to estimate Malaysia’s technology advances will be presented in the technology sector section. Figure 9 shows the relationships between the consumption efficiency and technological advances.
Figure 9. Relationships between the consumption efficiency and technological advances.
Energies 05 02989 g009
The oil trade subsector is composed of international oil price, oil export, oil export value, oil import, and oil import value. The oil export and oil import variables are both determined by oil production and oil consumption variables. The international oil price is exogenous to the model. There are two types of oil prices that we consider: The Tapis oil price and the average Middle Eastern oil price. Tapis is the best of Malaysia’s oil commodity. It is one of the lightest oils in the world with API gravity of 44° [3]. In this sector, the Tapis oil price is used to calculate the oil export value. Malaysia imports oil mainly from the Middle East. Assuming that there has to be a margin between export and import, we consider the average of Middle Eastern oil prices with lower API degrees to calculate oil import value. For both prices, we assumed that they will increase following their historical data trend linearly. Figure 10 presents the real and assumed oil prices used in the model.
Figure 10. Assumed behaviors of oil prices (dash lines) and their historical data (solid lines) (Source: [3]).
Energies 05 02989 g010

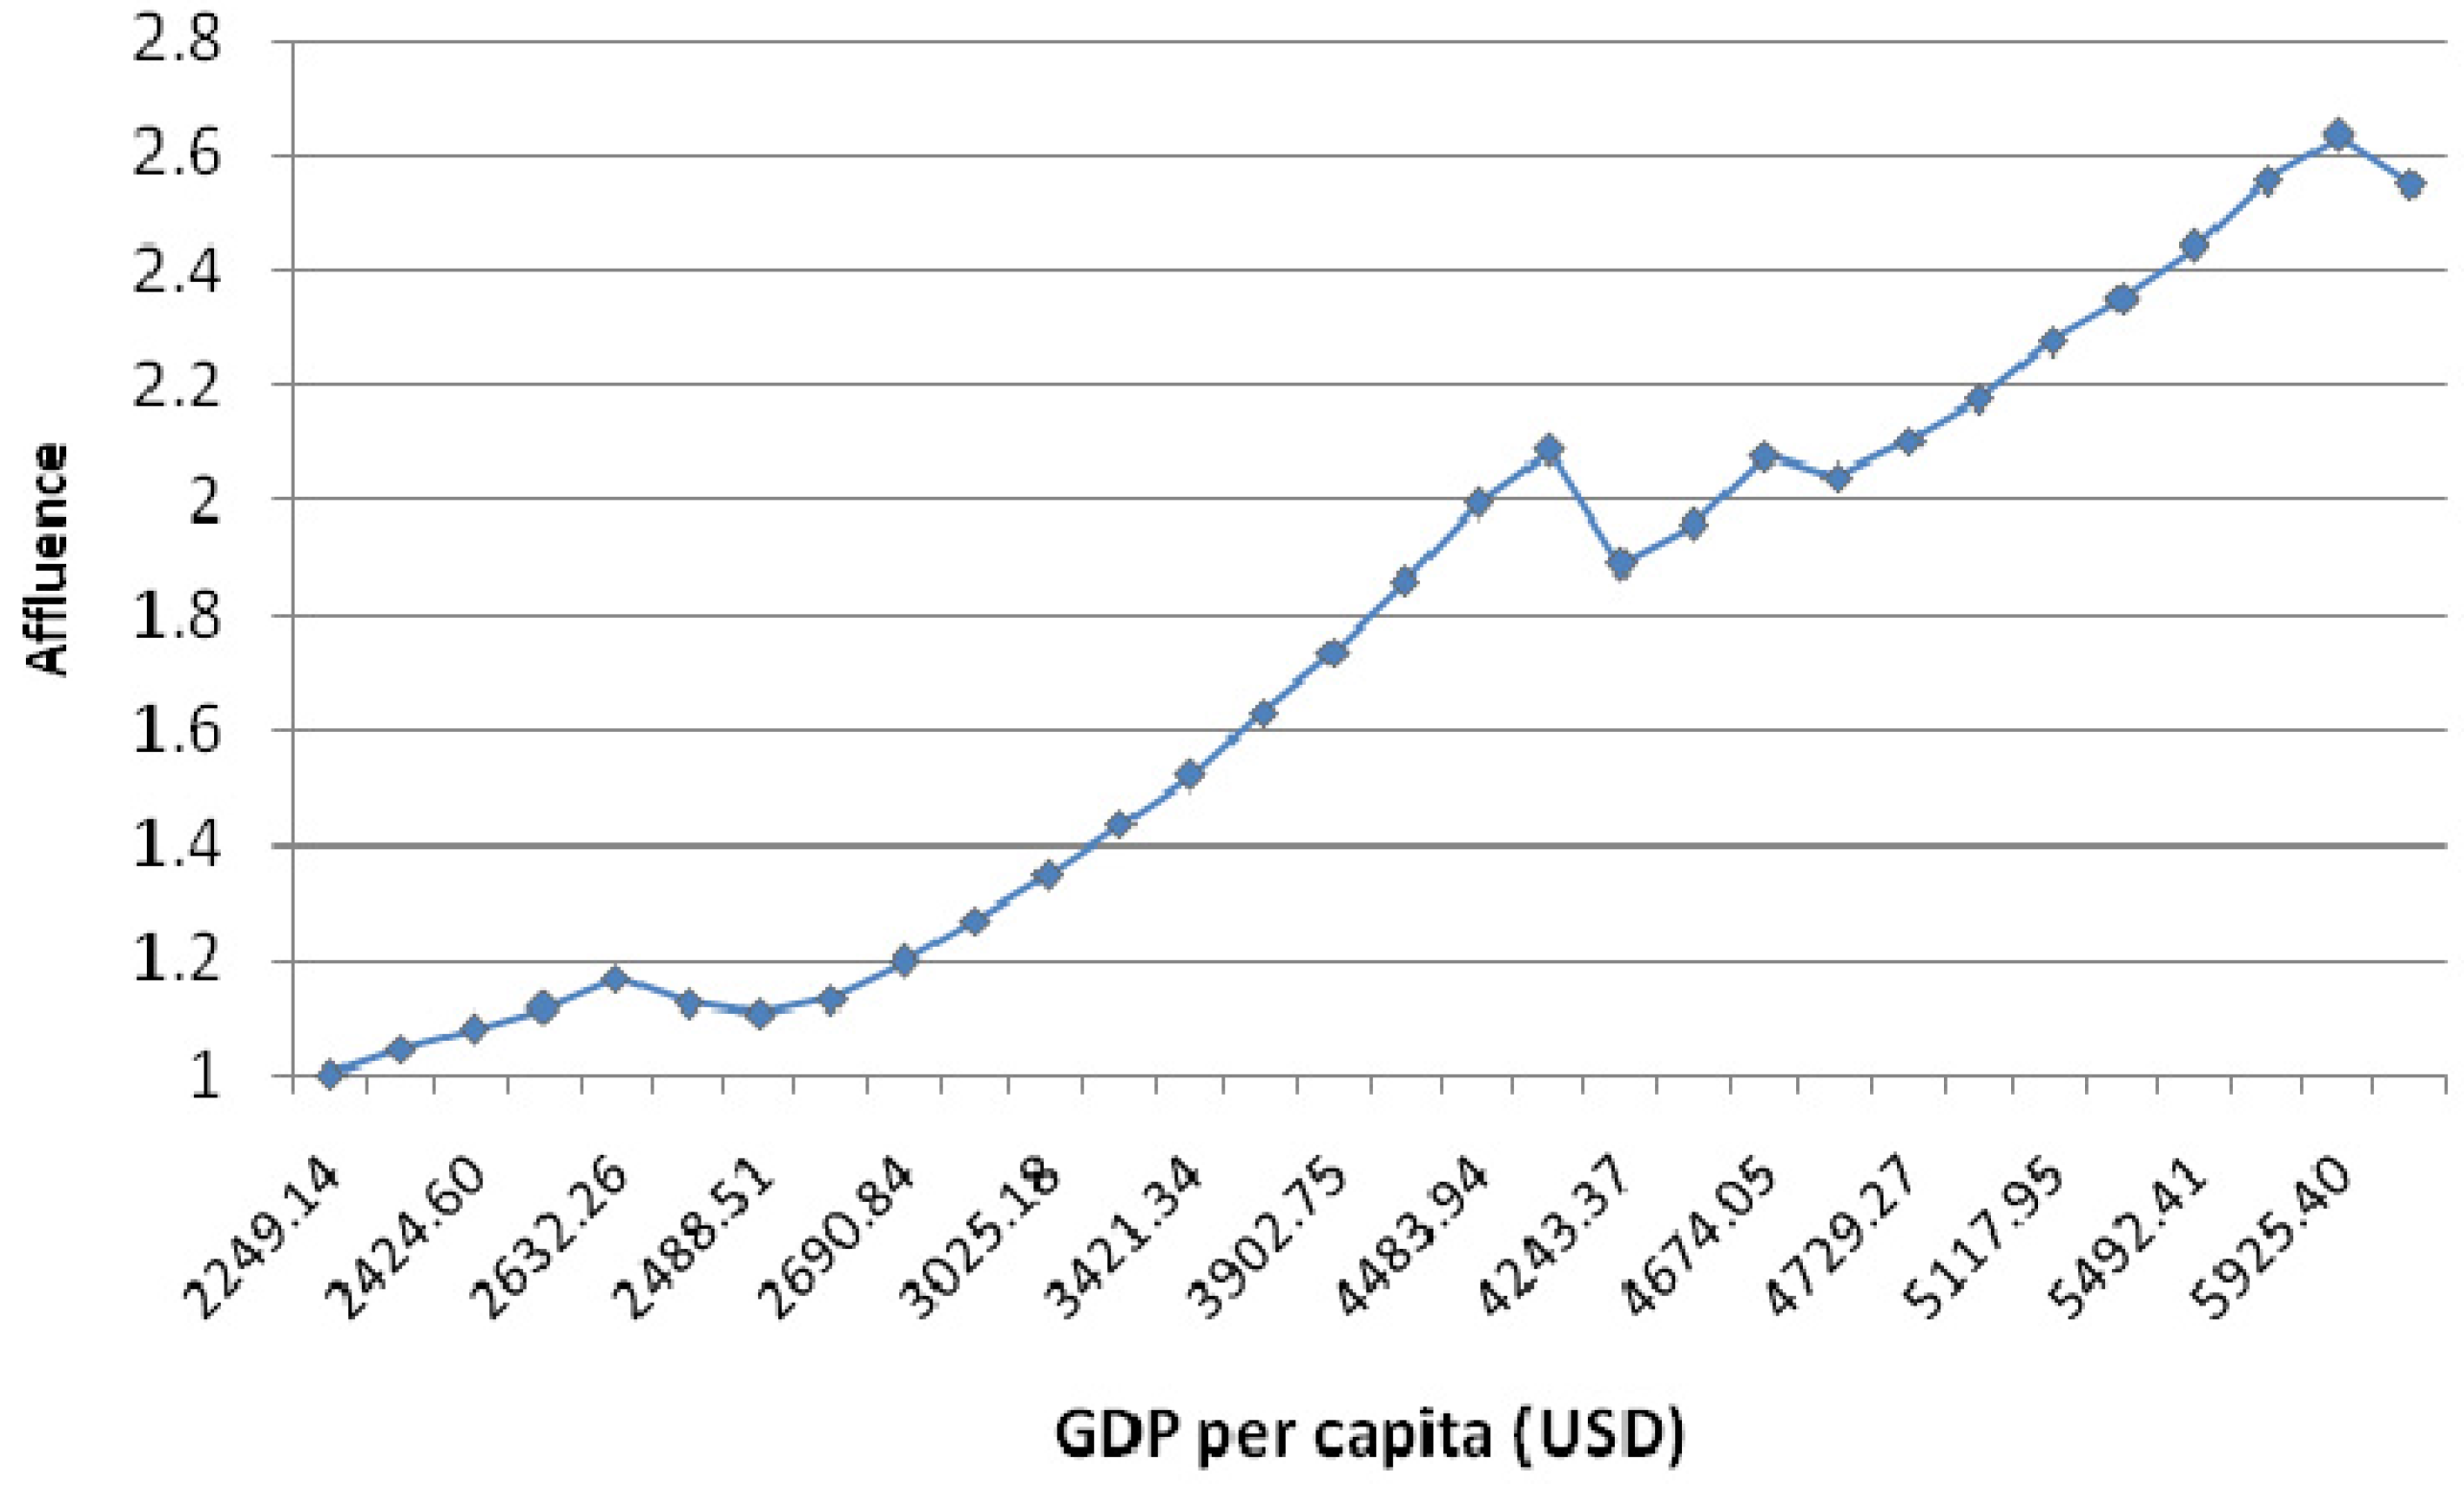
4.2.1.2. Economy Sector

This sector is composed of economic growth, household consumption, investment, oil exploration and production investment, government spending, export, import, non-oil export, non-oil import and gdp-per-capita variables. Economic growth is indicated by the gross domestic product (GDP). The calculation of GDP is based on the Keynesian expenditure formula:
Y = C + I + G + ( X M )
where, Y is GDP, C is household consumption, I is investment, G is government spending, X and M are respectively export and import values of goods and services.
Consumption and government spending variables are determined by the population variable. Investment is determined using a formula derived from regression analysis on historical data and therefore it is exogenous. The oil exploration and production investment is calculated as fraction of GDP. The fraction is based on historical data. Export and import are respectively determined by non-oil export and non-oil import and also by oil export and import value variables from oil trade sub-sector. The values of non-oil export and non-oil import variables are calculated based on historical data regression. The GDP-per-capita variable is determined by dividing GDP by population. Figure 11 shows the assumed behavior of exogenous variables in this sector and their historical data.
Figure 11. Assumed behaviors (dashed lines) of Investment, Non-oil export and Non-oil import variables and their historical data (solid lines). (Source: [2])
Energies 05 02989 g011

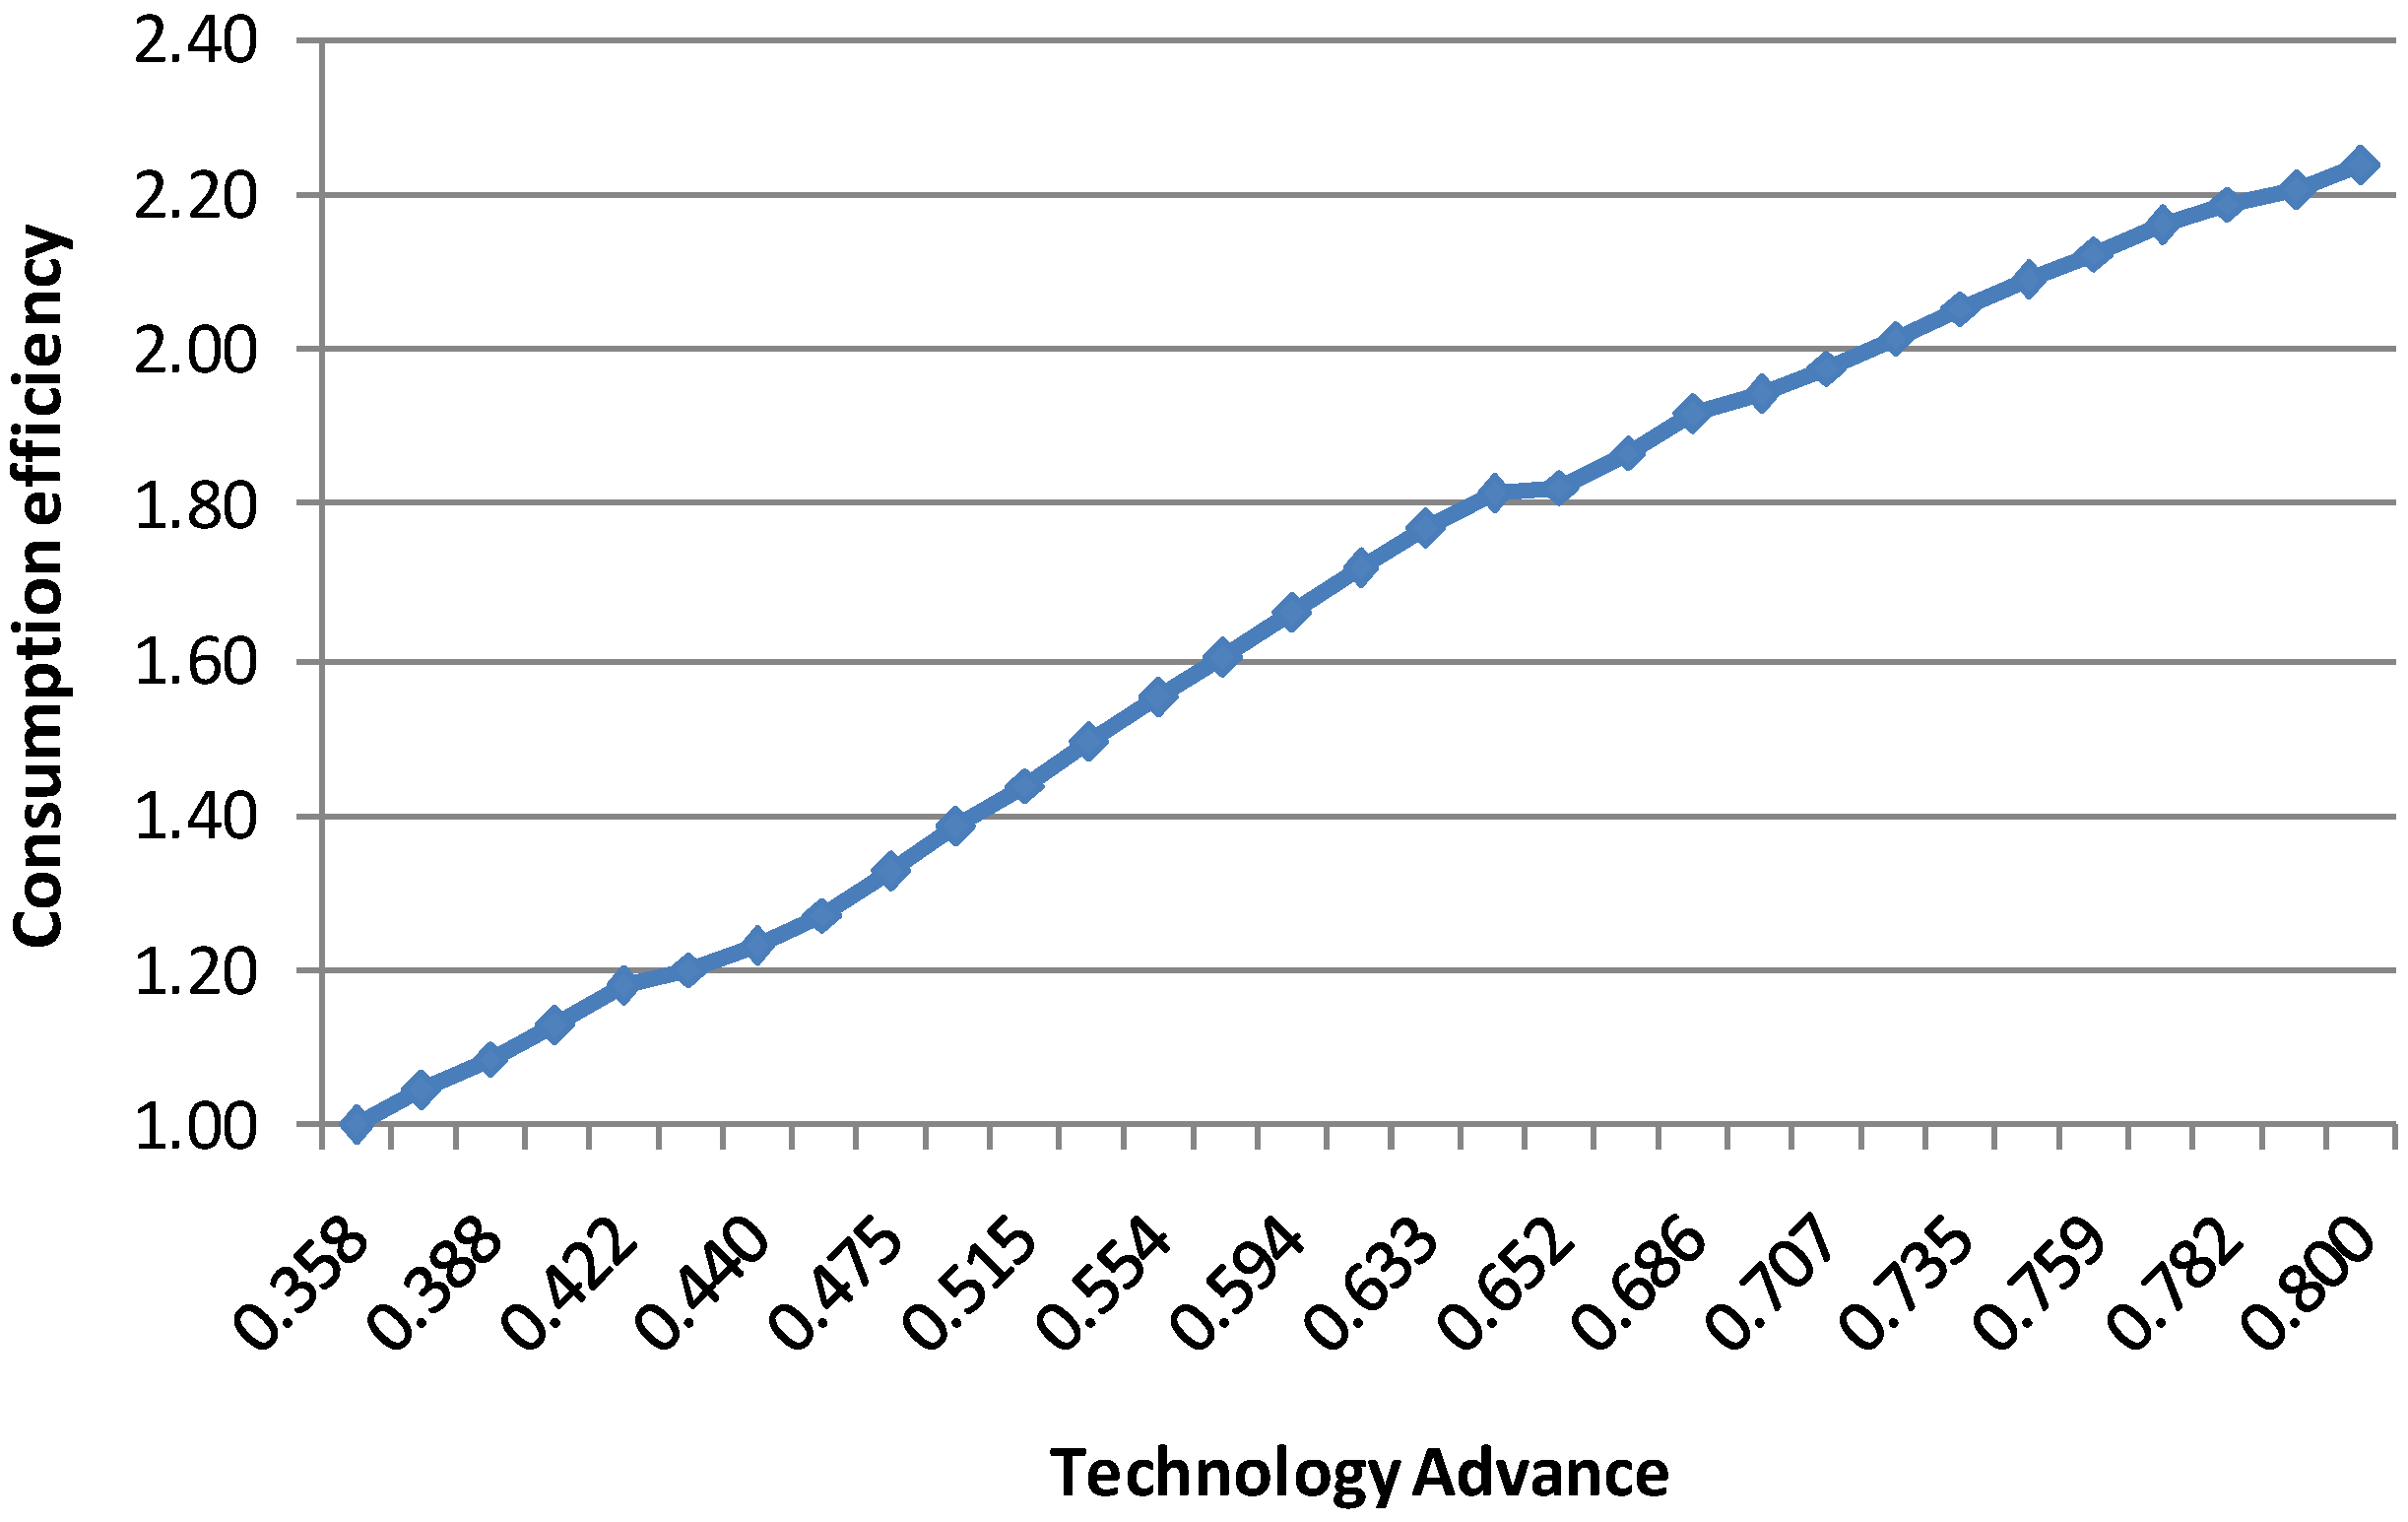
4.2.1.3. Technology Sector

The technology sector consists of technology advance variables. We adopt the Technological-Advance component of the Industrial-cum-Technological Advance (ITA) index from United Nations Industrial Development Organization to determine this variable. We use the index as a proxy to represent the provision of new technologies to the consumer oil market in the economy. New technology is assumed to bring more efficient products (e.g., more efficient motors), thus efficiency is gaining if the technology advances are increasing. As more new technology is adopted in the market, consumption efficiency is increasing as well. The following equation is provided in [50] to estimate the ITA progression of a country:
ITA Tech-Adv = ( 1 + e a 0.443 ln Y 0.997 ln N ) 1
where Y stands for GDP per capita, N for population and ln for the natural logarithm, while parameter “a” is estimated. By using Malaysia’s GDP per capita and population data, we found that the best estimated value of this parameter is 4.677. Figure 12 presents Malaysia’s ITATech-Adv score produced from the equation. The scores of 0.515 and 0.707 are Malaysia’s ITATech-Adv scores in 1990 and 2002, respectively, as reported in [50].
Figure 12. Malaysia’s ITATech-Adv score (data source: [50]).
Energies 05 02989 g012

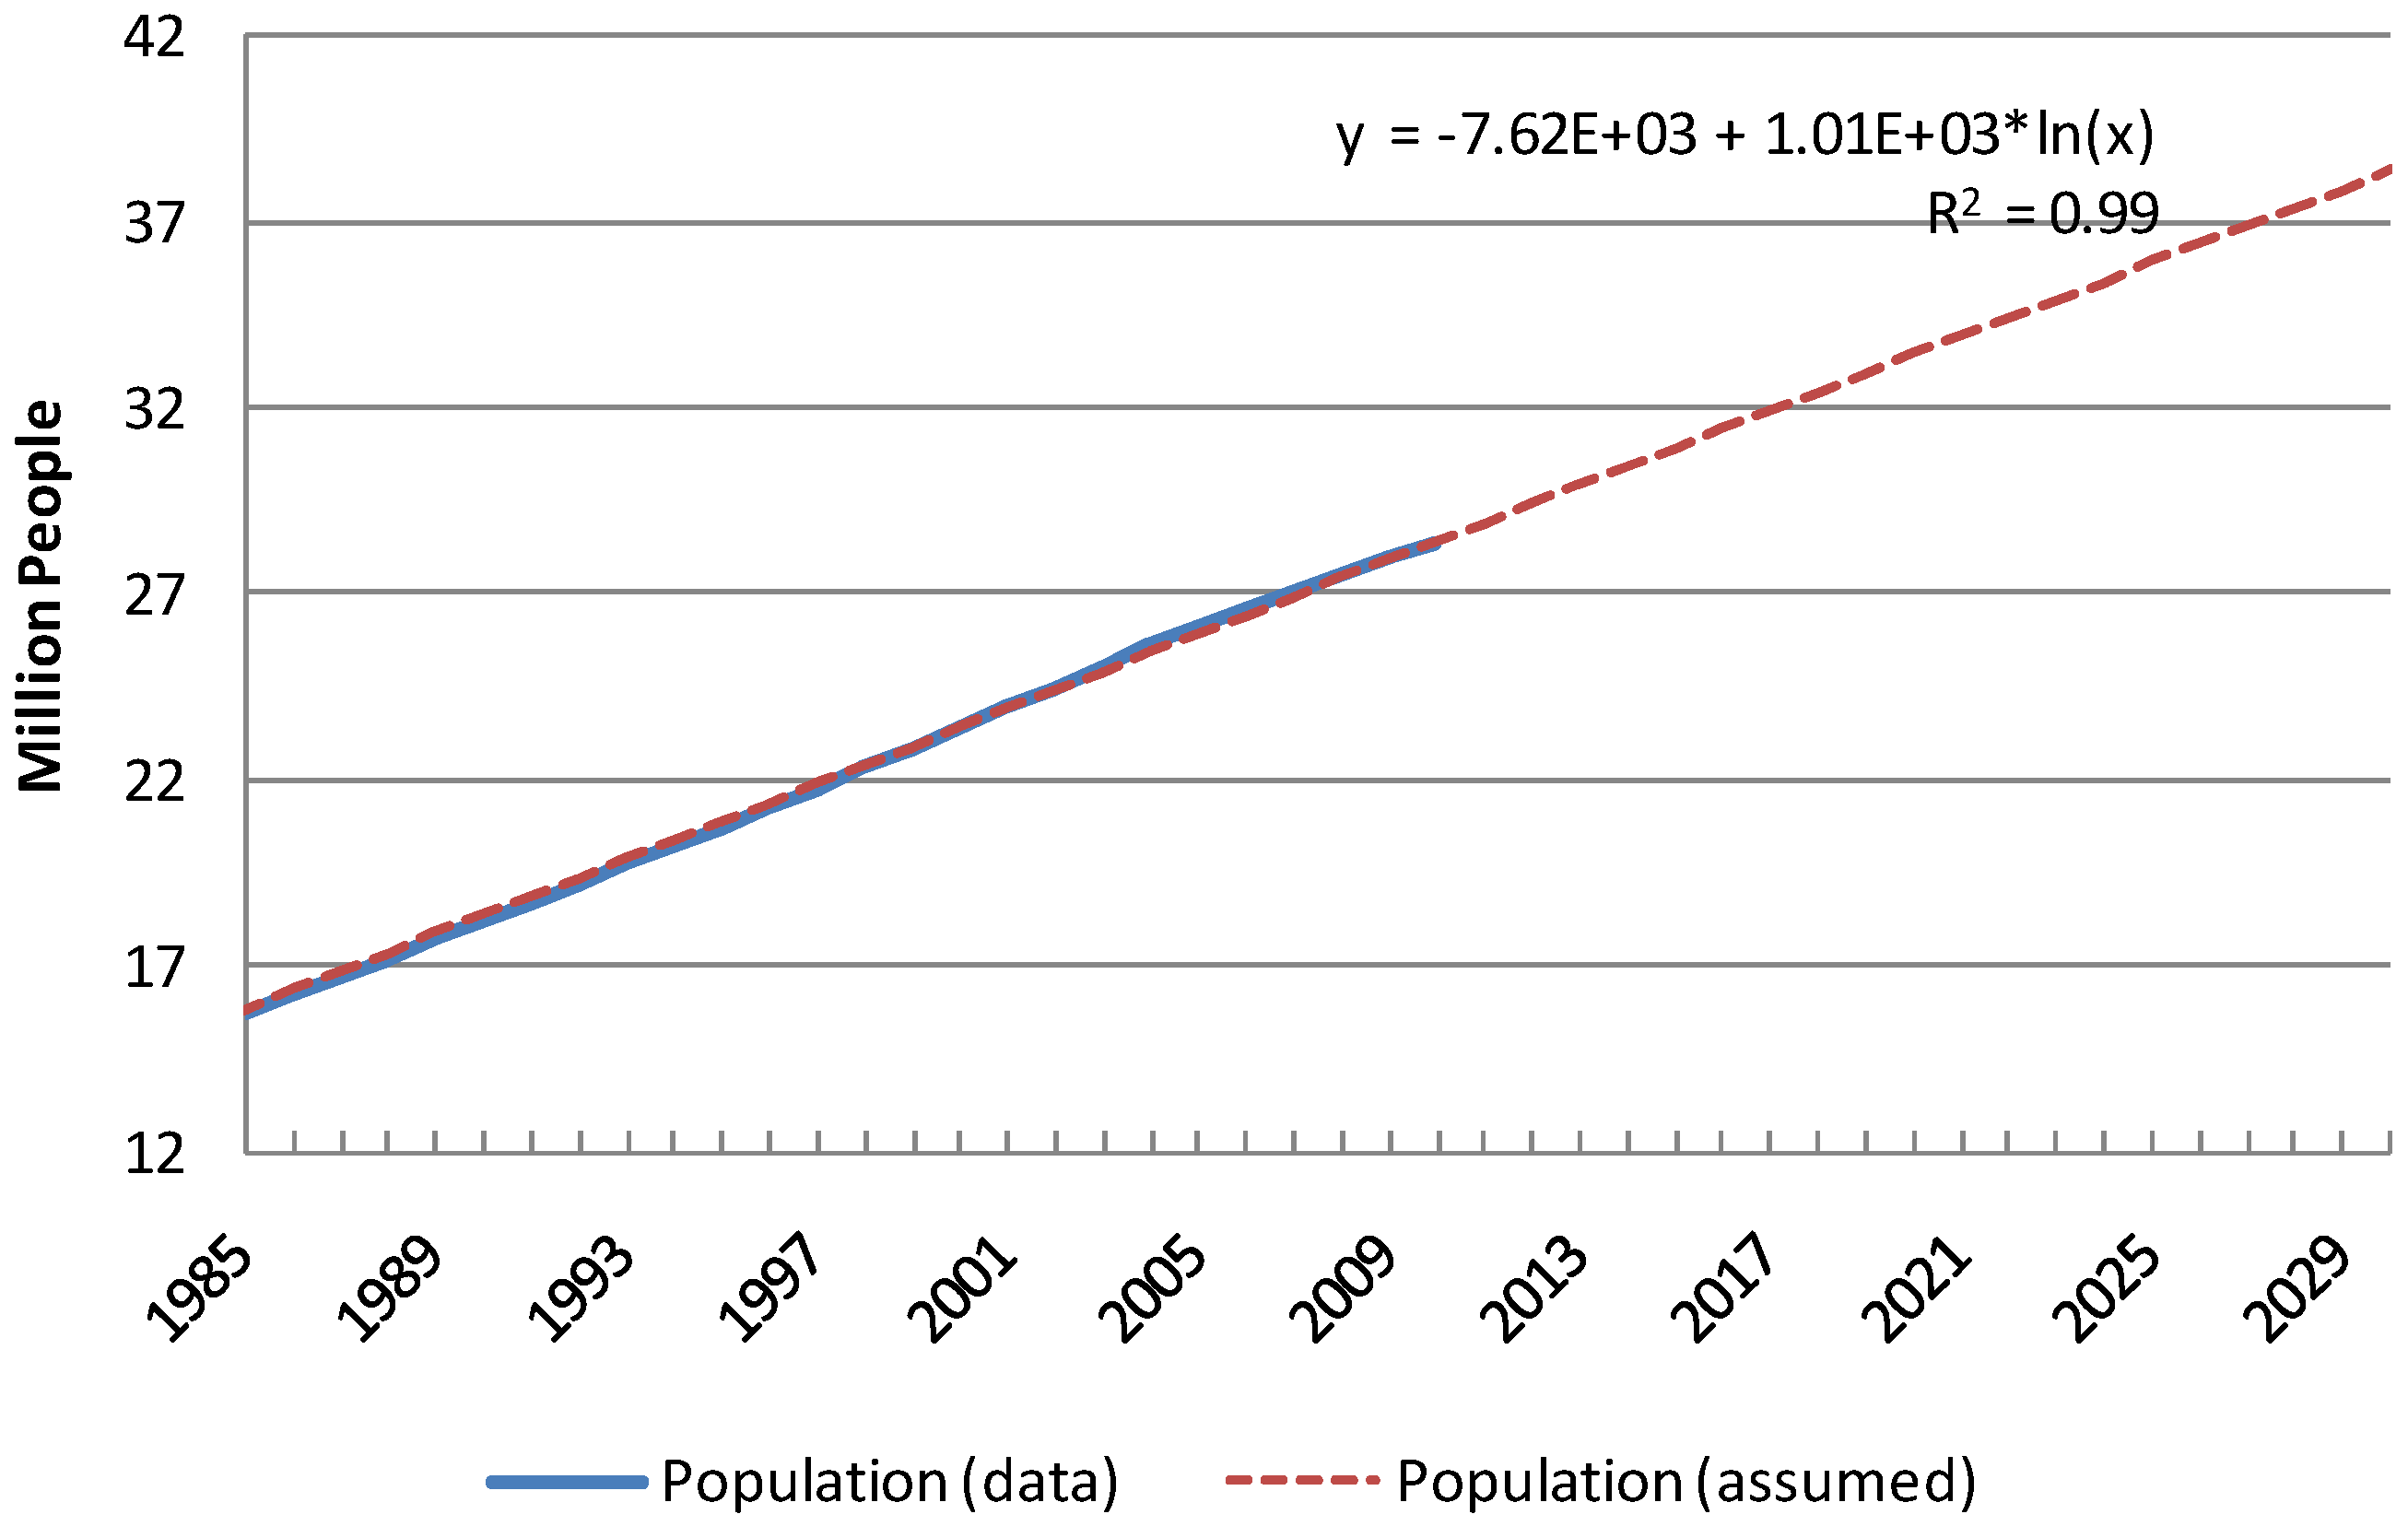
4.2.1.4. Population Sector

This sector has only one exogenous variable—the population variable. It is determined by regression analysis on the country’s historical population data. Figure 13 presents Malaysia’s population historical data and its assumed behavior.
Figure 13. Malaysia’s population data (Source: [51]) and assumed trajectory.
Energies 05 02989 g013

4.2.2. Feedback Loops

The mechanism of the model is characterized by feedback loops. Figure 14 presents the causal loop diagram of the model. Feedback loops are presented as clockwise/counter clockwise black arrows with numbers. A loop is consisted of blue arrows representing the causal relationships of the variables. The polarity signs (+/−) shows the direction of influence of the connected variables. The “+” sign corresponds to positive influence toward a variables or similar direction of change (i.e., increase of oil production will influence oil export to increase). The “−” sign corresponds to negative influence or opposite direction of change (i.e., increase of oil production will influence oil import to decrease). There are two types of feedback loops, reinforcing and balancing loops. Reinforcing loop is one in which the interactions are such that each changes in one variable adds to the other. A balancing loop is a loop in which one or more variables bring the loop toward equilibrium. There are six major loops identified in the model. They will be explained in the next section.
Figure 14. Causal loop diagram of the model.
Energies 05 02989 g014

4.2.2.1. Major Loops Related to Oil Consumption Sector

The first feedback loop is a balancing loop. In this loop, oil consumption influences the amount of oil imported. Along with international oil price level, changes in oil imports will affect oil import value and eventually adjust the GDP through imports. Adjustments to the GDP will then impact the affluence level via GDP per capita. Subsequently, changes in the affluence level positively influence the oil consumption. The second loop has a similar structure as the first. However, in this loop, GDP per capita has a positive influence on technology advancement. Subsequently, advances of technology will positively influence oil consumption efficiency, which then has a negative influence on oil consumption. The third and forth feedback loops have similar causal descriptions as the first and second loops. The distinction is that instead of oil imports, oil import value and import path, these loops take the path of oil exports, oil export value and export.

4.2.2.2. Major Loops Related to Oil Production Sector
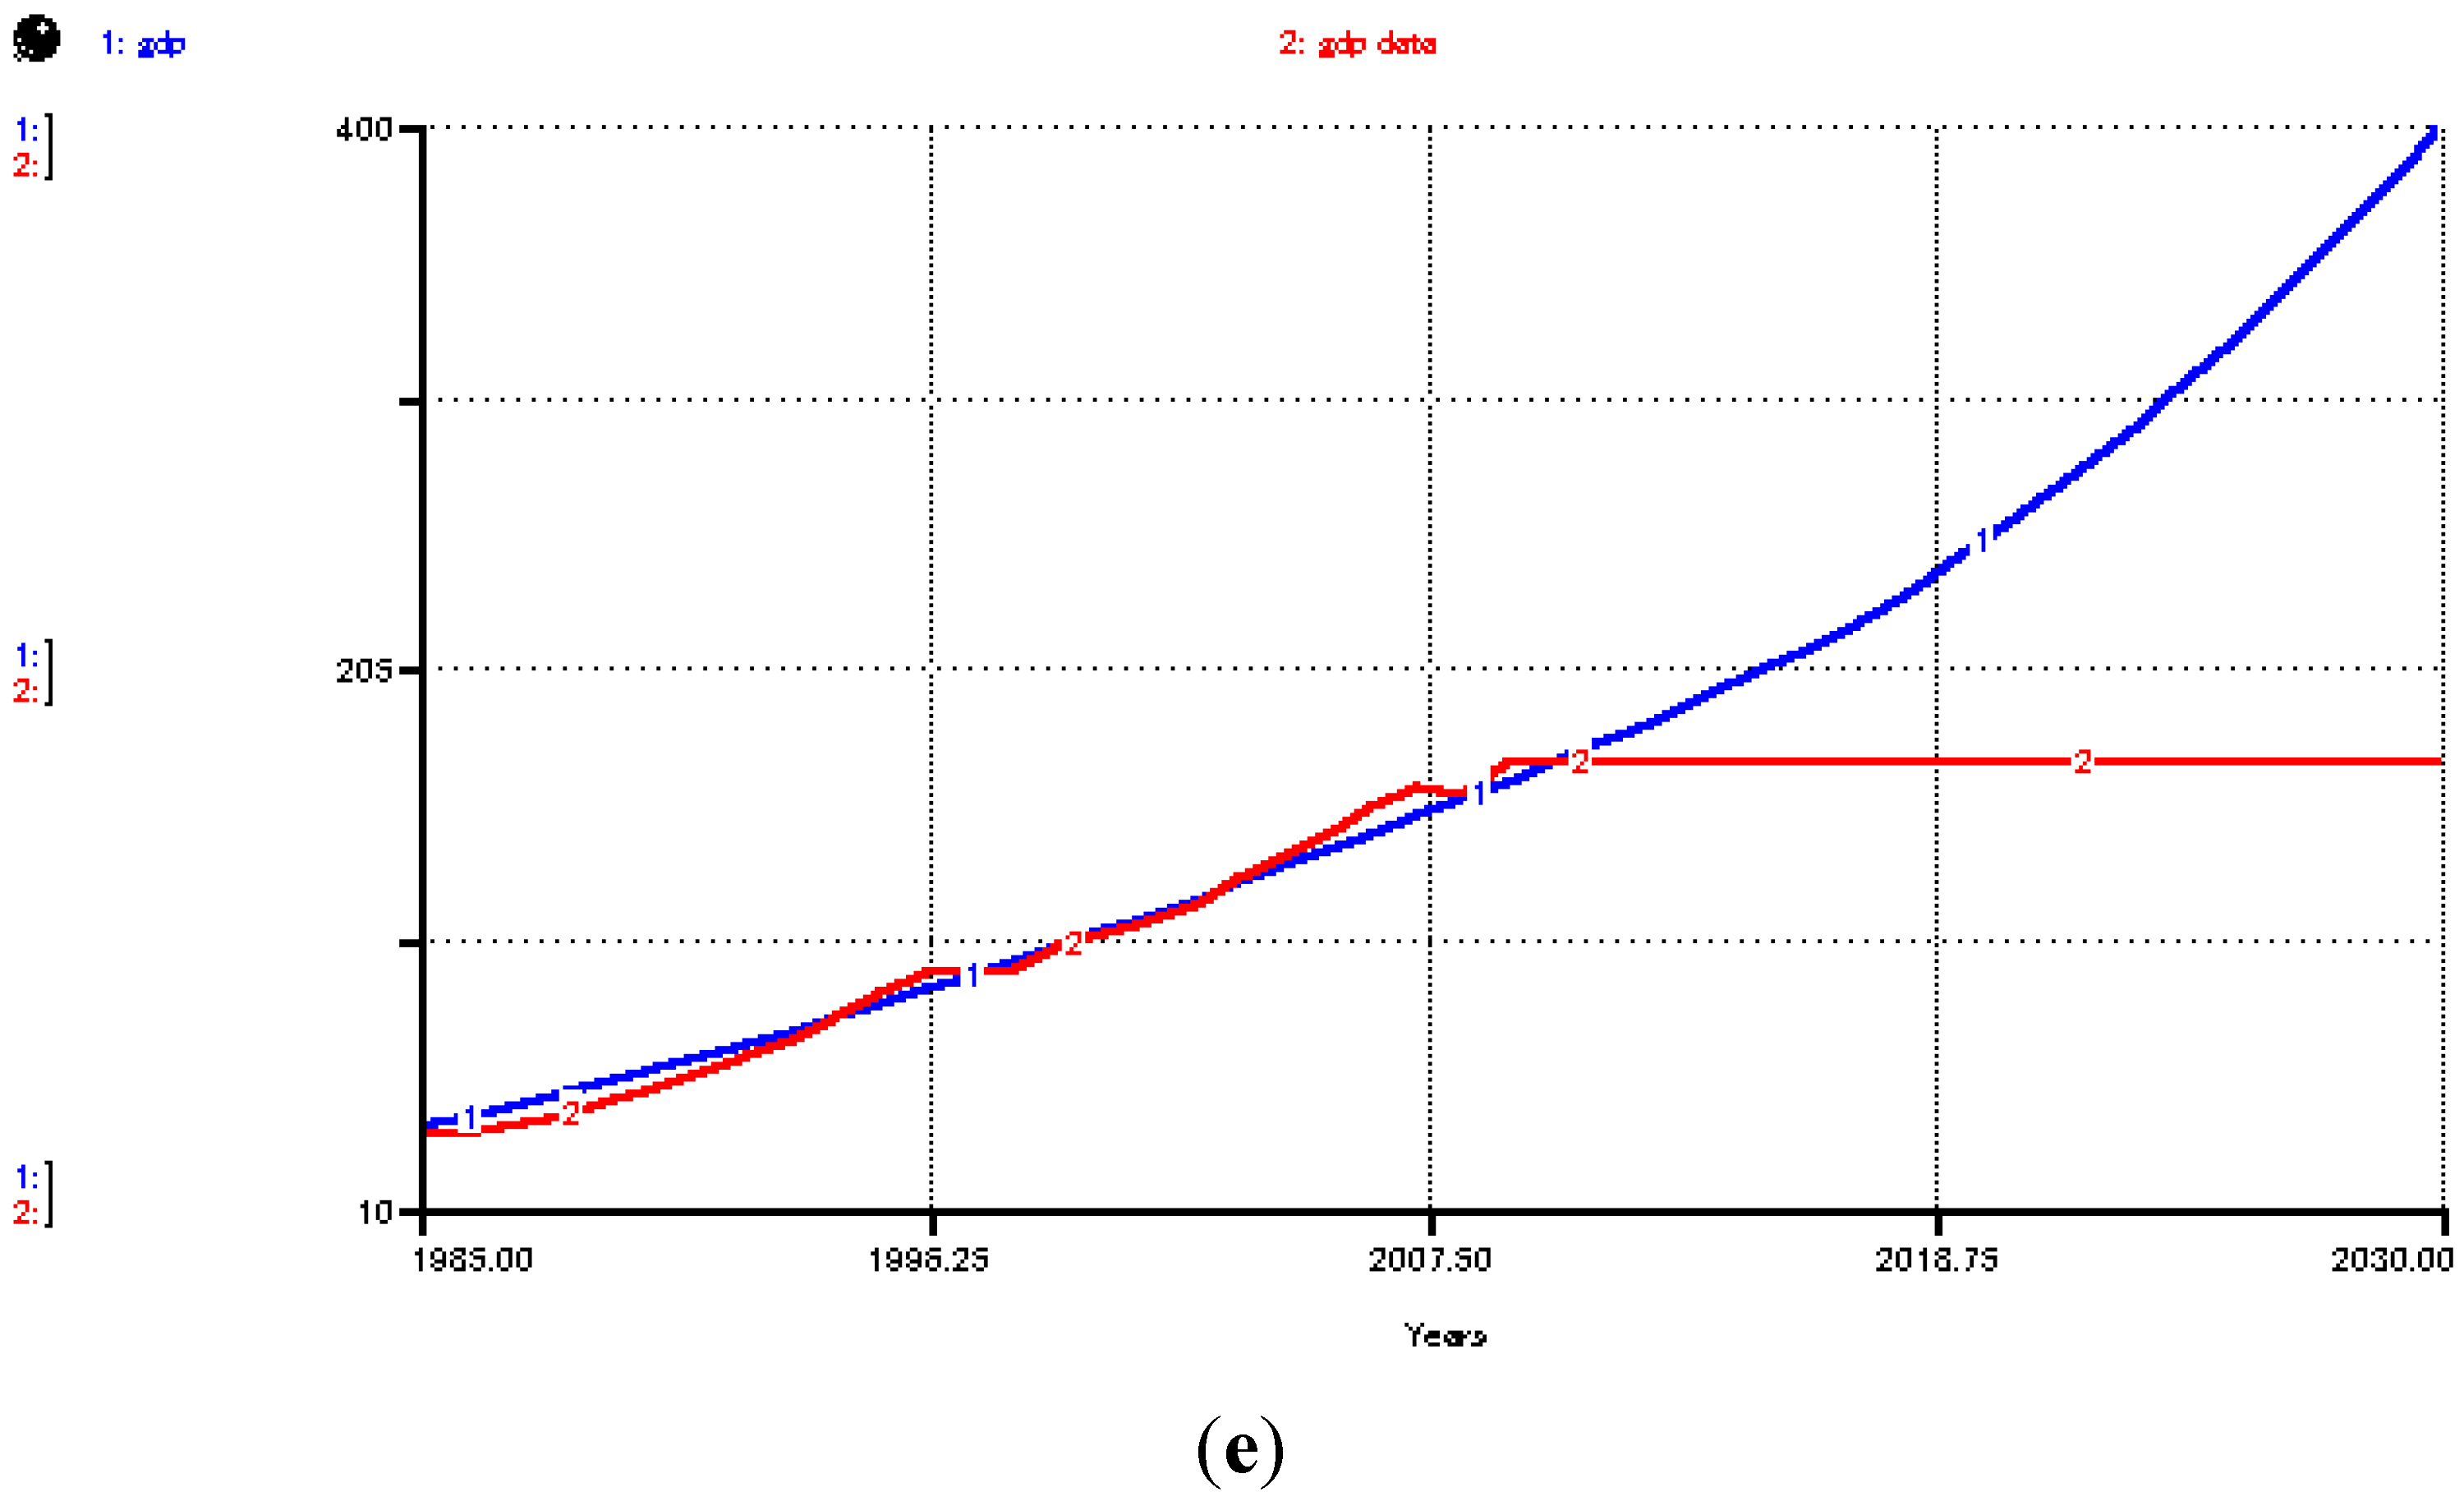
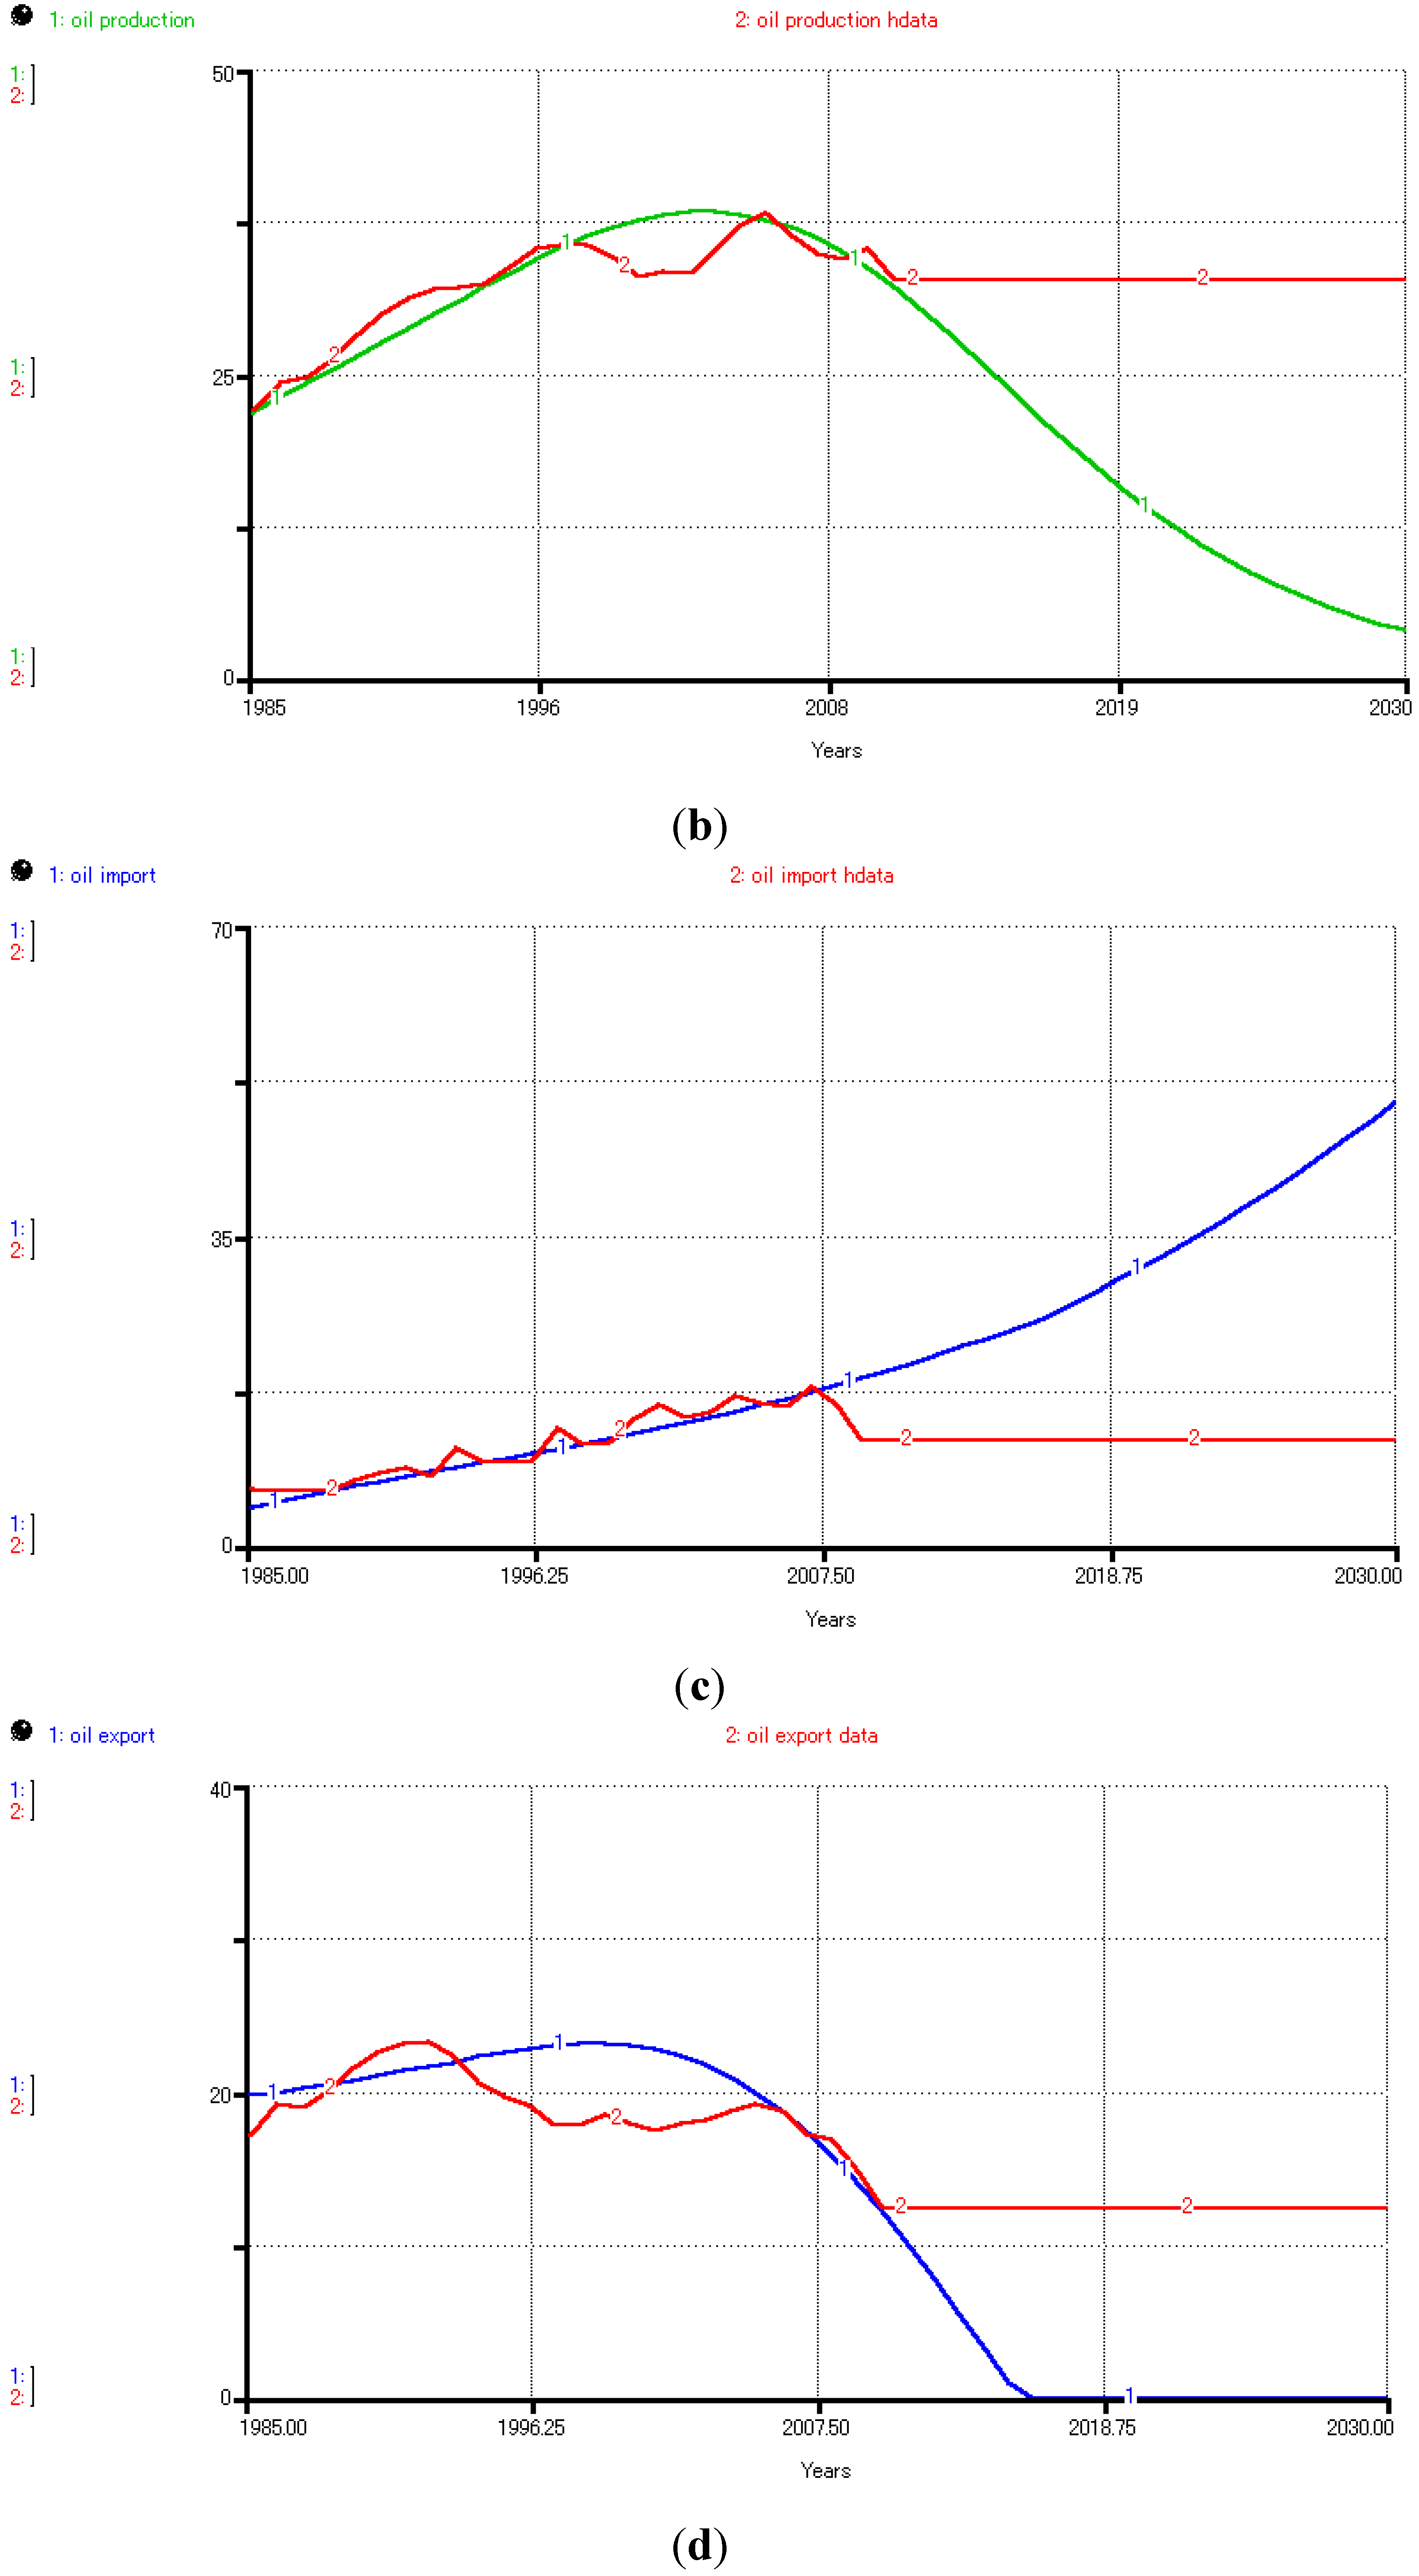
In the fifth loop, oil production has a positive influence on oil exports. Therefore, the value of oil exports will positively influence exports, and subsequently the GDP. Changes in GDP translate as changes in the exploration and production investment. Afterward, along with the declining remaining undiscovered oil, changes in this investment influence positively to oil discoveries. Discoveries give addition to ultimate reserve level which encourages oil production accordingly. The sixth loop has the same structure as the fifth. The difference is that from oil production, the path of influences is via oil imports, oil import value, import and finally the GDP. Both loops are reinforcing loops.

4.2.3. Validation

Two tests were conducted to build confidence on the model. First, the assumed relationships between variables were checked using regression on historical data. There are three key assumed relationships in the model: (1) Oil consumption is influenced by price of oil products at the consumer level, the affluence level and the consumption efficiency; (2) oil imports are influenced by oil production and consumption; and (3) oil exports are influenced by oil production and consumption. The results of the test show consistency with the causal relationships described in the previous section. The test results are presented in Table 2. Second, simulation results were compared against their historical data, to check model ability to replicate previously known behavior. Critical variables to test are oil consumption, oil production, oil import, oil export and GDP. Figure 15 presents the simulation results of these critical variables against their historical data.
Table 2. Test on key assumed relationships.
VariableRegression on historical data
Oil ConsumptionCONSM = −17.46EFF + 30.047AFF − 5.44PRICE
R2 = 0.98
Oil ImportOM = 0.364CONSM 0.058OP
R2 = 0.92
Oil ExportOX = −0.632CONSM + 0.938OP
R2 = 0.99
Figure 15. Simulation results of critical variables versus its historical data: (a) Oil consumption; (b) Oil production; (c) Oil import; (d) Oil export; (e) GDP.
Energies 05 02989 g015aEnergies 05 02989 g015bEnergies 05 02989 g015c
It can be visually observed from the generated results that the model can replicate the historical behavior of those variables relatively well. The results were further checked using the mean squared error (MSE), root mean squared error (RMSE), and root mean squared percentage error (RMSPE). The MSE provides a measure of total errors in terms of the square of the variable units. The RMSE provides a measure of error with the same unit of the variable. The RMSPE provides a normalized measure of the magnitude of error in terms of percentage. Table 3 summarizes the error analysis results of these variables.
Table 3. Error analysis of critical variables.
VariableMSE (unit2)RMSE (unit)RMSPE (%)
Oil production (Mtoe)4.32.10.32%
Oil consumption (Mtoe)3.81.91.97%
Oil export (Mtoe)21.04.62.2%
Oil import (Mtoe)11.63.42.1%
GDP (Bil. USD)45.56.71.41%
Bearing in mind the purpose of the model, visual observation and statistical error analysis above, the historical behavior reproduction of these variables is considered sufficient.

4.2.4. Data

The bulk of the oil data from 1985 to 2009 is coming from the publicly available IEEJ energy database. To maintain as much consistency as possible, we selected this as the main source of data. In the case of data unavailability, data from British Petroleum (BP) statistics and Bundesanstalt für Geowissenschaften und Rohstoffe (BGR) and Malaysia Energy Centre (MEC) were used. Data on international oil prices is collected from the Energy Information Administration (EIA). Data on petrol prices were collected from various reports and articles in Bernama (Malaysian national news agency). Economic and population data is coming from the United Nation Statistics Division (UNSTAT), while technological advance data is coming from United Nations Industrial Development Organization (UNIDO).

4.3. Scenarios

A reference scenario and four alternative scenarios are developed for the study: Business as usual (BAU), EOR implementation (EOR), investment (INV), technology advance (TECH) and subsidy elimination (SUB). Additionally, a scenario describing combined alternative scenarios is also considered.
The alternative scenarios do not necessarily represent any particular policy, strategy or event existing now or in the past. Rather, they are representing possible future events. Simply put, these scenarios are “what-if” situations. Nevertheless, we review some references for the parameter setting of the scenarios. Each scenario describes a situation which will be explained in the following section. Table 4 summarizes the parameter settings for the scenarios.

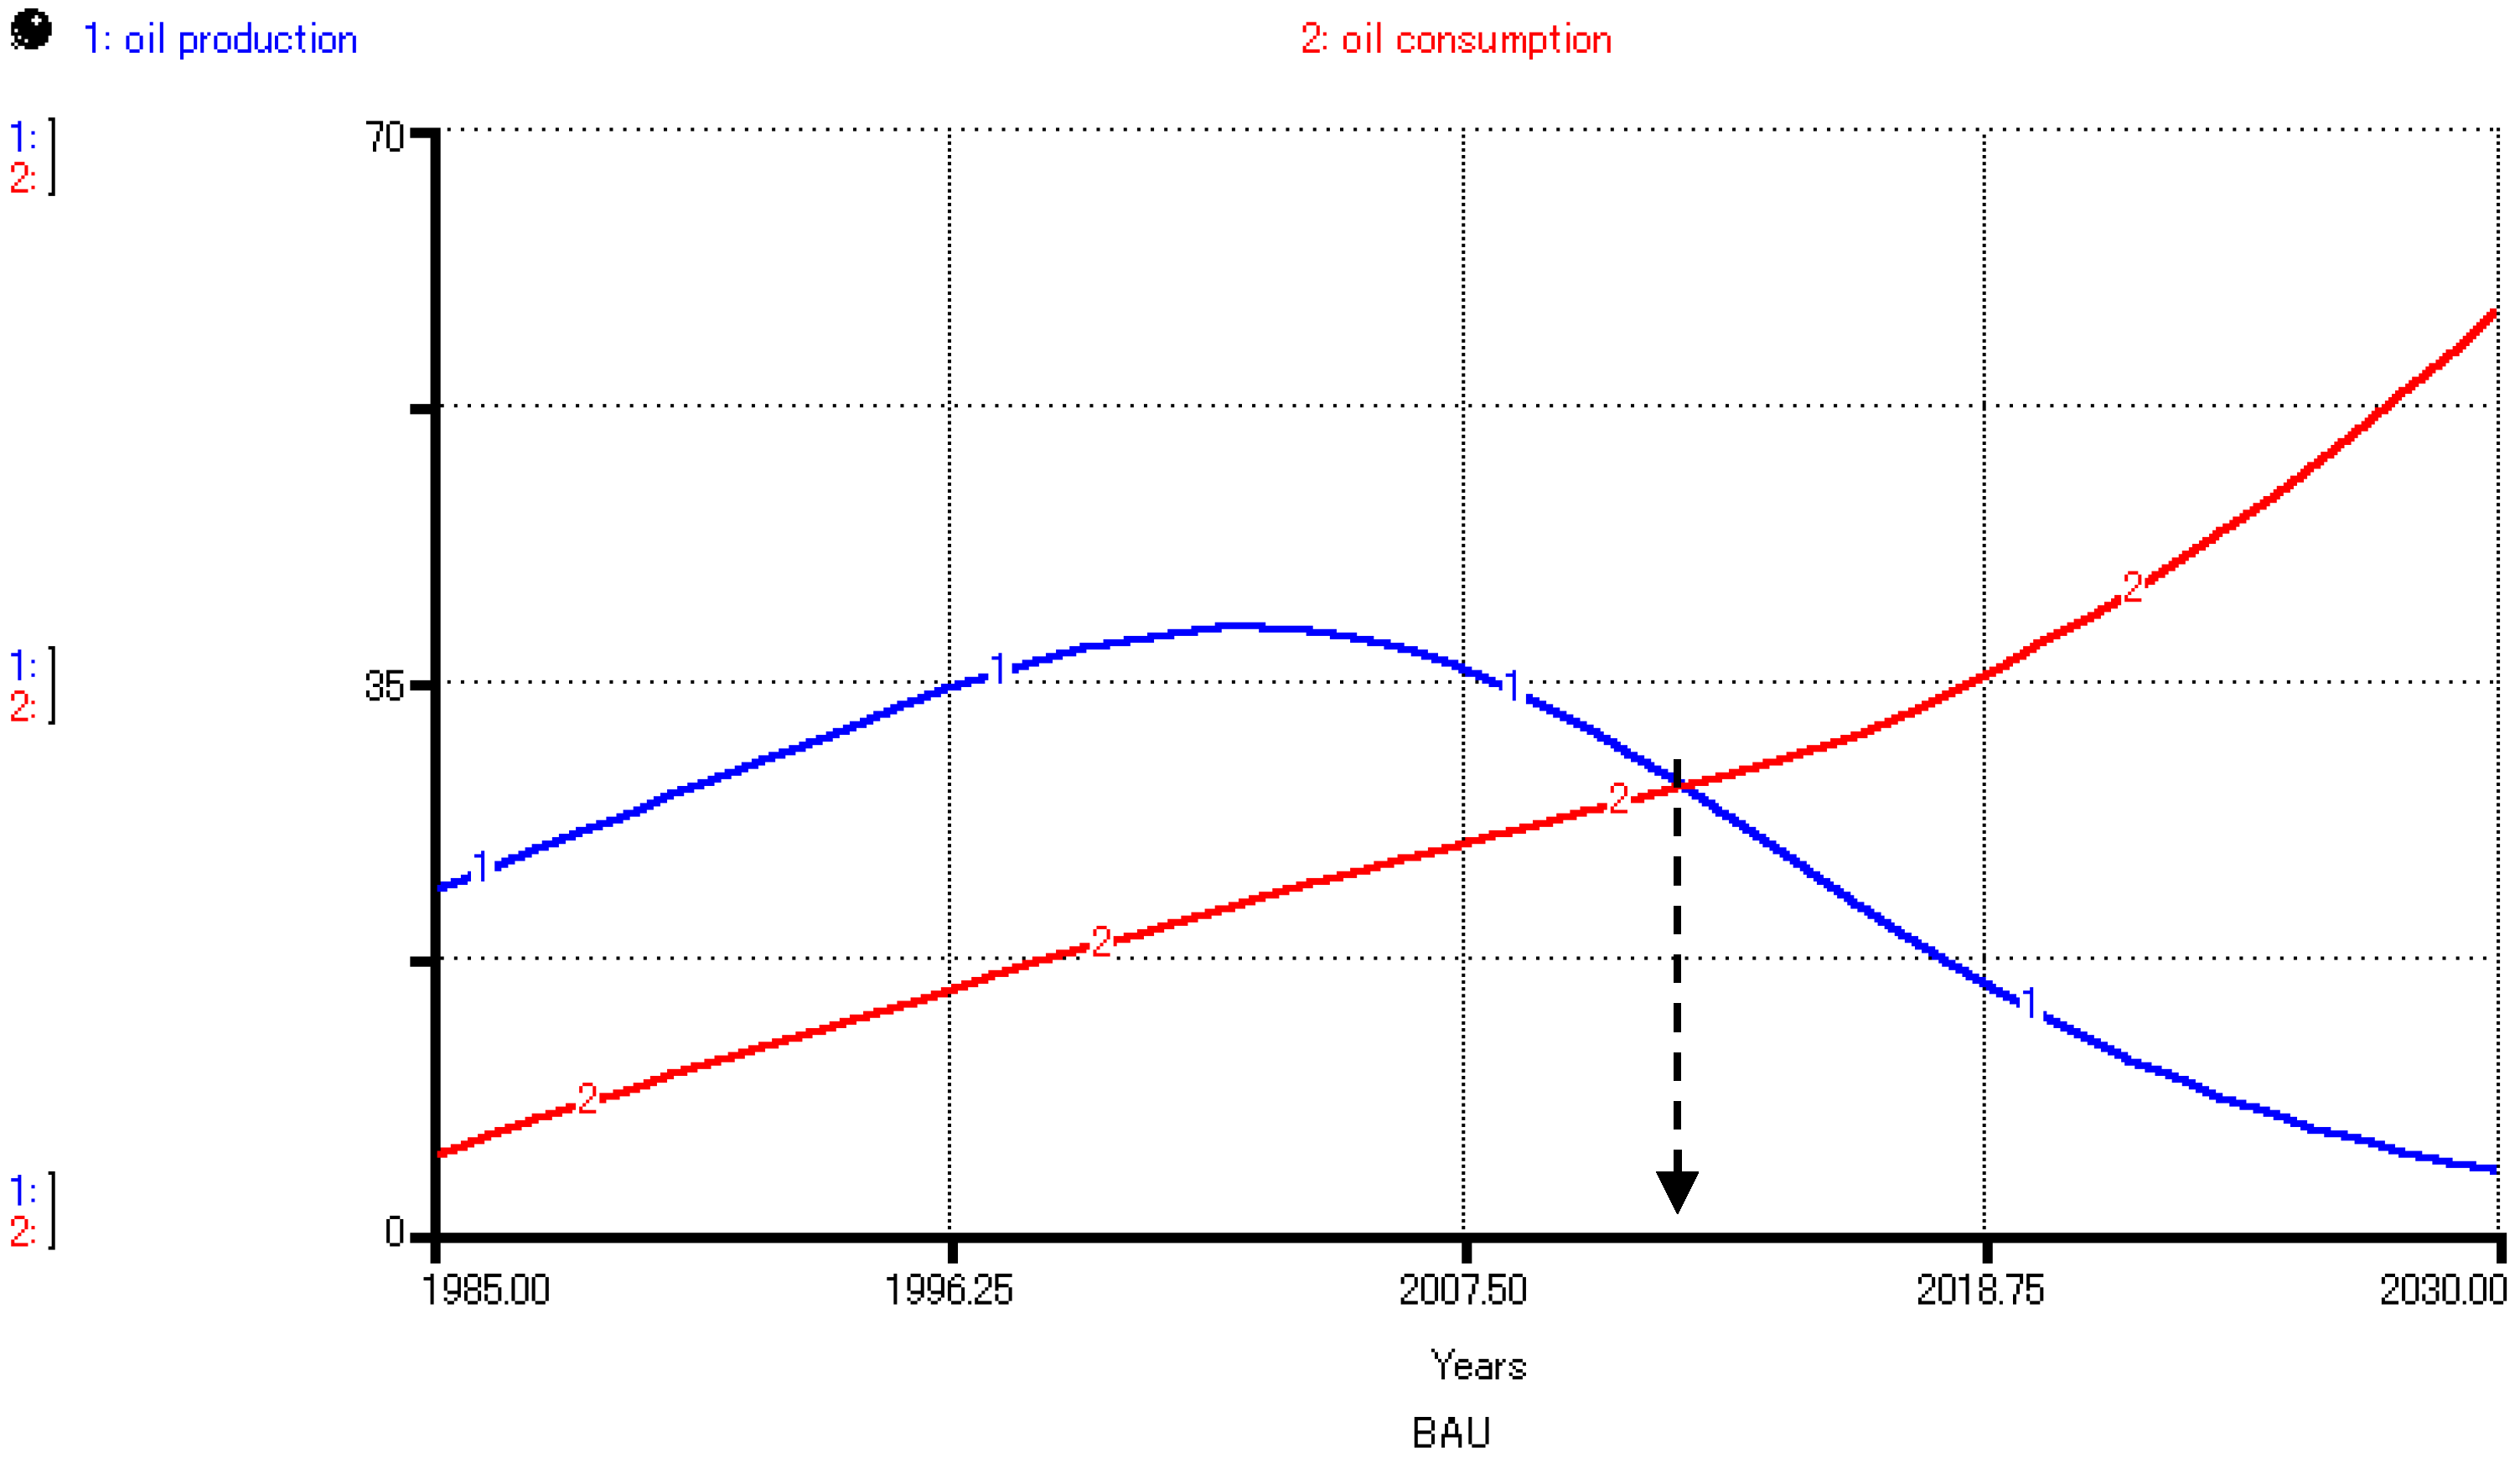
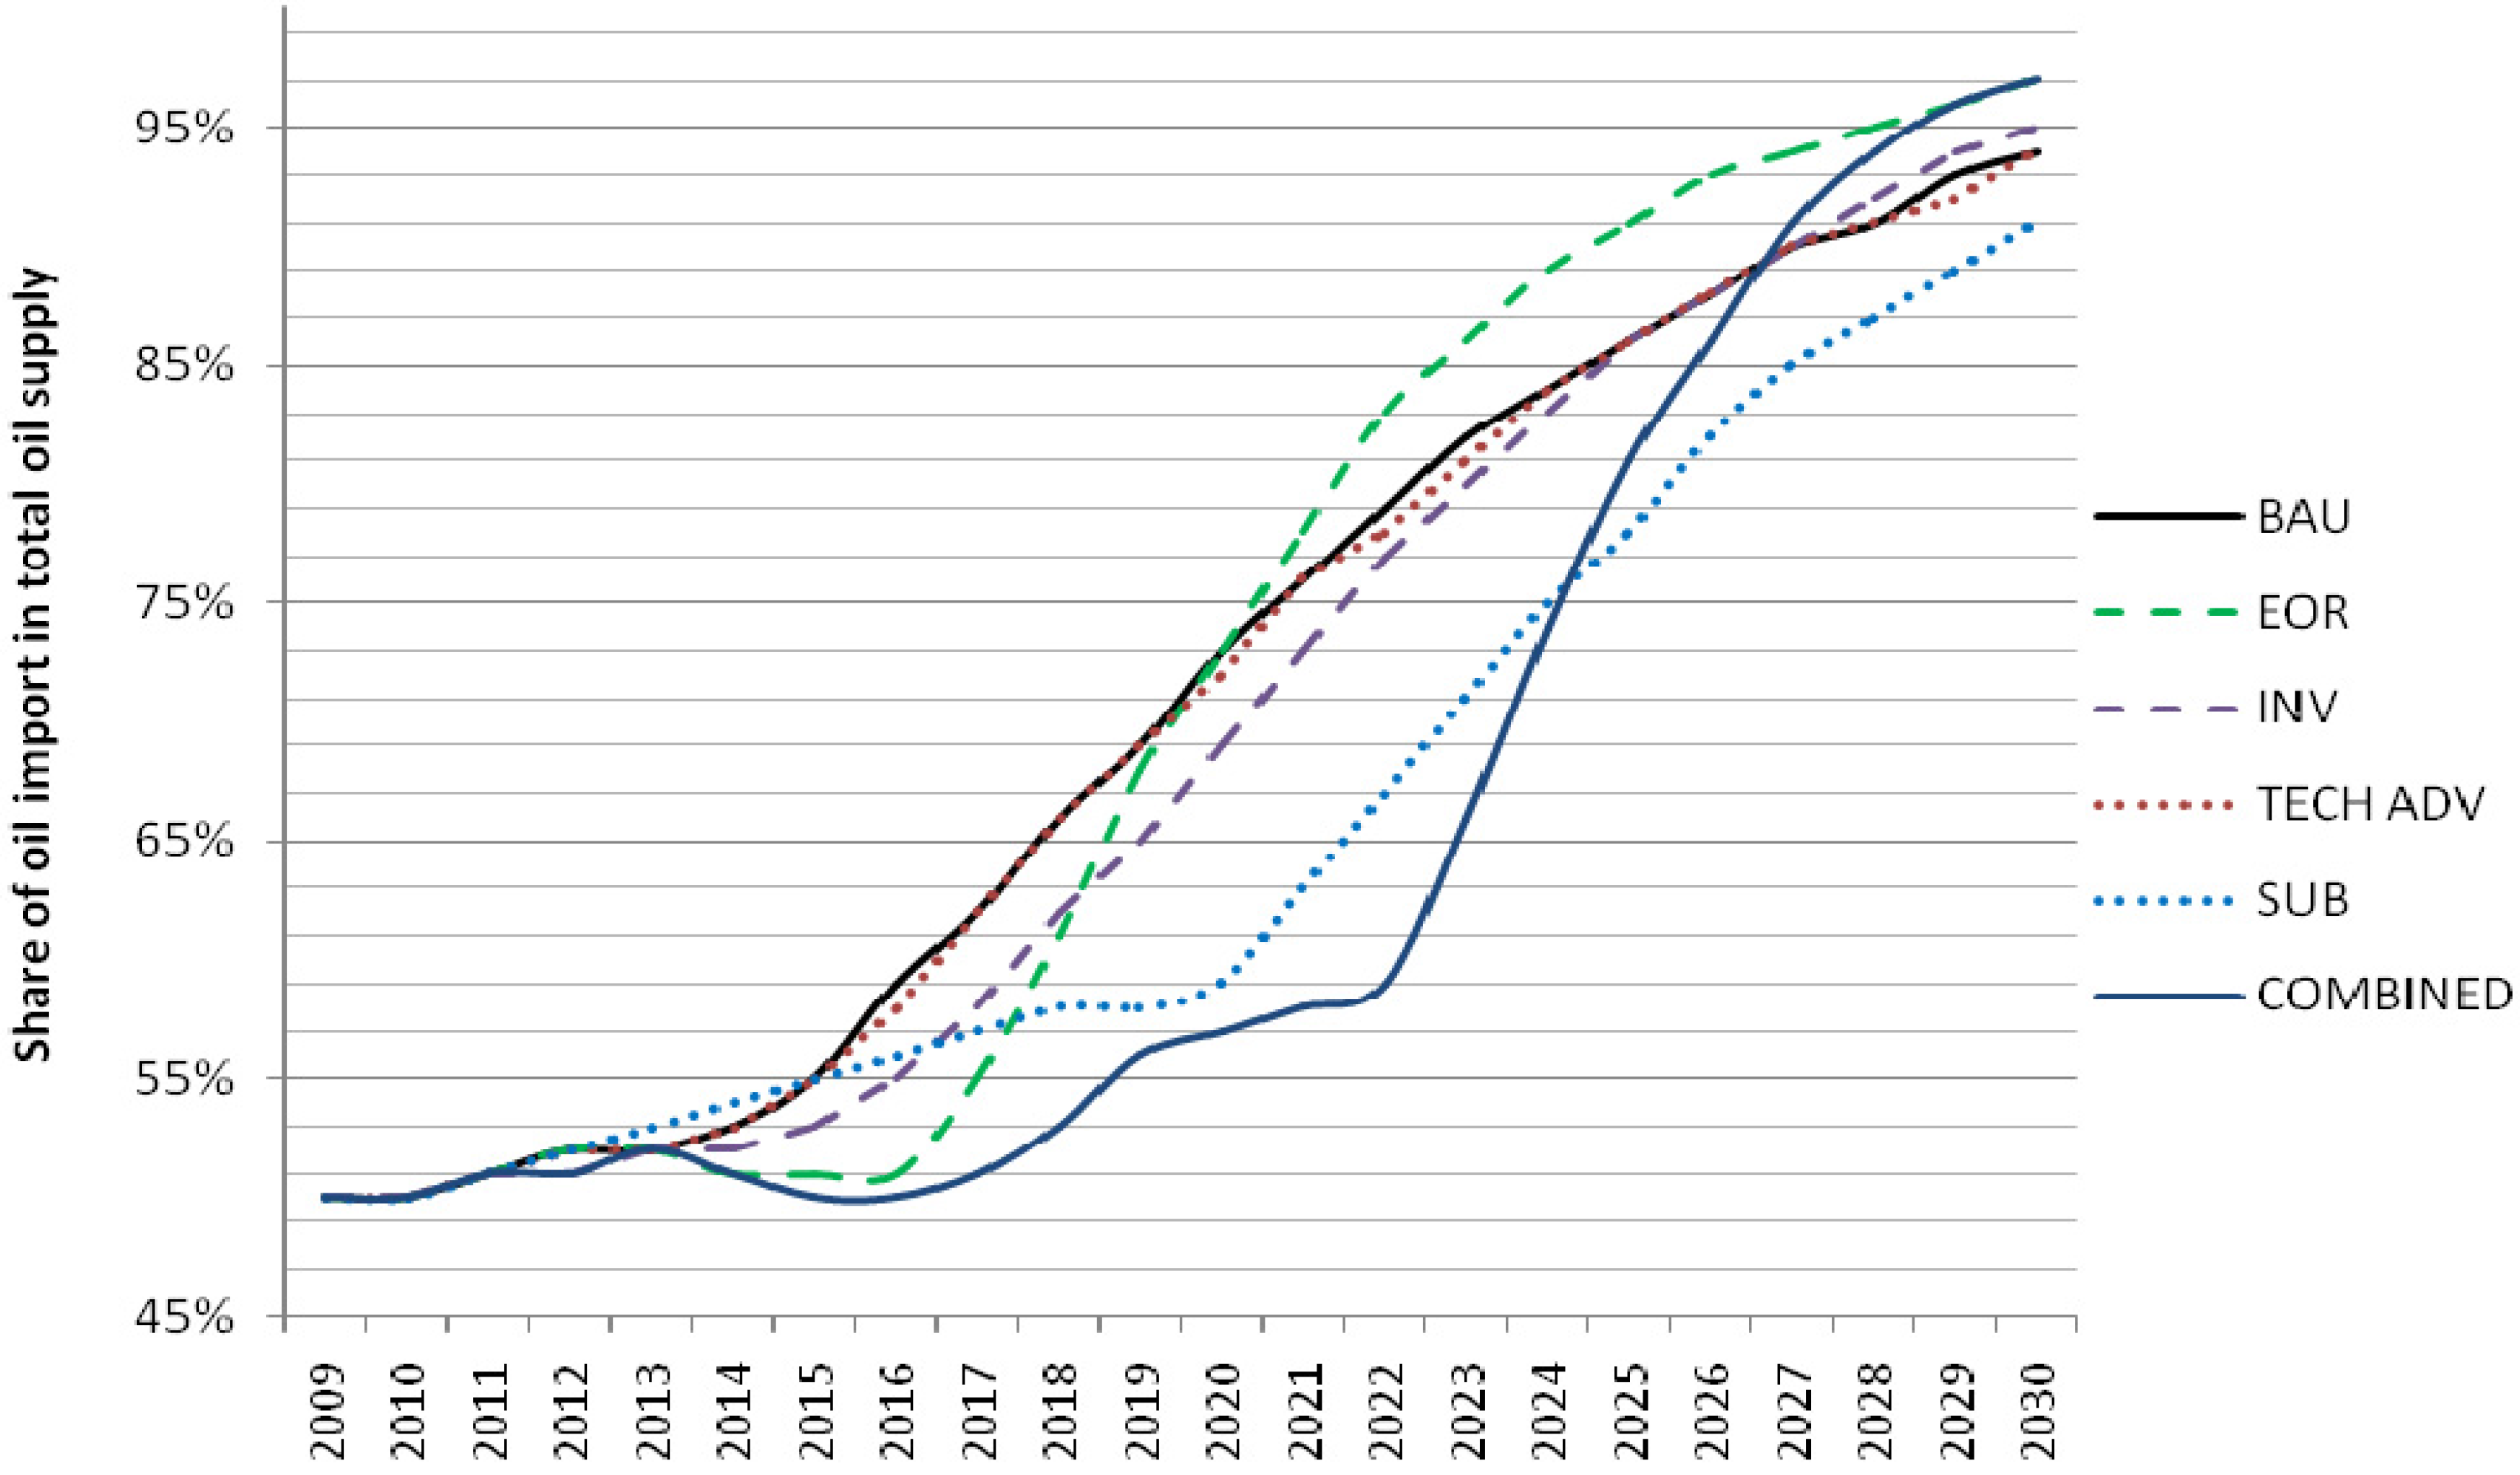
4.3.1. Business as Usual (BAU)

The BAU scenario was developed as a reference scenario. It describes the continuation of policies and strategies occurring before 2009. We assumed that impacts of events are represented by the data, thus it is based on historical data. In this scenario, the initial oil reserve is set at 2611 Mtoe. Government subsidy on oil products is approximated using the price of the most utilized gasoline grade (RON95). The price of RON95 was RM 1.90/L in December 2010, while the price of the same gasoline grade without subsidy in Singapore was RM 4.36/L [52]. Using this comparison, we assumed that the subsidy is 56.4% (RM 2.46/L) for the whole simulated years. Other parameters are set to follow basic assumptions explained in the previous section.
Table 4. Scenarios parameters setting.
ParameterScenario
BAUEORINVTECHSUB
SubsidyConstant at RM 2.46as BAUas BAUas BAUDecrease to RM 0 in 2020
Technology advance growthas BAUas BAU3× fasteras BAU
Intrinsic growthConstant at 0.079Increase 32.8% annually from 2014 to 2020as BAUas BAUas BAU
E&P investment growthConstant growth at 35% annuallyas BAU75% annual growth from 2010 to 2015; 50% annual growth from 2016 to 2020as BAUas BAU

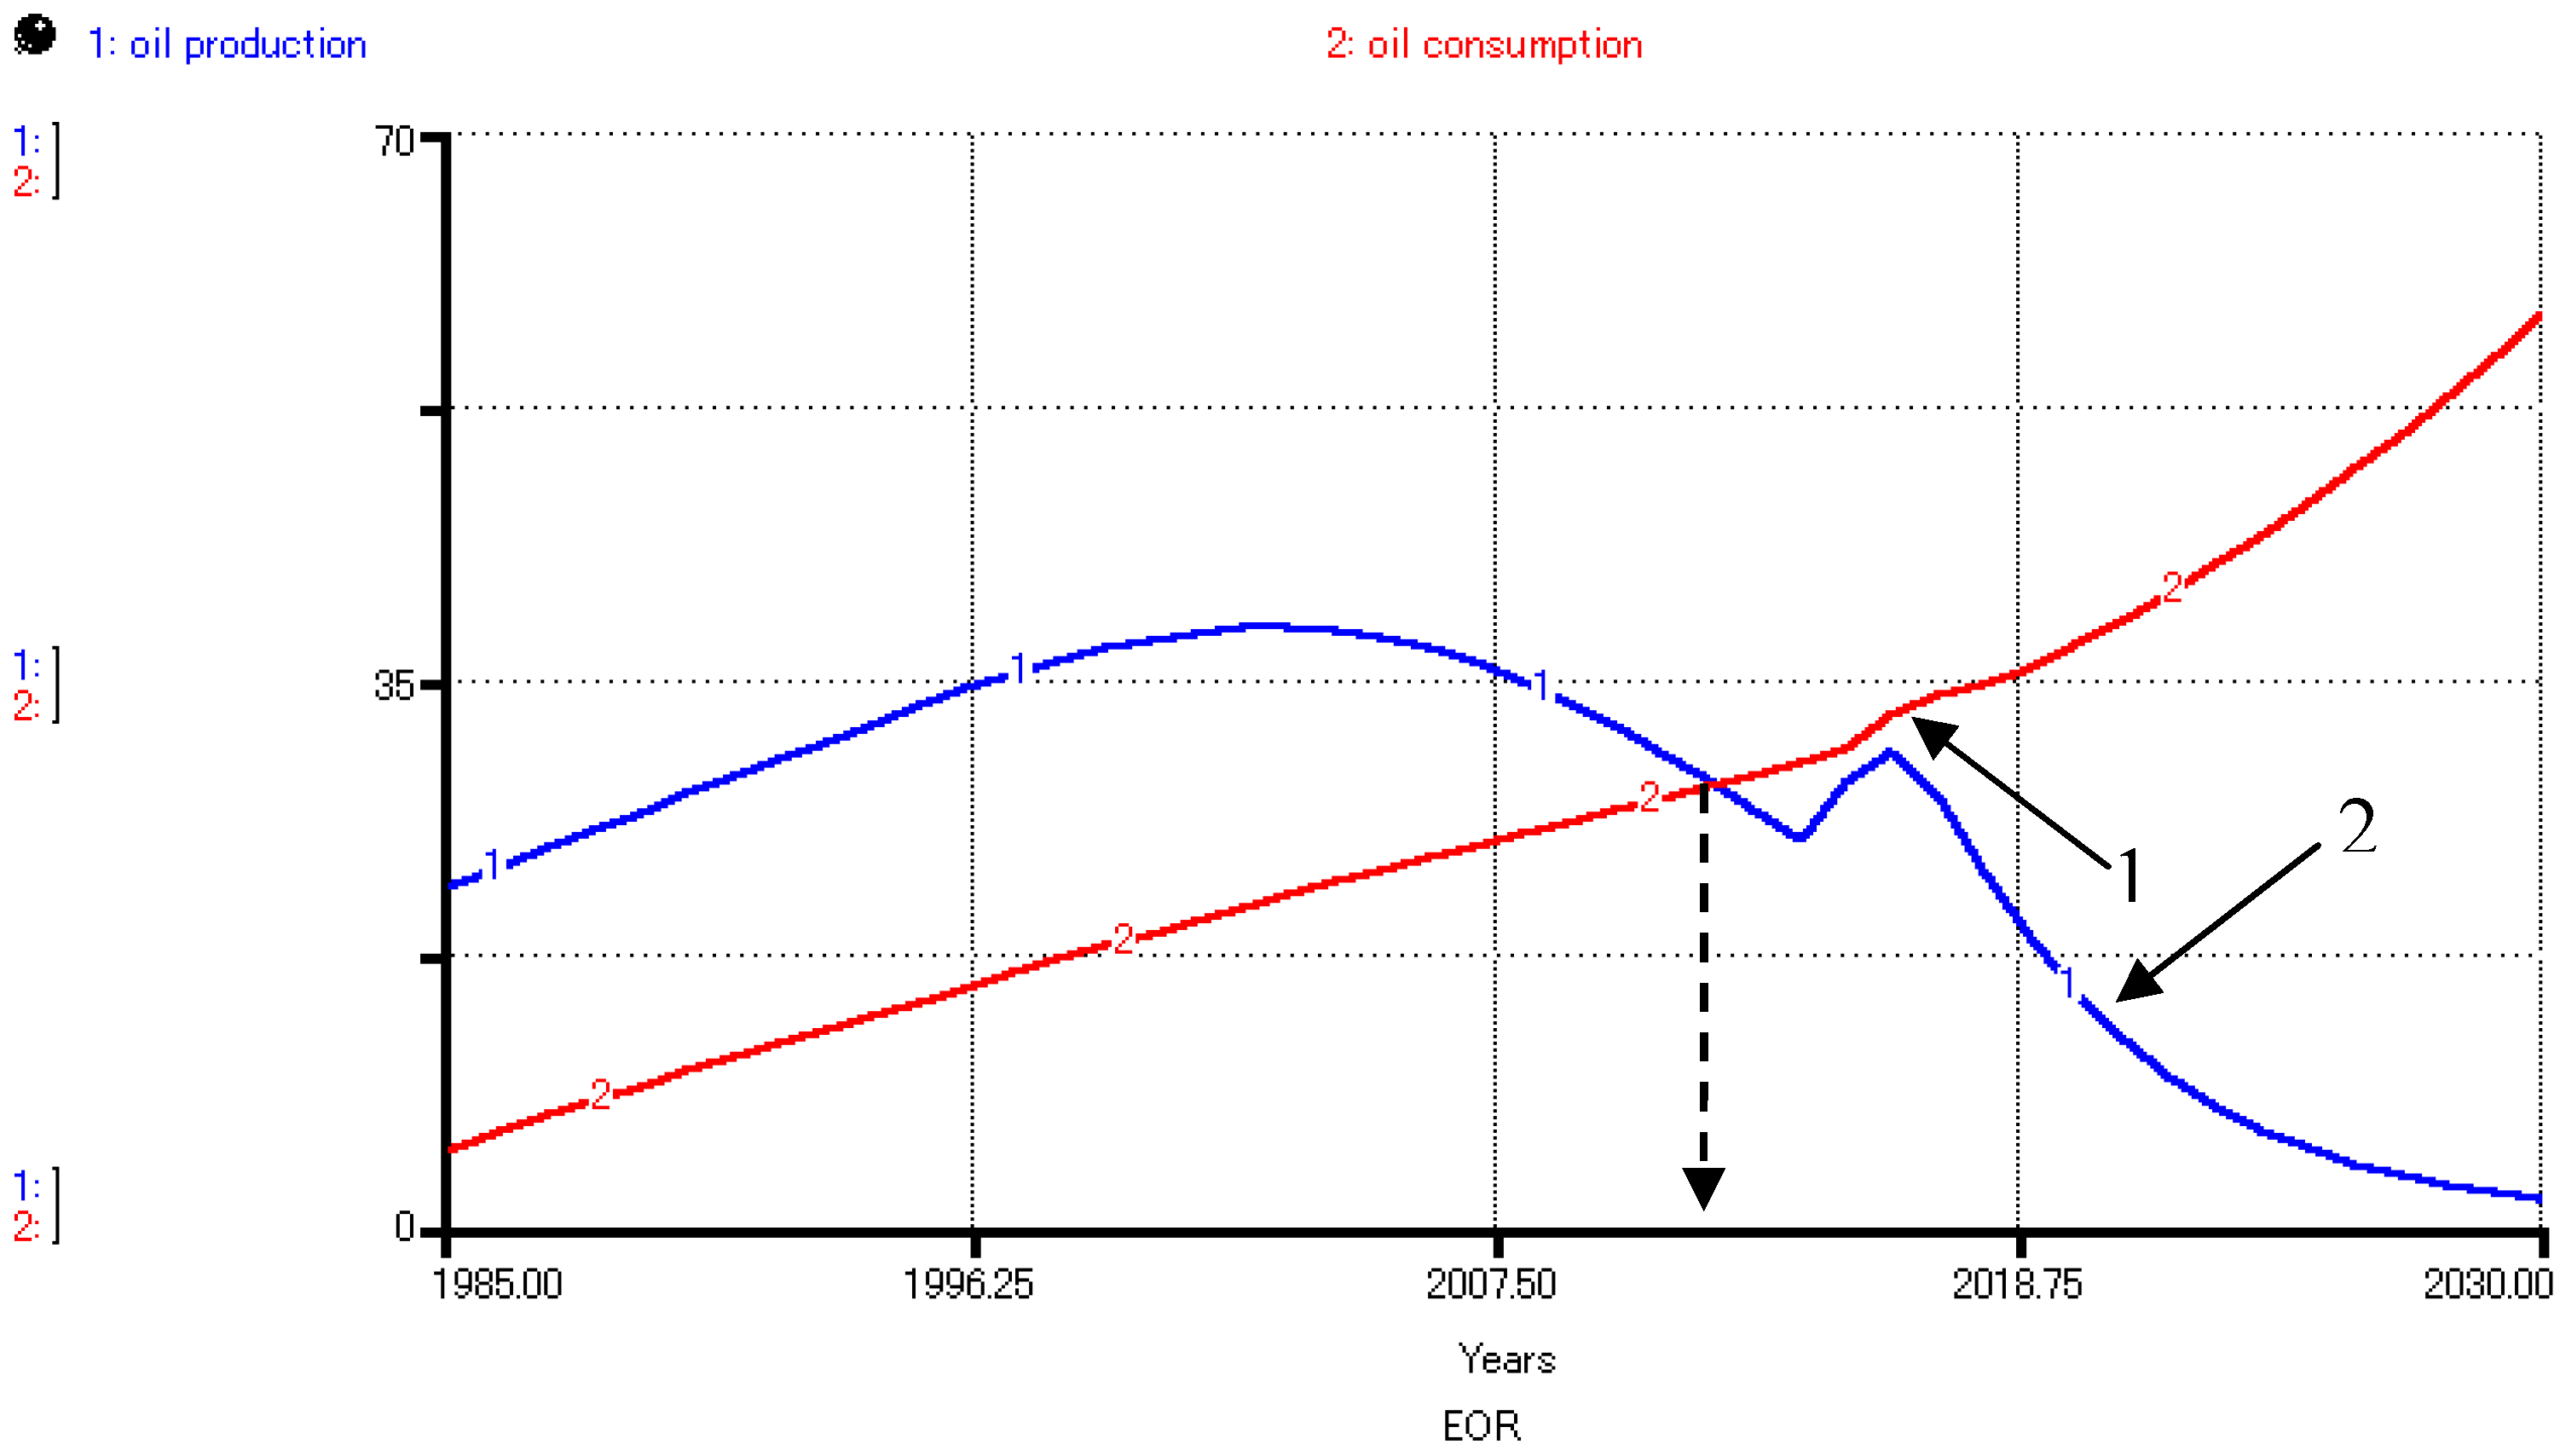
4.3.2. Enhanced Oil Recovery (EOR)

The EOR scenario reflects a situation where Petronas’s EOR projects [25] are starting to contribute from 2014 onwards. The average recovery rate of Malaysia’s oil reservoirs is 36.8%, while the remaining oil-in-place (63.2%) is unrecoverable or cannot be produced [23]. This scenario assumed that EOR implementation will increase the recoverability of all oil reservoirs to 100% of their potential, thus oil production will increase accordingly. Therefore, the intrinsic growth parameter is set to increase 32.8% annually to simulate the full gain of production from 2014 to 2020, and stay at this level until 2030.

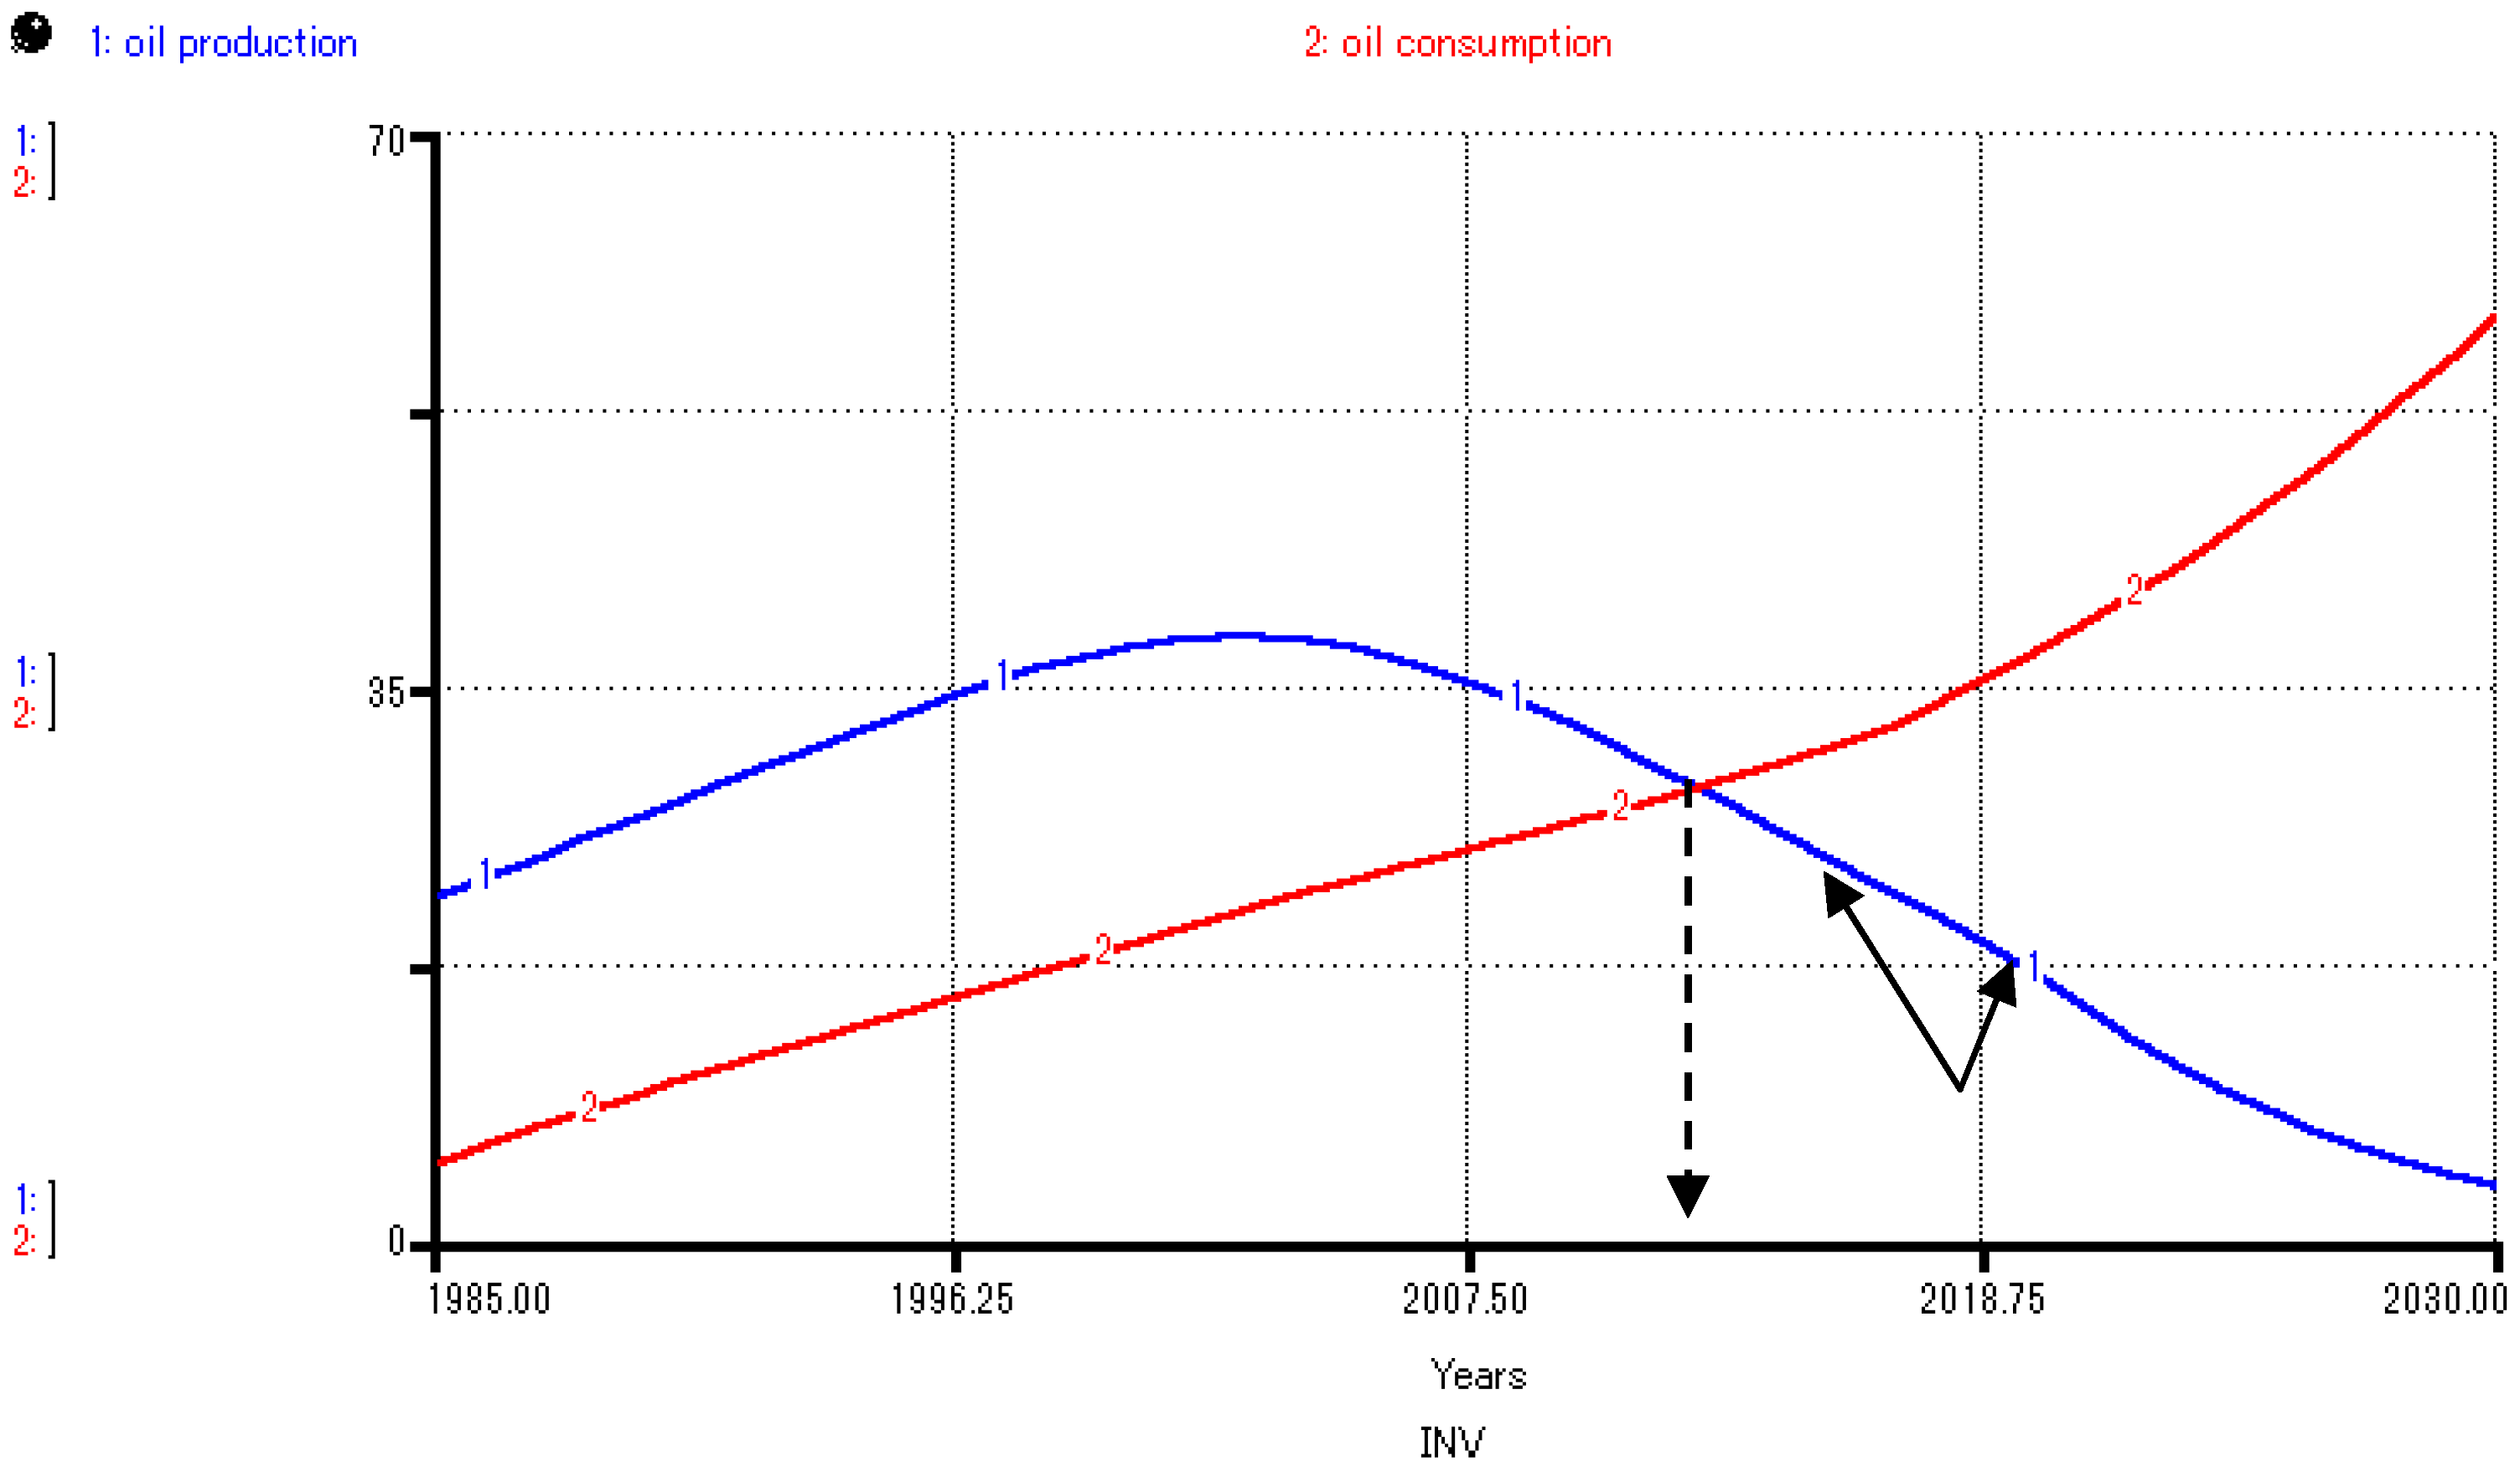
4.3.3. Investment (INV)

During the last five years, investment in oil exploration and production has tripled with an average of 35% annual growth [20,44,45,46,47,48,49]. This scenario describes a situation where investment growth is twice as much or 70% annually from 2010 to 2015, and then 50% from 2016 to 2020, and stays at this level until 2030. The decline on the later simulation years is based on the assumption that the costs will become very high that render the investment to slow down.

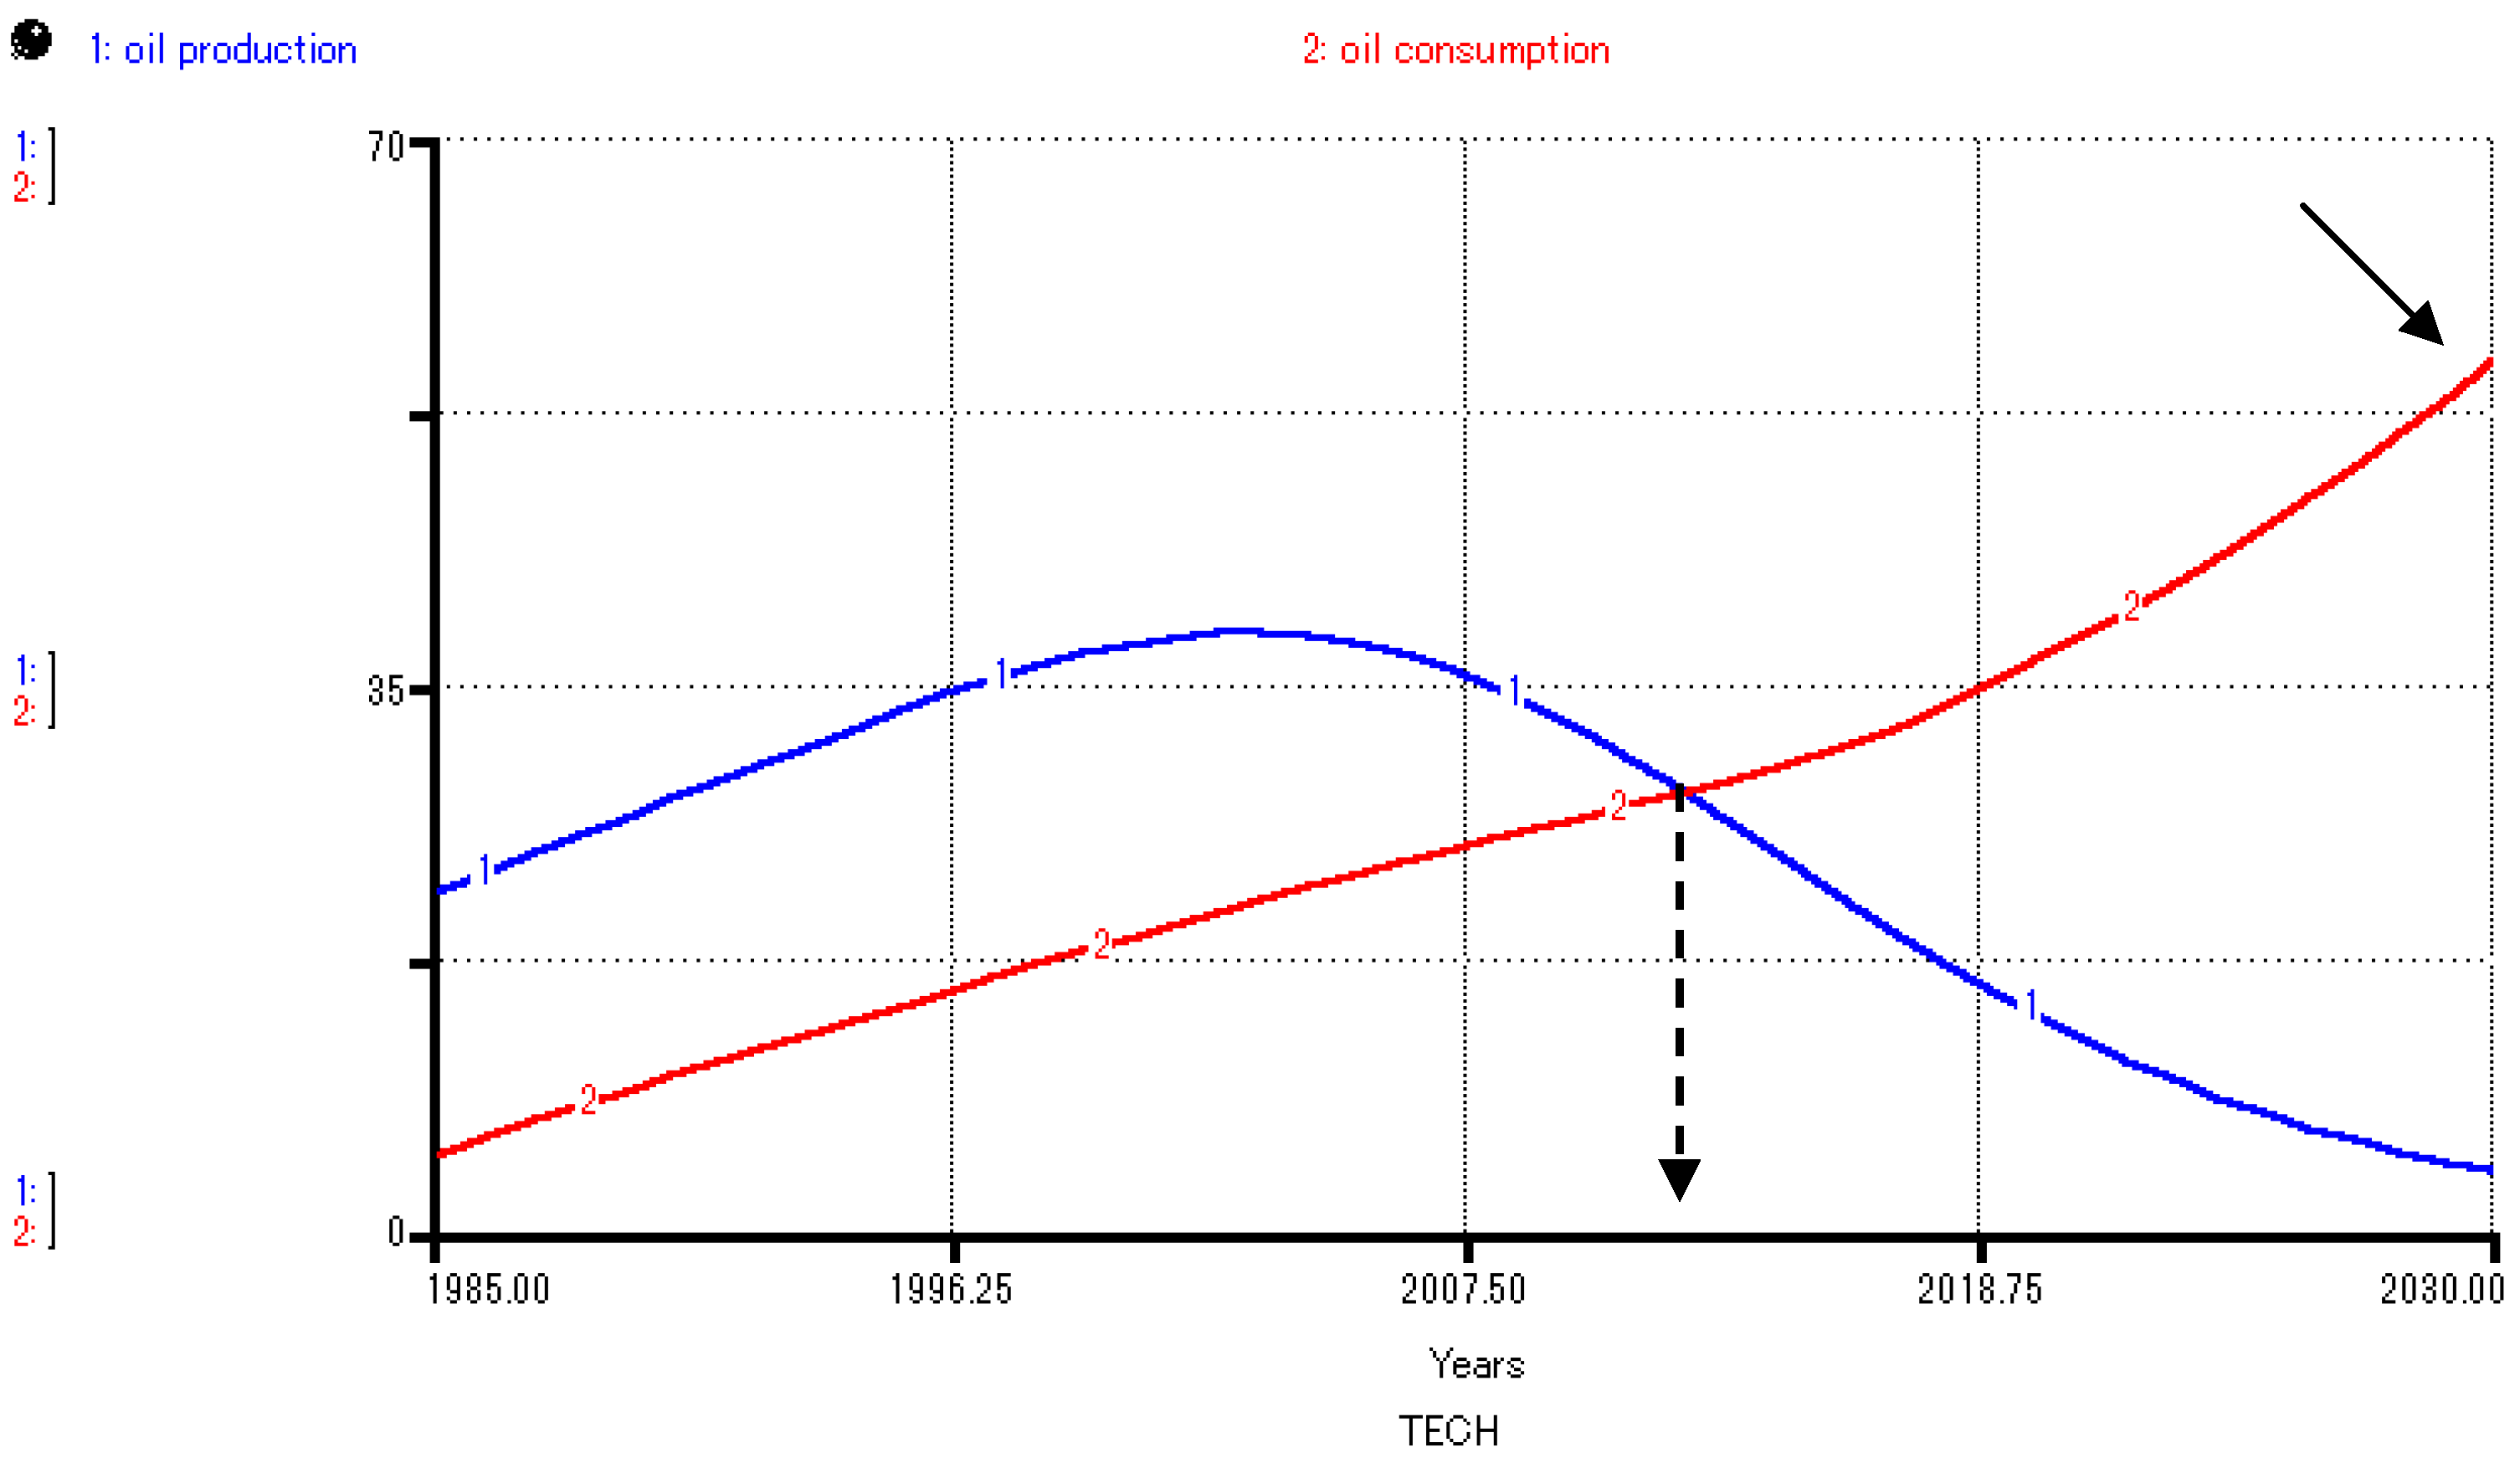
4.3.4. Technology Advance (TECH)

This scenario reflects a higher rate of successful adoption of new technologies that brings about higher oil consumption efficiency. Government incentives and financing schemes for green technologies [53] are assumed to be fruitful in increasing the market share of cars utilizing non-conventional fuels, such as biodiesel mixtures. In addition, efforts similar to the MIEEIP project, were assumed to continue and fulfilling its target. In this scenario Malaysia’s technology advance score is improving three times faster from 2010 until the end of the simulation.

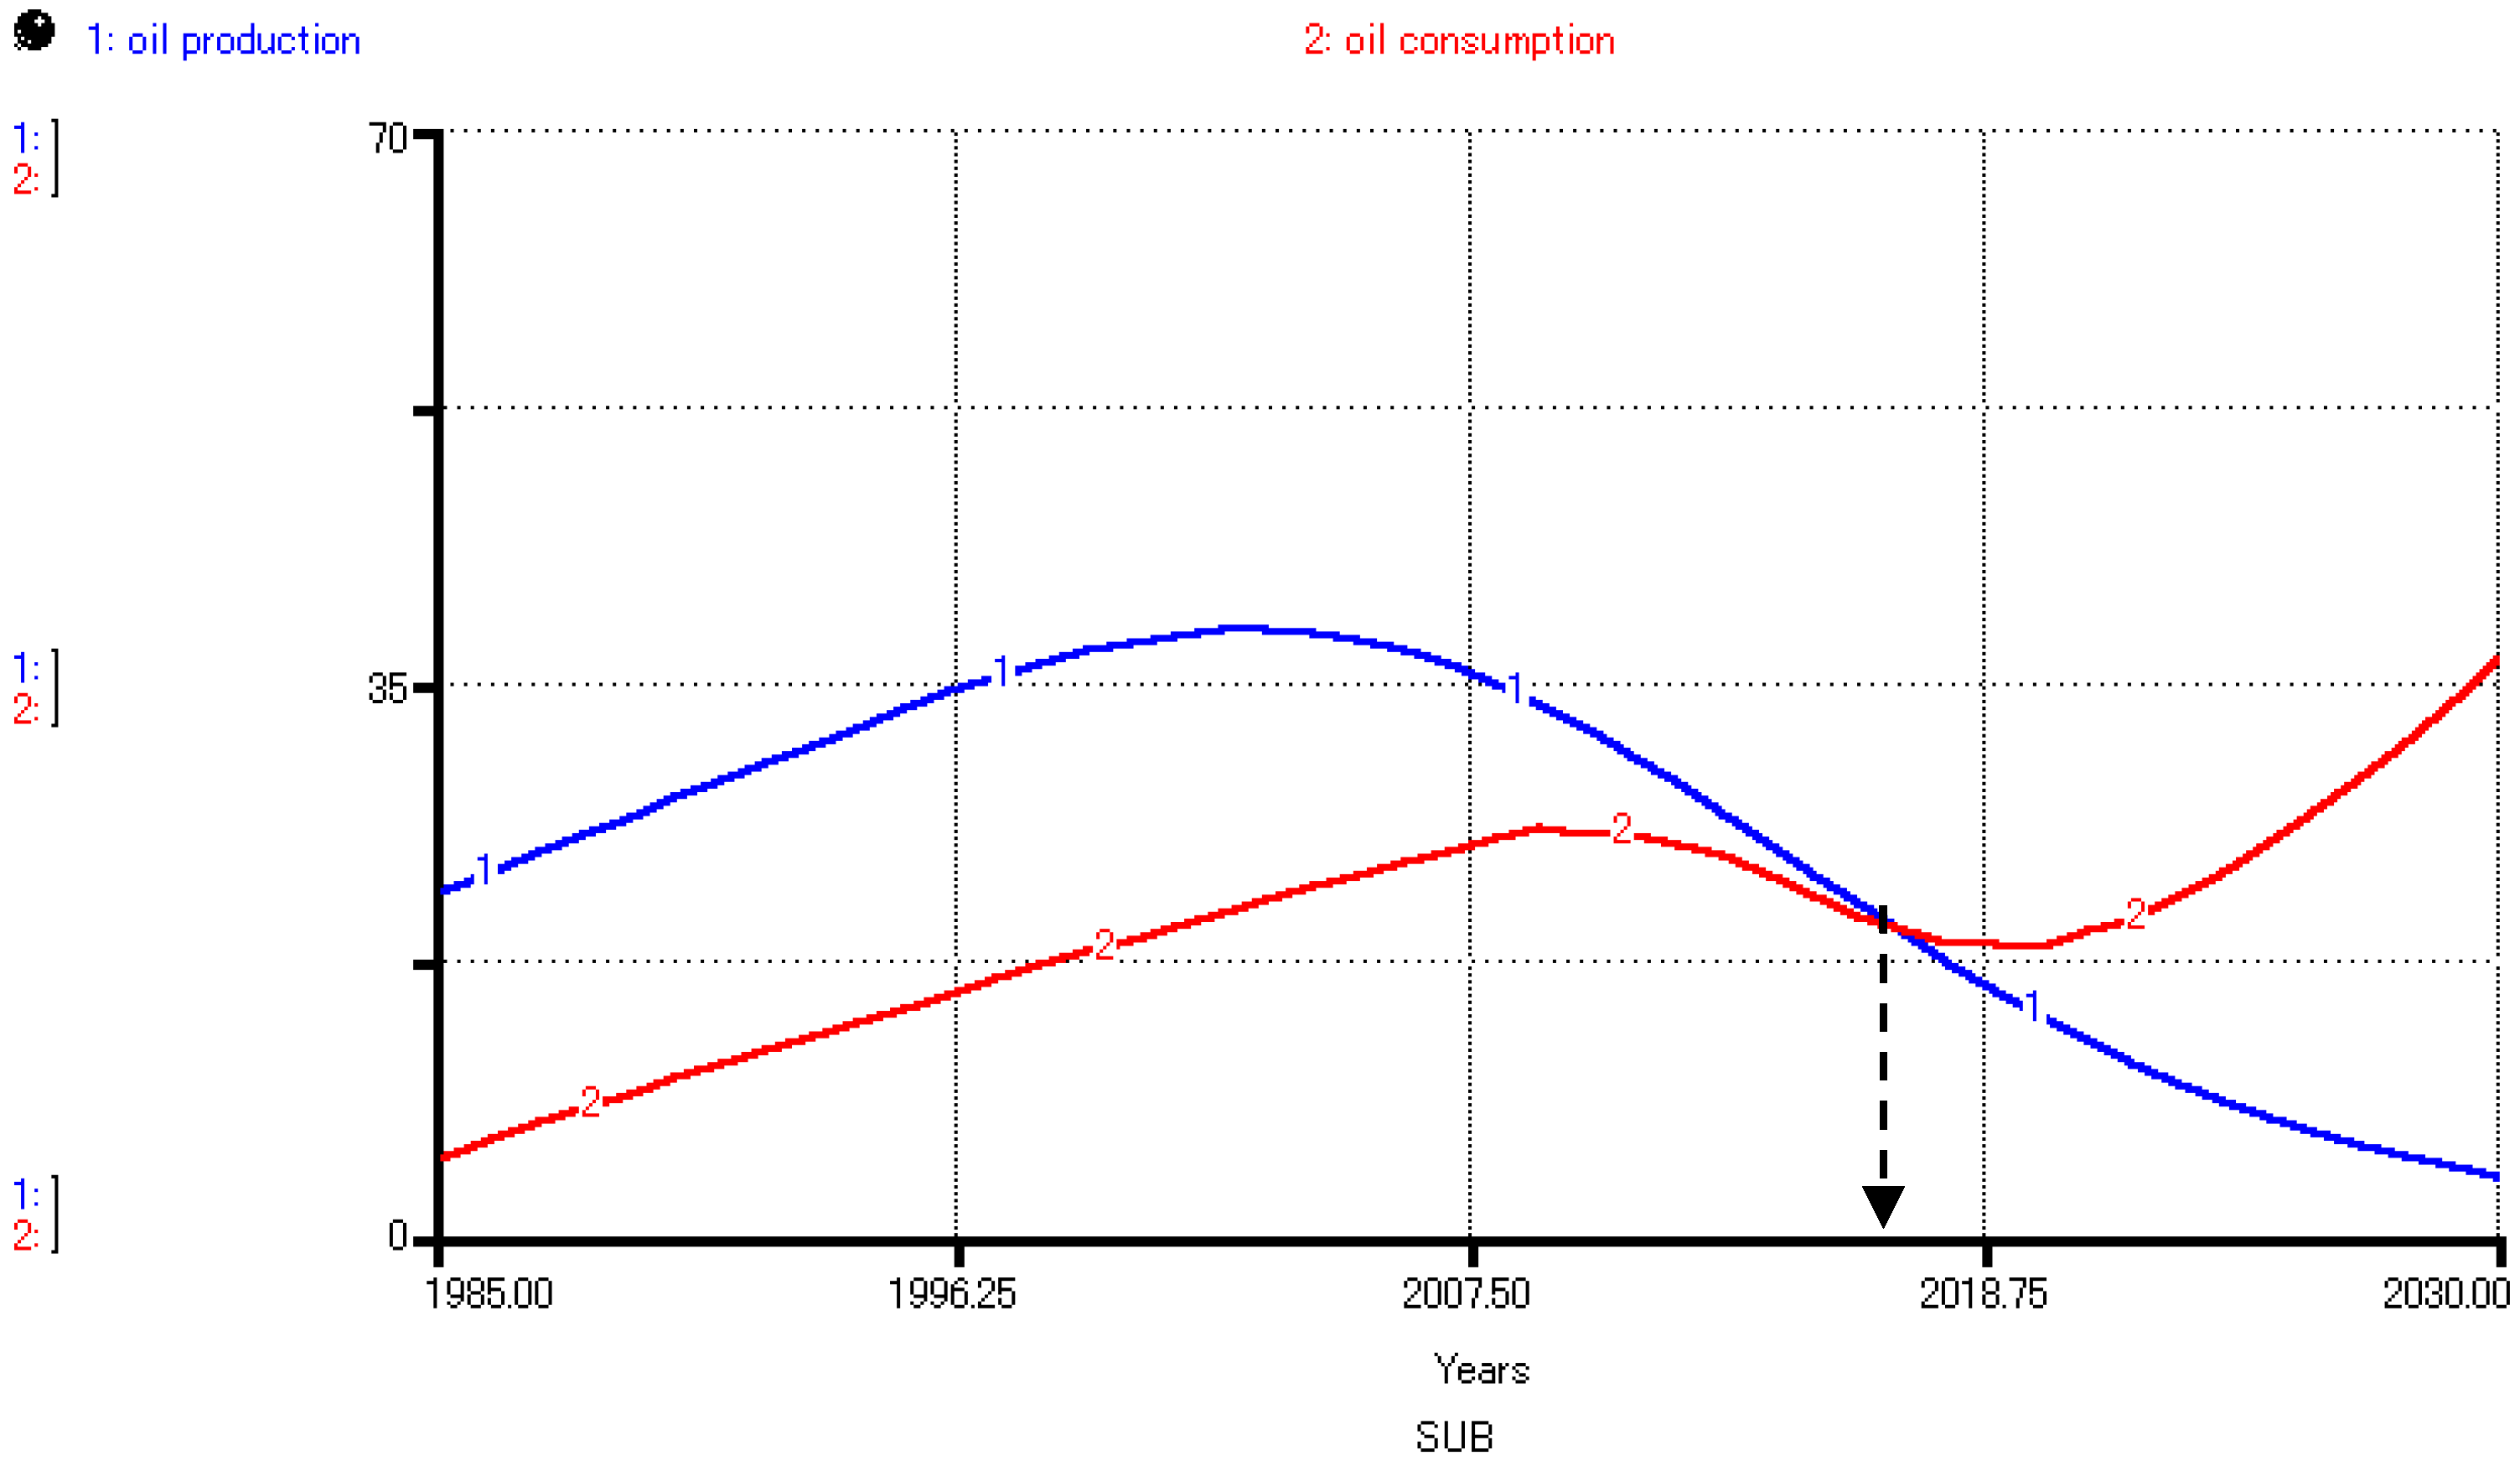
4.3.5. Subsidy (SUB)
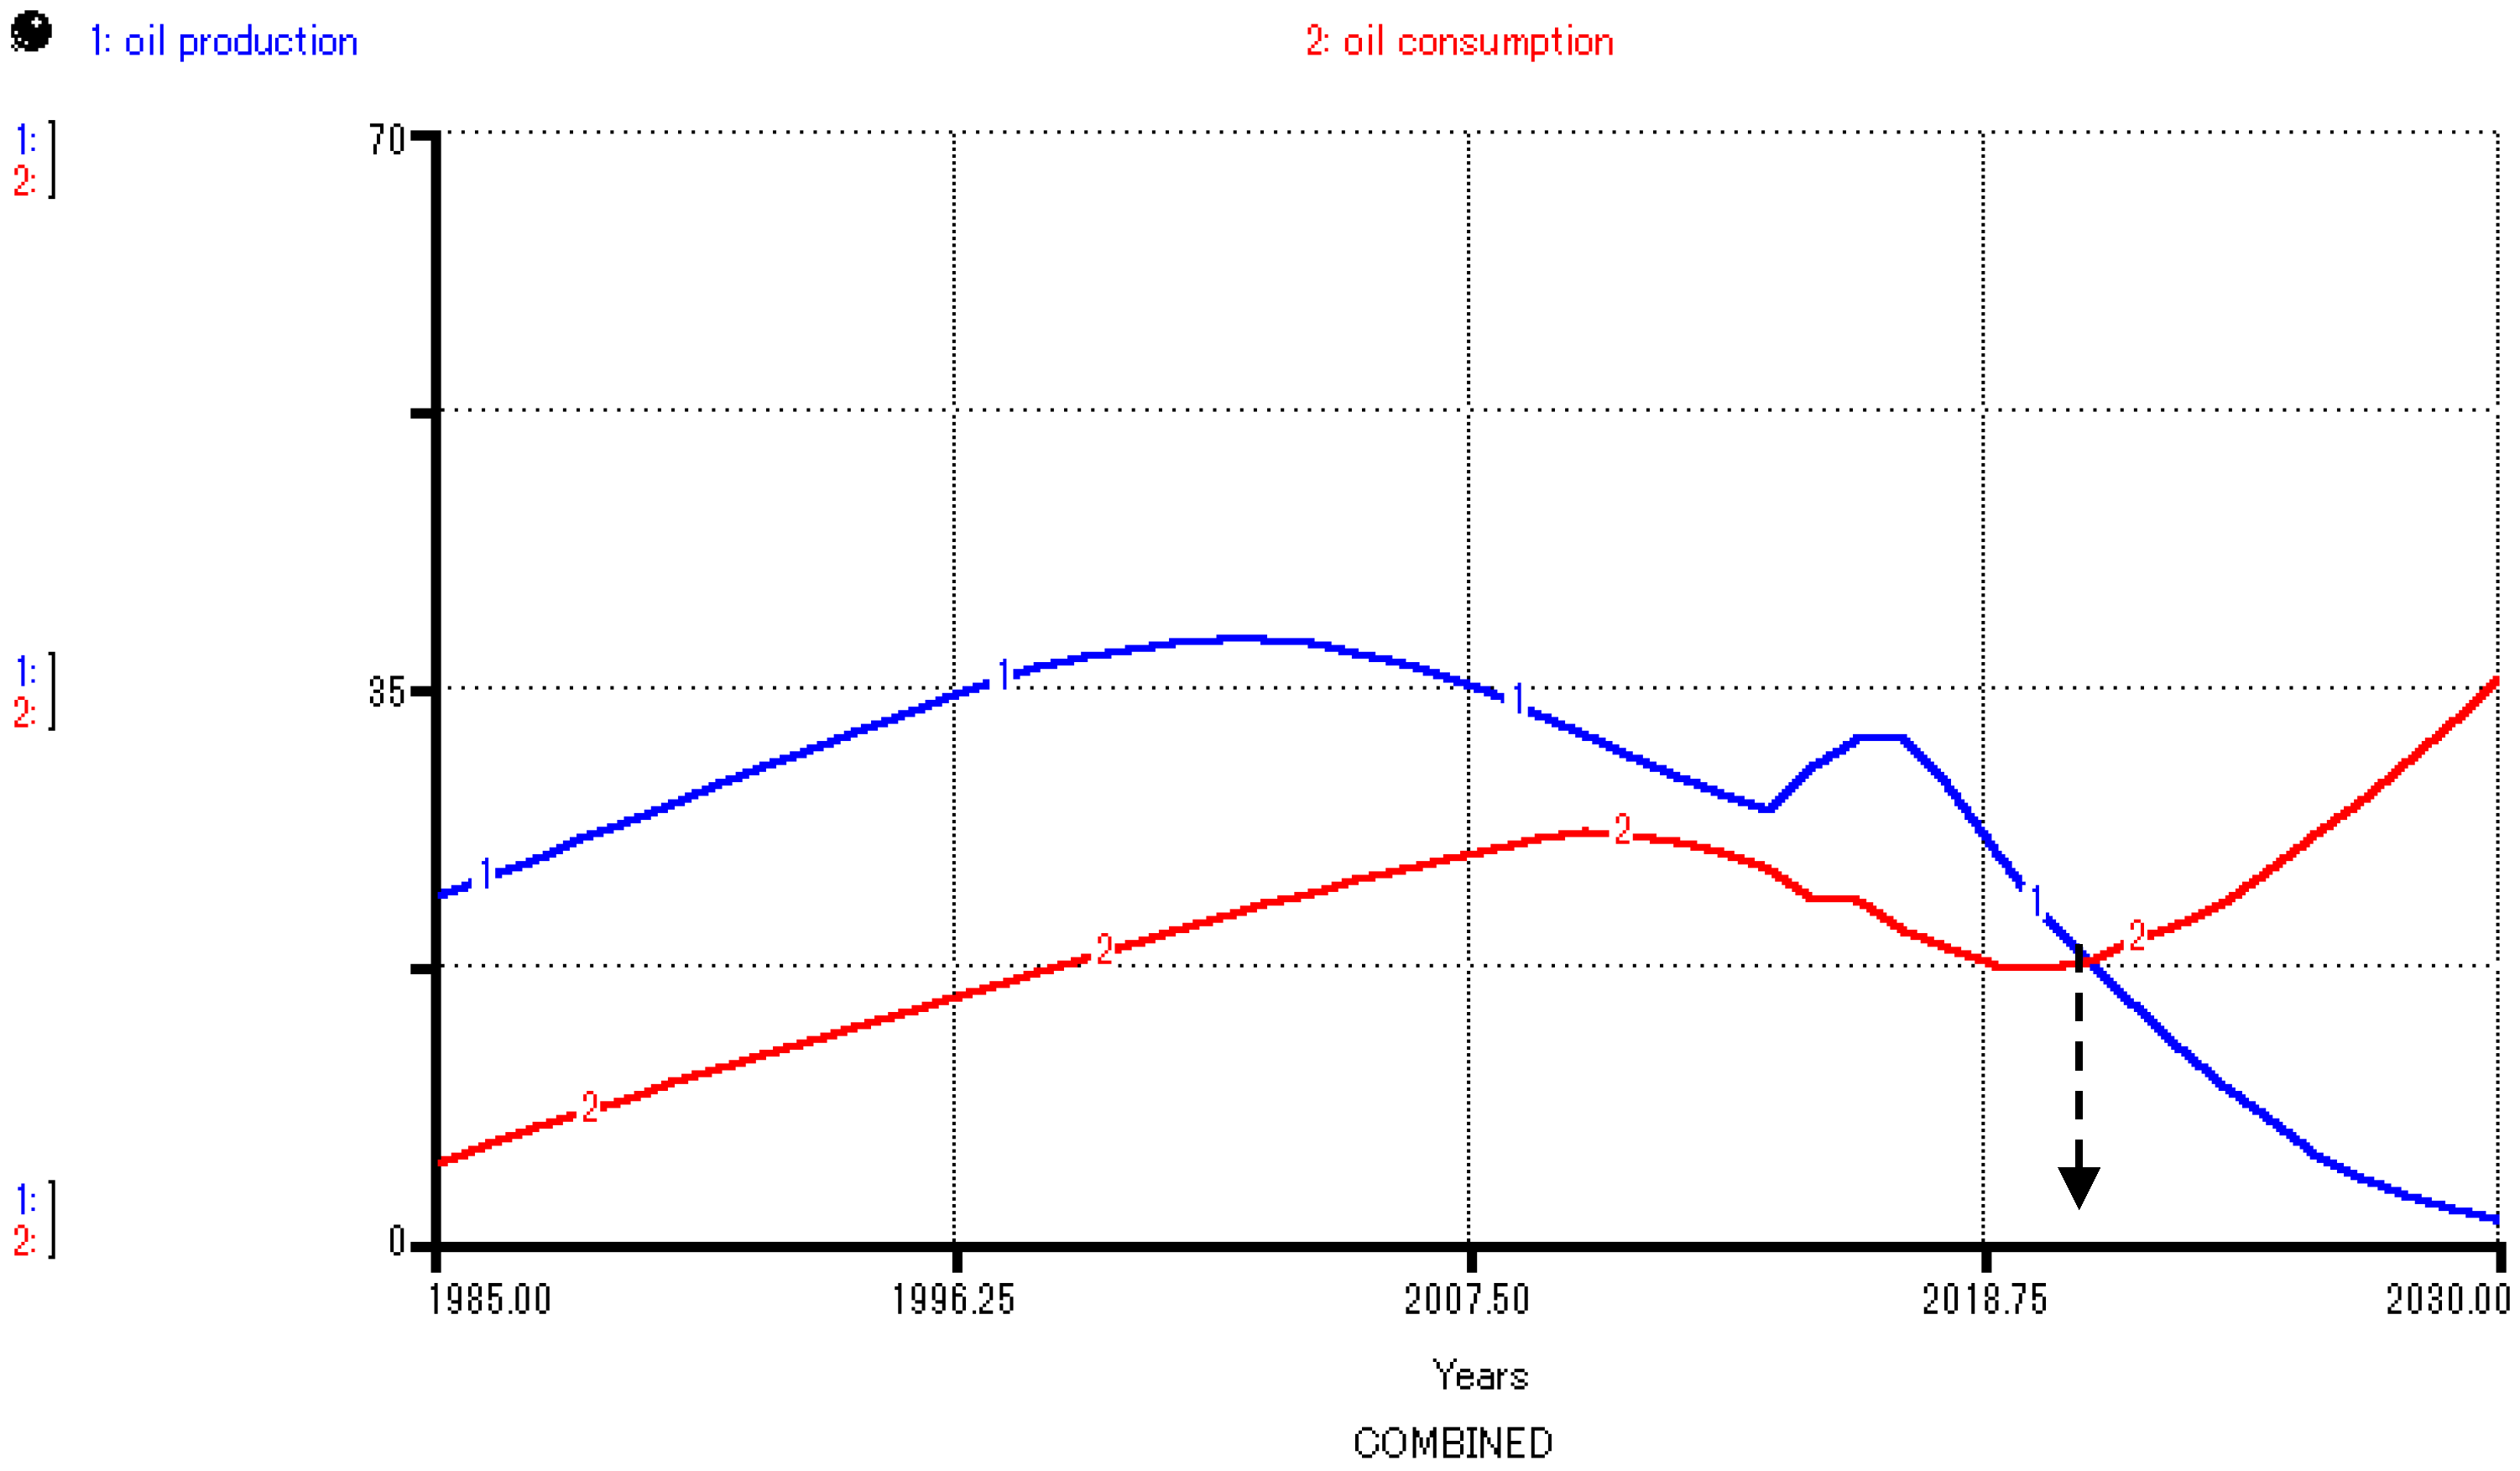
Government subsidies for oil products have been blamed as one of the barriers in reducing oil consumption in Malaysia [14]. In the wake of oil price shock in 2008, the Malaysian government considered rationalizing the subsidy. However, the rationalization has not been consistently carried out [54,55]. This scenario describes a situation where the subsidy is persistently reduced starting from 2010 until it is totally lifted in 2020.

4.3.6. Combined

In practice, policies are not implemented in isolation. They often coincide and interact with each other. Therefore, in this scenario, we combined all the parameter settings of the alternative scenarios.

5. Results and Discussion

5.1. Transformation to Net Oil Importer

The simulation results show only a few variations on Malaysia’s transformation to a net oil importer. In BAU scenario the transformation is due in 2012 (indicated by dashed arrow in Figure 16. Oil production in this scenario is decreasing to 4.2 Mtoe in 2030. On the other hand, consumption is soaring up to 57.9 Mtoe in 2030.
Figure 16. Oil production and consumption in the BAU scenario.
Energies 05 02989 g016
Surprisingly, the EOR scenario yields the same year as the BAU scenario. The contribution of EOR projects does not influence the transformation as its impact on oil production is rather late as shown in Figure 17. However, it is narrowing the net oil import gap during 2014 to its peak in 2016. It is also slightly influencing the consumption (indicated by arrow 1). This is due to an increase in oil exports which eventually adjusts the affluence level via GDP per capita. It can be observed from the result that the impact of EOR implementation on oil production is short-term. Also, it yields a steeper decline curve of oil production (indicated by arrow 2). The reason for these is because oil production is constrained by the amount of reserves, thus the surging production rate is pushing the reserve depletion to progress faster. In 2030, oil production is decreasing to 2.1 Mtoe or 50% lower than the reference scenario, while oil consumption is at the same level.
Figure 17. Oil production and consumption in the EOR scenario.
Energies 05 02989 g017
In the INV scenario, the transformation also occurs in 2012. The effort to increase the rate of discovery through higher investment does not significantly impact oil production. Nevertheless, it provides a slight moderation to the declining production curve starting from 2014 to 2020 (as indicated by solid arrows in Figure 18. At the end of simulation year, oil production is at the same level as the reference scenario.
Figure 18. Oil production and consumption in the INV scenario.
Energies 05 02989 g018
The higher rate of technology advance in the TECH scenario does not produce any significant change to oil consumption patterns. We suspect that this indicates a rebound-effect [56]. Nevertheless, it can be observed at the end on simulation (indicated by arrow in Figure 19) that oil consumption is 53.7 Mtoe or 7.3% lower than the reference scenario. This suggests that the impact of faster technology advances on oil consumption is long term. The transformation occurs in 2012 in this scenario too.
Figure 19. Oil production and consumption in the TECH scenario.
Energies 05 02989 g019
In contrast to previous scenarios, result from the SUB scenario present a significant deferal of the transformation, as presented in Figure 20. The increase of oil product price due to subsidy lifting amid the increasing trend of international oil price has an immediate discouraging effect on oil consumption, starting from 2010. However, it starts to climb again in 2019. This is because from 2019 onward GDP per capita growth drives the affluence level to reach a point where the price become less effective to suspend oil products purchases as they become more affordable. At the end of the SUB scenario simulation, oil consumption is at 36.3 Mtoe or 37.3% lower than the reference scenario. In this scenario the transformation occurred in 2017.
Figure 20. Oil production and consumption in SUB scenario.
Energies 05 02989 g020
From the above analysis, obviously the policy or strategy of eliminating subsidy prevails. However, the result of combined scenario shows even longer delay of the transformation, as presented Figure 21.
Figure 21. Oil production and consumption in combined scenario.
Energies 05 02989 g021
The effect of higher investment suspends EOR production peak and slides the declining slope further in time. However, the declining curve is steeper, thus at the end of simulation oil production is at 1.9 Mtoe or 55% lower than the reference scenario. On the consumption side, the suspended EOR production peak sustained the consumption briefly. The cause of this is the same as reasons explained in the EOR scenario However, the steeper declining production curve caused a faster correction on oil exports and eventually give a slight pressure on oil consumption in the course of its SUB scenario pattern. In 2030, consumption is at 35 Mtoe or 39.5% lower than reference scenario. In this scenario the transformation occurred in 2021.

5.2. Oil Import Dependence

In terms of oil import dependence, the results from all scenarios show increasing dependency. This is not unexpected as the patterns of oil production and consumption are declining and rising, respectively. Nevertheless, there are variations in the progression pattern of dependency which are driven by the different policies or strategies. This enables us to compare the tradeoffs between the strategies. Figure 22 presents Malaysia’s oil import dependence as oil import share in its total oil supply calculated from the simulation results.
Figure 22. Malaysia’s oil import share in its total oil supply.
Energies 05 02989 g022
Three scenarios have distinct dependency results: the EOR, combined and SUB scenarios. The EOR scenario produces a lower dependency than the BAU scenario starting from 2013 to 2019. However, it immediately becomes higher afterward and reaches up to 97% at the end of simulation. This is due to higher depletion rate of oil reserves which makes production decline faster. EOR projects provide short term solutions for dependency improvement but a higher risk is expected in the long run.
The lowest dependency growth can be observed in the combined scenario result. In this scenario dependence is maintained below 55% from 2009 until 2018 and the result is still the lowest among scenarios until 2026. However, it is also produces the fastest dependency growth from 59% in 2022 to 97% at the end of simulation. It becomes higher than the BAU scenario in 2027. This is due to the collective effect of a steeper production decline derived from the EOR scenario and the swing in oil products affordability due to increase in affluence level from the SUB scenario. In the beginning, the combination of strategies in this scenario provides ample gains in curbing dependency over the BAU scenario but in the end it arrives at the same situation as the EOR scenario.
Interestingly, the SUB scenario is the only scenario where dependency is almost entirely maintained below the reference. This is because oil production does not suffer a rapid production increase as in EOR and the combined scenarios. Therefore, production is maintained at the same rate while consumption is progressing at a slower rate. In 2030, this scenario resulted in 91% dependency.
The effort to increase discoveries of oil reservoir by higher investment provides a slightly lower dependency than BAU until 2025, and a slightly higher dependency of 1% in 2030. Faster technology advance in TECH scenario has the least impact on oil import dependency. The pattern of dependency in this scenario is just about the same pattern as in the BAU one.

5.3. Discussion

Based on the simulation results, Malaysia is expected to become a net oil-importing country in 2012 at the earliest, and by 2021 at the latest. The main reason for such an imminent transformation year is the inconsistent implementation of subsidy elimination which obstructs other efforts to decrease oil consumption. At the same time, oil production rates are declining very fast after they peaked in 2004. On the contrary, the transformation could be delayed if Malaysia takes the options to rigorously eliminate subsidies and put more investment into enhancing production. The combined effect of these options on the transformation year are significant mainly because of the timely deviation of the oil consumption trajectory. If subsidy elimination is delayed the effect will likely to be lessened. Table 5 presents predictions on the transformation years by others and this study. The results of our study clearly provide a new range of predicted year of transformation.
Table 5. Predictions of Malaysia becoming oil net-importer country.
Predicted Transformation Year
NEAC (2005)2009
CPPS (2008)2012
Gan and Li (2008)2013
Bernama (2010)2011
This study2012, 2017, 2021
The most effective strategy to delay the transformation is through pricing mechanisms. Eliminating subsidies can prolong the transformation due to its effect of increasing oil product prices. Furthermore, sustaining the high price of oil products, despite the volatility of international oil price, will be beneficial in maintaining a low level of oil consumption growth. In this regard, Malaysian government may learn from Indonesia’s experience. Following its transition to net oil importer, the petroleum subsidy in Indonesia was planned to be gradually lifted from 2005 until total subsidy elimination in 2007 [57]. However, the plan is being constantly delayed. Malaysia may learn some challenges that Indonesia faced that make the plan very difficult to realize [58].
In terms of energy security, the simulation results suggest that Malaysia’s oil import dependence will continue to increase over the years. In general, the growth of oil import dependence is accelerating after the transition mainly due to steep declining slope of production. However, over time, it will be stabilized and become slower as the declining production slope becomes less steep. Malaysia’s oil import dependence will rise to 97% at the highest and 91% at the lowest. This seems inevitable considering the depleting oil resources and the fact that Malaysia’s transportation and industrial sectors are still heavily dependent on oil products. This would only mean that it will require large efforts for the country to reduce its oil import dependence. Nevertheless, the simulation demonstrates that Malaysia has some options that could delay oil import dependency and provide more time for its economy and energy systems toward anticipating the risks of being a net oil importer. However, it should be recognized that short term solution, such as EOR projects, may actually have an adverse effect in the long term and interfere with the efficacy of other strategies in reducing oil import dependency.
Malaysia may observe some other options to reduce risks from higher oil import dependence from other countries which have experienced the transformation. For example, the United Kingdom encourages more players to enter its energy market which increases the competition between suppliers and hence increases the security of supply [59]. On the other hand, China highly promotes acquisition of foreign oil resources by supporting exploration and production investment in other countries, such as in Africa. In addition, China imports oil from neighbouring countries so that oil can be transported by land (pipelines) [60]. Domestic Market Obligation (DMO) for coal and gas is now in effect in Indonesia [61,62]. This measure is intended to accelerate the shift of domestic energy market from oil domination.
To a certain extent, our study provides an integrated framework to study Malaysia’s transformation to a net oil importer and its subsequent energy security status in term of oil import dependency. However, to investigate the topic comprehensively, other aspects need to be integrated into the framework. For instance, our simulation does not consider the influence of petrol price over GDP through inflation which may affect the affluence level and eventually adjust oil consumption. Subjects such as the unexpected effect of efficiency improvements, or the rebound-effect, are particularly motivating. Efficiency improvement in this subject may be translated as lower price per energy unit, thus may reduce the desired effect of subsidy elimination. In relation to energy security evaluation, this study only presents one indicator related to availability dimension of energy security among many others dimensions [63,64]. One might consider that the transformation may affect other dimensions and therefore required to be incorporated in the model. Therefore, the study may be extended toward these directions.

6. Conclusions

In conclusion, exploration of the possible years of Malaysia’s transformation into a net oil importer and the extent to which it will be dependent on oil import is presented. The exploration is conducted by developing an integrated dynamic simulation. The simulation results suggest that Malaysia’s transformation is imminent. However, it has options which may delay the transformation and concurrently improve energy security by slowing down the expected increase of oil import dependence.

Abbreviations

API
American Petroleum Institute
BAU
Business as usual (scenario)
bbl/d
barrel per day
EOR
Enhance Oil Recovery
EOR *
Enhance oil recovery implementation (* scenario)
INV
High Investment (scenario)
ITA
Industrial-cum-Technology Advance
L
Litre
MMBOE
Million barrels of oil equivalent
MMSTB
Million stock tank barrels
Mtoe
Million ton of oil equivalent
RM
Ringgit Malaysia
SUB
Subsidy elimination (scenario)
TECH
Fast New Technology adoption (scenario)

Acknowledgement

This publication is supported in part by Keio University Global-COE Program: Symbiotic, Safe and Secure System Design program. For this, we acknowledge and grateful for its supports. We also would like to convey our gratitude to anonymous reviewers for their valuable comments.

References

  1. The Institute of Energy Economics. IEEJ. APEC Energy Database. Available online: http://www.ieej.or.jp/egeda/index.html (accessed on 27 January 2011).
  2. United Nations Statistics Division. National Accounts Statistics: Main Aggregates and Detailed Tables. 2011. Available online: http://unstats.un.org (accessed on 27 January 2011).
  3. EIA. International Petroleum (Oil) Prices; U.S. Energy Information Administration. 2011. Available online: http://www.eia.gov/emeu/international/oilprice.html (accessed on 5 January 2011). [Google Scholar]
  4. National Economic Action Council. Oil Prices and Subsidies (An Explanation); National Economic Action Council: Kualalumpur, Malaysia, 2005. [Google Scholar]
  5. Ministry of Energy, Water and Communication Malaysia. Integrated Energy Analysis for Malaysia Using the ENPEP Model—Final Report; MEWC: Kualalumpur, Malaysia, 1991. [Google Scholar]
  6. Agence de I’Environment et de la Maitrise de I’Energie. Study on Energy Policy Analysis and Planning to the Year 2020—Energy Demand for Malaysia to 2020; Agence de I’Environment et de la Maitrise de I’Energie: Kualalumpur, Malaysia, 1996. [Google Scholar]
  7. Malaysia Energy Center. Long-term National Strategy for the Malaysian Energy Sector—Synthesis Report; MEC: Selangor, Malaysia, 2000. [Google Scholar]
  8. Gan, P.Y.; Li, Z.D. An econometric study on long-term energy outlook and the implications of renewable energy utilization in Malaysia. Energy Policy 2008, 36, 890–899. [Google Scholar] [CrossRef]
  9. Centre for Public Policy Studies. Policy Fact Sheet: Oil and Gas. 2008. Available online: http://www.cpps.org.my (accessed on 1 February 2012).
  10. Bernama Malaysian News Agency. Malaysia Likely to be Net Oil Importer by 2011. Available online: http://www.bernama.com (accessed on 12 January 2012).
  11. International Energy Agency. World Energy Outlook 2011; IEA: Paris, France, 2011. [Google Scholar]
  12. Asia Pacific Energy Research Centre. APEC Energy Overview 2010; APEC: Tokyo, Japan, 2011. [Google Scholar]
  13. Ong, H.C.; Mahlia, T.M.I.; Masjuki, H.H. A review on energy pattern and policy for transportation sector in Malaysia. Renew. Sustain. Energy Rev. 2012, 16, 532–542. [Google Scholar] [CrossRef]
  14. Institute of Energy Economics Japan. Peer Review on Energy Efficiency in Malaysia; APEC: Tokyo, Japan, 2011. [Google Scholar]
  15. Jayed, M.H.; Masjuki, H.H.; Kalam, M.A.; Mahlia, T.M.I.; Husnawan, M.; Liaquat, A.M. Prospects of dedicated biodiesel engine vehicles in Malaysia and Indonesia. Renew. Sustain. Energy Rev. 2011, 15, 220–235. [Google Scholar] [CrossRef]
  16. Malaysiakini. RON97 price hits record high at RM2.90 per litre. Available online: http://www.malaysiakini.com/news/163256 (accessed on 23 February 2012).
  17. Ministry of Energy, Green Technology and Water. Malaysian Energy Efficiency Improvement Programme (MIEEIP). Available online: http://www.kettha.gov.my (accessed on 23 February 2012).
  18. Energy Information Administration. International Energy Statistics. Available online: http://www.eia.gov/countries/data.cfm (accessed on 15 June 2012).
  19. Ong, H.C.; Mahlia, T.M.I.; Masjuki, H.H. A review on energy scenario and sustainable energy in Malaysia. Renew. Sustain. Energy Rev. 2011, 15, 639–647. [Google Scholar] [CrossRef]
  20. Petronas. 2010 Annual Report; Petroleam Nasional Berhad: Kualalumpur, Malaysia, 2010. [Google Scholar]
  21. Petronas. Media Release—2011: Petronas Carigali Finds Oil off Sabah. Available online: http://www.petronas.com.my/media-relations/media-releases/Pages/article/PETRONAS-CARIGALI-FINDS-OIL-OFF-SABAH.aspx (accessed on 23 February 2012).
  22. Petronas. Media Release—2011: Petronas Carigali Finds New Oil and Gas Fields off Sarawak. Available online: http://www.petronas.com.my/media-relations/media-releases/Pages/article/PETRONAS-FINDS-NEW-OIL-AND-GAS-FIELDS-OFFSHORE-SARAWAK.aspx (accessed on 23 February 2012).
  23. Hamdan, M.K.; Darman, N.; Hussain, D.; Ibrahim, Z. Enhanced Oil Recovery in Malaysia: Making It a Reality. In Proceedings of SPE Asia Pacific Oil & Gas Conference and Exhibition, Jakarta, Indonesia, 5–7 April 2005; Society of Petroleum Engineers: Jakarta, Indonesia, 2005. [Google Scholar]
  24. Samsudin, Y.; Darman, N.; Husain, D.; Hamdan, M.K. Enhanced Oil Recovery in Malaysia: Making It a Reality (Part II). In Proceedings of SPE International Improved Oil Recovery Conference in Asia Pacific, Kuala Lumpur, Malaysia, 5–6 December 2005; Society of Petroleum Engineers: Kuala Lumpur, Malaysia, 2005. [Google Scholar]
  25. Petronas. 2011 Annual Report; Petroleam Nasional Berhad: Kualalumpur, Malaysia, 2011. [Google Scholar]
  26. Sterman, J.D. Business Dynamics: Systems Thinking and Modeling for a Complex World; McGraw Hill: Boston, MA, USA, 2000. [Google Scholar]
  27. Sovacool, B.K.; Mukherjee, I.; Drupady, I.M.; D’Agostino, A.L. Evaluating energy security performance from 1990 to 2010 for eighteen countries. Energy 2001, 36, 5846–5853. [Google Scholar] [CrossRef]
  28. Bassi, A.M. Evaluating the use of an integrated approach to support energy and climate policy formulation and evaluation. Energies 2010, 3, 1604–1621. [Google Scholar] [CrossRef]
  29. Kiani, B.; Mirzamohammadi, S.; Hosseini, S.H. A Survey on the role of system dynamics methodology on fossil fuel resources analysis. Int. Bus. Res. 2010, 3. [Google Scholar]
  30. Brandt, A.R.; Plevin, R.J.; Farrell, A.E. Dynamics of the oil transition: Modeling capacity, depletion, and emissions. Energy 2010, 35, 2852–2860. [Google Scholar] [CrossRef]
  31. Kiani, B.; Pourfakhraei, M.A. A system dynamic model for production and consumption policy in Iran oiland gas sector. Energy Policy 2010, 38, 7764–7774. [Google Scholar] [CrossRef]
  32. Tang, X.; Zang, B.; Höök, M.; Feng, L. Forecast of oil reserves and production in Daqing oilfield of China. Energy 2010, 35, 3097–3102. [Google Scholar] [CrossRef]
  33. Albin, S. Building A System Dynamics Model Part 1: Conceptualization; Massachusetts Institute of Technology: Cambridge, MA, USA, 2001. [Google Scholar]
  34. Hubbert, M.K. Nuclear energy and the fossil fuels. In Drilling and Production Practice, 1st ed.; The American Petroleum Institute: New York, NY, USA, 1956; pp. 7–25. [Google Scholar]
  35. Hubbert, M.K. Techniques of Prediction as Applied to Production of Oil and Gas (NBS Special Publication); US Department of Commerce: Gaithersburg, MD, USA, 1982; pp. 1–121. [Google Scholar]
  36. Laherrere, J.H. The Hubbert Curve: Its Strength and Weaknesses. 2000. Available online: http://dieoff.org/page191.htm (accessed on 15 June 2012).
  37. New Strait Times. Petronas denies discovery of huge oil field off Malaysia, Year. Available online: http://business.asiaone.com/Business/News/Story/A1Story20100325–206612.html (accessed on 15 June 2012).
  38. Bundesanstalt für Geowissenschaften und Rohstoffe. Annual Report: Reserves, Resources and Availability of Energy Resources; BGR: Hannover, Germany, 2005. [Google Scholar]
  39. Bundesanstalt für Geowissenschaften und Rohstoffe. Annual Report: Reserves, Resources and Availability of Energy Resources; BGR: Hannover, Germany, 2006. [Google Scholar]
  40. Bundesanstalt für Geowissenschaften und Rohstoffe. Annual Report: Reserves, Resources and Availability of Energy Resources; BGR: Hannover, Germany, 2007. [Google Scholar]
  41. Bundesanstalt für Geowissenschaften und Rohstoffe. Annual Report: Reserves, Resources and Availability of Energy Resources; BGR: Hannover, Germany, 2008. [Google Scholar]
  42. Bundesanstalt für Geowissenschaften und Rohstoffe. Annual Report: Reserves, Resources and Availability of Energy Resources; BGR: Hannover, Germany, 2009. [Google Scholar]
  43. Bundesanstalt für Geowissenschaften und Rohstoffe. Annual Report: Reserves, Resources and Availability of Energy Resources; BGR: Hannover, Germany, 2011. [Google Scholar]
  44. Petronas. 2005 Annual Report; Petroleam Nasional Berhad: Kualalumpur, Malaysia, 2005. [Google Scholar]
  45. Petronas. 2006 Annual Report; Petroleam Nasional Berhad: Kualalumpur, Malaysia, 2006. [Google Scholar]
  46. Petronas. 2007 Annual Report; Petroleam Nasional Berhad: Kualalumpur, Malaysia, 2007. [Google Scholar]
  47. Petronas. 2008 Annual Report; Petroleam Nasional Berhad: Kualalumpur, Malaysia, 2008. [Google Scholar]
  48. Petronas. 2009 Annual Report; Petroleam Nasional Berhad: Kualalumpur, Malaysia, 2009. [Google Scholar]
  49. British Petroleum. Statistical Review of World Energy; BP: London, UK, 2011. [Google Scholar]
  50. United Nations Industrial Development Organization. Capability Building for Catching-Up: Historical, Empirical and Policy Dimensions; UNIDO: Vienna, Austria, 2005. [Google Scholar]
  51. United Nations Statistics Division. Global Indicator Database. 2011. Available online: http://data.un.org/Data.aspx (accessed on 11 December 2011).
  52. Bernama Malaysian News Agency. Government announces subsidy reductions for fuel, sugar. 2010. Available online: http://www.bernama.com.my/bernama/v6/newsindex.php?id=547623 (accessed on 12 January 2012).
  53. Ministry of Energy, Green Technology and Water. The Green Technology Financing Scheme Guidelines. 2010. Available online: http://www.gtfs.my/page/gtfs-guideline (accessed on 12 January 2012).
  54. Bernama Malaysian News Agency. Kerajaan Tidak Hasrat Naik Harga Petrol RON95-Ismail Sabri. 2012. Available online: http://bernama.com.my/bernama/v6/bm/newsindex.php?id=659188 (accessed on 17 April 2012).
  55. Thestar. RON 95 price stays despite dearer fuel, says Ismail. 2012. Available online: http://thestar.com.my/news/story.asp?file=/2012/4/16/nation/11112904&sec=nation (accessed on 17 April 2012).
  56. Roy, J. The rebound effect: Some empirical evidence from India. Energy Policy 2000, 28, 433–438. [Google Scholar] [CrossRef]
  57. Syarifuddin, F. Oil Dependency and Energy Policy in Indonesia. 2007. Available online: http://www.bi.go.id/web/en/Publikasi/Kertas+Kerja+dan+Materi+Seminar/Kertas+Kerja/default.htm?Page=3&Year=0 (accessed on 17 June 2012).
  58. Beaton, C.; Lontoh, L. Lessons learned from Indonesia’s attempts to reform fossil-fuel subsidies. Available online: http://www.iisd.org/publications/pub.aspx?id=1355 (accessed on 19 June 2012).
  59. Abdo, H. UK energy security: Challenges, threats and solutions. Energy Sci. Technol. 2011, 1, 38–53. [Google Scholar]
  60. Leung, G.C.K.; Li, R.; Low, M. Transitions in China’s oil economy, 1990–2010. Eurasian Geogr. Econ. 2011, 52(4), 483–500. [Google Scholar]
  61. Ministry of Energy and Mineral Resources. Peraturan Menteri Energi dan Sumber daya Mineral Nomor: 03 TAHUN 2010. Tentang Alokasi dan Pemanfaatan Gas Bumi, Untuk Pemenuhan Kebutuhan dalam Negeri [In Indonesian]; MEMR: Jakarta, Indonesia, 2010. [Google Scholar]
  62. Ministry of Energy and Mineral Resources. Persentase Minimal Penjualan Batubara Dalam Negeri. Available online: www.esdm.go.id (accessed on 6 March 2011).
  63. Chester, L. Conceptualising energy security and making explicit its polysemic nature. Energy Policy 2010, 38, 887–895. [Google Scholar] [CrossRef]
  64. Vivoda, V. Evaluating energy security in the Asia-Pacific region: A novel methodological approach. Energy Policy 2010, 38, 5258–5263. [Google Scholar] [CrossRef]

