Dissemination of Solar Water Heaters in Taiwan: The Case of Remote Islands


Abstract
:1. Introduction
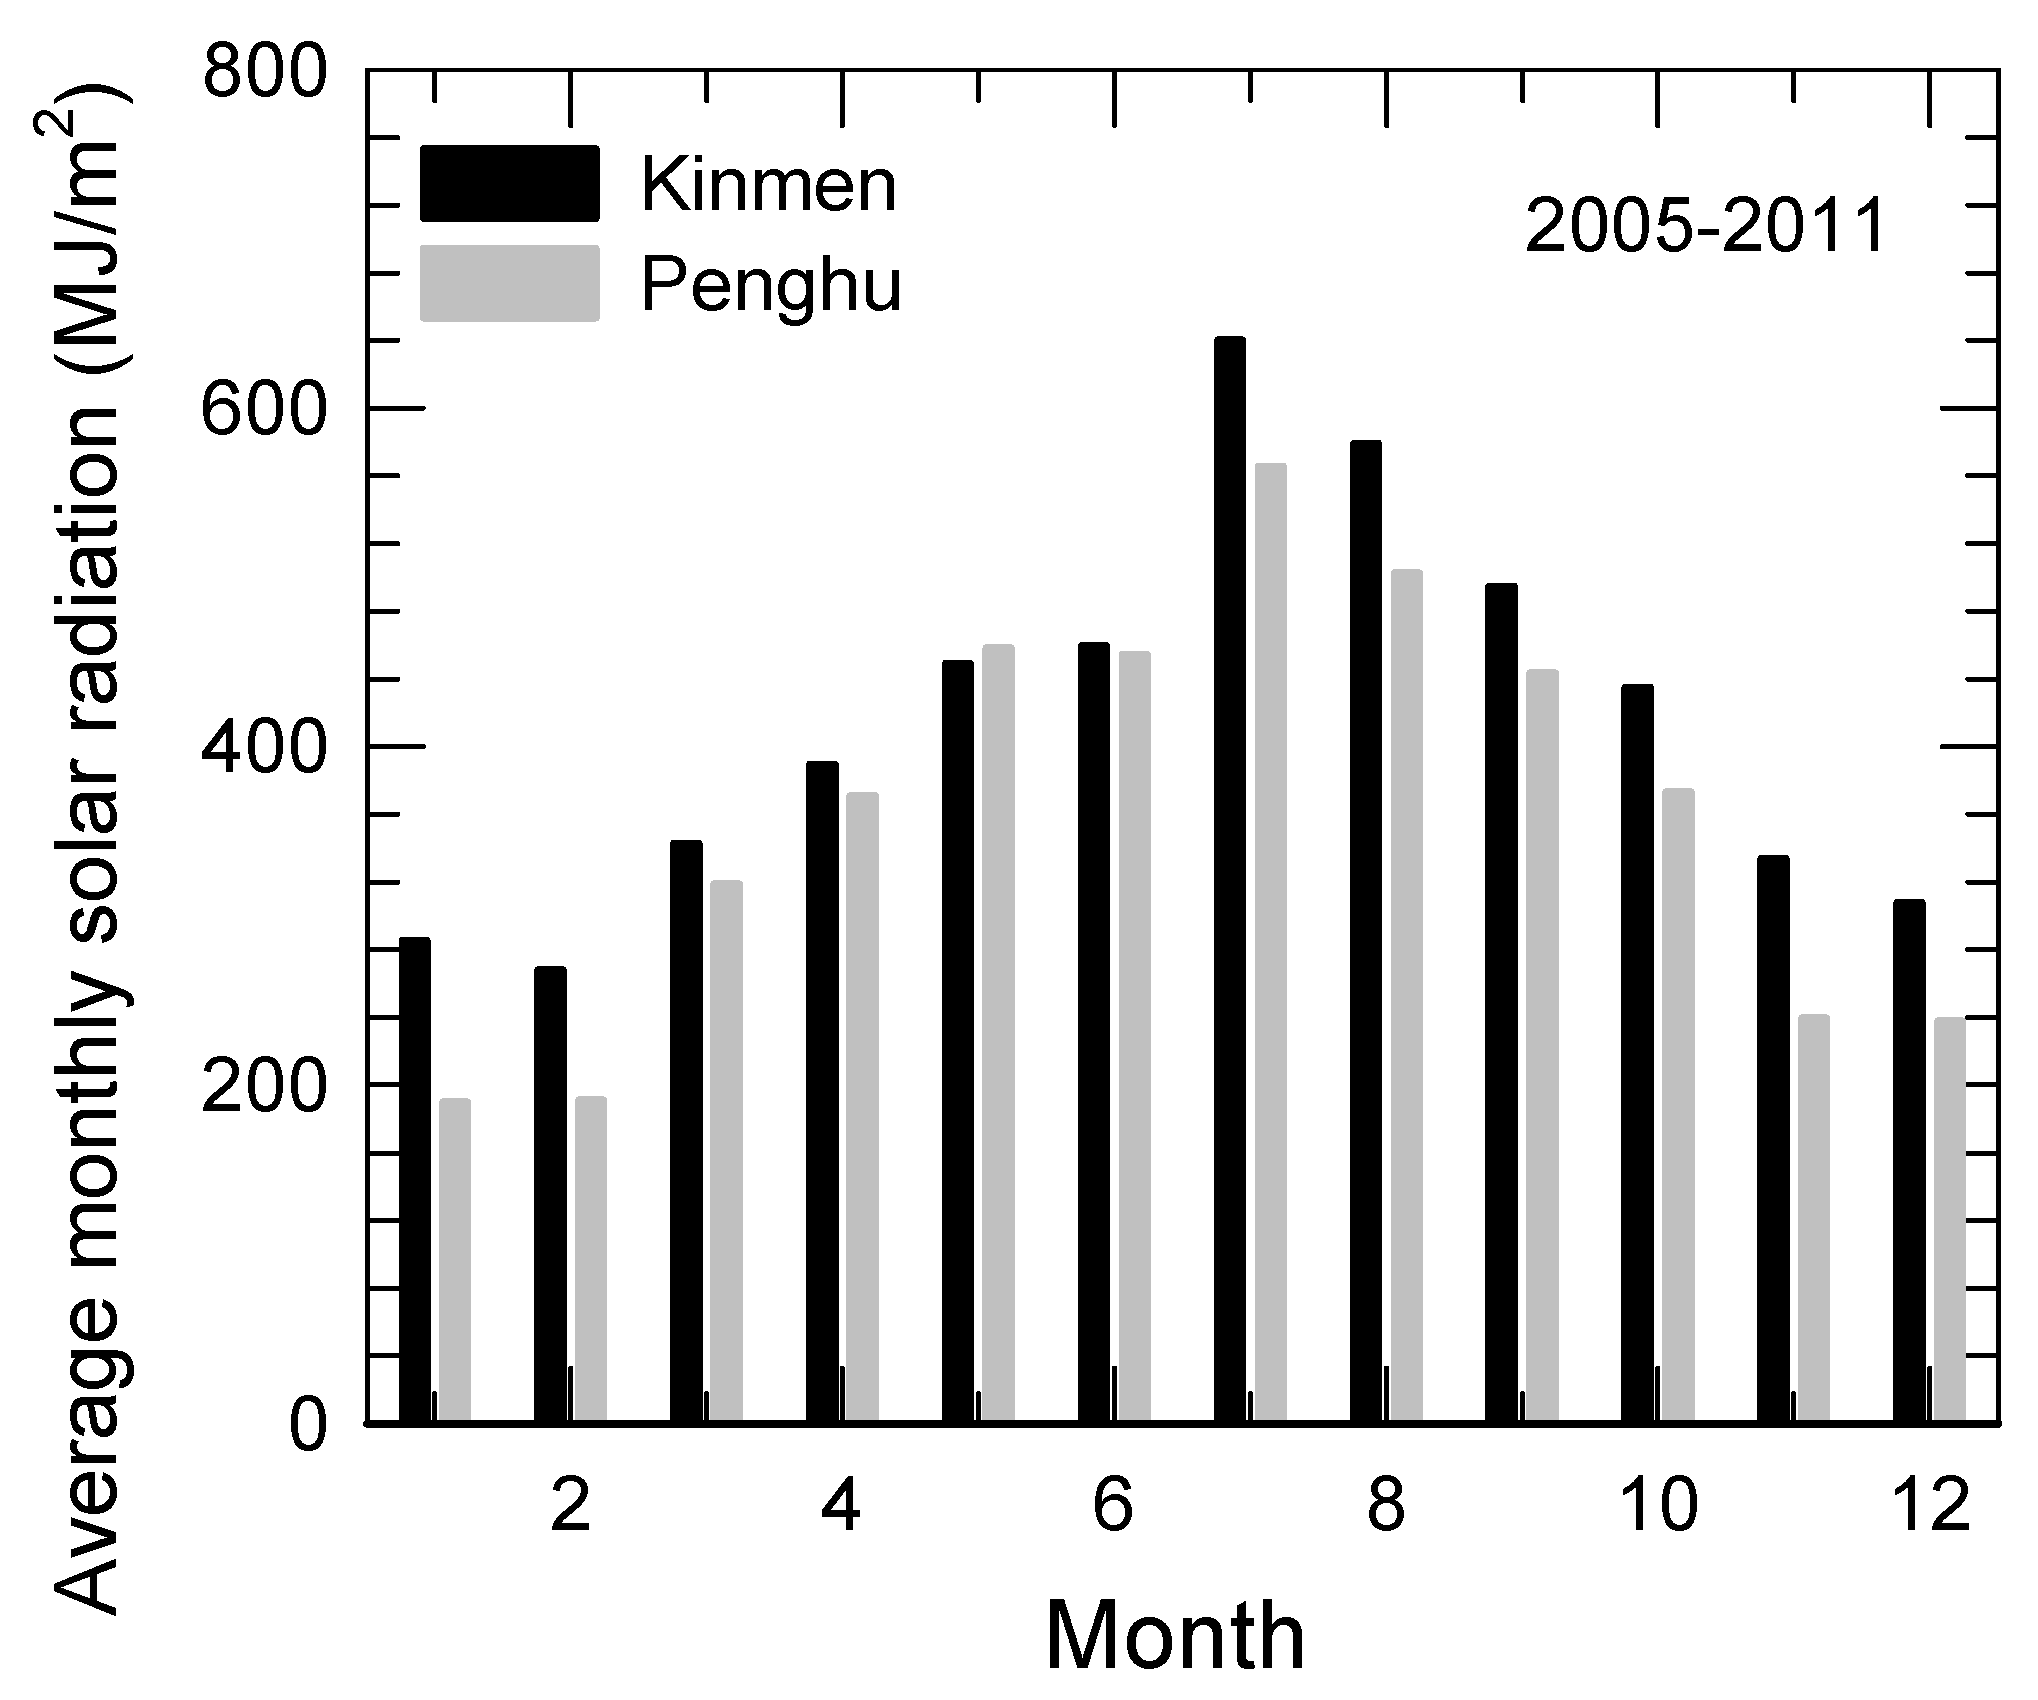
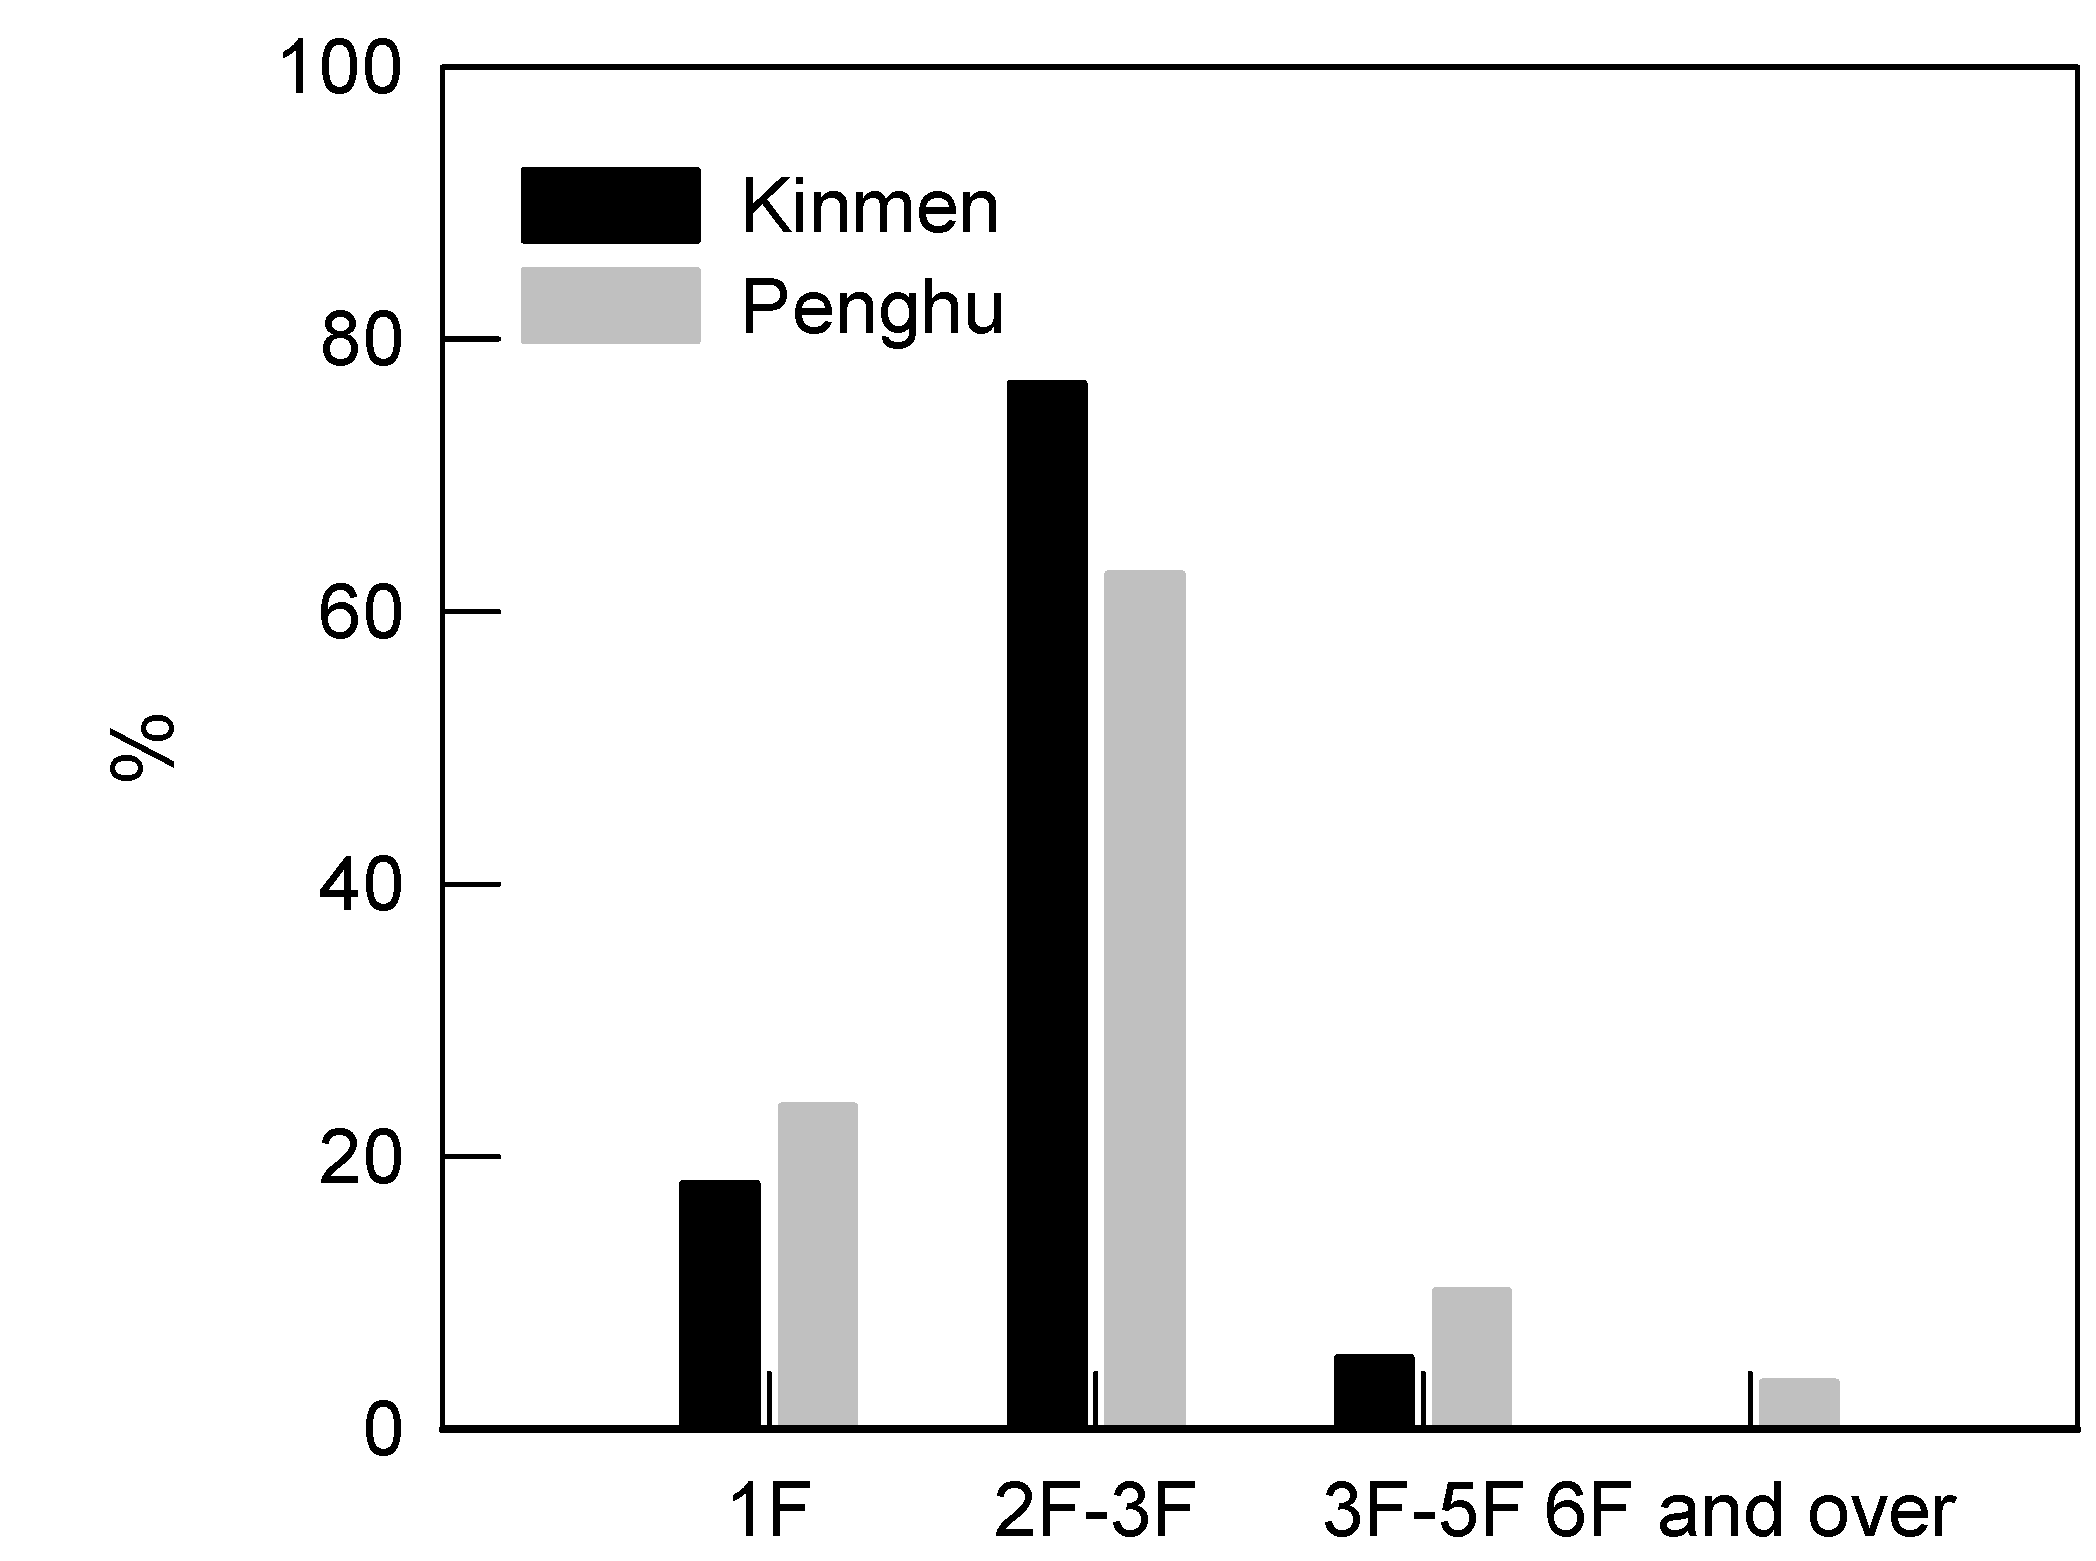
2. Background: Kinmen and Penghu Counties

3. Methodology
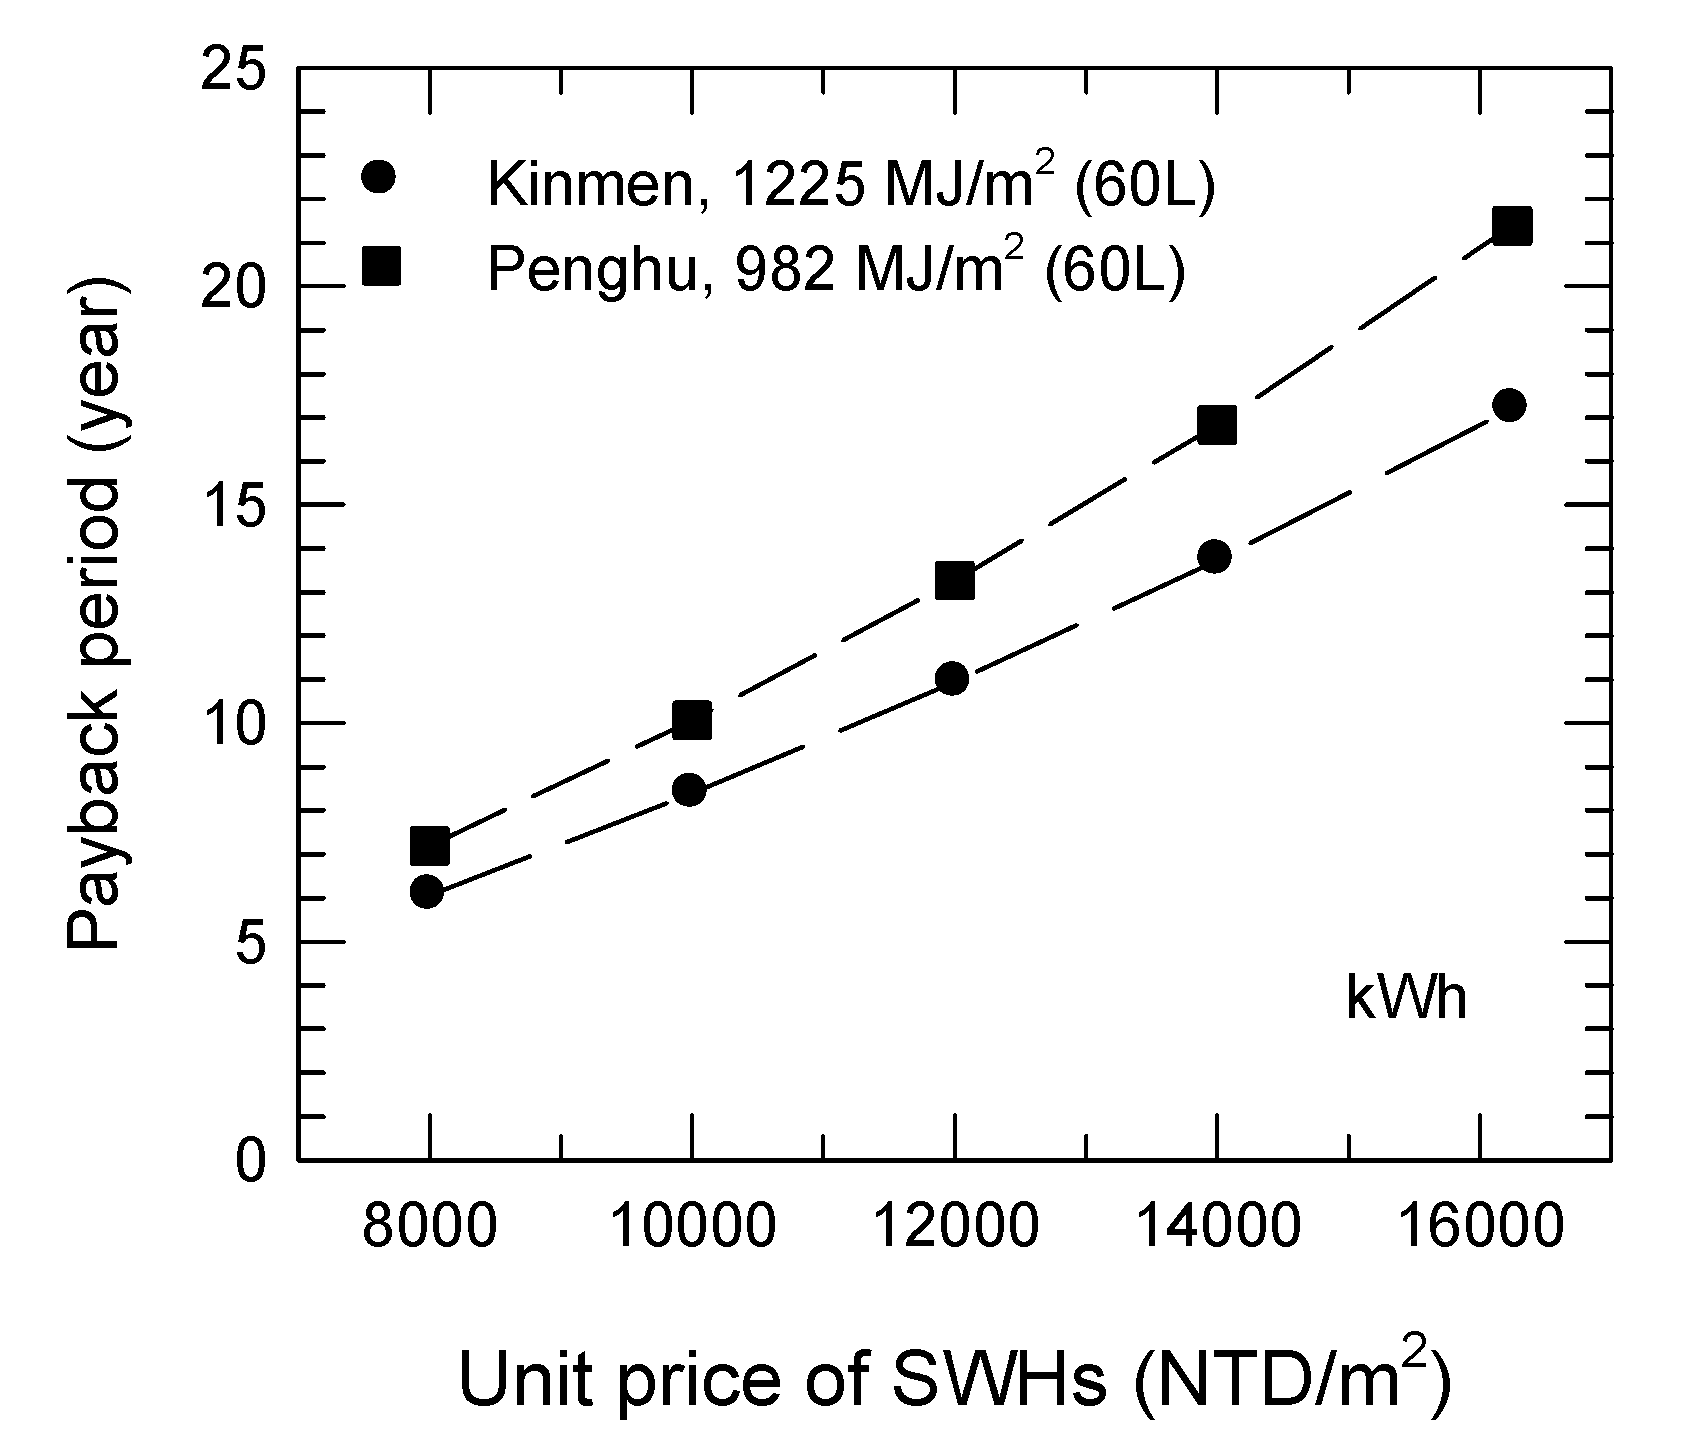
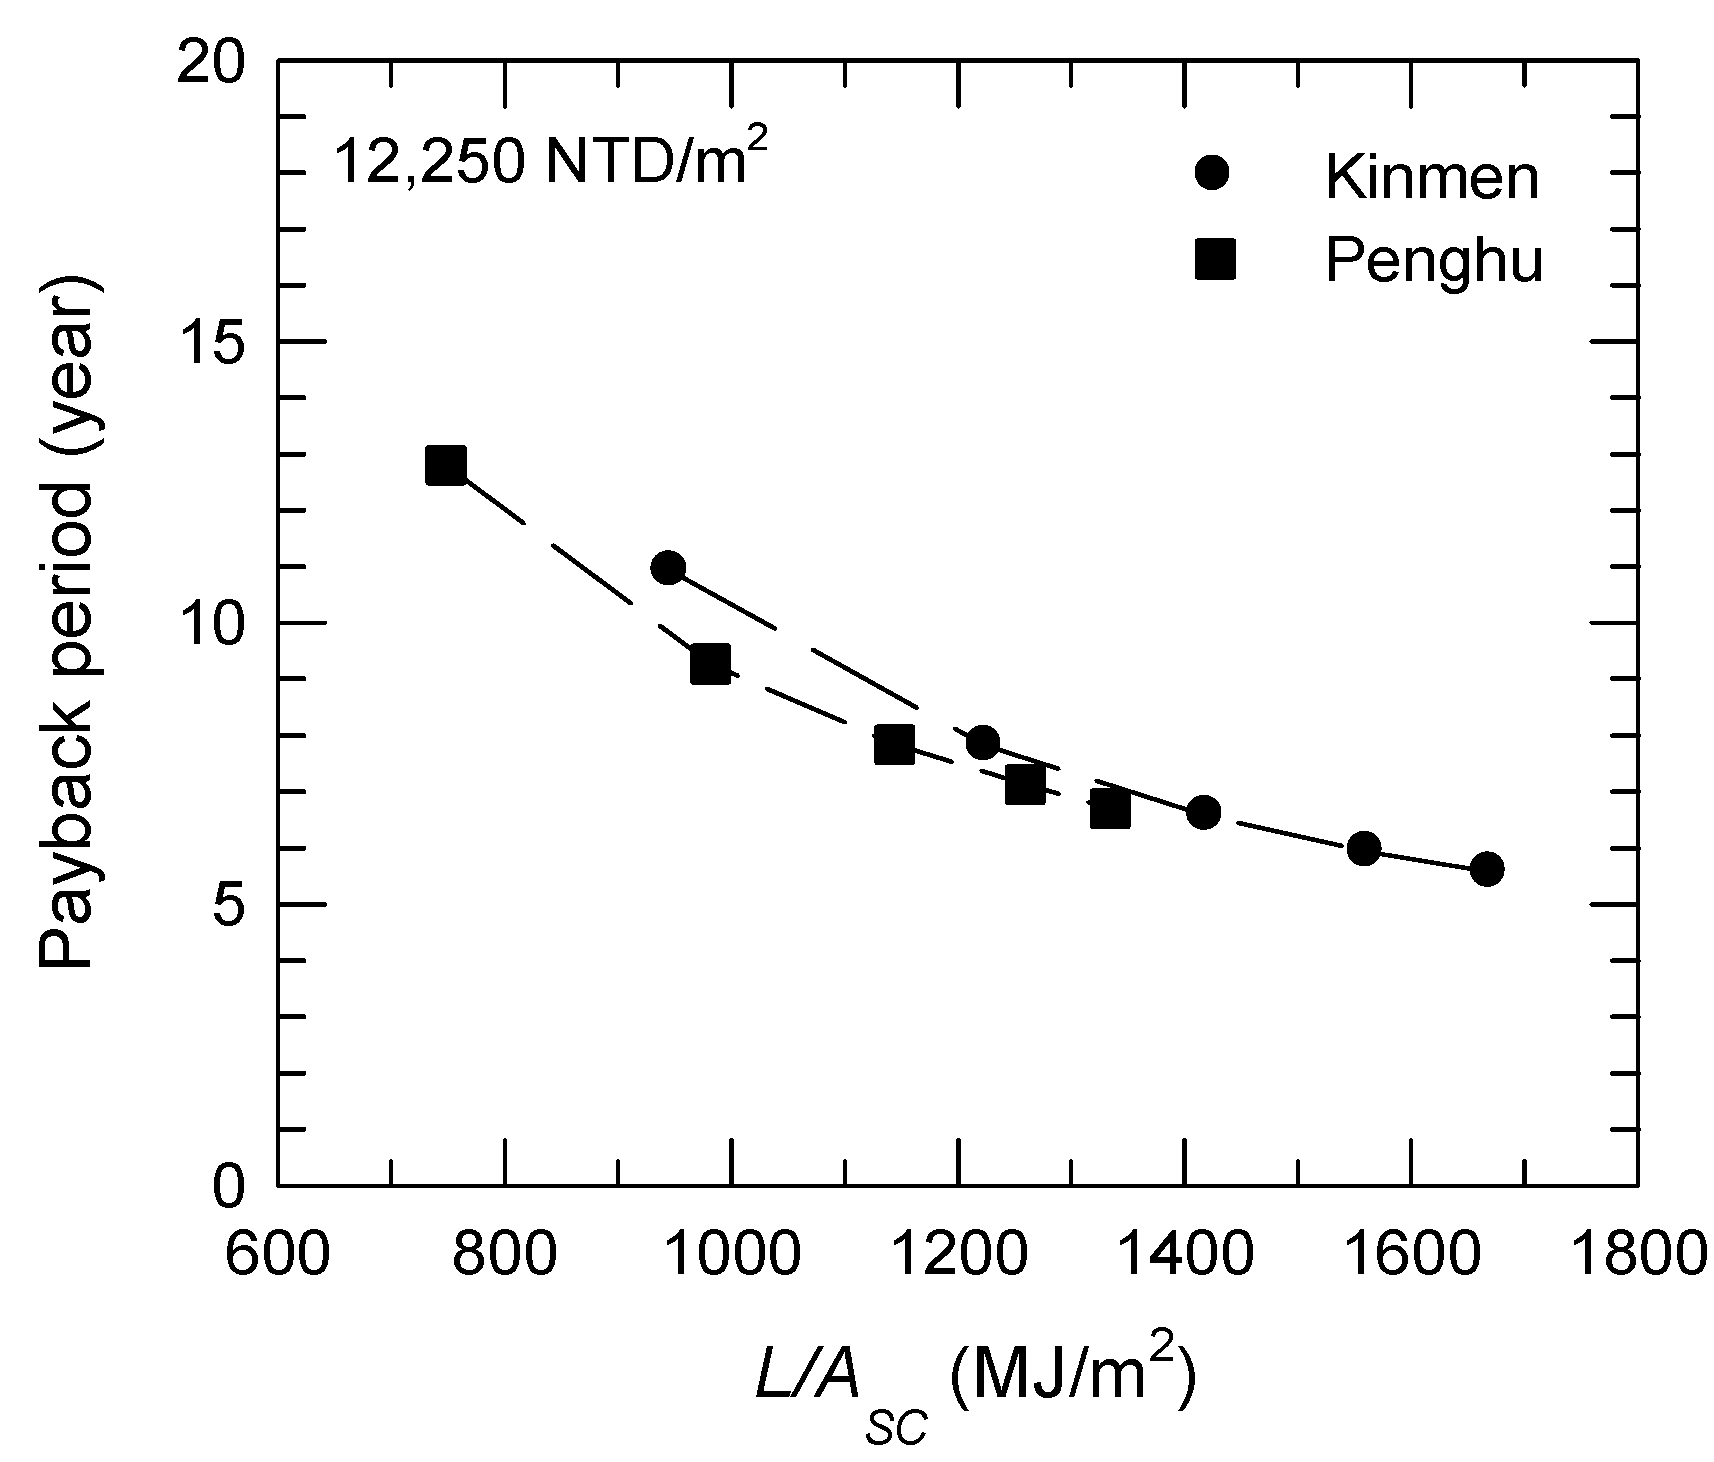
3.1. Payback Period

| Funding agency | Period | Collector-area-based subsidies |
|---|---|---|
| BEMOEA | January 2009–present | Direct subsidy, 2,250 NTD/m2 for glazed flat-plate SC and evacuated-tube SC; 1,500 NTD/m2 for unglazed flat-plate SC |
| Government of Kinmen County | March 2008–present | Direct subsidy, the same amount as BEMOEA; Subsidizing up to Asc = 6 m2 after 1 April 2010 |
| Government of Penghu County | January 2012–present | Direct subsidy, 3,000 NTD/m2; Subsidizing up to Asc = 6 m2 |
3.2. Water Quality
4. Results and Discussion
4.1. Payback Period of SWHs
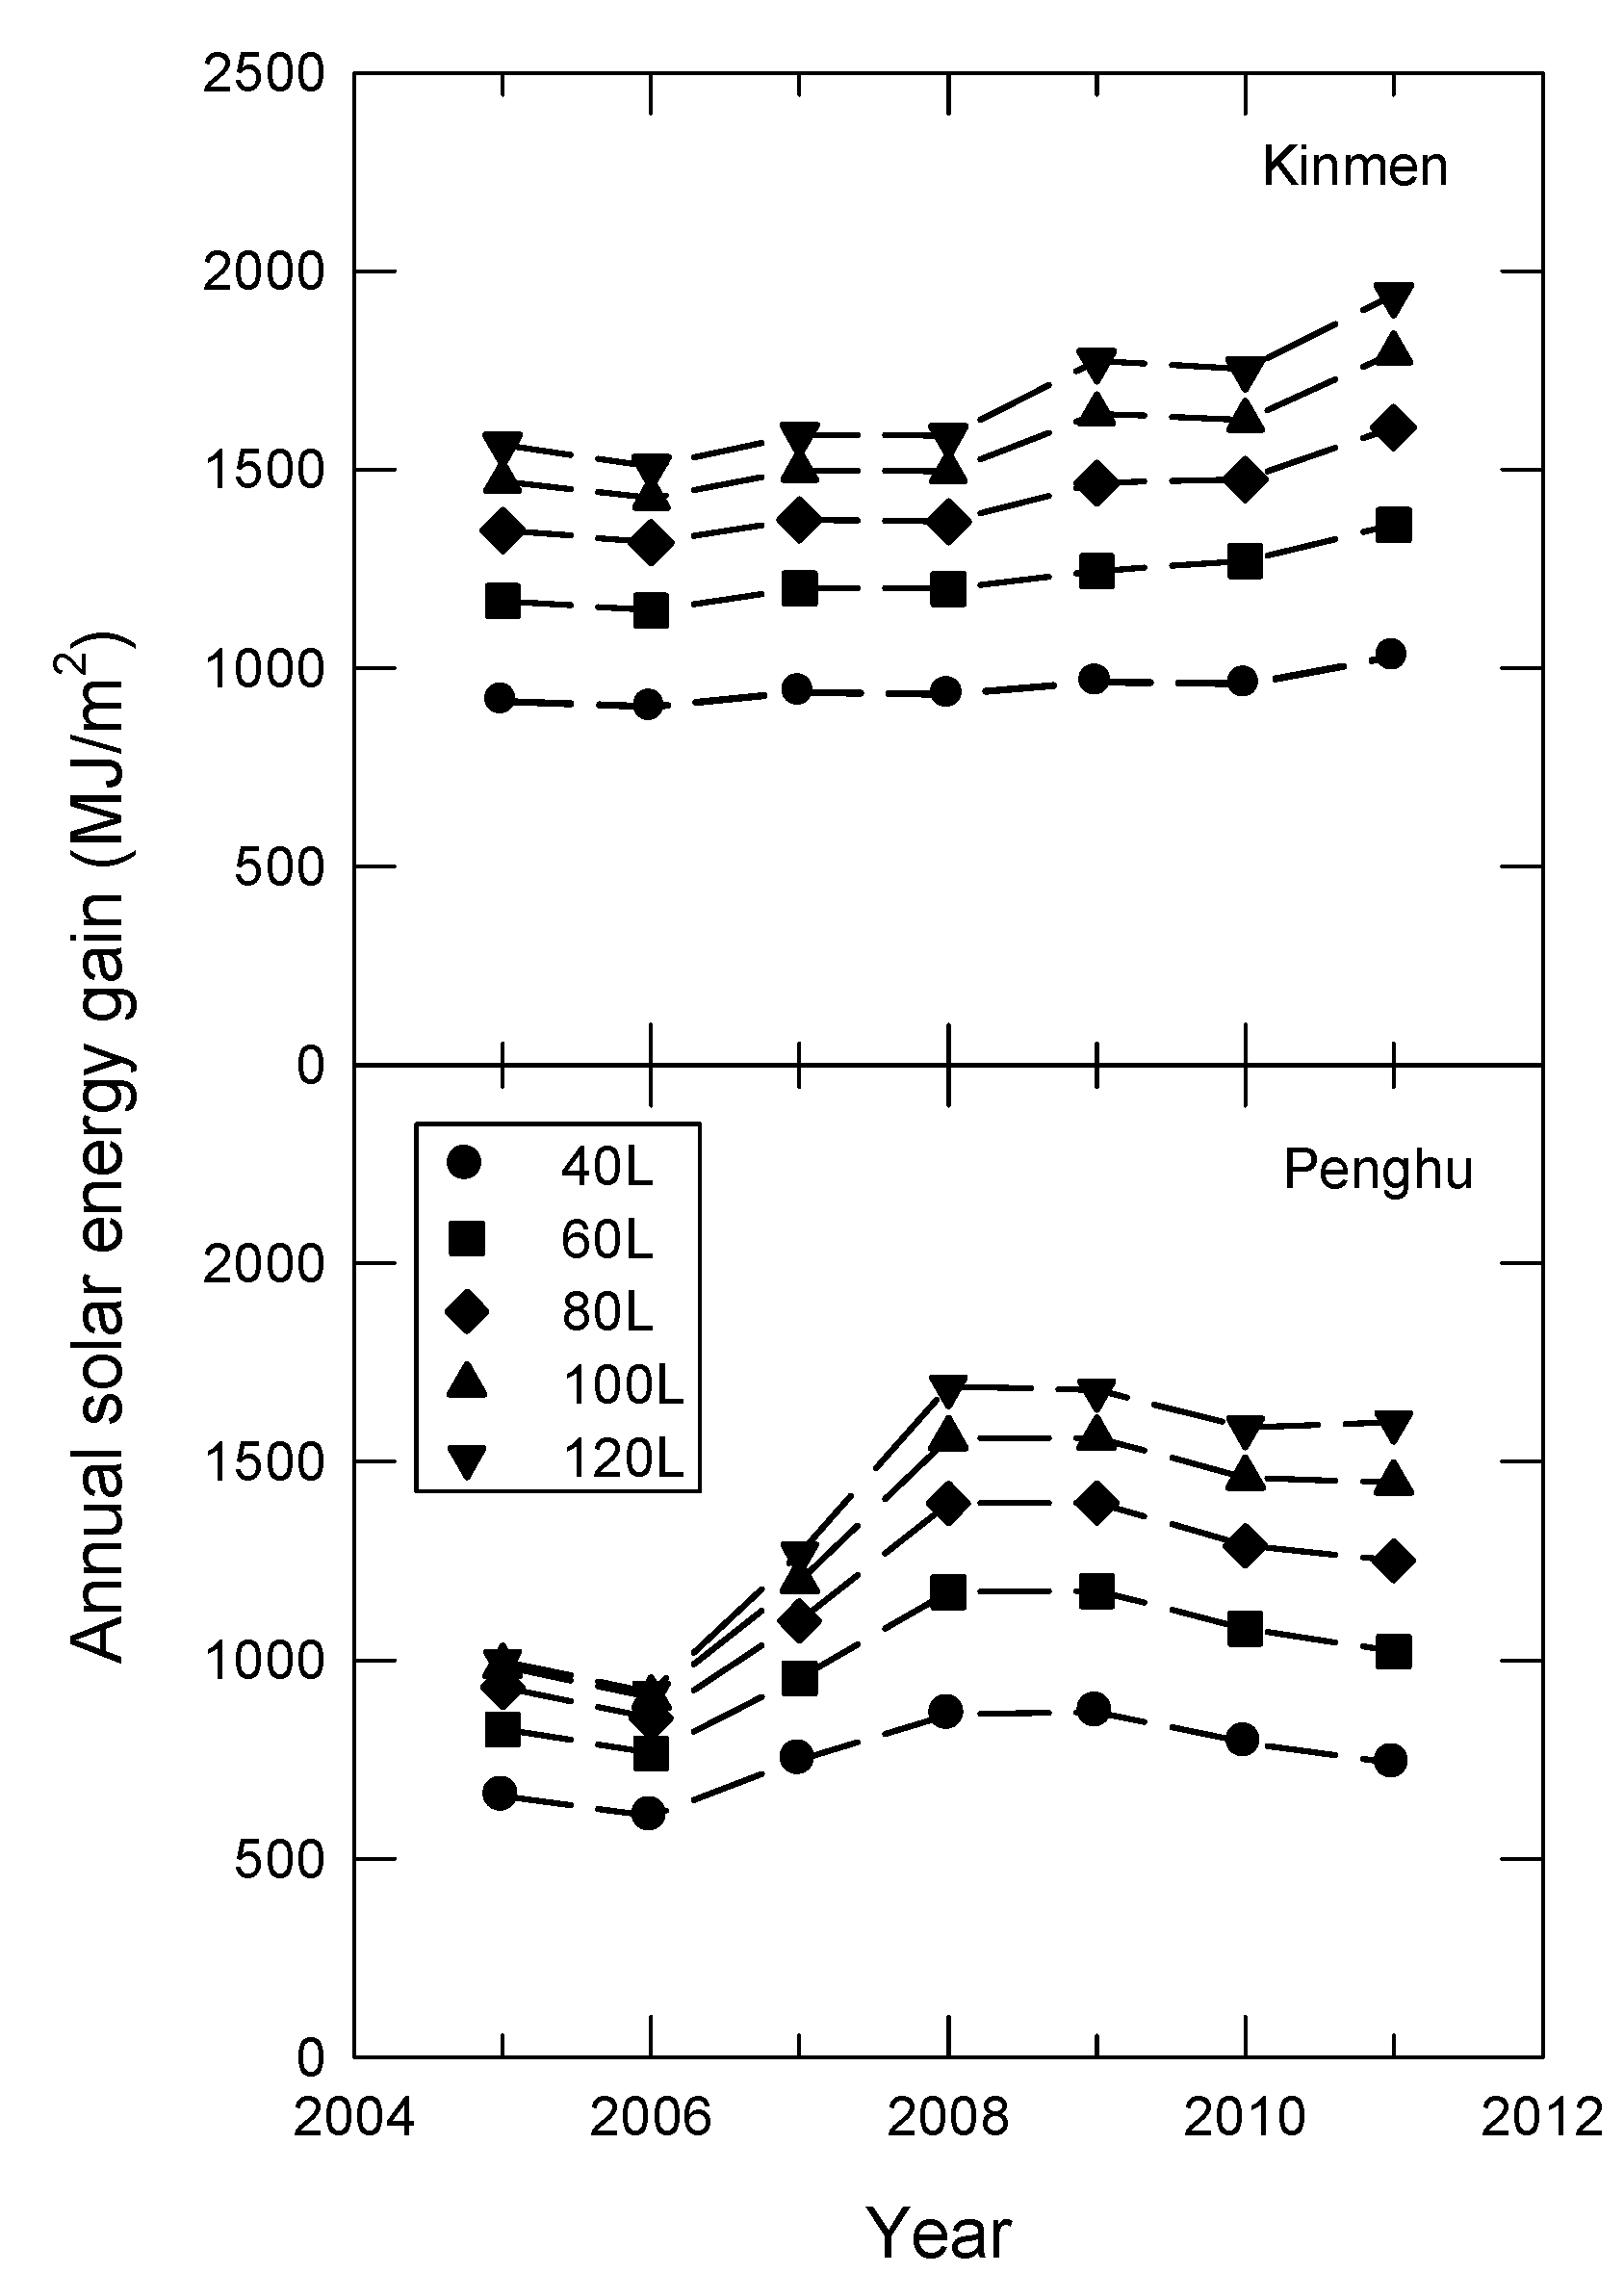
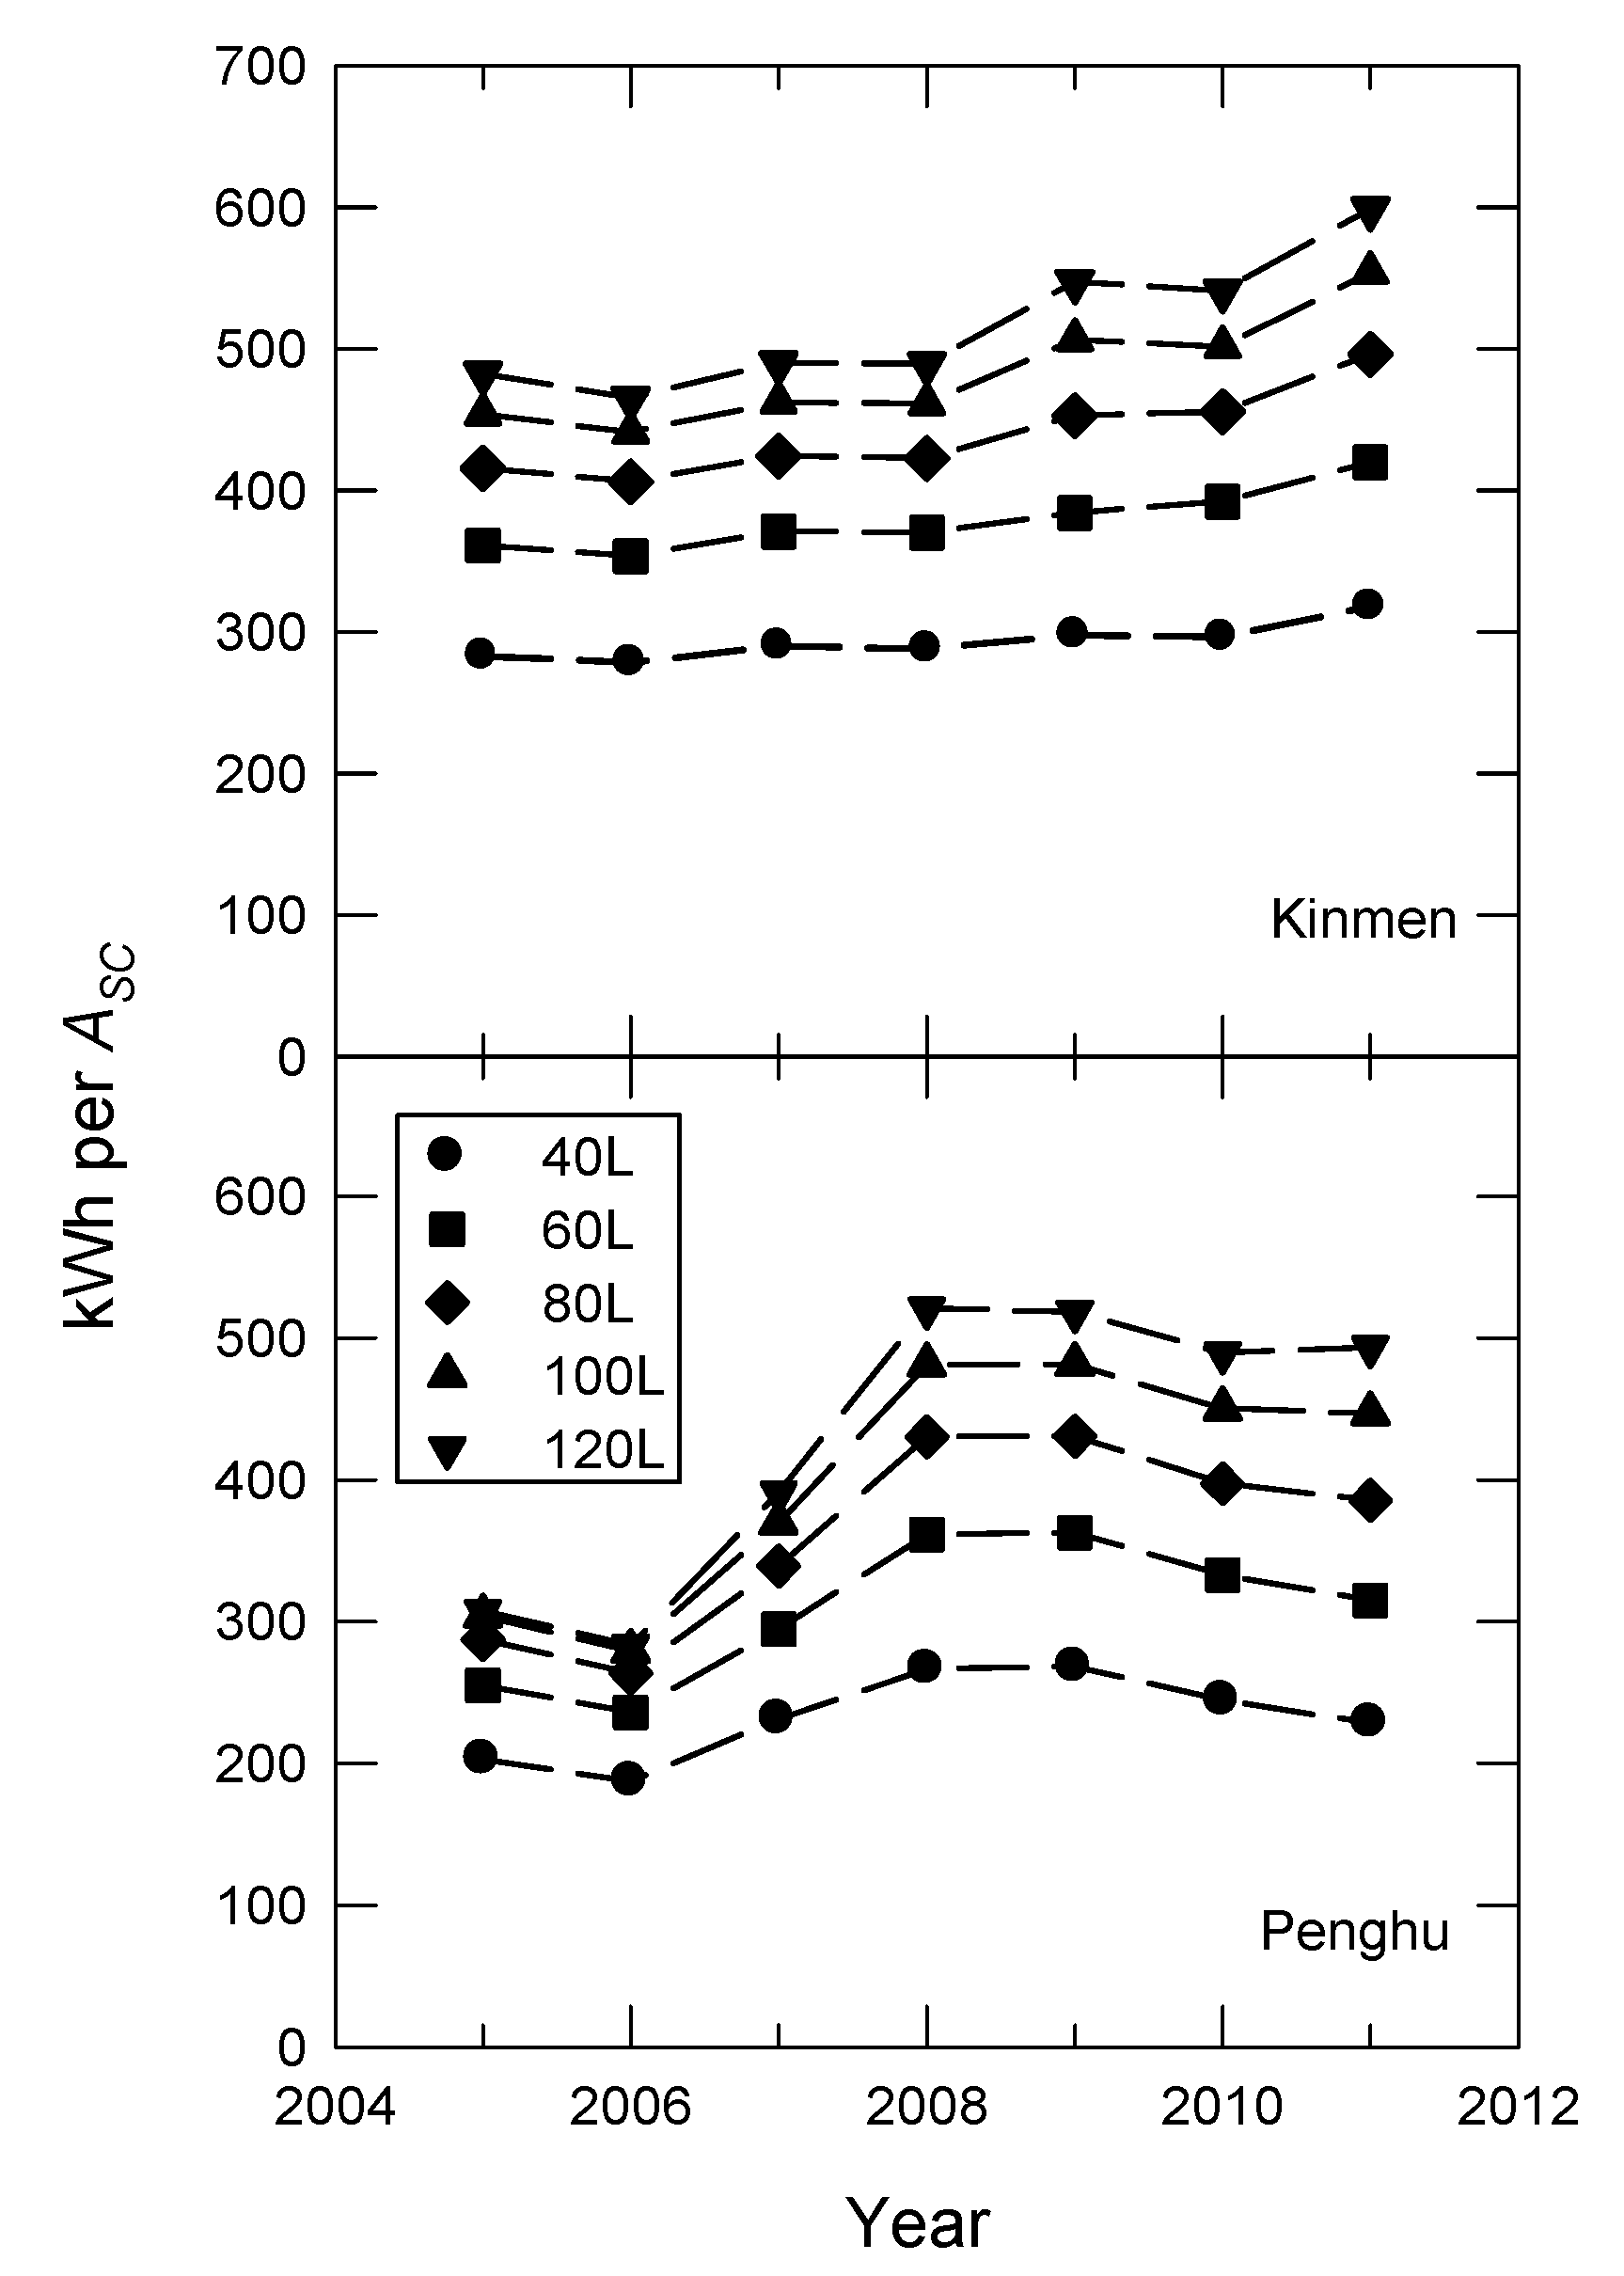
4.1.1. Energy Savings


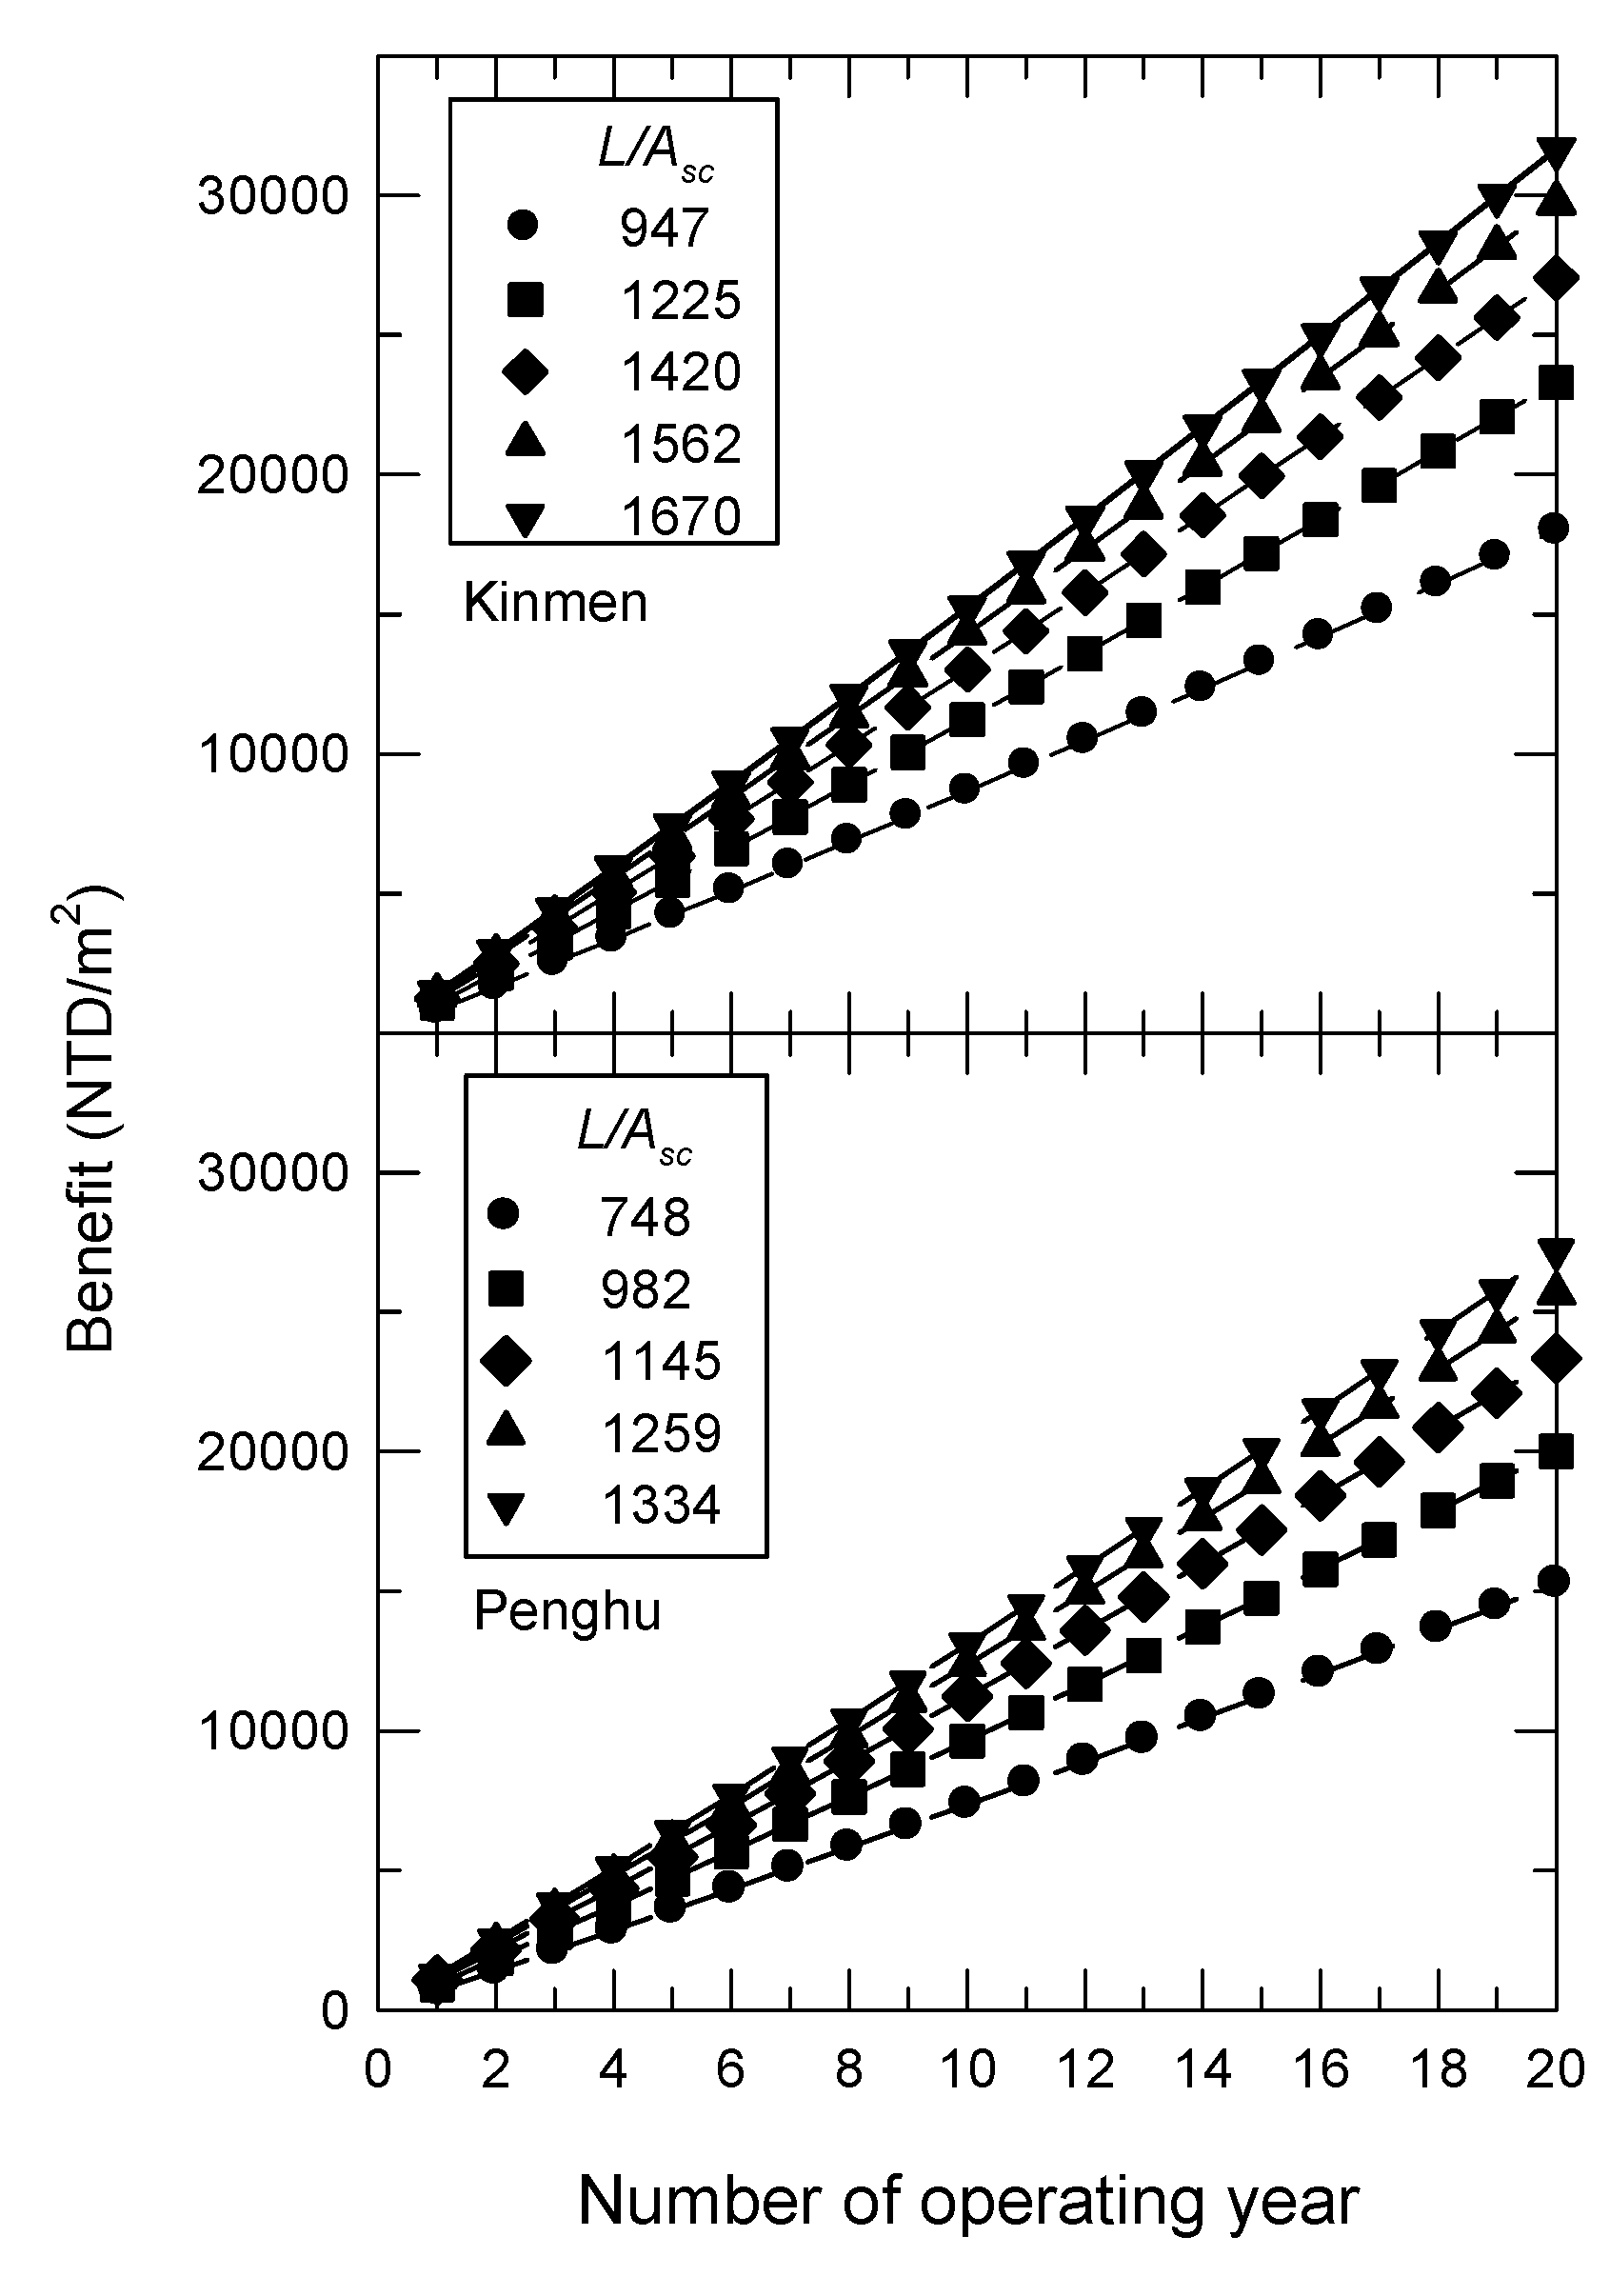
4.1.2. Benefit Analysis


4.2. Water Quality on SWHs
4.2.1. Water Quality in Penghu County
| WPP | Cheng-Kung | Wang-An | Cimei | Siyu | ||||
| Year | 2010 | 2011 | 2010 | 2011 | 2010 | 2011 | 2010 | 2011 |
| Cl−, mg/L | 131 ± 27 | 124 ± 23 | 165 ± 27 | 194 ± 36 | 257 ± 125 | 155 ± 27 | 198 ± 34 | 217 ± 39 |
| LSI | −0.76 ± 0.46 | −0.03 ± 0.58 | 0.26 ± 0.28 | 0.97 ± 0.34 | 0.99 ± 0.74 | 0.85 ± 0.36 | 0.13 ± 0.43 | 0.35 ± 0.15 |
| RSI | 8.05 ± 0.74 | 7.53 ± 1.00 | 6.73 ± 0.33 | 6.04 ± 0.56 | 5.62 ± 1.14 | 5.88 ± 0.62 | 7.25 ± 0.66 | 6.92 ± 0.23 |
| PSI | 7.70 ± 0.92 | 8.08 ± 1.61 | 6.72 ± 0.39 | 6.91 ± 0.76 | 5.67 ± 1.12 | 6.02 ± 0.85 | 7.19 ± 0.52 | 6.93 ± 0.25 |
| LSCI | 5.60 ± 2.04 | 4.91 ± 3.26 | 3.99 ± 0.47 | 5.30 ± 2.69 | 2.55 ± 0.54 | 2.12 ± 0.99 | 1.83 ± 0.16 | 1.84 ± 0.16 |
| WPP | Jibei | Baisha | Lintou | Magong | ||||
| Year | 2010 | 2011 | 2010 | 2011 | 2010 | 2011 | 2010 | 2011 |
| Cl−, mg/L | 297 ± 47 | 330 ± 108 | 163 ± 34 | 225 ± 116 | 133 ± 41 | 109 ± 26 | 128 ± 43 | 106 ± 28 |
| LSI | 1.40 ± 0.23 | 1.58 ± 0.13 | 0.01 ± 0.73 | 1.24 ± 0.62 | 0.56 ± 0.22 | 0.74 ± 0.26 | 0.30 ± 0.23 | 0.54 ± 0.51 |
| RSI | 5.52 ± 0.48 | 5.27 ± 0.26 | 6.89 ± 1.03 | 5.25 ± 0.88 | 7.01 ± 0.20 | 6.74 ± 0.47 | 7.47 ± 0.42 | 7.04 ± 0.87 |
| PSI | 6.23 ± 0.54 | 6.15 ± 0.41 | 6.20 ± 0.87 | 4.92 ± 0.78 | 8.24 ± 0.14 | 7.93 ± 0.68 | 8.87 ± 1.04 | 8.28 ± 1.37 |
| LSCI | 2.57 ± 0.50 | 3.35 ± 1.34 | 1.74 ± 0.70 | 0.95 ± 0.29 | 3.69 ± 1.21 | 2.75 ± 1.26 | 6.79 ± 6.66 | 4.08 ± 2.50 |
| Township | Baisha | Husi | Siyu | Magong |
|---|---|---|---|---|
| Cl−, mg/L | 350 ± 30 | 188 ± 83 | 208 ± 43 | 140 ± 9 |
| LSI | 1.38 ± 0.67 | 0.74 ± 0.11 | 0.26 ± 0.33 | 0.07 ± 1.21 |
| RSI | 5.01 ± 0.62 | 6.47 ± 0.68 | 7.05 ± 0.28 | 7.58 ± 1.99 |
| PSI | 4.76 ± 0.02 | 7.07 ± 1.50 | 7.04 ± 1.11 | 8.55 ± 1.99 |
| LSCI | 1.47 ± 0.43 | 2.22 ± 0.23 | 1.72 ± 0.08 | 4.97 ± 3.38 |
| Township | Baisha | Husi |
|---|---|---|
| Cl−, mg/L | 320 ± 71 | 209 ± 54 |
| LSI | 1.07 ± 0.02 | 1.42 ± 0.64 |
| RSI | 5.70 ± 0.83 | 5.16 ± 0.71 |
| PSI | 5.76 ± 1.87 | 5.42 ± 0.38 |
| LSCI | 1.96 ± 0.26 | 1.46 ± 0.86 |
4.2.2. Water Quality in Kinmen County
| Township | Jingsha | Jincheng | Jinhu | Jinning | Lieyu |
|---|---|---|---|---|---|
| Cl−, mg/L | 27 ± 13 | 96 ± 73 | 322 ± 168 | 38 ± 4 | 31 ± 14 |
| LSI | −0.37 ± 0.00 | −1.15 ± 0.72 | 0.92 ± 0.70 | −1.85 ± 0.42 | −0.65 ± 1.42 |
| RSI | 8.35 ± 0.26 | 8.93 ± 1.02 | 6.05 ± 0.66 | 10.40 ± 0.23 | 8.01 ± 2.14 |
| PSI | 9.24 ± 0.55 | 8.80 ± 0.82 | 6.70 ± 0.13 | 10.96 ± 1.04 | 7.68 ± 1.90 |
| LSCI | 0.87 ± 0.37 | 2.71 ± 1.41 | 4.77 ± 2.87 | 3.75 ± 3.10 | 0.77 ± 0.75 |
| Township | Jingsha | Jincheng | Jinhu | Jinning | Lieyu |
|---|---|---|---|---|---|
| Cl−, mg/L | 42 ± 12 | 77 ± 49 | 91 ± 52 | 30 ± 13 | 55 ± 24 |
| LSI | −0.89 ± 0.63 | −1.01 ± 0.51 | −1.14 ± 1.78 | −3.68 ± 0.36 | −0.25 ± 0.38 |
| RSI | 8.78 ± 0.80 | 8.76 ± 0.73 | 8.68 ± 1.70 | 12.17 ± 0.25 | 7.42 ± 0.93 |
| PSI | 9.16 ± 0.43 | 8.82 ± 0.50 | 8.40 ± 1.57 | 11.31 ± 0.44 | 6.89 ± 1.20 |
| LSCI | 1.56 ± 0.23 | 2.70 ± 1.82 | 3.34 ± 2.32 | 4.99 ± 0.51 | 0.56 ± 0.15 |
5. Conclusions
Acknowledgments
Conflicts of Interest
References
- Bureau of Energy, Ministry of Economic Affairs (BEMOEA) Web Page. Available online: http://web3.moeaboe.gov.tw/ECW/populace/web_book/WebReports.aspx?book=Q_CH&menu_id=143 (accessed on 1 August 2013).
- Chen, F.L.; Lu, S.M.; Wang, C.C.; Chang, Y.L. Promotion strategies for renewable energy in Taiwan. Renew. Sustain. Energy Rev. 2008, 12, 1681–1691. [Google Scholar] [CrossRef]
- Roulleau, T.; Lloyd, C.R. International policy issues regarding solar water heating, with a focus on New Zealand. Energy Policy 2008, 36, 1843–1857. [Google Scholar] [CrossRef]
- Enaburekhan, J.; Yakasai, U.T. Performance evaluation of a refrigerant-charged integrated solar water heater in northern Nigeria. Desalination 2009, 243, 208–217. [Google Scholar] [CrossRef]
- Chang, K.C.; Lin, W.M.; Lee, T.S.; Chung, K.M. Local market of solar water heaters in Taiwan: Review and perspectives. Renew. Sustain. Energy Rev. 2009, 13, 2605–2612. [Google Scholar] [CrossRef]
- Bernardo, L.R.; Davidsson, H.; Karlsson, B. Retrofitting domestic hot water heaters for solar water heating systems in single-family houses in a cold climate: A theoretical analysis. Energies 2012, 5, 4110–4131. [Google Scholar] [CrossRef]
- Weiss, W.; Bergmann, I.; Faninger, G. Solar Heat Worldwide: Markets and Contribution to the Energy Supply 2010 (Edition 2012); International Energy Agency: Paris, France, 2012. [Google Scholar]
- Chang, K.C.; Lin, W.M.; Chung, K.M. Solar thermal market in Taiwan. Energy Policy 2013, 55, 477–482. [Google Scholar] [CrossRef]
- Chang, K.C.; Lee, T.S.; Lin, W.M.; Chung, K.M. Outlook for solar water heaters in Taiwan. Energy Policy 2008, 36, 66–72. [Google Scholar] [CrossRef]
- Pan, T.C.; Kao, J.J.; Wong, C.P. Effective solar radiation based on benefit and cost analysis for solar water heater development in Taiwan. Renew. Sustain. Energy Rev. 2012, 16, 1874–1882. [Google Scholar] [CrossRef]
- Directorate-General of Budget, Accounting and Statistics (DGBAS) Home Page. Key Economic and Social Indicators; 2012. Available online: http://www.dgbas.gov.tw (accessed on 1 August 2013).
- Central Weather Bureau Home Page. Ministry of Transportation and Communications, Climate Statistics. 2011. Available online: http://www.cwb.gov.tw (accessed on 1 August 2013). [Google Scholar]
- Chang, K.C.; Lee, T.S.; Chung, K.M. Solar Water Heating System Promotion and Subsidy; Bureau of Energy, Ministry of Economic Affairs: Taipei, Taiwan, 2012.
- Kaldellis, J.K.; Kavadias, K.A.; Spyropoulos, G. Investigating the real situation of Greek solar water heating market. Renew. Sustain. Energy Rev. 2005, 9, 499–520. [Google Scholar] [CrossRef]
- Lin, W.M.; Chang, K.C.; Liu, Y.M.; Chung, K.M. Field surveys of non-residential solar water heating systems in Taiwan. Energies 2012, 5, 258–269. [Google Scholar] [CrossRef]
- Langelier, W.F. The analytical control of anti-corrosion water treatment. J. Am. Water Works Assoc. 1936, 28, 1500–1521. [Google Scholar]
- Ryznar, J.W. A new index for determining the amount of calcium carbonate scale formed by water. J. Am. Water Works Assoc. 1944, 36, 472–494. [Google Scholar]
- Carrier Air Conditioning Company. Handbook of Air Conditioning System Design; McGraw-Hill: New York, NY, USA, 1965. [Google Scholar]
- De Zuane, J. Handbook of Drinking Water Quality, 2nd ed.; John Wiley & Sons: New York, NY, USA, 1996. [Google Scholar]
- Prisyazhniuk, V.A. Prognosticating scale-forming properties of water. Appl. Therm. Eng. 2007, 27, 1637–1641. [Google Scholar] [CrossRef]
- Seneviratne, M. A Practical Approach to Water Conservation for Commercial and Industrial Facilities; Elsevier: Amsterdam, The Netherlands, 2007. [Google Scholar]
- Gacem, Y.; Taleb, S.; Ramdani, A.; Senadjki, S.; Ghaffour, N. Physical and chemical assessment of MSF distillate and SWRO product for drinking purpose. Desalination 2012, 290, 107–114. [Google Scholar] [CrossRef]
- Larson, T.E.; Skold, R.V. Laboratory Studies Relating Mineral Quality of Water to Corrosion of Steel and Cast Iron; Illinois State Water Survey; Authority of the State of Illinois: Urbana, IL, USA, 1958. [Google Scholar]
- Ghali, E. Corrosion Resistance of Aluminum and Magnesium Alloys: Understanding, Performance, and Testing; John Wiley & Sons: Hoboken, NJ, USA, 2010; pp. 103–104. [Google Scholar]
- Gallegos, A.A.; Martinez, S.S.; Ramirez Reyes, J.L. Evaluation of water corrosivity using a corrosion rate model for a cooling water system. J. New Mater. Electrochem. Syst. 2005, 8, 133–142. [Google Scholar]
- Liang, C.H.; Zhang, W. Pitting corrosion mechanisms and characteristics of aluminum in solar heating systems. J. Chin. Chem. Soc. 2006, 53, 313–318. [Google Scholar]
- Parrott, R.; Pitts, H. Chloride Stress Corrosion Cracking in Austenitic Stainless Steel—Recommendations for Assessing Risk, Structural Integrity and NDE based on Practical Cases and a Review of Literature; The Health and Safety Laboratory for the Health and Safety Executive: Buxton, UK, 2011. [Google Scholar]
- Kopeliovich, D. Pitting Corrosion. Available online: http://www.substech.com/%20dokuwiki/doku.php?id%20=pitting_corrosion (accessed on 15 July 2013).
- Kinmen County Government Web Page. Available online: http://www.kinmen.gov.tw/Layout/sub_E/index.aspx?frame=99 (accessed on 15 July 2013).
- Taiwan Water Corporation (TWC). Annual Report of 2010 for Water Quality; Taiwan Water Corporation: Taichung, Taiwan, 2010. [Google Scholar]
- Taiwan Water Corporation (TWC). Annual Report of 2011 for Water Quality; Taiwan Water Corporation: Taichung, Taiwan, 2011. [Google Scholar]
- Chang, K.C.; Lin, W.M.; Lee, T.S.; Chung, K.M. Subsidy programs on diffusion of solar water heaters: Taiwan’s experience. Energy Policy 2011, 39, 563–567. [Google Scholar] [CrossRef]
- Haralambopoulos, D.; Paparsenos, G.F.; Kovras, H. Assessing the economic aspects of solar water production in Greece. Renew. Energy 1997, 11, 53–167. [Google Scholar]
© 2013 by the authors; licensee MDPI, Basel, Switzerland. This article is an open access article distributed under the terms and conditions of the Creative Commons Attribution license (http://creativecommons.org/licenses/by/3.0/).
Share and Cite
Lin, W.-M.; Fan, K.-C.; Chang, K.-C.; Chung, K.-M. Dissemination of Solar Water Heaters in Taiwan: The Case of Remote Islands. Energies 2013, 6, 5101-5113. https://doi.org/10.3390/en6105101
Lin W-M, Fan K-C, Chang K-C, Chung K-M. Dissemination of Solar Water Heaters in Taiwan: The Case of Remote Islands. Energies. 2013; 6(10):5101-5113. https://doi.org/10.3390/en6105101
Chicago/Turabian StyleLin, Wei-Min, Kai-Chun Fan, Keh-Chin Chang, and Kung-Ming Chung. 2013. "Dissemination of Solar Water Heaters in Taiwan: The Case of Remote Islands" Energies 6, no. 10: 5101-5113. https://doi.org/10.3390/en6105101