Article

Comparative Study on Different Energy Management Strategies for Plug-In Hybrid Electric Vehicles

National Engineering Laboratory for Electric Vehicles, Beijing Institute of Technology, Beijing 100081, China
*
Author to whom correspondence should be addressed.
Energies 2013, 6(11), 5656-5675; https://doi.org/10.3390/en6115656
Submission received: 4 August 2013 / Revised: 22 October 2013 / Accepted: 23 October 2013 / Published: 29 October 2013
(This article belongs to the Special Issue Advances in Hybrid Vehicles)

Abstract

:
Plug-in hybrid electric vehicles (PHEVs) have a larger battery and can replace a certain amount of conventional fossil fuels with grid electricity, which differs from the traditional hybrid electric vehicles (HEVs). The application of the onboard electrical energy significantly influences the energy utilization efficiency and thus impacts the fuel economy. In this paper, the basic PHEV operation modes are defined as pure electric driving (PED), hybrid driving charge depleting (HDCD) and hybrid driving charge sustaining (HDCS) based on the battery state of charge (SoC) profile. For a plug-in hybrid electric bus (PHEB), three different energy management strategies, which are combined with two or three of the basic operation modes, are put forward and comparatively examined based on simulation models. If some trip information can be approximately known in advance such as the trip distance and the mean power demand, the PED + HDCD + HDCS strategy comprised optimally of the PED mode, the HDCD mode and the HDCS mode would be the best energy management strategy.

1. Introduction

The energy crisis and climate change have become increasingly serious issues, thus greatly promoting research on and applications of energy-saving and emission-reducing technologies in the automobile industry [1]. Compared with conventional hybrid electric vehicles (HEVs), plug-in hybrid electric vehicles (PHEVs) have a larger battery pack and can replace a certain amount of fossil energy with grid electricity. As a result, the fuel economy and emission reduction can be improved remarkably [2,3,4,5,6].
The energy demand of the PHEV is supplied both by the fuel tank and the power grid, which makes the power distribution among different power components more complex than HEVs, meanwhile the energy management strategy has a significant impact on the vehicle performance [7,8,9,10]. He and Chowdhury et al. [11] presented, based on an innovative adaptive equivalent consumption minimization strategy, an energy optimization strategy for a power-split PHEV with predictive traffic information. He and Yang et al. [12] proposed an adaptive online-optimal energy management strategy for a PHEV with a new flexible full hybrid electric system equipped with an electrical continuously variable transmission. Lee and Kim et al. [13] studied an optimal engine-generator operating line for a plug-in hybrid electric bus (PHEB) to minimize the fuel consumption. Zhang and Vahidi [14] studied the energy management strategy for a PHEV, which is based on dynamic programming (DP) with full knowledge of future driving conditions, and the instantaneous real-time minimization strategy, in which the parameters obtained either from DP or from a back-ward solution of energy equivalent consumption minimization equations with an estimated future driving conditions. Zhang and Yang et al. [15] presented a power management strategy with a pair of power parameters including the power thresholds to start the engine and the optimum battery power thresholds when the engine is on.
Recently, research on the PHEV energy management strategy has mainly focused on the optimization-based strategy, but the performance of optimization-based methods is closely related to the amount of trip information available in the form of road profiles, velocity profiles, trip distances, and weather conditions [16]. The detailed trip information of the driving cycle in a practical application is always difficult to know precisely, even though modern vehicular navigation systems are utilized. In this paper, three basic PHEV operation modes, i.e., pure electric driving (PED), hybrid driving charge depleting (HDCD) and hybrid driving charge sustaining (HDCS) are defined based on the battery state of charge (SoC) profile. Three different PHEB energy management strategies without considering the information of trip distance and driving cycle, which is combined with two or three of the basic operation modes, are developed and comparatively examined based on simulation models. The PHEB powertrain is introduced in Section 2, and its systematic models are built in Section 3. The PHEV energy management strategies are discussed and the three new energy management strategies are put forward in Section 4. Detailed simulation experiments on the different energy management strategies are presented in Section 5 and finally several conclusions are drawn in Section 6.

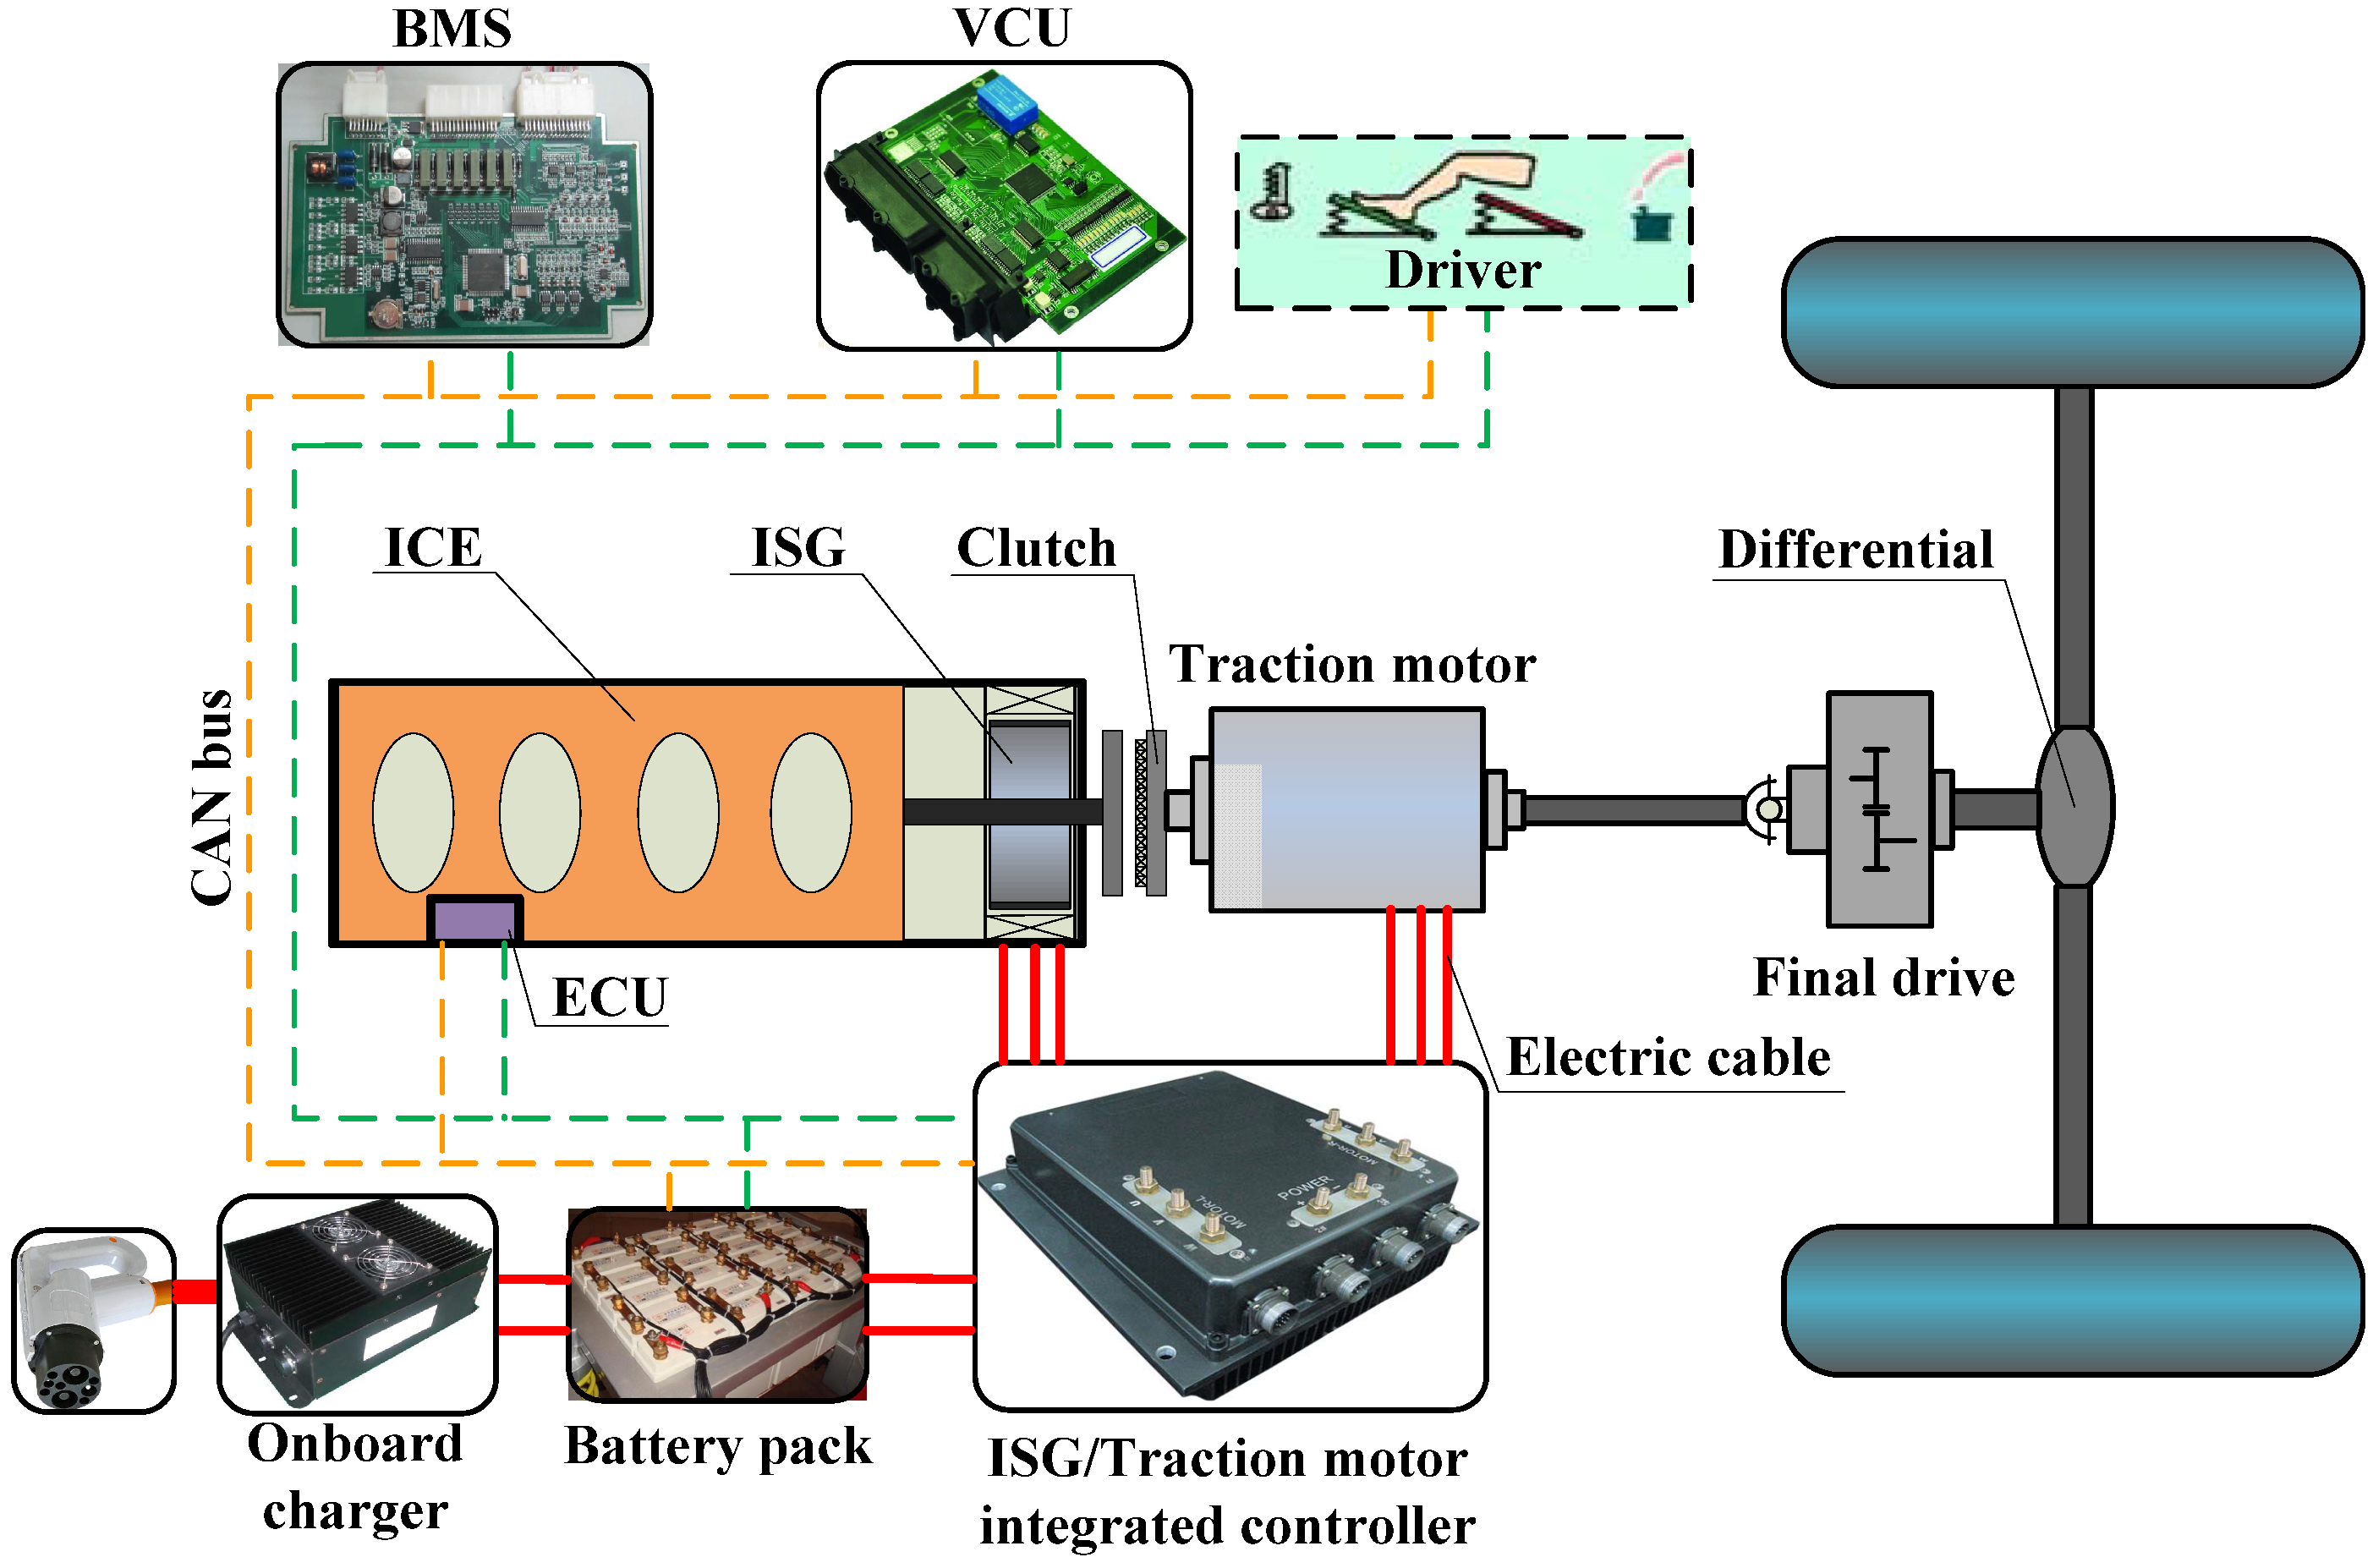
2. A Plug-In Hybrid Electric Bus Powertrain

A single-axis series-parallel PHEB is taken as the research object and its powertrain configuration is shown in Figure 1. It consists of a conventional internal combustion engine (ICE), an integrated starter and generator (ISG), a traction motor (TM), an automatically controllable friction clutch, a battery pack, an on-board battery charger and the electronic control systems which include a vehicle control unit (VCU), a battery management system (BMS), an integrated motor controller for the ISG and the TM, an ICE control unit, and so on. The basic PHEB parameters are listed in Table 1.
Figure 1. Powertrain configuration of the series-parallel PHEB.
Energies 06 05656 g001
Table 1. The PHEB main specifications.
ParametersValueParametersValue
Curb weight/kg12,500Aerodynamic drag coefficient0.55
Gross weight/kg18,000Rolling resistance coefficient0.0095
Frontal area/m26.6transmission efficiency0.93
Tire rolling radius/mm473
For the PHEB powertrain, the ICE output is directly connected to the ISG rotor shaft, and then connected to the clutch input plate. The TM rotor is directly connected to the clutch output plate. The power from the ICE, the ISG and the TM could be delivered directly to the rear drive wheels through the final drive and the differentials. The automatically controllable friction clutch is used to connect or disconnect the ICE/ISG torque with the TM torque. If the clutch input plate and output plate are connected, the ICE/ISG torque could be delivered directly to the driving wheels, and the PHEB works in a parallel hybrid mode. In the clutch input plate and output plate are disconnected, the ICE/ISG could only output electricity, and the PHEB works in a series hybrid mode. It is necessary to note that the ISG could start the ICE instantaneously once the ICE is needed to work.

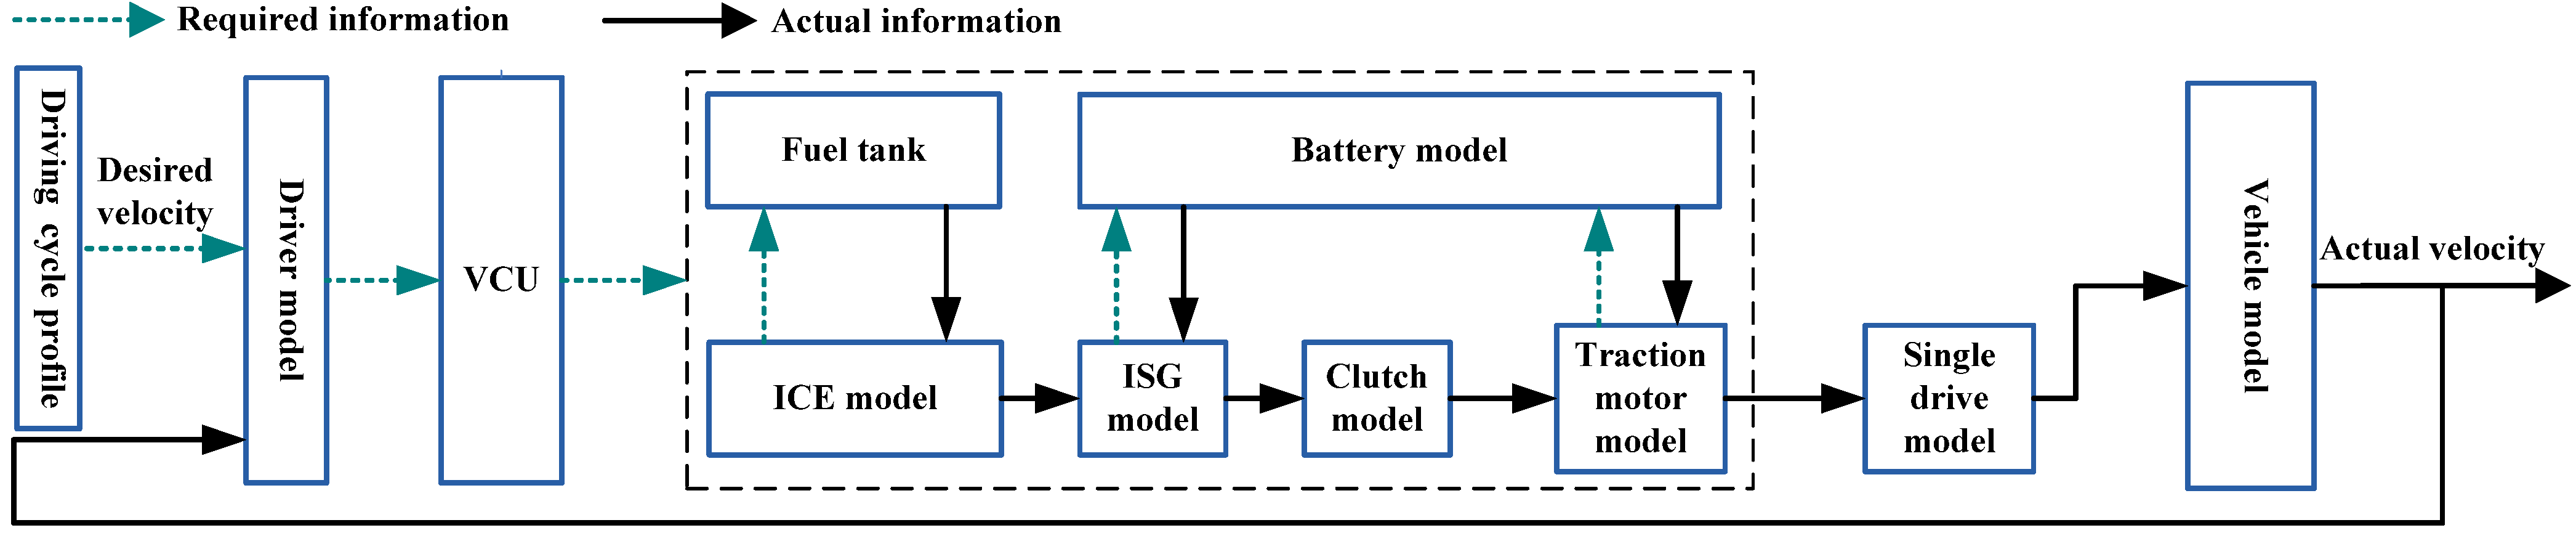
3. The Plug-In Hybrid Electric Bus Modeling

To perform the energy analysis and the fuel consumption evaluation of the PHEVs, the simulation method is generally used [10] and the quasi-static models are usually selected [17]. Since only the energy flow is focused on, the accuracy of the quasi-static models is enough for the simulation time steps as big as 1 s. Here, we also build the PHEB model with quasi-static models and perform a forward-facing simulation. As shown in Figure 2, a driver model which compares the actual velocity with the desired velocity decided by the target driving cycle and generates acceleration and brake commands [18]. These commands serve as the inputs of the VCU and the VCU outputs the control signals of relevant powertrain components with the optimum power split between the engine and the battery.
Figure 2. The architecture of the forward-facing quasi-static PHEB model.
Energies 06 05656 g002

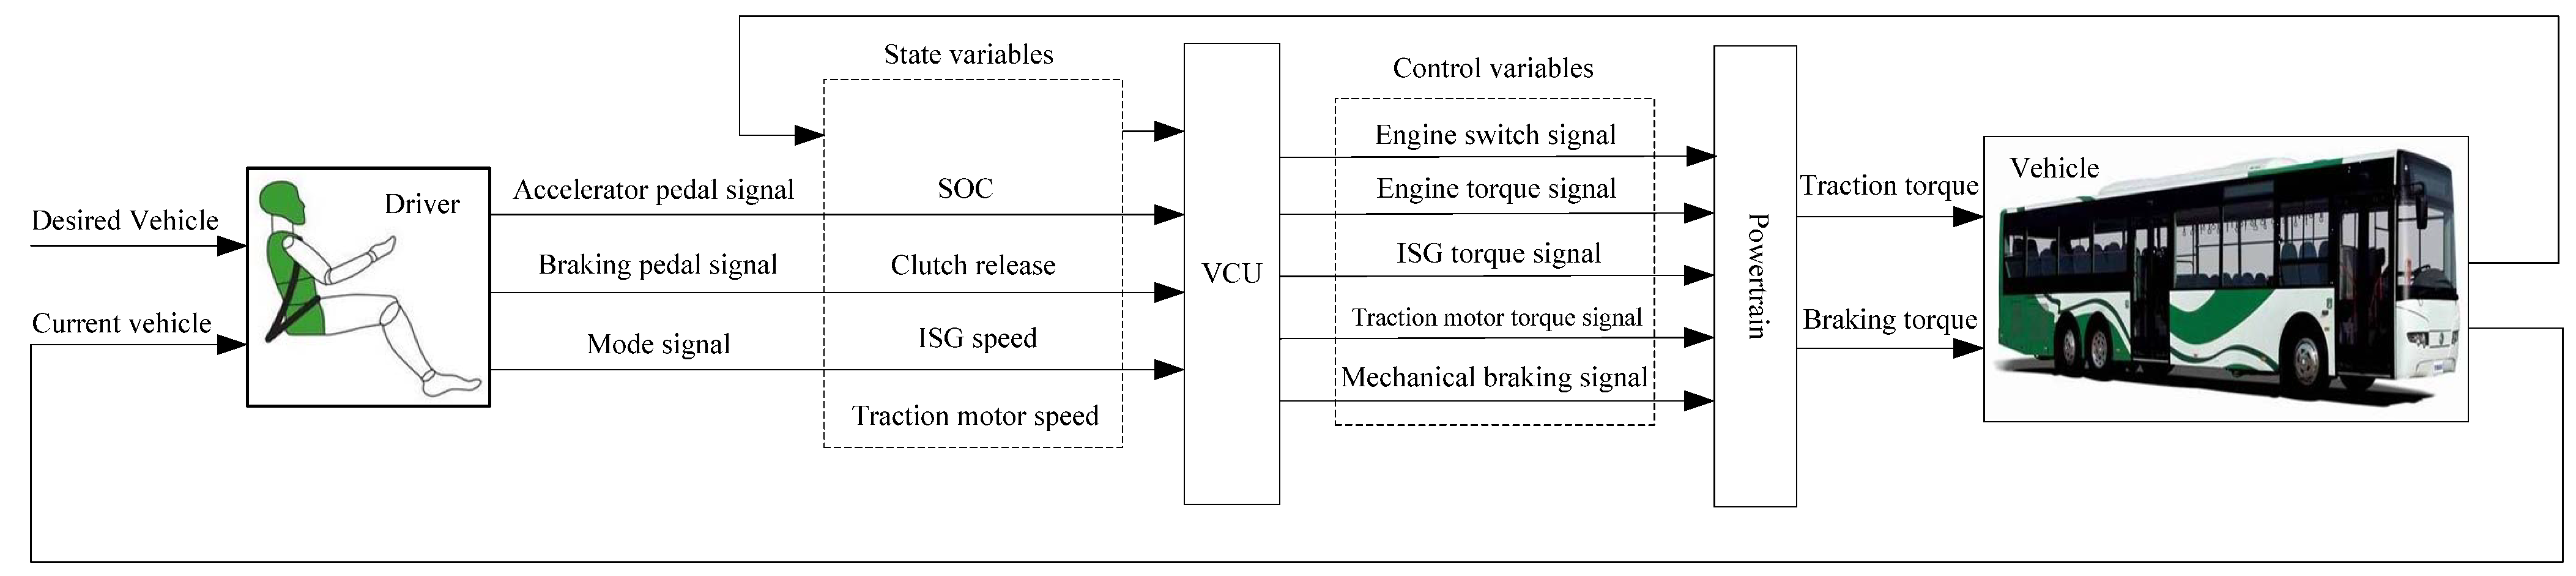
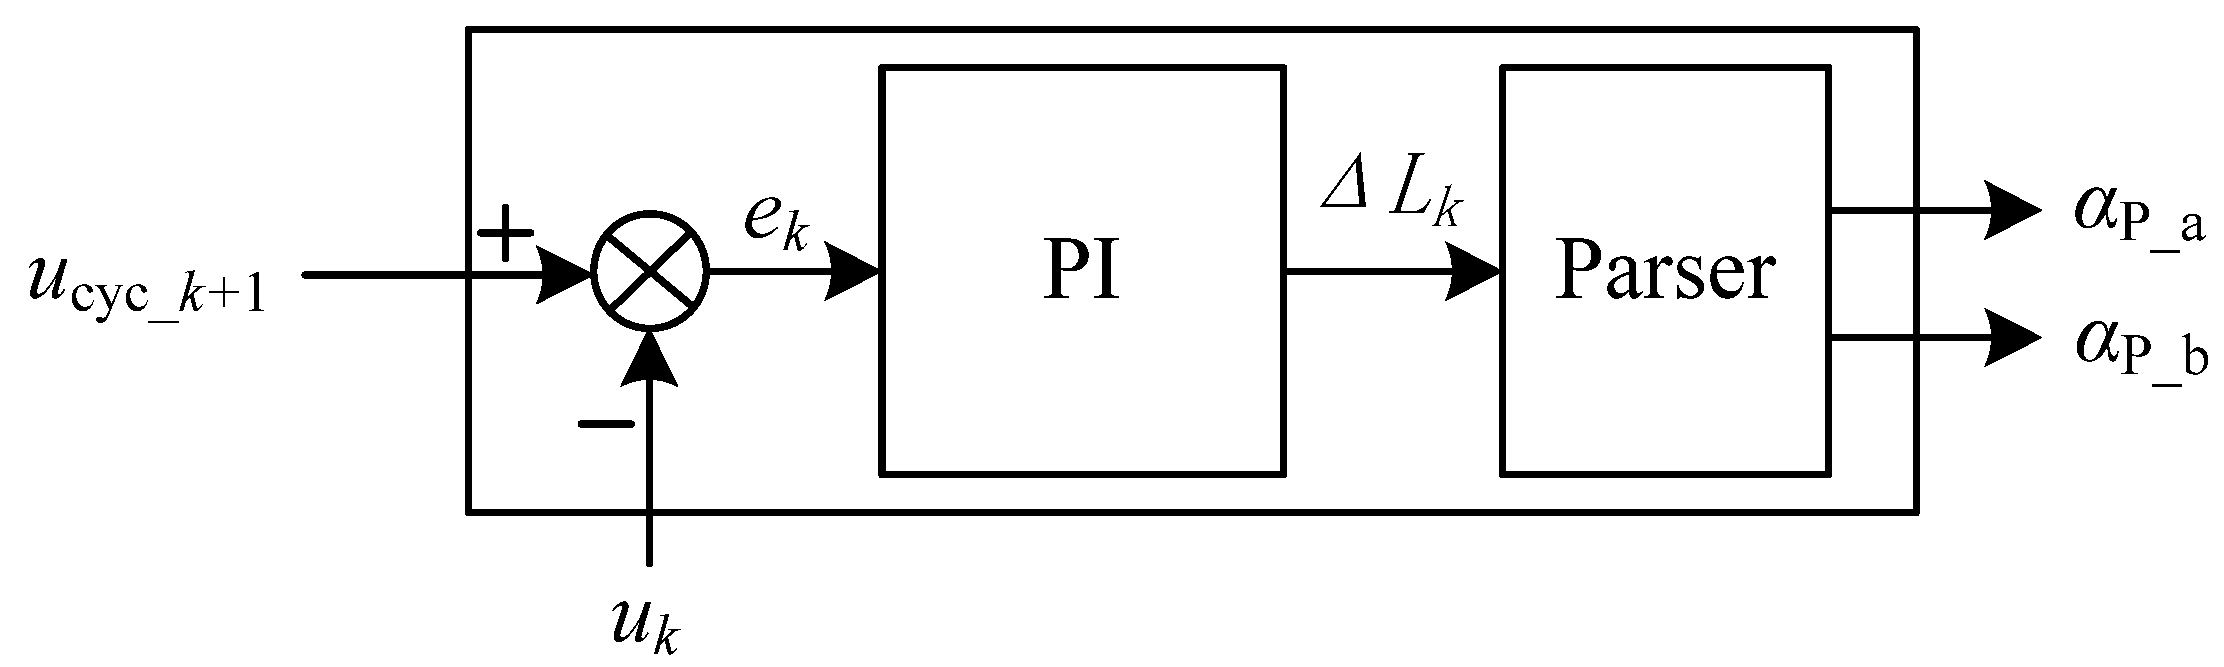
3.1. The Driver Model

The driver model is used to simulate the driver’s manipulation of the acceleration pedal and brake pedal, which essentially includes a PI controller that compares the actual velocity with the desired velocity and a parser that generates acceleration and brake commands based on the outputs from the PI controller, as shown in the Figure 3.
Figure 3. Schematic of the driver model.
Energies 06 05656 g003
In the figure e k is the velocity difference between the desired velocity and the actual velocity at the k moment, and it is defined by e k = u c y c _ k + 1 u k ; u k is the actual velocity at the k moment; u cyc _ k + 1 is the velocity at the k + 1 step in the driving cycle; Δ L k is the output of the PI controller at the k step, and it is described as Equation (1); α P_a is the acceleration command; α P_b is the brake command:
Δ L k = K P e k + K I j = 0 k e j
where K P is the scale factor; K I is the integrator factor; e j is the velocity deviation between the desired velocity and the actual velocity at the j step ( j = 0 , 1 , 2 , , k ).

3.2. The Vehicle Model
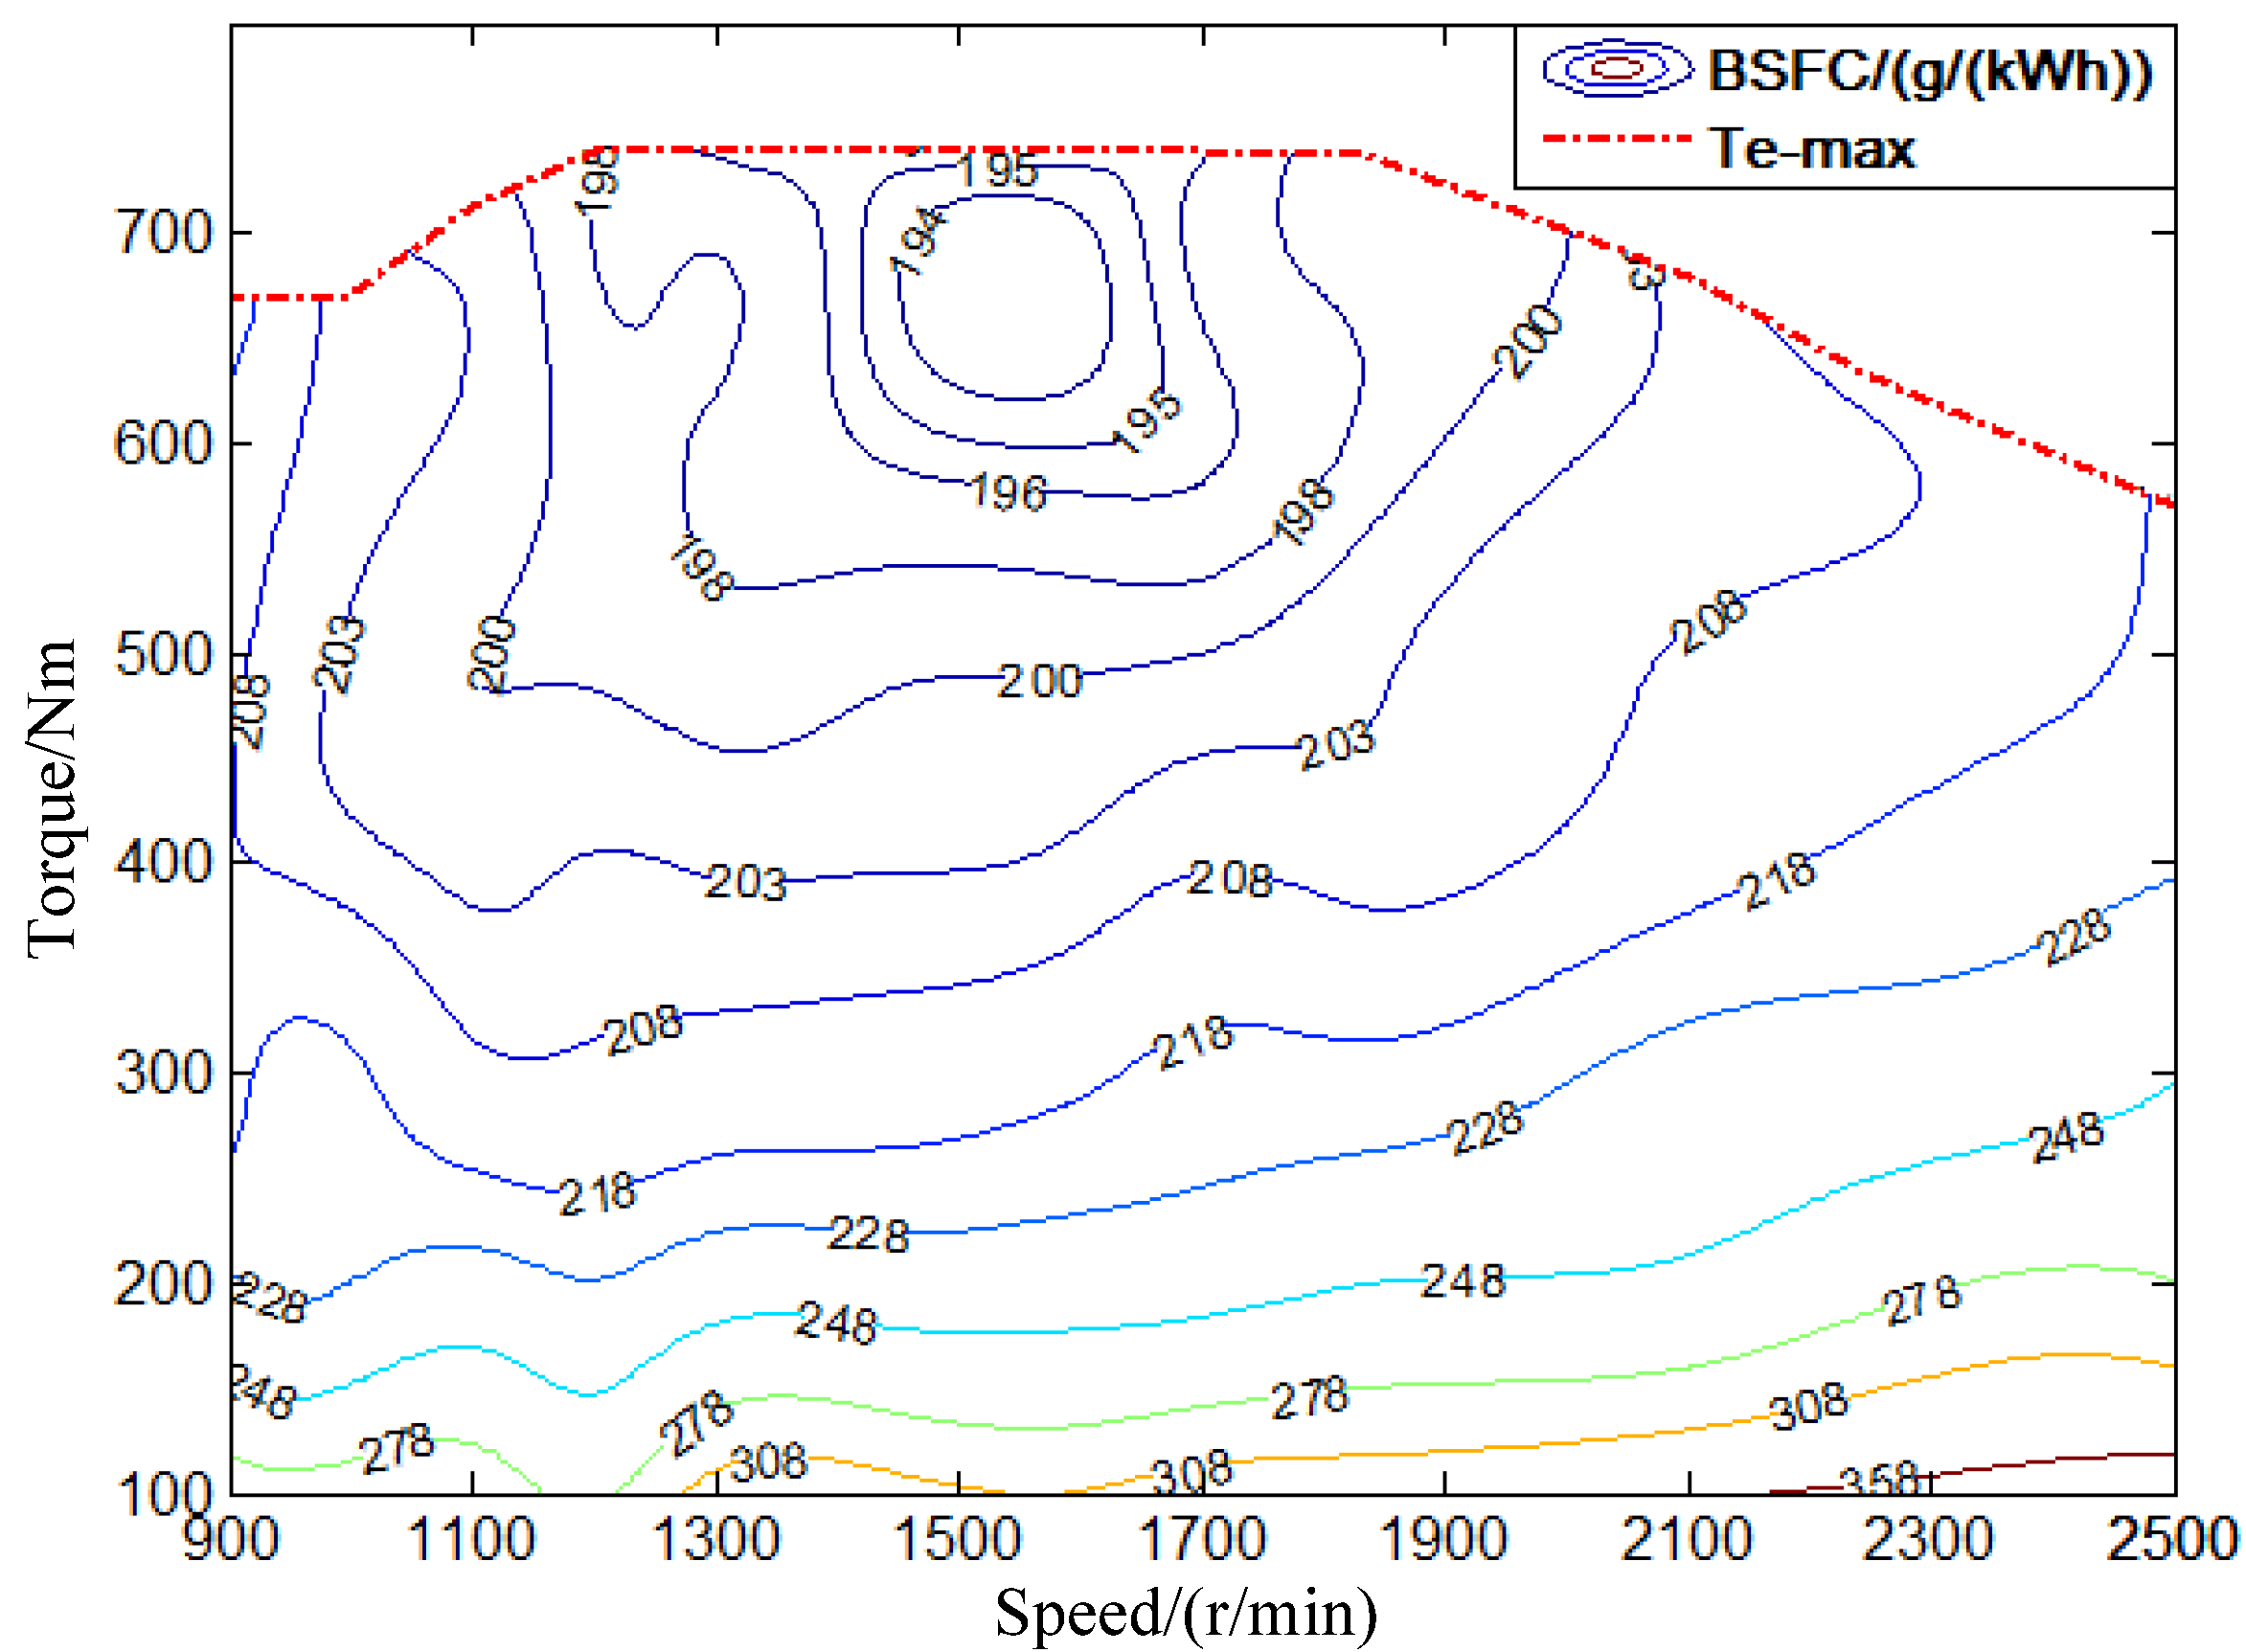
The movement behavior of a vehicle along its moving direction is completely determined by all the forces acting on it in the same direction. In the longitudinal direction, the major external forces acting on a two-axle vehicle include the rolling resistance of the front and rear tires, F f , the aerodynamic drag, F w , the climbing resistance, F i , the acceleration resistance, F j , and the tractive effort of drive wheels F d . The dynamic equation of vehicle motion along the longitudinal direction is expressed by:
F d = F f + F w + F i + F j = m g f cos α + 1 2 C D A ρ u 2 + m g sin α + δ m d u d t
where m is the vehicle gross mass; g is the gravitational acceleration; f is the rolling resistance coefficient; α is the road gradient; C D is the aerodynamic drag coefficient; A is the vehicle frontal area; ρ is the air density; u is the vehicle velocity; δ is the mass factor that equivalently converts the rotational inertias of rotating components into translational mass; d u d t is the vehicle acceleration.
The driving resistances depend on the current state of vehicle and the driver’s expectation at the next moment. During the simulation, the desired velocity at the next moment is decided by the driving cycle profile. Since the vehicle simulation system is a discrete time system, the current acceleration can be described as:
a k = u k + 1 u k t step
where u k + 1 is the desired velocity at the next moment; t step is the sampling interval.
Transforming Equation (2) to a discrete form:
m g f cos α + 1 2 C D A ρ u k 2 + m g sin α + δ m u k + 1 t step δ m u k t step F d = 0
Equation (4) can be transformed as follows:
u k + 1 = t step δ m ( F P + δ m u k t step m g f cos α 1 2 C D A ρ u k 2 m g sin α )
where u k + 1 is the achieved velocity at the k + 1 moment; F P is the propelling force delivered from the powertrain at the current moment.
At the same time, Equation (5) must meet the constraint as follows:
F P F φ = m g φ cos α
where F φ is the adhesive capability between the tire and ground; φ is tire adhesion coefficient.

3.3. ICE Model

The experimental modeling method is used to develop the ICE model in the quasi-static vehicle model without considering its dynamic characteristics. The fuel consumption map of the ICE is expressed as the relationship between the crankshaft speed and the torque by a non-linear 3-D MAP from experimental ICE data. Figure 4 shows the fuel consumption map of a 6.5 L diesel engine.
Figure 4. The ICE fuel consumption map.
Energies 06 05656 g004
Therefore, the ICE output torque T e , for the engine throttle angle θ e at the speed n e , can be approximated as follows [19]:
T e = T e ( θ e , n e ) ( 1 + δ e d ω d t )
where T e ( θ e , n e ) is the steady output torque for the engine throttle angle θ e at the speed n e , which is obtained by the interpolation function T e ( θ e , n e ) = f ( θ e , n e ) ; δ e is the torque correction factor; d ω d t is the ICE crankshaft angular acceleration.
The fuel consumption rate g e ( n e , T e ) at the operating point ( n e , T e ) is obtained by the interpolation function as follows:
g e ( n e , T e ) = f ( n e , T e )
The ICE fuel consumption V fuel is obtained with the method of the inverse calculation by:
V fuel = 1 34380000 ρ fuel k = 1 L sim n e _ k T e _ k g e ( n e _ k , T e _ k ) t step = 1 34380000 ρ fuel k = 1 L sim n e _ k T e _ k f ( n e _ k , T e _ k ) t step
where ρ fuel is the fuel density; L sim is the simulation steps obtained by L sim = T sim t step ; T sim is the simulation period; n e _ k is the ICE speed at the k step; T e _ k is the ICE output torque at the k step.

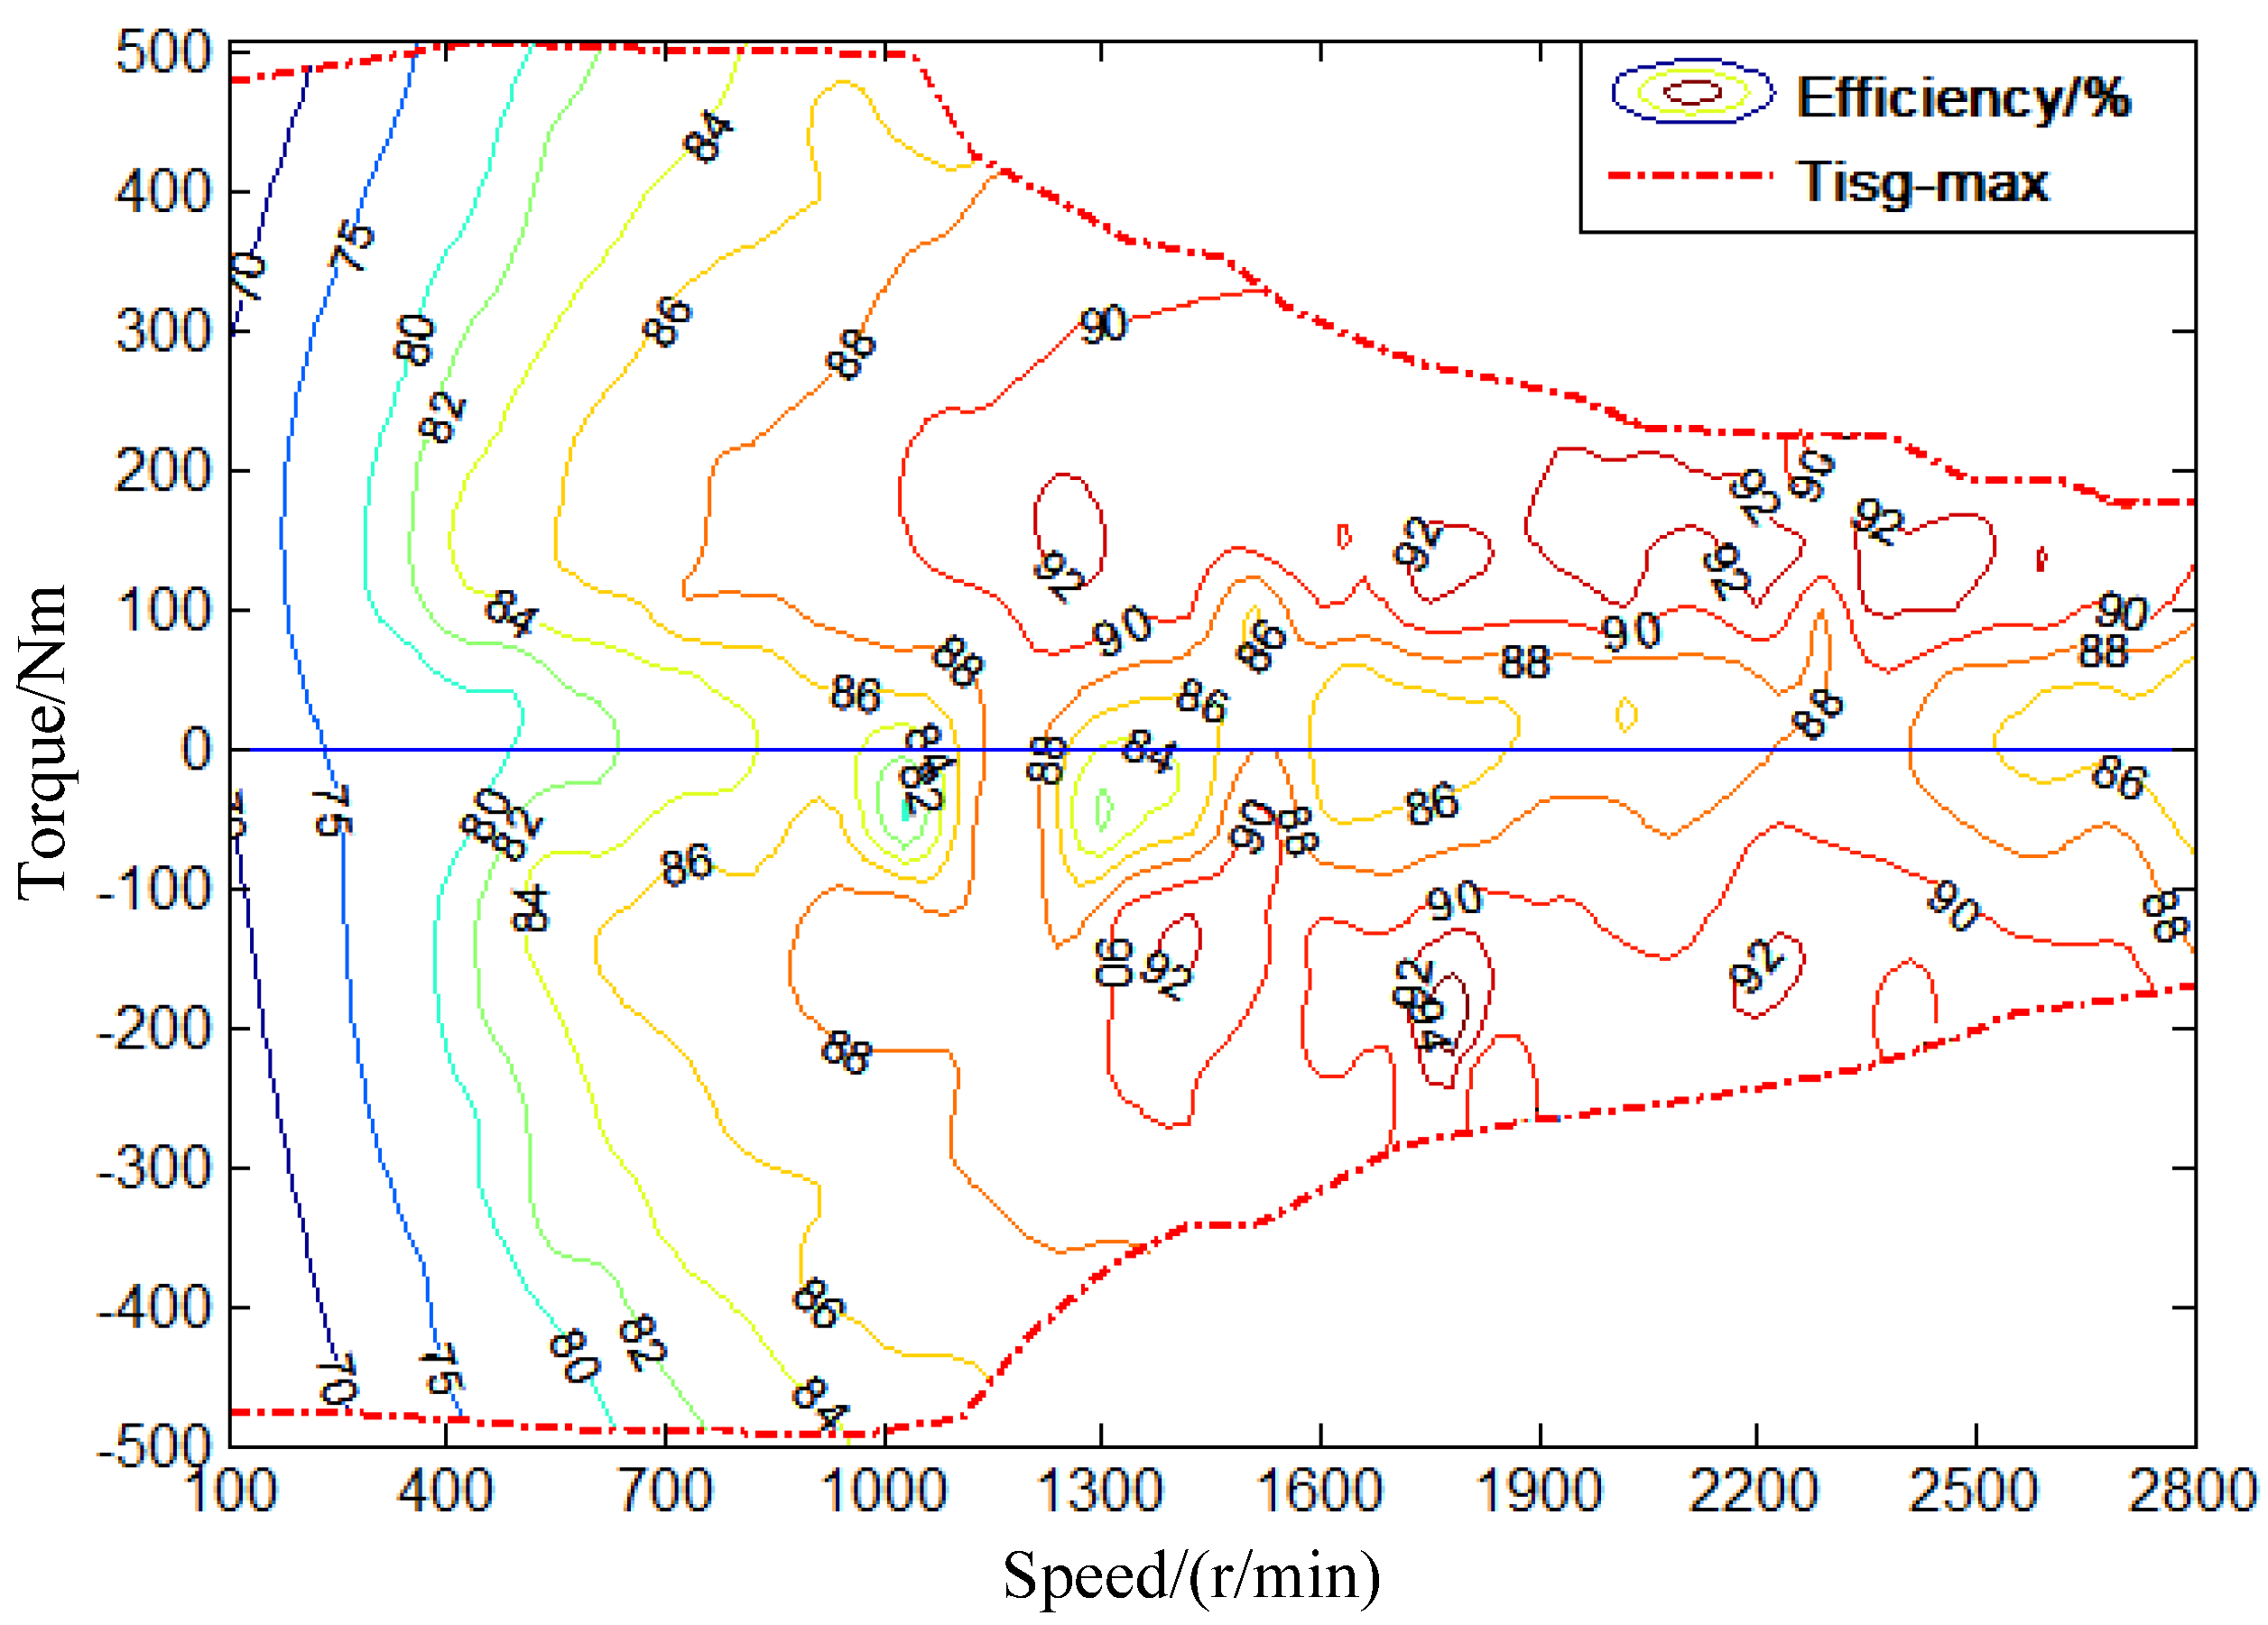
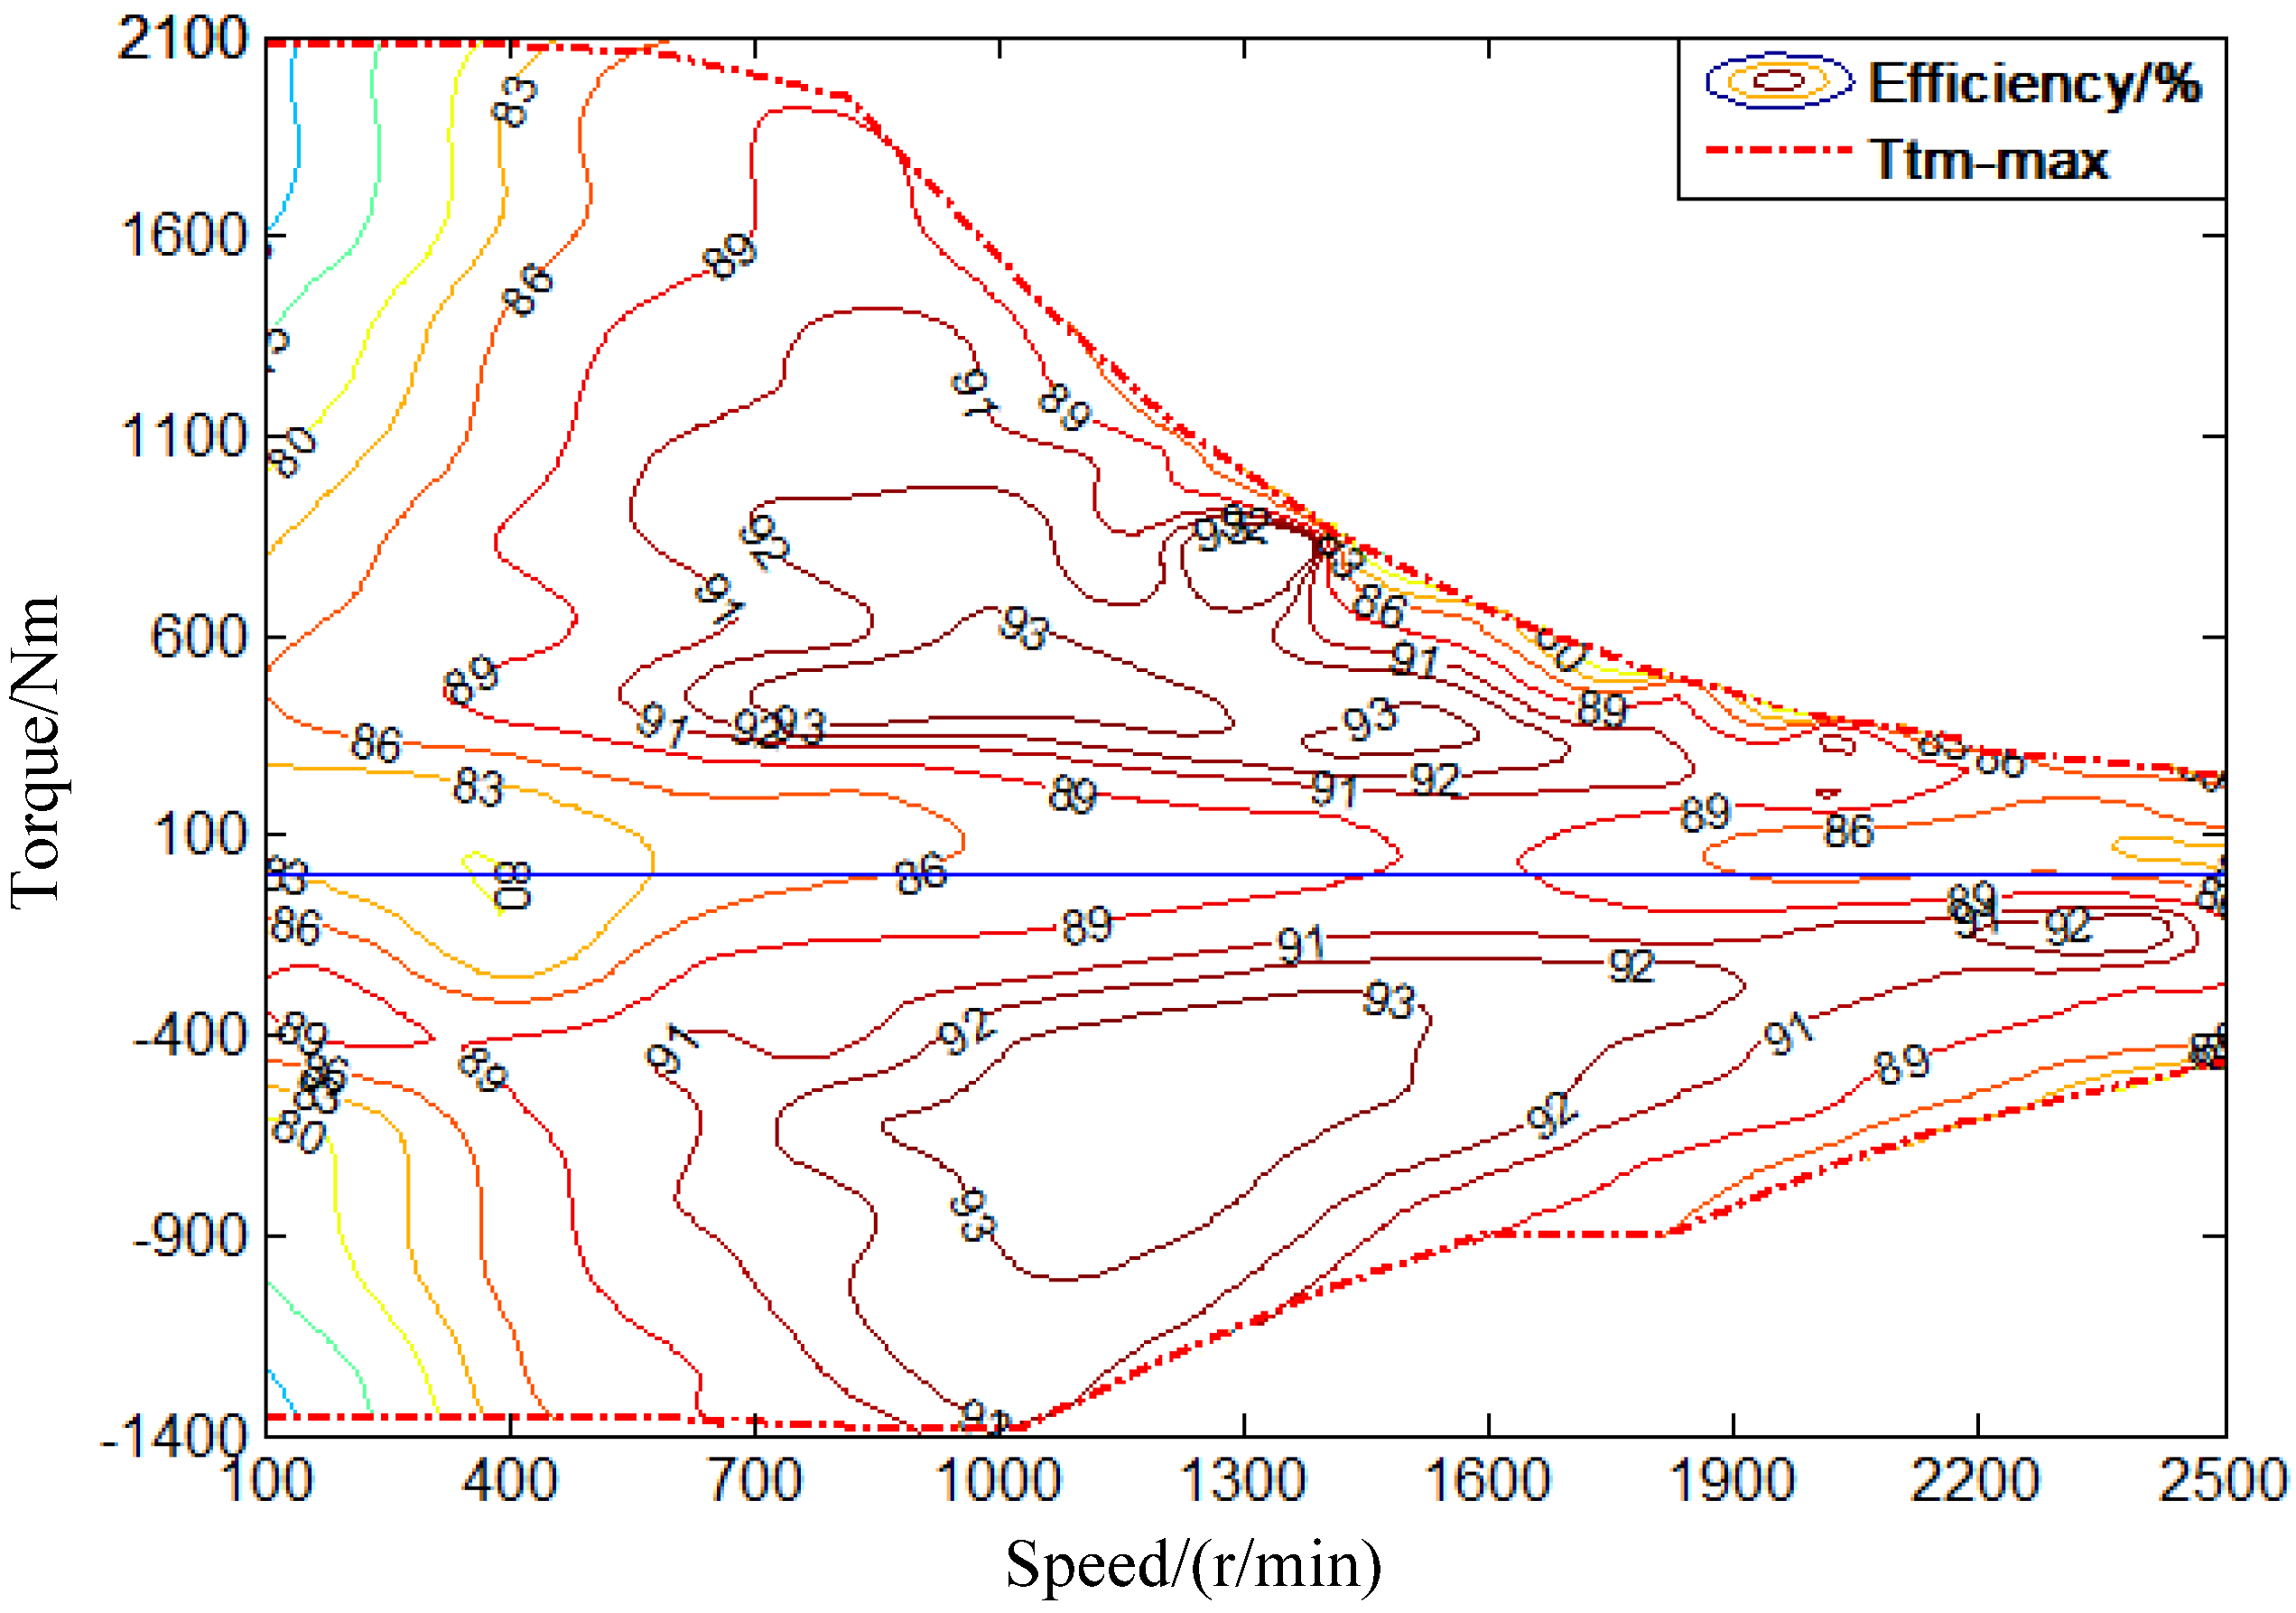
3.4. The ISG and TM Model

The experimental modeling method is also used to develop the ISG model and the TM model. Those efficiency characteristics are expressed as the relationship between the speed and the torque by a non-linear 3-D MAP from experimental data. Figure 5 shows the ISG efficiency map, and Figure 6 shows the TM efficiency map. The torque output model of motor is similar to the ICE. The motor efficiency η m ( n m , T m ) at the operating point ( n m , T m ) is obtained by the interpolation function as follows:
η m ( n m , T m ) = f ( n m , T m )
where n m is the speed of motor; T m is the motor output torque, which is defined as positive during propelling and negative during regenerative braking.
Figure 5. The ISG efficiency map.
Energies 06 05656 g005
Figure 6. The traction motor efficiency map.
Energies 06 05656 g006

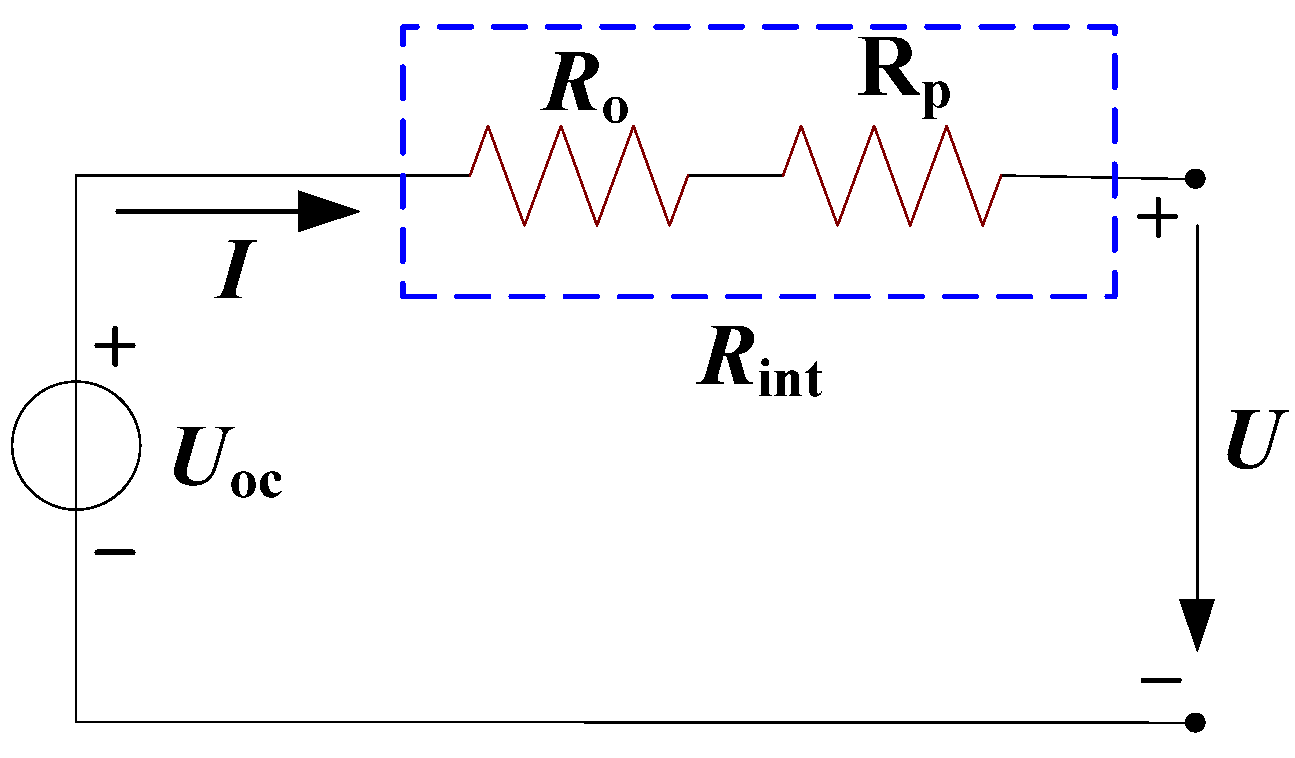
3.5. The Battery Model

The battery used is the lithium-ion type which can be modeled with a static equivalent circuit [20]. In this paper, the Rint model, based on the battery charging-discharging experimental data, is used due to its simplicity and effectiveness for lithium-ion batteries, which is shown in Figure 7.
Figure 7. The Rint battery model.
Energies 06 05656 g007
where U oc is the battery open-circuit voltage, which is a function of the SoC and the battery temperature T b and can be obtained by the interpolation function U oc = f ( S o C , T b ) ; I is the battery charging-discharging current, defined as positive during discharging and negative during charging; R int is the battery internal resistance including an ohmic resistance R o and a polarization resistance R p , which can be obtained by the interpolation function R int = f ( S o C , T b , I ) ; U is the load voltage of the battery, which can be obtained by U = U oc I R int .
Based on the equivalent circuit in Figure 7, the following equations can be obtained:
P bat = U I = ( U oc I R int ) I = U oc I I 2 R int
where P bat is the electric power provided by the battery, which is positive during discharging and negative during charging:
I = U oc U oc 2 4 R int P bat 2 R int
The first-order derivative of the battery SoC with respect to time can be expressed as follows:
d S o C d t = I C = U oc U oc 2 4 R int P bat 2 R int C
where C is the nominal capacity of the battery.
Transforming Equation (13) to a discrete form:
S o C k + 1 = S o C k U oc _ k + 1 U oc _ k + 1 2 4 R int _ k + 1 P bat _ k + 1 2 R int _ k + 1 C
where S o C k + 1 , U oc _ k + 1 , P bat _ k + 1 and R int _ k + 1 are respectively the SoC, open-circuit voltage, electric power and internal resistance of the battery at the k + 1 step; S o C k is the battery SoC at the k step.
In addition, the electric power of the battery is decided by the ISG and the TM as the follows equation:
P bat = 1 9550 [ sgn ( T ISG ) T ISG n ISG η ISG sgn ( T ISG ) + sgn ( T TM ) T TM n TM η TM sgn ( T TM ) ]
where T ISG , n ISG and η ISG are respectively the output torque, speed and working efficiency of the ISG; T TM , n TM and η TM are respectively the output torque, speed and working efficiency of the TM.
Therefore, using Equations (14) and (15), S o C k + 1 can be expressed as follows:
S o C k + 1 = S o C k U oc _ k + 1 U oc _ k + 1 2 4 R int _ k + 1 9550 [ sgn ( T ISG _ k + 1 ) T ISG _ k + 1 n ISG _ k + 1 η ISG _ k + 1 sgn ( T ISG _ k + 1 ) + sgn ( T TM _ k + 1 ) T TM _ k + 1 n TM _ k + 1 η TM _ k + 1 sgn ( T TM ) ] 2 R int _ k + 1 C
The electricity consumption Q is obtained by:
Q = 1 3600 k = 1 L sim P bat _ k t step η bat _ k
where P bat _ k is the electric power provided by the battery at the k step; η bat _ k is the charging-discharging efficiency of the battery at the k step, which is obtained by the interpolation function η bat = f ( S o C , I , T b ) .

4. The PHEB Energy Management Strategy

Based on the purpose of online real-time energy management rather than focusing on the vehicle’s dynamics, the corresponding models concentrate on fuel consumption characteristics and energy efficiency [12,20]. Three energy management strategies for the PHEB based on the logical threshold control are developed and compared instead of using certain complex algorithms, which is not implementable onboard due to the resulting heavy computational burden.
An overview of the vehicle control system for the aforementioned PHEB is shown in Figure 8. The position of the acceleration pedal and the brake pedal reflect the driver’s power demand at the vehicle’s wheels, which are determined by the current velocity and the driver’s desired velocity, and the driver’s other expectation is reflected by the working mode selection. The VCU outputs the control signals of the powertrain components, which control the powertrain to operate efficiently according to the control algorithm proposed hereafter, based on the driver’s manipulation and the vehicle state variables such as the battery SoC, the clutch state, the ISG speed and the TM speed.
Figure 8. Schematic of the vehicle control system.
Energies 06 05656 g008

4.1. Power Flow Analysis

The PHEV fuel economy depends deeply on its energy management strategy, especially the electric energy usage, determined by the SoC profile of the battery during the entire trip. The power of the TM and the battery in the PHEB are enough to drive the bus alone and the capacity of the battery is sufficient to allow the PHEB driving in the PED mode for a given distance. Usually, based on the battery SoC profile, a PHEV’s energy management strategy can be classified as three basic operation modes as PED, HDCD and HDCS as shown in Figure 9. The decreasing rate of the battery SoC in the PED mode is faster than that in the HDCD mode while the battery SoC in the HDCS mode sustains in a preset range.
Figure 9. Comparison of SoC profiles for different modes.
Energies 06 05656 g009

4.1.1. Pure Electric Driving Mode

In the PED mode, the vehicle can use the renewable electric energy source and thus causes no fossil fuel consumption and no emissions. The TM supplies all the vehicle driving torque and a certain percent of braking torque which is a function of the battery SoC and the vehicle velocity. All the energy demand of the vehicle is provided by the battery recharged from the power grid while the ICE and ISG are switched off. Therefore, the clutch state is disengaged, which is formulated as S clu = 1 , while S clu = 0 if the clutch is engaged, and the ICE working state is off which is formulated as S eng = 0 , while S eng = 1 if the ICE is switched on . The equations describing the torque balance in the PED mode are provided as follows:
{ T e = 0 T ISG = 0 T TM = { T req i f T req 0 0 i f T req < 0
where T ISG is the torque provided by the ISG; T TM is the torque provided by the TM; T req is the torque demand of the vehicle.

4.1.2. Hybrid Driving Charge Depleting Mode

In the HDCD mode, the power demand of the vehicle is provided by the ICE and battery together while the ISG is turned off. The battery SoC decreases along the entire trip with a slower rate than that in the PED mode. The TM supplies the main driving torque and assists the mechanical braking system, and the ICE is switched on when the ICE working speed corresponding to the vehicle velocity flows in the high-efficient working area, which can be determined by:
S eng = { 0 i f S clu = 1 1 i f n TM n eng_on & S clu = 0 0 i f n TM < n eng_off & S clu = 0 1 i f n eng_off n TM < n eng_on & S eng - = 1 & S clu = 0 0 i f n eng_off n TM < n eng_on & S eng - = 0 & S clu = 0
where n TM is the speed of the TM; n eng_on is the threshold at which the ICE is switched on; n eng_off is the threshold at which the ICE is switched off; S eng - is the ICE working state at the former moment.
The clutch state is determined by:
S clu = { 0 i f n TM n clu_on 1 i f n TM < 0.9 n clu_on 0 i f 0.9 n clu_on n TM < n clu_on & S clu - = 0 1 i f 0.9 n clu_on n TM < n clu_on & S clu - = 1
where n clu_on is the threshold at which the clutch engages; S clu - is the clutch state at the former moment.
The equations describing the torque balance in the HDCD mode are listed as follows:
Energies 06 05656 i001
where T eng_threshold_opt_min and T eng_threshold_opt_max are the lower and upper limit of the ICE optimal operating area respectively; f ( n TM , S o C ) is the function of the n TM and the battery S o C .

4.1.3. Hybrid Driving Charge Sustaining Mode

In the HDCS mode, the ICE, the ISG and the TM are coordinated to work to make the powertrain perform efficiently. In addition, the battery SoC sustains in a preset range, which is similar to HEVs. The ICE provides main power and the battery serves as a peak power regulation unit to maximize the powertrain efficiency. The clutch state in this mode can be determined by Equation (20) and the ICE working state is determined by:
S eng = { 0 i f S o C > S o C eng_on & S clu = 1 1 i f S o C ( S o C eng_on 0.05 ) & S clu = 1 0 i f ( S o C eng_on 0.05 ) < S o C S o C eng_on & S eng - = 0 & S clu = 1 1 i f ( S o C eng_on 0.05 ) < S o C S o C eng_on & S eng - = 1 & S clu = 1 1 i f S clu = 0
where S o C eng_on is the threshold at when the ICE is switched on.
The torque balance in the HDCD mode is described as follows:
Energies 06 05656 i002
where f ( n TM ) is the function describing the relationship between the T TM and the n TM .

4.2. Energy Management Strategy

The battery capacity in a PHEV is larger than that in a HEV, and the battery allowable SoC working range in a PHEV is much broader than that in a HEV. As a result, a large amount of the onboard energy recharged from the external energy source is available to optimize the ICE and replace fossil fuels. It is desired that the battery SoC decrease monotonely along the entire trip and the battery available energy is just exhausted at the terminal of the trip. The global optimization algorithm, such as dynamic programming, can provide the best benchmark achievable with the assumption that the total trip distance and the detailed information of the driving cycle are previously known [14]. However, the trip distance and the detailed information of the driving cycle are always difficult to know precisely, even when modern vehicular navigation systems are utilized. To solve such problem, three different energy management strategies, which are combined with two or three of the basic operation modes discussed in Section 4.1, will be comparatively examined in the following.

4.2.1. PED + HDCS Strategy

The PED + HDCS strategy is combined with the PED and HDCS operation modes. During the first part of the trip, the PHEV drives with the PED mode assuming that the battery is fully charged. When the battery SoC decreases and reaches the preset value, the PHEV drives with the HDCS mode until the end of the trip.

4.2.2. HDCD + HDCS Strategy

The HDCD + HDCS strategy is combined with the HDCD and HDCS basic operation modes. In the first part of the trip, the PHEV with the fully charged battery pack operates with the HDCD mode. When the battery SoC reduces to the predetermined value, the PHEV turns to operate with the HDCS mode until the end of the trip.

4.2.3. PED + HDCD + HDCS Strategy

The PED + HDCD + HDCS strategy is combined with the PED, the HDCD and HDCS basic operation modes. The PHEV with the fully charged battery pack works in three stages, firstly, the PHEV starts with PED mode. When the battery SoC declines to a certain predetermined value, the PHEV switches to operate in the HDCD mode. After the battery SoC decreases further and reaches the other threshold, the PHEV would turn to operate with the HDCS mode until the end of the trip.

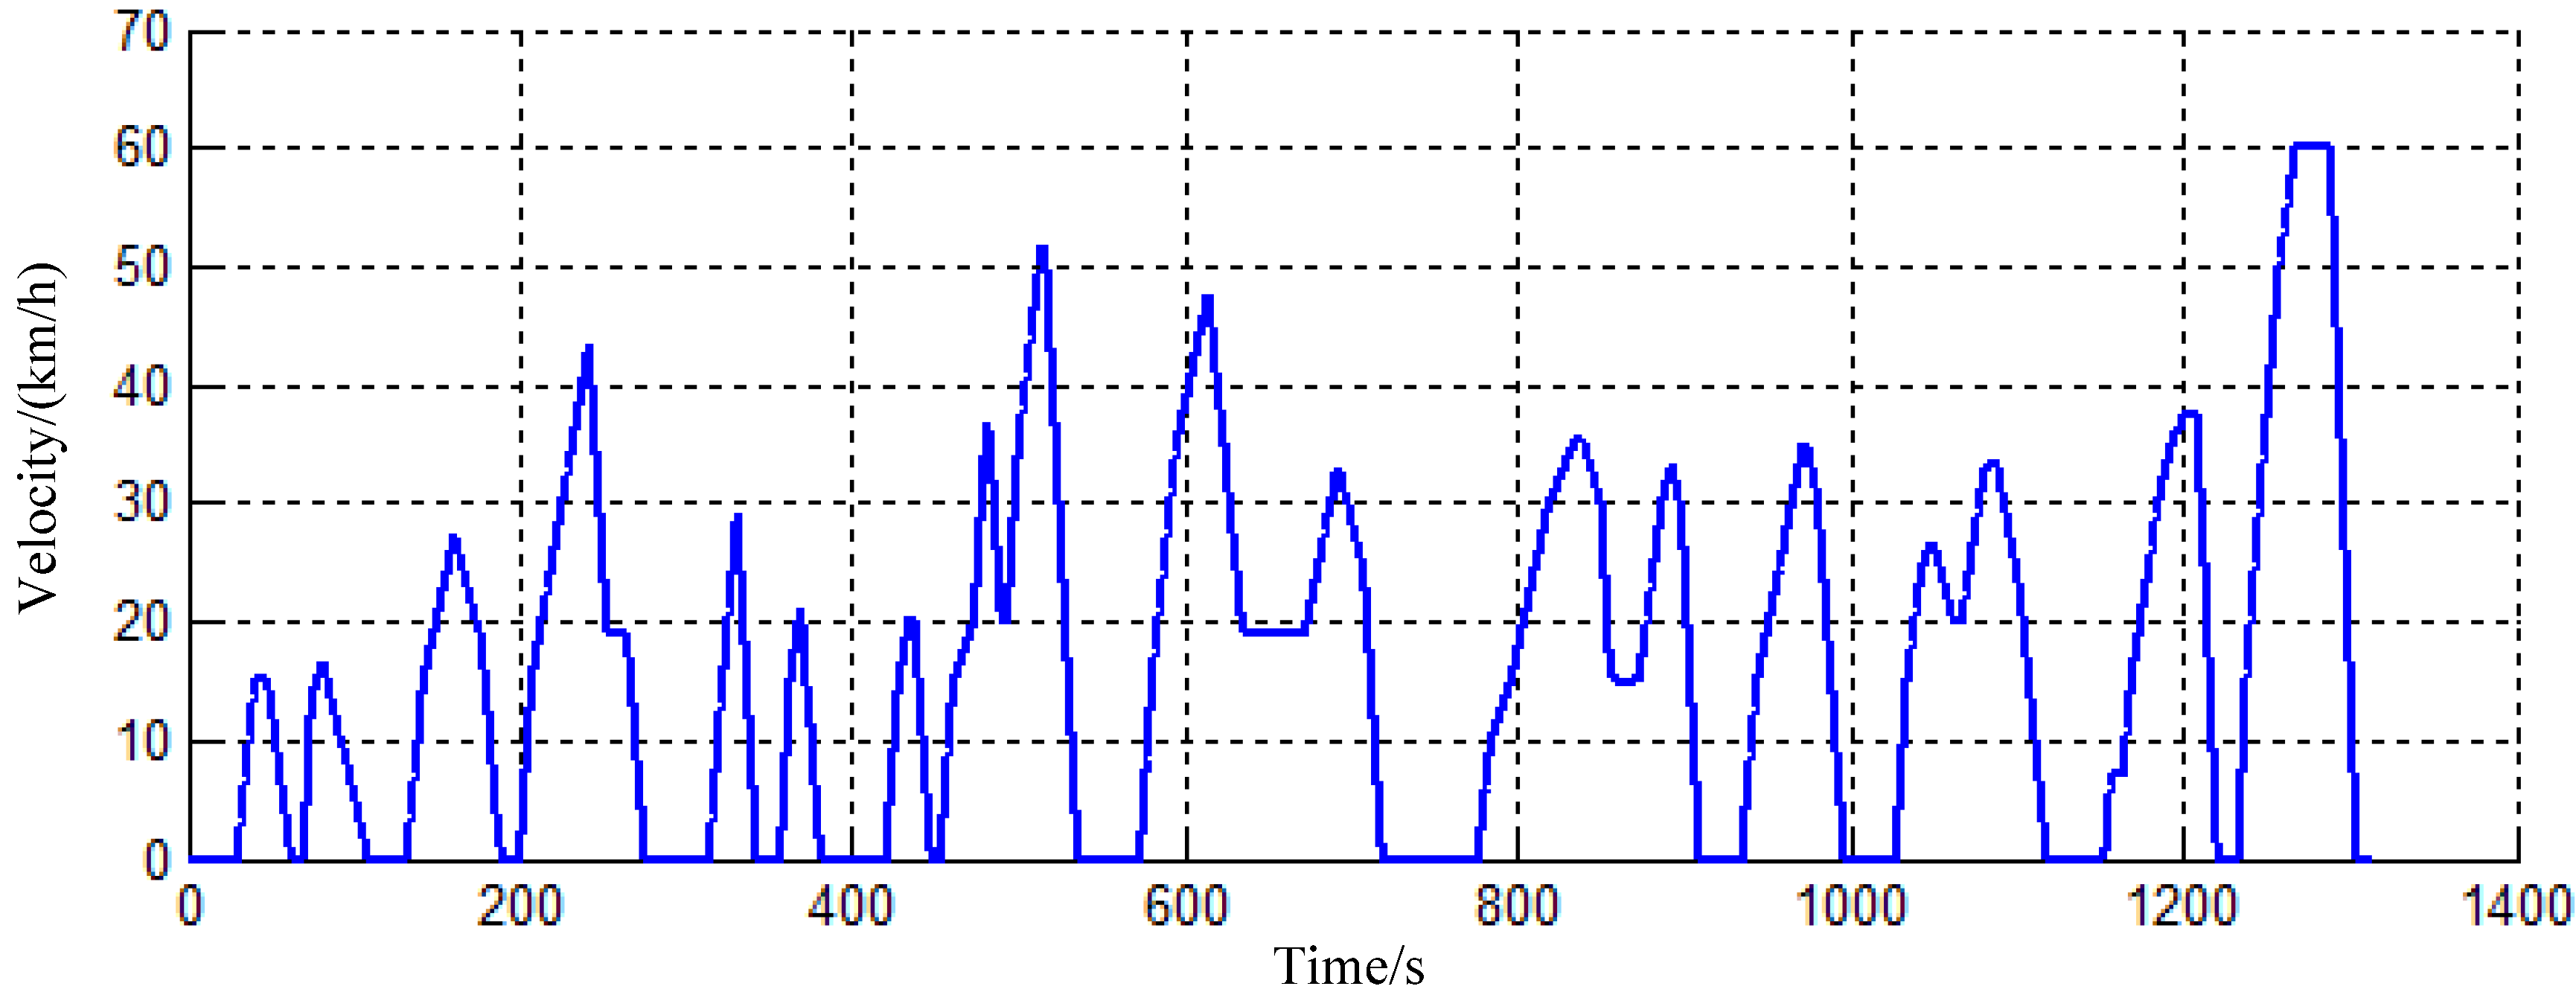
5. Simulation Experiments and Discussions

To ensure fairness in the comparison of the three energy management strategies, the algorithm of the same basic operation mode in different strategies and the driving cycle used in simulation experiments are identical [21]. Here, the Chinese Standard Urban Driving Cycle (CSUDC), which is shown in Figure 10, is selected. It is noted that the driving cycle with a longer distance is attained by successively repeating the same driving cycle.
Figure 10. The velocity profile of the CSUDC cycle.
Energies 06 05656 g010

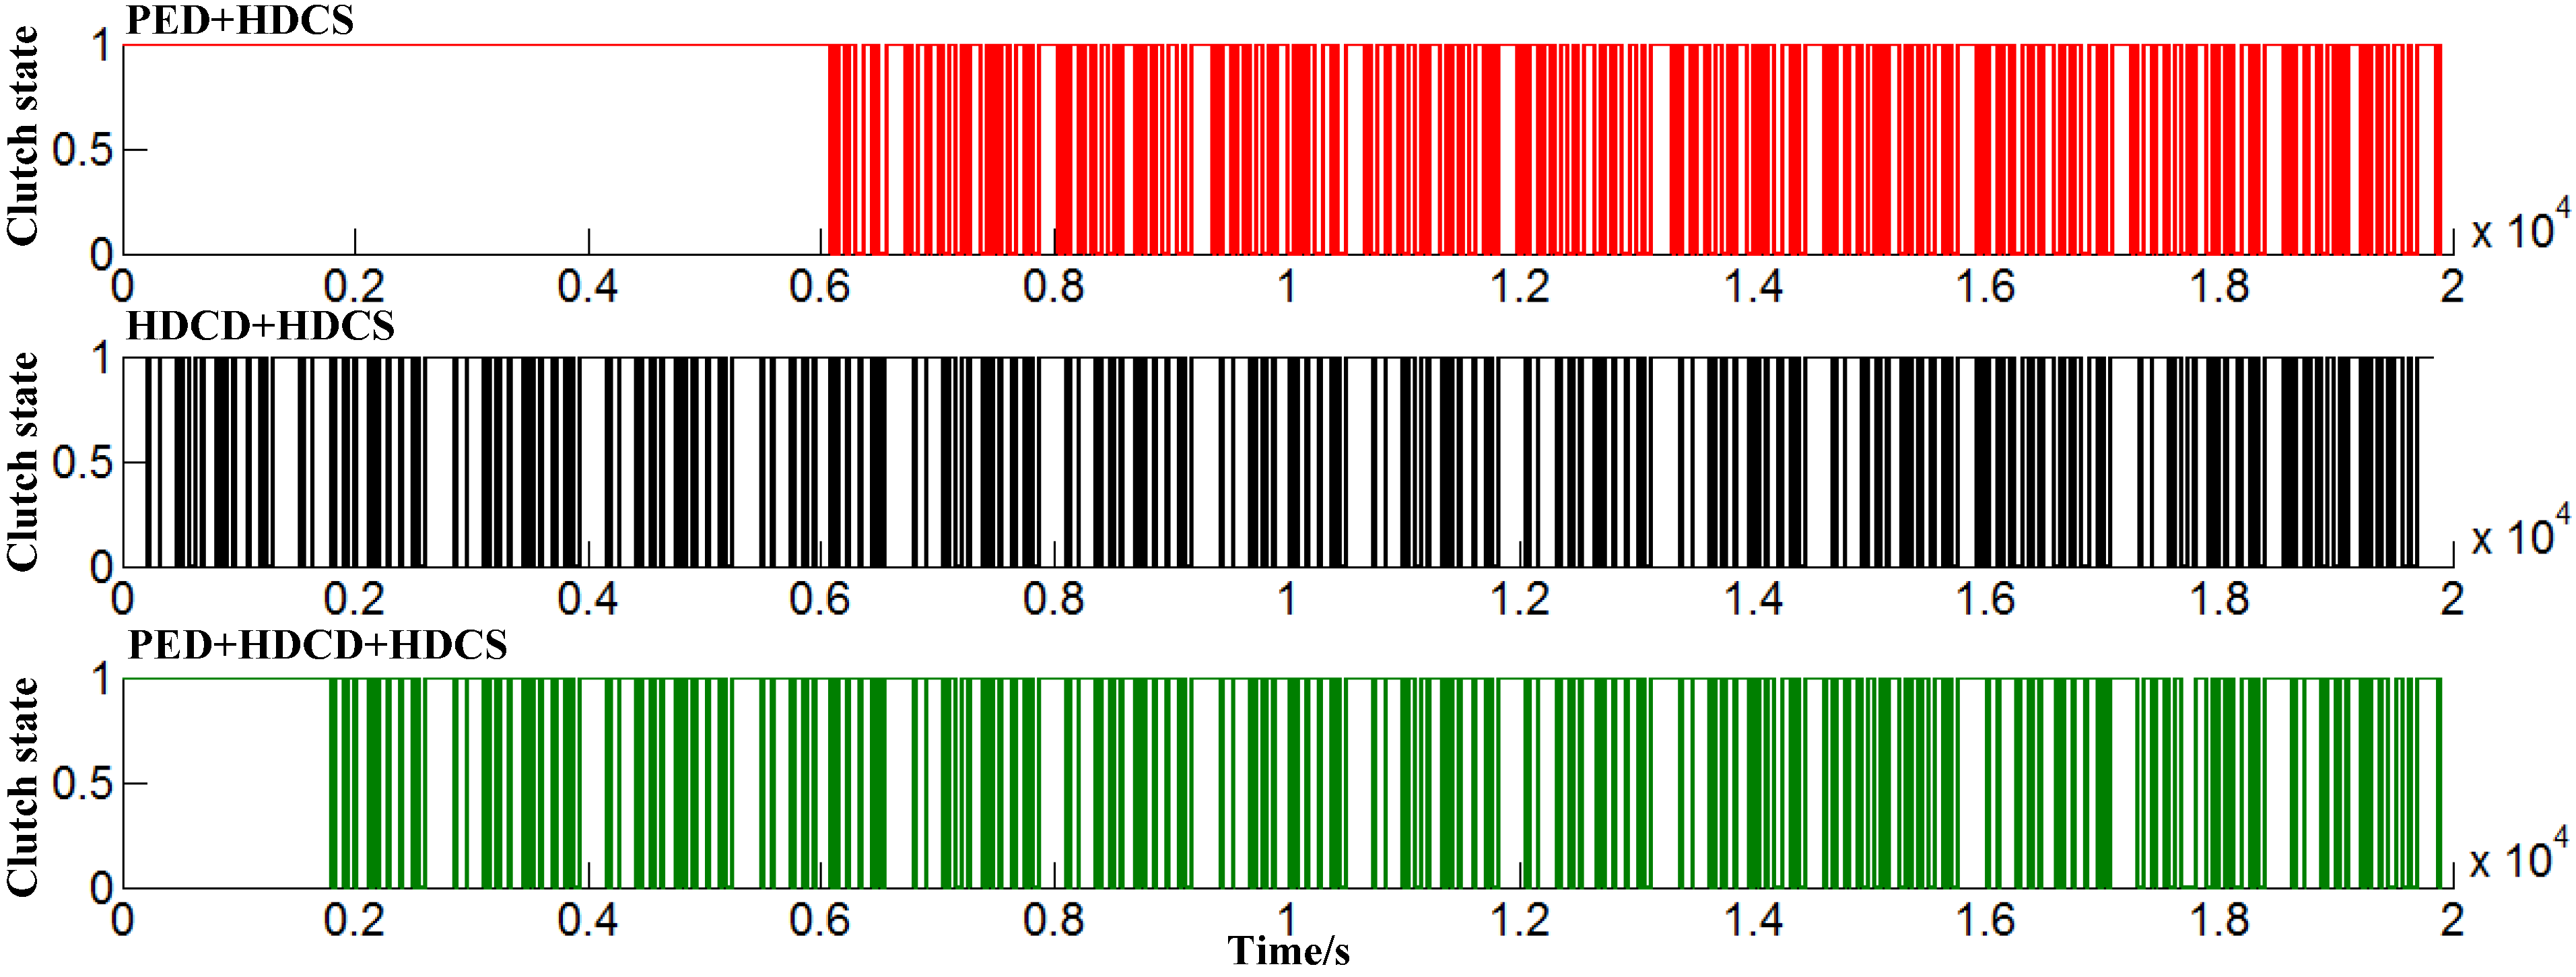
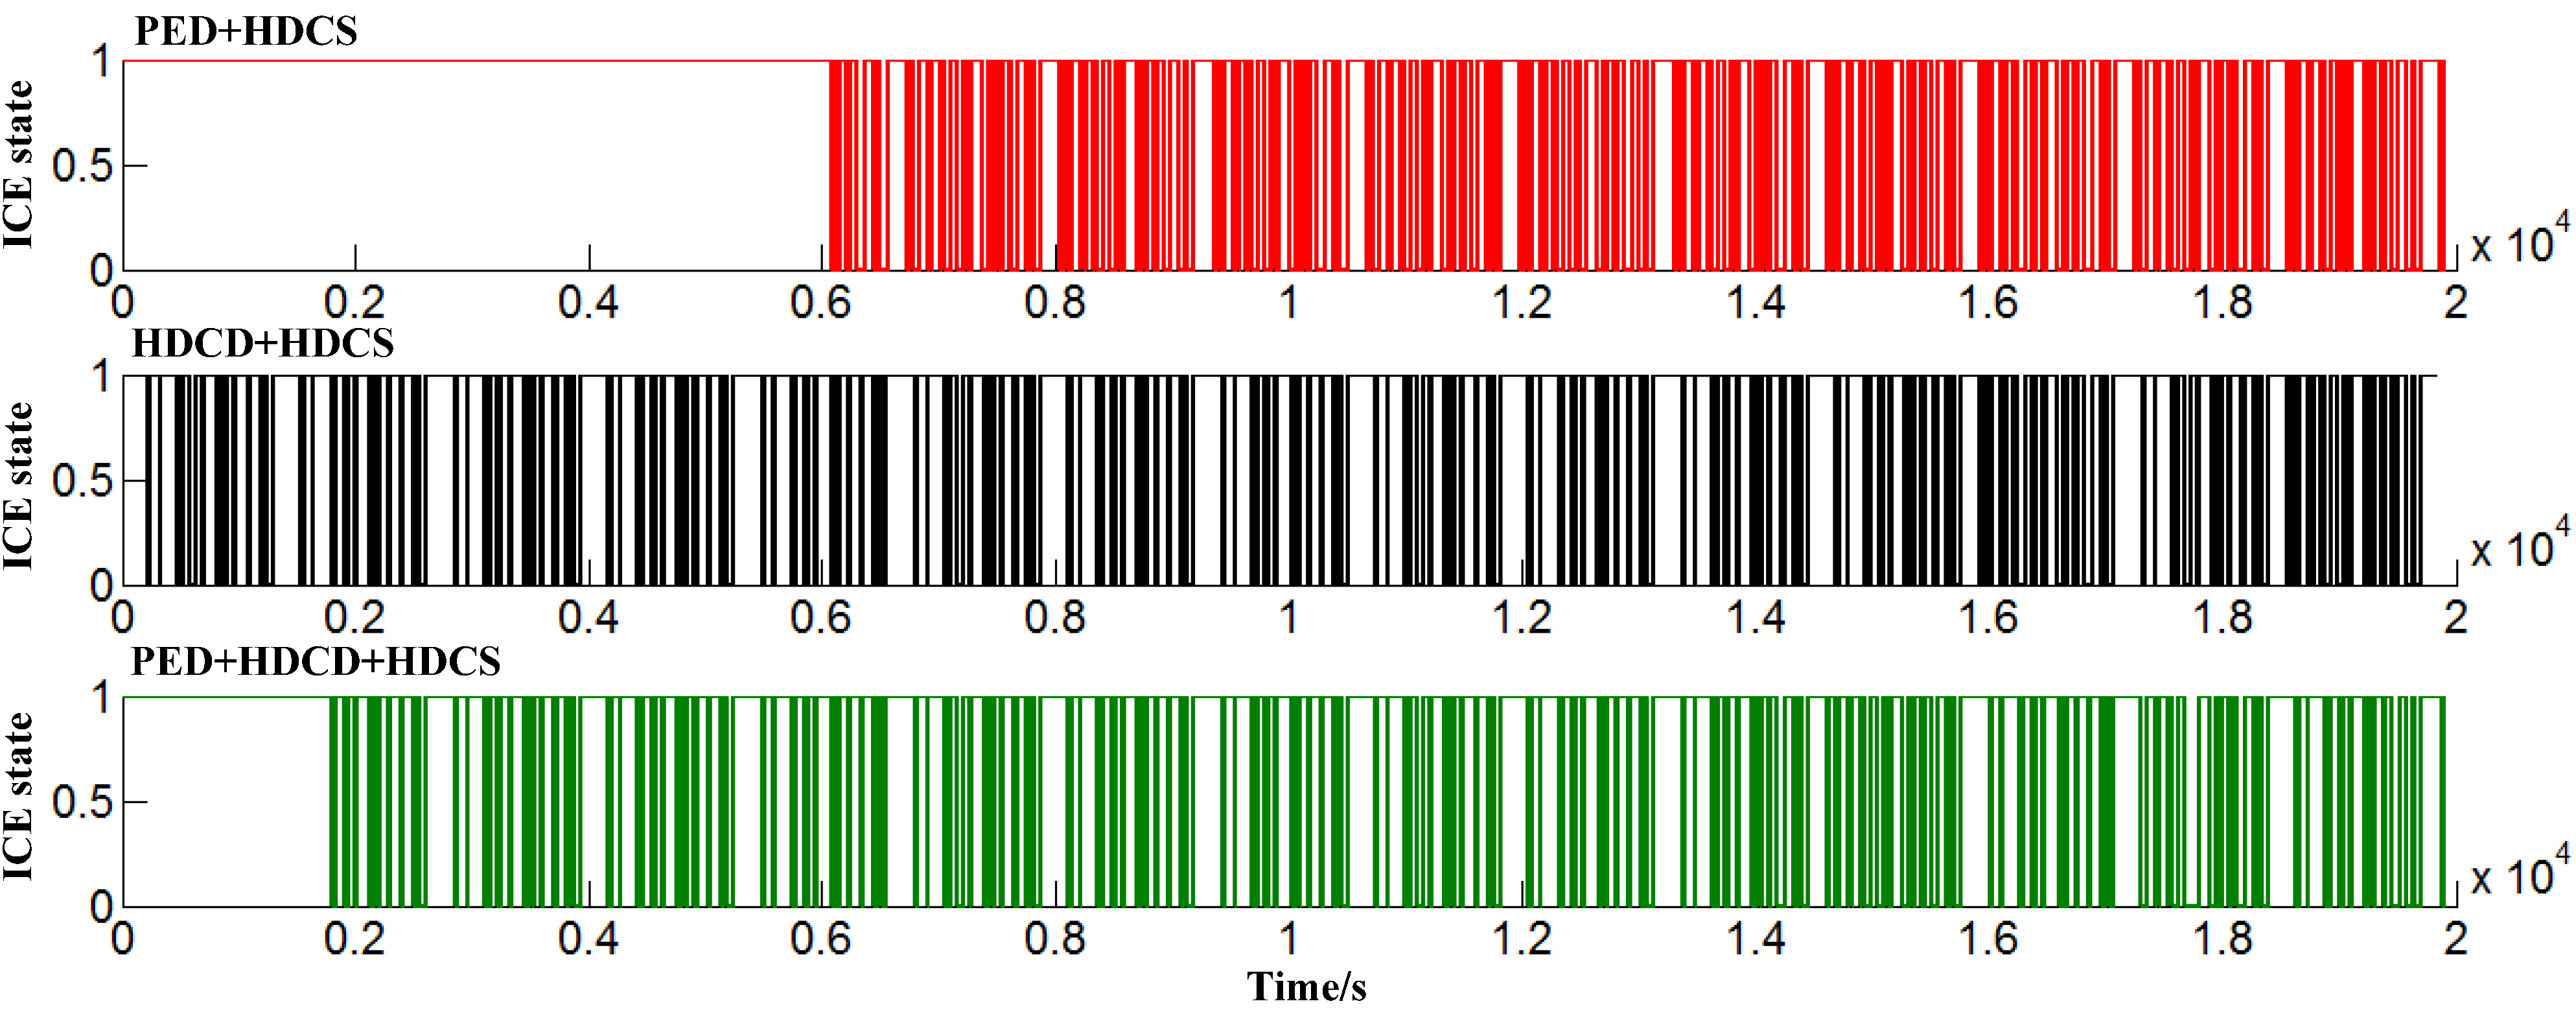
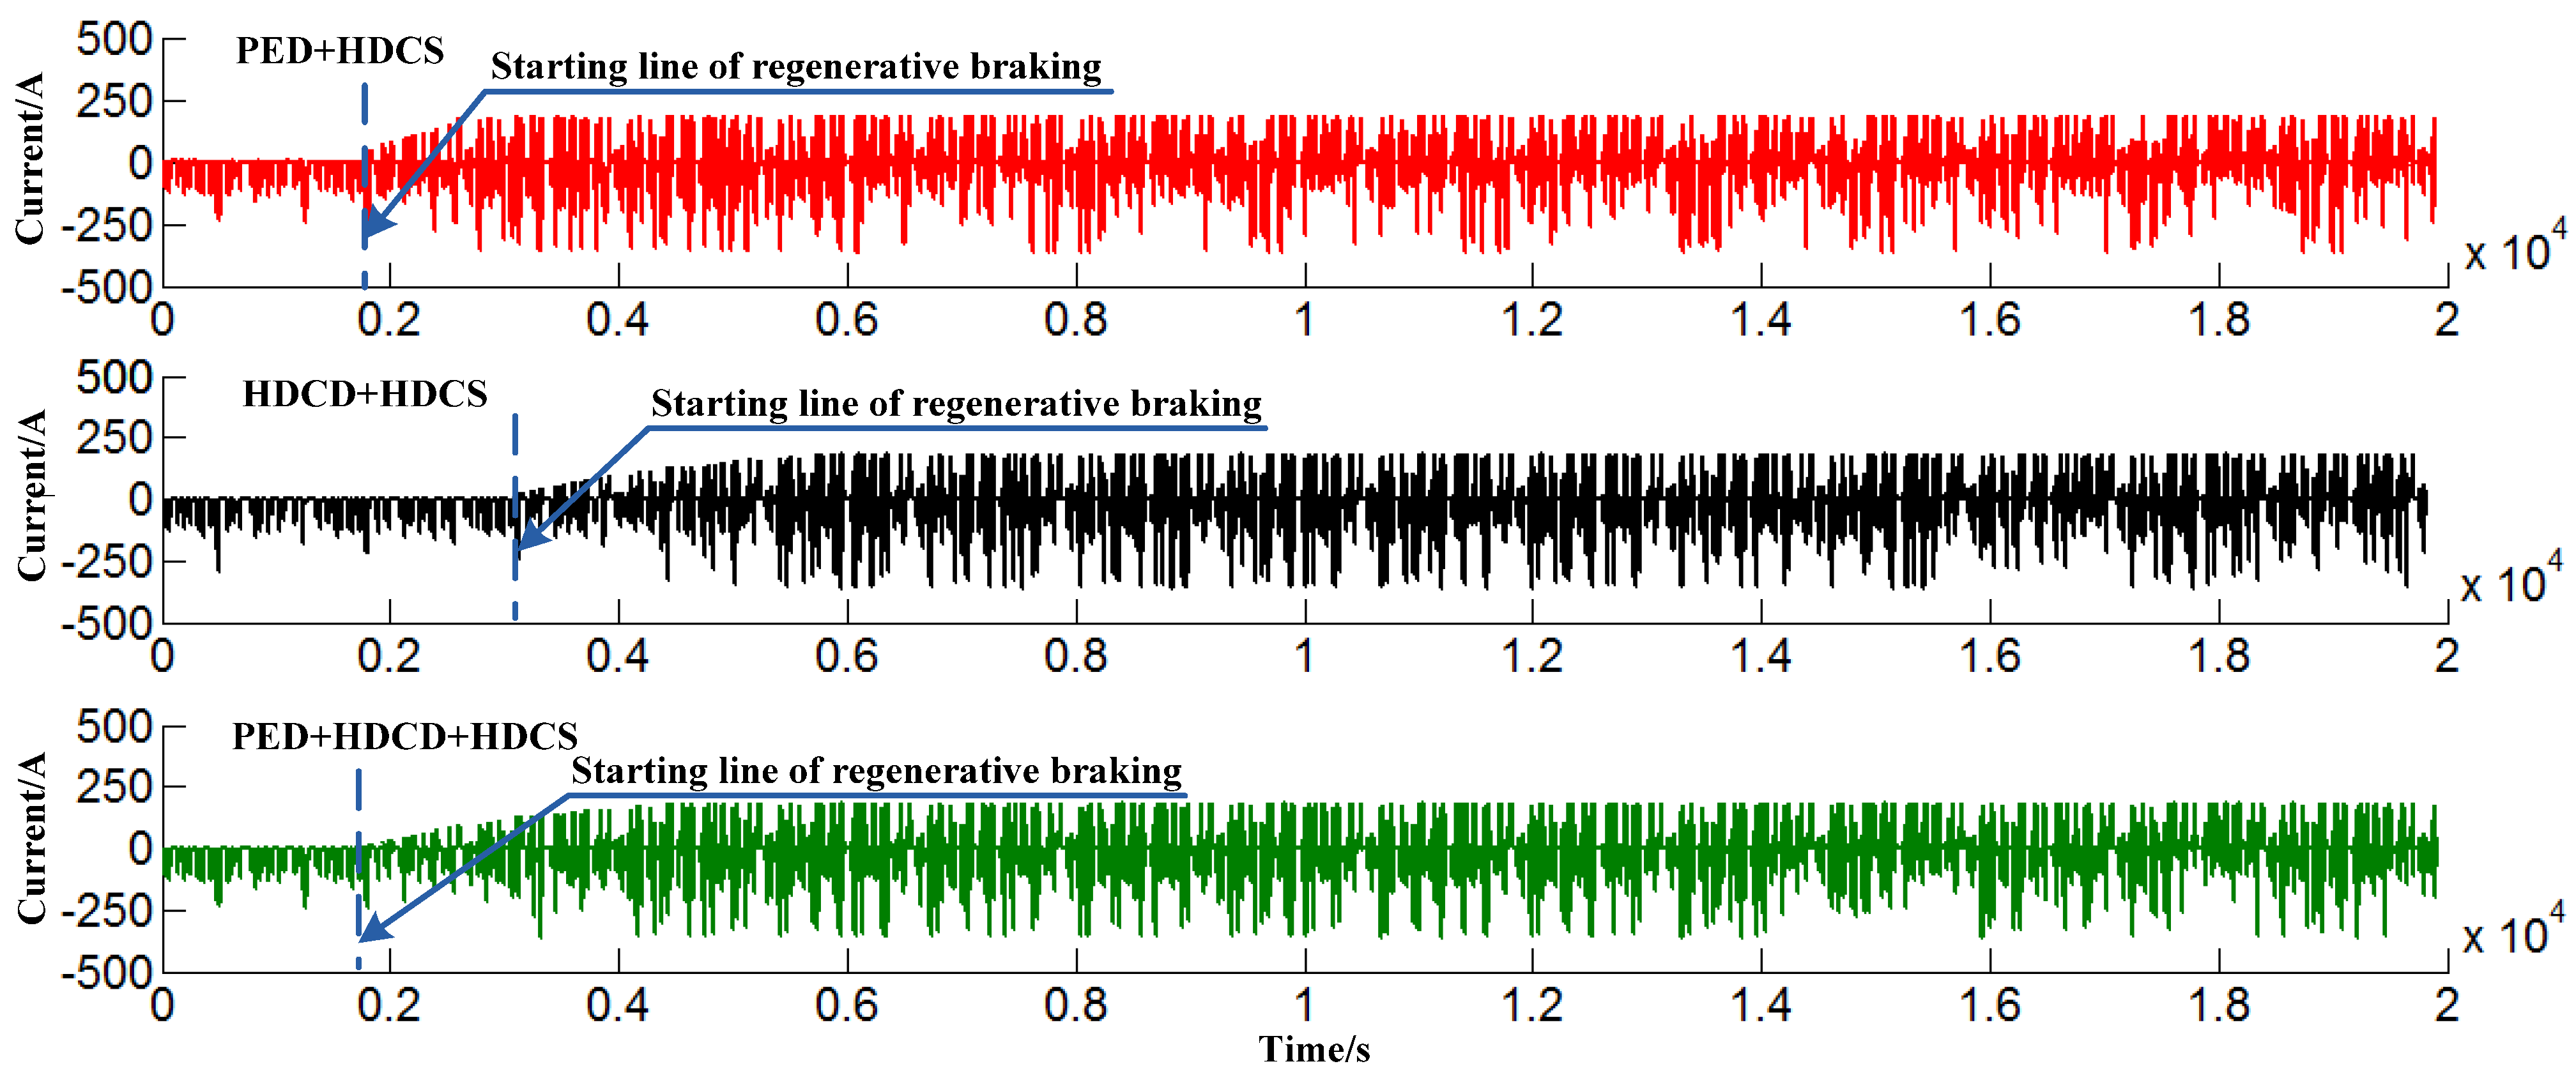
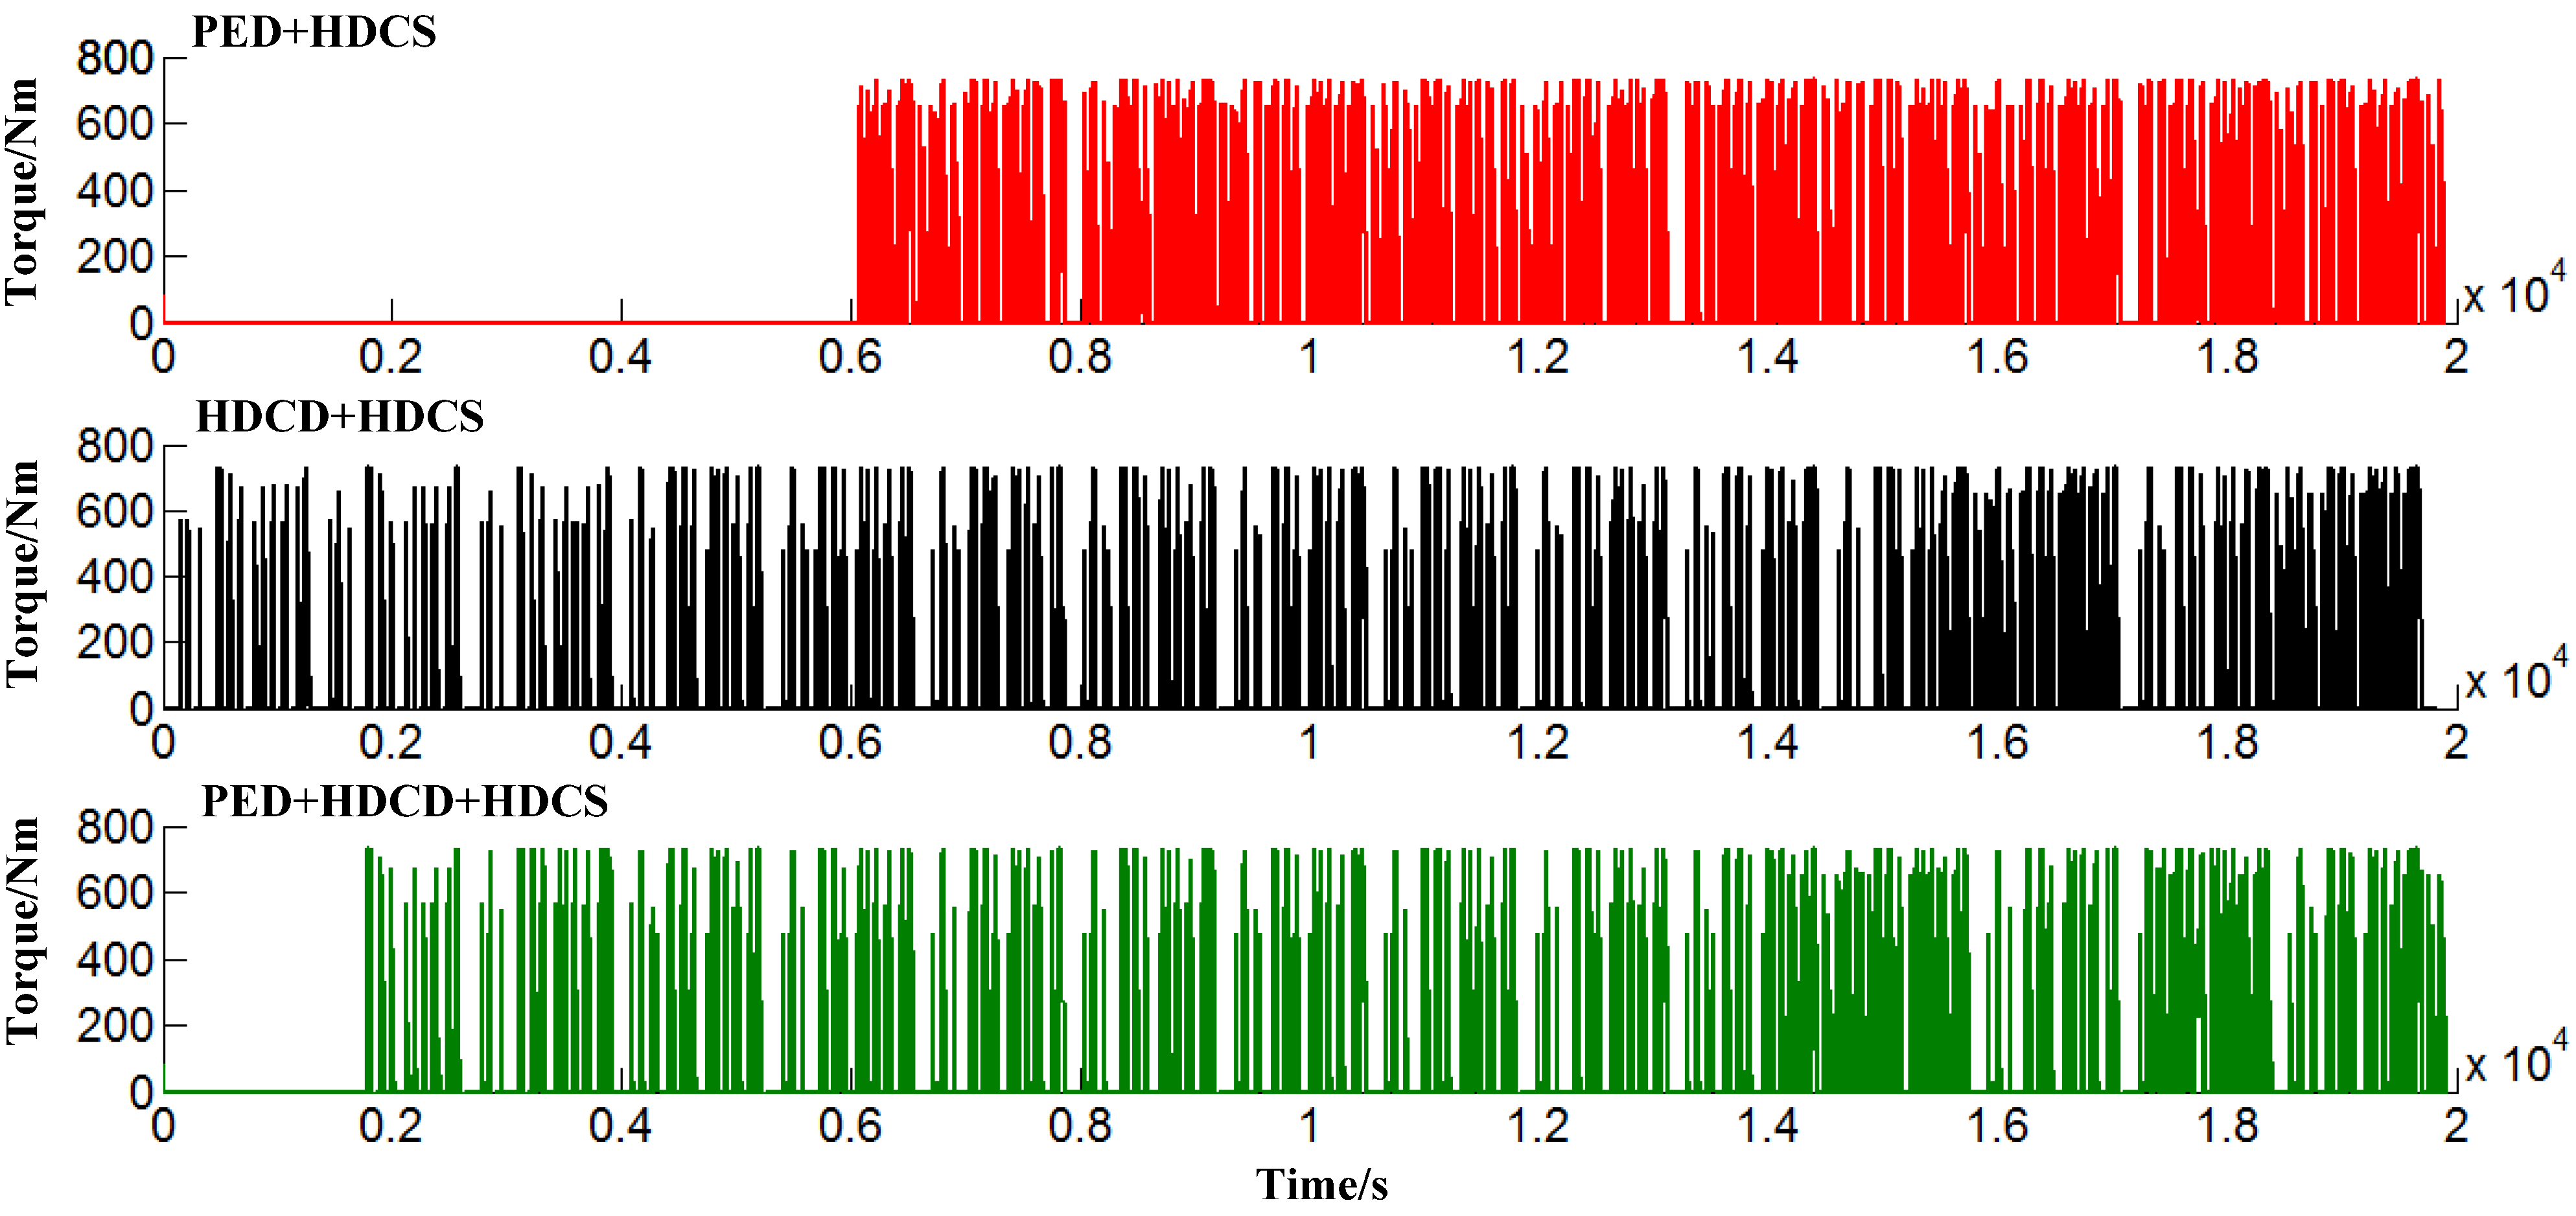
5.1. The Clutch State Profiles

The operation patterns of the PHEB powertrain mentioned above depend on the clutch’s state. Figure 11 shows the profiles of the clutch state for the three energy management strategies.
Figure 11. The clutch state profiles under different strategies.
Energies 06 05656 g011
As for the PED + HDCS strategy, the clutch is disengaged for the first more than 100 min, which implies that vehicle operates in the PED mode, and then frequently switches its state between opening and closing during the rest of trip depending on the velocity which is similar to the HDCD + HDCS strategy. The clutch’s state for the HDCD + HDCS strategy is similar to that for the PED + HDCS strategy, but is disengaged for about 30 min during the first part of trip.

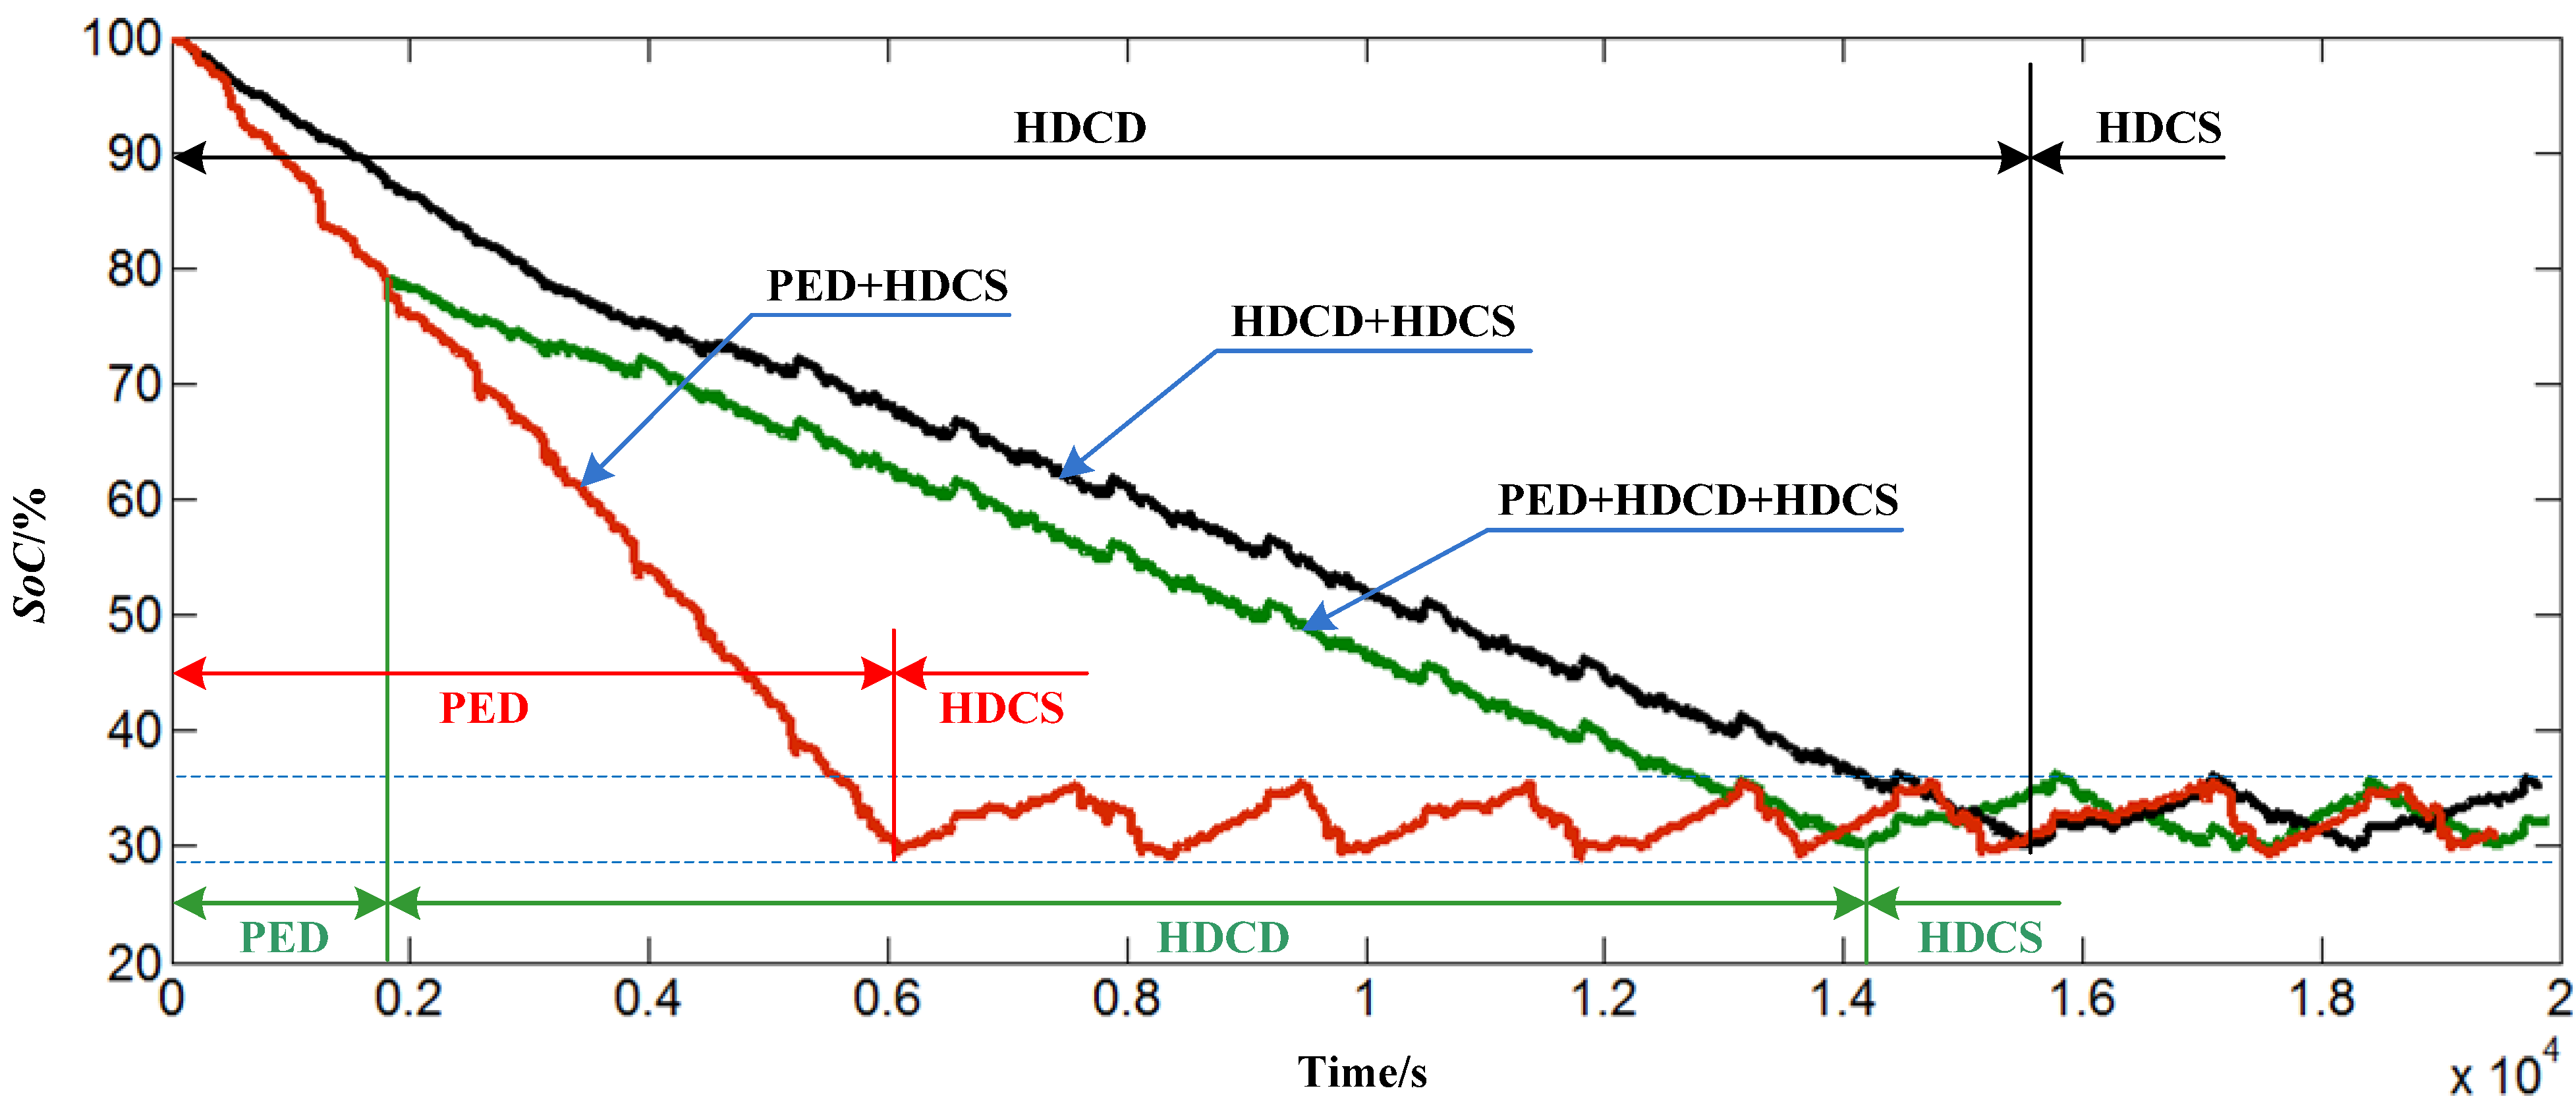
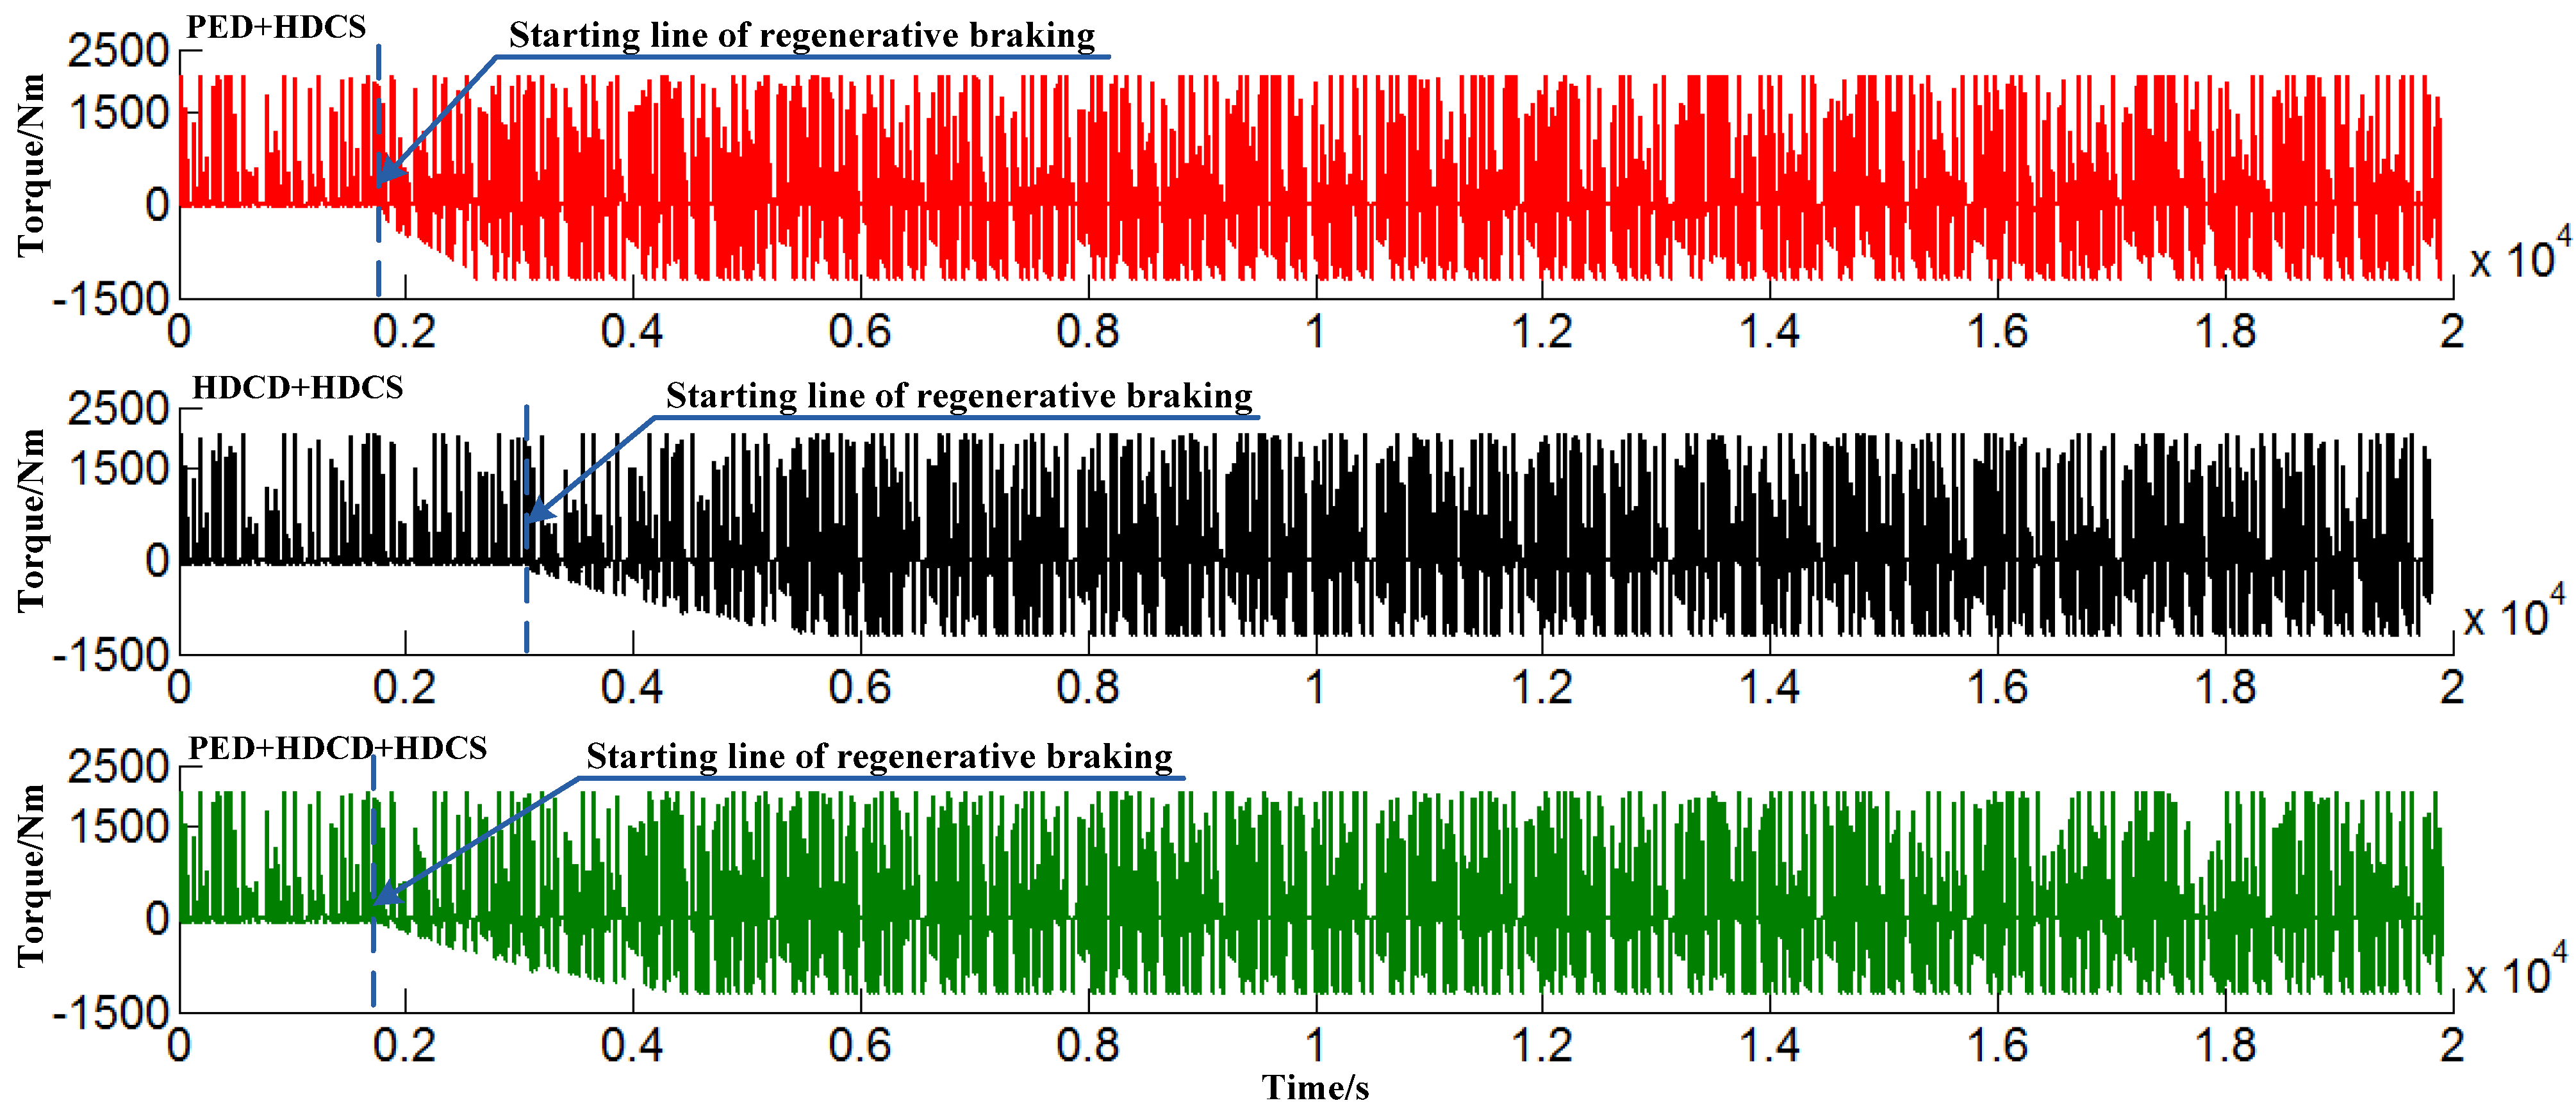
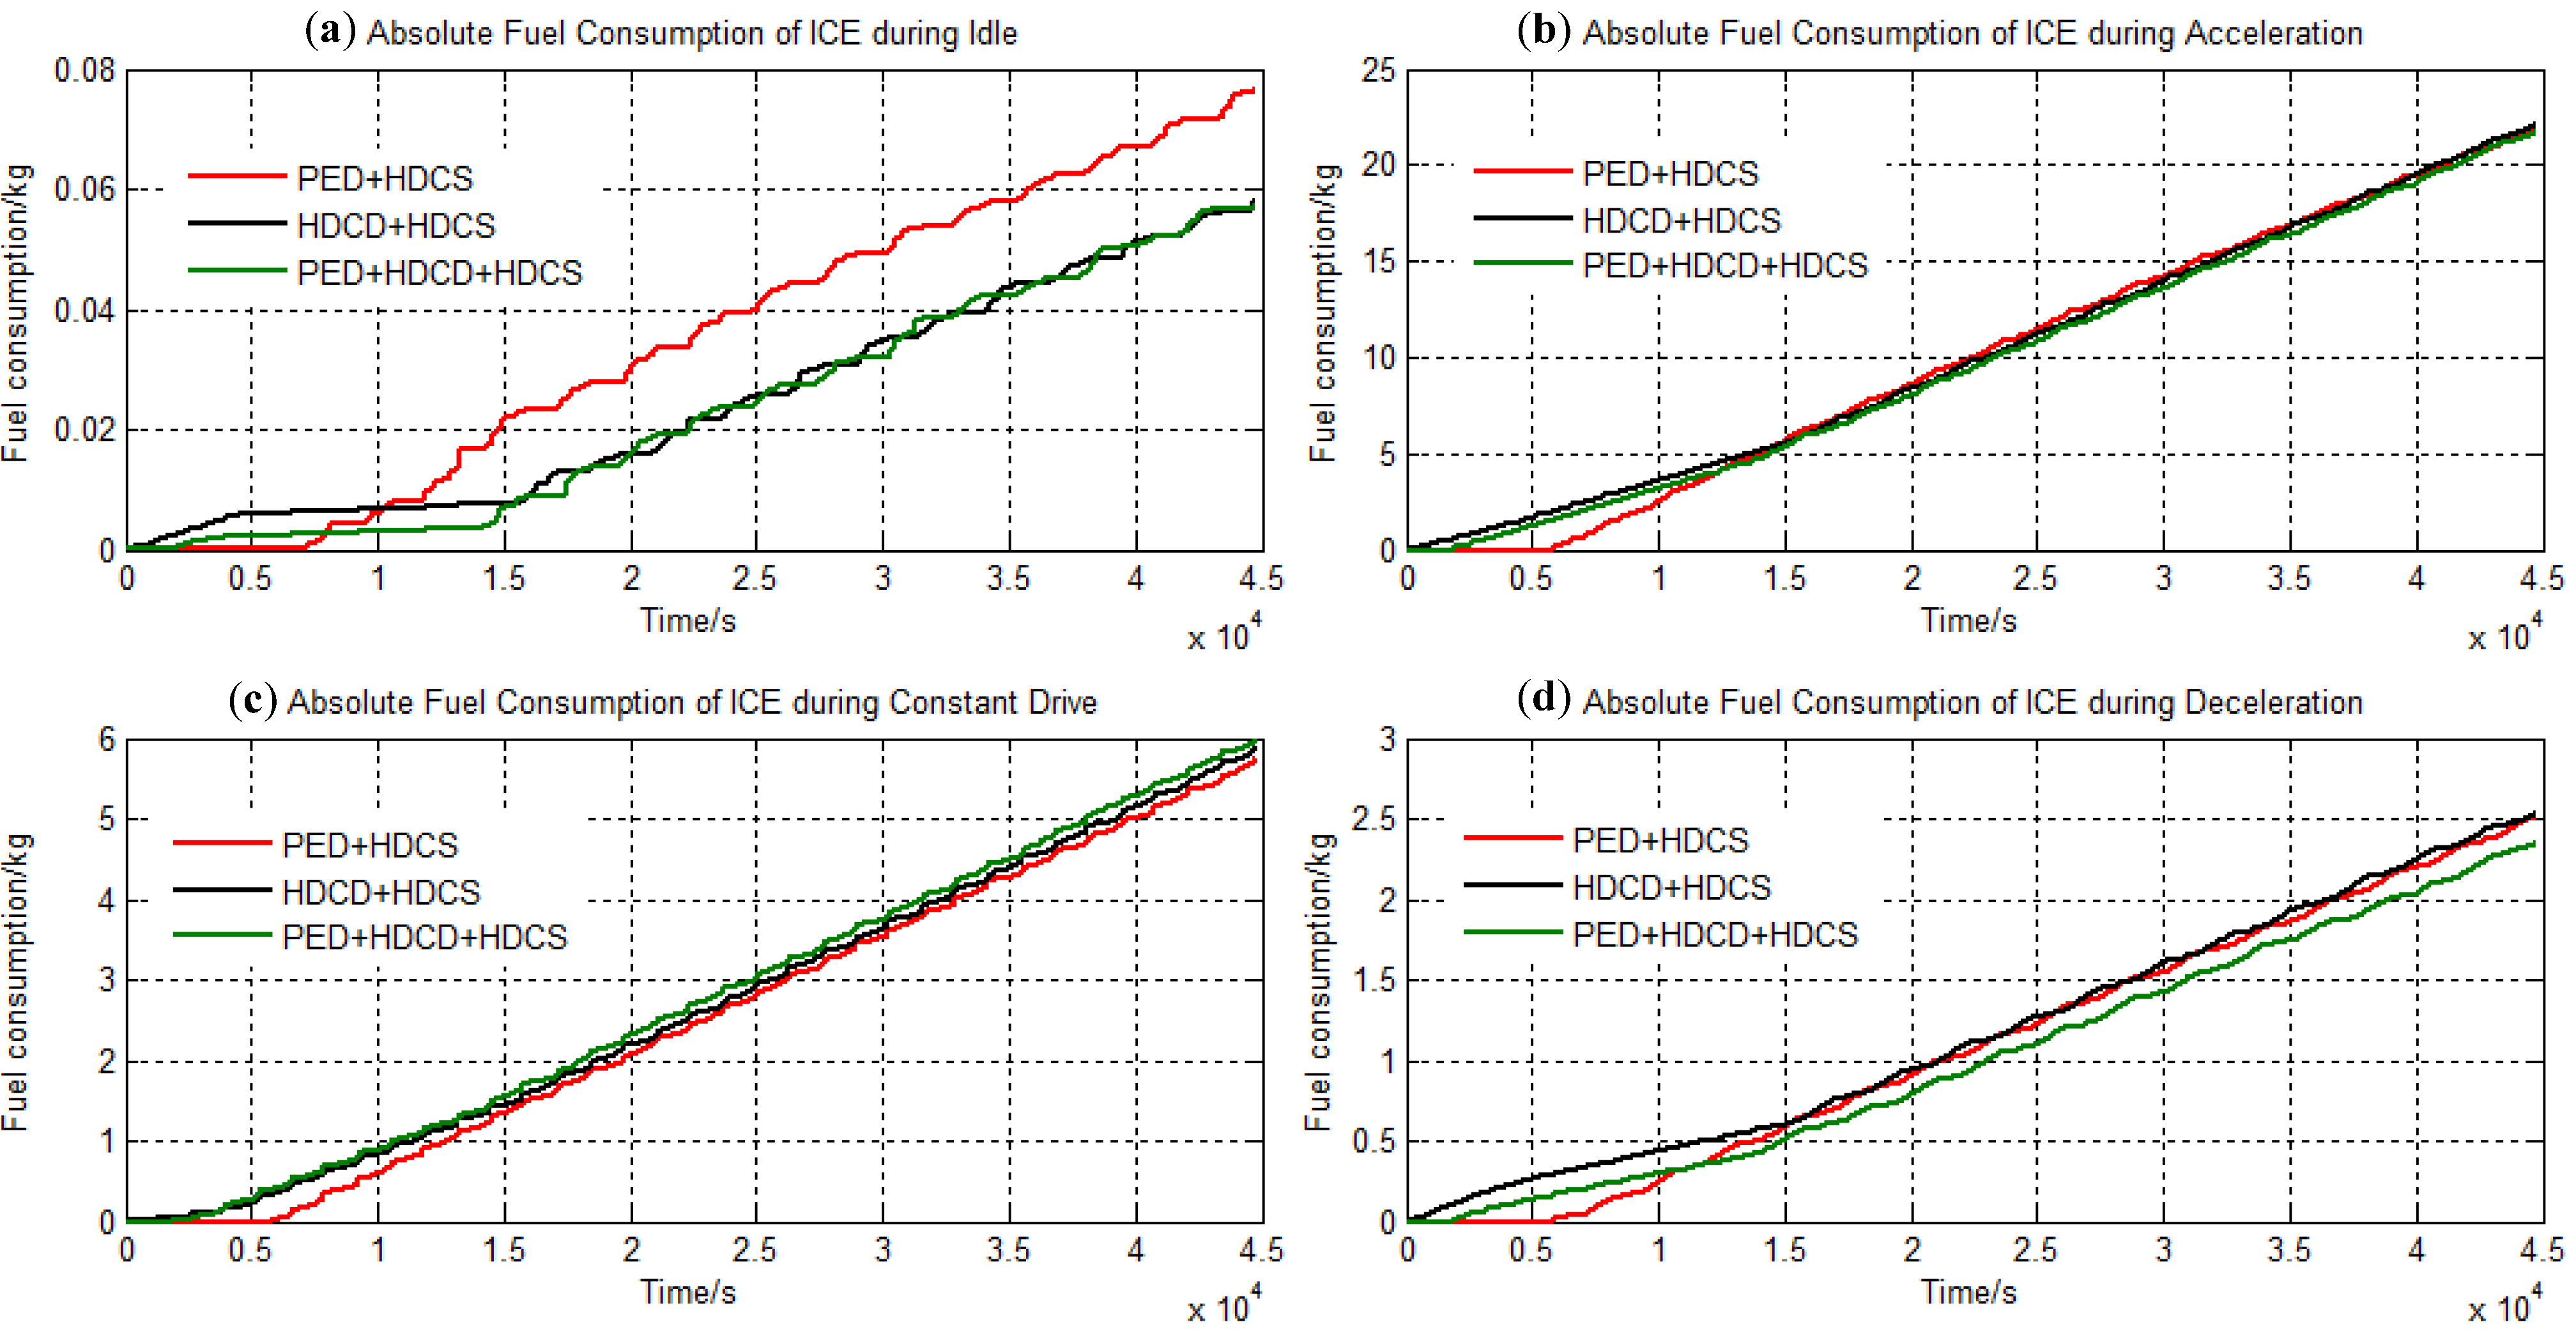
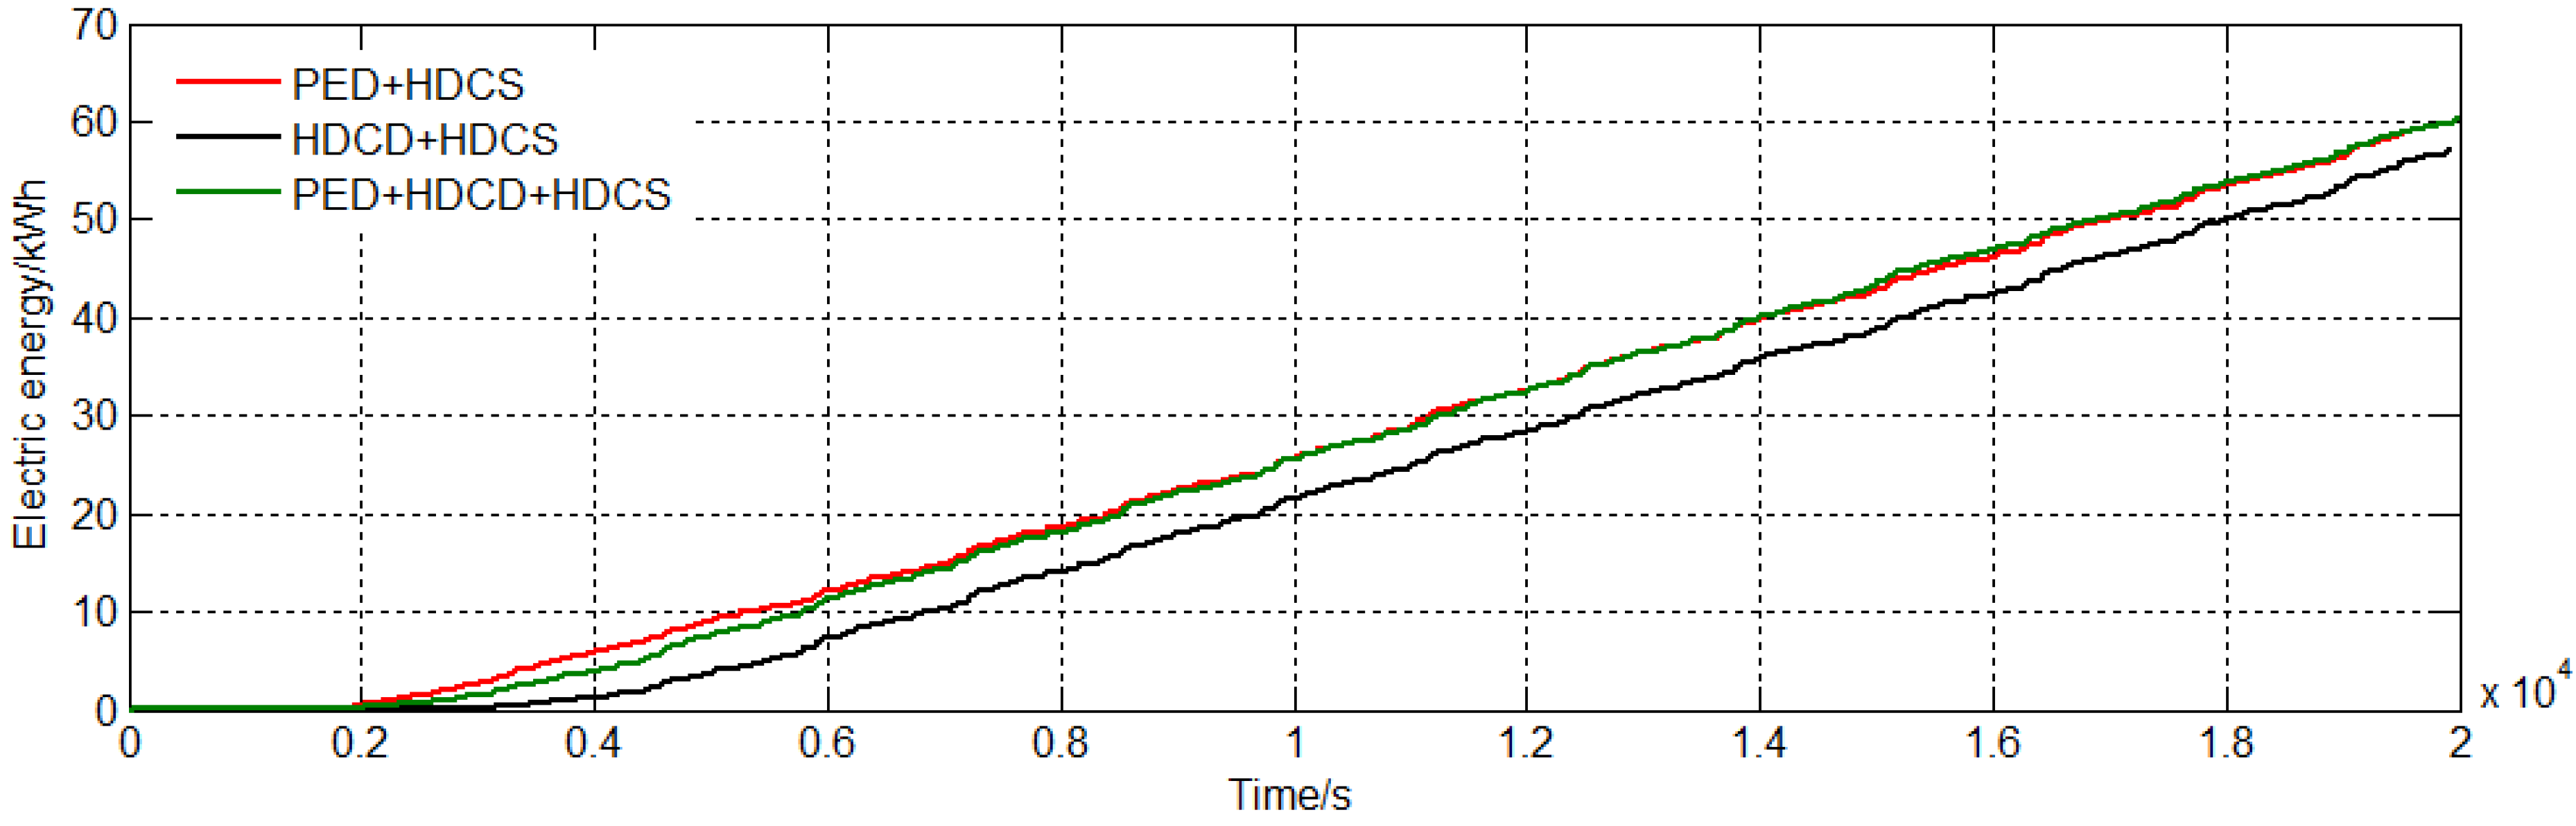
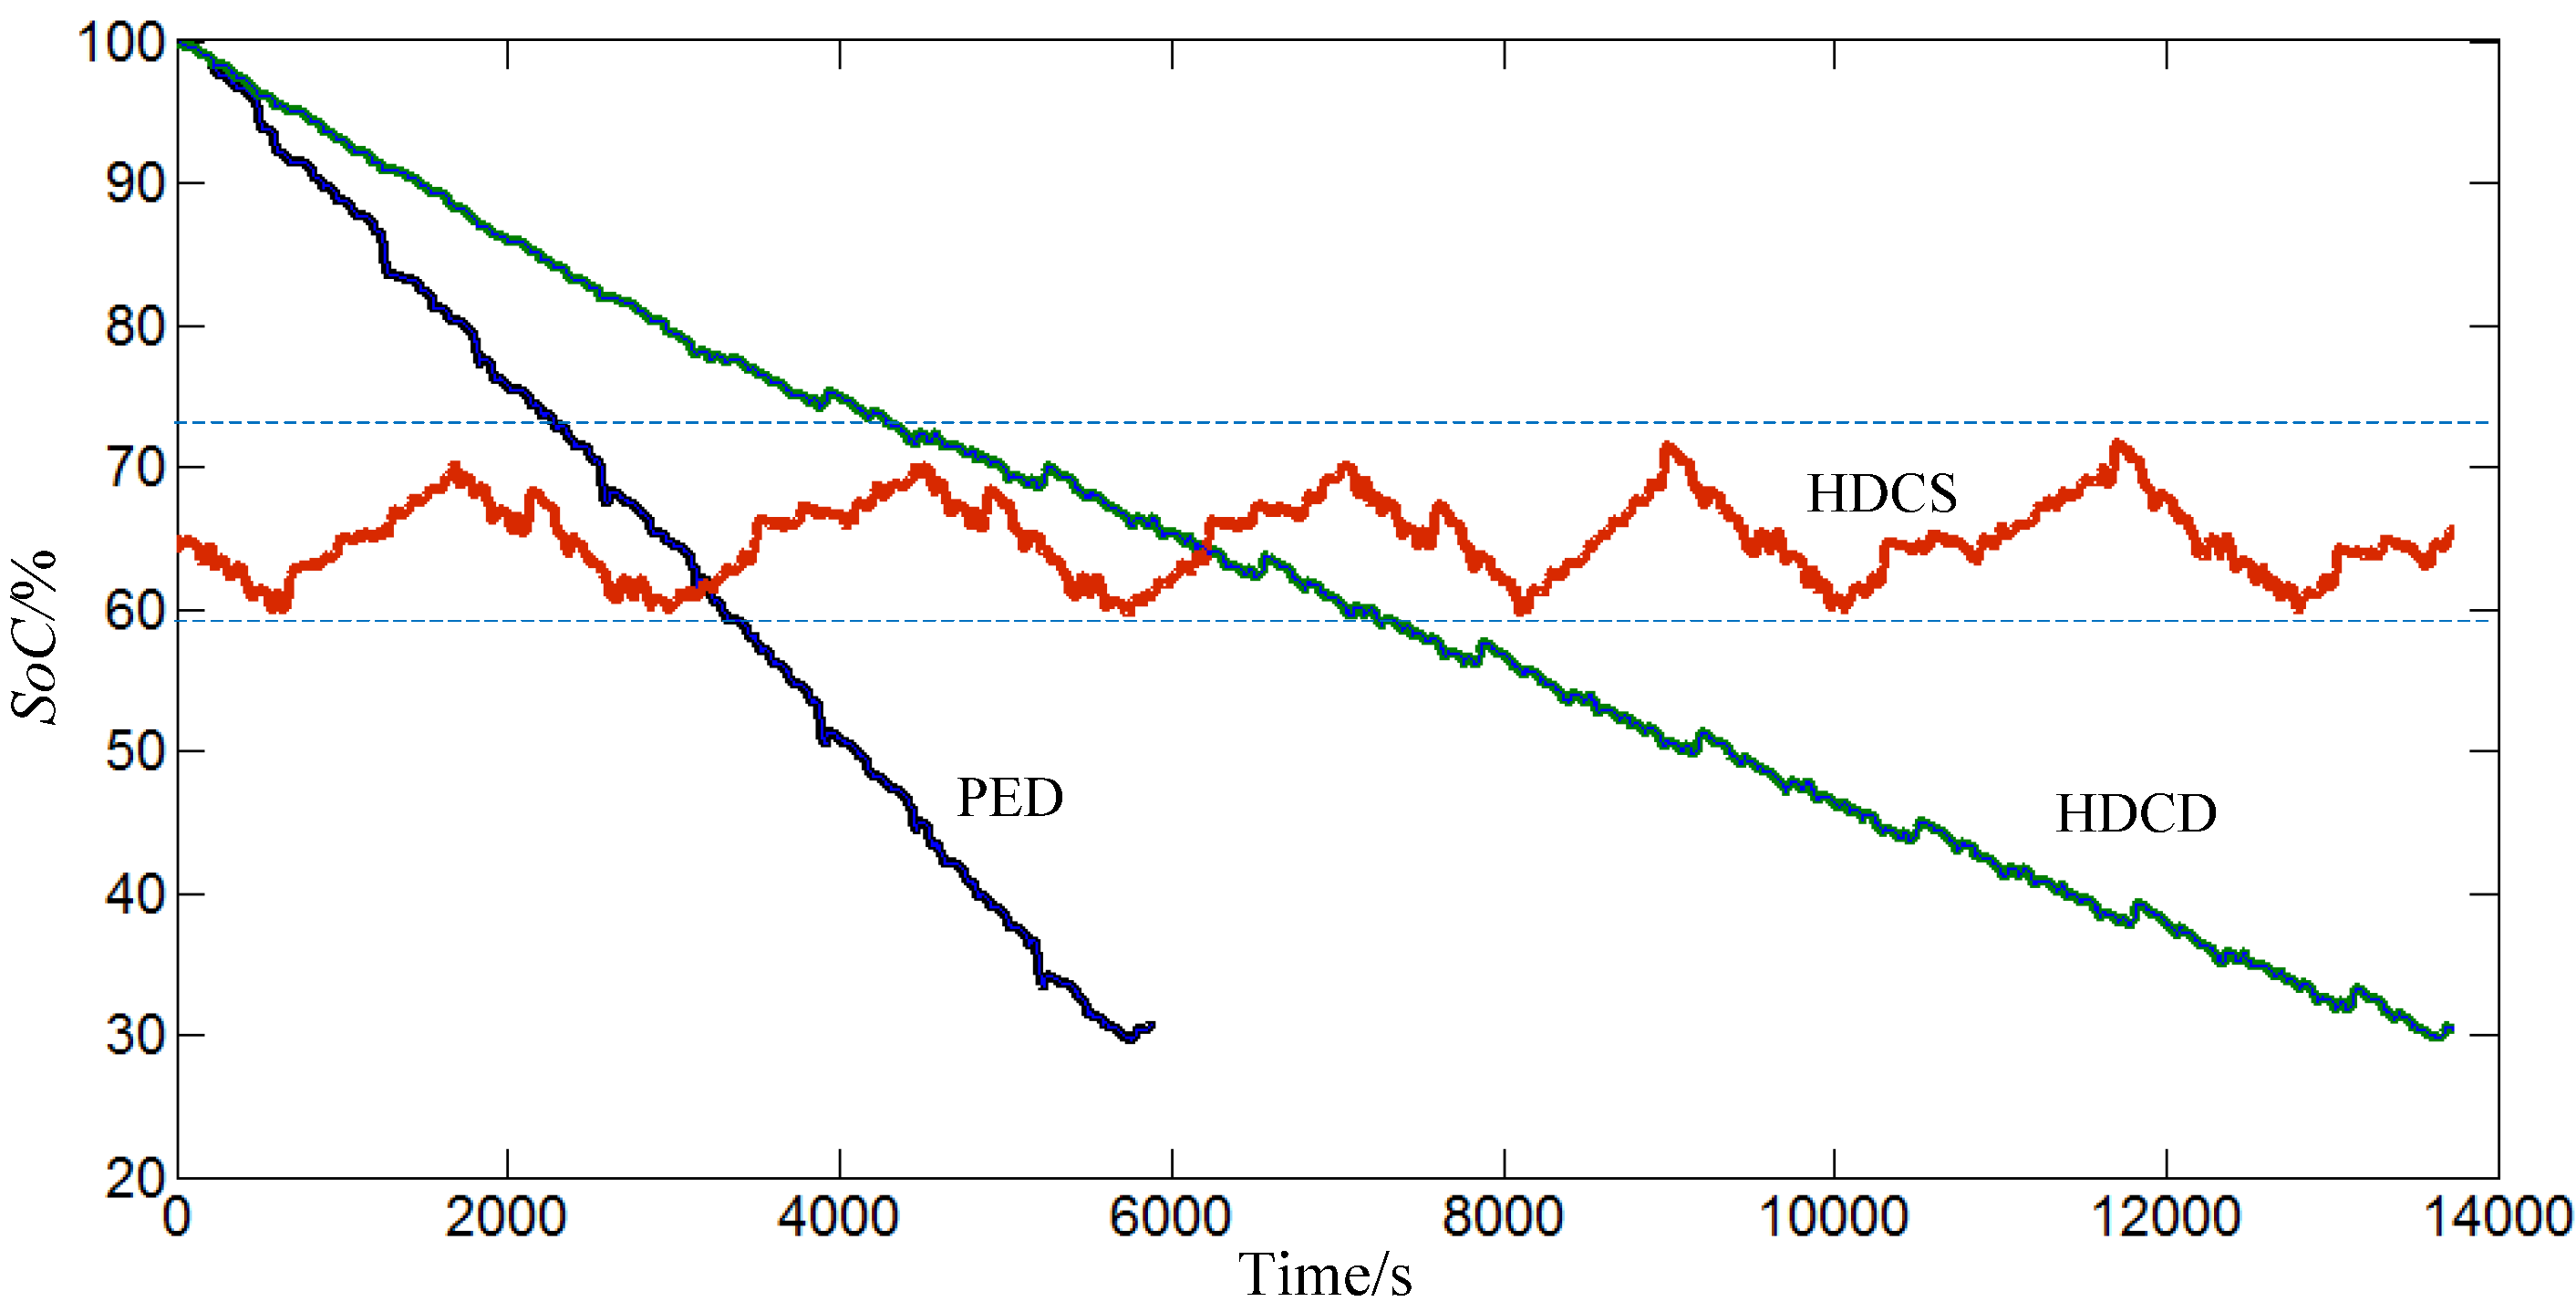
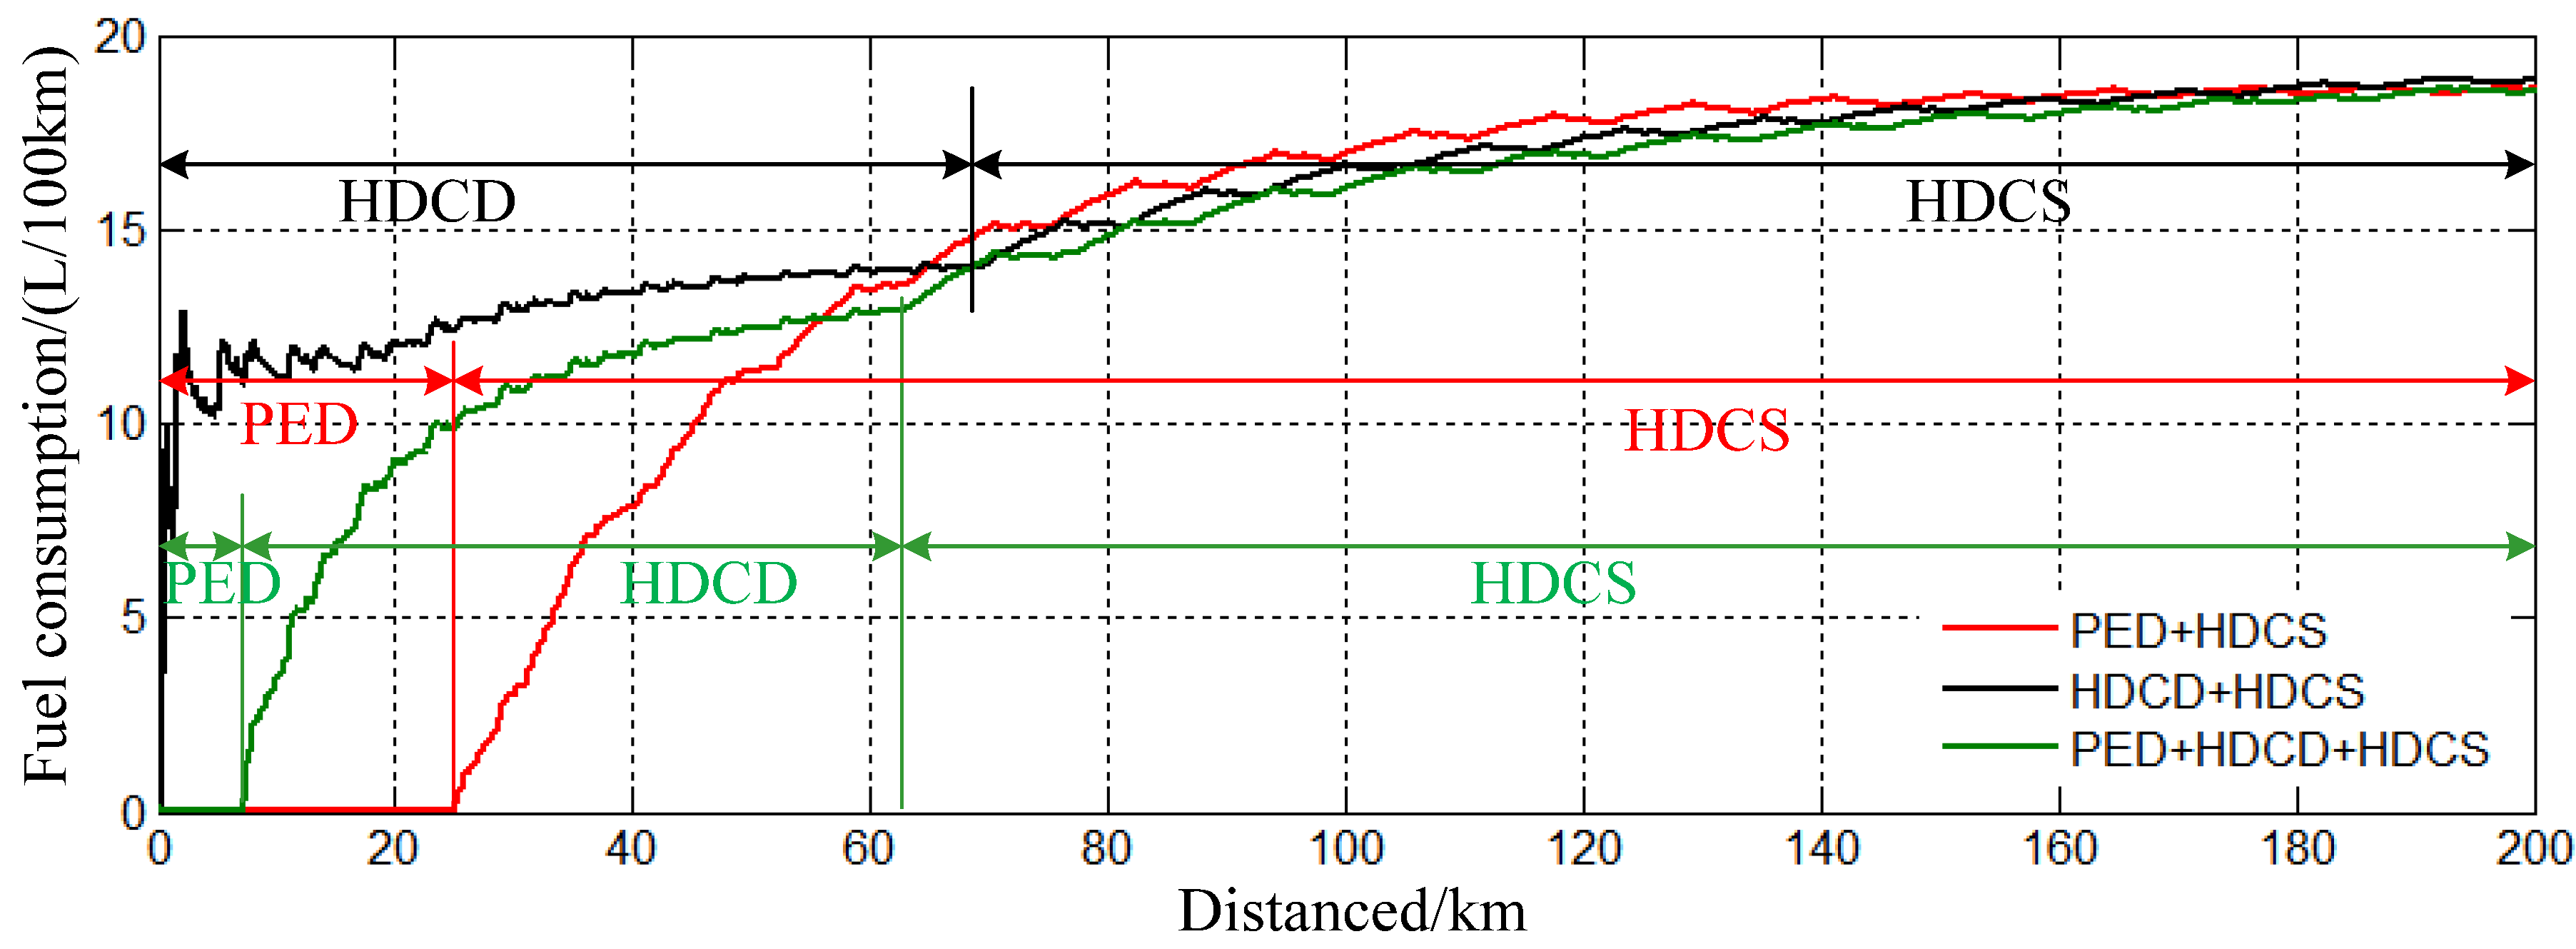
5.2. Fuel Economy Results and Discussion

The PHEV consumes energy both from the on-board fuel tank and the battery pack. The electricity consumption should be considered first. The battery SoC profiles of the three energy management strategies for the PHEB mentioned above are shown in Figure 12.
Figure 12. The battery SoC profiles under different strategies.
Energies 06 05656 g012
During the starting part of the trip, the PHEB with any one of the three strategies cannot carry out regenerative braking due to the overhigh SoC level. The SoC decreasing rate for the three different basic modes depends on the PHEB electricity consumption rate. It is obvious that the rate of decrease of the SoC under the PED mode is the fastest, then followed by the HDCD mode and the HDCS mode, as shown in Figure 12. Therefore, for the PED + HDCD + HDCS strategy and the PED + HDCS strategy, the PHEB can implement regenerative braking ahead of the HDCD + HDCS strategy, as shown in Figure 13 and Figure 14.
Figure 13. The battery current profiles under different strategies.
Energies 06 05656 g013
Figure 14. The TM torque profiles under different strategies.
Energies 06 05656 g014
In addition, as shown in Figure 12, the proportion of the HDCS mode during the entire trip in the PED + HDCS strategy is larger than that in the other two strategies, while the proportion of the HDCS mode in the PED + HDCD + HDCS strategy is a little larger than that in the HDCD + HDCS strategy.
As shown in Figure 14, Figure 15 and Figure 16, when the PHEB drives with the PED mode, there is no fuel consumption because the ICE is off. In the HDCS mode all the energy demand of the vehicle is provided by fuel tank, and the ICE frequently responds to the vehicle’s dynamic torque demands and drives the ISG to recharge the battery. In order to sustain the SoC at the preset range, the ICE has to work longer in HDCS mode than that in the HDCD mode. As for the HDCD mode, the ICE operates only in the efficient area and the TM absorbs the peak torque requirements, as a result, the powertrain efficiency is much higher than in the HDCS mode.
Figure 15. The ICE working state profiles under different strategies.
Energies 06 05656 g015
Figure 16. The ICE torque profiles under different strategies.
Energies 06 05656 g016
Thus, for PHEVs, the more the proportion of the PED mode in the entire trip is, the better the fuel economy is, while the HDCS mode does the reverse, but the fuel economy benefits from the PED mode are less and less as the vehicle travels longer and longer. Figure 17 shows the relationship between the trip distance and the fuel consumption per 100 km of the PHEB with the three strategies.
There are noticeable differences in the first part of the trip, especially in the first 55 km, as shown in Figure 17. For the HDCD + HDCS strategy, due to the shorter distance and the momentary variability of the power demand, the PHEB fuel consumption per 100 km fluctuates with the ICE on-off state firstly and then tends to be stable.
Figure 17. The relationship curves between the fuel economy and trip distance under different strategies.
Energies 06 05656 g017
As shown in Figure 18, for the PED + HDCS strategy and the PED + HDCD + HDCS strategy, the PHEB starts with TM only driving mode and consumes no fuel. As a result, the fuel consumption of the PED + HDCS strategy is zero in the first about 25 km of the trip and the PED + HDCD + HDCS strategy in the first about 7 km. Therefore, the fuel economy of the PED + HDCS is better than the two other strategies, and the PED + HDCD + HDCS is better than the HDCD + HDCS when the trip distance is shorter than 55 km.
Figure 18. The ICE fuel consumption curves during different working conditions under different strategies.
Energies 06 05656 g018
However, when the trip distance exceeds 55 km, the PHEB fuel economy under the PED + HDCS strategy changes to be the worst, because its battery SoC reduces faster and the PHEB operation mode switches to the HDCS mode earlier than in the other two strategies, and the benefits for fuel economy from the PED mode is counteracted by the increasing proportion of the HDCS mode in the subsequent distance traveled. As for the HDCD + HDCS strategy, the superiority of the HDCD is lessened by the lateness of regenerative braking, and its percentage of the HDCS in the entire trip is slightly lower than the PED + HDCD + HDCS strategy. Thus the fuel economy for the HDCD + HDCS strategy is worse than the PED + HDCD + HDCS strategy which contains the PED mode.
Figure 18 shows the absolute ICE fuel consumption during four kinds of working conditions such as idling, cruising, accelerating and braking for the three strategies. Since all aforementioned strategies implement the ICE start-stop function, the fuel consumption during the idle condition is negligible as shown in Figure 18a. The PHEB fuel economy mainly depends on the ICE fuel consumption during constant drive condition and transient working condition including acceleration and deceleration, especially acceleration. When PHEB operates with PED + HDCD + HDCS strategy, the proportion of the ICE constant drive condition with higher efficiency than other conditions is higher than the other two strategies as shown in Figure 18c, accordingly the proportion of transient condition is the lowest as shown in Figure 18b and Figure 18d. It should be noted that as the trip distance increases the proportion of each working condition of the ICE for every strategy is gradually close to each other. Meanwhile, the benefits for fuel economy from regeneration braking are increasingly equal as the trip distance increases, as shown in Figure 19.
Figure 19. The electric energy profiles from regeneration braking under different strategies.
Energies 06 05656 g019
In conclusion, the PHEB fuel consumption per 100 km with different strategies changes as the trip distance increases and the corresponding trends are rising as a whole, eventually asymptotically approaching each other since the difference of the proportion of the HDCS in different strategies is decreasing gradually, which is clearly shown in Figure 17.
It is important to note that if the trip distance and the driving cycle are known in advance, the percentage of the HDCD mode in the entire trip can be increased by lessening the utilization rate of the electrical energy based on the trip information. Even if the vehicle travels in the PED and HDCD mode throughout the entire trip, the battery SoC is monotonely decreased and the available energy of the battery is just exhausted at the end of the trip by using the global optimization algorithm.
If some information about the trip can be approximately known in advance such as the trip distance, the mean power demand and so on, the vehicle can be operated in the PED and HDCD mode during the largest fraction of the trip and the HDCS mode is only used to extend the driving range. In other words, the PED + HDCD + HDCS strategy, which is comprised optimally of the PED mode, the HDCD mode and the HDCS mode, is an optimal energy management strategy practicable for PHEVs.

6. Conclusions

We defined the basic PHEV operation modes as PED, HDCD and HDCS based on the battery SoC profile, and researched three different energy management strategies for a PHEB. The main conclusions drawn are as follows:
(1)
A single-axis series-parallel PHEB was modeled and its systematic model was built for energy flow analysis and fuel economy evaluations.
(2)
Three energy management strategies, which are the PED + HDCS strategy, the HDCD + HDCS strategy and the PED + HDCD + HDCS strategy, were put forward by combing the three basic PHEV operation modes. The corresponding models were built and the corresponding equations were listed.
(3)
A systematic simulation experiment was performed and the three energy management strategies were compared. It is shown that the more the proportion of the PED mode in the entire trip is, the better the fuel economy will be, while the HDCS mode does the reverse. The PHEB fuel consumption per 100 km differs as the driving distance increases with a general rising tendency. In general, the PED + HDCD + HDCS strategy, which is optimally composed of the PED mode, the HDCD mode and the HDCS mode, is the optimal one practicable for PHEVs.

Acknowledgments

This work was supported by the National High Technology Research and Development Program of China (2012AA111603, 2011AA11A290) in part, the Program for New Century Excellent Talents in University (NCET-11-0785) in part. The authors would also like to thank the reviewers for their corrections and helpful suggestions.

References

  1. Lee, T.K.; Adornato, B.; Filipi, Z.S. Synthesis of real-world driving cycles and their use for estimating PHEV energy consumption and charging opportunities: Case study for Midwest/US. IEEE Trans. Veh. Technol. 2011, 60, 4153–4163. [Google Scholar] [CrossRef]
  2. Lunz, B.; Yan, Z.; Gerschler, J.B.; Gerschler, J.B.; Sauer, D.U. Influence of plug-in hybrid electric vehicle charging strategies on charging and battery degradation costs. Energy Policy 2012, 46, 511–519. [Google Scholar] [CrossRef]
  3. Ehsani, M.; Falahi, M.; Lotfifard, S. Vehicle to grid services: Potential and applications. Energies 2012, 5, 4076–4090. [Google Scholar] [CrossRef]
  4. Bradley, T.H.; Quinn, C.W. Analysis of plug-in hybrid electric vehicle utility factors. J. Power Sources 2010, 195, 5399–5408. [Google Scholar] [CrossRef]
  5. Gonder, J.; Markel, T. Energy management strategies for plug-in hybrid electric vehicles. SAE Tech. Paper 2007. [CrossRef]
  6. Falahi, M.; Chou, H.-M.; Ehsani, M.; Xie, L.; Butler-Purry, K.L. Potential power quality benefits of electric vehicles. IEEE Trans. Sustain. Energy 2013, 4, 1016–1023. [Google Scholar]
  7. Borhan, H.; Vahidi, A.; Phillips, A.M.; Kuang, M.L.; Kolmanovsky, I.V.; Di Cairano, S. MPC-based energy management of a power-split hybrid electric vehicle. IEEE Trans. Control Syst. Technol. 2012, 20, 593–603. [Google Scholar] [CrossRef]
  8. Zhang, B.; Mi, C.C.; Zhang, M. Charge-depleting control strategies and fuel optimization of blended-mode plug-in hybrid electric vehicles. IEEE Trans. Veh. Technol. 2011, 60, 1516–1525. [Google Scholar] [CrossRef]
  9. Wirasingha, S.G.; Emadi, A. Classification and review of control strategies for plug-in hybrid electric vehicles. IEEE Trans. Veh. Technol. 2011, 60, 111–122. [Google Scholar] [CrossRef]
  10. Tulpule, P.; Marano, V.; Rizzoni, G. Effects of Different PHEV Control Strategies on Vehicle Performance. In Proceedings of American Control Conference, St. Louis, MO, USA, 10–12 June 2009; pp. 3950–3955.
  11. He, Y.; Chowdhury, M.; Pisu, P.; Ma, Y. An energy optimization strategy for power-split drivetrain plug-in hybrid electric vehicles. Transp. Res. Part C Emerg. Technol. 2012, 22, 29–41. [Google Scholar] [CrossRef]
  12. He, J.-H.; Yang, L.; Qiang, J.-X.; Chen, Z.-Q.; Zhu, J.-X. Novel flexible hybrid electric system and adaptive online-optimal energy management controller for plug-in hybrid electric vehicles. J. Cent. South Univ. 2012, 19, 962–973. [Google Scholar] [CrossRef]
  13. Lee, D.H.; Kim, N.W.; Jeong, J.R.; Park, Y.I.; Cha, S.W. Component sizing and engine optimal operation line analysis for a plug-in hybrid electric transit bus. Int. J. Auto. Technol. 2013, 14, 459–469. [Google Scholar] [CrossRef]
  14. Zhang, C.; Vahidi, A. Route preview in energy management of plug-in hybrid vehicles. IEEE Trans. Control Syst. Technol. 2012, 20, 546–553. [Google Scholar] [CrossRef]
  15. Zhang, M.; Yang, Y.; Mi, C.C. Analytical approach for the power management of blended-mode plug-in hybrid electric vehicles. IEEE Trans. Veh. Technol. 2012, 61, 1554–1566. [Google Scholar] [CrossRef]
  16. Tulpule, P.; Marano, V.; Rizzoni, G.; McGee, R.; Yu, H. A statistical approach to assess the impact of road events on PHEV performance using real world data. SAE Tech. Paper 2011. [CrossRef]
  17. Wei, X. Modeling and Control of a Hybrid Electric Drivetrain for Optimum Fuel Economy, Performance and Driveability. Ph.D. Thesis, Ohio State University, Columbus, OH, USA, 2004. [Google Scholar]
  18. Koprubasi, K. Modeling and Control of a Hybrid-Electric Vehicle for Drivability and Fuel Economy Improvements. Ph.D. Thesis, Ohio State University, Columbus, OH, USA, 2008. [Google Scholar]
  19. Huang, Y. A Study on Control Strategy and Implementation Technique for Pre and Pro Double Clutches Parallel Hybrid Electric Urban Buses. Ph.D. Thesis, Shanghai Jiao Tong University, Shanghai, China, 2009. [Google Scholar]
  20. Albert, I.J.; Kahrimanovic, E.; Emadi, A. Diesel sport utility vehicles with hybrid electric drive trains. IEEE Trans. Veh. Technol. 2004, 53, 1247–1256. [Google Scholar] [CrossRef]
  21. Patil, R.M. Combined Design and Control Optimization: Application to Optimal PHEV Design and Control for Multiple Objectives. Ph.D. Thesis, The University of Michigan, Lansing, MI, USA, 2012. [Google Scholar]

