Article

On the Feasibility of Using Poles Computed from Frequency Domain Spectroscopy to Assess Oil Impregnated Paper Insulation Conditions

Canada Research Chair on Insulating Liquids and Mixed Dielectrics for Electrotechnology (ISOLIME), Université du Québec à Chicoutimi, 555 Boulevard de l'université, Chicoutimi, QC G7H 2B1, Canada
*
Author to whom correspondence should be addressed.
Energies 2013, 6(4), 2204-2220; https://doi.org/10.3390/en6042204
Submission received: 28 January 2013 / Revised: 18 March 2013 / Accepted: 21 March 2013 / Published: 18 April 2013

Abstract

:
Frequency Domain Spectroscopy (FDS) is an effective tool allowing assessing the condition of oil-paper insulation system in power equipment. However, results from these measurements are known to be greatly influenced by various parameters, including insulation aging, moisture content, and insulation geometry/volume, together with environmental condition such as temperature. In this contribution, a series of experiments have been performed under controlled laboratory conditions. The dielectric response of the oil impregnated paper, along with the degree of polymerization and moisture content, were monitored. Since dielectric parameters are geometry dependent, poles (independent of the geometry) which depends on resistivity and permittivity, were considered to assess the condition of the insulation. From the investigations performed on new and aged samples, it is shown that poles (P) can be regarded as insulation aging indicator. It is also shown that a per unit value based on the Dielectric Dissipation Factor (DDF), measured in the frequency range from 1 to 1000 Hz can be correlated to moisture content in the insulation paper.

1. Introduction

Power transformers, which are often considered as one of the costliest pieces of equipment in the electrical power transmission system, are indispensable components for power transmission and distribution systems and large industrial plants. It is therefore essential that they function properly for many years. In these key assets, composite oil/paper system has been used as the main insulation for more than a century [1]. During service, this insulation system is subjected to various stresses (electrical, environmental, mechanical and thermal), occurring in different parts of the structure; some of them being inter-related. Despite all the important progress in the design of power transformers, the weak link in the chain still remains the insulation system. As the equipment ages, its internal insulation degrades, thus increasing the risk of failure. Insulation degradation/aging is consequently recognized to be one of the major causes of transformer breakdown [2,3,4,5,6,7]. Indeed, when electrical equipments fail, the fault can generally be traced to defective insulation [8]. Preventing failures and maintaining the equipment in good operating condition are very important issues, utilities have to face.
Nowadays, a large number of power transformers around the World are approaching the end of their design life [8]. Replacing them with new ones—only because of their age—is clearly uneconomic. This is because some of these transformers are still in good condition and could be used for many more years. For these reasons, transformer life management has gained an ever increasing interest over the last decades, due to both economic and technical reasons [2,3,4]. In today’s economic climate, it is important to know the condition, by means of suitable diagnostic tests, of the transformer insulation. Over the last decades, the increasing requirements for appropriate tools to diagnose power equipments insulation non-destructively and reliably in the field drive the development of diagnostic tools based on changes of the dielectric properties of the insulation. Among these tools time domain measurement based on Polarization/Depolarization Current (PDC) and Frequency Domain Spectroscopic (FDS) measurements are gaining exceptional importance to the utility professionals [7,8,9,10,11,12,13,14,15]. The FDS is the favoured choice for on-site measurements due to its robustness against noise. In the last decades, much study and work has been performed with the aim of improving our basic understanding of dielectric response interpretation schemes (e.g., [2,3,4,5,6,7,8,9,10,11,12,13,14,15,16,17,18,19,20,21]). It is now accepted that Frequency Domain Spectroscopy (FDS) measurement techniques provide indication of the general ageing status and moisture content of the oil-paper insulation of transformer. However, the results of these tests are severely influenced by several factors, including temperature, rain and electromagnetic disturbances, together with transformer’s volume/geometry [4]. Producing a measure for insulation which does not require volume/geometry might be very helpful.
In this contribution, a circuit model based on the principles of linear dielectric response has been derived. Since the electrical parameter (resistance and capacitance) values are geometry dependent, poles (P), calculated from and permittivity, were used as they are independent of the geometry. A correlation has been found between the condition of the insulation and the equivalent model parameters that offer an alternative for interpreting dielectric test results. The issue of how P varies with moisture and aging is also attempted and some interesting results are produced in relation to sensitivity of poles. The feasibility of using poles and dielectric dissipation factor to assess insulation condition and moisture content is discussed.

2. Background on Frequency Domain Spectroscopy

The frequency response of the dielectric materials is being widely used as a diagnostic tool for insulation systems [4,5,6,7]. The monitoring of the complex permittivity and the dissipation factor of transformer insulation, as function of frequency provides inside information concerning the state of insulation within the components. The fundamental theories behind dielectric measurements are already well known [2] while dielectric phenomena are discussed in Jonscher’s publications [22,23]. A comprehensive review can be found in [2,4]. However, to facilitate interpretation of the measurements reported in this contribution, there is a short review on the theory behind frequency domain measurement techniques.
The relative complex permittivity (εr) is a dimensionless quantity, which compares the complex permittivity of a material (ε) to the permittivity of the free space (εo = 8.854 × 10⁻¹² F/m). It describes the interaction of a material with the electric field and consists of a real part ε’, which represents the storage, while the imaginary part ε”, represents losses. The relative “lossiness” or Dielectric Dissipation Factor (DDF) of the material is the ratio of the energy lost to the stored energy:
tan δ = I loss I c h arg e = ε ε
The DDF (also known as tan δ) is a property of an electrical insulation system; low values of it are usually regarded as proof of good quality of the insulation. The progressive increase of the DDF is closely related to the chemical degradation which accompanies aging/moistening of the insulation system [1,2,3,4,5].
When a sinusoidal voltage is applied across an insulation system, polarization processes start inside the insulation material resulting in a flow of current through it [22,23]. In the FDS techniques, the sample under test is subjected to sinusoidal voltage over a wide frequency range and the amplitude and phase of the response current flowing through the insulation are recorded from which, dissipation factor and complex capacitance are determined. The FDS allows fast measurements at high frequencies but requires long measurement times at frequencies down to 0.1 mHz. In practice, it is necessary to take into account the conduction losses in the DDF [6]. The complex susceptibility χ(ω) = χ’(ω) − jχ”(ω) is the Fourier transform of the dielectric response function f(t) and defined as the complex dielectric susceptibility. Given that the complex permittivity ε(ω) = ε’(ω) − jε”(ω), the loss factor tan δ in frequency domain can be defined as follows [2,3]:
tan δ ( ω ) = ε ( ω ) ε ( ω ) = σ o ε o ω + χ ( ω ) ε + χ ( ω )
where σo is the dc conductivity of the dielectric material; ε’(ω) and ε”(ω) are the real and imaginary parts of the complex permittivity respectively.
Both quantities C and DDF are frequency-dependent. Since aging, moisture and geometry affect these parameters in a quite different and specific frequency ranges, interpretation techniques should be developed to improve the diagnostics. The FDS technique is available as a portable user-friendly method, and can be used to monitor, diagnose and check new insulating materials, qualification of insulating systems during/after production of power equipments non-destructively. The moisture prediction is based on a model formulation which varies all insulation parameters (consisting of spacer, barrier and oil duct) to simulate every possible geometrical design. Indeed, the dielectric response, which is a unique characteristic of the particular insulation system, can provide indication of aging and moisture content of the transformer insulation [13]. The software creates model curves and compares them to the measured DDF curve until the best possible match is reached. The Arrhenius equation is also applied to compensate for temperature dependence in the material. The final results are presented as a percent of moisture in paper and a separate value for oil conductivity.
A large number of papers have been published in this last decade to close some gaps in our understanding. Theoretical and experimental results have been reported in many contributions to demonstrate the effects of temperature, electric field, ageing and moisture content of paper and oil on the FDS results (e.g., [2,3,4,5,6,7,8,9,10,11,12,13,14,15,16,17,18,19,20,21]). It is now well accepted that FDS measurement techniques can provide indication of aging and moisture content of transformer insulation [13]. However, Saha et al. [5] revealed that moisture content has a dominant influence on nearly all electrical-based diagnostic techniques for assessing the condition of insulation, and indeed, masks their capability to determine the presence and extent of aging by-products of the insulation [5,24]. According to Saha et al. [5], there are two main reasons why electrical techniques mostly do not provide good measures of the ageing of insulation. The first, as already mentioned, is the dominant effect of moisture on most electrical properties. The second is that the electrical properties of the oil impregnated paper and pressboard are probably more a complex function of oil and cellulose. Therefore, electrical techniques may not be very sensitive to measuring the extent of ageing of paper/pressboard insulation [5]. Some separation attempts have been reported recently [10,25,26], but it must be emphasized that moisture and aging separation still constitute a challenging point in this domain.
The FDS measurement is carried out as a frequency sweep from 1 kHz down to 0.1 mHz, thus causing an unavoidably large measuring time due to the very low frequency oscillations. Transformation of the results from time domain into the frequency domain has been an alternative that allowed reducing measurement duration (e.g., [27,28]). The time of measurement can be reduced down to less than three hours in the lower frequency ranges. More recently, Jaya et al. [29] proposed an alternative testing technique to reduce the measuring time by measuring multiple sinusoidal oscillations simultaneously. Digital Fourier Transformation (DFT) is used to separate the individual oscillations in the frequency domain. The proposed alternative techniques allow reducing the measuring time by up to 73%.
Another important aspect revealed by researchers is the influence of several factors, including temperature, rain and electromagnetic disturbances, together with the transformer’s volume/geometry, on the FDS measurements [4,14]. Producing a FDS measure for insulation which does not require volume/geometry might therefore be very helpful. The investigations reported in this contribution emphasize the feasibility of using poles to get rid of/encompass equipment volume effects.

3. Experimental Procedures

In order to study the dielectric response as a function of ageing, investigations have been performed on oil-paper insulation samples. Insulation life is normally determined by measuring the time to breakdown. Doing this in “real time” is rather exhausting, given that transformer insulation systems are expected to last several decades before failure occurs. It is therefore appropriate to perform accelerated ageing procedures, whereby the ageing process is accelerated in laboratory conditions. An accelerated vessel ageing procedure is more rapid, less expensive, and provides samples with a controlled thermal ageing history.
Moisture content in the cellulose based paper (pressboard) samples was measured at about 6% using Karl Fisher coulometer. These pressboard samples were carefully dried under vacuum (<1 mbar, 48 h at 110 °C) before impregnation, with a degassed and dehumidified commercial grade mineral oil sample. The degasification and dehumidification took place in a two stage dehydrating and degassing column [6,15]. This procedure allowed reducing the moisture content in the oil from 18 to 5 ppm and from 6 to 1% in the pressboard.
The oil impregnated pressboard samples were aged in laboratory conditions. The samples of paper specimens were calendared 70 × 70 mm² to fit the test cell depicted in Figure 1. This ageing procedure which is similar to that described in the ASTM D1934 [30], allows studying the stability of electrical insulating oils under oxidative conditions. The ageing was achieved by placing the oil impregnated paper specimens in a convection oven at 115 °C for different durations, i.e., 72, 144, 240, 425 and 500 h. The specimens were aged within unsealed vessels to allow oxygen access. Small samples of the pressboard were included in the ageing vessel for Karl Fisher titrations and the degree of polymerization (DP) measurements.
Figure 1. Overview of the capacitive test cell used for the measurement of dielectric response of the oil impregnated pressboard: 1. High-voltage electrode; 2. Measuring electrode; 3. Guard-ring and 4. pressboard sample.
Energies 06 02204 g001
Portable user friendly equipment IDA 200 [31], was used to evaluate frequency scan of insulation material properties in a wide frequency range. This instrument allows the frequency scan of the capacitance, power factor, dielectric constant and dielectric losses over essential frequency ranges, that is from 0.1 mHz to 1 kHz (typically 1 mHz to 1 kHz). The equipment was directly connected to the capacitive test cell located in the aging vessel. To shorten the duration of the experimental work, the investigations were performed from 0.01 to 1000 Hz; low frequency measurements down to 0.1 mHz being particularly a long time consuming process. The results are summarized and discussed in the next section.

4. Results of the Investigations

Transformer insulation aging by-products are mostly polar in nature and affect DDF/conductivity as well as the permittivity and the capacitance. Thus, knowledge of the oil-impregnated pressboard DDF can be used as an important parameter allowing assessment of insulation condition.
The DDF of a dielectric material is a complex function of at least two variables—frequency and temperature, although aging, moisture and pressure may be other physical variables [4,5,6,7,8,9,10,11,12,13,14,15,16]. A complete representation should therefore be “three-dimensional” plots, but these are cumbersome and are therefore seldom employed, although modern computer graphics enable one to plot third-angle projections in two dimensions. The prevailing method of representation consists therefore in plotting the frequency dependence with aging duration as parameter. The frequency scan of the DDF is given in Figure 2. The dissipation factor is very large for the aged samples, which reflects worse condition of oil and paper.
Figure 2. Effect of ageing on the DDF of oil impregnated pressboard samples measured at 115 °C.
Energies 06 02204 g002
The measurements in low frequencies are important because that is where insulation degradation is most clearly indicated [2,3,4,5,6,7,8,9,10,11,12,13,14,15,16,17,18,19,20,21]. Figure 3 is generated from Figure 2 by zooming in on the frequency ranges from 0.01 to 10 Hz. It can be observed that below 0.1 Hz, the DDF values increase with aging. Low frequency measurements appear to be very helpful for monitoring accurately the condition of insulation. Therefore, at low frequencies, different ageing cases can be detected. This is in agreement with investigations reported by other researchers [3,15,17]. The dielectric response which is known to be a unique characteristic of the insulation system can be used to derive equivalent models.
Figure 3. Zoomed view of Figure 2, in the frequency ranges from 0.01 to 10 Hz.
Energies 06 02204 g003
In the literature, equilibrium curves describing the relationship between moisture in oil and moisture in the solid insulation material can be found [32]. However, these curves are only valid when the moisture distribution inside the oil-paper insulation reaches a complete equilibrium condition. The condition is known to be strongly temperature- dependent. As the time constant of moisture migration from oil to solid insulation and vice versa is about 6 h at 70 °C [3,32], equilibrium at a constant ageing of 115 °C might have been reached. So to speak, it can be accepted that FDS measurements were not affected by moisture migration.

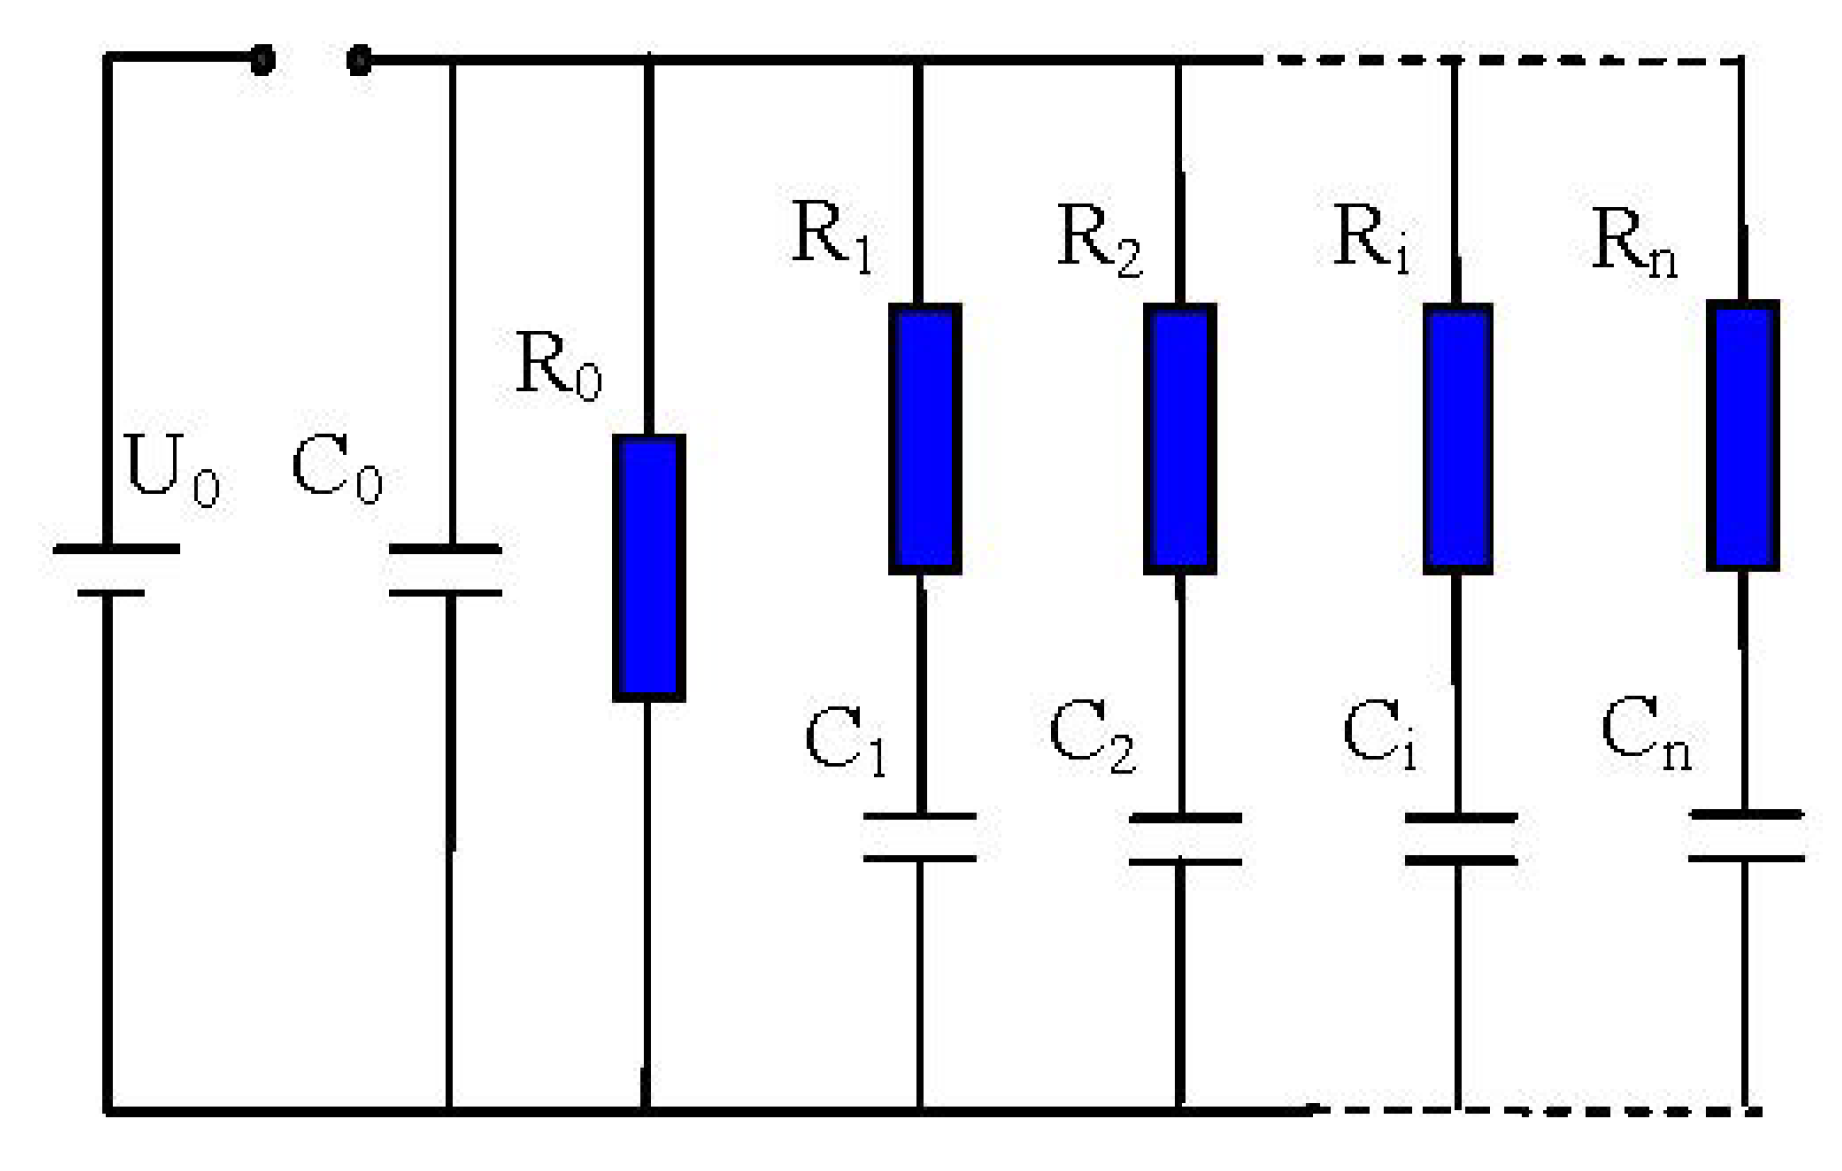
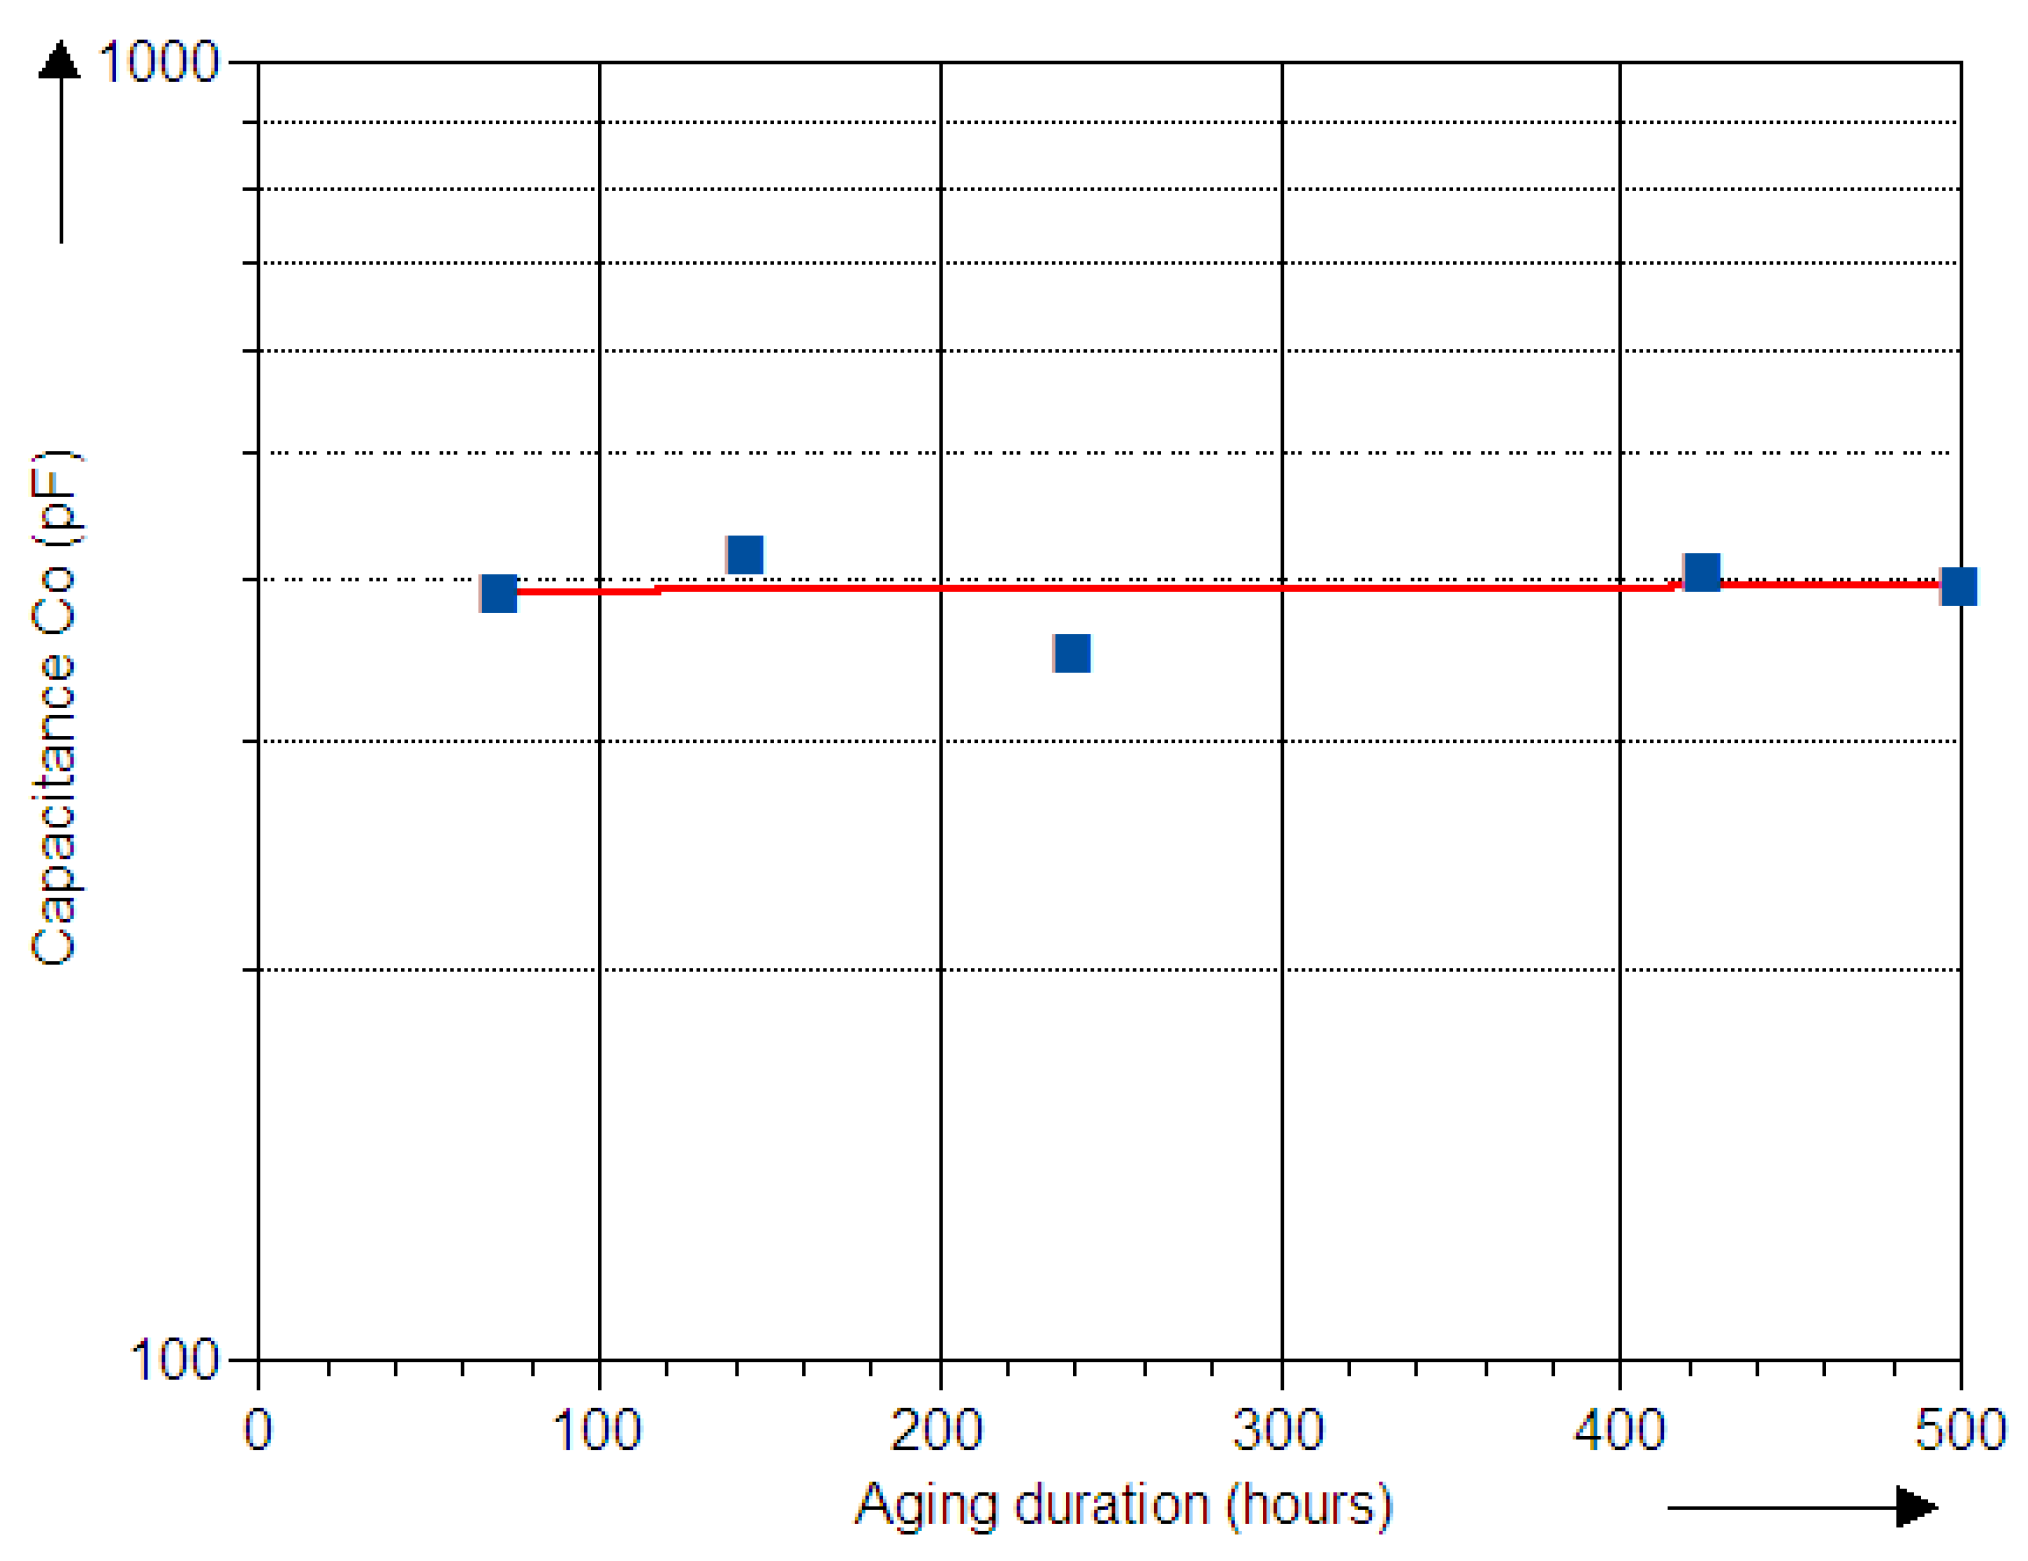
4.1. Insulation Model for Dielectric Response

For a better understanding of the dielectric response, a number of equivalent circuits have been proposed over the last few years [5,6,19] to model transformer oil/paper insulation systems. In essence, all of the models proposed so far have been derived from an extended Debye approach based on a simple RC model. This model consists in a parallel arrangement of branches, each containing a series connection of resistor and capacitor. Figure 4 depicts such arrangement adapted to the multilayer oil-paper insulation.
Figure 4. Modelling the dielectric response of a multilayer insulation by means of equivalent circuits.
Energies 06 02204 g004
The conduction current in the insulation is due to the insulation resistance R0 while C0 represents the geometric capacitance of the insulation system [5,6,19]. The equivalent circuit model parameters were obtained using a non-linear optimisation procedure with the help of software code "fminsearch" written in MATLAB library [6]. This code is based on “Nelder-Mead Simplex Method” [33]. Ri − Ci branch values of the equivalent insulation model (Figure 4) have been calculated from data reported in Figure 2. For this test cell, only one parallel branch was considered to find the best fitting. The predicted values are plotted in Figure 5 and Figure 6.
Figure 5. Predicted variation of the resistance R0 (at 115 °C) as function of thermal ageing duration.
Energies 06 02204 g005
Figure 6. Predicted variation of capacitance C0 (at 115 °C) as a function of thermal ageing.
Energies 06 02204 g006
The insulation resistance provides information about the overall status of the insulation. A higher value indicates better condition of the insulation, whereas lower corresponds to aged/moistened insulation. Lower values can also be related to measurement performed at higher temperatures [3,4,5]. From Figure 6, it can be seen that the values of the capacitances C0 are almost not affected by the thermal ageing.
However, in order to apply this approach to different equipment with different insulation geometry and volume, it is essential to introduce a geometry-independent parameter. A systematic sensitivity study of different parameters that affect the FDS data can be found in the literature [3,4,5,18,19,20]. Detailed experimental investigations performed by Pradhan and Yew [18] emphasized the influence of oil/paper volume on the dielectric spectroscopic measurements. Producing a measure for insulation which does not require volume/geometry might therefore be very helpful.
Considering theoretical relationships of the insulation resistance and geometrical capacitance, the pole (P) of the insulation may be obtained (S being the cross sectional area and L, the distance between electrodes):
{ R = ρ L S C = ε 0 ε r S L { P = 1 R C P = 1 ρ ε 0 ε r
In thermal ageing, the capacitance C should be constant. However, during thermal ageing and/or strong influence of moisture, resistivity ρ and ε0 and εr are variables and therefore C is not constant any more. The main premise of Equation (3) is to emphasize that “poles” P are independent of geometry for test samples. P therefore depends on dielectric parameters, i.e., resistivity ρ, ε0 and εr. This equation simply suggests using P rather than resistances and capacitances (R and C) as there is no need to evaluate precise geometry or volume components. Small values of P should reflect good insulation, whilst large P values should indicate poor insulation. The issue of how P varies with aging is emphasized in Figure 7.
Figure 7. Poles evolution as a function of thermal ageing duration.
Energies 06 02204 g007
As expected, the poles increase with the degradation of the oil impregnated pressboard. This increase is mainly caused by the variation of resistance, due to the insulation ageing/degradation. The moisture content variation was not large enough to affect the capacitance.

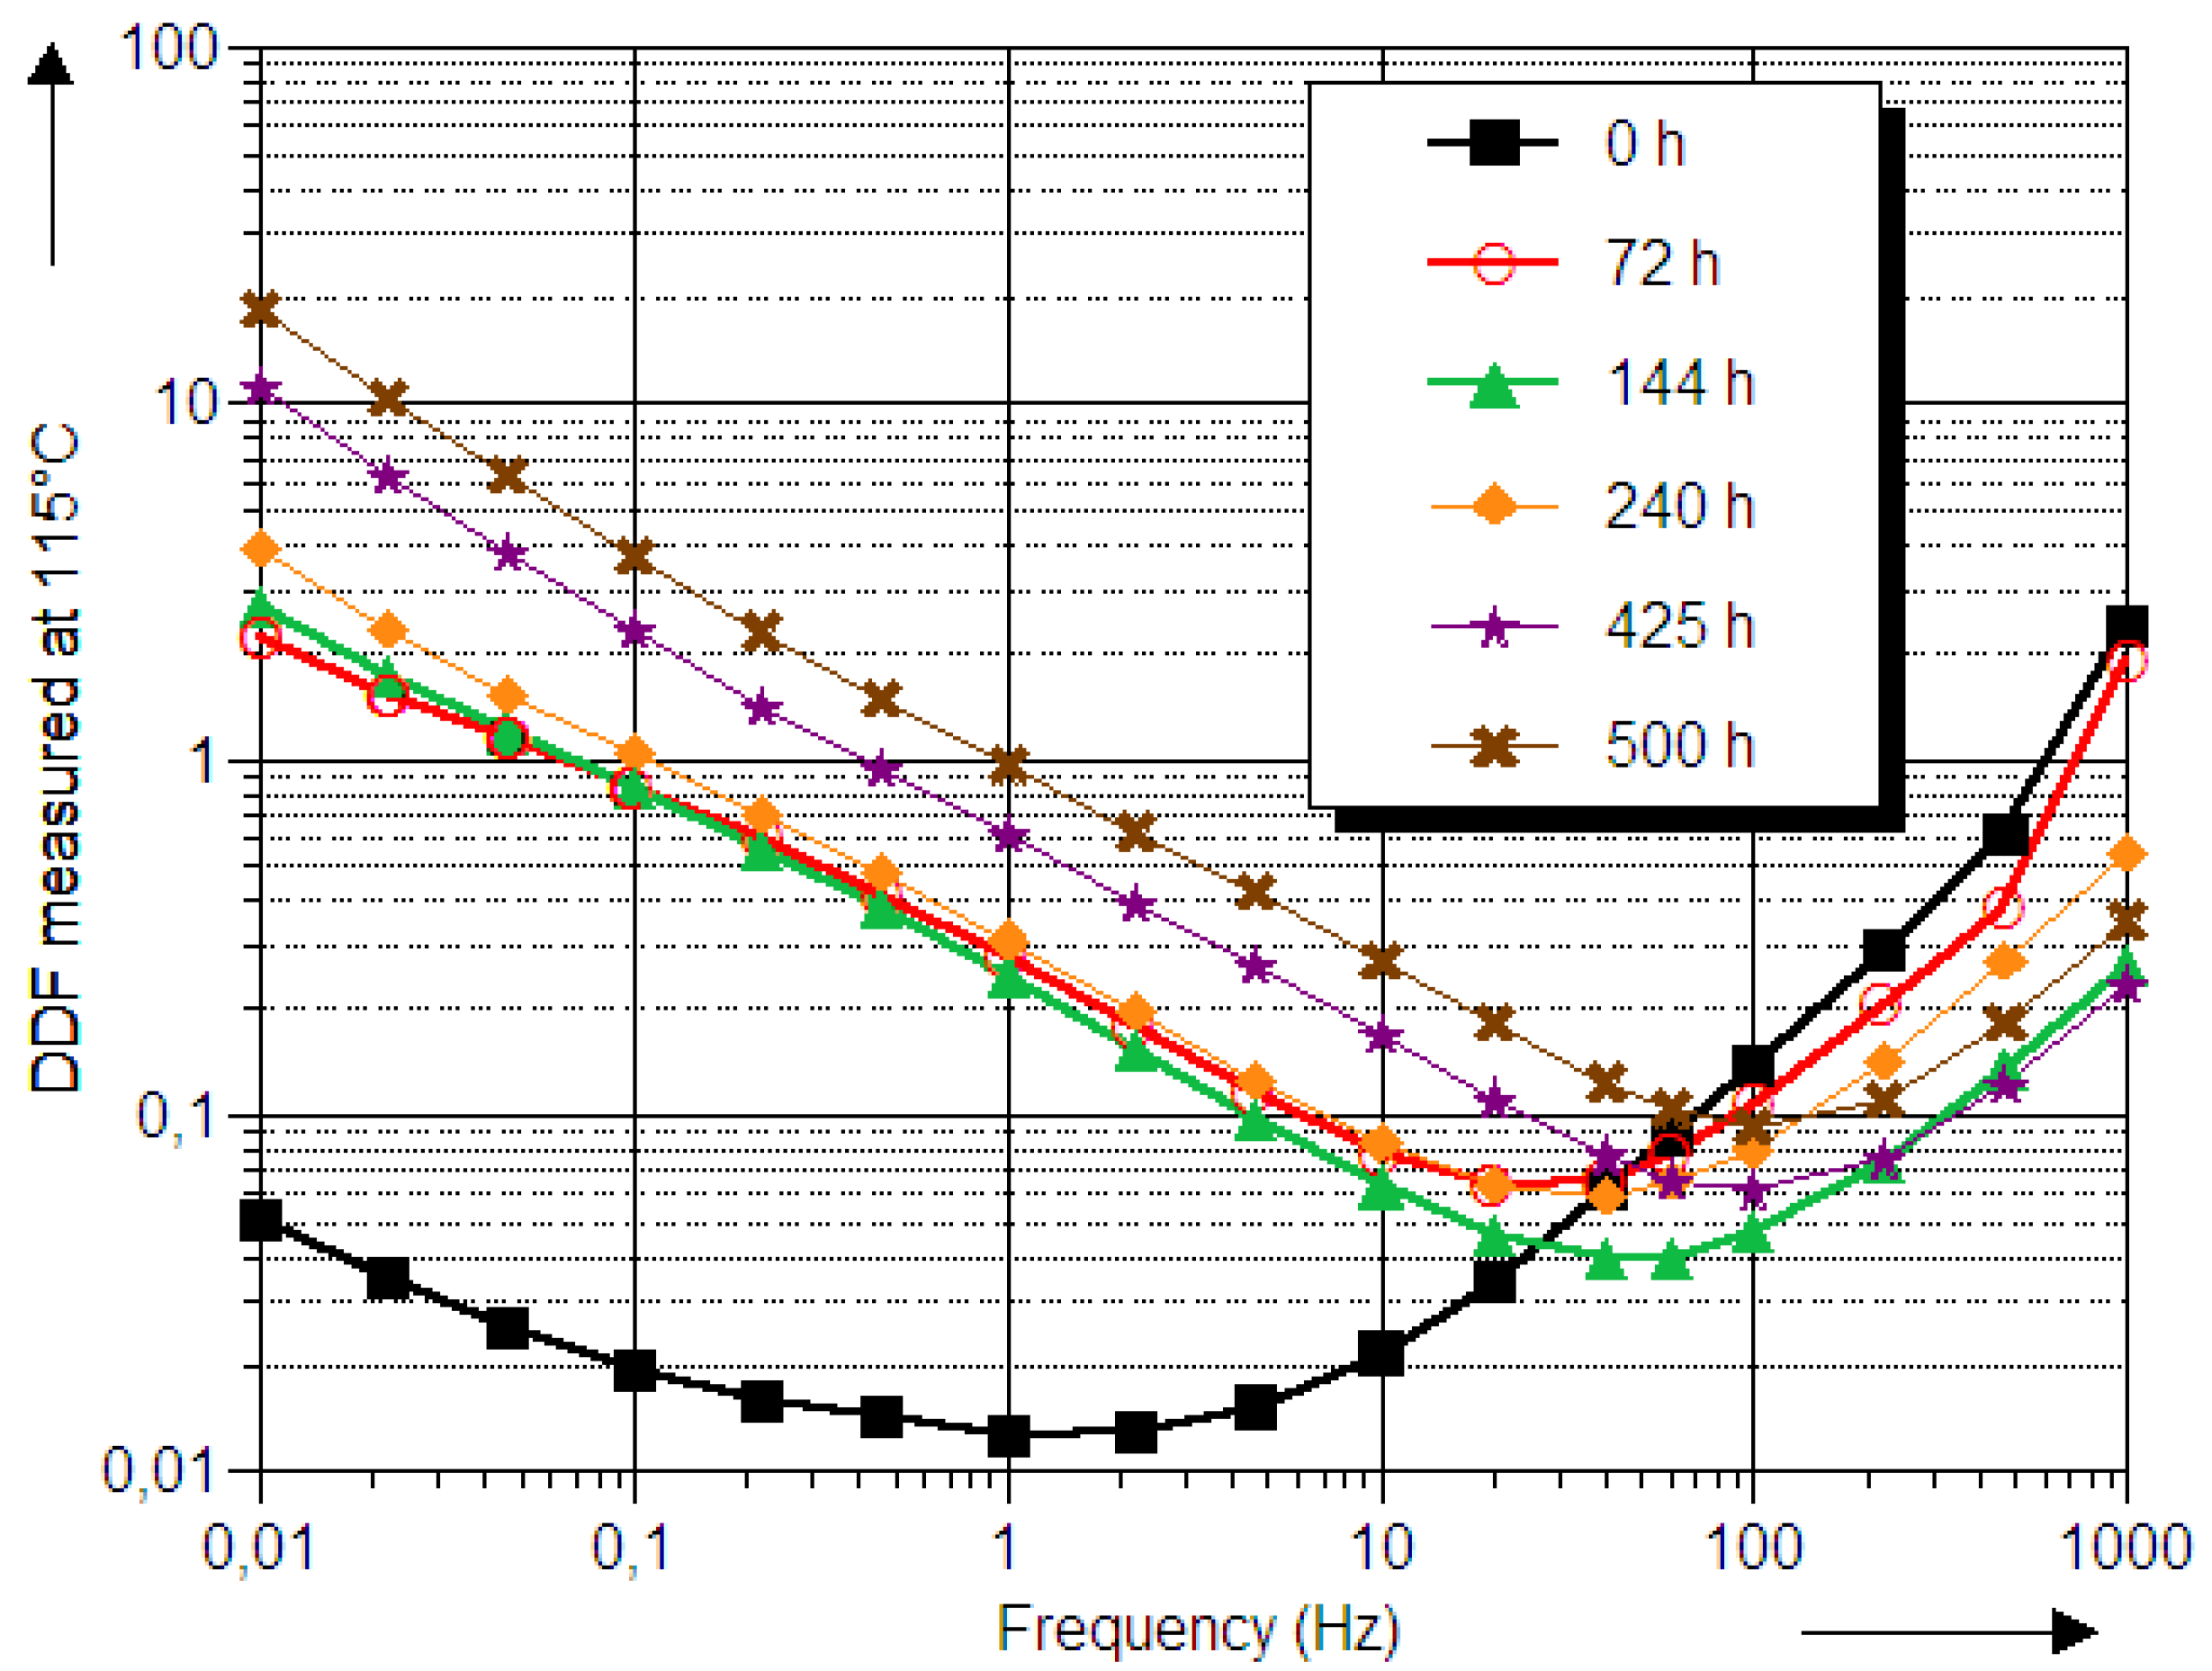
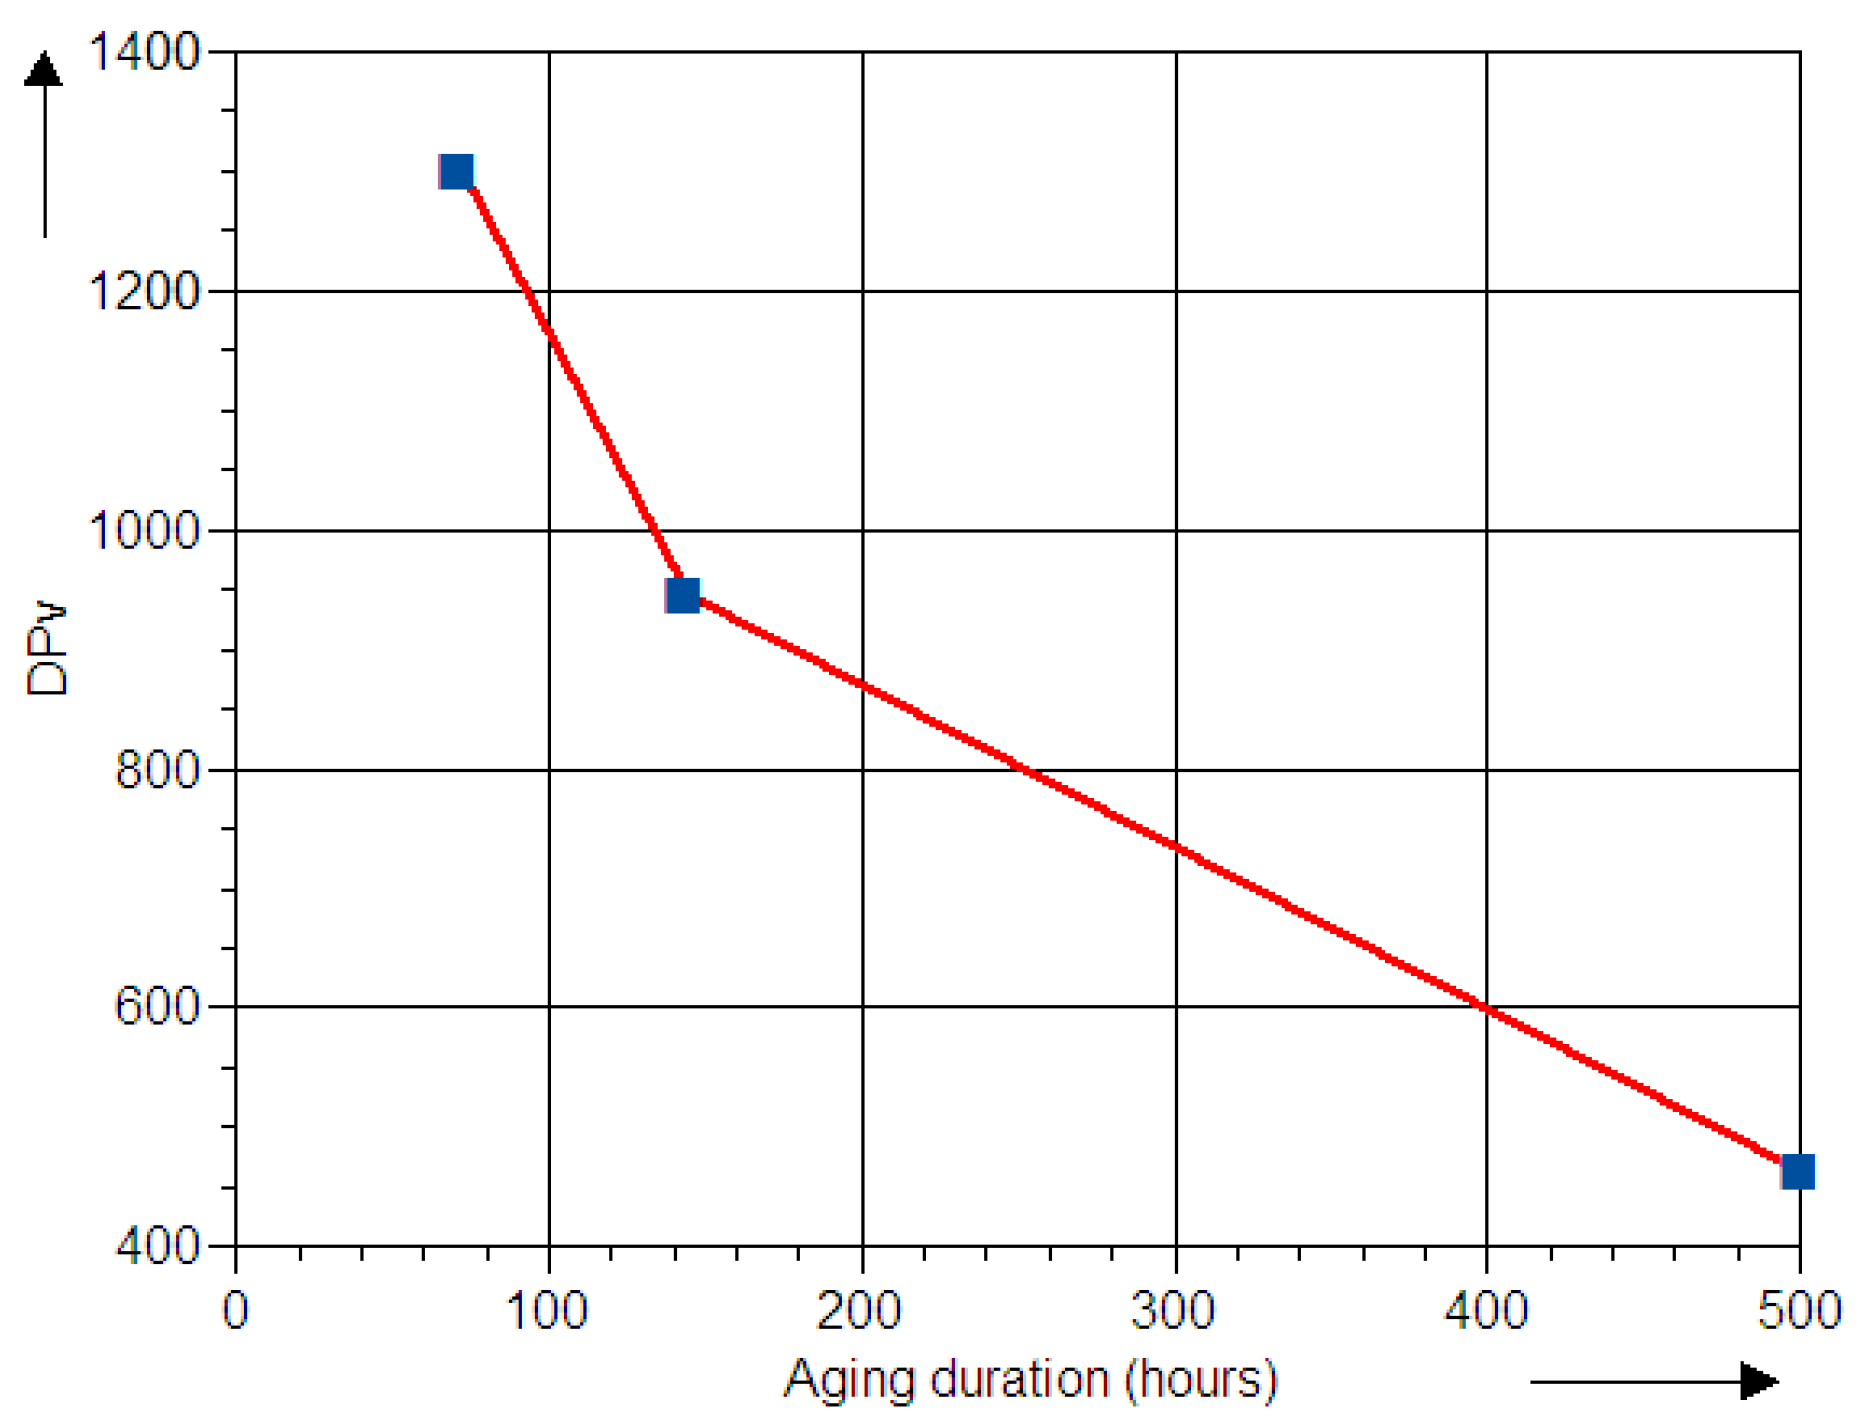
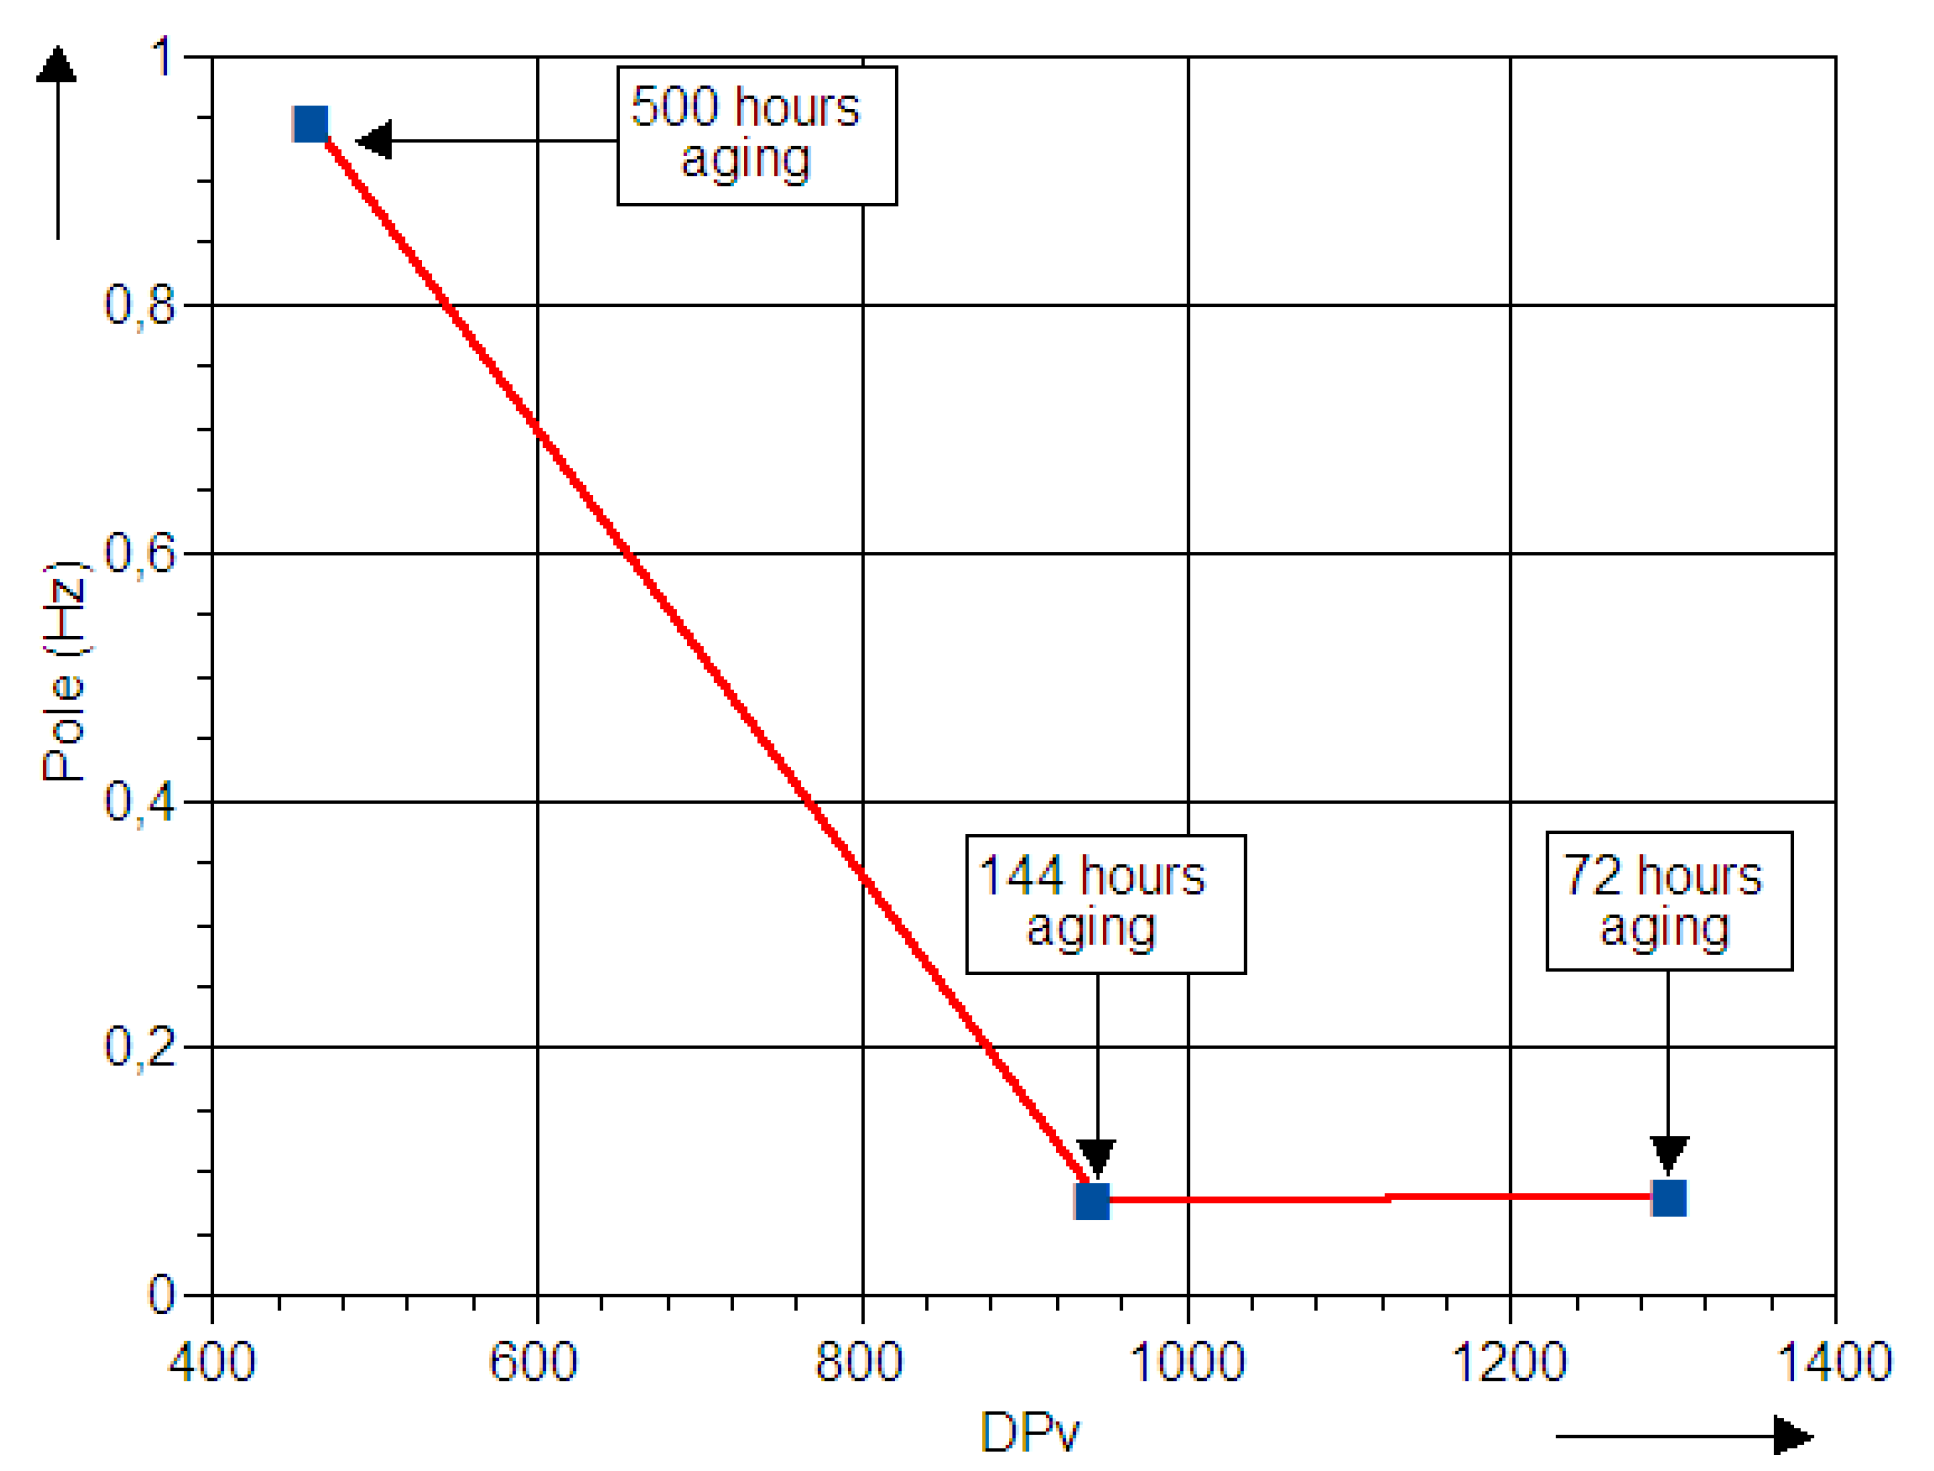
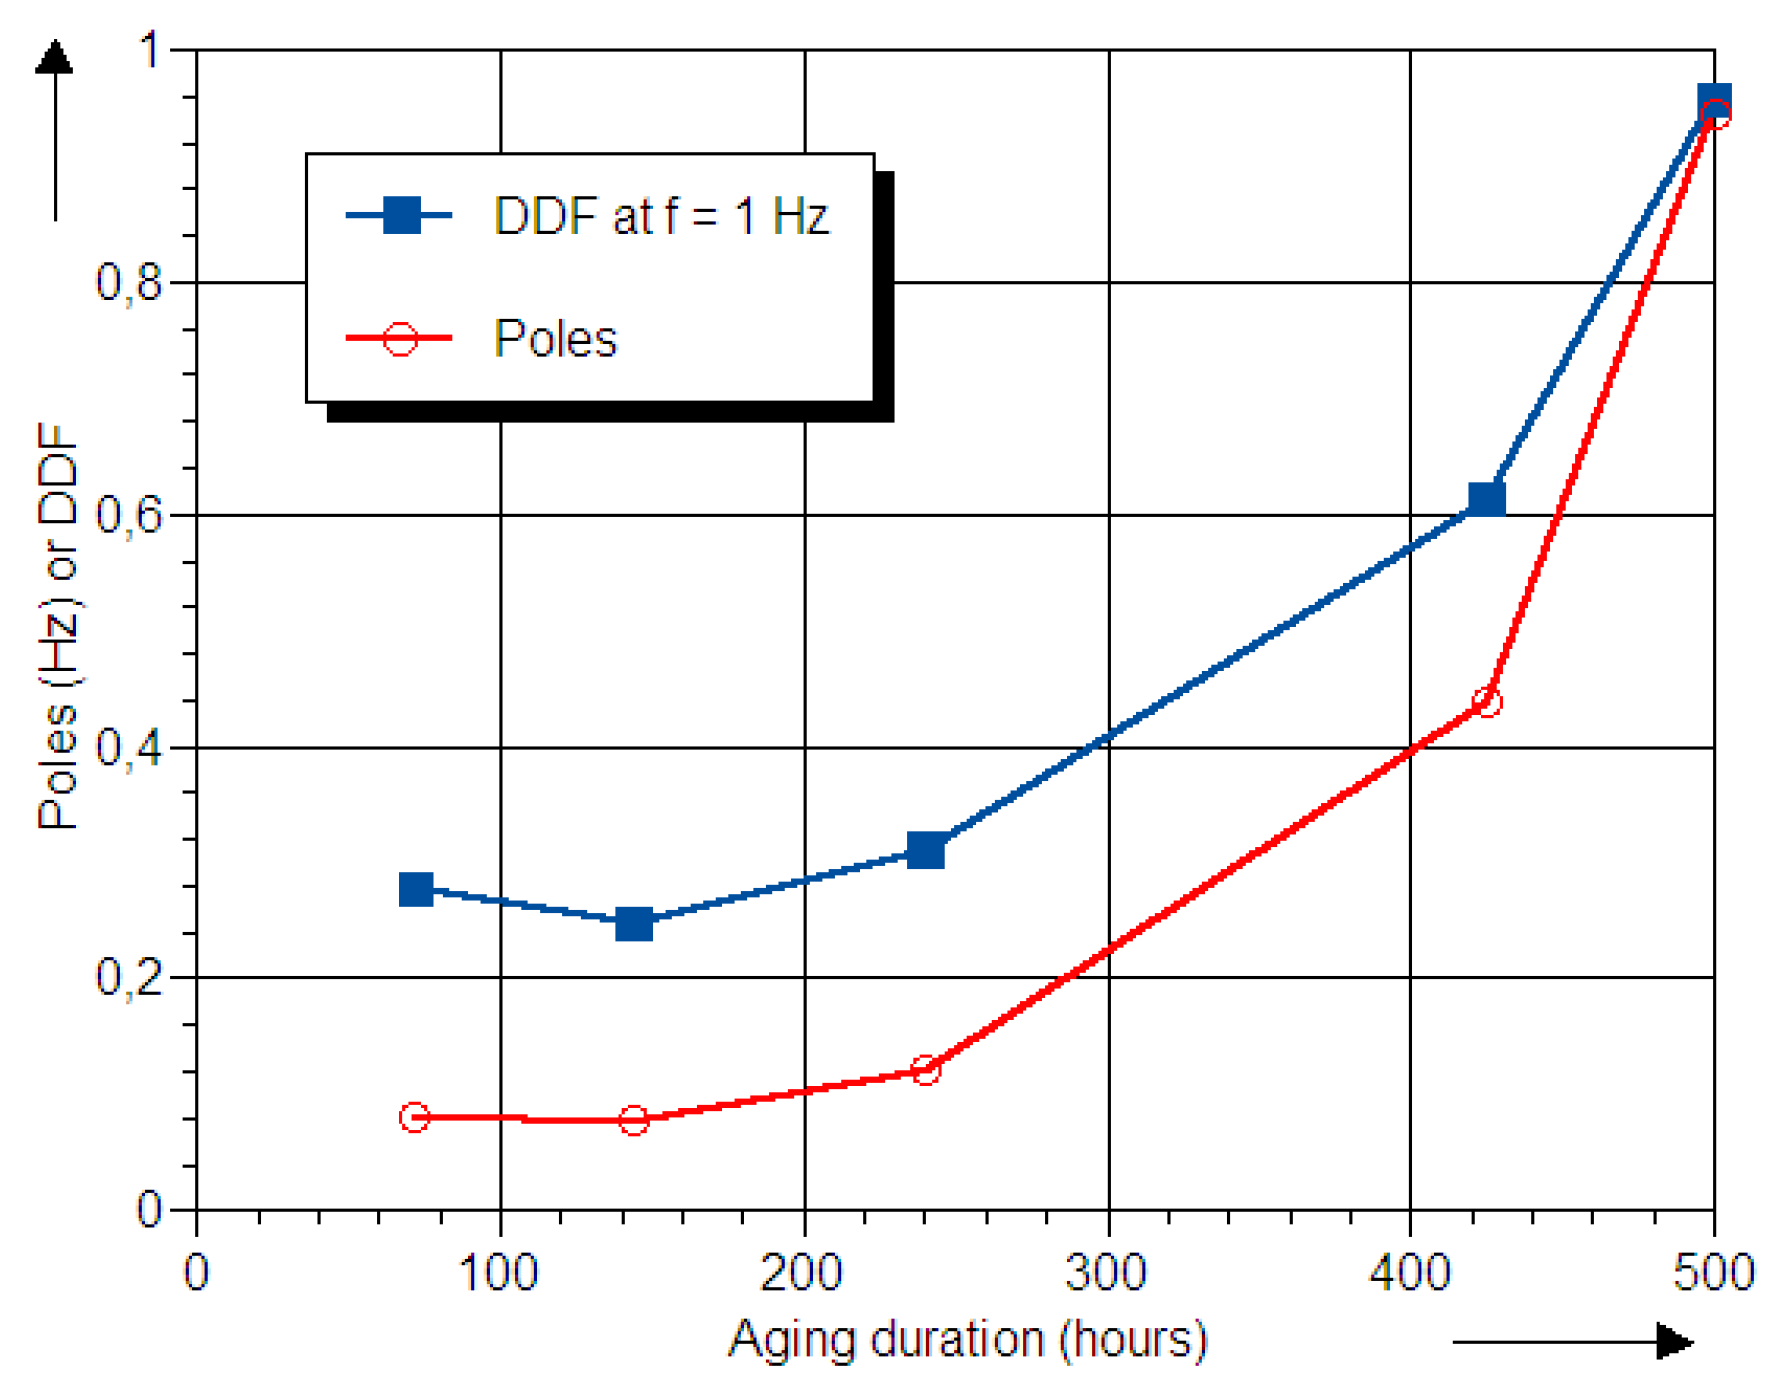
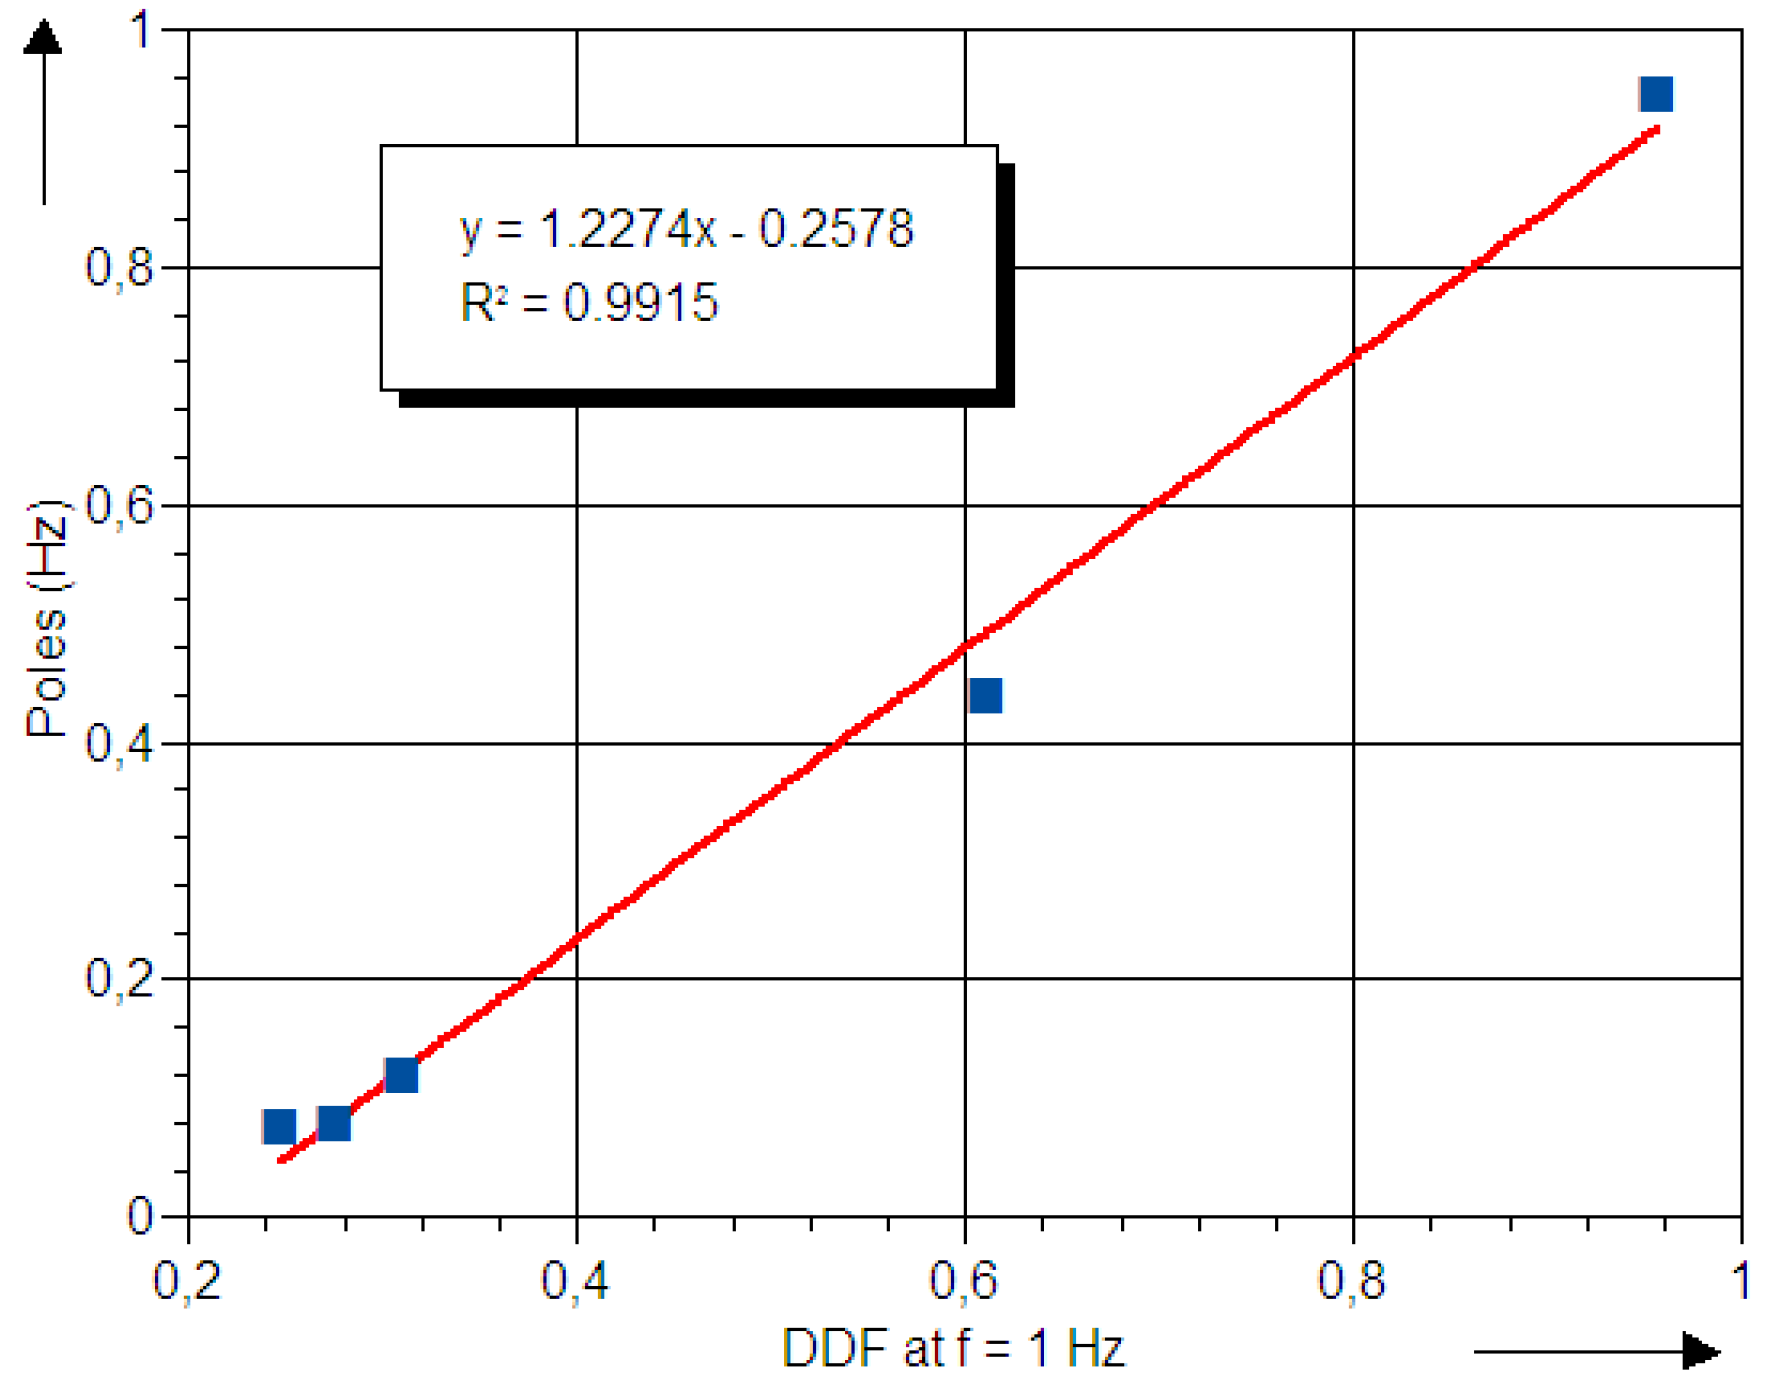
4.2. Using Poles as Aging Indicator

The thermal aging process of paper can be monitored by measuring properties such as tensile strength, degree of polymerisation (DPv), furan content in oil, etc [8]. Many initial works are based on the measurement of the DPv and considering it as a criterion for determining the remaining life of insulation. The DPv of the aged paper samples was measured by average viscosimetry, according to ASTM D4243 [34] and the results reported in Figure 8.
Figure 8. Evolution of the degree of polymerisation as a function of thermal ageing.
Energies 06 02204 g008
Figure 9 presents the evolution of the poles as a function of the degree of polymerisation (DPv).
Figure 9. Relationship between the derived poles and degree of polymerisation (DPv) of the oil impregnated pressboard samples.
Energies 06 02204 g009
From the experimental data, it can be seen that the degradation of the paper resulting from the rupture of the cellulose chains is accompanied by a reduction in the pole values.

4.3. Moisture Content in Oil-Paper Insulation Estimation
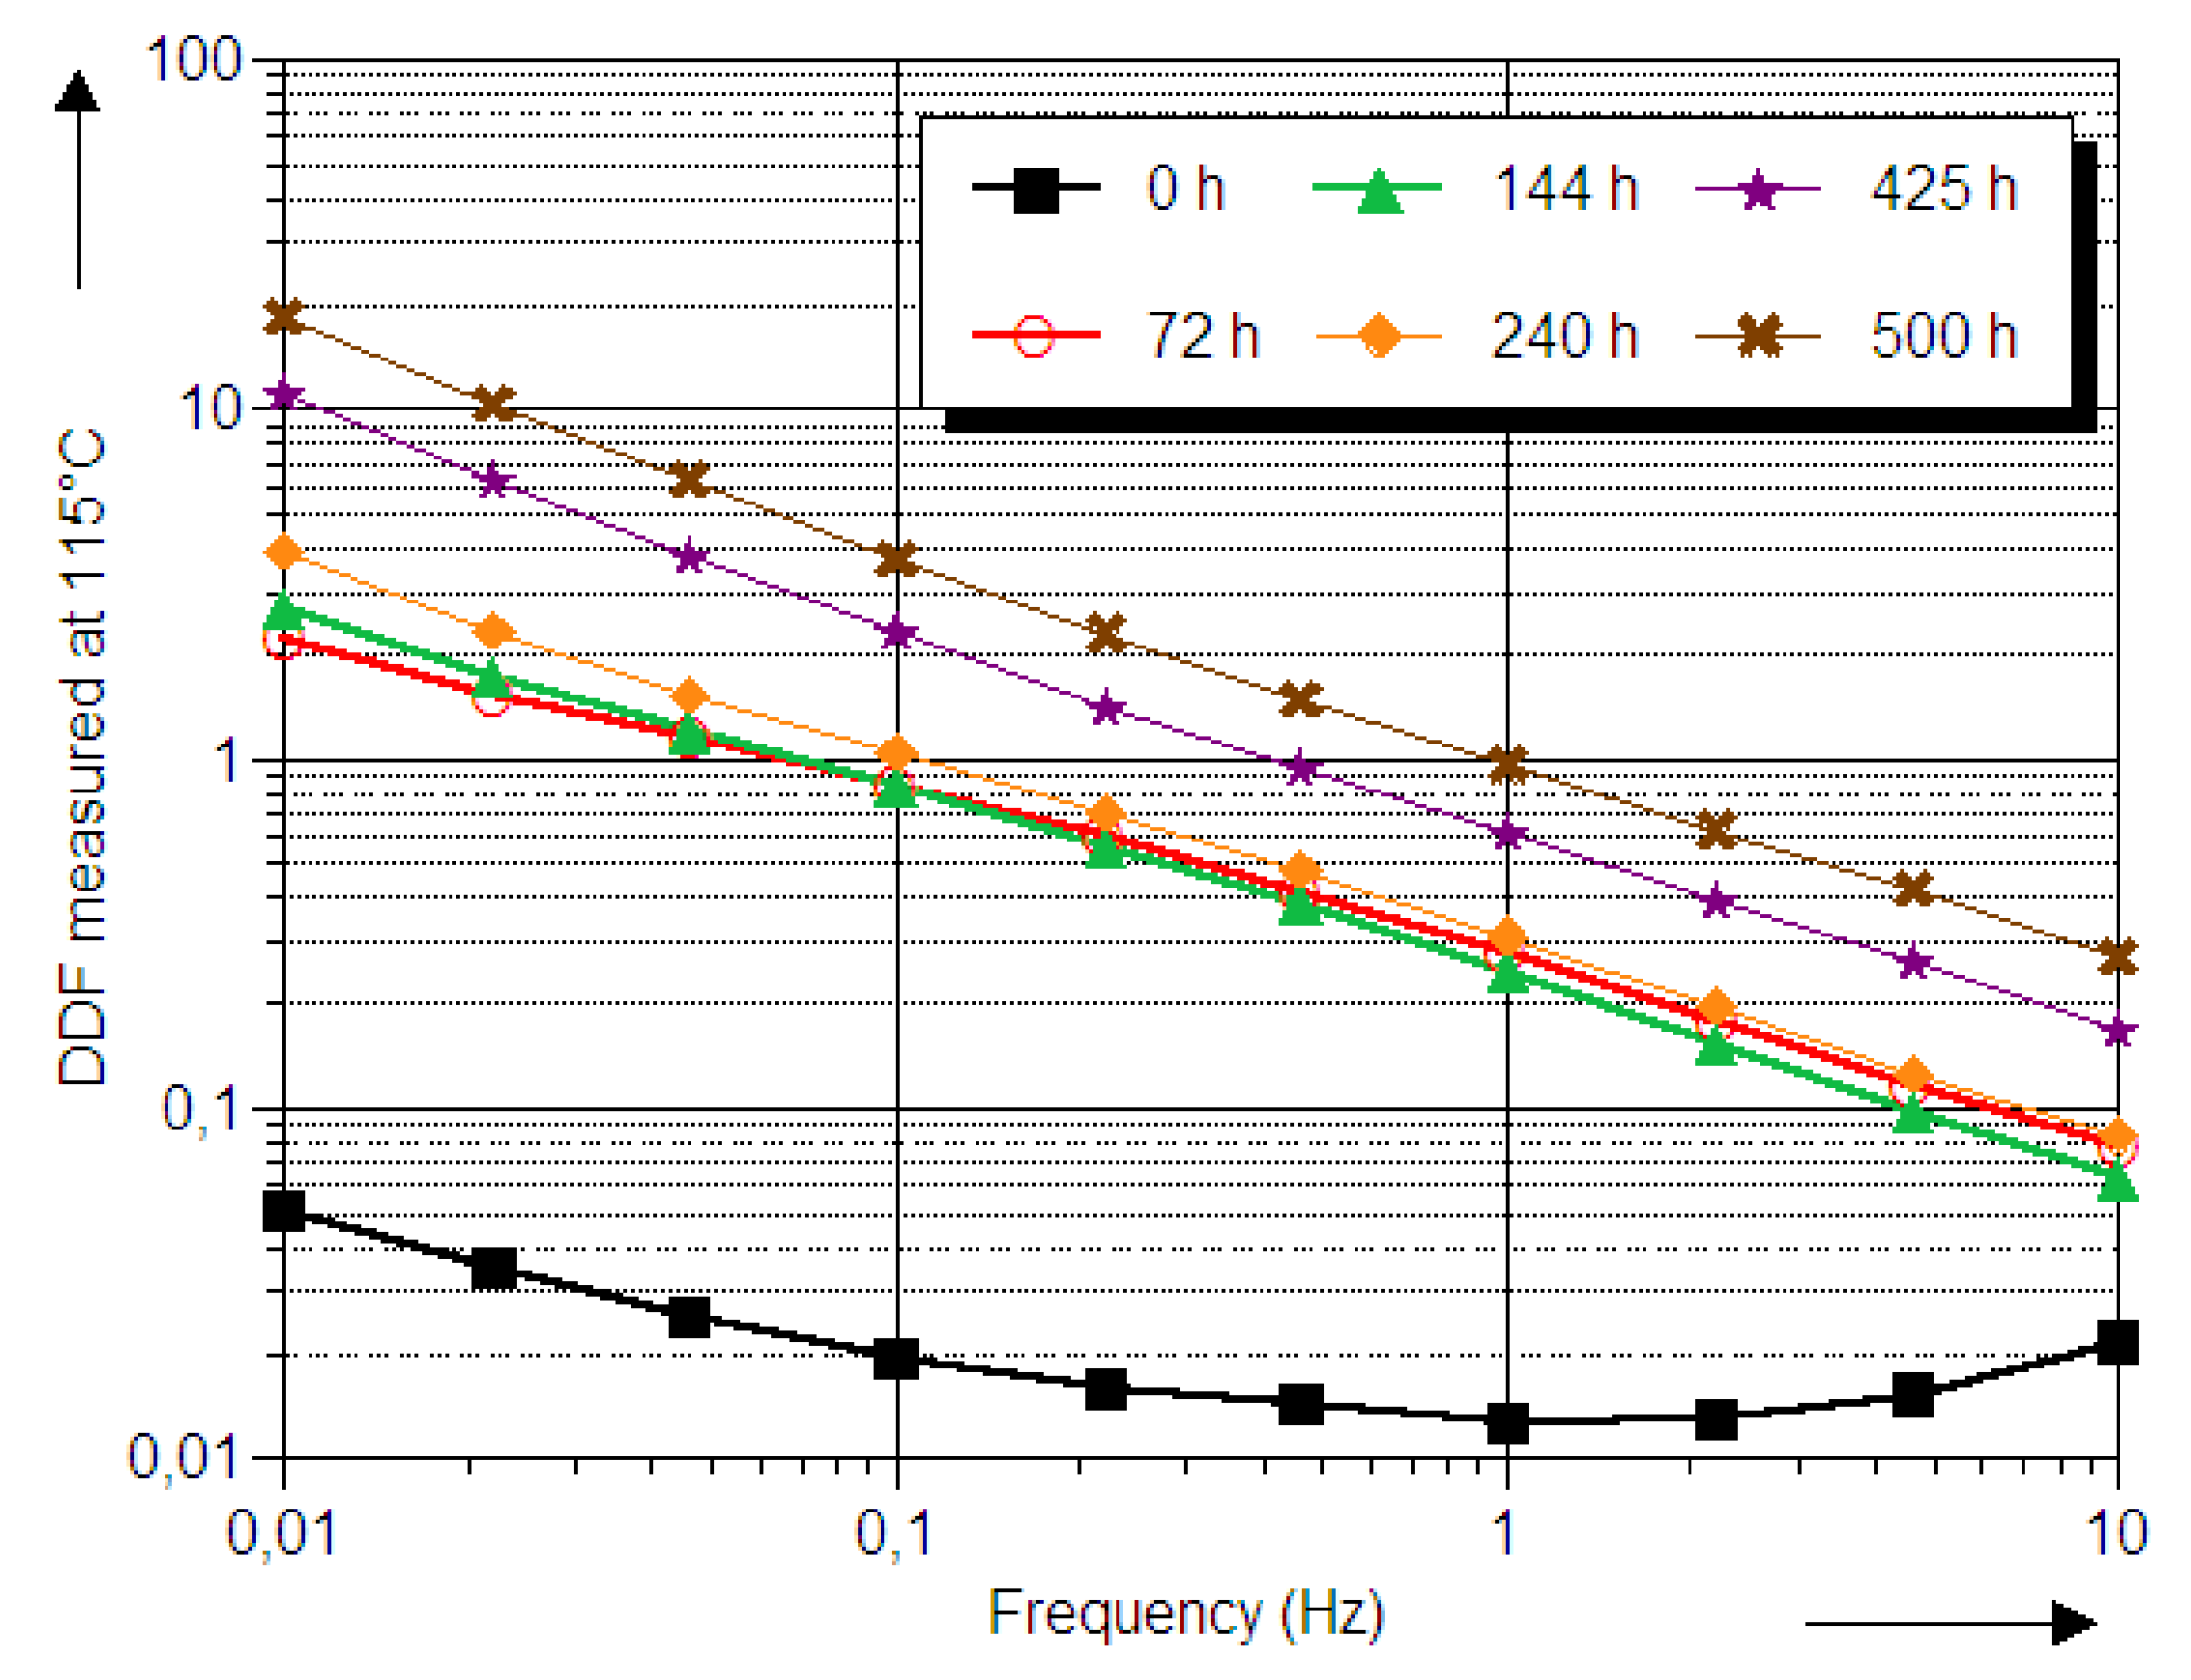
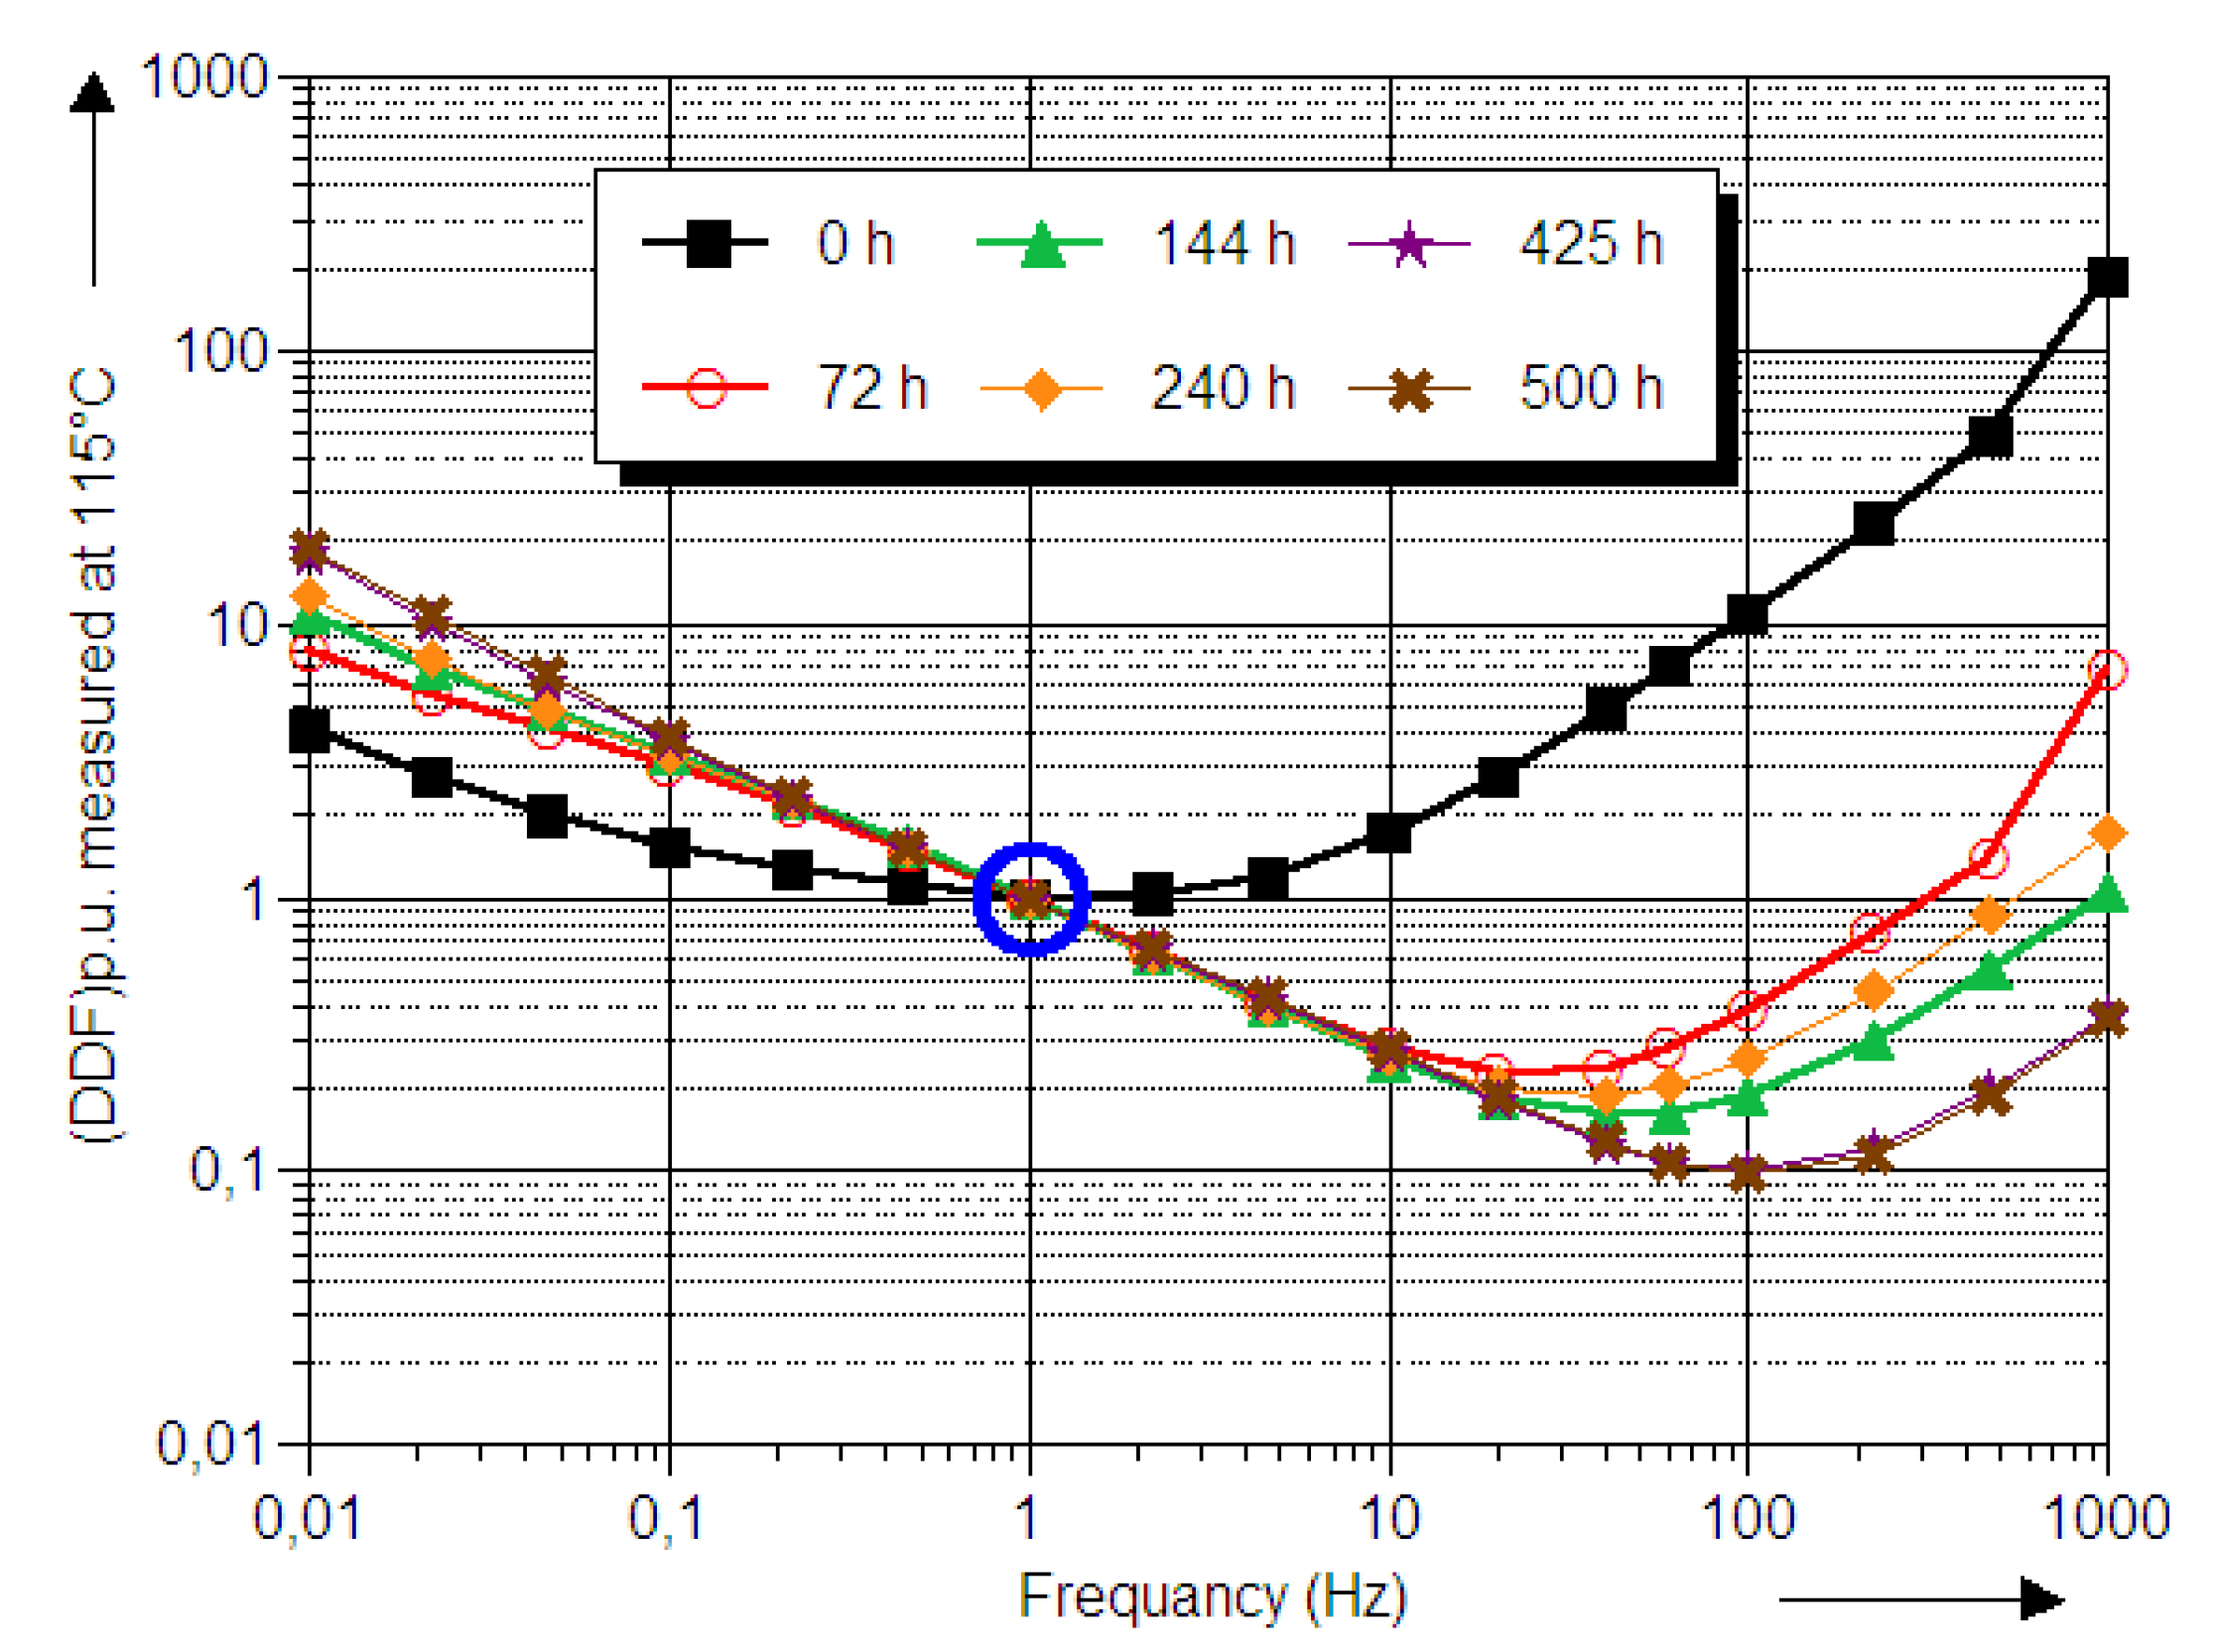
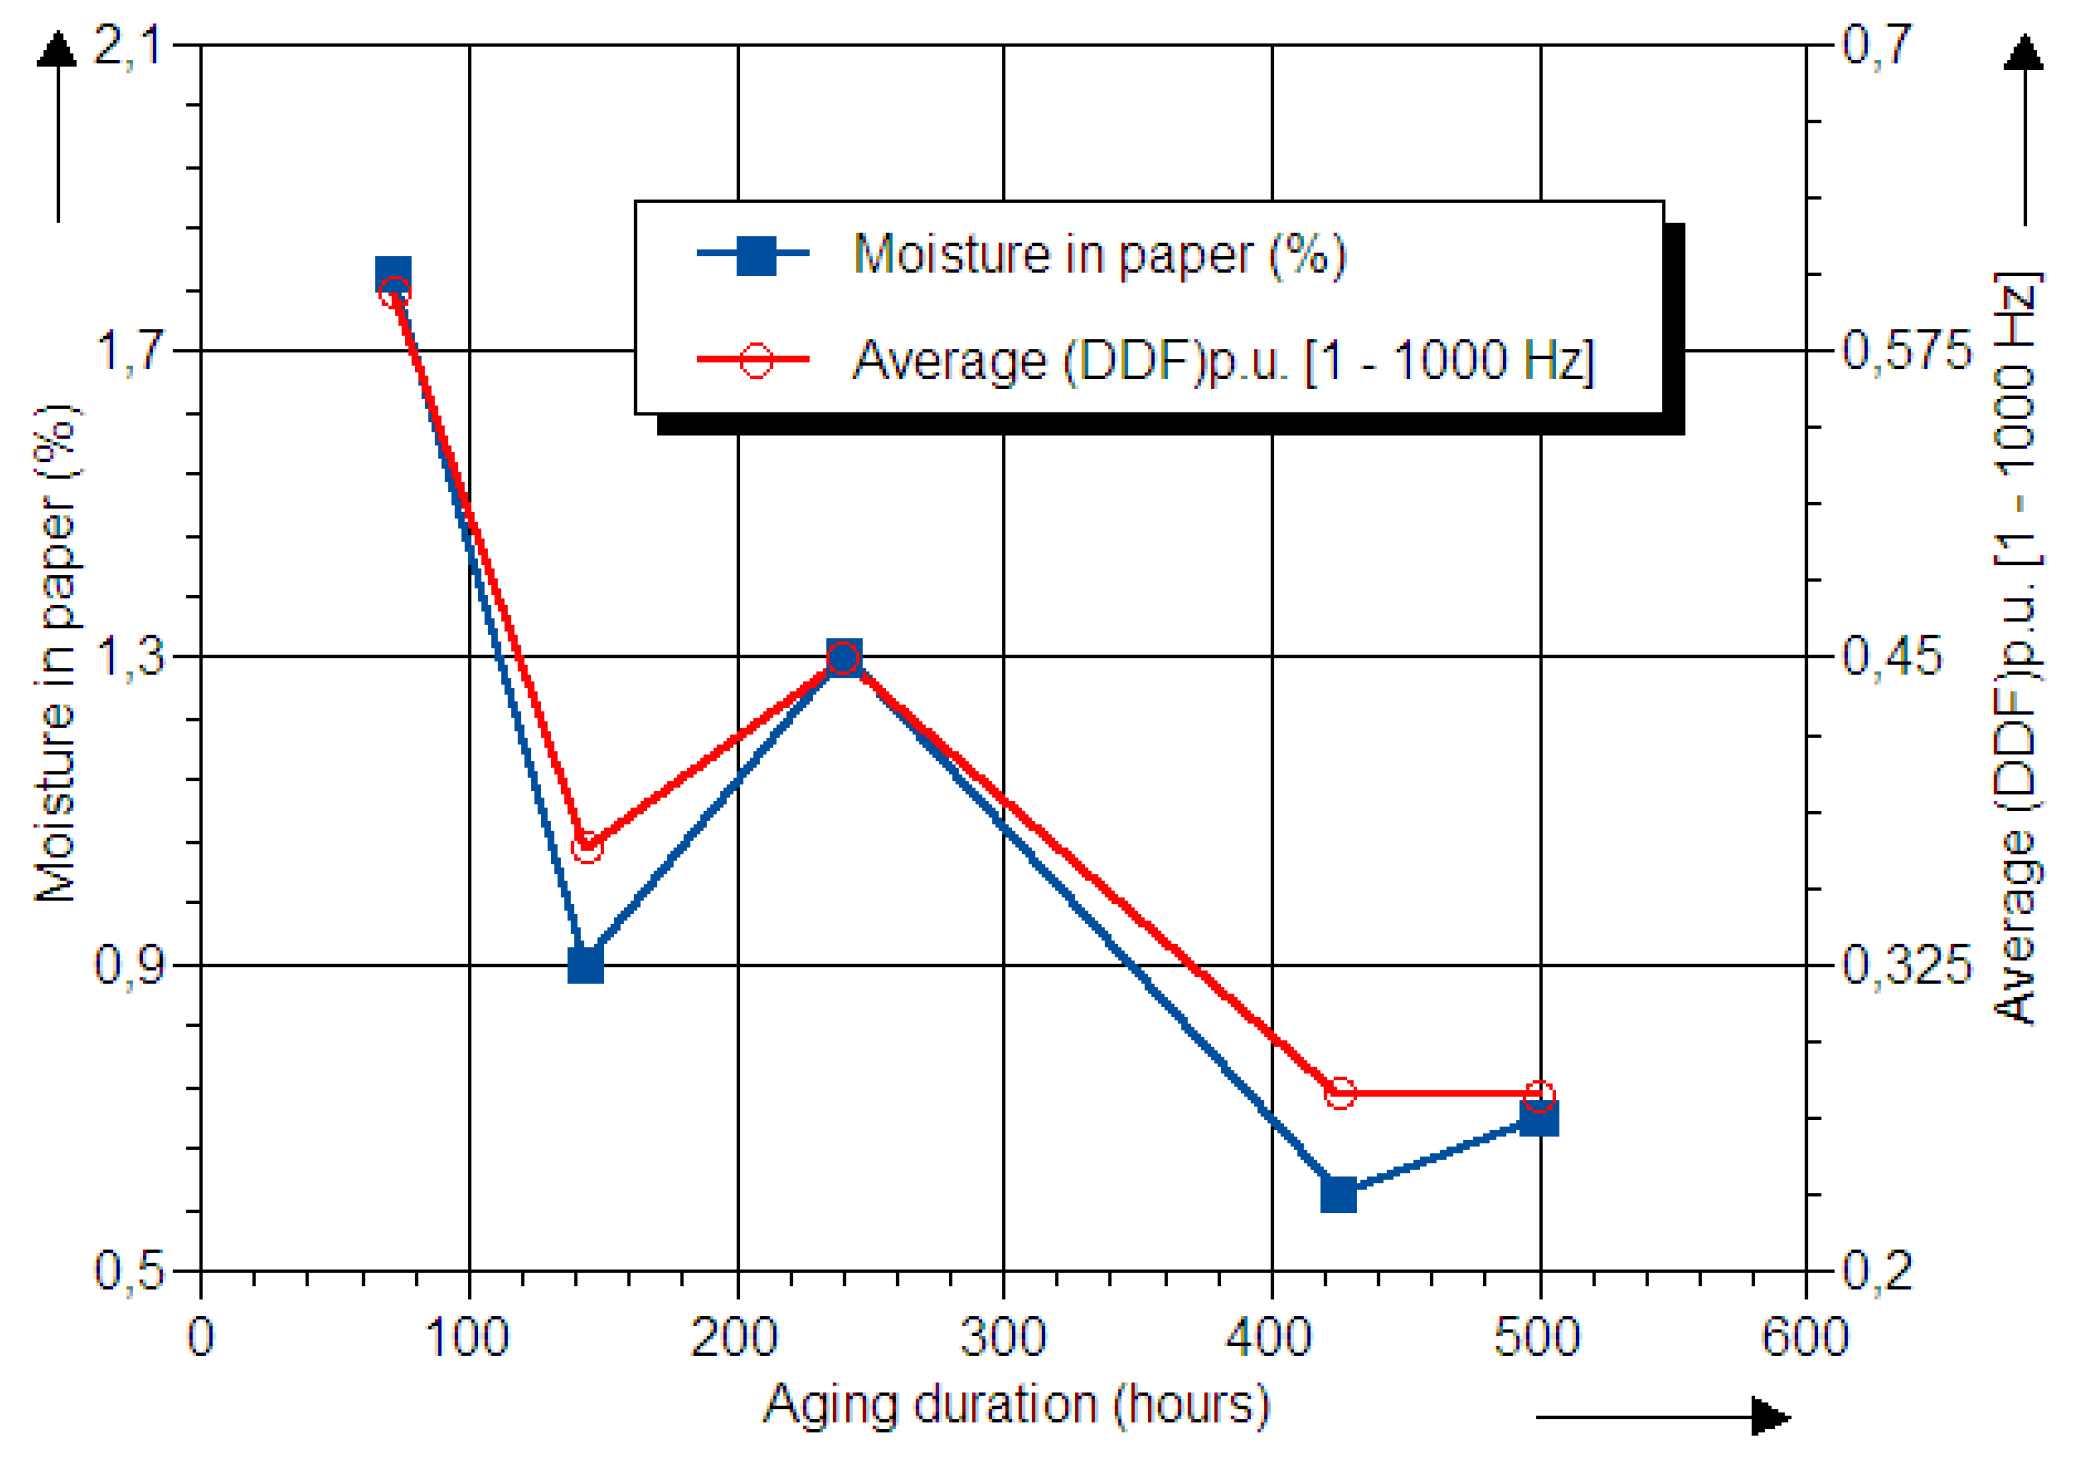
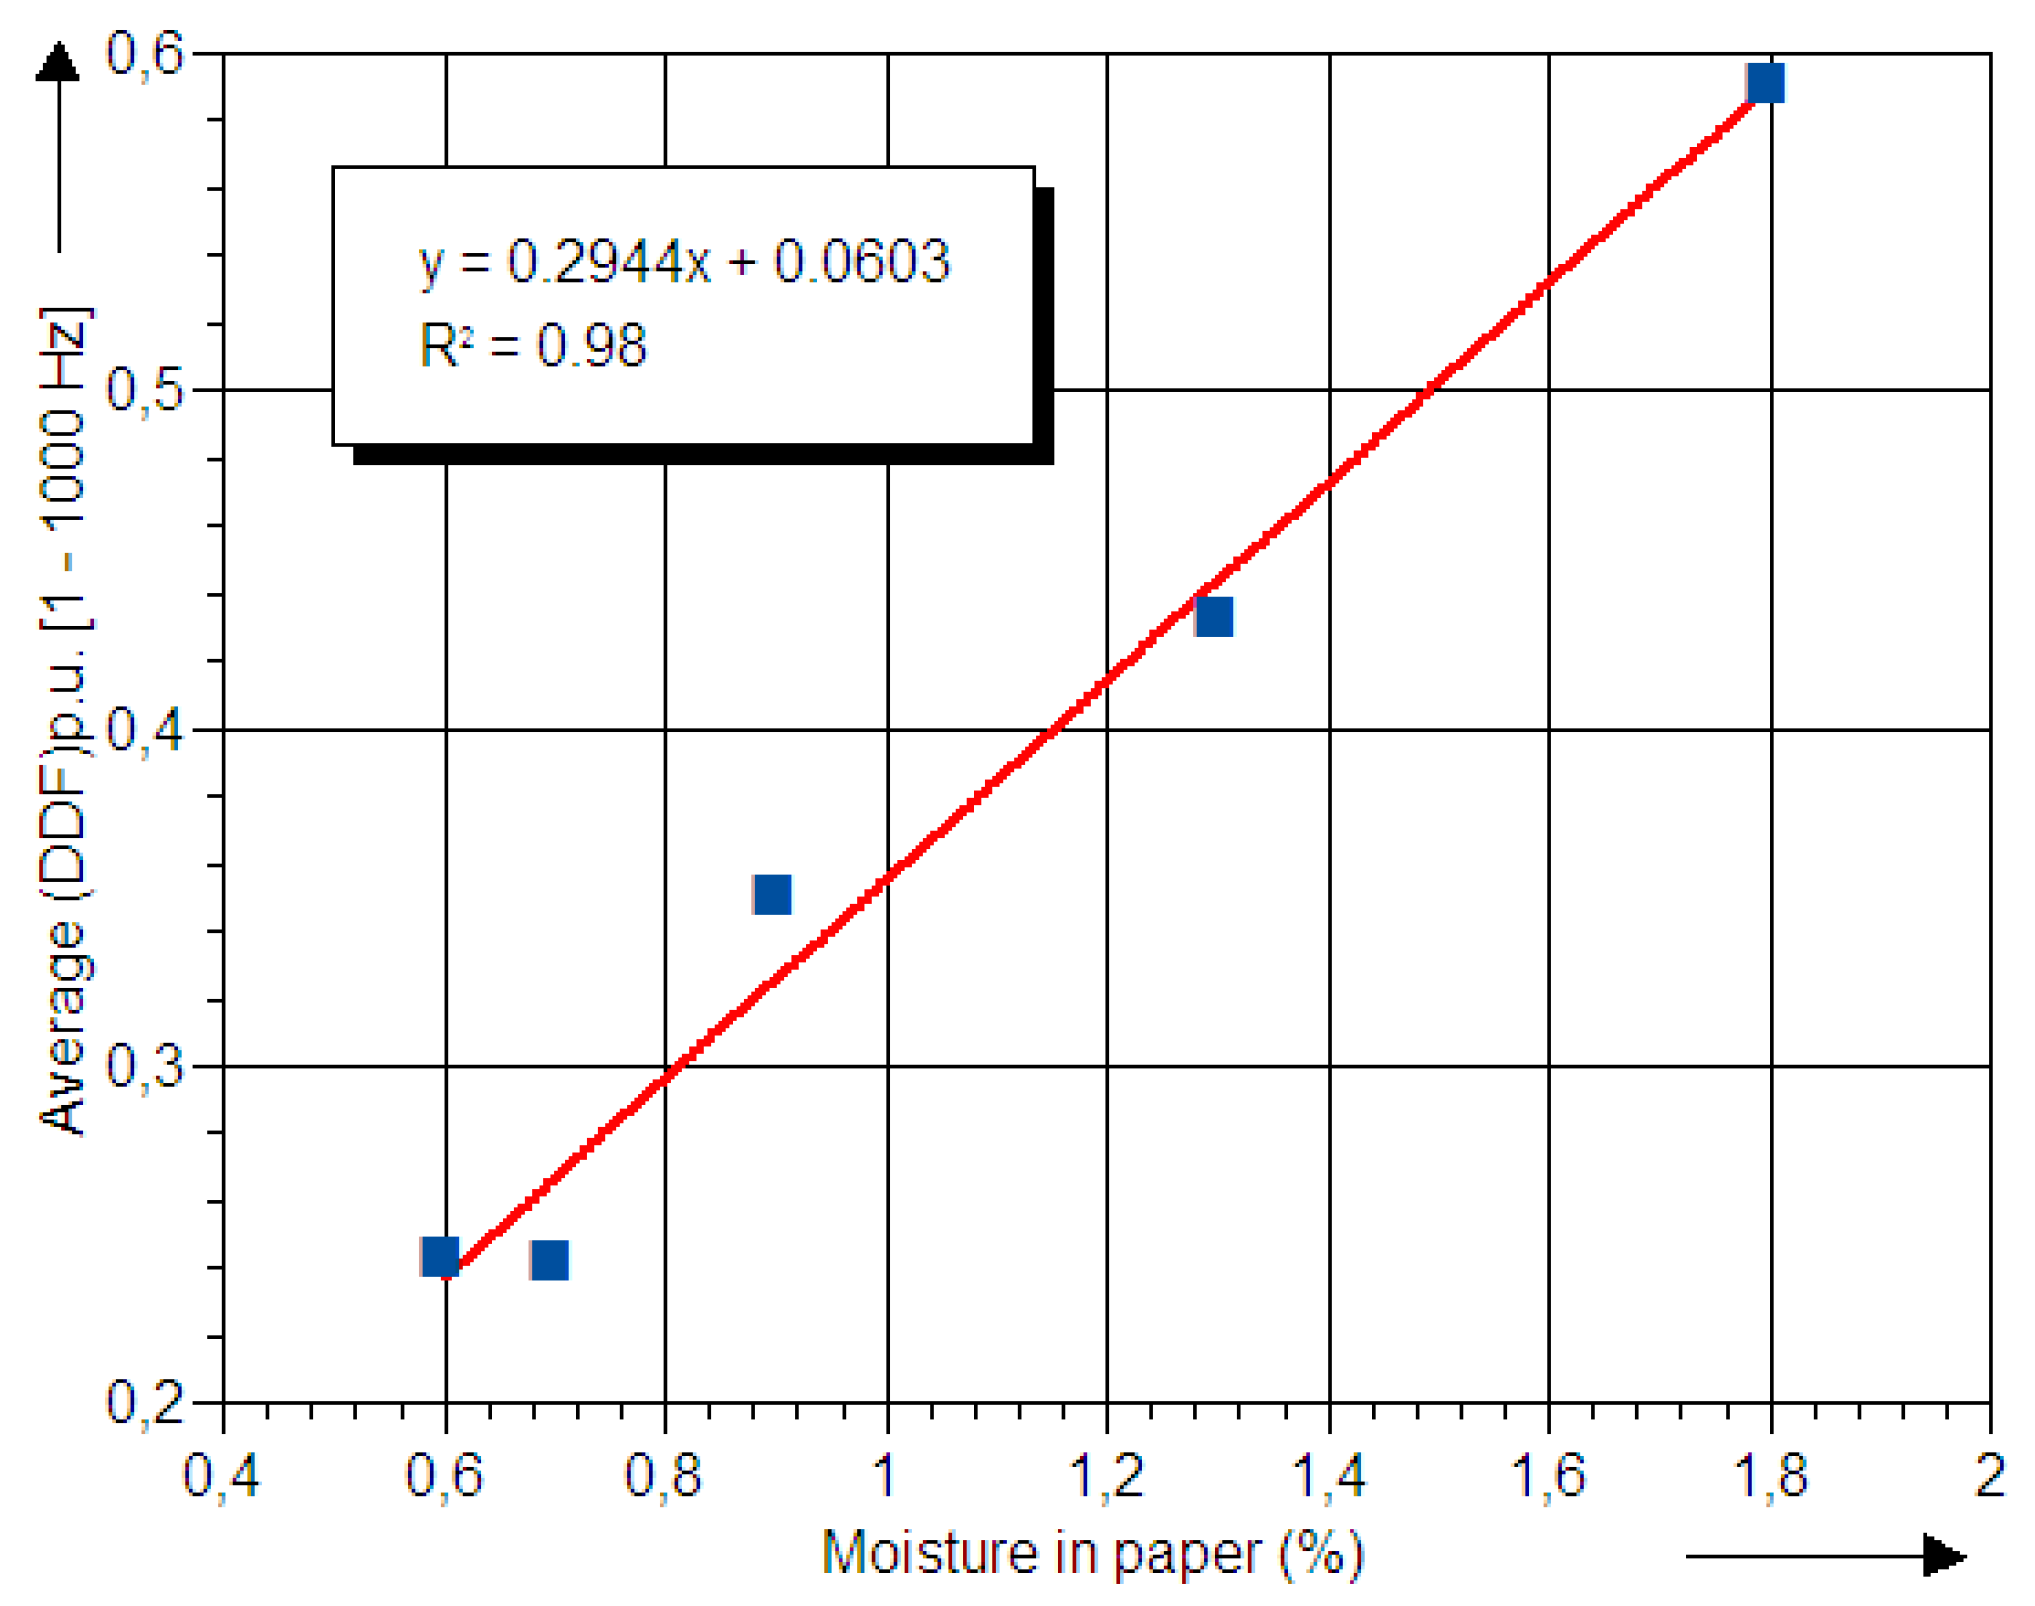
Basically, an insulation material can be modeled as a parallel/series connection of a capacitor and a resistor [6,19]. Considering a resistance in parallel with a capacitance, the Dielectric Dissipation Factor (DDF) is given by:
D D F = 1 R C ω
where ω = 2πf is the angular frequency and f the frequency. At a frequency f = 1 Hz, Equation (4) simplifies to:
D D F = 1 2 π R C
At this specific frequency (f = 1 Hz), poles can therefore be estimated from the value of the DDF. Figure 10 represents a comparison between the DDF measured at f = 1 Hz and the poles as a function of the ageing duration. The measured data were plotted in per unit scales [according to Equation (4)] for a better comparison. Out of this Figure, a correlation between the DDF (measured at f = 1 Hz) and the poles can be found. A linear relationship (having a correlation factor R2 = 0.99) may be used as the best fit of the results obtained in this study (Figure 11). As an ageing or moisture content indicator, the DDF measured at f = 1 Hz may be used as a system baseline to represent the data on per unit (p.u.) values:
( D D F ) p . u . = D D F D D F a t    f = 1 H z
Figure 12 represents the per unit value of the DDF as a function of the ageing duration.
Figure 10. The DDF at f = 1 Hz and poles, as a function of frequency. The aging duration acted as parameter.
Energies 06 02204 g010
Figure 11. Correlation between the DDF at f = 1 Hz and the poles.
Energies 06 02204 g011
Figure 12. The per unit values of the DDF as a function of aging duration.
Energies 06 02204 g012
It can be observed that all the curves cross each other at the point of coordinates (1, 1). In the frequency ranges of 1–1000 Hz, an apparent correlation with moisture content in the paper (Table 1) can be observed. The data related to 425 and 500 h aged samples are superimposed. This might be related to their moisture contents that are substantially close (Table 1).
Table 1. Moisture content in paper at the end of aging process.
Aging duration (hours)Water content in the paper (%)Average [DDF]p.u. [1–1000] Hz
026.14
721.80.59
1440.90.35
2401.30.43
4250.60.24
5000.70.24
Another alternative way in representing the data can be explored. Given that the scale of the graph in Figure 12 is represented in logarithmic, the average value of these data in the frequency range [1–1000] Hz can be calculated as follows:
( D D F ) a v g [ 1 1000 H z ] = f = [ 1 1000 H z ] ( D D F ( f ) ) 1 N
where Π represents the product of all DDF values in the frequency range [1–1000] Hz and N, the total DDF values in the same frequency range. The results obtained from Equation (7) are represented in the Table 1, while Figure 13 represents the average value of the DDF in the frequency range [1–1000] Hz and the moisture content in the paper as a function of ageing duration.
Figure 13. Average value of DDF in the frequency range [1–1000] Hz and moisture content in the paper as a function of the ageing duration.
Energies 06 02204 g013
A strong correlation between the moisture content in the paper and the average value of DDF in the frequency range [1–1000] Hz can be observed. This correlation is clearly highlighted by the linear trend-line reported in the Figure 14. Recall that the frequency vs. dissipation factor relationship response curve for oil-impregnated paper is well known to display moisture and ageing impact at higher and lower frequencies with much clearer indication in the very lower frequencies (below millihertz range) [2,3,4,5,6,7,8,9,10,11,12,13,14,15,16,17,18,19,20,21]. The interpretation scheme must allow a separation between these parameters. When the higher moisture is produced from ageing, it is understood that the moisture and ageing separation become a difficult task. Attempt to separate these parameters have been performed by Yao et al. [10]. Equation (7) partnered with poles computation should help investigating the separation of ageing and moisture impacts.
Figure 14. Correlation between the average value of the DDF in the frequency range [1–1000] Hz and moisture content in the paper.
Energies 06 02204 g014
More investigations are therefore required. The proposed moisture and ageing indicators of oil-paper insulation system should be validated under controlled laboratory conditions with a large number of samples.
In the literature review, several studies have been conducted to determine correlation between oil paper insulation degradation and DDF values at defined frequencies. This study opens the door for future studies to help finding a correlation between these parameters and the ratio between the values of DDF at different specific frequencies   ( DDF ( f 1 ) DDF ( f 2 ) ) .
The issue of moisture in oil-paper and the relationship to the values of P might be of high interest. Particularly, the issue of P values quantification within “large insulation volumes” based on localised moisture issues can be addressed considering previously published investigations by the authors [35]. A three dimensional impedance network was used to simulate the dielectric behavior of insulation. Both solid and liquid insulations have been simulated and the results compared to experimental ones obtained from frequency domain analysis. In this model the dielectric is a parallelepiped formed by cubic cells. The cells are large enough to describe macroscopic scale dielectric properties, and small enough to represent a single phase (matter) and the mixture of all particles to be assumed as a homogeneous phase. Inside an elementary cell, the impedance holds the same impedance value and is equal to impedances within all other elementary cells of the same volume material. A suitable model of each type of insulation (liquid and solid) has been used. This simulation has opened the possibility of introducing water content and impurities to study their effect on the dielectric frequency response of oil paper insulation. The possibility of analyzing the water and aging by-product inclusion distributions in the dielectric might help increasing our basic understanding of how moisture and aging affect the dielectric response

5. Conclusions

The interpretation of Frequency Domain Spectroscopy (FDS) test results still remains a difficult task as it is believed to be influenced by various parameters, including insulation ageing condition, moisture content, insulation geometry/volume, together with environmental conditions such as temperature.
A Debye circuit model, which describes the dielectric behaviour of oil-paper composite insulation system, has been parameterized in this paper. The equivalent circuit parameters were obtained using a non-linear optimization procedure.
Perharps the most important contribution of this paper is the main premise that “poles” P are independent of geometry for test samples. The issue of how P varies with moisture and aging was examined and some results in relation to sensitivity of poles were reported. The correlation of poles with the degree of polymerisation of paper shows that small values of poles indicate a good insulation, while higher values indicate the degradation of the solid insulation. Producing a measure for insulation which does not require volume/geometry is very helpful.
Also, a strong correlation between the moisture content in the paper and the average value of the dielectric dissipation factor in the frequency range [1–1000] Hz was observed. The issue of experimental moisture in oil-paper and the relationship to the values of P is also interesting. Both parameters can be used to predict the ageing/moisture condition of oil-paper insulation provided the measurement temperature is kept constant. Moreover, the Arrhenius equation can be applied to compensate for temperature dependence in the material.

Acknowledgments

This work was carried out within the framework of the Canada Research Chair, ISOLIME and the International Research Center, CENGIVRE at the Université du Québec à Chicoutimi (UQAC). The authors would like to thank James Cross from Weidmann Electrical Technology Inc. (St. Johnsbury, VT, USA) for the support in materials as well as all the sponsors/collaborators of the project. The authors are much indebted to the anonymous reviewers for their valuable comments/suggestions which allowed improving the English expressions and technical quality of the manuscript.

References

  1. Wilson, A.C.M. Insulating Liquids: Their Use, Manufacture and Properties; Peter Peregrinus Ltd. (on behalf of the Institution of Electrical Engineers): London, UK, 1980. [Google Scholar]
  2. Zaengl, W.S. Dielectric spectroscopy in time and frequency domain for HV power equipment, Part I: Theoretical considerations. IEEE Electr. Insul. Mag. 2003, 19, 5–19. [Google Scholar] [CrossRef]
  3. Seytashmehr, A.; Fofana, I.; Eichler, C.; Akbari, A.; Borsi, H.; Gockenbach, E. Dielectric spectroscopic measurements on transformer oil-paper insulation under controlled laboratory conditions. IEEE Trans. Dielectr. Electr. Insul. 2008, 15, 1100–1111. [Google Scholar] [CrossRef]
  4. Gubanski, S.M.; Boss, P.; Gspes, G.; Houanessian, V.D.; Filippini, J.; Guuinic, P.; Gäfvert, U.; Karius, V.; Lapworth, J.; Urbani, G.; Werelius, P.; Zaengl, W. Dielectric Response Methods for Diagnostics of Power Transformers; Technical Brochures Published in Electra; International Council on Large Electric Systems (CIGRE): Paris, France, 2002; Volume 202, pp. 25–36. [Google Scholar]
  5. Saha, T.K.; Purkait, P. Investigations of temperature effects on the dielectric response measurements of transformer oil-paper insulation system. IEEE Trans. Power Deliv. 2008, 23, 252–260. [Google Scholar] [CrossRef]
  6. Fofana, I.; Hemmatjou, H.; Meghnefi, F.; Farzaneh, M.; Setayeshmehr, A.; Borsi, H.; Gockenbach, E. On the frequency domain dielectric response of oil-paper insulation at low temperatures. IEEE Trans. Dielectr. Electr. Insul. 2010, 17, 805–813. [Google Scholar] [CrossRef]
  7. Bouaïcha, A.; Fofana, I.; Farzaneh, M.; Seytashmehr, A.; Borsi, H.; Gockenbach, E.; Béroual, A.; Aka, N.T. On the usability of dielectric spectroscopy techniques as quality control tool. IEEE Electr. Insul. Mag. 2009, 25, 6–14. [Google Scholar] [CrossRef]
  8. Saha, T.K. Review of modern diagnostic techniques for assessing insulation condition in aged transformers. IEEE Trans. Dielectr. Electr. Insul. 2003, 10, 903–917. [Google Scholar] [CrossRef]
  9. Wang, W.; Liu, Y.; Bi, J.; Gong, Y.; Deng, Y. Effect factors analysis of frequency domain spectroscopy test. In Proceedings of the 2012 Asia-Pacific Power and Energy Engineering Conference (APPEEC), Shanghai, China, 27–29 March 2012; pp. 1–5.
  10. Saha, T.K.; Purkait, P. Understanding the impacts of moisture and thermal aging on transformer’s insulation by dielectric response and molecular weight measurements. IEEE Trans. Dielectr. Electr. Insul. 2008, 15, 568–582. [Google Scholar] [CrossRef]
  11. Breitenbauch, B.; Küchler, A.; Leibfried, T.; Zaengl, W.S. Insulation diagnosis by polarisation and depolarisation current measurements. In Proceedings of the 13th International Symposium on High Voltage Engineering (ISH), Delft, The Netherlands, 25–29 August 2003.
  12. Pradhan, M.K.; Yew, J.H.; Saha, T.K. Influence of the geometrical parameters of power transformer insulation on the frequency domain spectroscopy measurement. In Proceedings of the 2008 IEEE Power and Energy Society General Meeting—Conversion and Delivery of Electrical Energy in the 21st Century, Pittsburgh, PA, USA, 20–24 July 2008; pp. 1–8.
  13. Küchler, A.; Bedel, T. Dielectric diagnosis of water content in transformer insulation systems. Eur. Trans. Electr. Power 2001, 11, 65–68. [Google Scholar] [CrossRef]
  14. Gubanski, S.M.; Boss, P.; Gspes, G.; Houanessian, V.D.; Filippini, J.; Guuinic, P.; Gäfvert, U.; Karius, V.; Lapworth, J.; Urbani, G.; Werelius, P.; Zaengl, W. Dielectric response methods for diagnostics of power transformers. IEEE Electr. Insul. Mag. 2003, 19, 12–18. [Google Scholar] [CrossRef]
  15. Fofana, I.; Hemmatjou, H.; Meghnefi, F. Effect of thermal transient on the polarization and depolarization current measurements of oil-paper insulation. IEEE Trans. Dielectr. Electr. Insul. 2011, 18, 513–520. [Google Scholar] [CrossRef]
  16. De Nigris, M.; Passaglia, R.; Berti, R.; Bergonzi, L.; Maggi, R. Application of Modern Techniques for the Condition Assessment of Power Transformers; International Council on Large Electric Systems: Paris, France, 2004. [Google Scholar]
  17. Goetz, M.P. Permittivity Measurements of Frequency Dependent Electronic Materials; Hewlett-Packard: Palo Alto, CA, USA, 1995; pp. 5964–1506. [Google Scholar]
  18. Pradhan, M.K.; Yew, K.J.H. Experimental investigation of insulation parameters affecting power transformer condition assessment using frequency domain spectroscopy. IEEE Trans. Dielectr. Electr. Insul. 2012, 19, 1851–1859. [Google Scholar] [CrossRef]
  19. Saha, T.K.; Purkait, P.; Müller, F. Deriving an equivalent circuit of transformers insulation for understanding the dielectric response measurements. IEEE Trans. Power Deliv. 2006, 20, 149–157. [Google Scholar] [CrossRef]
  20. Liao, R.; Hao, J.; Chen, G.; Yang, L. Quantitative analysis of ageing condition of oil-paper insulation by frequency domain spectroscopy. IEEE Trans. Dielectr. Electr. Insul. 2012, 19, 821–830. [Google Scholar] [CrossRef]
  21. Tang, M.; Lei, M.; Xu, H.; Lu, Y.; Wei, X.; Wu, P.; Zhang, G. Frequency domain characteristics and insulation condition evaluation of power transformer oil-paper insulation. In Proceedings of the 2012 International Conference on High Voltage Engineering and Application (ICHVE), Shanghai, China, 17–20 September 2012; pp. 443–446.
  22. Jonscher, A.K. Dielectric relaxation in solids. J. Phys. D Appl. Phys. 1999, 32, R57–R70. [Google Scholar] [CrossRef]
  23. Jonscher, A.K. Universal Relaxation Law; Chelsea Dielectrics Press: London, UK, 1996. [Google Scholar]
  24. Fofana, I.; Bouaicha, A.; Farzaneh, M. Aging characterization of transformer oil-pressboard insulation using modern diagnostic techniques. Eur. Trans. Electr. Power Eng. 2011, 21, 1110–1127. [Google Scholar] [CrossRef]
  25. Yao, Z.T.; Saha, T.K. Separation of Aging and Moisture Impacts on Transformer Insulation Degradation by Polarization Measurement; International Council on Large Electric Systems: Paris, France, 2002; pp. 15–304. [Google Scholar]
  26. Betie, A.; Meghnefi, F.; Fofana, I.; Yéo, Z. On the Impacts of Ageing and Moisture on Dielectric Response of Oil Impregnated Paper Insulation Systems. In Proceedings of the IEEE Annual Conference on Electrical Insulation and Dielectric Phenomena (CEIDP), Montreal, Canada, 14–17 October 2012; pp. 219–222.
  27. Shayegani, A.A.; Gockenbach, E.; Borsi, H.; Mohseni, H. Investigation on the transformation of time domain spectroscopy data to frequency domain data for impregnated pressboard to reduce measurement time. Electr. Eng. 2006, 89, 11–20. [Google Scholar] [CrossRef]
  28. Setayeshmehr, A.; Eichler, C.; Akbari, A.; Borsi, H.; Gockenbach, E. Condition Evaluation of Oil-Pressboard Insulation by Fourier Transform of Time Domain Dielectric Response. In Proceedings of the Nordic Insulation Symposium (Nord-IS 07), Lyngby, Denmark, 11–13 June 2007; pp. 169–172.
  29. Jaya, M.; Geißler, D.; Leibfried, T. Accelerating dielectric response measurements on power transformers—Part I: A frequency domain approach. IEEE Trans. Power Deliv. 2013, in press. [Google Scholar]
  30. ASTM D1934—Standard Test Method for Oxidative Aging of Electrical Insulating Petroleum Oils by Open-Beaker Method; ASTM International: West Conshohocken, PA, USA, 2012. [CrossRef]
  31. Insulation Diagnostics Spectrometer IDA 200: User’s Manual; Programma Electric AB: Täby, Sweden, 2000.
  32. Du, Y.; Zahn, M.; Lesieutre, B.C.; Mamishev, A.V.; Lindgren, S.R. Moisture equilibrium in transformer paper-oil systems. IEEE Electr. Insul. Mag. 1999, 15, 11–20. [Google Scholar] [CrossRef]
  33. Lagarias, J.C.; Reeds, J.A.; Wright, M.H.; Wright, P.E. Convergence properties of the nelder-mead simplex method in low dimensions. SIAM J. Optim. 1998, 9, 112–147. [Google Scholar] [CrossRef]
  34. ASTM D4243—Standard Test Method for Measurement of Average Viscometric Degree of Polymerization of New and Aged Electrical Papers and Boards; ASTM International: West Conshohocken, PA, USA, 2009. [CrossRef]
  35. Bouaïcha, A.; Fofana, I.; Farzaneh, M. A three dimensional electrical network for oil-paper insulation modeling. In Proceedings of the 16th International Symposium on High Voltage Engineering, Cape Town, South Africa, 24–28 August 2009; pp. 436–441.

